
Pharmaceutical Product Modularization as a Mass Customization Strategy to Increase Patient Benefit Cost-Efficiently


1
Department of Industrial and Materials Science, Chalmers University of Technology, Hörsalsvägen 7A, 41296 Gothenburg, Sweden
2
Pharmaceutical Technology and Development, AstraZeneca Gothenburg, 43183 Mölndal, Sweden
*
Author to whom correspondence should be addressed.
Systems 2021, 9(3), 59; https://0-doi-org.brum.beds.ac.uk/10.3390/systems9030059
Submission received: 29 June 2021
/
Revised: 24 July 2021
/
Accepted: 2 August 2021
/
Published: 6 August 2021
(This article belongs to the Special Issue Model-Based Systems Engineering and Product Service Systems Design)
Abstract
:Customized pharmaceutical products aim to comply with the individual needs of a patient to enhance the treatment outcome. The current pharmaceutical production paradigm is, however, dominated by mass production, where the pharmaceutical products embrace a one-size-fits-all design with a low possibility of treatment optimization to patient needs. This production paradigm is not designed or intended for customized pharmaceutical products and operating this production context for customized pharmaceutical products is argued to be cost-inefficient. To address this challenge of inefficient production of customized pharmaceutical products, this study proposes an approach to modular pharmaceutical product design. As a mass customization strategy, product modularization enables serving customers with customized products cost-efficiently. The proposed modular pharmaceutical products integrate three product design requirements originating from patient needs: a scalable dose strength, a flexible target release profile, and a scalable treatment size. An approach to assess the value of these product designs is presented, by means of proposing three benefit metrics complying with respective design requirements and a cost metric assessing the cost of producing these modular pharmaceutical product designs. Results suggest that pharmaceutical product modularization can, by keeping the number of produced components low, substantially increase the external product variety and, hence, enhance the treatment outcome of patients. Furthermore, results indicate that the achieved benefit for the patient through product modularization increases beyond additional costs arising during production. However, a careful modularization must be performed to optimize the tradeoff between the increased benefit and cost.
1. Introduction
Personalized medicines, or customized pharmaceutical products, is an emerging field to enhance the therapeutic outcome with patientcentricity in mind, i.e., providing the patient with a safe and effective treatment [1,2,3]. Patientcentricity implies customizing the pharmaceutical product according to design requirements complying with individual patient needs. These individual product design requirements include active pharmaceutical ingredient (API), dose strength, target release profile, appearance (including treatment size and shape, for example), sensory properties, and composition [4].
However, the large-scale deployment of customized pharmaceutical products is currently inadequate. The dominating production context is mass production, where the product design embraces a one-size-fits-all design, which means that four-to-six dose strengths are produced in large volumes [5]. A shift toward a pharmaceutical product customization context leads to the inevitable consequence and challenge of a vast increase in the number of product variants produced in smaller volumes. However, a product variety exceeding six dose strengths has been argued as infeasible in the current mass production paradigm [5]. Thus, uneconomical production will challenge the provision of customized pharmaceutical products, and in the end, if the product does not reach the patient, the therapeutic outcome cannot be enhanced.
Mass customization, as a production paradigm, has the intent of increasing business performance by serving a wide range of customers with customized products, through efficient production [6]. Three mass customization principles described by Hu et al. [7] incorporate product family architecture, reconfigurable manufacturing systems, and delayed differentiation. Govender et al. [4] projected these into the pharmaceutical context as product modularization, process reconfiguration, and postponement. Product modularization in a pharmaceutical context is, to some extent, present in the literature. Siiskonen et al. [8] have suggested an initial approach to product modularization of pharmaceutical products using function modeling, by which two product design requirements, originating from patient needs, were integrated into the product: a scalable dose strength and product size. For these modular product designs, cost and benefit studies were conducted. Govender et al. [9] and Govender et al. [10] experimentally showed the realization of a modular product design for a pharmaceutical product with a scalable dose strength and flexible, but controlled, target release profile. Building on the studies by Siiskonen et al. [8], Govender et al. [9], and Govender et al. [10], the novelty of this paper is a theoretical modeling approach to generate modular product designs for pharmaceutical products for cost-efficient customization. The earlier work is extended by integrating three product design requirements into a customized pharmaceutical product: scalable dose strength, target release profile flexibility, and scalable treatment size. The scope of this study considers pharmaceutical products embracing the dosage form of a tablet, which is the most common dosage form [5,11,12]. This study will not consider the design of the molecules of the active pharmaceutical ingredients or excipients. Furthermore, to assess the value to the patient of these modular product designs, models for benefit and cost are suggested and applied. The research questions guiding this study are RQ1: How can individual product design requirements be realized in a pharmaceutical product for customization? and RQ2: How can the cost and benefit of customized pharmaceutical product designs be assessed?
The remainder of this paper is organized as follows: Section 2 presents essential literature and concepts upon which this study has been built and describes the research gap addressed in this paper. Section 3 describes the collection of methods used in the study, and the results of applying these are presented and discussed in Section 4. Section 5 answers the research questions posed in Section 1 and discusses the study’s methods. Section 6 concludes the paper and offers suggestions for future research directions.
2. Literature Review
In this section, a review of the essential theory and concepts is provided. The findings are presented in the form of a research gap.
2.1. Pharmaceutical Production
The currently dominating pharmaceutical production context is mass production. A mass production context implies batchwise production of a few product variants in large volumes. The product design within this paradigm is even called a one-size-fits-all design, and although some variation in dose strength for the same product is offered today, the economic feasibility is argued to be limited to four to six product variants [5].
2.2. Pharmaceutical Product Customization
Customized pharmaceutical products allow treatments tailored to the individual needs of the patient [5,13], which can be attributed to the biological, environmental, behavioral, or preference characteristics of the patient [4]. Furthermore, Govender et al. [4] have outlined, but did not present as an exhaustive set, the product design requirements of patientcentric treatment designs to satisfy patient needs. These design requirements incorporate the API, dose strength, target release profile, appearance, sensory properties, and composition. The design requirements incorporated in this paper include the dose strength and target release profile, which are mainly attributed to the biological characteristics of the patient, as well as appearance, more specifically focusing on the treatment size, which is attributed to the preference category of the patient as the preferred treatment size is a variable between individual patients [4].
Pharmaceutical product designs suitable for treatment customization have been discussed in the literature. Additive manufacturing, as a technology for patientcentric product design, is widely researched. Within a computer model, the treatment characteristics can be defined and then, by various techniques, be printed, providing the means for individual customization [14,15]. Nonetheless, challenges for large-scale technical realizability of this technology remain, such as material selection limitations, precision in process, and so forth. Furthermore, economic feasibility issues such as large-scale production concerning cost, time, and distribution are still unsolved [4].
Scored tablets, a commercially available product design, allow the treatment to be split into two or four subunits [16]. Through splitting, some scalability to the dose strength is achieved. However, the sufficiency of obtained dose strengths for a customization context remains debatable, and in addition, for example, Wening and Breitkreutz [17] have outlined drawbacks of splitting tablets, such as inadequate dosing and tampered release properties.
Multiple unit dosage forms, such as pellet-based dosage forms and mini-tablets, are commercially available product concepts and have been discussed as enablers for pharmaceutical product customization. For example, Aleksovski et al. [18] have examined the benefits of multiple unit dosage forms regarding scalable dose strengths and flexible target release profiles, as well as their role in alleviating swallowing difficulties. Thus far, these product designs have purely been considered in a mass-production context rather than in a customization context, including assessments of feasible production and provision. These designs embrace multiple unit dosage forms consisting of several identical units and have not been assessed with patientcentricity in mind, e.g., how to solve for providing different product functionalities complying to patient needs but doing so cost-efficiently.
2.3. Mass Customization
A mass customization paradigm for pharmaceutical products is hypothesized as a solution for the wide commercialization of customized pharmaceutical products. A mass customization paradigm intends to affordably develop, produce, market, and deliver goods satisfying a wide variety of customer needs [6,7,19]. Three mass customization strategies (as outlined by, for example, Hu [7]) incorporate modular product architectures, reconfigurable manufacturing systems, and postponement. Siiskonen et al. [20] studied manufacturing system design in a customization context and suggested that the current mass production platforms are not suitable to be operated in a mass customization context. Siiskonen et al. [21] suggested reconfigured supply chain designs postponing the final assembly position of the treatments closer to the customer for the cost-efficient provision of customized pharmaceutical products. Manufacturing system design and postponement for mass customization in a pharmaceutical context are outside the scope of this paper, but the reader is referred to the publications by Siiskonen et al. [20] and Siiskonen et al. [21] for further discussion on these topics.
2.3.1. Product Modularization
Product modularization is a strategy to increase the product variety for customers while keeping the costs low [22,23]. Siiskonen et al. [8] presented a study on product modularization in a pharmaceutical product customization context in which two product design requirements, dose strength and size, were considered as the means of customization in a pharmaceutical product. These design requirements were realized as modules that enabled the dose strength and size scalabilities of the pharmaceutical products. Govender et al. [9] and Govender et al. [10] manufactured experimentally modular product designs with scalable dose strengths and flexible and controllable target release profiles.
2.3.2. Product Architecture
According to Ulrich and Eppinger [24], product architecture is a basis for enabling configurations of product variants. Ulrich [25] defined product architecture as the allocation of product functions into physical components. A product is a collection of physical elements such as components, parts, and subassemblies, and which embeds functional elements that collectively contribute to the product’s overall function [24].
According to Du et al. [26], there are two approaches to enable variety in a product: a modular and a scalar product architecture approach. A product embracing a modular architecture consists of modules embedding one or more functions of the product. The geometrical properties of the modules are fixed; however, the interactions in between modules are kept decoupled, and this enables addition, removal, and interchangeability of modules. Therefore, a variety of products can be obtained [27]. Scalar architecture employs a rigid structure, in which the interfaces between the functional elements are predefined. However, design parameters realizing the functional elements can be changed to obtain variability in products [28]. Du et al. [26] proposed an integrated modular and scalar architecture approach by employing the Stackelberg game theory. The configurable component (CC) method, established by Claesson [29], is another model for an integrated modular and scalar approach and is the one used in this study.
2.3.3. The CC Method
The CC method serves as a foundation for a product platform that provides a tool for enabling both modular and scalar product variety; later, via platform execution, sets of product variants can be established [29]. A common purpose for product platforms is to establish product variety to meet a wide range of customer needs [30].
The CC method establishes a product architecture consisting of several configurable subsystems, or configurable components (CCs), operating independently but providing their functions to the overall performance of the system. The CC method builds on the enhanced function-means (EF-M) modeling approach by Schachinger and Johannesson [31], an evolution from the function–means model by Tjalve [32], where each CC object (subsystem) is expressed by the means of functional requirements (FRs) and design solutions (DSs). The independently operating CC objects provide a modular structure to the product. Defining functional bandwidths of each FR and defining the design parameters of the DSs that provide for the bandwidth of the FRs, within a CC object, enables a scalable design of the CC and, in the end, the overall product [29].
The CC structure describes the function domain of a product platform. Levandowski et al. [33] and Michaelis et al. [34] connected the CC objects to the component domain by the means of a component (CO) tree of the product. The component tree aims to concretize the abstract product architecture described through FRs and DSs by the physical realization of the DSs assigned to the respective FRs (i.e., these are described by the means of COs with their geometrical properties, dimensions, and so forth).
Panarotto et al. [35] researched the incorporation of nonfunctional requirements, such as flexibility. This inclusion was achieved by defining the flexibility of the design as a constraint (C) within the function domain. Flexibility is intended to define an adaptable, changeable, and reconfigurable design concept of an engineering system [36]. Within the context of this paper, flexibility of the pharmaceutical product designs indicates the customizability of these. In this article, the dose strength scalability, target release profile flexibility, and size scalability are assessed as the flexibility of the product designs. For example, for dose strength scalability, the flexibility factor defined through C describes the various dose strengths for which product variants should be configured (i.e., it is a property across product variants but within a product family). This is different from the functional bandwidth of a CC object (described by the means of FRs and DSs) that describes the property of a CC object and the different variants that this CC object can be configured as. The different variants of the CC object, rather, generate product variants belonging to different product families. Cs are also used to limit the functional bandwidth of the CC objects and ultimately the product. For example, in pharmaceutical products, a C could be the size of the treatment to ensure convenient administration, and in this case, it could be expressed as a volume and geometrical restriction.
2.4. Value
The ultimate aim of developing designs of customized pharmaceutical products is an increased value for the patient, i.e., increasing the benefit to the patient, however, while not compromising the cost of doing so. To make product design decisions, Hazelrigg [37] has stated that value should be the most intuitive criteria. Early design decisions must be based on models describing what ultimately brings value for the customer. Value models and the construction of these, however, have not been exhaustively investigated [38,39]. A general definition for product value is offered by Lindstedt and Burenius [40] as the ratio between benefits for the customer and the cost for the customer expressed in monetary terms, time, or effort. Ulrich and Eppinger [24] use a weighted sum approach where product performance criteria are evaluated relative to each other. In the context of customized pharmaceutical products, Siiskonen et al. [8] presented an initial approach to their value assessment. In this approach, the benefit was described through the number of product variants that modular product designs could generate from a dose strength and size scalability perspective, and the cost was described by the complexity factor by Pugh [41]. In this study, to assess product value the concept of using cost and benefit as value assessment criteria along with a weighted sum approach has been used.
2.4.1. Benefit
No established approach to assess the benefits of pharmaceutical product designs for decision-making in a customization context are, to the best of our knowledge, found. In a pharmaceutical context, the benefit of product customization describes the enhanced treatment outcome. Examples of benefit assessment of drug products exist in the literature; for example, Hörn et al. [42] presented a study on benefit assessment of new drug products, where the benefits were indicated through the treatment outcome of clinical trials. These drug products, however, resided in the realization stage, where actual clinical trials on them could be conducted. Considering customized pharmaceutical products within the scope of this study, the nature of these designs resides in a conceptual stage, not close to a realization stage; thus, benefit assessment procedures must be suited to this level of early conceptual designs.
2.4.2. Cost
Several models to assess the cost of conceptual product designs exist. Generally, the product cost consists of material, process, and assembly costs [43]. Material and process costs are assumed not to significantly affect the cost within the scope of this study. Rather, the assembly cost is of interest in this research. Swift and Booker [43] have presented an approach to assembly cost estimation which is based on handling features, fitting techniques, and alignment features of the parts. When the process of assembly has not been detailed, the complexity factor by Pugh [41], which essentially measures the resulting product complexity by incorporating the number of parts, types of parts, and interfaces between parts in an assembly, can be viewed as a pragmatic approach with which to assess additional costs of manufacturing arising from increased product complexity. The complexity factor has been adopted in this study to indicate the cost of manufacturing customized pharmaceutical products.
2.5. Research Gap
Approaches to pharmaceutical product customization are emerging; for example, additive manufacturing has been researched as a technology to achieve individualized treatments. However, studies verifying the large-scale deployment from a technical and economic feasibility perspective are lacking. Commercially available multiple unit dosage forms have been discussed as enablers for customization since these can achieve dose strength scalability and target release profile variability. However, the product design embraces a fully integral product even though it consists of several smaller units since each unit is identical. Thus, the idea of introducing several units embracing different functionalities to the overall product to comply to design requirements for a customization context, hence employing a modular product design, is not established for multiple unit dosage forms. Furthermore, no studies considering the cost-efficient production of these product designs in a customization context have been found.
Product modularization has been adopted as a strategy in mass customization to provide for external product variety cost-efficiently. Product modularization is thus adopted in this study as a hypothesis for the cost-efficient customization of pharmaceutical products. Siiskonen et al. [8] have presented initial modular product designs of pharmaceutical products for customization purposes, where dose strength and treatment size scalability were demonstrated. Furthermore, this study performed an assessment of value for the patient by suggesting benefit and cost metrics. Govender [9] and Govender [10] experimentally showed the realization of modular product concepts with scalable dose strengths and flexible target release profiles. Hence, based on the studies by Siiskonen et al. [8], Govender [9], and Govender [10], this study presents an approach to the integration of three product design requirements. Beyond a scalable dose strength and treatment size, a flexible target release profile has been designed into the product, and the requirements and consequences of integrating three product design requirements rather than two are elicited. The aim is to assess product modularization as a strategy for a mass customization paradigm of pharmaceutical products. This study solely considers product design and the mass customization strategy of product modularization. For a comprehensive description of an approach to manufacturing modular product designs, the reader is referred to [20] and for discussion on applying the principle of postponement in a pharmaceutical context, the reader is referred to [21].
This study, furthermore, recommends approaches to assess the value for the patient by the means of benefit and cost metrics, which are further developed from the approach by Siiskonen et al. [8] and comply with all three product design requirements for customization. Finally, an approach to assess the overall value for the patient is suggested, by consolidating the benefit and cost models into a single expression and illustrating a value-based approach to support design decision-making regarding the best-performing modular product design from a benefit and cost perspective.
3. Methodology
This section describes the approach to establish modular product designs for pharmaceutical products, integrating product design requirements through the means of CC modeling. The design of a product platform to generate treatment portfolios of different degrees of modularization is explained. Furthermore, the selection of a model treatment used to assess the performance of these treatment portfolios from a value-for-the-patient perspective is presented, along with the performance assessment approach.
3.1. Configurable Component Modeling for Product Design Requirement Integration
A CC model of a treatment is established herein. A traditional design of a tablet along with the primarily considered design requirements, dose strength, target release profile, and size serve as inputs for establishing the CC model. These design requirements provide a foundation for the functionalities that a pharmaceutical product should embed, and these are expressed in FRs, which are further realized as DSs. Cs serve as means to constrain the functioning bandwidth of any FR and their consequent DS. Cs, furthermore, describe the nonfunctional requirements, the scalability of the dose strength, the flexibility of the target release profile, and the scalability of the treatment size. The CC model is complemented by a component tree of the pharmaceutical product to give physical realization to the configurable objects in the model.
3.2. Modeling and Executing Product Platform for Creating Treatment Portfolios
The CC model serves as a foundation for a product platform. Configurable component modeler (CCM) [29] is a research tool for CC modeling and is used in this study to model the product platform of the treatment. To develop the platform, the CC model is complemented by parameter-specific data to describe the various DSs and Cs in executable terms, mainly as integers or characters. CCM allows the execution of a product platform and does so by solving a full-factorial combinatorial problem. The result of execution is sets of all possible product configurations that fulfill the functional bandwidth of the FRs or nonfunctional requirements (described through Cs) defined in the CC model.
A treatment portfolio is a set of product variants configured from CC objects created from a single instance of parameter values on each DS in the CC model. If the CC object’s parameter value for a DS is changed, the resulting product variants created from this CC object belong to another treatment portfolio.
To establish dose strength scalability, target release profile flexibility, and size scalability, the Cs describing these nonfunctional requirements in the CC model are defined as bandwidths. Each treatment portfolio configures product variants so that the whole bandwidth of the nonfunctional requirements is covered. For example, the dose strength bandwidth is defined from 25 to 100 mg; thus, the treatment portfolio would consist of product variants that can embrace different dose strengths in between 25 and 100 mg.
3.3. Treatment Portfolio Performance Assessment
The value for the patient of each treatment portfolio is assessed to reflect how well it complies to the patient’s needs. To reflect the patient needs, a model treatment is selected, and for this treatment, a treatment population reflecting the patient needs is generated. The value of the modular pharmaceutical product designs for this treatment population is evaluated through performance metrics. Three categories of performance metrics are used for the value assessment: benefit, cost, and the consolidated metric value.
3.3.1. The Model Treatment and Reference Case
A reference case based on the current commercial treatment with its one-size-fits-all design is used, to which each treatment portfolio embracing modular product designs is compared concerning the performance metrics. Hence, this describes any increase or decrease in performance. As a model treatment, a selective serotonin-reuptake inhibitor (SSRI) product has been chosen that is prescribed for depression.
3.3.2. Treatment Population and Patient Segmentation
The commercial SSRI product is produced in two dose strengths: 50 and 100 mg. A common approach to treatment with this product is to start with half a dose of a 50 mg tablet (i.e., 25 mg); after a week, the dose is doubled to 50 mg, which is the most common dose. Further increasing to 75 or 100 mg is common as well. The maximum dose is 200 mg [44]. Today, this treatment is produced as tablets containing the doses of 50 and 100 mg. The simplification made in this study is that the maximum dose is 100 mg.
The treatment population need is described by the optimal dose of the patients. To model the treatment population, a random number generator was used in MATLAB, creating a normal distribution between 25 and 100 mg, with 99.7% of the population falling in between this dose range. Since the optimal dose of each patient is a random number in between 25 and 100 mg, the received dose, generated by any treatment portfolio, cannot match each patient’s dose exactly. The received dose is restricted by the available dose strengths that the respective treatment portfolio can construct from the components used for product variant configuration. Each patient in the treatment population is thus grouped into their respective segment according to their received dose, and the received dose of each patient is the next available dose that a treatment portfolio can offer by the means of its product variants.
3.3.3. Performance Metrics
The benefit metric aims to assess the benefits for the patient and is assessed by three types of metrics: , , and . Each metric corresponds to the benefit for the patient when complying with the product design requirements: dose strength scalability, target release profile flexibility, and size scalability, respectively. The cost of each treatment portfolio is assessed using the complexity factor by Pugh [41], which essentially evaluates the complexity of an assembly (a product variant of a treatment portfolio). The final performance metric, value, assesses both the benefit and cost of each treatment portfolio by the means of a single term and is based on the concept scoring matrix by Ulrich and Eppinger [24] to make the various treatment portfolios comparable in a normalized manner.
4. Results
This section presents the resulting CC model of a pharmaceutical product integrating three product design requirements. Furthermore, the product platform development procedure and the resulting treatment portfolios generated through platform execution are described. Finally, the performance metrics constructed are presented along with the final performance assessment of the generated treatment portfolios.
4.1. CC Model of a Pharmaceutical Product Integrating Three Design Requirements
The resulting CC model of a treatment portfolio integrating the three design requirements of interest in this study (dose strength, target release profile, and size) is displayed in Figure 1. Note that this CC model only displays three product design requirements and not the exhaustive set of design requirements required for a pharmaceutical product or customization of the pharmaceutical product.
The main FR of a treatment portfolio is to comply with the therapeutic need of any patient, and this FR is solved by the DS treatment. This treatment is aimed to comply with product design requirements originating from patient needs: dose strength, target release profile, and size. The CC assembly, which essentially comprises the treatment, embodies two FRs: provide convenient delivery and provide treatment. The first FR, provide convenient delivery, regards processes occurring before administration to support the administration process, whereas the second FR, provide treatment, relates to processes occurring within the body after administration. These FRs are solved through the DSs filling system and drug delivery system, which are further composed using lower-level CC objects, filling module and API module. These provide the means for the independent realization of the FRs provide convenient delivery and provide treatment.
The CC API module is further composed using the CCs API core and release control system. Within the CC API core, the product design requirement dose strength has been denoted as the FRs provide therapeutic effect and define dose, to which the DSs API and API dose have been assigned, respectively. Within the CC API core, additional FRs are defined that are essential for the final realization of the API core, but not explicitly required by the design requirement dose strength; for example, although not crucial for the dose strength, an API core must contain excipients (DSs to the FR facilitate formulation) for enabling the formulation of the core and, in the end, ensuring the core to be producible. Furthermore, the API core must be defined concerning its geometrical properties, leading to the inclusion of the FRs define size and define shape and their respective DSs, size and shape.
The product design requirement target release profile is achieved through the CC release control system. This CC object contains the FR control drug release through top surface area, for which the DS lid is defined. The DS lid is further described within a CC object of its own. Depending on how the CC object lid is defined during physical realization, different release properties can be obtained. The CC object release control system further incorporates the FRs prevent bottom and side release and provide structural stability, which are solved through a single DS cup. This DS is likewise described within a CC object of its own, cup, and the physical realization of this will result in a component preventing any API release from the sides and bottom of the API core. The FR provide structural stability aims at giving the API core a structure into which it can be placed for controlled release.
Two types of release mechanisms, dose-dependent release and dose-independent release, are provided through the product model. The dose-independent release scenario is achieved using the CC object release control system. In a scenario where this CC object is nonexistent, the dose-dependent release scenario is obtained instead. The dose-dependent release is simply performed through the inherent release properties of the API cores, a result of the formulation of the cores (i.e., the API to excipient ratio, size, and shape of the cores).
The final product design requirement, size, is categorized as a property of the CC assembly and is translated into the FR provide convenient delivery. To this FR, the DS filling system is assigned to further be composed using the CC filling module as an autonomous CC object.
On the highest hierarchical level, i.e., within the CC treatment portfolio, the Cs dose range and release range describe the viable range of both properties and, hence, essentially define the dose strength scalability and release flexibility of the treatment portfolio. The C size range informs the allowed sizes of any treatment and thus describes the extent of size scalability.
4.2. Component Tree and Platform Execution for Physical Realization
Figure 2 displays the realization of the respective CC object, defined in the CC model in Figure 1, as COs within the component tree. The DSs on the lowest hierarchical level of the CC model are connected to the COs in the component tree through is-realized-in (iri) relationships; however, in Figure 2, only the CCs have, for the sake of brevity, been displayed (not the breakdown of the CCs into FRs and DSs). For detailed descriptions of the CCs, the reader is referred to Figure 1. It should be noted that several CCs are provided with a depth, such as the CC API module. The depths describe alternative CC objects originating from assigning alternative DSs to FRs within that CC (see Figure 1). When executing the CC model and generating the various product variants, the results are various physical realizations of the CC object, as components, depending on the assigned DS during the instance of execution. For example, in Figure 2, for the CO API module, six variants of API modules are displayed; these correspond to the alternative DSs defined in the CC model before execution. The physical realizations of the CCs API core, lid, cup, and assembly have likewise been displayed in the component tree in Figure 2. These are described in detail in the subsequent sections. For each CO in the tree, a figure has been provided to give the reader a visual idea of the realized COs. It should be noted that for the CO tablet, several examples of final assemblies configured from the set of COs are displayed, not the exhaustive set of possible variants.
4.3. Product Platform Design for Treatment Portfolio Generation
As described in Section 3, a model treatment, an SSRI product, has been selected as a case example. For this model treatment, modular product designs are proposed based on the outlined CC model of a treatment described throughout Section 4.1. Through platform modeling and execution of the CC model, treatment portfolios containing sets of modular product variants are generated. The platform is also used to generate the treatment portfolios for the reference case. Their performance is assessed to evaluate the impact of various levels of modularity that these treatment portfolios embrace on the benefit for the patient and the cost of the product.
4.3.1. Reference Case Design
The reference case, based on the commercial SSRI treatment, is produced in two dose strengths: 50 and 100 mg. Figure 3 displays an illustration of the commercial treatment with a dose strength of 50 mg. This treatment has the approximate geometrical properties illustrated in Figure 3: an oval-formed body assuming flat faces where the body can be divided into two end parts and a middle part (see Figure 3a). The end parts are assumed to form a perfect cylinder with a diameter of 5 mm and height of 2 mm, d and h, respectively, in Figure 3b. The middle part is assumed to form a cuboid with the width, w, of 4 mm and height, h, of 2 mm (see Figure 3c). From these geometrical properties, the approximate volume of the commercial treatment is calculated to 81.4 mm3. In this study, an assumption is made that a tablet can be split, generating the additional dose strengths 25 and 75 mg; the splitting line is marked in Figure 3a. A single release profile is assumed for each dose strength. In theory, a 50 mg treatment could be established by a single 50 mg tablet or half a 100 mg tablet. Likewise, a 75 mg treatment can be established by one and a half 50 mg tablets or half a 50 mg and half a 100 mg tablet. The preferable approach, however, is to administer a single 50 mg tablet rather than splitting a 100 mg tablet due to the challenges with tablet splitting (see, for example, Wening and Breitkreutz [17]); thus, the viable approach for creating the dosages 50 and 75 mg is to minimize the number of tablet splits. A single treatment variant is assumed for each dose strength, making the reference case consist of, in total, four dose strengths, four release profiles, and four treatment sizes.
4.3.2. Modular Product Designs
To configure modular product designs, elements are proposed to provide for the various design requirements (these elements are denoted COs in the component tree, Figure 2). These elements are divided into parts, modules, and assemblies, see visualizations in Figure 4. A modular product design must be assembled through an assembly process to generate an administrable treatment (i.e., an assembly). Parts are transferred through a preassembly process into modules, and then modules are transferred through a final assembly process into an assembly, see Figure 4.
- —
- Parts
In this study, parts are the smallest elements of a treatment that serve as inputs into the preassembly process, where these are transformed into modules. Parts include the API cores lids and cups. The API cores comply with the design requirement dose strength (i.e., the cores are physical entities containing a specific dose of a specific API). Dose strength scalability is achieved through two cores, A and B, that are smaller in size concerning dose content than the commercial tablets. These cores are a cylindric shape and are displayed in Figure 4, core A as yellow and core B as green. The dose content of core A is selected as one-fifth of the smaller-sized commercial treatment, which has a dose content of 50 mg, i.e., the dose of core A is 10 mg. Core B is selected to contain half of the dose content of core A, i.e., 5 mg. To define the geometrical size of core A, the same ratio of material content as in the commercial treatment of 50 mg is assumed. Furthermore, given that the approximate volume of the commercial treatment is 81.4 mm3, and knowing the dose of the commercial treatment as well as the dose of core A, the volume of core A is calculated as 16.3 mm3.
Govender et al. [10] produced API cores experimentally using hot-melt extrusion and melt molding. The geometrical shape of the core is a cylinder, and the diameter of the cylinder is given as 3.81 ± 0.11 mm. The core in this study is aimed at imitating these experimentally realized cores by Govender et al. [10]; the core diameter is defined as 2.4 mm. A smaller core diameter is assigned in this study due to the volume restrictions of an assembled treatment. This is discussed further below in Assemblies and treatment portfolios. The API cores can resemble commercially available mini-tablets that have a diameter of 2–3 mm or even smaller [45], verifying the manufacturability of the core with a diameter of 2.4 mm. Selecting the diameter of the core, and defining the geometric shape as a cylinder, the height can be calculated as 3.6 mm.
For core B, despite, dose-wise, being half the size of core A, the geometrical size and shape are assumed to be equal to core A. This means that the excipient content of core B is higher than for core A.
The design requirement of target release profile is realized by two distinct approaches. Either a dose-dependent release is generated, which relies on the inherent release properties of the API cores (i.e., no additional elements are introduced to realize this), or a dose-independent release is generated by the means of a release system consisting of lids and a cup. Two lids with different release properties, lids A and B, are considered; however, the drug-release mechanism generated by these is outside the thesis scope. Govender et al. [10] produced lids and cups by fused deposition modeling with a thickness of 0.5 mm, which is used as a geometrical property in this study.
- —
- Modules
Modules are defined as elements that serve as an input into the final assembly step and are to be transformed into assemblies. The assemblies are the treatments provided to patients. Modules are API cores, API modules, and filling modules. It must be noted that API cores are considered both parts and modules since these can either be used for generating API modules or can be directly transferred into assemblies.
API modules are configured through the preassembly process by placing a core into a cup and sealing with a lid (see a visual representation of API modules in Figure 4). The filling module has the aim of complying with the product design requirement size. The filling module is, by itself, inert and serves the purpose of providing filling material to be able to generate product variants of different sizes, enabling size scalability of treatments. The geometry of the filling module is assumed to be a cylinder, and the size is assumed to be equal to the API modules.
- —
- Assemblies and treatment portfolios
Assemblies, or treatments, are configured through the final assembly process, where modules are assembled into desired constellations. As displayed in Figure 4, three treatment portfolios, A, B, and C, are generated through platform execution for two scenarios, dose-dependent and dose-independent release. The treatment portfolios are initially defined through the API cores used for product variant configuration. Portfolio A uses core A in both dose-dependent and -independent release scenarios. Portfolio B uses core B, and portfolio C uses cores A and B for both dose-dependent and -independent release scenarios. Figure 4 displays a product variant (assembly) of each treatment portfolio; it should be noted, however, that only a single product variant is displayed and not the exhaustive set of product variants within each treatment portfolio.
The approach to assemble the modules into desired constellations forming the final assemblies follows several assumptions. The assumed final allowed assembly size and shape are in accordance with those described in the study by Siiskonen et al. [8] but modified for the convenience of this study. In the study by Siiskonen et al. [8], a capsule of size 00 was used as a reference into which a cuboid was placed. The volume of this cuboid gave the maximum volume for the final assembly. The geometries of this capsule and cuboid are used in this study to define the boundary conditions of a final assembled treatment size. Figure 5a displays a redrawn 3D view of the cuboid that constituted the total volume to be used by the modules in an assembly. The cuboid embraces the length, , defined as the maximum length of a 00 capsule, which is 23.3 mm. Hence, a limit of stacking five modules on top of each other (in the dimension) was set, which allows for a total length of 23 mm, since the height of a module is 4.6 mm (core height of 3.6 mm and the thicknesses of the cup and lid, 0.5 mm, respectively). Thus, the size of a treatment variant within a product portfolio can range from a single API module to 20 modules (consisting of both API modules and filling modules in different ratios depending on the treatment variant). The cuboid diagonal, , aligns with the diameter of a 00 capsule, i.e., 8.18 mm. The capsule periphery is displayed in Figure 5b with a dashed red line.
At the bottom of the cuboid, the modules are packed in arrangements of four, as displayed in Figure 5b. This type of arrangement is called a module stack for convenience. The arrangement of a module stack fit within the periphery of the capsule, verified by calculations based on the diameter of the core, 2.4 mm, and adding the thickness of the walls of the cup (i.e., 2 × 0.5 mm). The module stacks are stacked on top of each other along the length, , dimension of the cuboid (see Figure 5c).
4.3.3. Product Variety
Through platform execution, the exhaustive set of product variants, for the complete dose range 25 to 100 mg, within each treatment portfolio and both dose-dependent and -independent scenarios is generated. The resulting number of product variants are displayed in Table 1. Table 1 shows that by product modularization, and thus, by the introduction of a few smaller components to configure the treatments from, a vast increase in product variety can be achieved. To exemplify, instead of producing two tablets of 50 mg and 100 mg, respectively, (reference case) generating in total four product variants, producing a single core containing 10 mg and a single filling module (portfolio A for the dose-dependent scenario) generates in total 116 product variants, not only due to the dose strength scalability but also, due to the size scalability. It should be noted that in both cases two elements were produced, however, due to modularization, the number of product variants can be significantly increased.
The product variety is created by two approaches; the first is a scaled functional bandwidth of a function within the product but keeping the number of functions provided by the product intact. The result of scaling the bandwidth is evident when comparing the number of product variants of different treatment portfolios for the same scenario. For example, the API core is scaled dose-wise, portfolio A uses a core of 10 mg, portfolio B a core of 5 mg, and portfolio C uses both the 5 and 10 mg cores. The smaller the dose content of the core the smaller increments of dose strengths can be obtained between the treatment variants generating an increased number of product variants (compare for example portfolio A and B for the dose-dependent scenario, the number of product variants resulting for the respective scenario in 116 and 136). A smaller core can generate an increased number of dose strengths; however, this also means that an increased number of cores are required to configure a treatment. An increased number of cores in a treatment might, for higher doses, pose size restrictions implying a lower degree of size scalability. Hence, using two cores for treatment variant configuration, as for portfolio C, can give an advantage concerning size scalability and dose strength scalability, thus the number of product variants is further increased when comparing to portfolios A and B. However, for the dose-dependent scenario, portfolio C can configure 1540 product variants, which is not solely a consequence of the higher degree of dose strength and size scalability. Portfolio C, using two cores with different inherent release properties for treatment configuration, will provide target release profile flexibility for a fixed dose; a treatment configured from three cores, each containing 10 mg, has a different target release profile than a treatment configured from two cores containing 10 mg and two cores containing 5 mg, even though the dose for both cases is the same.
The second approach to establish product variety is to introduce modules with different functions to satisfy design requirements. This is seen in Table 1 by comparing the product variety of the dose-dependent and -independent release scenarios for the same treatment portfolio. In the dose-independent release scenario lids and cups have been introduced for the means of controlling the release providing for a vast increase in the target release profile flexibility.
4.4. Treatment Portfolio Performance
Product variety, although giving some indication, cannot alone describe the value for the patient. This section will thus present the results of each treatment portfolio in terms of value generated for the patient.
Patient Segmentation
As described in Section 3.3.2, the treatment population is divided into segments, illustrated in Figure 6, both for the reference case (above) and the treatment portfolios embracing modular product designs (below). The segment dose for the modular product designs denoted in Figure 6 by A, B, M, N, and so forth, is decided according to the dose strengths that each treatment portfolio embracing modular product designs can offer. It should be mentioned that the illustration in Figure 6 is purely conceptual, and the sizes of the segments, concerning the number of patients, are not correct ratios. The optimal dose of each patient is a result on a continuous scale generated by MATLAB random number generator. The patient is categorized into the segment offering the next available dose from the patient’s optimal dose offered by the treatment portfolio (i.e., if the patient requires 27 mg, but the treatment portfolio can only provide a dose strength of 30 mg, the patient will receive 30 mg and belong to the 30 mg segment).
4.5. Benefit
This section describes the suggested benefit metrics, , and , to assess the treatment portfolio performance from a benefit perspective and the outcome of calculating these for each treatment portfolio.
4.5.1.
- —
- Dose strength scalability
Siiskonen et al. [20] proposed an approach to assess the benefit of a treatment portfolio concerning dose scalability by suggesting the concept of quality decay. This concept describes the distance between the dose received by the patient, decided through the patient segmentation process, and the patient’s optimal dose. Reformulating the quality decay concept suggested by Siiskonen et al. [20], aims to assess how close the dose offered by a treatment portfolio is to the patient’s optimal dose.
To assess the benefit from a dose strength scalability perspective, is calculated through Equation (1). In this equation, is the optimal dose of each patient m, is the dose received by the patient decided through the patient’s segment, and denotes the size of the population.
Figure 7 depicts the increase in the metric in percentage when comparing each treatment portfolio embracing modular product designs, A to C, to the reference case. It is inevitable that, through product modularization, the dose strength of the treatment offered to the patient is better matched with the patient’s optimal dose. If studying the raw numbers for , displayed in Table A1 in Appendix A, the match of the received dose to the optimal dose of the patient is 0.92 for portfolio A and 0.96 for portfolios B and C. The reference case results in 0.79, and 1.0 denotes a perfect match. This substantial improvement in dose match might not be as evident if solely displaying the increase from the reference to the modular product designs in percentage.
The driver for improved quality from a dose strength perspective is the dose content of the API core as this decides the dose strength increments between each treatment variant in a portfolio. The smaller the dose content of the API core, the better the dose strength received by the patient can be matched to the patient’s optimal dose, and, hence, the performance of is increased. Portfolios B and C show the same level of increase in the metric. The reason is that, even though the level of scalability is higher for portfolio C than B (i.e., using API cores of two dose strengths for generating product variants), it is still the smallest core that, dose-wise, decides the final performance on this metric. The smallest core decides the smallest dose increments that can be obtained.
4.5.2.
- —
- Target release profile flexibility
The target release profile flexibility, , is assessed through Equation (2). Patient segmentation decides the dose that a patient receives, and given this dose strength, the number of release profiles a patient can choose from is assessed. In Equation (2), describes the number of release variants each treatment portfolio can configure for each patient segment, and describes the ratio of patients within each segment, which is obtained through Equation (3). In this equation, describes the number of patients within a segment, and describes the size of the whole treatment population.
The results of the metric is displayed in Figure 8. The increase in percentage when comparing the modular product designs to the reference case is depicted. The increase in target release profile flexibility is shown for both the dose-dependent scenario (i.e., relying on the inherent release properties of the API cores) and the dose-independent scenario (i.e., controlling the release through the release control system). By modularizing the product and only introducing a few different parts to it, the number of release profiles can be substantially increased. When studying portfolio C for dose-dependent release, solely relying on the inherent properties of the API cores, the number of release profiles a patient can choose from is increased by more than 600% when compared to the reference case. Studying the raw numbers of (see Table A1 in Appendix A), the reference case can generate a single release profile for each dose strength, whereas portfolio C can generate an average of 7.23 release profiles. This increase in release profiles is achieved by using two API cores for product variant configuration instead of a single core. When studying the independent-release scenarios, portfolio A can generate, on average, 7.75 release profiles, and portfolios B and C can generate 14.0 release profiles, on average. These increases correspond to 675% and 1300% and are achieved entirely by either introducing two additional types of components, a lid and a cup (portfolio A) or three additional types of components, two lids and a cup (portfolios B and C).
It should be noted that for portfolios A and B, for the dose-dependent scenario, there is no increase in the metric. The reason is that, even though portfolio B can, from a dose-strength perspective, provide an increased number of product variants compared to portfolio A, these portfolios can, when fixing the dose, from a release perspective, solely configure a single target release profile. For dose-dependent release, the release profile relies solely on the API core combination creating the product variants, and portfolios A and B use a single API core, in the respective case, for the creation of the product variants for each dose strength.
Portfolios B and C are different from a dose-dependent release perspective, even though, from a dose-independent perspective, they are identical. From a dose-independent perspective, the lids control the release rate. This means that it does not matter if one configures one’s treatment of 25 mg consisting, API core-wise, of five 5 mg cores or two 10 mg cores and a single 5 mg core. Only the unique combinations of the lids for each dose strength act as the driver of the product variety in the dose-independent release scenario.
4.5.3.
- —
- Size scalability
The third metric, , is calculated through Equation (4) and assesses the size scalability of a treatment portfolio. As an indicator for size scalability, the number of treatment sizes, given a fixed dose and target release profile of the patient, is used. In Equation (4), denotes the average number of different sizes that a treatment variant can be configured as when the dose strength and target release profile are fixed. Several treatment sizes are obtained for each variant within a patient segment with different target release profiles; thus, the average number of size variants is calculated. For example, for portfolio C, a dose strength of 25 mg can be obtained by the means of different cores. Regardless of whether a dose-dependent or -independent scenario is considered, several target release profiles can be configured for the dose strength 25 mg, and for all these, different-sized treatments can be configured. To obtain a single value representing the number of size variants for each segment, the average of the number of size variants for each segment is calculated.
The number of treatment sizes is constrained concerning the shape and volume of the final assembly, as described in Section 4.3.2. In Equation (4), describes the ratio of patients within each segment and is obtained through Equation (3).
The results of the metric are displayed in Figure 9, where, as with the preceding benefit metrics, the percentage increase is presented when comparing the modular product designs to the reference case. Overall, similarly to the metric, substantial increases in the number of product variants offered for the patient to choose from can be obtained simply by just introducing an additional module, a filling module, to provide size scalability. Studying the raw data of (see Table A1 in Appendix A), the reference case can offer a single treatment size for each dose strength, whereas portfolio A can, on average, offer 14.25, portfolio B 8.0, and portfolio C 11.13. These numbers correspond to increases of 1330%, 700%, and 1010%, respectively.
Portfolio B shows the smallest increase in . The reason is that the geometrical size of API core B, which is used for configuring the product variants of portfolio B, is the same as for API core A (used in portfolios A and C), however, API core B contains only half the dose content of the API core A. Thus, the configured treatments of portfolio B are larger in size compared with, especially, portfolio A when configuring treatments of the same dose strength. In addition, since there is an upper limit in treatment size, the size scalability by the means of filling modules is much lower for portfolio B than for A since the remaining volume to fill by filling modules for treatments of portfolio B is much smaller. The same reason applies when considering the size scalability of portfolio C compared to portfolio A. Portfolio C poses some increased level of size scalability compared to portfolio B due to using both API cores A and B for product variant configuration. Hence, for a fixed dose, portfolio C can configure several sizes of treatment variants by varying the API cores A and B; on average, the remaining volume of the treatments within which to vary the filling modules is larger for portfolio C than portfolio B.
4.5.4. Patient Benefit Exemplification
To describe the meaning of an increased patient benefit by the means of modular product designs, an exemplification is offered in Figure 10.
In Figure 10, the example of treatments that a patient requiring the dose strength of 34.3 mg can be offered in the respective scenario is illustrated. The reference case displays the current mass production paradigm, where the patient receives a dose of 50 mg. The resulting treatment outcome from a dose perspective, , is 0.54. Furthermore, this patient is limited to a single target release profile and treatment size, i.e., the values for and are 1.
The selection of treatments offered to the patient from portfolio C for both the dose-dependent and -independent scenarios are displayed in Figure 10. Note that not the exhaustive set of treatment choices have been illustrated. For both scenarios, the benefit from a dose perspective, , can be increased to 0.98. For the dose-dependent scenario, the patient has eight target release profiles to select from. In a dose-independent scenario, the selection of the number of target release profiles is increased to 40. Furthermore, portfolio C can at an average offer the patient a selection of 15.5 treatment sizes. An average number for treatment sizes is displayed since the treatment variants posing different release properties, i.e., D1 to D8 or I1 to I40 poses different size scalability properties. For example, the degree of size scalability of treatment D8 is not as large as for treatment D1 due to the former configuring a larger treatment from the API cores alone before the filling modules for size scalability is introduced.
4.6. Cost Model
Equation (5) displays the total cost, , of a treatment portfolio. In this equation, is the preassembly cost, and is the final assembly cost; both these expressions are based on the complexity factor by Pugh [41].
4.6.1. Preassembly Cost
The preassembly cost, , is only applicable in the dose-independent scenario since the preassembly process is therein used to transform API cores, lids and cups, into API modules (see Figure 4). The preassembly cost, , is obtained through Equation (6), where is the number of parts in an API module, is the number of interfaces between the parts, and is the number of types of parts in an API module.
4.6.2. Final Assembly Cost
The final assembly cost, , is obtained through Equation (7) and is applicable to the process of transforming modules into assemblies (see Figure 4).
In Equation (7), , , and are the number of modules, interfaces between the modules, and types of modules, respectively, calculated for each unique product variant within each patient segment for each treatment portfolio, both for dose-dependent and -independent scenarios. The expression is averaged by the number of product variants, , within each segment. Finally, for each treatment portfolio, a weighted average is calculated for using the patient segment fraction of the total treatment population, , obtained through Equation (3).
In Equations (6) and (7), K is the constant of convenience, and f is the number of functions within the assembly for which the cost is evaluated.
4.6.3. Cost Assessment
The cost assessment is performed for both the reference case and the respective portfolio embracing modular product designs. The result is displayed as a change in cost when comparing each portfolio embracing modular product designs to the reference case, respectively, for both dose-dependent and -independent scenarios.
- —
- Reference case cost assessment
As mentioned, the reference case is based on a commercial treatment providing two tablets containing the dose strengths 50 and 100 mg. A split tablet not only generates additional dose strengths, but also an imaginary interface is introduced to perform cost estimates on the commercial treatment by using Equation (7). This imaginary interface aligns with the splitting line, displayed in Figure 3a. If this imaginary interface were not introduced, Equation (7) could not be used for cost assessment since the number of interfaces, Ni, would be equal to zero, making the expression in Equation (7) zero. Hence, the result of the reference case would not be comparable with the cost of the treatment portfolios embracing modular product designs.
- —
- Modular product design cost assessment
The preassembly cost, , obtained through Equation (6), is equal for each treatment portfolio (for the dose-independent scenario); since each API module consists of three parts (an API core, a lid, and a cup), the assembly of the parts is fixed, and, in this study, three interfaces are assumed (one between each part). Finally, the API module is configured of three types of parts since each part in the API module is a type of its own.
To perform a final cost assessment, the sets of product variants in each treatment portfolio obtained through platform execution are used. The output from platform execution describes the and for each product variant within each treatment portfolio. To calculate the number of interfaces, , within each assembly (product variant) of each treatment portfolio, the final configuration of the assembled treatment must be known. In Section 4.3.2, the approach of assembling the treatments into desired module constellations is described. Based on the module constellations in an assembly, the number of interfaces between the modules is calculated by Equation (8).
In Equation (8), NMS is the number of modules in a stack, and NSS is the number of saturated stacks (a full arrangement of four modules) placed on top of each other, as displayed in Figure 5c. NMPNS is the number of modules in any non-saturated stack.
According to Pugh [41], the product , in both Equations (6) and (7), is the cost driver; thus, the focus is directed to this product in the modeling. Hence, K, which, in Equations (6) and (7), is a constant of convenience, is set to one. denotes the number of functions of the product; thus, the complexity factor essentially indicates the cost per function. However, in this study, the number of functions is set to one when using Equations (6) and (7). The reason is that the functions embedded by any treatment portfolio will be the same, since the idea is to propose treatment portfolios complying with each of the design requirements: dose strength scalability, target release profile flexibility, and size scalability. These design requirements are the primary functions embodied by the product design, providing value for the patient.
Figure 11 displays the resulting increase in the cost of each treatment portfolio for both dose-dependent and -independent scenarios. Since the cost of any treatment portfolio embracing modular product designs is calculated as a change compared to the reference case, it is evident that portfolios consisting of modular product designs will increase the cost of production. In addition, an increased level of modularization will increase the cost of production. For example, when comparing portfolio A to portfolio B, the API core in portfolio B entails a smaller dose than the API core of portfolio A. The consequence is that portfolio B requires more API cores in an assembly to generate product variants of the same dose strength as portfolio A, hence increasing the value of in Equation (7). When comparing portfolios B and C, portfolio C does not necessarily require as many API cores for generating a specific dose strength as portfolio B since portfolio C has two API core sizes to use for configuration. However, due to portfolio C using two cores for configuration, the value for in Equation (7) is increased, and thus, overall, the final cost of portfolio C is higher than that for portfolio B. The difference in cost when comparing the dose-dependent and dose-independent scenarios for the respective treatment portfolio is due to the preassembly cost, which is added in the dose-independent scenario.
4.7. Value Model
Overall, when studying the benefit and cost metrics, the cost increases for the treatment portfolios are between ~450 and 800% compared to the reference case, whereas the increase in benefit metrics, especially for and , can approach and exceed values of ~1300%. This might give some indication that the benefit of modular product designs increases faster than their production cost. However, the benefit and cost metrics are not directly comparable as they currently stand.
To enable weighing the cost to benefit, an approach to assess the value of each treatment portfolio is suggested. Based on the concept scoring method by Ulrich and Eppinger [24], the final value, V, of each treatment portfolio is calculated through Equation (9).
In Equation (9), is the sum of each benefit metric and is, in Equation (9), described for each treatment portfolio by a score on a scale of 1 to 5. Similarly, is a score on a scale of one to five. To distribute scores for the benefit and cost metrics in Equation (9), a scale for each performance metric has been constructed. These scales are based on raw data obtained when calculating the performance metrics for each treatment portfolio. This raw data can be found in Table A1 in Appendix A. For each performance metric, the highest and lowest performances, across the treatment portfolios, have been used in between to establish a linear relationship. To exemplify a scale, Figure 12 presents the scale for the metric. The reference case performs the worst on this metric, i.e., = 0.7909 for which the score p = 1 is assigned. Portfolios B and C perform the best on this metric, i.e., = 0.9581 for which the score p = 5 is assigned. A linear relationship is established in between these metric values and scores (see Figure 12), and the remaining portfolio performances are evaluated on this linear scale to be assigned a score. Thus, the final score on each performance metric that each treatment portfolio obtains depends on how well the treatment portfolios perform (i.e., where they end up on the scale). The remaining scales for the performance metrics and the final scores of each treatment portfolio on each performance metric are found in Figure A1, Figure A2, Figure A3 and Figure A4 in Appendix B and Table A2 in Appendix C, respectively.
The scores obtained for the benefit and cost metrics that each treatment portfolio achieves are divided by the number of either benefit or cost metrics (i.e., or ), respectively, to obtain an average score of both benefit and cost. Furthermore, the benefit and cost metrics are weighted to explore cases where either the benefit and cost are weighted equally or where either the benefit or the cost is emphasized. The weighting is determined through the weight factors in Equation (9), and . The cases explored are illustrated in Table 2 where, in the Value 50–50 case, the cost and benefit are weighted equally; in the Value 67–33 case, the benefit is emphasized; and, finally, in the Value 33–67 case, the cost is emphasized.
Value Assessment
Table 3 presents the value of each treatment portfolio for both dose-dependent and -independent release scenarios. Furthermore, based on the resulting value of each treatment portfolio, to get a quick sense of how the treatment portfolios compare to each other, a ranking has been assigned when comparing the resulting values.
When the cost and benefit are equally emphasized (i.e., Value 50–50 case), the reference case is resulting in the highest value followed by portfolios A and C for the dose-dependent release scenario. Portfolio A and C performs well on the and metrics but poorly on the cost metric, whereas the reference case maximizes the cost metric but performs poorly on the benefit metrics. Since the benefit term of the value equation is an average of each benefit metric, the overall benefit term will suffer when the performance is not maximized on each of the benefit metric. For example, portfolios A and C for the dose-dependent release scenario maximizes or performs well on the and metrics, but since the performance on the metric is worse, the overall benefit term suffers noticeably even though the and metrics are significantly better for portfolios A and C compared to the reference case.
An increased modularization (moving from portfolio A to portfolio C) can result in a benefit exceeding the cost, however, the benefit must be emphasized prior to cost (i.e., Value 67–33 case). The reason for this can be seen in Figure 7, Figure 8 and Figure 9, where an evident increase in benefits can be obtained through modular product designs. Especially when comparing portfolios A, B, and C, in the dose-independent release scenario, an increased value can be seen by increased degree of modularization. Even the dose-independent release scenario of portfolio C exceeds the dose-dependent scenario of portfolio A in value due to the vast increase in benefit resulting from product modularization.
When emphasizing cost prior to benefit (i.e., Value 33–67 case) a low degree of modularization is suggestively resulting in higher value. When, for example, comparing portfolios A to C for the dose-independent release scenario, the final value of portfolio C is lower than for A and B, which could suggest that the cost of increased modularization exceeds its benefits.
5. Discussion
To answer the research question RQ1: How can individual product design requirements be realized in a pharmaceutical product for customization? the CC method was proposed as an approach to integrate product design requirements as functions into the pharmaceutical product. The usability of this approach has been demonstrated by developing a CC model of a treatment integrating the design requirements of dose strength, target release profile, and size. By using the independently operating CC objects, these separate design requirements have been incorporated as functions in the overall product. As these CC objects operate independently, a modular approach to variety has been presented, i.e., an overall treatment can be configured by using or not using each CC object depending on the design requirements to which the treatment must comply.
The API core was introduced to satisfy the design requirement dose strength. To incorporate the design requirement target release profile, two approaches to realization were discussed; the first relies on the inherent release properties of the API cores (dose-dependent release), and the second approach introduces a release control system by means of lids and cups (dose-independent release). Finally, the filling module was introduced to satisfy the design requirement size.
Not only were these design requirements incorporated, but so were the desired properties of these design requirements, i.e., a scalable dose strength, a flexible target release profile, and a scalable treatment size. Achieving flexibility in these design requirements enables the customization of the treatment according to the individual needs of the patients. The flexibility of the design requirements has been realized through the scalable approach to product variety. For example, a scalable dose strength is achieved by introducing API cores with a low dose content, and by varying the number of API cores in a treatment, the dose strength of the treatments can be varied. Furthermore, different sizes of API cores were introduced to further increase product variety. A decreased dose content of the API core increases the dose strength scalability. Lowering the dose content raises two considerations, though. If the dose content is decreased but the overall material content of the treatment remains fixed, the API core size decreases in proportion, and this means that the manufacturability of these must be verified. The second consideration is to keep the API core size to ensure their manufacturability. Hence, the material content of the core is changed, resulting in a decreased dose content. The case study in this paper is, however, purely theoretical and serves the purpose of testing the usability of the proposed method of generating modular product designs for pharmaceutical products, and rather describes the approach to increase the scalability of the treatment dose strength. API core design concerning limits in sizes and dose content, the manufacturability of these as well as the resulting dose strength scalability is product specific and depends on the API to excipient ratio. Thus, the dose strength scalability shall be investigated for each product separately. The challenge of configuring treatments (final assemblies) embracing higher dose contents arises since, for the convenience of administering any treatment, an upper size limit exists. This study did, however, only explore two different sizes of API cores to determine any indication of the benefit and cost of the resulting treatments. This study did not, by any means, aim to optimize the size(s) of the API cores or the number of different-sized API cores that should be incorporated in a treatment portfolio for the optimized benefit and cost.
Target release profile flexibility is obtained by two approaches. The first scenario is relying on the dose dependency of the release (i.e., depending on the API-to-excipient ratio of the API core) as well as the size and the shape. The resulting release mechanism has not been studied and is left for future work. The other scenario is dose-independent release, which is controlled, and the product variety can be increased vastly, since this approach relies on the release properties of lids. The lids ensure that the release is slower than through the cores, meaning that the lids control the release. This study has only explored the consequence on benefit and cost of introducing lids with two different release properties. This study did not study the explicit manufacturing process of the lids, the release mechanism of the lids and the obtained release window of treatment through varying the lids but should be in future studies.
The scalable size property was realized by scaling the number of filling modules. A single size of a filling module was used, and the number was varied within the limits of a maximum treatment volume, described in Section 4.3.2. This study aimed to explore the size scalability property and suggest an approach to achieve this. The preferred size or shape of a treatment for any specific patient is outside the scope of this research.
This study demonstrated the applicability of the method by integrating three design requirements, dose strength, target release profile, and treatment size, for the means of pharmaceutical product customization. This study has not integrated the exhaustive set of design requirements; however, the CC method is general and can be used to integrate any desired design requirement by translating the design requirement into a functional requirement and searching for design solutions to this. This way the CC method can likewise be used to develop function models of pharmaceutical products, beyond the dosage form of a tablet, by focusing on the functions required for the specific dosage form of interest. CCM was used to develop a platform basing on the CC model of the pharmaceutical product. CCM is a research tool and due to its limitations support was brought from MATLAB to, for example, eliminate unfeasible solutions and to perform benefit, cost, and value assessments. Hence, this approach to platform modeling does not offer a complete solution applicable in the industry yet, however, a basis and a concept is presented to be further developed into a robust tool for usage in the industry.
To answer the second research question, How can the cost and benefit of customized pharmaceutical product designs be assessed?, this study proposed three categories of performance metrics—benefit, cost, and value—to assess the value for the patient when redesigning the pharmaceutical product to comply with patient design requirements. To assess the performance, the CC model was developed into a platform based on a commercial SSRI treatment, and through platform execution treatment, portfolios A, B, and C, embracing modular product designs, were generated. Three metrics were proposed within the benefit category: , , and . complies to the design requirement of dose strength scalability and adapts the concept of quality decay, which was initially suggested by Siiskonen et al. [20]. This metric describes how closely the dose received by the patient matches the patient’s optimal dose. How to define the optimal dose of the patient is a question that belongs to the diagnostic field of research and is outside the scope of this study. However, in this study, based on the selected model treatment, a fictitious treatment population was generated following a normal distribution between 25 mg and 100 mg for the means of illustrating the usability of the described model.
The second benefit metric, , was proposed to assess the target release profile flexibility of the treatment portfolios. This metric assesses the unique number of release profiles a patient with a predefined dose can choose from. As an initial suggestion, this term can indicate the improved treatment quality concerning target release profiles by using the increase in the number of release profiles. However, future work should be conducted to, for example, construct a metric that can describe the release profile window that it is possible to create from the components of the treatments and then assess the distance between the optimal release profile of the patient and the release profile that actually can be generated for the patient by the treatment portfolios.
The third benefit metric, , was an initial suggestion to assess the size scalability of treatments within a treatment portfolio; for this, the number of treatment sizes that a patient, given a preselected dose and target release profile, can choose from is used as an indication for improved treatment quality. Future work should, however, incorporate the design of an assessment procedure where the optimal size and shape of treatment for the patient and the size and shape received by the patient can be compared.
To assess the cost of the treatment portfolio, the complexity factor by Pugh [41] was used as a proxy. This factor indicated additional costs arising from the manufacturing of more complex product designs (i.e., modular products instead of fully integral products, as the reference case represents). In this study, the reference case (a fully integral product, meaning it is not composed of several parts or modules) does not entail any interfaces between the modules, since no modules exist to create any interfaces. Hence, the cost estimate using the complexity factor in Equation (7) cannot directly be used to give a comparative number to which modular product designs can be compared since the resulting complexity factor for a fully integral product is zero. By introducing an imaginary interface to the product design of the reference case, the complexity factor was used as an estimate indicating cost; however, with this approach, the complexity factor is overestimated, which might indicate an overestimation of the cost. On the other hand, the inclusion of the imaginary interface also allows for tablet splitting, which generates additional dose strengths for the reference case; similarly, this overestimates the benefit of the reference treatment portfolio. As an initial suggestion of cost assessment, this overestimation of both the cost and benefit was accepted; however, the complexity factor is an initial pragmatic estimate for design concepts to indicate the cost. The complexity factor by Pugh [41] is based on discrete part products. In the current mass production context, pharmaceutical products embrace a composite type of nature rather than being discrete part products. However, the approach to product modularization for pharmaceutical products is inspired by discrete part products, especially modular product architectures that have been established for product customization purposes. Thus, the complexity factor, likewise inspired by assessments performed on discrete part products, has been used to assess the increase in cost when generating modular architectures for pharmaceutical products. The complexity factor has been used as an indicative measure, measuring a change when comparing the reference case to any modular product design case. The complexity factor has not been used to describe any absolute increase in cost. To determine if the complexity factor is the right approach to assess the cost of modular pharmaceutical products is not further discussed. Detailed cost models should, however, be constructed when more knowledge about the product is acquired, the material selections are made, and the manufacturing processes are outlined and so forth. The scope of this study, however, extended to modular product design; hence, the consideration of actual material selection, the selection of manufacturing processes from a cost-efficiency and technical realizability perspective has not been incorporated; however, this shall be addressed in future research.
The value assessment approach for each treatment portfolio has been suggested to weigh the benefits to the cost. Scales were created based on the raw performance data of each treatment portfolio on the respective performance metric. The scales were established to follow a purely linear scoring system between the lowest- and highest-performing portfolio on the respective metric. Whether the scales should be designed to follow linear relationships was not further studied; however, for sensitivity purposes, future experiments could be conducted to determine if any other type of scales (for example, following multiplicative or exponential relationships) will change the resulting value assessment.
The expression for value consists of two distinct terms: benefit and cost. The benefit term consisted of the three performance metrics , and . These have in this study been equally weighted in the expression for value. However, future studies can consider the weighting of these benefit metrics in relation to each other depending on the patient preference; this can provide the basis for the selection of the most suitable treatment for that patient.
Since the cost term only consists of a single metric, no inherent weighting must be considered for this term. Nonetheless, the benefit and cost terms were weighted against each other to create cases that either weigh the benefit and cost equally or emphasize either the benefit or the cost (i.e., the cases Value 50–50, Value 67–33, and Value 33–67). These cases have been created for the sole purpose of testing the impact in the resulting value metrics of the respective treatment portfolio. To determine whether the correct weights have been assigned was not the objective of this study. The value model was kept general, and essentially the stakeholders responsible for designing the products must choose the weighting to suit their respective business models.
Overall, to increase the value for the patient, modular product designs could be used to integrate desired design requirements into treatments, resulting in substantially increased performance concerning the benefit metrics, especially and . However, these benefit metrics measured the number of variants for the patient to choose from while fixing the dose of the patient. Clarifying the optimal target release profile and treatment size of the patient, as well as the offered target release profile and the treatment sizes by their portfolios, would allow to investigate the match between the optimal and the offered target release profile and size, respectively. This match would better reveal the actual increase in the benefit metrics and and reveal if the increase in performance, magnitude-wise, can reach the values that resulted from the approach to assess the performance in this study. In addition, the cost of producing modular products, posing increased benefits, increases in a similar trend. Thus, further studies should consider the tradeoff between the increased benefit for the patient and the increased cost of production. Ultimately, a better treatment could cost more due to its benefits, but the question remains of how much more is viable from a business perspective.
In this study, the benefit for the patient has solely considered benefits from a single treatment perspective. Product modularization offers another significant opportunity, combination therapeutics. Polypharmacy, i.e., administering multiple medications in a day, has been discussed as a reason for nonadherence especially for an ageing population [46]. Modular pharmaceutical product designs could offer a solution to nonadherence from polypharmacy since instead of administering multiple treatments, the treatments could be combined as modules into a single treatment and thus, improve the adherence rate.
Increased modularity (i.e., from portfolio A to C) displayed an overall improved performance concerning benefits, mainly from a dose strength and target release profile perspective. However, when regarding the benefit from a size scalability perspective a lower degree of modularization is preferable due to the size restriction of the final treatment. The key is to consciously design the modules to find the balance that results in a degree of modularization that, from a cost and benefit perspective, provides the best outcome. To develop this optimal design will probably be a case-by-case consideration, and any further discussion of this is outside the scope of this paper. Not only is the trade-off between benefit for the patient and the cost of production a key consideration when modularizing products; pharmaceutical production is a highly regulated environment that currently poses strict approaches for the quality control of any commercial pharmaceutical product. The approaches to quality control today generally imply an off-line quality control of each batch produced. Employing current quality control approaches with increased product modularity and the resulting increase in complexity of production logically implies an increased degree of quality control activities. The management of the required increase of quality control activities remains a challenge. Hence, the challenge of quality control for customized pharmaceutical products is researched and for notable research initiatives on the topics such as quality by design and process analytical technology for real-time quality control the reader is referred to [47].
6. Conclusions and Future Work
This paper presented an approach to integrate three product design requirements—dose strength, target release profile, and size—to customize pharmaceutical products according to patient needs. The CC method enabled the integration of these design requirements as functions to which design solutions were assigned and, further, which were developed into independently operating CC objects. These CC objects were further realized as components that generated modular product designs.
The API core was introduced to satisfy the design requirement of dose strength, the lid and cup were used to meet the design requirement of target release profile, and the filling module was employed to fulfill the design requirement of size. To achieve the desired flexibility of these design requirements, scalable parameters of the design solutions were defined. For example, by introducing an API core with low dose content, the number of these cores could be scaled to generate treatments of different dose strengths.
An SSRI treatment was selected as a model treatment for which a platform was developed, based on the CC model of a treatment. Through platform execution, treatment portfolios were generated. Portfolios A, B, and C embraced modular product designs, with varying degrees of modularization, and the design of the reference case was based on the model treatment. Furthermore, a patient population for this model treatment described by patient needs was developed. The value of the treatment portfolios for the patient was assessed through three categories of performance metrics: benefit, cost, and value. From a benefit perspective, three metrics were suggested to comply with the three product design requirements: dose strength scalability, target release profile flexibility, and size scalability, respectively. The results showed that
- —
- Increased degree of modularization can substantially increase the ability to match the offered treatment to the patient’s optimal dose.
- —
- By introducing a few components to increase target release profile flexibility, there is a substantial increase in the number of target release profiles from which the patient can choose.
- —
- Maximizing the dose content of the API core offers the best conditions for maximizing treatment size scalability.
To assess the cost of each treatment portfolio, the complexity factor by Pugh [41] was applied. The results indicated that the cost of modularization does not increase as fast as the improvement obtained in the benefit metrics. However, as the benefit and cost metrics are not directly comparable, value has been suggested as an approach to compare the treatment portfolios concerning the benefit for the patient and the cost of producing the various product variants within a treatment portfolio. Overall, the results showed that
- —
- An increased degree of modularization (moving from portfolio A to portfolio C) can result in faster increasing benefits compared to the increasing costs from modularization.
However, several tradeoffs between design choice concerning the degree of product modularization and the performance metrics could be detected. A decreasing API core dose strength promotes dose strength scalability; however, the size scalability of a treatment portfolio suffers. Introducing additional components such as lids and cups substantially improves the target release profile flexibility, but the cost of production increases. Further studies should account for which design requirement is the most important to support decisions regarding modular product designs and/or to conduct module design optimization by maximizing the benefit and cost tradeoff.
This study only considered modular product designs. Process flexibility (i.e., the feasible approach to producing increased product variety) as well as a profitable provision (i.e., the ability to supply the customized pharmaceutical products to the patients) should be studied along with product modularization. Ultimately, if the customized pharmaceutical product cannot be produced and supplied profitably, it will not reach the patient, and thus the treatment outcome cannot be enhanced.
Author Contributions
Conceptualization, M.S., J.M. and S.F.; methodology, M.S.; software, M.S.; formal analysis, M.S.; investigation, M.S.; writing—original draft preparation, M.S.; writing—review and editing, M.S., J.M. and S.F.; visualization, M.S.; supervision, J.M. and S.F.; project administration, M.S., J.M. and S.F.; funding acquisition, J.M. All authors have read and agreed to the published version of the manuscript.
Funding
This research was funded by an internal grant received from the Chalmers University of Technology Foundation.
Conflicts of Interest
The authors declare no conflict of interest.
Appendix A. Performance Assessment
Table A1 displays the resulting raw data on assessing the resulting performance of each treatment portfolio, reference case, A, B and C, for both the dose-dependent and -independent scenarios. The resulting performance is assessed for the benefit-metrics, , and as well as the cost-metric, .

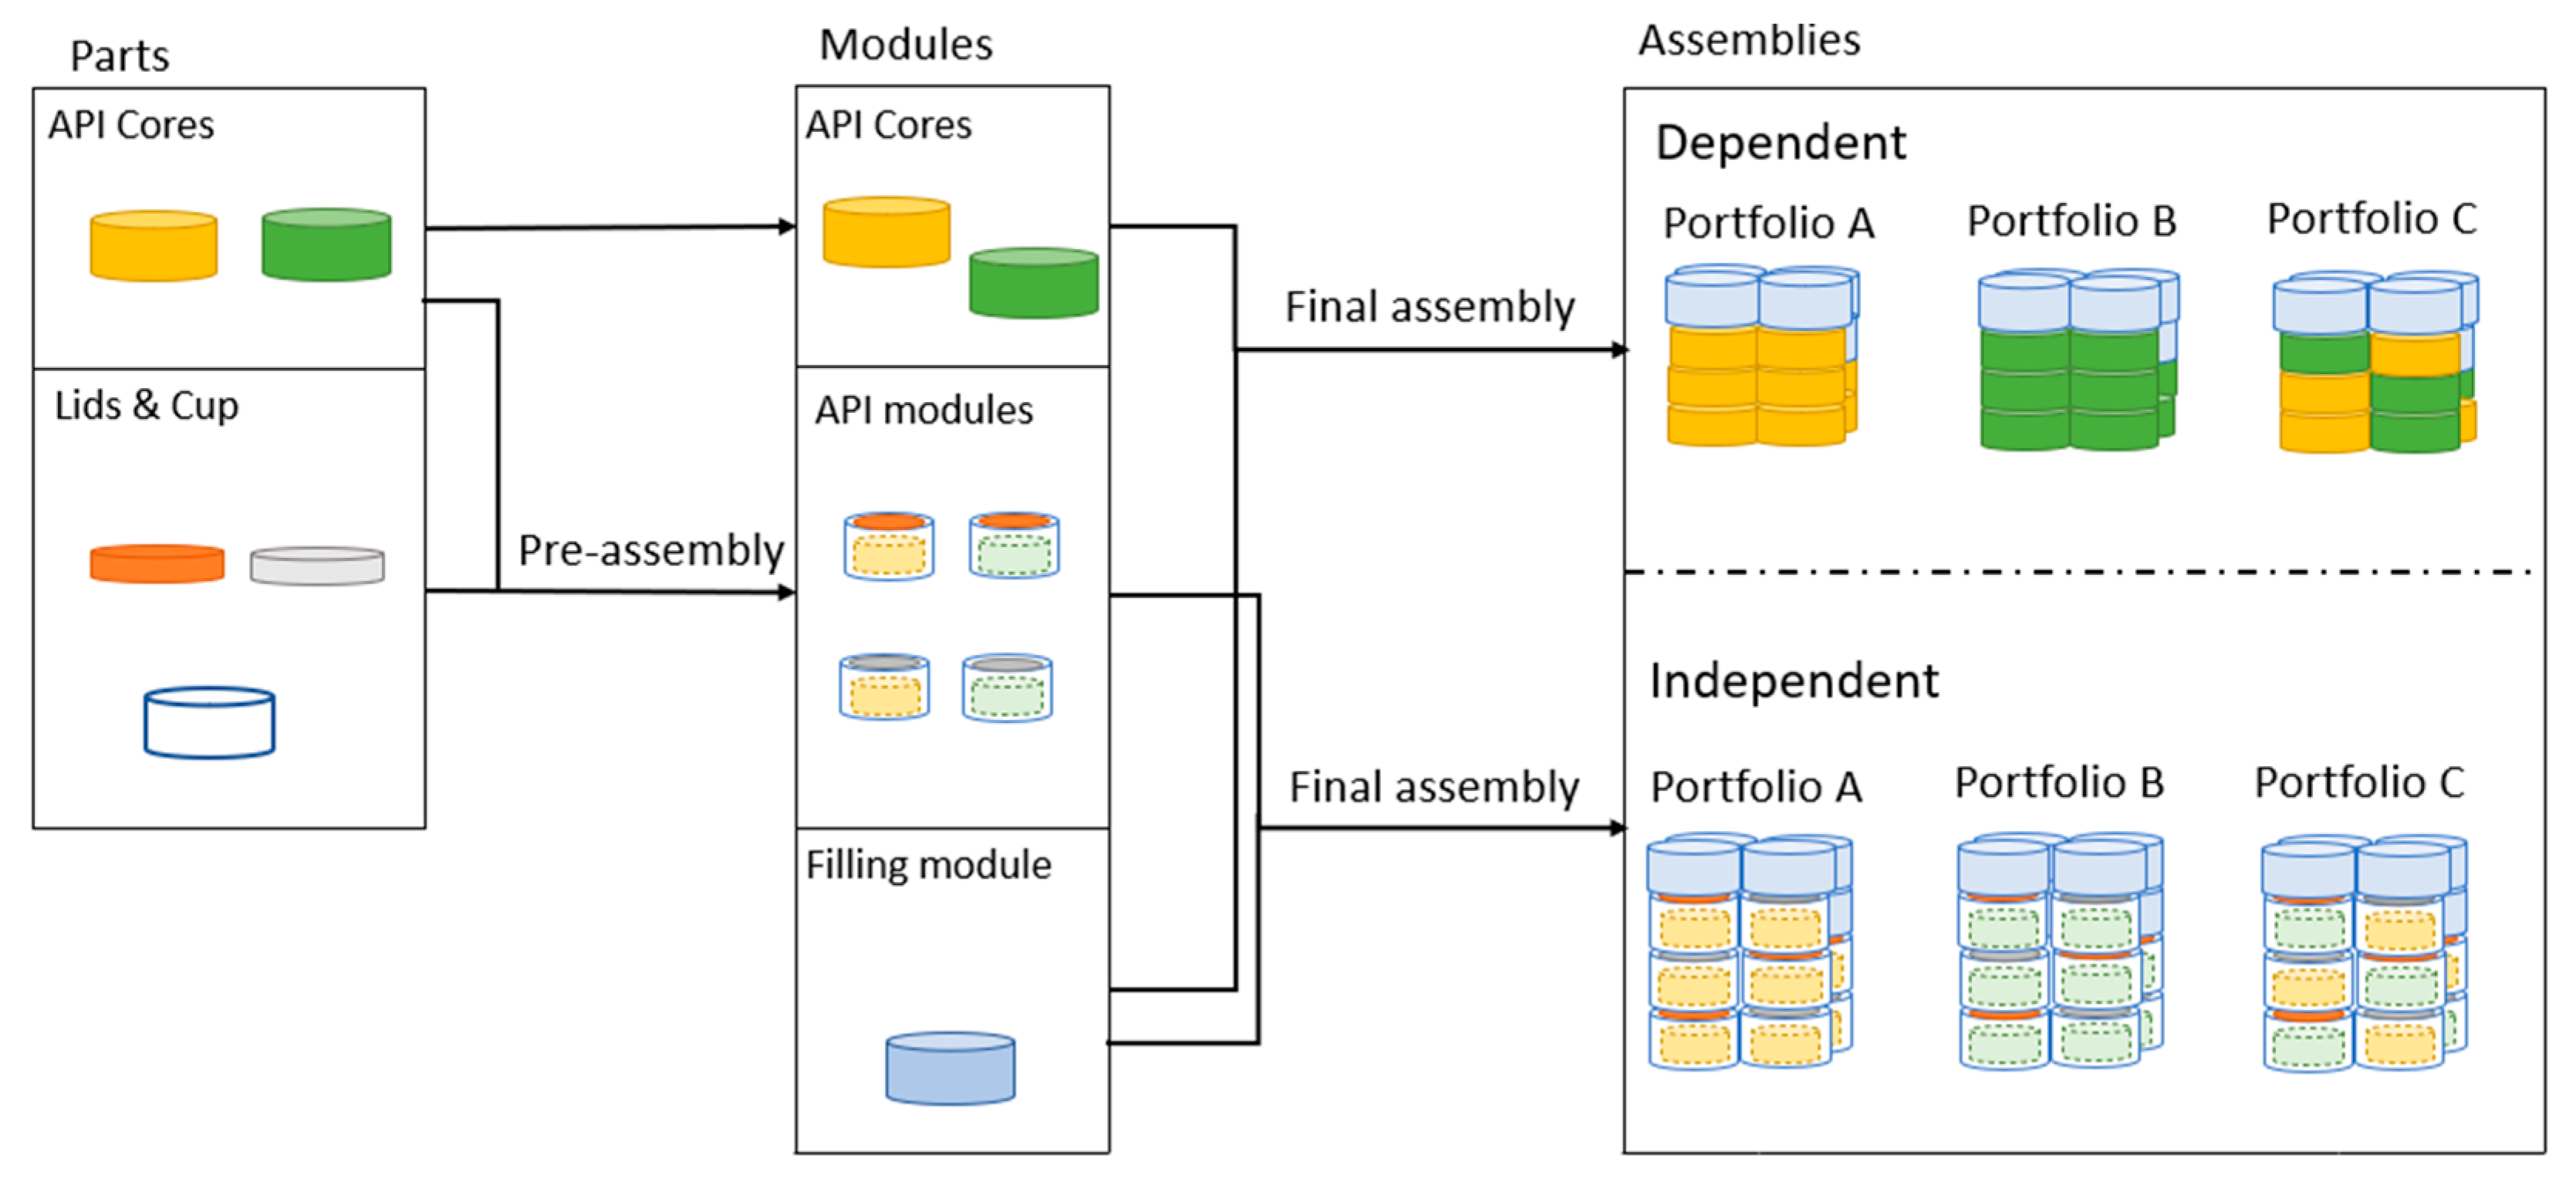
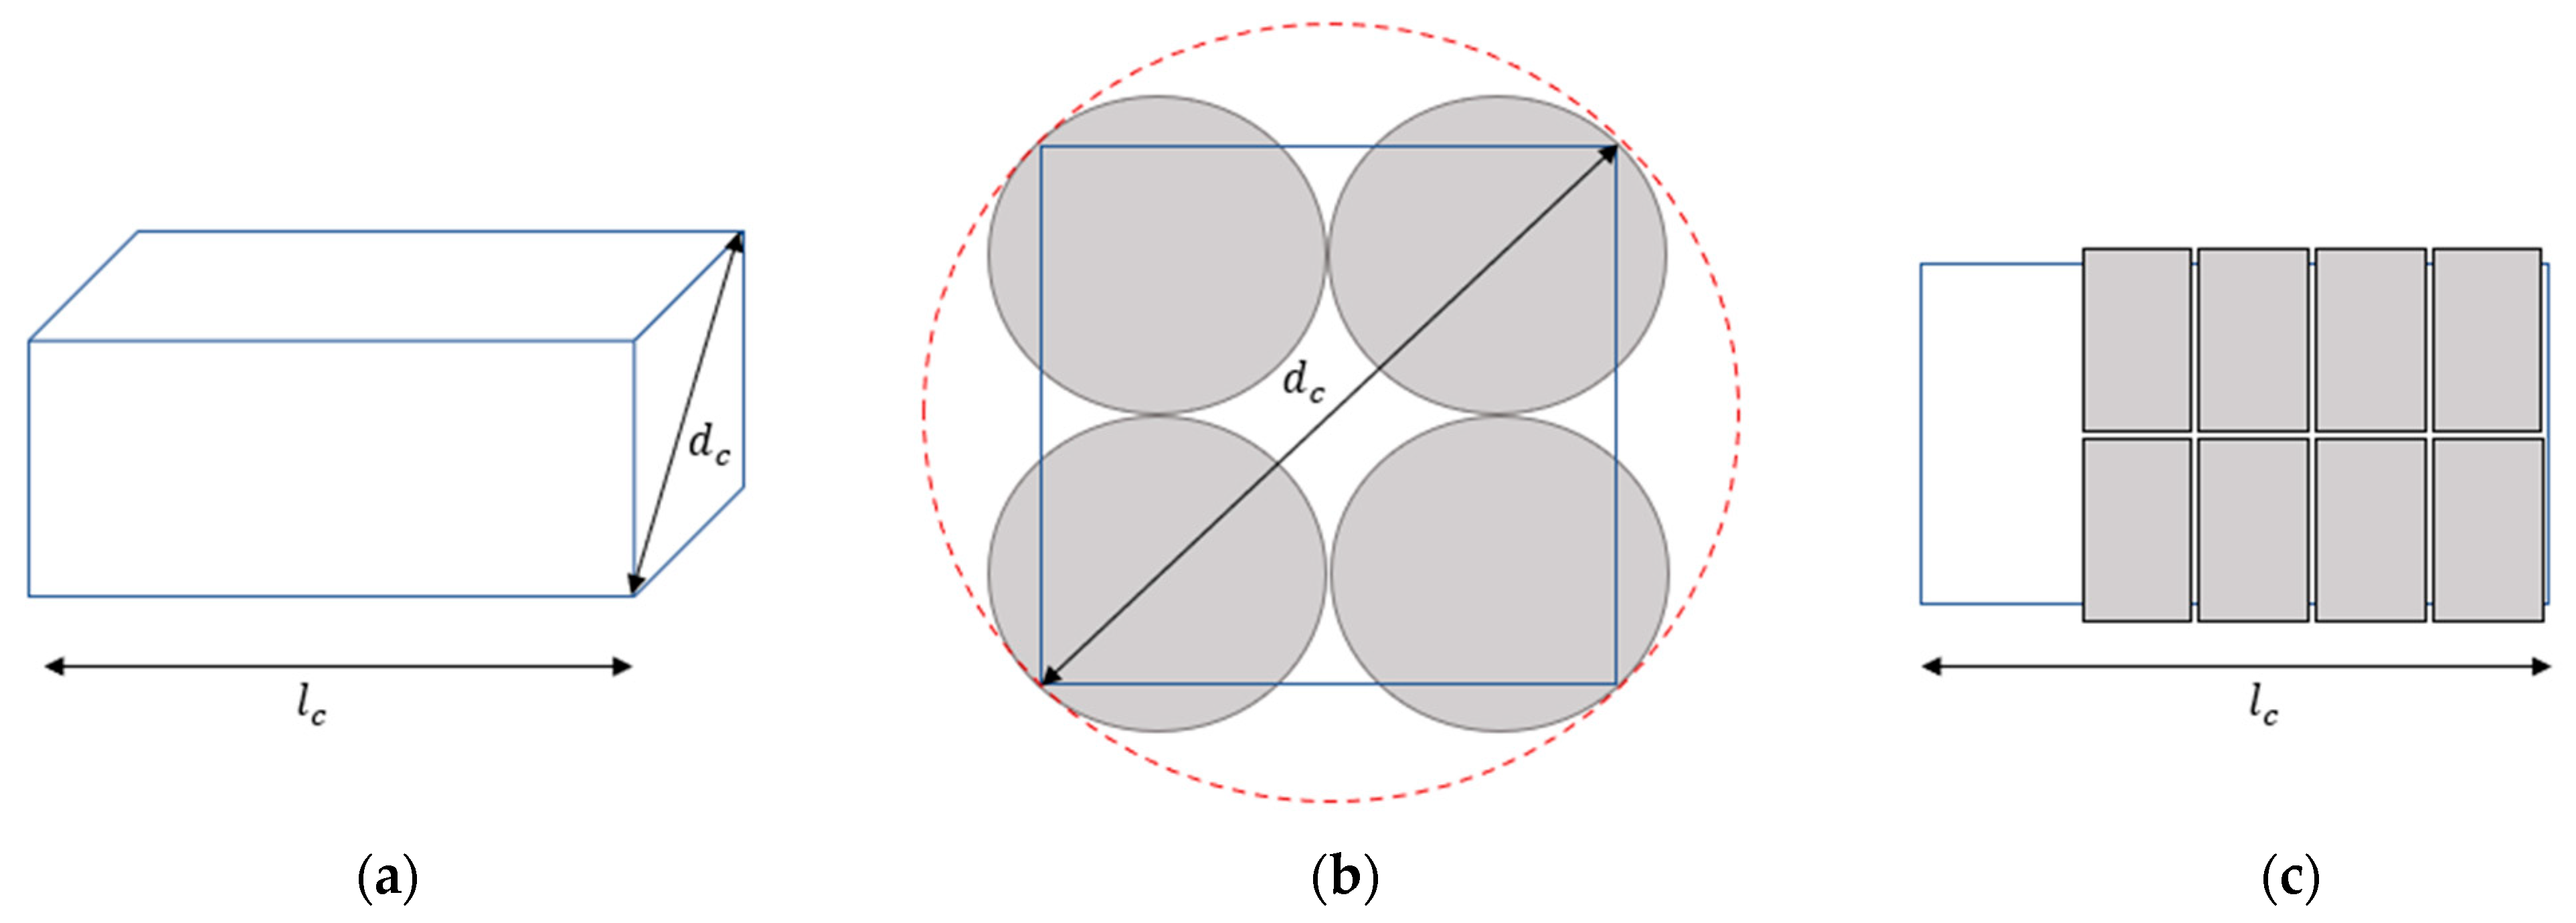
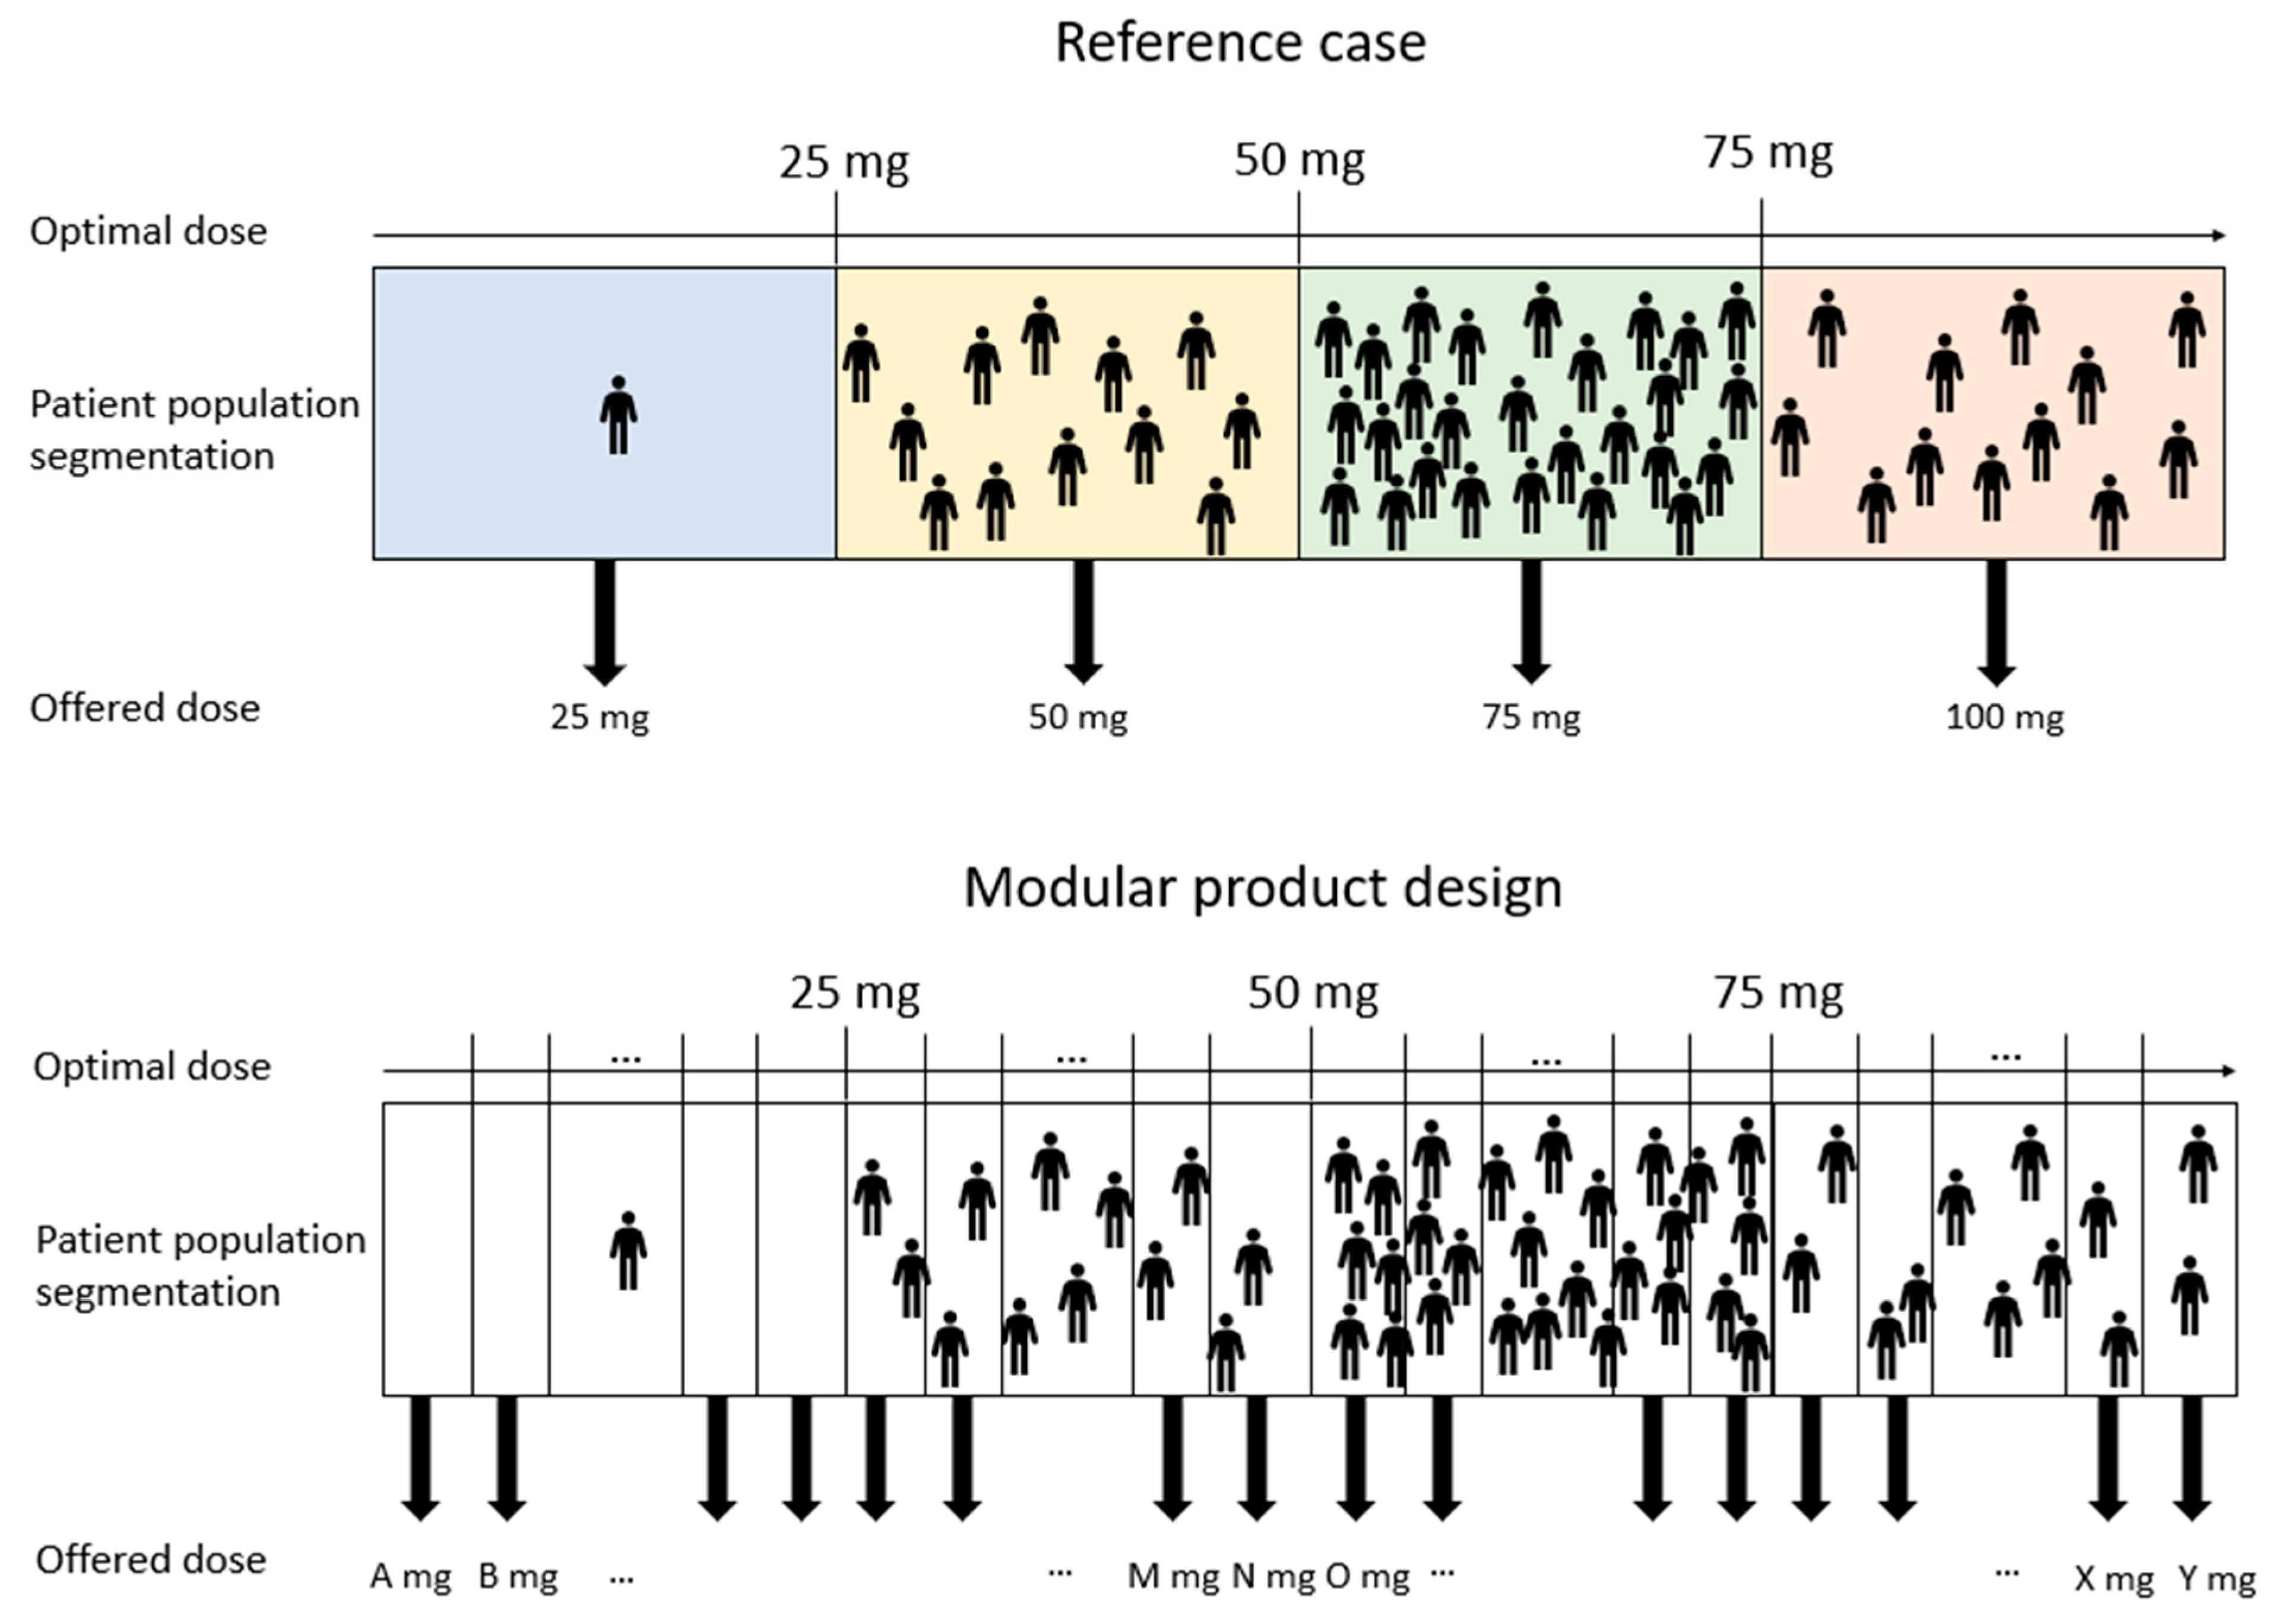
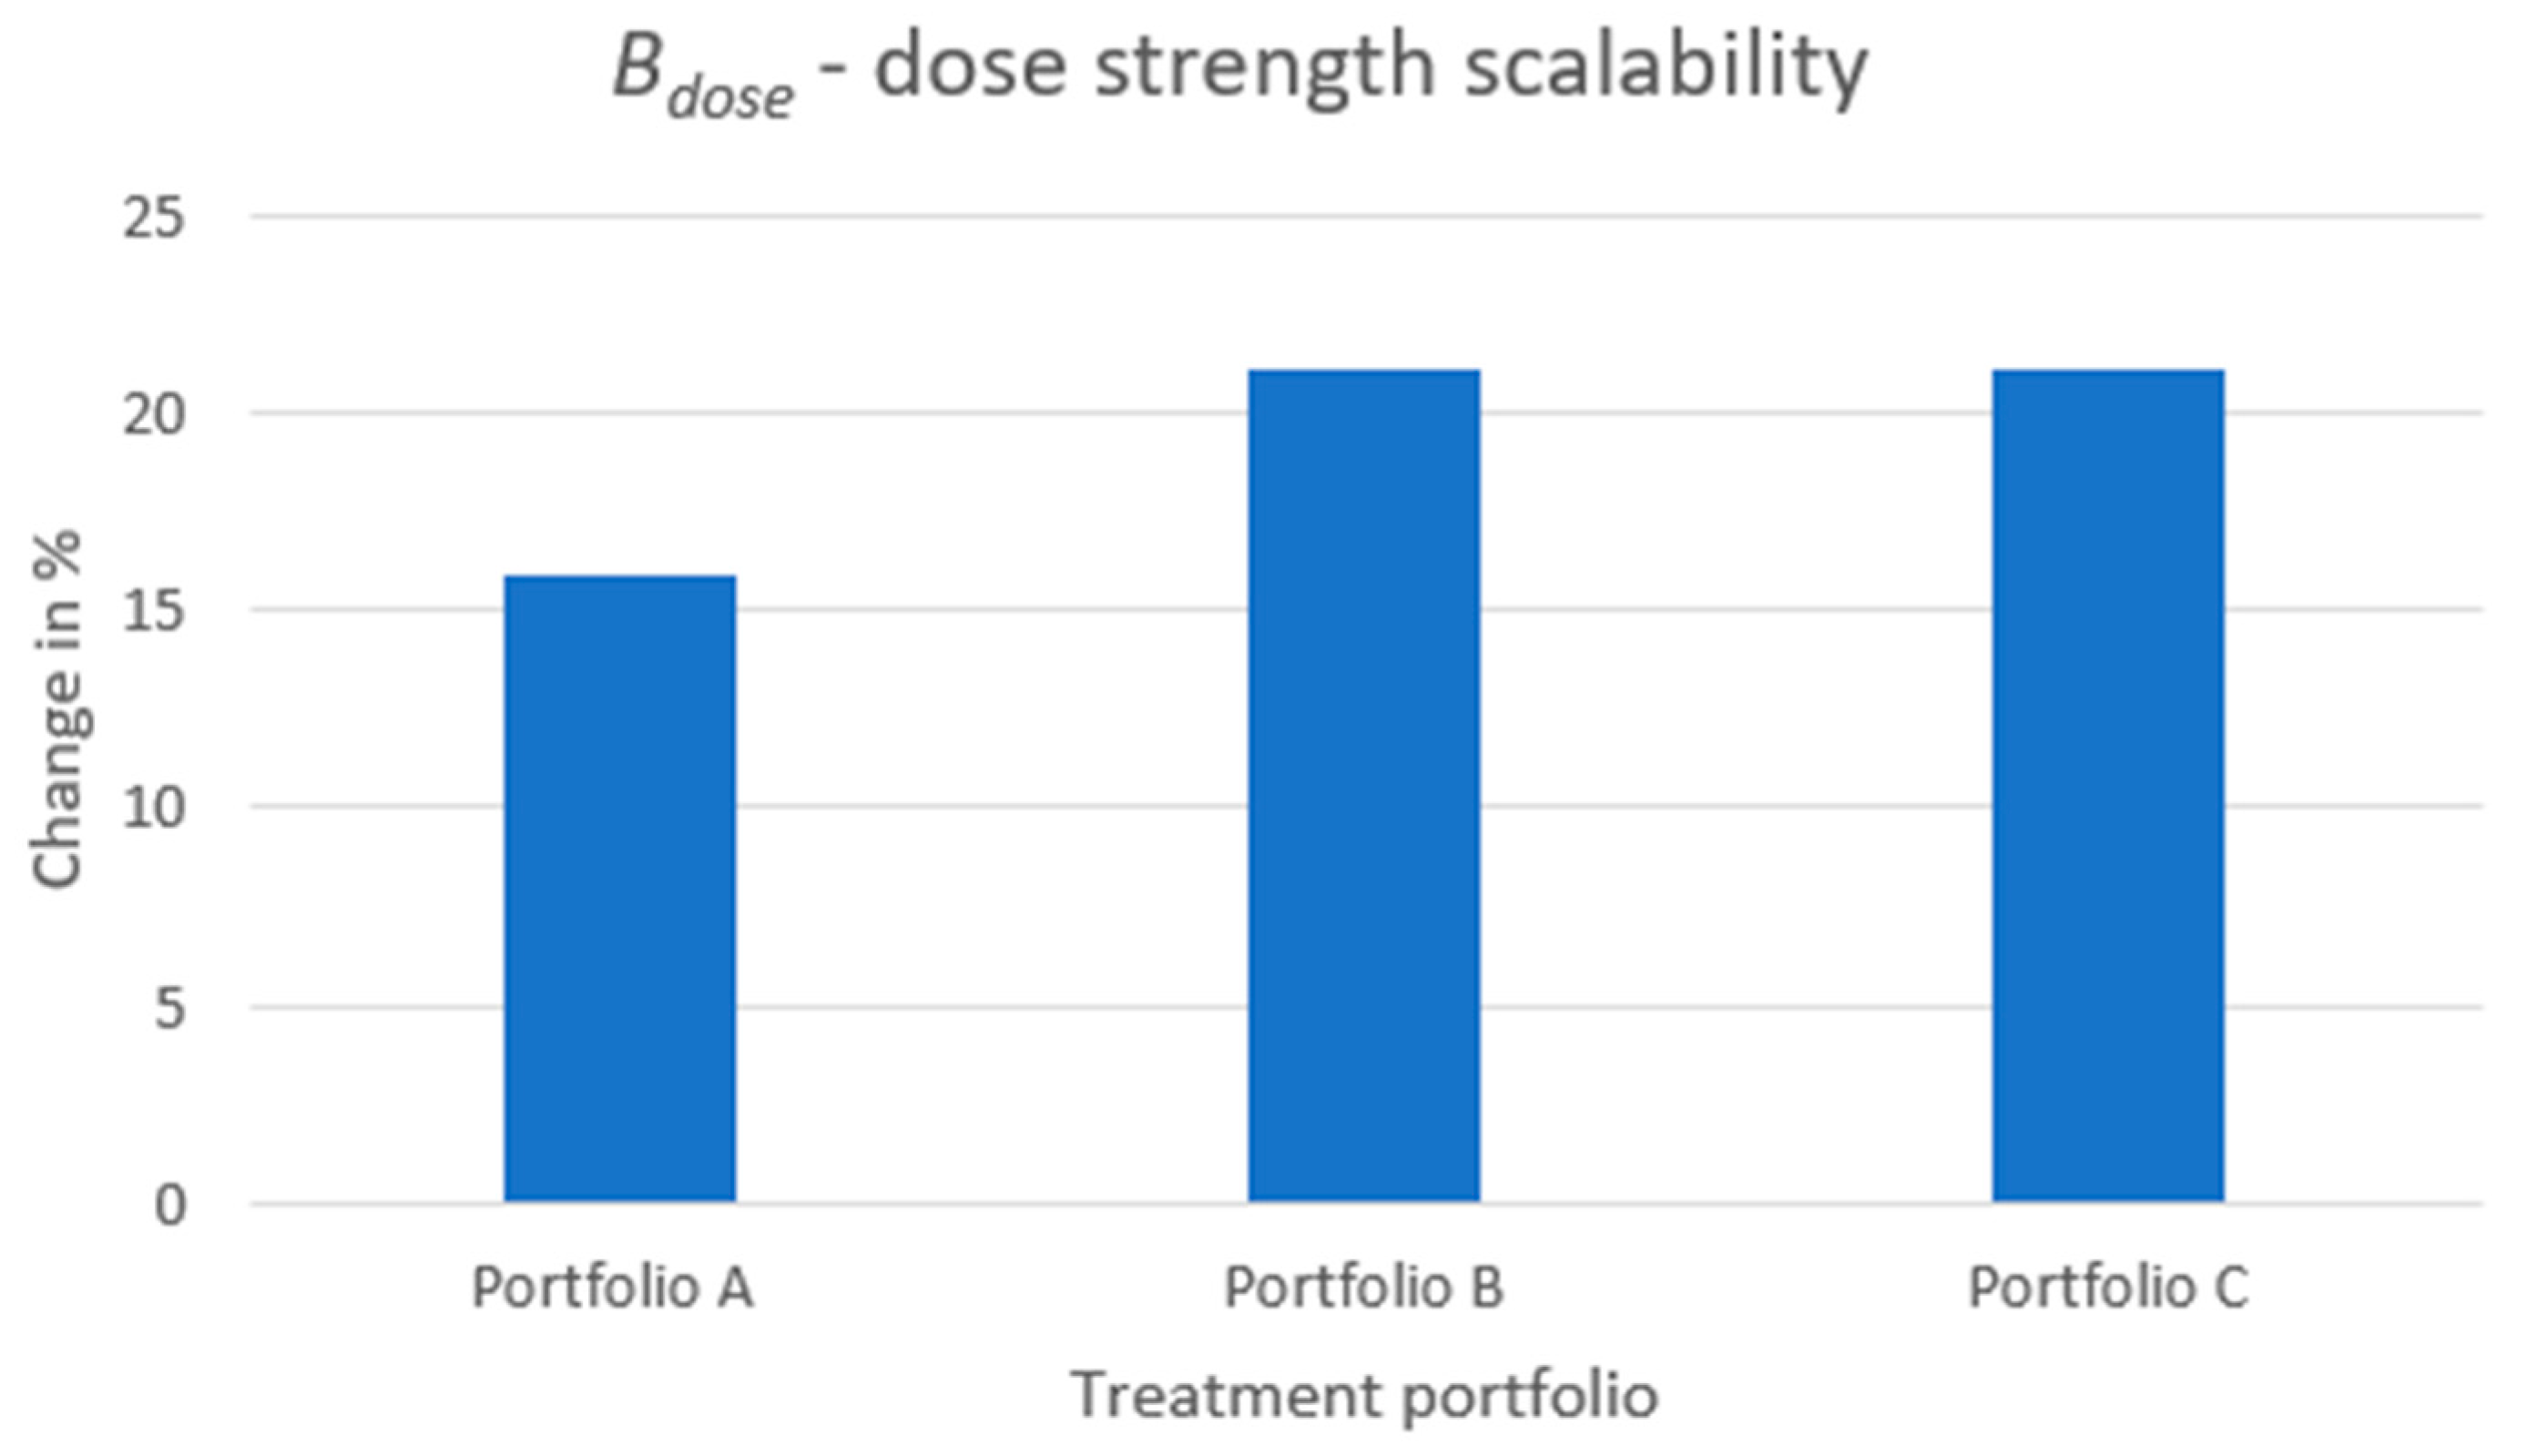
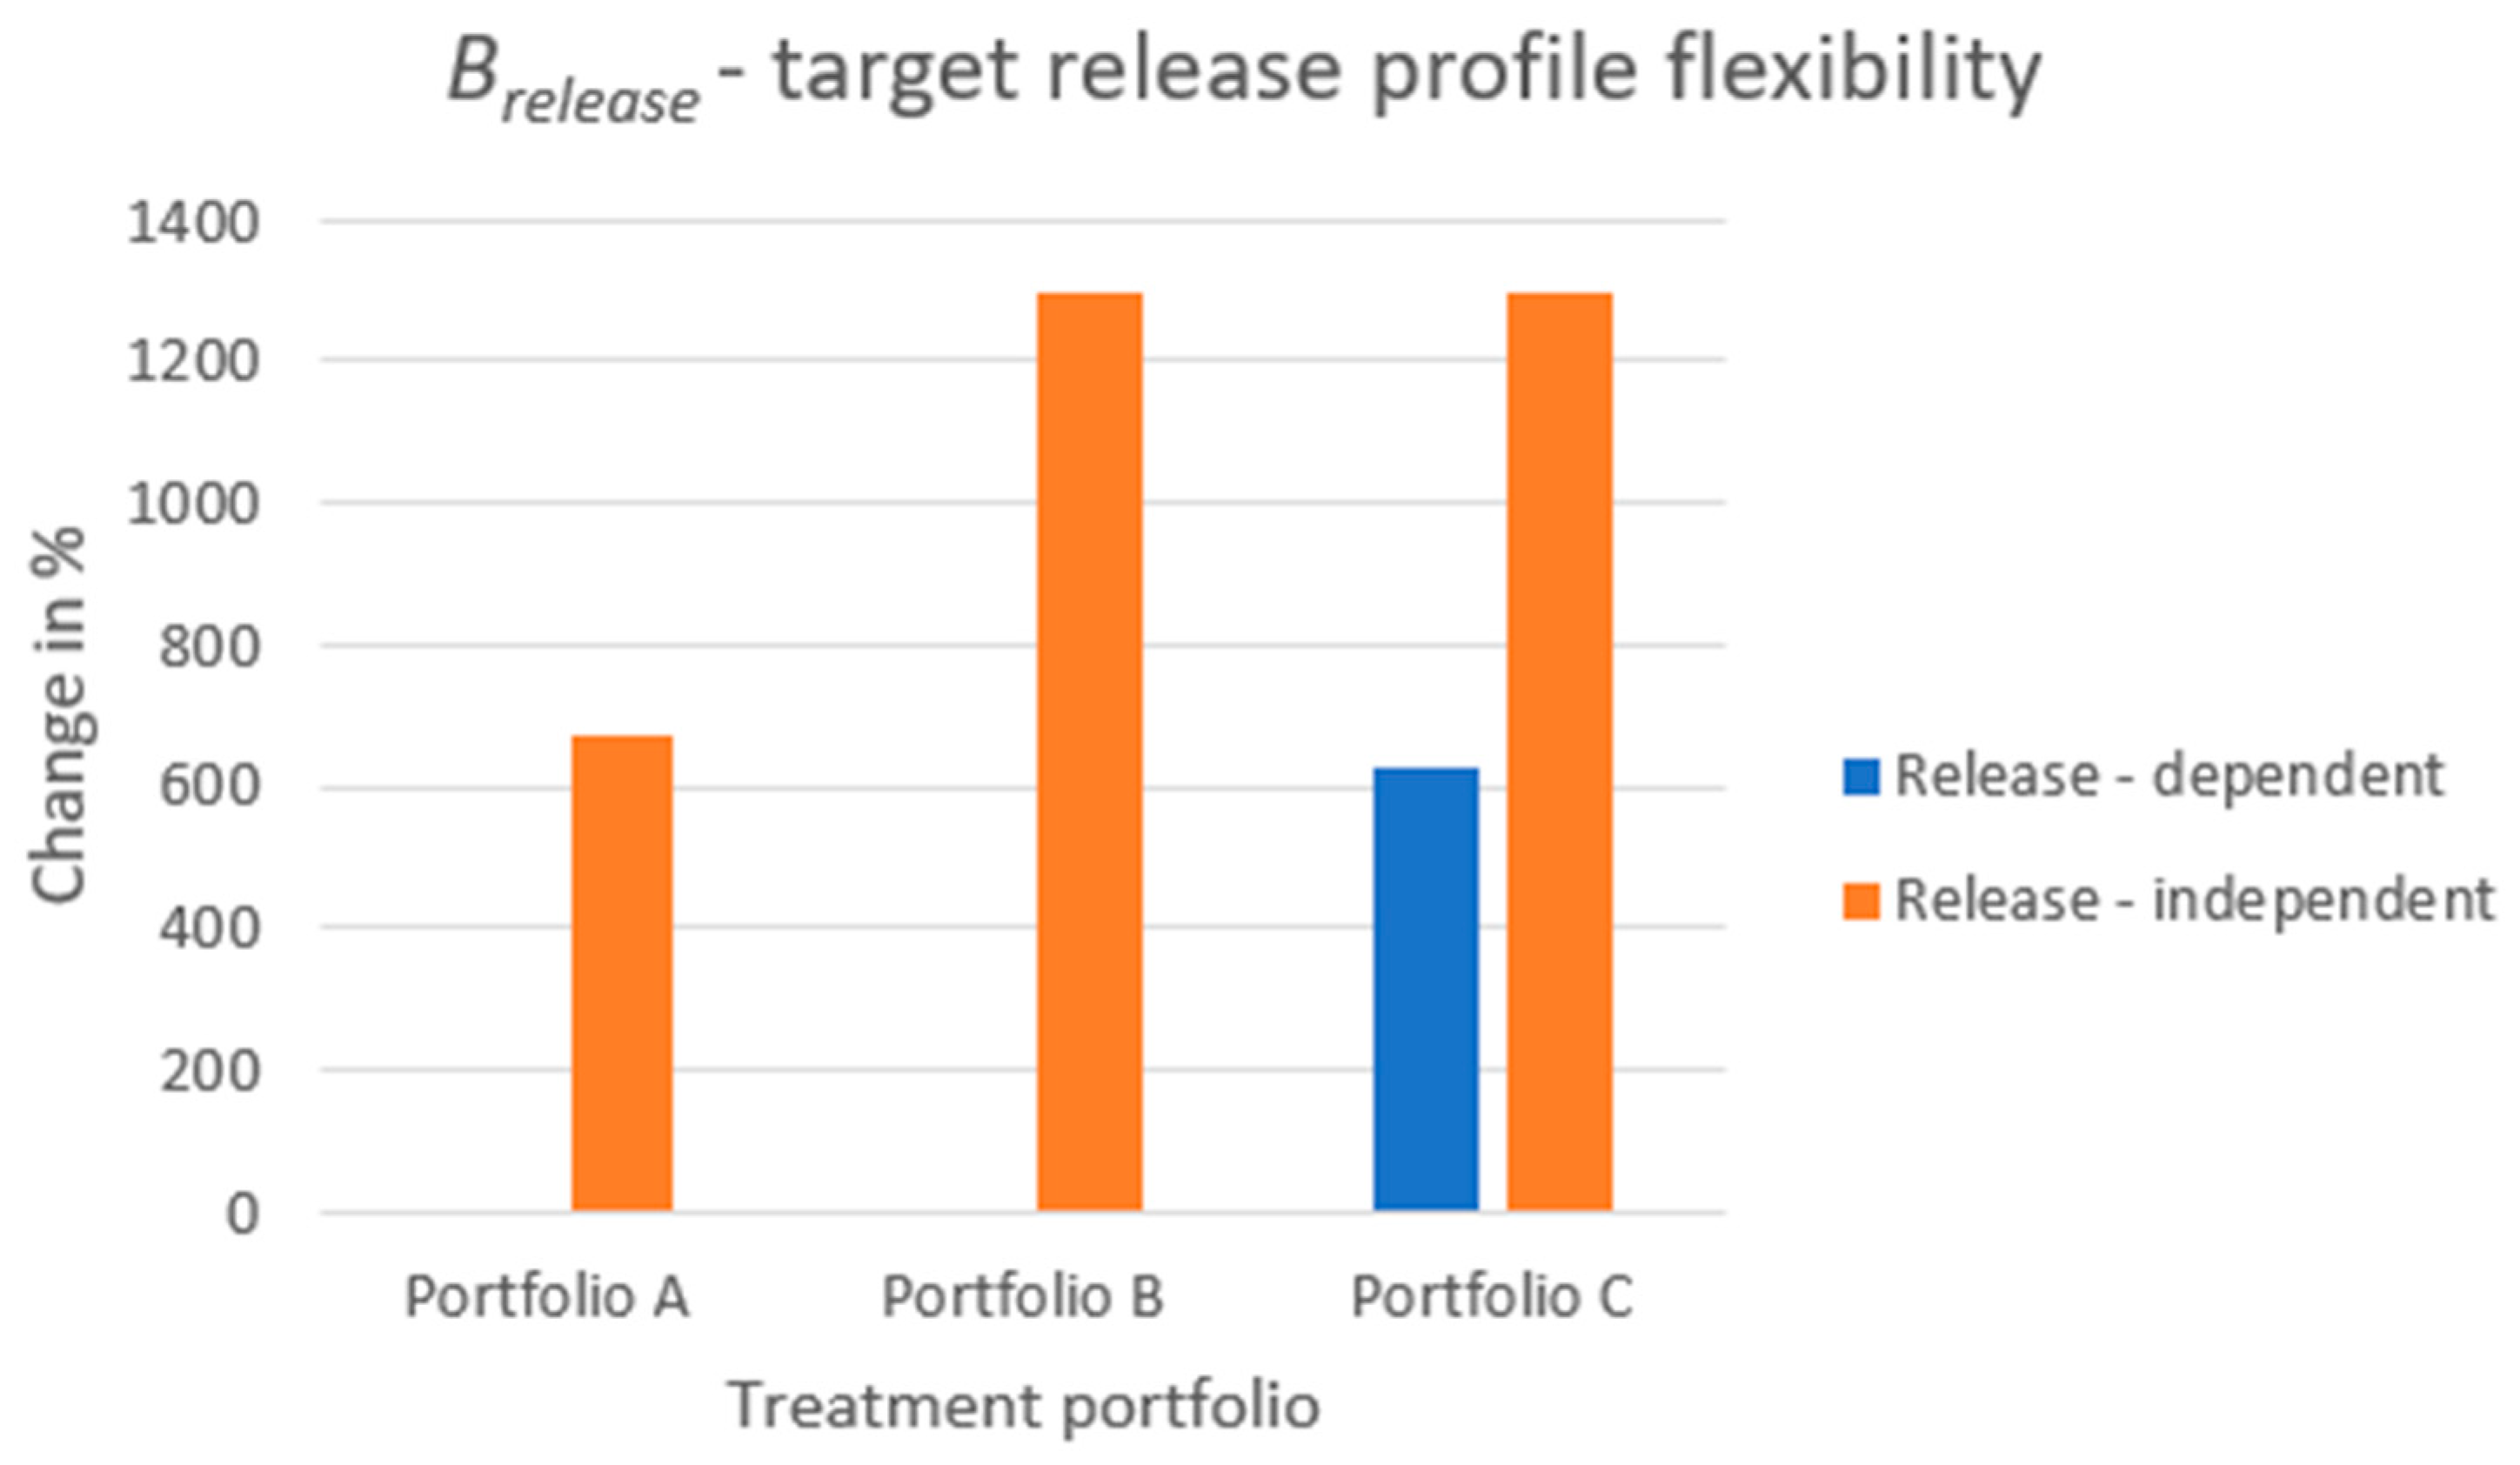
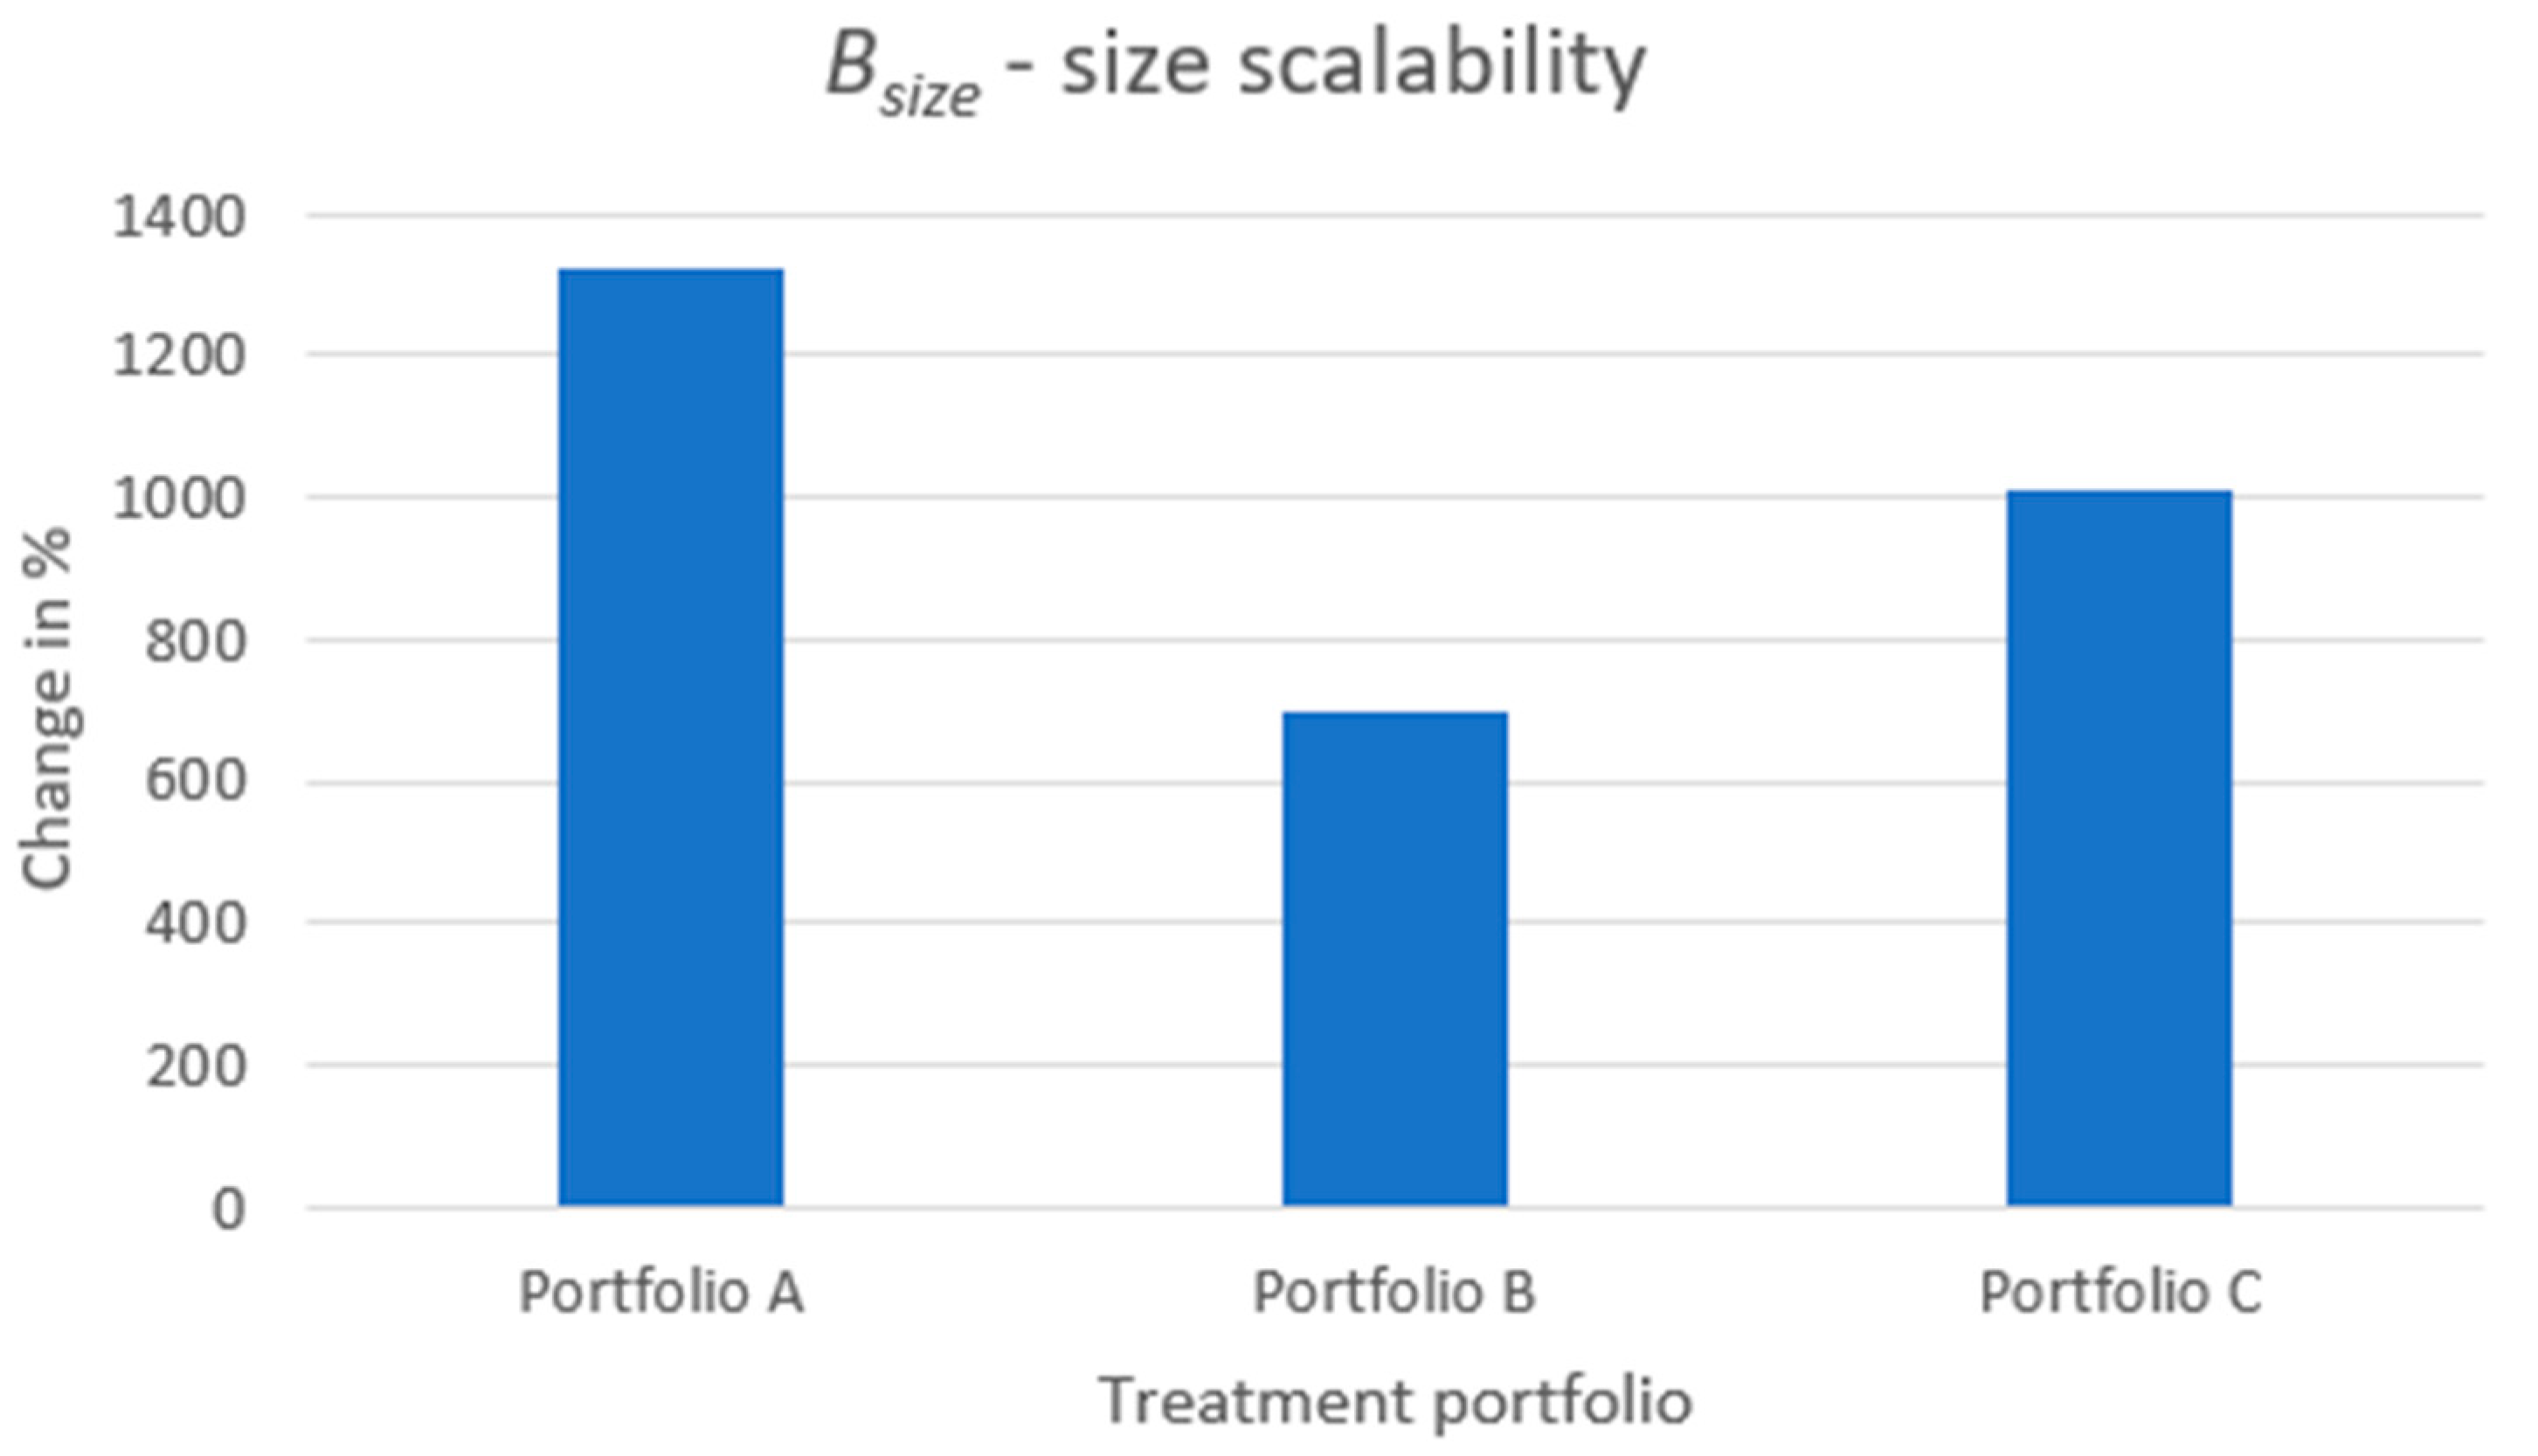
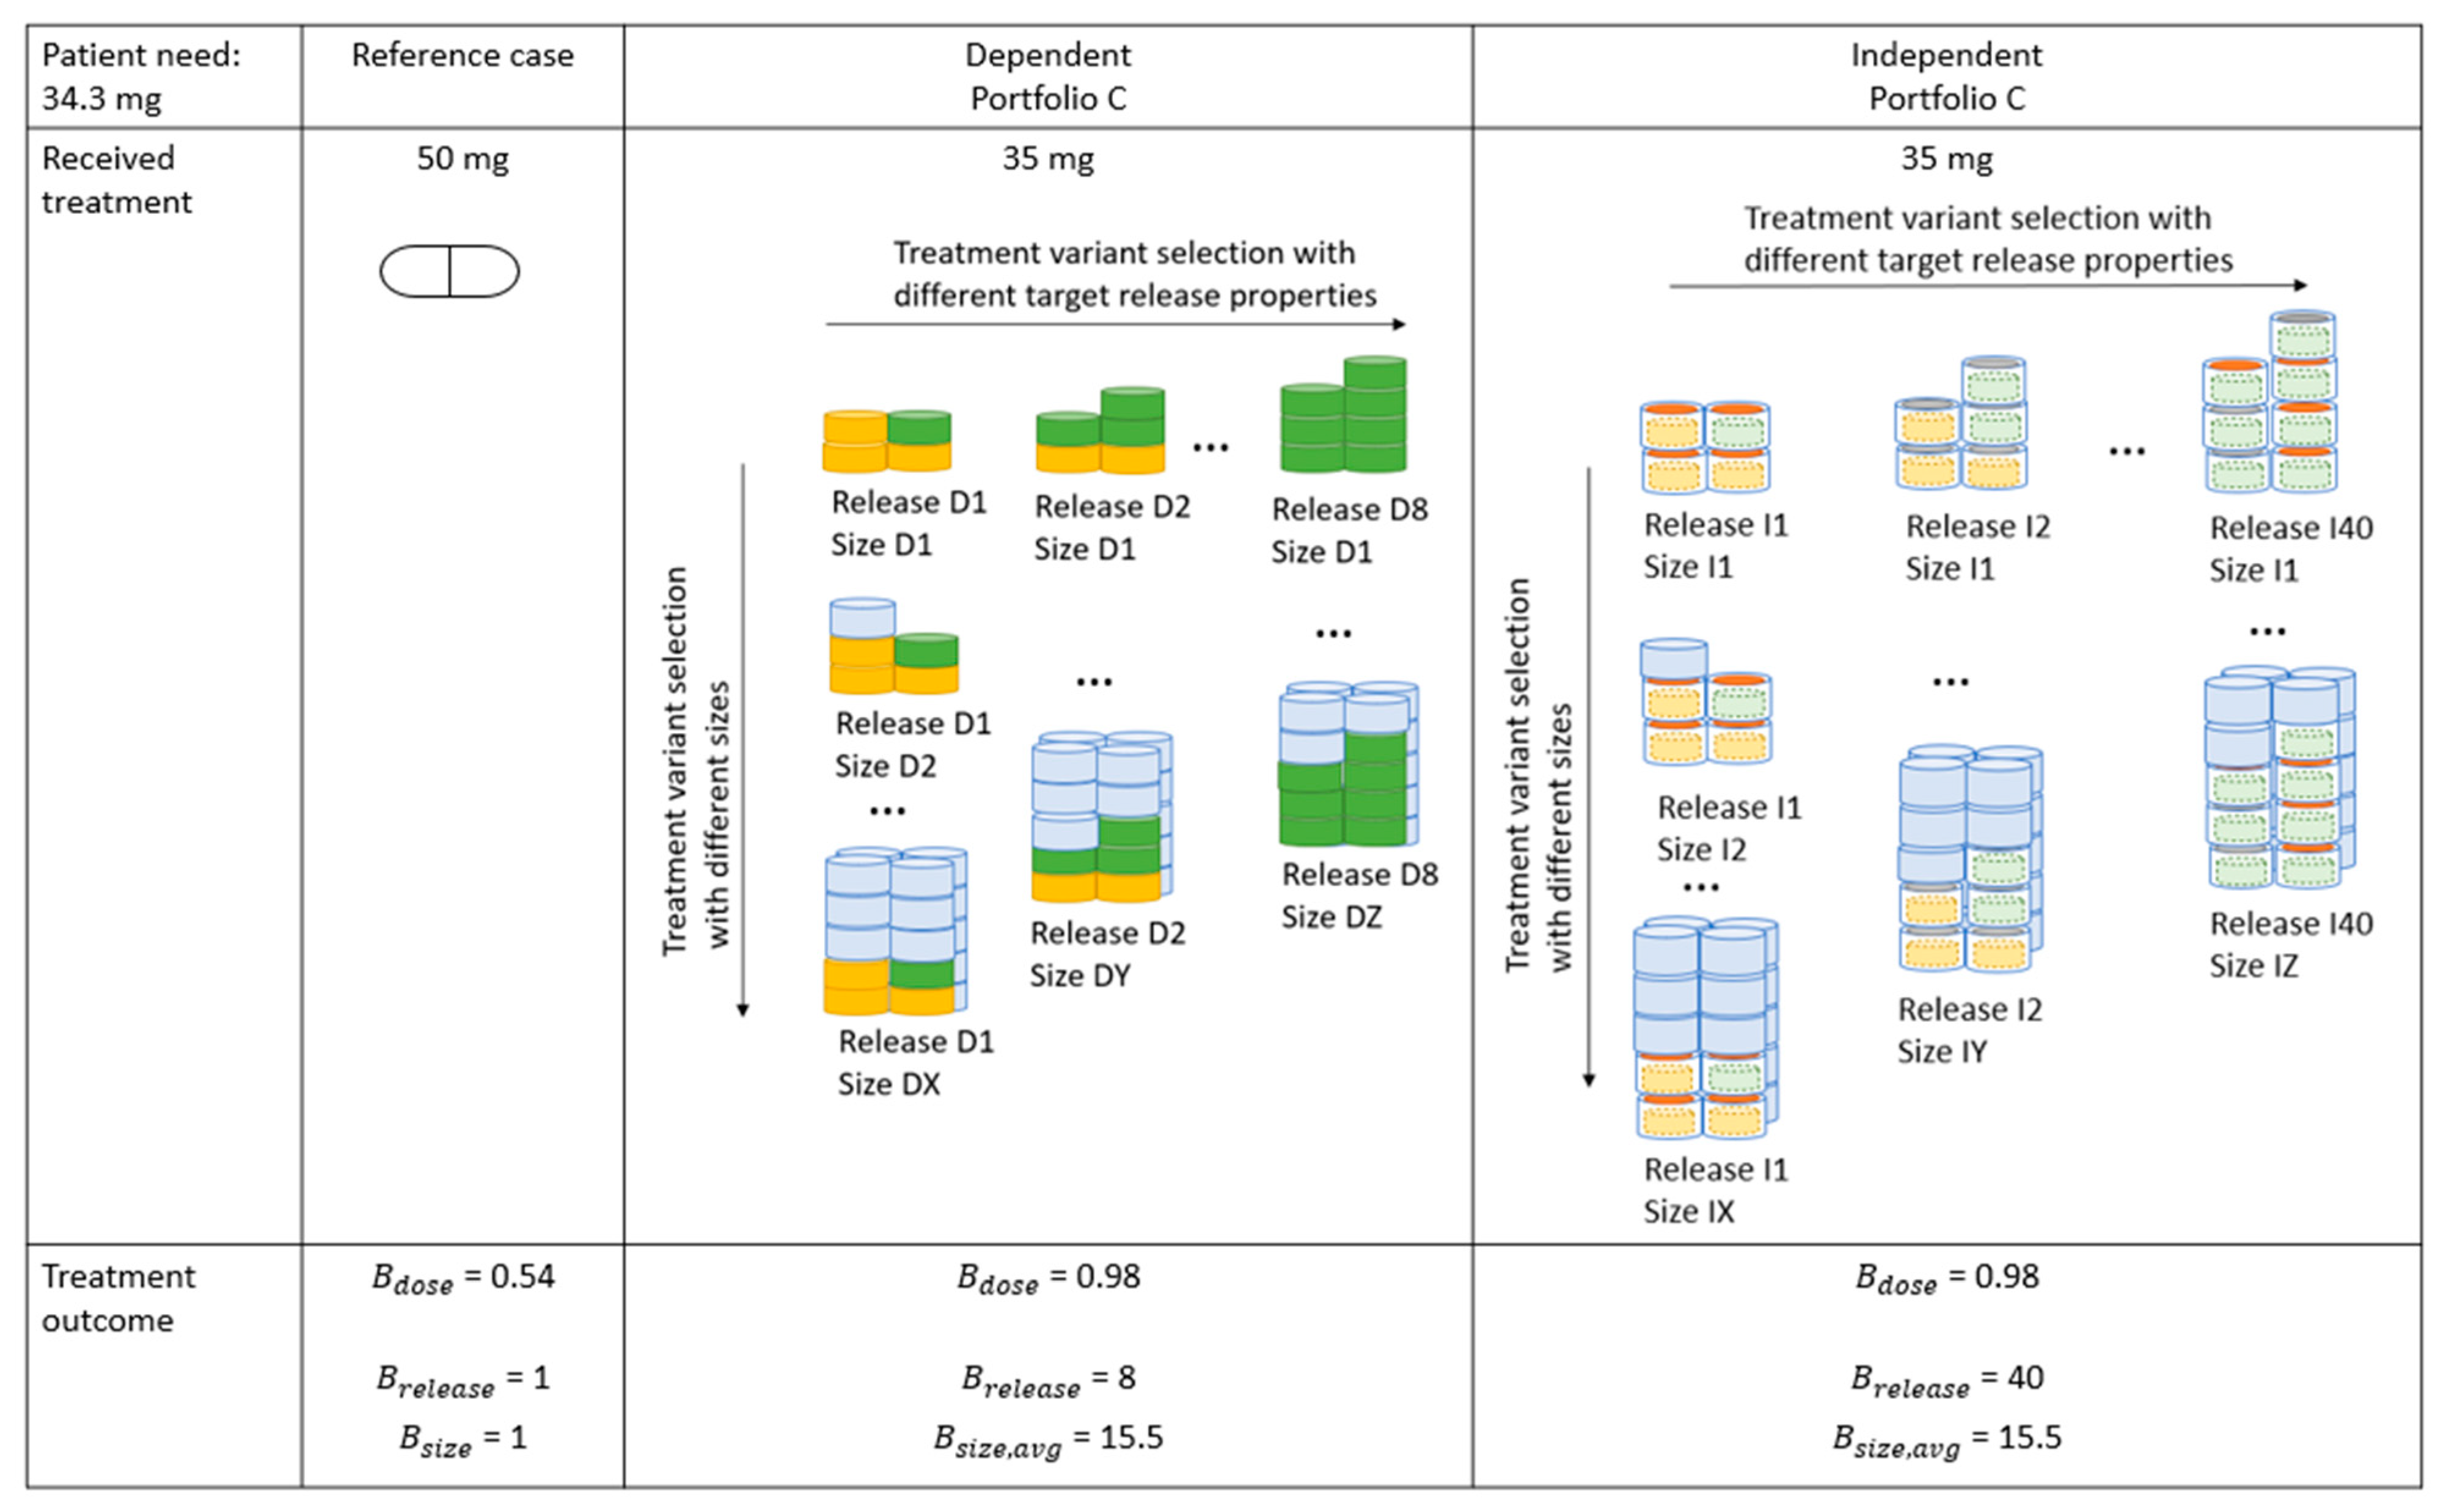
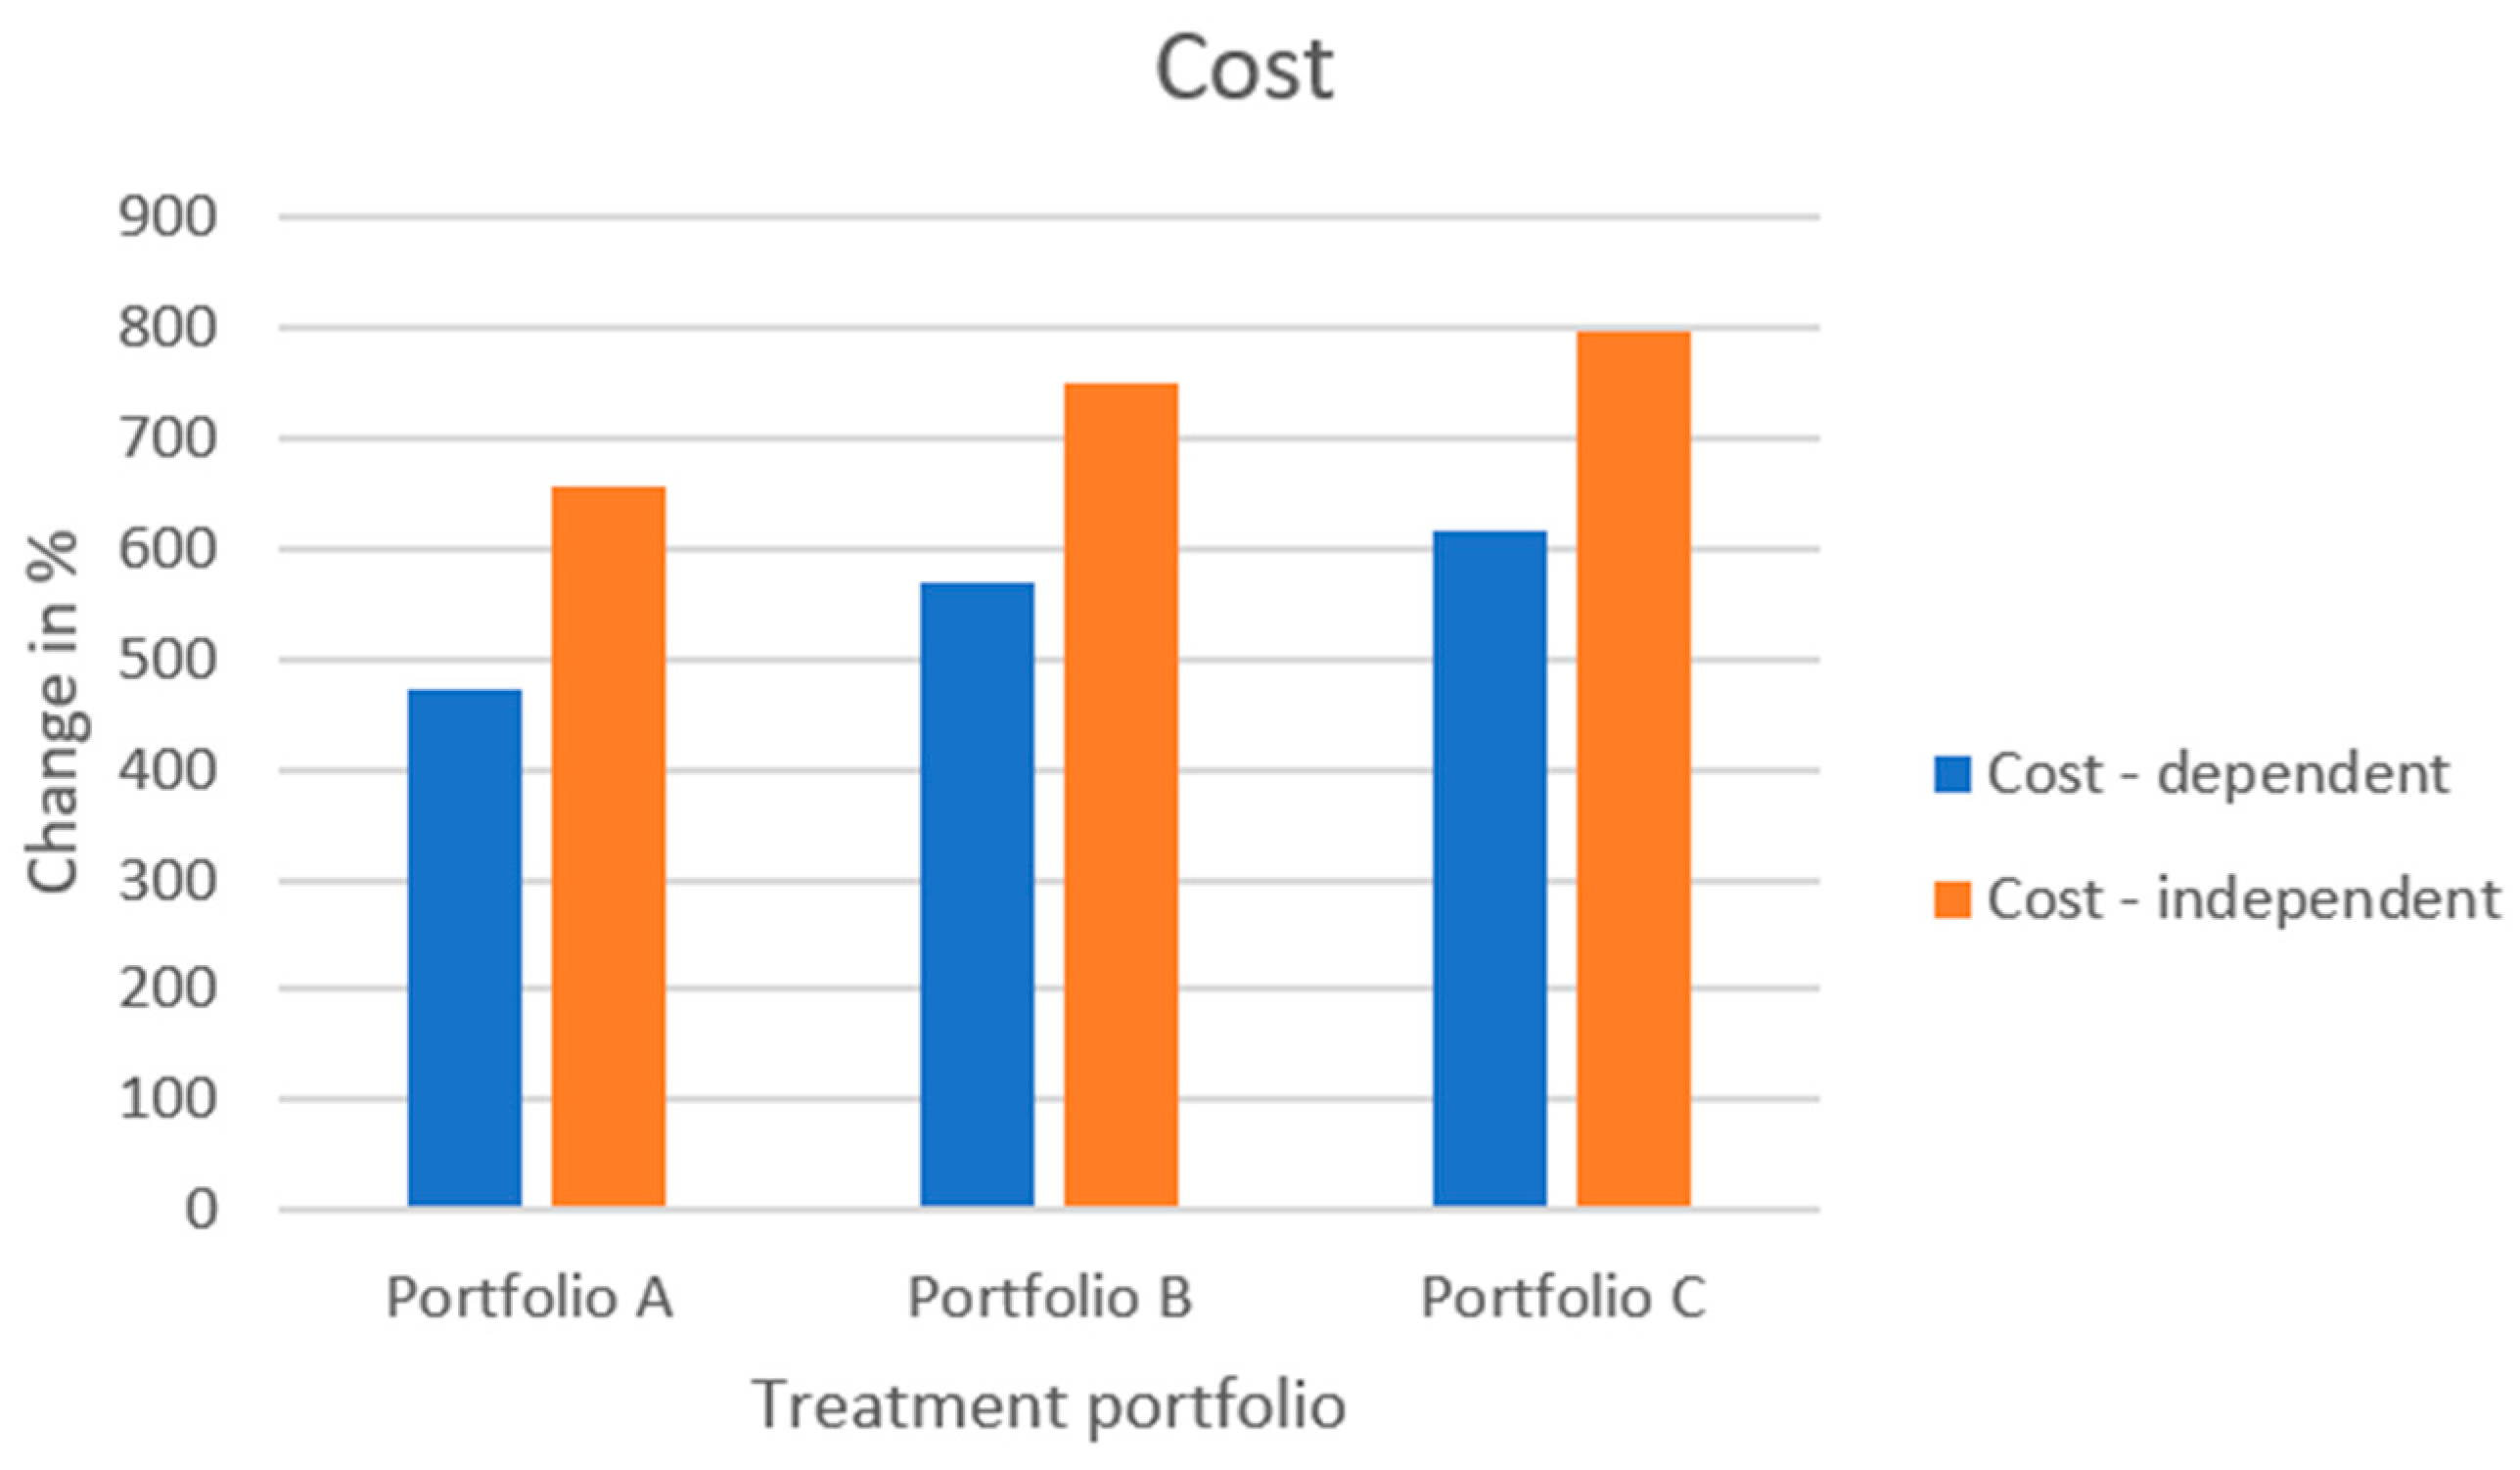
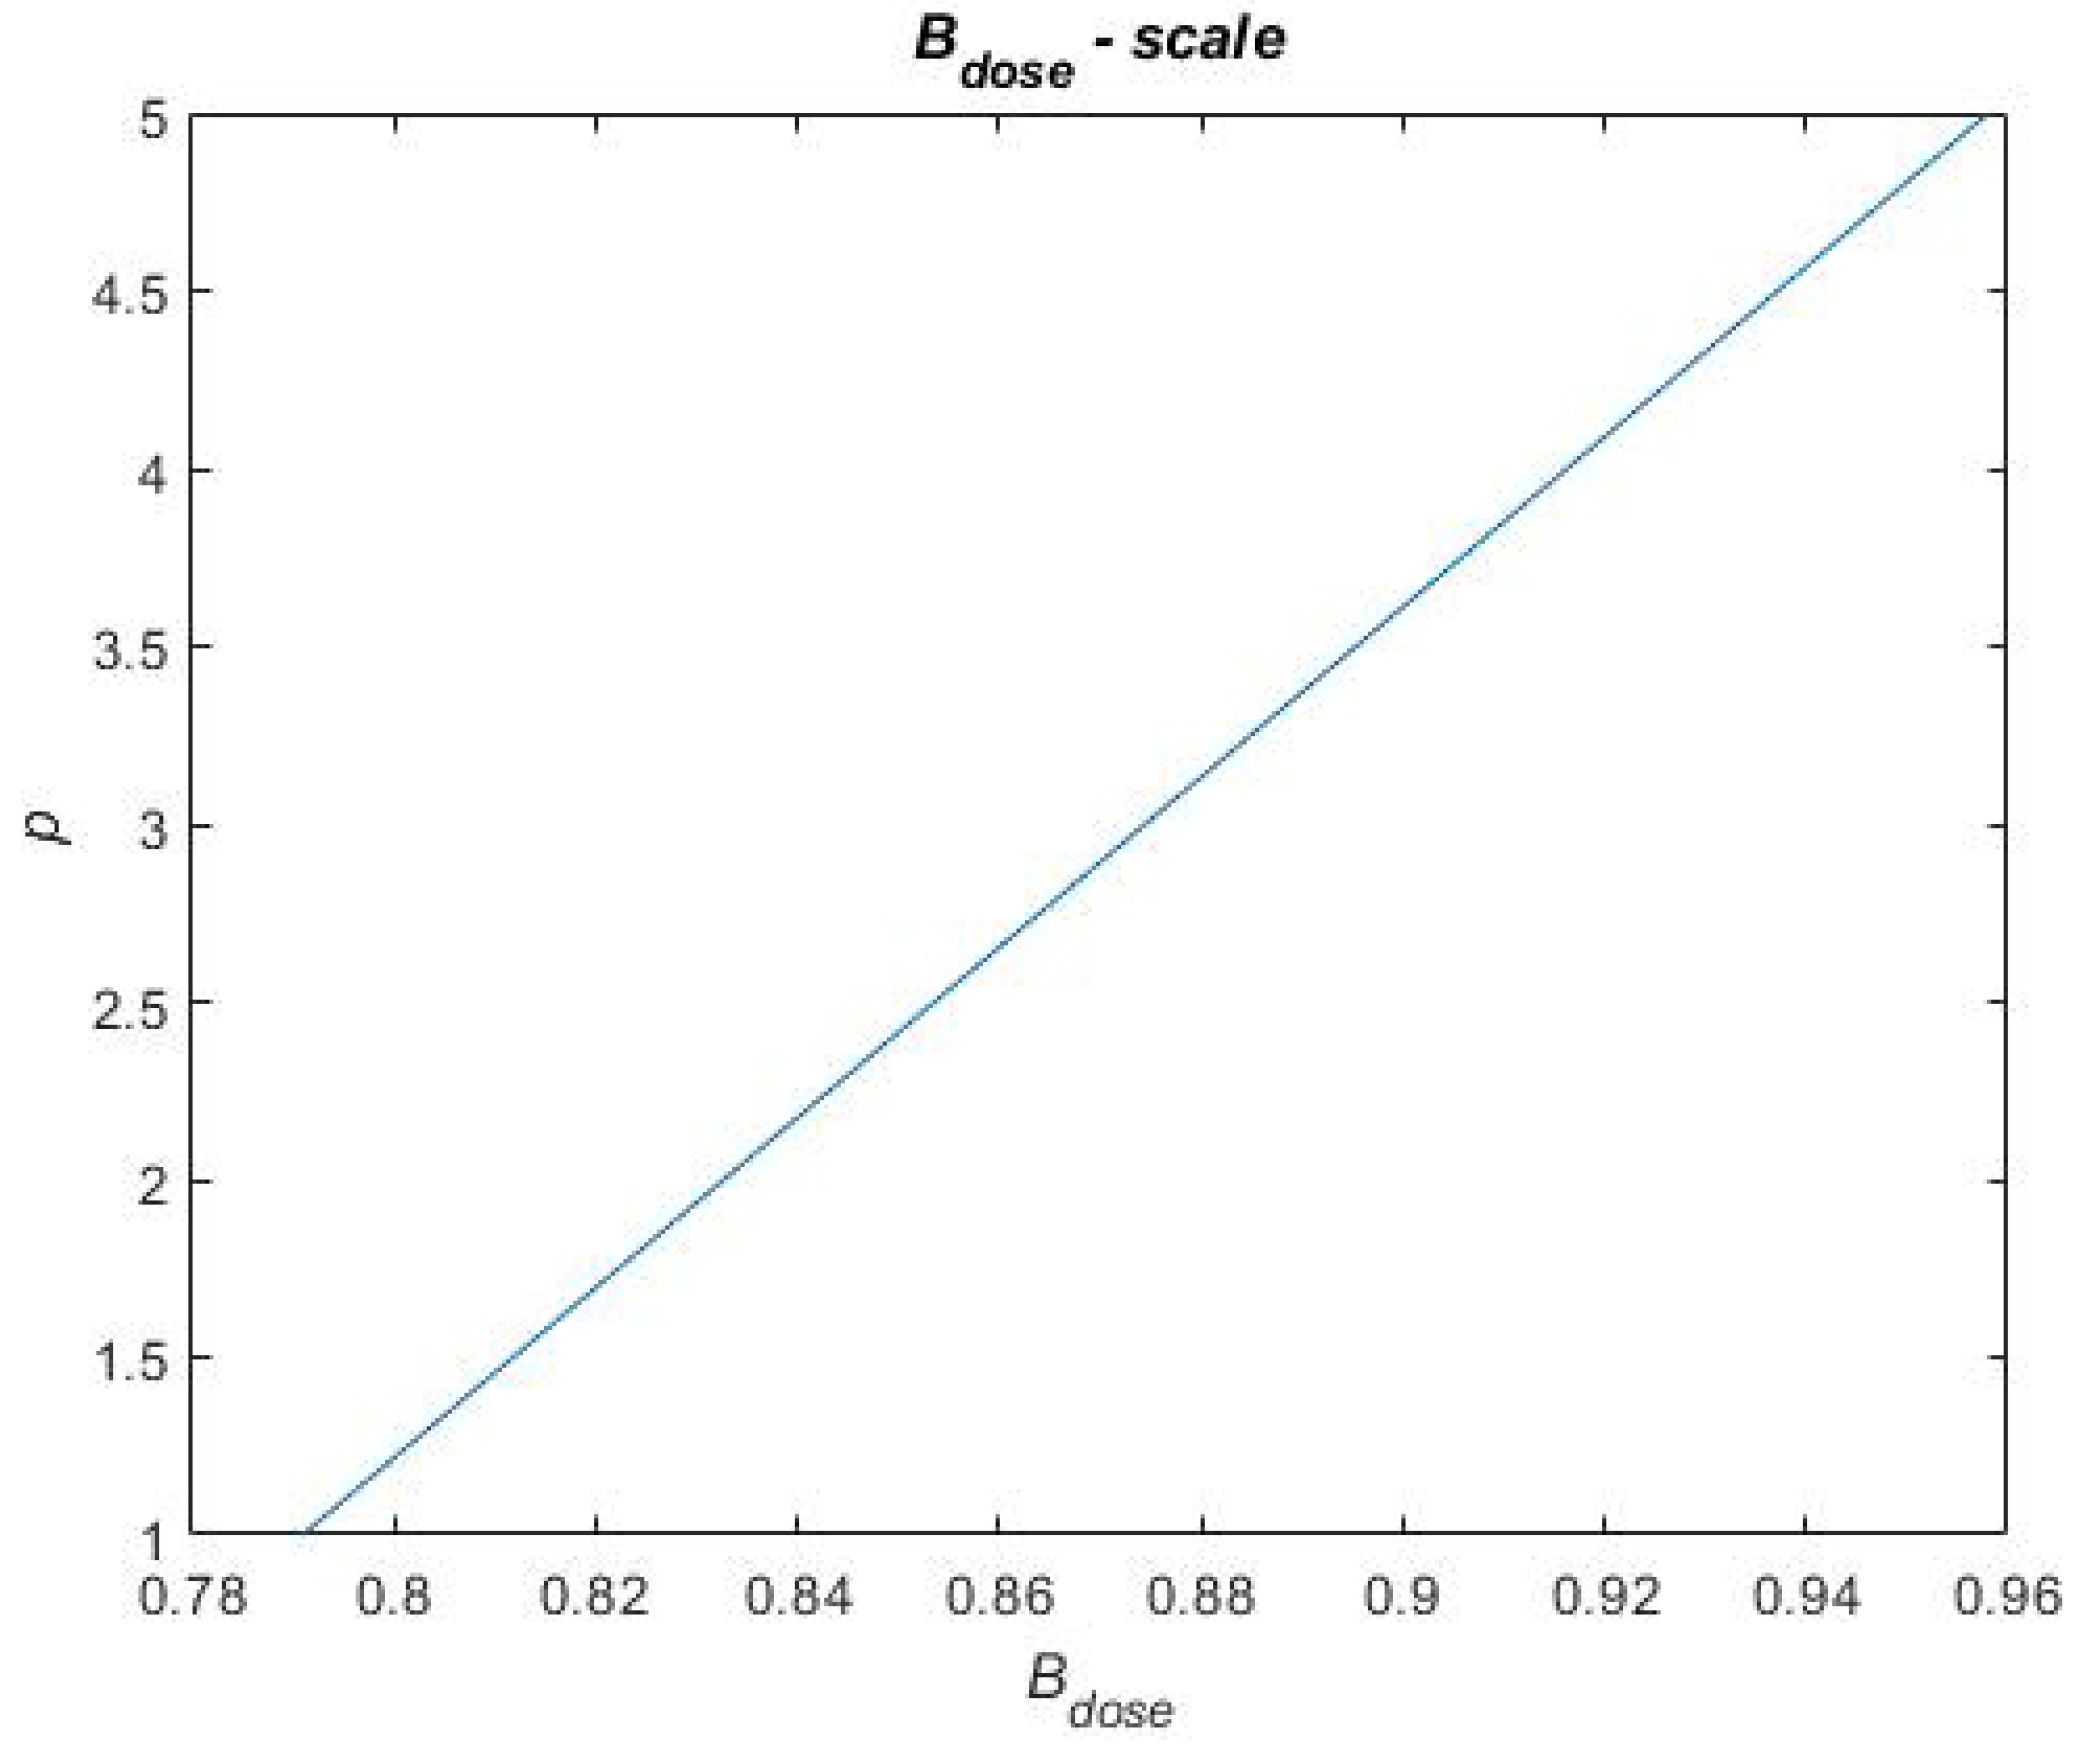
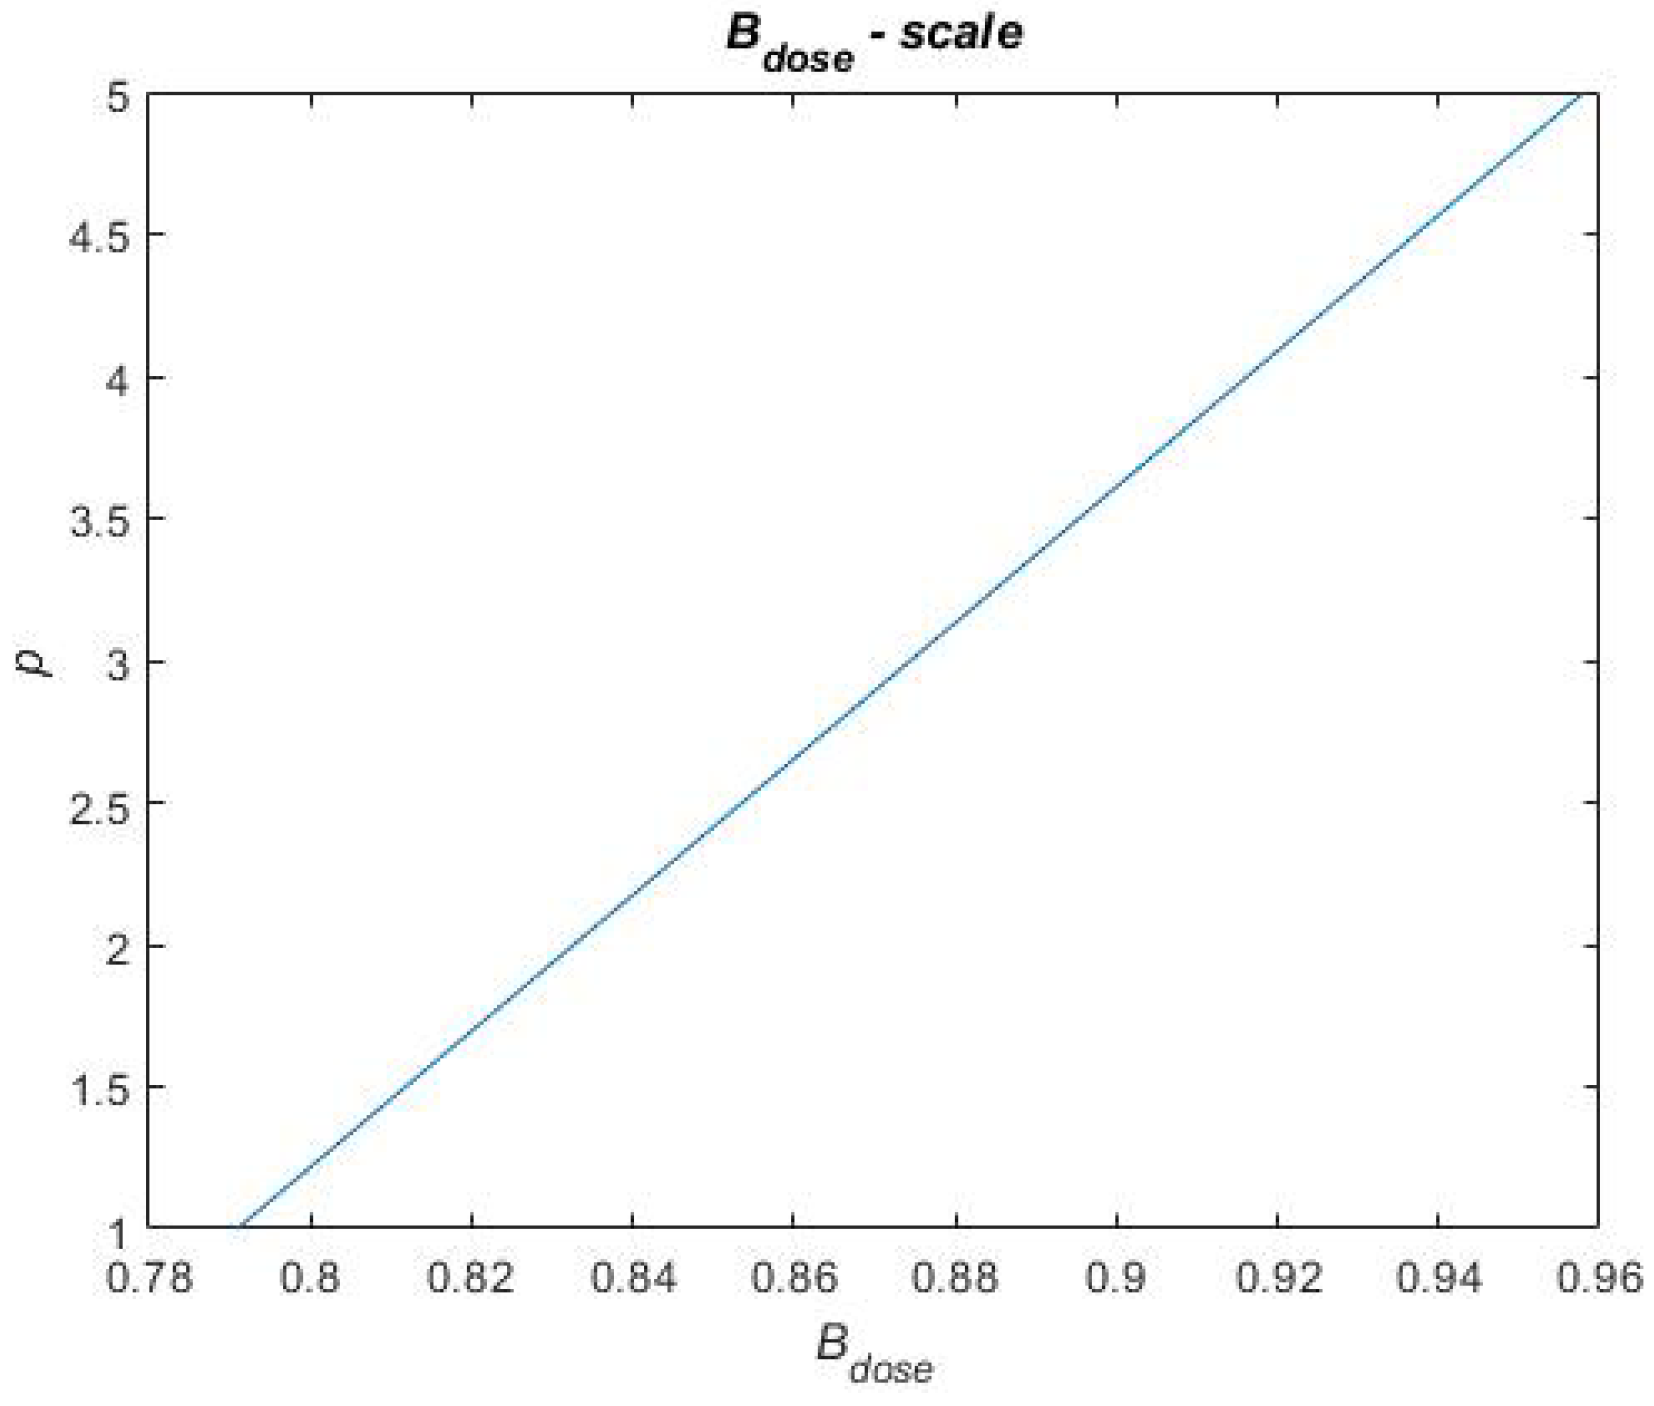
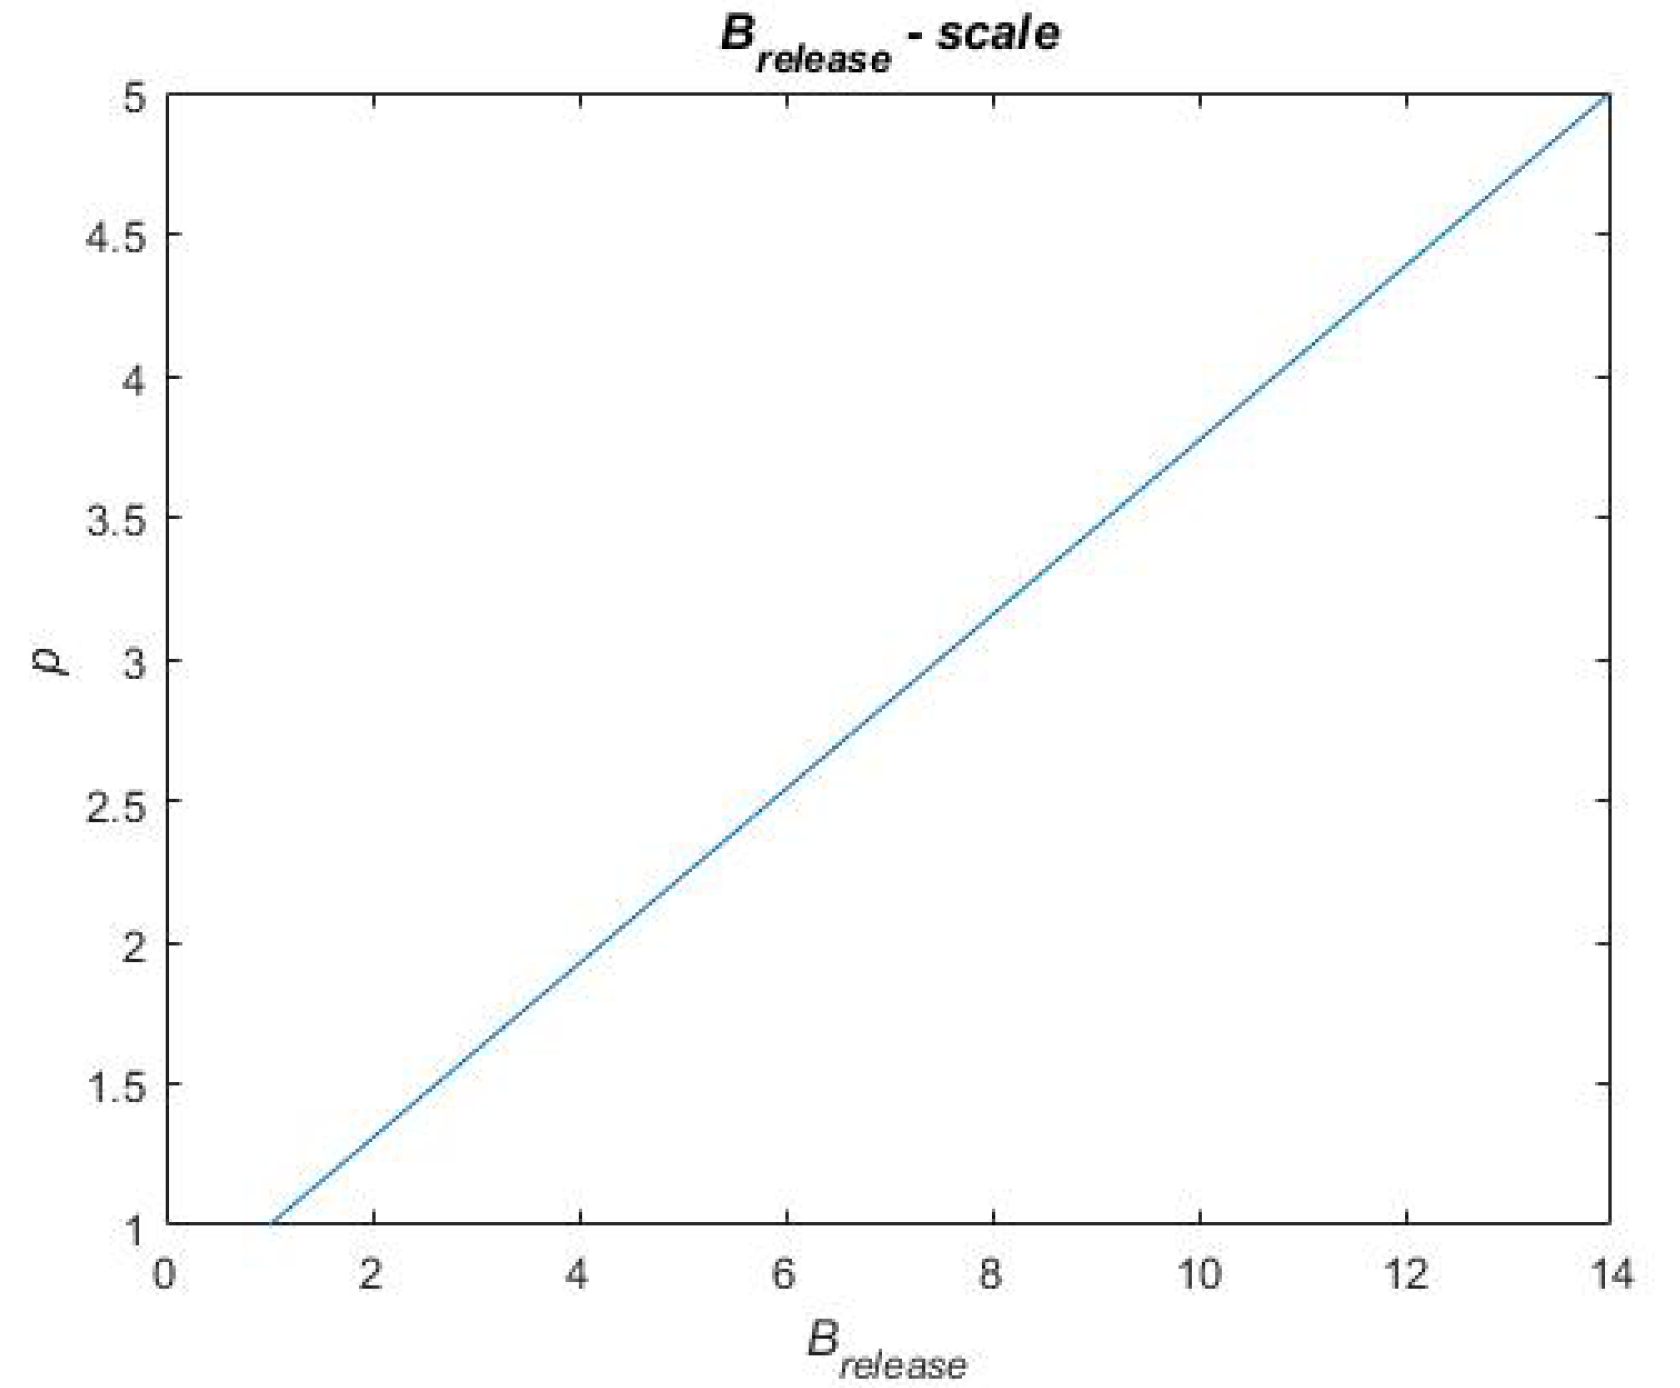
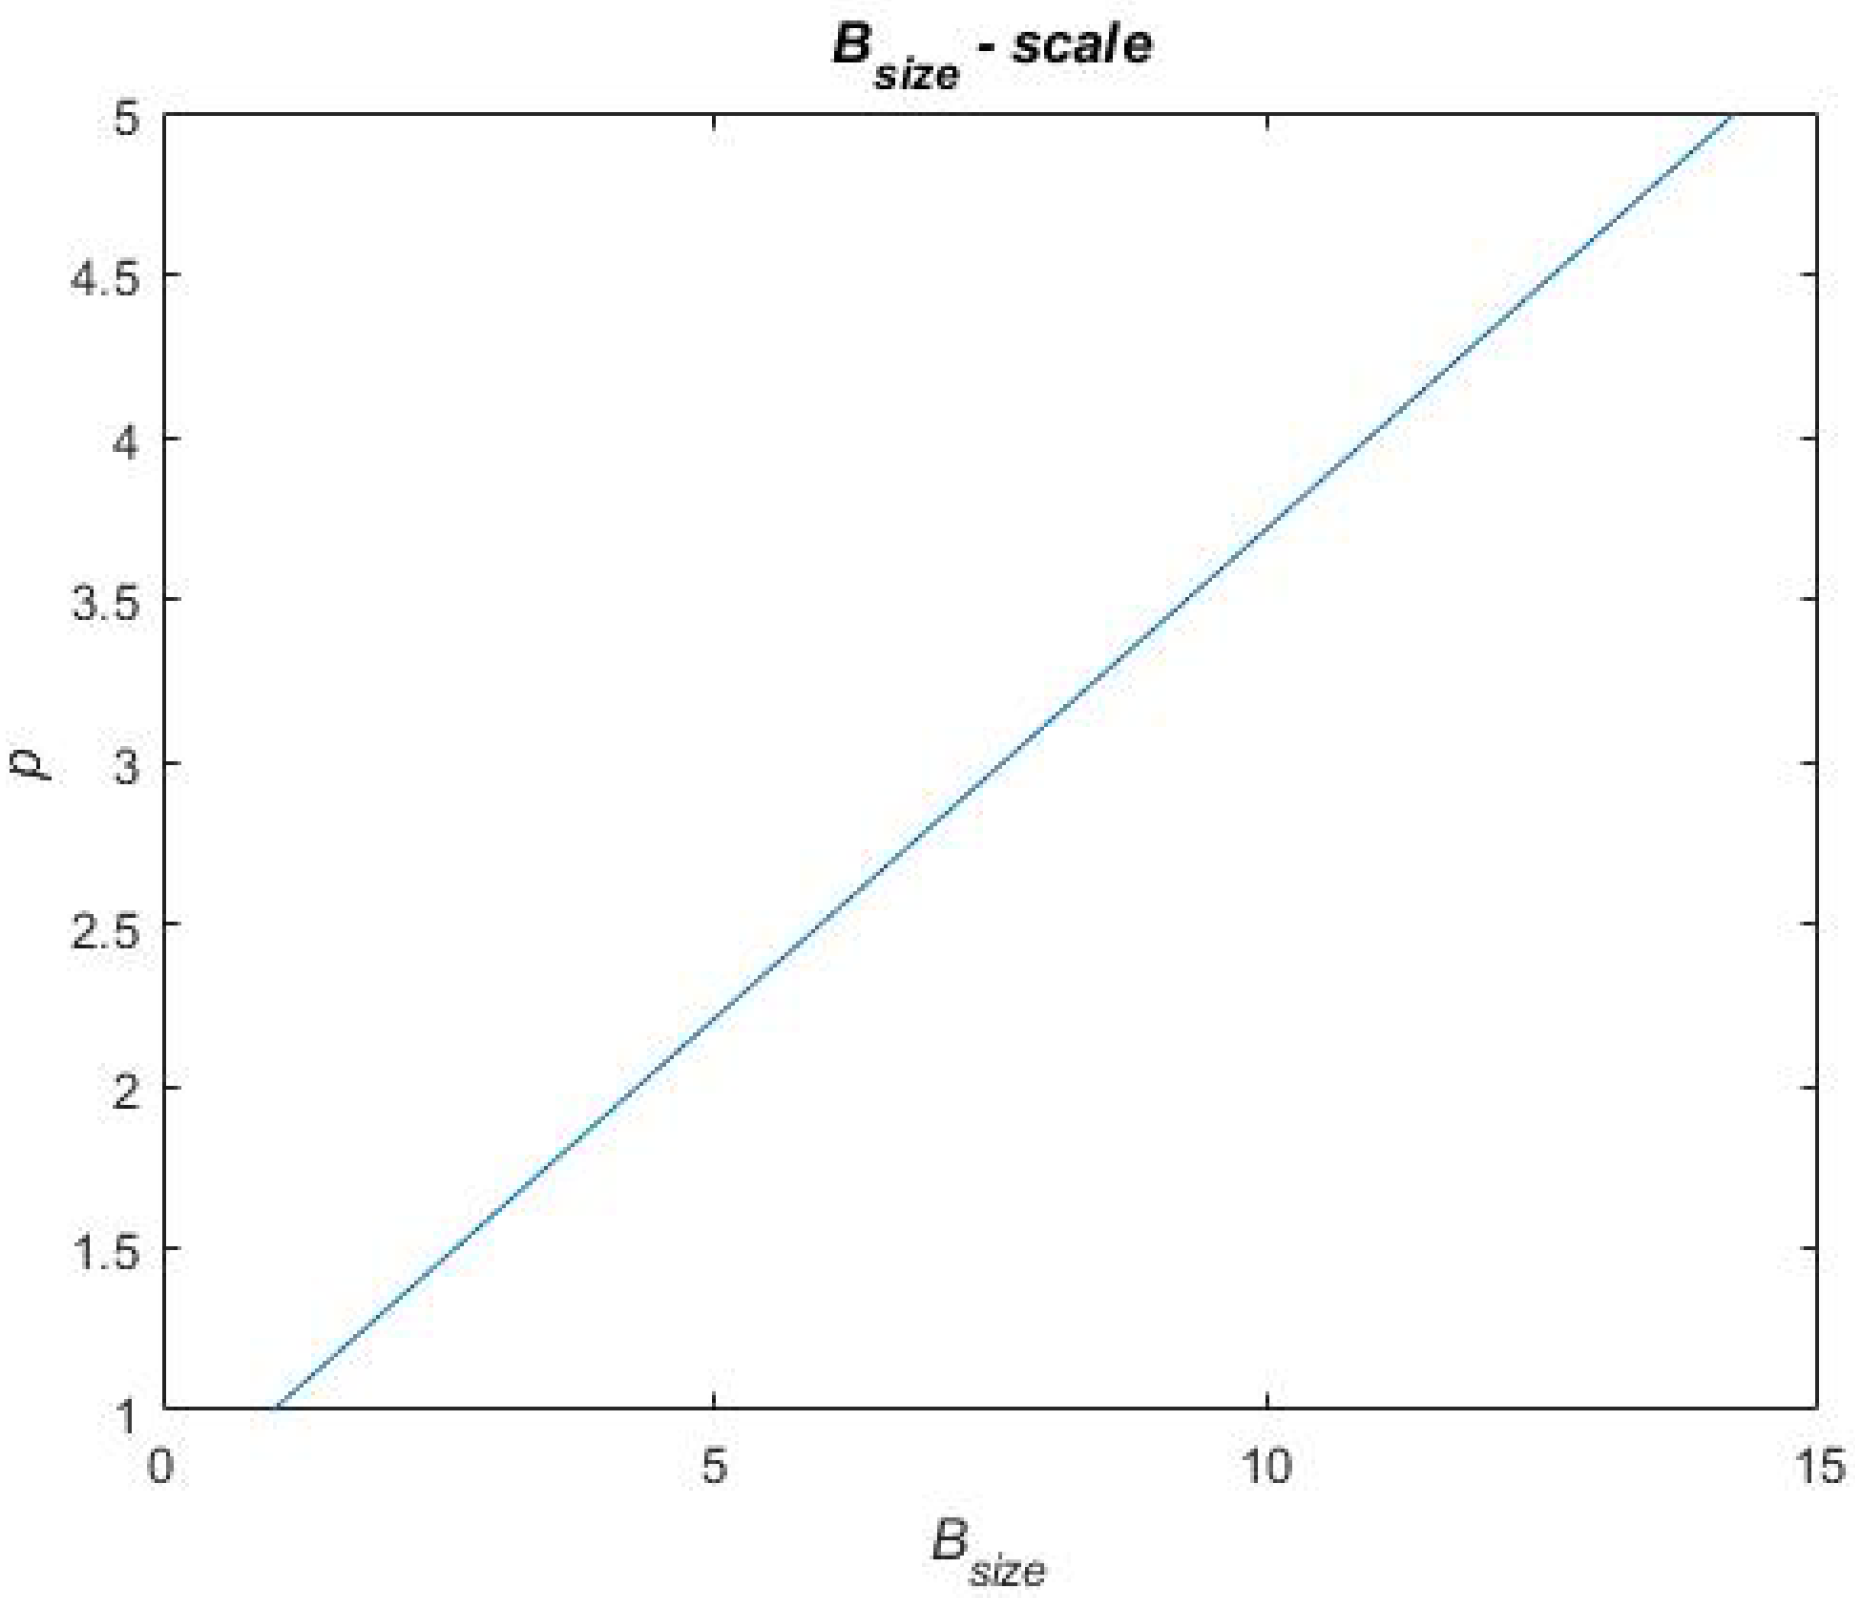
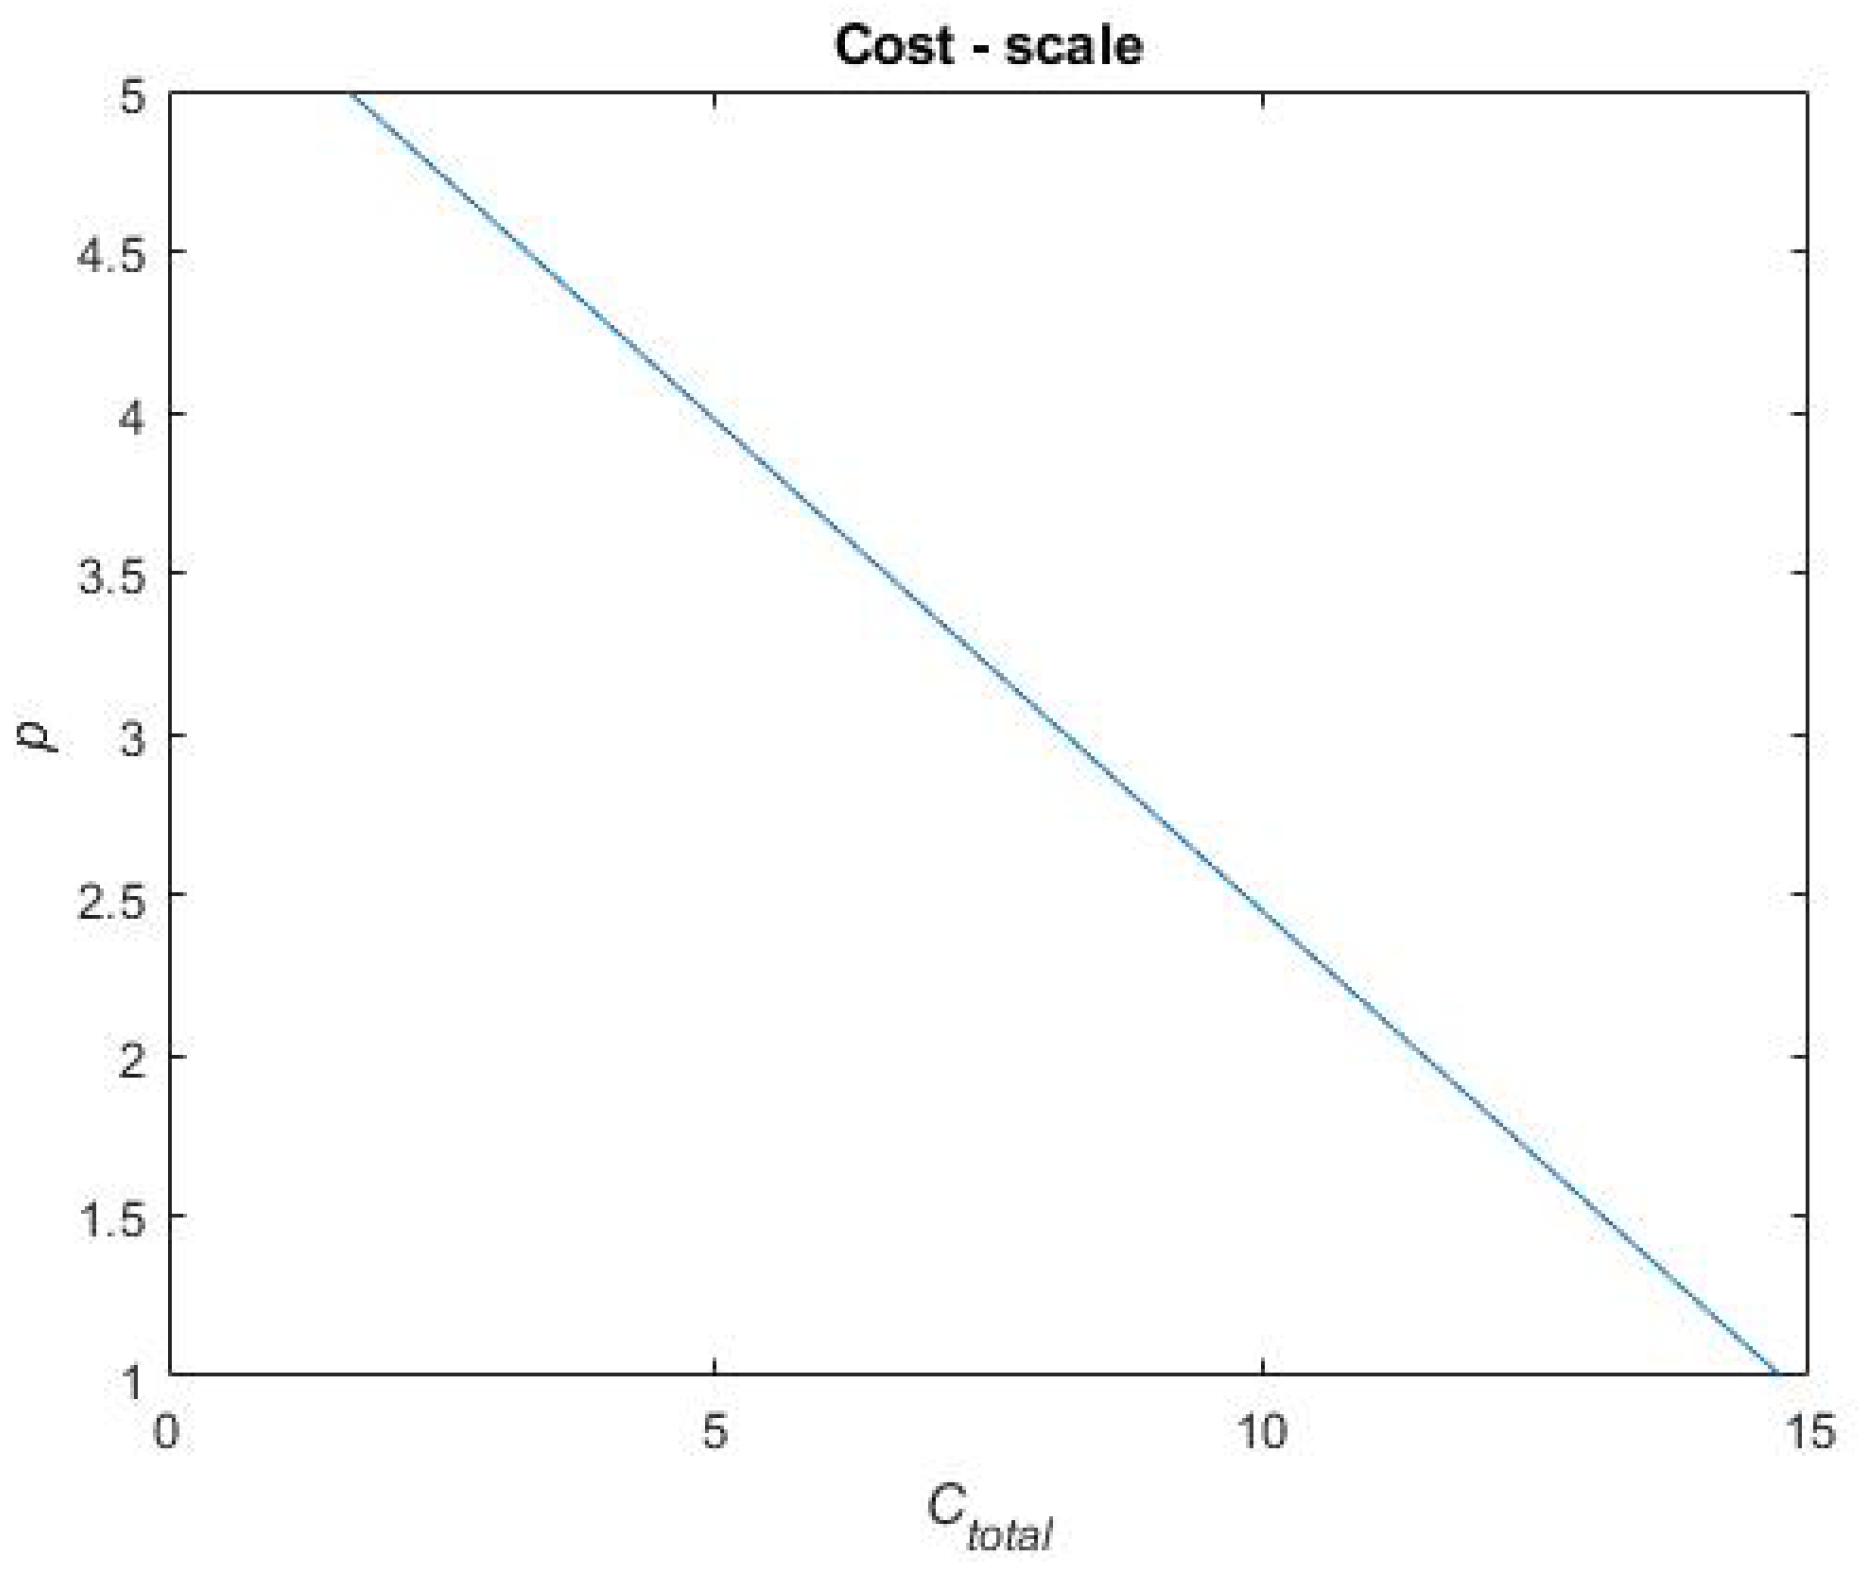
Table A1.
Resulting values of calculating the performance of each treatment portfolio for the respective scenario.
Table A1.
Resulting values of calculating the performance of each treatment portfolio for the respective scenario.
| Performance Metric | Reference | Dependent Release | Independent Release | ||||
|---|---|---|---|---|---|---|---|
| Portfolio A | Portfolio B | Portfolio C | Portfolio A | Portfolio B | Portfolio C | ||
| 0.7909 | 0.9163 | 0.9581 | 0.9581 | 0.9163 | 0.9581 | 0.9581 | |
| 1 | 1 | 1 | 7.2349 | 7.7469 | 13.9962 | 13.9962 | |
| 1 | 14.2531 | 8.0038 | 11.1285 | 14.2531 | 8.0038 | 11.1285 | |
| 1.6409 | 9.4 | 10.963 | 11.74 | 12.4 | 13.9634 | 14.74 | |
Appendix B. Scales
The scales for the scoring system are displayed in Figure A1, Figure A2, Figure A3 and Figure A4. The scales are created for each performance metric, , and and , respectively. These scales bases on the worst- and best-performing portfolio for each performance metric, where the worst performance is assigned the score one and the best performance is assigned the score five. In between these scores, a linear scale has been created and the remaining portfolios are assigned scores depending on where on the linear scale their performance result.
Figure A1.
Scale for the performance metric.

Figure A2.
Scale for the performance metric.

Figure A3.
Scale for the performance metric.

Figure A4.
Scale for the performance metric.

Appendix C. Concept Scoring
Table A2 displays the resulting scores assigned to each treatment portfolio on each performance metric.
Table A2.
The resulting scores of each treatment portfolio on the respective performance metric.
| Reference | Dependent Release | Independent Release | |||||
|---|---|---|---|---|---|---|---|
| Portfolio A | Portfolio B | Portfolio C | Portfolio A | Portfolio B | Portfolio C | ||
| 1.0000 | 4.0000 | 5.0000 | 5.0000 | 4.0000 | 5.0000 | 5.0000 | |
| 1.0000 | 1.0000 | 1.0000 | 2.9190 | 3.0766 | 5.0000 | 5.0000 | |
| 1.0000 | 5.0000 | 3.1139 | 4.0569 | 5.0000 | 3.1139 | 4.0569 | |
| 5.0000 | 2.6306 | 2.1534 | 1.9161 | 1.7146 | 1.2371 | 1.000 | |
References
- Crommelin, D.J.; Storm, G.; Luijten, P. ‘Personalised medicine’ through ‘personalised medicine’: Time to integrate advanced, non-invasive imaging approaches and smart drug delivery systems. Int. J. Pharm. 2011, 415, 5–8. [Google Scholar] [CrossRef]
- U.S. Food and Drug Administration. Paving the Way for Personalized Medicine. Available online: https://www.fdanews.com/ext/resources/files/10/10-28-13-Personalized-Medicine.pdf (accessed on 4 August 2021).
- Deloitte Center for Health Solutions. The Future Awakens: Life Sciences and Health Care Predictions 2022. Available online: https://www2.deloitte.com/content/dam/Deloitte/be/Documents/deloitte-uk-life-sciences-health-care-predictions-2022.pdf (accessed on 7 June 2021).
- Govender, R.; Abrahmsén-Alami, S.; Larsson, A.; Folestad, S. Therapy for the individual: Towards patient integration into the manufacturing and provision of pharmaceuticals. Eur. J. Pharm. Biopharm. 2020, 149, 58–76. [Google Scholar] [CrossRef] [PubMed]
- Wilson, M.W. Manufacturing platforms for patient-centric drug products. In Developing Drug Products in an Aging Society, 1st ed.; Stegemann, S., Ed.; Springer International Publishing: Cham, Switzerland, 2016; pp. 447–483. [Google Scholar]
- Pine II, B.J.; Victor, B.; Boynton, A.C. Making Mass Customization Work. Harv. Bus. Rev. 1993, 71, 108–118. [Google Scholar]
- Hu, S.J. Evolving Paradigms of Manufacturing: From Mass Production to Mass Customization and Personalization. Procedia CIRP 2013, 7, 3–8. [Google Scholar] [CrossRef] [Green Version]
- Siiskonen, M.; Folestad, S.; Malmqvist, J. Applying function-means tree modelling to personalized medicines. In Proceedings of the NordDesign, Linköping, Sweden, 14–17 August 2018. [Google Scholar]
- Govender, R.; Abrahmsén-Alami, S.; Folestad, S.; Larsson, A. High Content Solid Dispersions for Dose Window Extension: A Basis for Design Flexibility in Fused Deposition Modelling. Pharm. Res. 2020, 37, 9. [Google Scholar] [CrossRef] [PubMed] [Green Version]
- Govender, R.; Abrahmsén-Alami, S.; Larsson, A.; Borde, A.; Liljeblad, A.; Folestad, S. Independent Tailoring of Dose and Drug Release via a Modularized Product Design Concept for Mass Customization. Pharmaceutics 2020, 12, 771. [Google Scholar] [CrossRef]
- Plumb, K. Continuous processing in the pharmaceutical industry: Changing the mindset. Chem. Eng. Res. Des. 2005, 83, 730–738. [Google Scholar] [CrossRef]
- Nagashree, K. Solid oral dosage forms: Tablets review article. J. Pharm. Anal. 2015, 4, 60–71. [Google Scholar]
- Norman, J.; Madurawe, R.D.; Moore, C.M.V.; Khan, M.A.; Khairuzzaman, A. A new chapter in pharmaceutical manufacturing: 3D-printed drug products. Adv. Drug. Del. Rev. 2016, 108, 39–50. [Google Scholar] [CrossRef]
- Siepmann, J.; Siepmann, F. Modeling of diffusion controlled drug delivery. J. Cont. Rel. 2012, 161, 351–372. [Google Scholar] [CrossRef]
- Goyanes, A.; Martinez, P.; Buanz, A.; Basit, A.; Gaisford, S. Effect of geometry on drug release from 3D printed tablets. Int. J. Pharm. 2015, 494, 657–663. [Google Scholar] [CrossRef] [PubMed]
- Quinzler, R.; Gasse, C.; Schneider, A.; Kaufmann-Kolle, P.; Szecsenyi, J.; Haefeli, W.E. The frequency of inappropriate tablet splitting in primary care. Eur. J. Clin. Pharmacol. 2006, 62, 1065–1073. [Google Scholar] [CrossRef]
- Wening, K.; Breitkreutz, J. Oral drug delivery in personalized medicine: Unmet needs and novel approaches. Int. J. Pharm. 2011, 404, 1–9. [Google Scholar] [CrossRef] [PubMed]
- Aleksovski, A.; Dreu, R.; Gašperlin, M.; Planinšek, O. Mini-tablets: A contemporary system for oral drug delivery in targeted patient groups. Expert Opin. Drug Deliv. 2015, 12, 65–84. [Google Scholar] [CrossRef] [PubMed]
- Mourtzis, D. Challenges and future perspectives for the life cycle of manufacturing networks in the mass customisation era. Logist. Res. 2016, 9, 1–20. [Google Scholar] [CrossRef] [Green Version]
- Siiskonen, M.; Malmqvist, J.; Folestad, S. Integrated product and manufacturing system platforms supporting the design of personalized medicines. J. Manuf. Sys. 2020, 56, 281–295. [Google Scholar] [CrossRef]
- Siiskonen, M.; Mortensen, N.H.; Malmqvist, J.; Folestad, S. Adapting discrete goods supply chains to support mass customisation of pharmaceutical products. Concurr. Eng. Res. Appl. 2021. [Google Scholar] [CrossRef]
- Meyer, M.H.; Utterback, J. The product family and the dynamics of core capability. Sloan Manag. Rev. 1993, 34, 29–47. [Google Scholar]
- Robertson, D.; Ulrich, K.T. Planning for product platforms. Sloan Manag. Rev. 1998, 39, 19–31. [Google Scholar]
- Ulrich, K.T.; Eppinger, S.D. Product Design and Development, 5th ed.; McGraw-Hill: New York, NY, USA, 2012. [Google Scholar]
- Ulrich, K. The role of product architecture in the manufacturing firm. Res. Policy 1995, 24, 419–440. [Google Scholar] [CrossRef] [Green Version]
- Du, G.; Jiao, R.J.; Chen, M. Joint optimization of product family configuration and scaling design by Stackelberg game. Eur. J. Oper. Res. 2014, 232, 330–341. [Google Scholar] [CrossRef]
- Fujita, K. Product variety optimization under modular architecture. Comput. Aided Des. 2002, 34, 953–965. [Google Scholar] [CrossRef]
- Simpson, T.W.; Maier, J.R.; Mistree, F. Product platform design: Method and application. Res. Eng. Des. 2001, 13, 2–22. [Google Scholar] [CrossRef]
- Claesson, A. A Configurable Component Framework Supporting Platform-Based Product Development. Ph.D. Thesis, Chalmers University of Technology, Gothenburg, Sweden, 2006. [Google Scholar]
- Gershenson, J.K.; Prasad, G.J.; Zhang, Y. Product modularity: Measures and design methods. J. Eng. Des. 2004, 15, 33–51. [Google Scholar] [CrossRef]
- Schachinger, P.; Johannesson, H.L. Computer modelling of design specifications. J. Eng. Des. 2000, 11, 317–329. [Google Scholar] [CrossRef]
- Tjalve, E. Systematisk Udformning Af Industriprodukter—Værktøjer for Konstruktøren [Systematic Design of Industrial Products—Tools for the Design Engineer]; Akademisk Forlag: Copenhagen, Denmark, 1976. [Google Scholar]
- Levandowski, C.; Michaelis, M.T.; Johanneson, H. Set-based development using an integrated product and manufacturing system platform. Con. Eng. Res. Appl. 2014, 22, 234–252. [Google Scholar] [CrossRef]
- Michaelis, M.T.; Johanneson, H.; ElMaraghy, H.A. Function and process modeling for integrated product and manufacturing system platforms. J. Manuf. Sys. 2015, 36, 203–215. [Google Scholar] [CrossRef]
- Panarotto, M.; Borgue, O.; Isaksson, O. Modelling Flexibility and Qualification Ability to Assess Electric Propulsion Architectures for Satellite Megaconstellations. Aerospace 2020, 7, 176. [Google Scholar] [CrossRef]
- Jugulum, R.; Frey, D.D. Toward a taxonomy of concept designs for improved robustness. J. Eng. Des. 2007, 18, 139–156. [Google Scholar] [CrossRef]
- Hazelrigg, G.A. A framework for decision-based engineering design. J. Mech. Des. 1998, 120, 653–658. [Google Scholar] [CrossRef]
- Soban, D.S.; Price, M.A.; Hollingsworth, P. Defining a research agenda in Value Driven Design: Questions that need to be asked. J. Aer. Oper. 2012, 1, 329–342. [Google Scholar] [CrossRef]
- Bertoni, M.; Bertoni, A. Iterative value models generation in the engineering design process. Des. Sci. 2019, 5, E18. [Google Scholar] [CrossRef] [Green Version]
- Lindstedt, O.; Burenius, J. The Value Model: How to Master Product Development and Create Unrivalled Customer Value; Nimba: Ödeborg, Sweden, 2003. [Google Scholar]
- Pugh, S. Total Design: Integrated Methods for Successful Product Engineering; Addison-Wesley: Wokingham, UK, 1990. [Google Scholar]
- Hörn, H.; Nink, K.; McGauran, N.; Wieseler, B. Early benefit assessment of new drugs in Germany—Results from 2011 to 2012. Health Policy 2014, 116, 147–153. [Google Scholar] [CrossRef] [PubMed]
- Swift, K.G.; Booker, J.D. Process Selection—From Design to Manufacture, 2nd ed.; Elsevier: London, UK, 2003. [Google Scholar]
- NHS. Sertraline. 2018. Available online: https://www.nhs.uk/medicines/sertraline/ (accessed on 22 April 2021).
- Lennartz, P.; Mielck, J.B. Minitabletting: Improving the compactability of paracetamol powder mixtures. Int. J. Pharm. 1998, 173, 75–85. [Google Scholar] [CrossRef]
- Marcum, Z.A.; Gellad, W.F. Medication Adherence to Multi-Drug Regimens. Clin. Geriatr. Med. 2012, 28, 287–300. [Google Scholar] [CrossRef] [Green Version]
- Rantanen, J.; Khinast, J. The future of pharmaceutical manufacturing sciences. J. Pharm. Sci. 2015, 104, 3612–3638. [Google Scholar] [CrossRef] [Green Version]
Figure 1.
CC model of a treatment complying with three product design requirements for customization: scalable dose strength, flexible target release profile, and scalable treatment size.
Figure 1.
CC model of a treatment complying with three product design requirements for customization: scalable dose strength, flexible target release profile, and scalable treatment size.

Figure 2.
Connecting the function domain to the component domain.

Figure 3.
(a) Illustrates the commercial tablet from the face view. (b) The end sections are displayed from the face and the side. (c) The middle section is displayed from the face and the side.
Figure 3.
(a) Illustrates the commercial tablet from the face view. (b) The end sections are displayed from the face and the side. (c) The middle section is displayed from the face and the side.

Figure 4.
Description of product elements divided into the categories of parts, modules, and assemblies and the respective assembly process transforming the product elements.
Figure 4.
Description of product elements divided into the categories of parts, modules, and assemblies and the respective assembly process transforming the product elements.

Figure 5.
Displaying the packing rationale of the modules into a treatment. (a) 3D view of cuboid; (b) bottom view of packed modules; (c) side view of packed modules.
Figure 5.
Displaying the packing rationale of the modules into a treatment. (a) 3D view of cuboid; (b) bottom view of packed modules; (c) side view of packed modules.

Figure 6.
A conceptual illustration of patient segmentation for the reference case (above) and treatment portfolios embracing modular product designs.
Figure 6.
A conceptual illustration of patient segmentation for the reference case (above) and treatment portfolios embracing modular product designs.

Figure 7.
The increase in benefit from a dose strength perspective when comparing each treatment portfolio embracing a modular product design to the reference case.
Figure 7.
The increase in benefit from a dose strength perspective when comparing each treatment portfolio embracing a modular product design to the reference case.

Figure 8.
The increase in patient benefit from a target release profile perspective when comparing each treatment portfolio embracing a modular product design to the reference case.
Figure 8.
The increase in patient benefit from a target release profile perspective when comparing each treatment portfolio embracing a modular product design to the reference case.

Figure 9.
The increase in patient benefit from a size scalability perspective when comparing each treatment portfolio embracing a modular product design to the reference case.
Figure 9.
The increase in patient benefit from a size scalability perspective when comparing each treatment portfolio embracing a modular product design to the reference case.

Figure 10.
An exemplification of the benefit for the patient by the means of modular product designs. In this example, the patient requires the dose of 34.3 mg. The patient benefit is displayed if the patient is offered a treatment in the reference case context as well as if the patient is offered a treatment from portfolio C for both dose-dependent and -independent scenarios.

Figure 11.
The increase in cost when comparing each treatment portfolio embracing a modular product design to the reference case.
Figure 11.
The increase in cost when comparing each treatment portfolio embracing a modular product design to the reference case.

Figure 12.
Exemplifying scales for scoring in the final value assessment.

Table 1.
Product variety for each treatment portfolio for both dose-dependent and -independent release scenarios.
Table 1.
Product variety for each treatment portfolio for both dose-dependent and -independent release scenarios.
| Scenario | Reference Case | Portfolio A | Portfolio B | Portfolio C |
|---|---|---|---|---|
| Dose-dependent | 4 | 116 | 136 | 1540 |
| Dose-independent | 4 | 828 | 1496 | 27472 |
Table 2.
Weight factors to explore different emphases on cost and benefit.
| Case | ||
|---|---|---|
| Value 50–50 | 0.5 | 0.5 |
| Value 67–33 | 0.67 | 0.33 |
| Value 33–67 | 0.33 | 0.67 |
Table 3.
The final value of each treatment portfolio and ranking between the portfolios.
| Case | Reference | Dependent Release | Independent Release | ||||
|---|---|---|---|---|---|---|---|
| Portfolio A | Portfolio B | Portfolio C | Portfolio A | Portfolio B | Portfolio C | ||
| Value 50–50 | 3 | 2.98 | 2.60 | 2.95 | 2.87 | 2.80 | 2.84 |
| Ranking | 1 | 2 | 7 | 3 | 4 | 6 | 5 |
| Value 67–33 | 2.32 | 3.10 | 2.75 | 3.31 | 3.26 | 3.34 | 3.47 |
| Ranking | 7 | 5 | 6 | 3 | 4 | 2 | 1 |
| Value 33–67 | 3.68 | 2.86 | 2.45 | 2.60 | 2.48 | 2.27 | 2.22 |
| Ranking | 1 | 2 | 5 | 3 | 4 | 6 | 7 |
Publisher’s Note: MDPI stays neutral with regard to jurisdictional claims in published maps and institutional affiliations. |
© 2021 by the authors. Licensee MDPI, Basel, Switzerland. This article is an open access article distributed under the terms and conditions of the Creative Commons Attribution (CC BY) license (https://creativecommons.org/licenses/by/4.0/).
Share and Cite
MDPI and ACS Style
Siiskonen, M.; Malmqvist, J.; Folestad, S. Pharmaceutical Product Modularization as a Mass Customization Strategy to Increase Patient Benefit Cost-Efficiently. Systems 2021, 9, 59. https://0-doi-org.brum.beds.ac.uk/10.3390/systems9030059
AMA Style
Siiskonen M, Malmqvist J, Folestad S. Pharmaceutical Product Modularization as a Mass Customization Strategy to Increase Patient Benefit Cost-Efficiently. Systems. 2021; 9(3):59. https://0-doi-org.brum.beds.ac.uk/10.3390/systems9030059
Chicago/Turabian StyleSiiskonen, Maria, Johan Malmqvist, and Staffan Folestad. 2021. "Pharmaceutical Product Modularization as a Mass Customization Strategy to Increase Patient Benefit Cost-Efficiently" Systems 9, no. 3: 59. https://0-doi-org.brum.beds.ac.uk/10.3390/systems9030059
Note that from the first issue of 2016, this journal uses article numbers instead of page numbers. See further details here.