With the rapid expansion of COVID-19, many hospitals are being overwhelmed with cases, especially in some developing countries. An important step in slowing down the spread of the pandemic is to perform comprehensive testing to detect the virus in individuals before they spread it. The most common testing method for detecting COVID-19 is the RT-PCR swab test. While the swab test is cheap and easy to administer, it can often take multiple days or even weeks for results to be returned depending on the location of the laboratory where the tests are analyzed. Furthermore, swab tests can have a false-negative rate ranging between 22% and 37% [
1] which can result in a large number of COVID-19 positive cases being recorded as negative and contributing to the spread of the disease. This is because the insertion of the swab into a patient’s nose can trigger violent coughing, which may decrease accuracy and also pose a sanitation risk to healthcare workers [
2]. Additionally, the effectiveness of the swab test varies depending on the time after exposure. Only 1 day after exposure, there is a 100% chance of a false-negative result; 4 days after exposure, there is a 67% chance of a false-negative result; and even on the day that symptoms onset, there is still a 38% chance of a false-negative result from a COVID-19 infected patient [
3]. While not as severe as false-negative rates, the false-positive rates from swab tests can reach as high as 4.0% [
4]. To solve these problems, some specialists have begun analyzing CT-Scans and X-rays, with accuracies of 82% and specificities of 89% [
5]. In some scenarios, this analysis has been documented to detect COVID-19 with 97% accuracy—a noticeably better performance compared to swab tests [
6] and with much quicker results. Quick test turnaround times are necessary for treating patients in critical condition and for quarantining those with the virus. For those reasons, many hospitals around the world have started examining X-rays as a preliminary detection method for COVID-19 before swab test results are returned or when swab tests are not available.
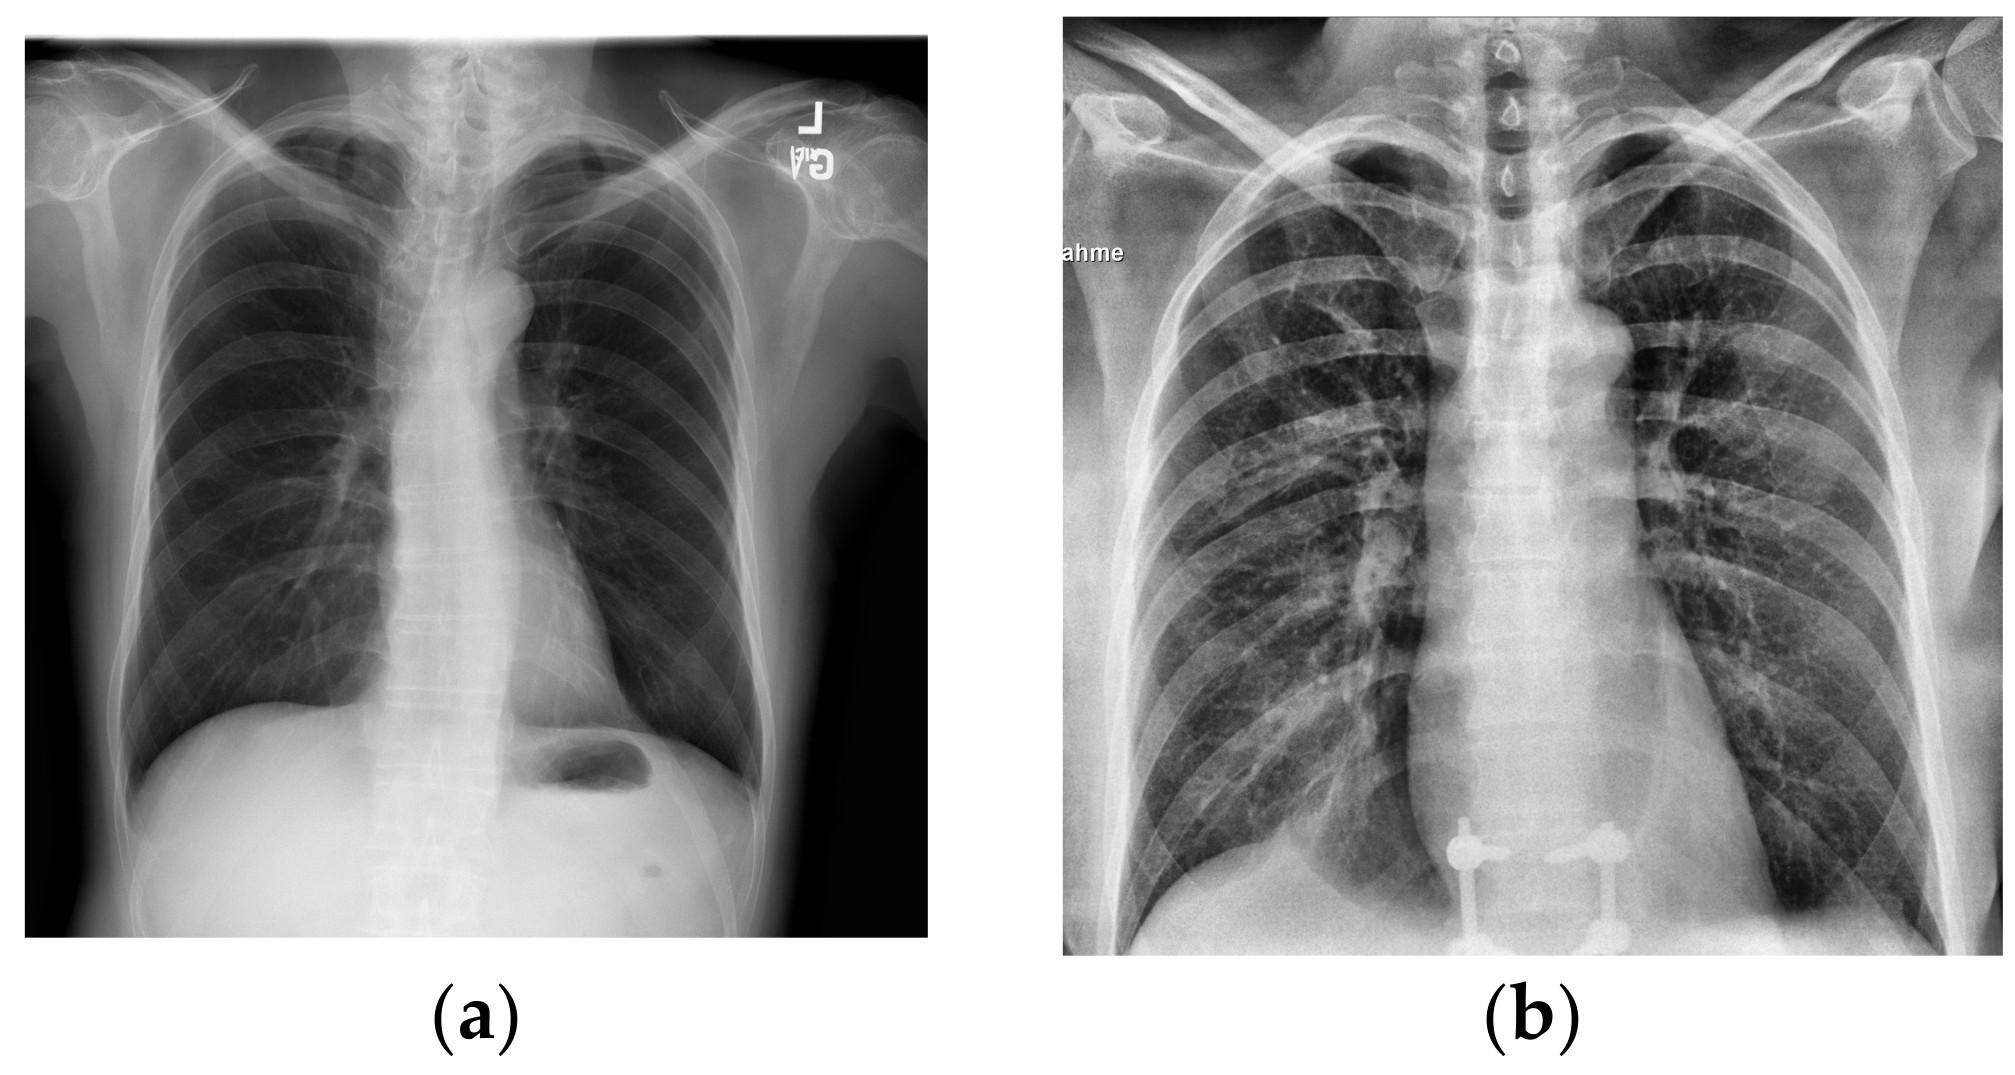
Although in
Figure 1a,b the differences in lung health are obvious, with large white opacities in the infected lung, the differences between healthy lungs and lungs infected by COVID-19 are often much more subtle. Additionally, some other illnesses like pneumonia can appear similar in an X-ray to COVID-19, requiring intensive review to distinguish them from the latter virus. With cases drastically increasing each day, it can take a significant amount of time for doctors to analyze these X-rays that could be used for treating patients instead. Couple this with the tedious work of manually analyzing hundreds of images in a high stress environment and there is an even greater overburdening of doctors and risk of mistakes.
Artificial Intelligence can play a large supporting role for physicians in detecting COVID-19. Convolutional neural networks (CNNs) can point out important areas in a scan for a physician to focus on via the use of image pre-processing and heatmap generation. Their ability to quickly and accurately analyze X-rays also provides an invaluable service for assisting radiologists and reducing their workloads [
9]. In this paper, we trained xRGM-NET, a custom created CNN, on the Cohen 2020 COVID-19 X-ray [
8] and the NIH X-ray databases [
7] in order to detect COVID-19 in patients through X-ray images.
X-rays are a cost-effective and quick test for COVID-19 [
10]. Compared to the days it might take for swab test results to be returned, a chest X-ray scan can return results in less than 10 min [
10]. Because swab tests need to be taken to laboratories to determine a result, there is an even longer wait time in developing countries where a lack of infrastructure might make it more difficult to transport the swab tests. Additionally, the equipment needed to analyze swab tests to determine whether a patient has COVID-19 or not is very expensive, and developing countries may not have enough of this equipment to analyze these tests in a reasonable time frame. This can be seen in India which has struggled with backlogging of swab tests [
10]. Lau et al. [
11] determined that many COVID-19 epicenters like China, Italy, USA, and Iran, among other countries, suffer from extreme under-testing and that reported cases often range from 10× to even 45× less than estimated cases. A solution to this was tested by Dr. Vishal Rao, a respected surgeon in Bengaluru and member of the COVID-19 Consulate Board, who led a pilot program in India with 1000 people that used X-rays to detect COVID-19 with over a 95% accuracy rate [
10]. These tests were able to be offered at a cost 10–20× less than a swab test in a public or private hospital [
10].
In their paper [
12], Chen et al. analyzed 52 models used for predicting COVID-19 from CT-Scans or X-rays that ranged in creation from as early as 14 February 2020 to 8 May 2020. Some successful models used contrast enhancement and other pre-processing techniques to improve accuracy. Many of these models used very small databases and achieved lackluster results, but some achieved significant results, whether with custom-designed model architectures, or just with common existing architectures.
In their paper on DarkCovidNet [
13], Ozturk et al. propose a lightweight and fairly accurate model for detecting COVID-19 from X-rays. DarkCovidNet [
13] was a very strong inspiration for our model. They were a great starting off point and had an accuracy of 98.08%, but a sensitivity of only 90.65% for detecting COVID-19 [
13]. We were particularly inspired by the expanding and contrasting number of filter patterns in their model. While this model has a good accuracy, this accuracy is for a dataset with only 127 COVID-19 X-rays [
13] and a much higher ratio of healthy lung images, which skewed the accuracy higher despite the model’s mediocre sensitivity. Thus it is important to examine a models sensitivity and specificity as well as its accuracy in order to get the full picture. With many COVID-19 predicting models we have seen, very small datasets of COVID-19 X-rays often had artificially high accuracies due to model over fitting and a lack of diverse or outlier X-rays that can lower the accuracy of the model.
The use of machine learning techniques for detecting COVID-19 has been tested in a few real-world scenarios to mixed results. Some techniques using neural networks have been able to achieve accuracies of over 95% on large numbers of patients, but other techniques, such as Random Forests, have fared significantly worse with accuracies as low as 66% [
14]. These promising results show the potential for the use of artificial intelligence in helping doctors diagnose COVID-19, but also the importance in making sure the right techniques are used to maximize the accuracy and efficiency of these models.
This paper formalizes and builds upon the preliminary results we presented at the UNCG Annual Mathematics and Statistics Conference [
15] and the State of North Carolina Undergraduate Research and Creativity Symposium [
16]. These broad PowerPoint style presentations were intended to simply disseminate information to a general audience and focused more on the concept of a CNN and how it can be applied to detect COVID-19. It was meant to rapidly disseminate basic information to help in the fight against COVID-19. In contrast, this manuscript goes into a deep analysis of xRGM-NET and its use of data augmentation and lung heatmap visualization as well as covering new results generated since those presentations. This manuscript covers the exact architecture of xRGM-NET and the evolution of the network as layers were changed and new procedures were added to it. It additionally covers new information comparing xRGM-NET to other similar work and examines the effects of data augmentation on CNN models to a greater degree. These results were not yet identified during those preliminary presentations over a year before the publication of this work. For these reasons, this manuscript is identified for publication.
1. Materials and Methods
1.1. Procedure
The general procedure for training xRGM-NET is both time efficient and effective. Once a clean dataset is obtained, the X-ray scan images are converted into a grey scale 227 × 227 numeric array. We then apply pre-processing and data augmentation to the image to enhance contrast as well as improve training. The pre-processed and augmented images are then fed into the xRGM-NET convolutional neural network to classify subjects as either positive or negative for COVID-19. We also utilize Score-CAM on xRGM-NET to generate a heatmap of the parts of the lung X-ray that are most indicative of COVID-19. This heatmap is exported to assist doctors or other medical staff in diagnosing COVID-19. Lastly, the original images are pre-processed using histogram equalization and color inversion. These processed images help emphasize opacities and artifacts in the lung that can help doctors identify a COVID-19 infection. Together, these three pieces of information—the COVID-19 diagnosis, the heatmap, and the processed images—assist doctors in quickly identifying COVID-19 in patients. This process is illustrated in
Figure 2.
1.2. Data
In training xRGM-NET, we used two different databases: the COVID-19 X-ray Image Database collected by Cohen et al. [
8] and the NIH ChestX-ray8 Database [
7]. We used the Cohen database because it contains a relatively large number of X-rays from a variety of locations; this ensures that our model will be more robust in many different hospitals with different X-ray machines. The NIH database contains 108,948 frontal X-ray images from 32,717 unique patients. These subjects have a wide range of conditions and illnesses. For our purposes, we only used 2754 healthy X-rays from the NIH database. We also cleaned the Cohen database and used 439 COVID-19 X-ray images from the total 951 images. Models were trained and tested on a 90% training, 10% testing validation split. When cleaning the Cohen database, we only included images that were from a frontal COVID-19 X-ray. This removed CT-Scans, X-rays taken from the side, and images of patients that were not infected or infected with other diseases besides COVID-19. We combined both of these databases for the training and testing of xRGM-NET. We are limited in our training by the lack of COVID-19 X-ray images; as more COVID-19 X-rays are collected, we can pull more healthy X-rays from the NIH database in a similar ratio to make a more comprehensive training dataset.
We aimed to explore different pre-processing techniques with X-ray images that would allow features significant to the COVID-19 classification task to stand out, while those less notable to be diminished. Such pre-processing could be used not only to improve the accuracy of trained convolutional neural networks, but can also be analyzed by medical professionals to gain a clearer understanding of the appearance of COVID-19 and its effects on the respiratory system.
Although the images in the Cohen COVID-19 X-ray Database and NIH ChestX-ray8 Database are consistent in terms of lung area photographed, they vary in the physical dimensions of the image. CNNs require a consistent image input dimension (preferably square), so we resized each image to 277 × 277 × 1 tensors and applied anti-aliasing to not sacrifice image quality in the process and possibly lose important details of the image. This is seen in
Figure 3b.
Contrast limited adaptive histogram equalization (CLAHE) [
17] is an image pre-processing technique that aims to improve clarity in an image and normalize irregularities in contrast. Unlike other contrast optimization techniques, CLAHE does not change the contrast of the image on a global scale, but rather adjusts the contrast of different parts of the images based on how high or low the contrast is in the region. Applied to X-rays, vessels and other parts of the lung that previously weren’t visible become clear to the naked eye. This is seen in
Figure 3c. CLAHE did not prove very useful for image classification, however, is still very helpful for humans who might want to analyze X-rays.
Color inversion flips the grey scale value (0–255) of each pixel in the image
and produces an inverted image. We found this to be mainly useful for looking at X-rays from a human perspective, as black is easier to see against white than vice versa. Color inversion did not prove very useful for the model accuracy, but still has importance for helping doctors in their diagnosis. This is seen in
Figure 3d.
Because COVID-19 is a relatively recent virus, there has not been enough time for large-scale X-ray and CT-Scan data collection and anonymization. Since CNN’s need as much data as possible for increased accuracy, it is imperative that xRGM-NET and other COVID-19 detecting models have a way to artificially increase the amount of data to train on. One method of this is through data augmentation. Data augmentation is a method of altering images and adding them to the training dataset, so that there are an increased number of slightly different images for the CNN to train on. Data augmentation also serves to increase the versatility of a model as well as lowering over fitting. Because of all these previously mentioned effects, data augmentation can drastically increase accuracy and reduce the error of a model [
18].
Geometric transformations are some of the earliest and most common forms of data augmentation. Geometric transformations consist of translations, rotations, and flips of an image. The transformations also allow xRGM-NET to better adapt to X-rays taken from the front or back of a subject. In order to conduct these transformations, we used Keras’s inbuilt ImageDataGenerator class. While these transformations are basic, they allow xRGM-NET to better identify X-rays that may have certain tilts and translations—as are common in the real world. This also served to create more data for xRGM-NET to train on. An example of a geometric augmentation can be seen in
Figure 4.
The next category of data augmentation we used involved adding noise, applying a median filter, conducting image inpainting, and adjusting brightness. These were all attempts to lower image quality and add artifacts that simulate defects found in real world scans. For noise, we randomly generated Gaussian noise and added it to the image. For larger speckle noise, we generated the same Gaussian noise but then used a median filter to bunch the noise up into dot-like artifacts on the image. For image inpainting, we first generated noise and used it as a mask, deleting the parts of the image where noise was present. We then used inpainting to take into account the nearest pixels to fill in the now empty areas where the noise mask was on the image. Finally, for brightness, we used the inbuilt Keras ImageDataGenerator class to randomly adjust the brightness of the image. These data augmentation techniques all served to prepare the model for more realistic scenarios where the X-ray may not be as clean as in a database. An example of a image quality augmentation can be seen in
Figure 5.
These data augmented images were added to the original images. This doubled the size of our COVID-19 positive training set from 395 images (based on a 90/10 training/testing split) to 790 images. While less important for healthy lung data, it also doubled the amount of healthy lung training images from 2479 to 4958. The amount of testing data images remained the same, at 44 COVID-19 infected lung images and 281 healthy lung images. This is because augmented data cannot be used to test as this can lead to artificially increased accuracy. Additionally, real X-rays would not be augmented if they were evaluated using xRGM-NET, and so it is more accurate to test only using a non-augmented set of images that the model has not trained with.
1.3. Vanishing Gradients
After the first iteration of the xRGM-NET, one aspect of the CNN we wanted to improve upon was the time required to converge upon a local minimum of cross-entropy loss. We also wished to converge upon a better local minimum. Because of the binary nature of classifying COVID-19, our output layer is designed to produce a value between 0–1, thus identifying the probability that a given subject has COVID-19. In order to make probabilistic predictions, the output neuron from the xRGM-NET is passed through a sigmoid activation function.
However, this function suffers from the problem of vanishing gradients which can lead to drastically slower training times, and can cause the model to stop improving all together—which ultimately is what happened with our first iteration of xRGM-NET.
In order to resolve this issue, we implemented a popular machine learning training technique known as batch normalization [
19]. Batch normalization aims to solve the problem of vanishing gradients by normalizing the values of a training batch’s input so that the distribution of values is more stable. This reduces the likelihood of gradient vanishing and also makes training less chaotic for the neural network. This is because each layer in a neural network produces output values based on its input, and for hidden layers (layers that are not the overall input/output layers) their inputs are derived from the inputs from all the previous layers. This means that during training, each layer changes its weights based on how it can modify its input to produce an output that minimizes the cost. However, if internal covariate shift occurs and each layer changes during training iterations, it can become difficult for the model to reach a consensus for the best weights that reduce cost. Batch normalization solves this by normalizing values entered to the neural network and thus decreasing the variation in input values to each layer between training iterations. This vastly improves the ability of the model to improve, with better performance metrics and higher accuracy. As these qualities are highly desirable, we implemented batch normalization in the training of our model.
Additionally, to also solve the problem of vanishing gradients, we used Leaky Rectified Linear Units (Leaky ReLU) activation functions instead of sigmoid functions. Instead of reaching a gradient of zero at negative values like a normal ReLU function or like a sigmoid function at its extremes, a leaky ReLU reaches a small gradient value that allows the neural network to continue training. However, for the output layer function, we still used the sigmoid function since it results in a value between 1 and 0 that can return the probability of a patient being infected with COVID-19.
1.4. Visualization with Gradients
Calculated gradients for a particular weight serve not only as an indicator of how the weights should be modified to achieve better performance metrics, but can also be used to visualize the processes undergone by the convolutional neural network to make certain decisions. One gradient based method for visualizing neural networks is known as saliency maps [
20]. saliency maps work by solving for the gradient of a model’s output with respect to each pixel in the model’s input image, which would be a X-ray in this case. In solving for this gradient, the intensity of impact a certain pixel has on the final output can be determined through the gradient’s magnitude. There are countless saliency mapping and feature visualization techniques and they generally can give a decent representation of what parts of an image the model determines to be significant in solving a task, however as seen in
Figure 6, these images can be hard to interpret.
Another commonly used gradient based visualization technique, which tries to solve the issues presented by saliency maps is one known as Gradient-weighted Class Activation Mapping [
22] (Grad-CAM). saliency maps analyze individual pixels to determine their contribution to the model’s output; however, from a human perspective, larger segments/regions of an image are what allow us to decipher what the image contains. Grad-CAM works by utilizing the filtered image to create a visualization of the CNN. By taking the gradient of the final convolutional layer’s filtered output image with respect to the output, the calculated value can determine which regions of an image have the greatest impact on the final prediction output of the CNN. Transferred to a heat-map, this method results in a decent representation of what the model believes to areas significant to producing accurate results in a given task.
Ultimately, we decided to use another method very similar to Grad-CAM called Score-CAM because of its smoother, more consistent, and less noisy heatmaps [
23]. Score-CAM finds the weights connected to individual pixels and filters of the image, thus finding which parts of the images have the most influence on the output of the CNN. Using Score-CAM, we generated heat maps of our X-rays that showcased the areas in the lung that xRGM-NET recognized as important for determining whether the patient was infected with COVID-19 or not. Areas in red represent opacities or spots in the lung that might indicate COVID-19 while areas in blue are parts that represent normality. As seen in
Figure 7, the two COVID-19 positive patients have large opacities on the left sides of their lungs and these are shown in the Score-CAM images with dark red ovals. However, on the healthy patients, there is a distinct lack of these red markers and the lungs are shown to be healthy.
1.5. CNN Models
We chose to tackle the task of COVID-19 X-ray scan classification using a supervised machine learning model called a convolutional neural network (CNN). We chose this type of model due to its superiority in pattern detection and image classification tasks versus machine learning models like Random Forests and simpler types of neural networks. We tested CNNs with a variety of architectures to determine a model that would best fit our goals: having low computational cost and high efficiency (computers found in low-income or developing areas as well as mobile devices may have difficulty running high end models due to their low performance), and high performance metrics (specifically sensitivity and accuracy). A high sensitivity may be more desirable over high specificity, since the consequence of falsely classifying a patient as positive for COVID-19 is simply that the patient will unnecessarily self isolate or get another test. The opposite scenario, a false-negative diagnosis, may result in patients unknowingly spreading the disease and worsening the COVID-19 situation. The models we used to achieve our goals ranged from having a high number of parameters, to being simple CNN architectures that could be trained quickly, to being the unique architecture of xRGM-NET.
1.5.1. Model Comparison
The AlexNet network [
24] was one of the first popularized CNN architectures and as such is very simple. The architecture consists of only five convolutional layers and four dense layers. The model was initially used as a test subject to see if our work with X-rays was feasible.
The modern VGG-19 network [
25] is one of the most widely used CNNs for image classification. However, its modernity also means it is structured to utilize extremely large datasets with millions of subjects and high performance computing power. The high number of neurons and layers results in over 120 million trainable parameters. A model of such size proved to be difficult to train on with our dataset of only 2000 images and, despite decent computing power (GTX 1070 GPU used to train), resulted in the model taking an extremely long time to converge upon a local minimum and severe over fitting. The immense computing power required to run VGG-19 also makes it unsuitable for use in the majority of hospitals and limits COVID-19 classification from being used in mobile devices.
xRGM-NET is the convolutional neural network designed in this study. The model consists of 17 convolutional layers and one dense layer, totaling approximately 2 million trainable parameters. We chose the size of the model to serve as a good balance between the massive VGG-19 network and the much more simple AlexNet model. This balance allows xRGM-NET to fully train in only an hour and classify X-rays in a fraction of a second on a GTX 1070 Ti. The model implements a CNN architecture design inspired by the DarkCovidNet neural network model created by Ozturk et al. [
13] in which the amount of filters within the convolutional layers increases between groups of three by a binary factor as shown in
Table A1. This cyclical increase and decrease in the number of filters helps keep the model from abstracting the image too much, which allows it to better distinguish the minute differences between a healthy and COVID-19 infected lung.
We only used 2 MaxPool layers and 2 AvgPool layers in our model. This was a key difference between DarkCovidNet and xRGM-NET and allowed us to retain more detail. MaxPool is much more selective by definition than AvgPool in which data it retains because it only selects the most prominent features, which can lead to smaller details being lost. While this is not usually a problem for most image recognition tasks with distinct objects, when detecting COVID-19 in lungs, the smallest opacities or haze in the lungs can convey a great deal of information about whether the patient is infected with COVID-19 or not, and thus AvgPool’s smoother incorporation of those details is very important. Additionally, MaxPool layers can better handle translations in space [
26] which can lead to more accurate heatmaps of X-rays.
2. Results
Following the creation and training of xRGM-NET Version 1, we aimed to achieve further improved subject diagnoses of COVID-19. Our goals with the second iteration of xRGM-NET were to increase accuracy and sensitivity while increasing, or at least not compromising, specificity. It was also important to maintain similar or even better model computation costs.
The first changes we made to our model stemmed from our implementation of Grad-CAM [
22], discussed in
Section 1.4. Because Grad-CAM uses the output of the final convolutional layer to solve for its gradients, we were able to get a better understanding of how the convolutional layers altered the original image and how it did so to train. When producing heat-maps for xRGM-NET Version 1, the heat-map was simply a 2 × 2 image with no useful information as seen in
Figure 8, which also means our convolution operations were oversimplifying the image to the point where it became almost meaningless due most likely to the use of too many MaxPool layers as mentioned in
Section 1.5.1.
To tackle this issue we reduced the number of max pooling layers, which increased the image shape of the final convolution layer’s output and had a drastic effect on improving training performance. It additionally allowed for a much better heatmap, as visible in
Figure 7. Another aspect of our model that we improved on is the use of batch normalization. Because of our non-linear activation functions, especially our sigmoid activation at the end of the model, our training on xRGM-NET Version 1 was suffering heavily from vanishing gradients and after just two epochs of training, the model began to train extremely slowly and eventually plateaued with negligible improvement to training or testing performance metrics. To solve this issue, we implemented batch normalization, discussed in
Section 1.3, which helped our model converge upon a lower local minimum of cost at a much faster rate as inputs to the activation functions were no longer residing in saturated regions. These changes can be seen in
Table A2.
These changes resulted in xRGM-NET V.2 having the lowest loss, highest accuracy, and highest specificity among the analyzed models with the sensitivity being only slightly lower than VGG-19’s sensitivity. The accuracies for each model can be seen in
Table 1.
Our next improvement to our model was using data augmentation. As seen in
Figure 9, geometric augmentation improved our sensitivity by 3% without any effect on accuracy and only a minuscule effect on the specificity of xRGM-NET V2. However, our image quality augmentations hurt the model and made it perform worse. While we are not sure as to why this is, we speculate that some of the noise might have appeared to be very similar to some of the opacities in the lungs and that this confused the model. Additionally, the changes in brightness and the median filter which blurred the X-ray might have degraded the image so that it lost its useful information. Another finding was that adding data augmentation will not necessarily improve a model as seen when we combined both data augmentation methods. Even though geometric augmentation improved our model, adding it to image quality augmentation made the model perform worse than either geometric or image quality augmentation on their own.
To further confirm the validity of these results and analyze the effects of geometric augmentation on other models, we performed geometric augmentation on VGG-19 and AlexNet. These are visible in
Table 2. As seen, geometric augmentation improved AlexNet’s accuracy, sensitivity, and specificity but negatively affected VGG-19s accuracy, sensitivity, and specificity. These inferior results for VGG-19 are reasonable given that VGG-19 has too many parameters for the training size, and so it overfitted the data. While normally, as it did for AlexNet and xRGM-NET, conducting geometric augmentations can help reduce overfitting, because VGG-19 has so many parameters, it overfitted the augmented data which explains the worse performance.
Table 3 compares the results obtained from our method with results from various other COVID-19 detection algorithms. As visible, our method performs equivalently or better than most other models that use X-rays or CT-Scans to detect COVID-19. The sensitivity of our model is also much better than most other models.
3. Discussion
Our xRGM-NET Version 2 CNN architecture seemed to be an ideal model for the COVID-19 classification task given the limitations of our dataset and computing power. xRGM-NET V.2 had the highest accuracy, at 97%, with AlexNet at 93% and VGG-19 at 96%. Each model seemed to reach a certain number of training epochs where the accuracy would remain the same, and likewise for the cross-entropy loss. As with any supervised machine learning task, this behavior from a model being trained is expected.
Our model had the highest performing X-ray COVID-19 classification accuracy out of the models that we trained and also performed better or equal to most other COVID-19 diagnosis methods found in literature. Our pre-processing techniques and use of heat-map CNN visualization can be used not only to improve the performance of our model, but to serve as an aid for doctors who perform manual analysis of X-rays, saving them time and resources that could otherwise be spent aiding patients in the emergency room.
An additional contribution was the use of data augmentation for improving the detection of COVID-19. While data augmentation is not a new technique, until very recently, we did not find any other models that used data augmentation to help solve the problem of a lack of COVID-19 X-rays. Even then, these papers did not compare different data augmentation techniques to the base model that did not use data augmentation. Geometric augmentation had a large effect in improving the sensitivity (true positive) rate of our model. While an increase of 3% may not seem like much, at the scale of COVID-19, it can mean thousands more people are correctly identified as having COVID-19. Achieving a high sensitivity for COVID-19 detecting models is the hardest task due to a lack of COVID-19 X-rays images and so an increase in sensitivity due to geometric augmentation is a very noteworthy achievement. Additionally, high sensitivity rates from xRGM-NET allow it to be a viable COVID-19 screening method [
34]. While high specificity rates are also important, in the case of COVID-19 diagnoses, the consequences of a false-negative result are much worse than a false-positive, due to the fact that a false-negative individual has the potential to continue spreading COVID-19, while a false-positive individual may only be subject to additional testing and unnecessary quarantine.
The combination of xRGM-NET’s high COVID-19 diagnosis accuracy with Score-CAM heatmaps and pre-processing provides a invaluable tool for radiologists and doctors to help them quickly diagnose COVID-19 in patients. This process should not be considered as a replacement for RT-PCR swab tests or manual radiologist diagnosis, but instead as a complement [
35]. Scanning a patient for an X-ray still requires machinery that needs to be cleaned and may take more time to conduct each individual test compared to the swab test. However, especially for cases where test results are needed quickly in order to determine what to treat a patient for, or whether to place a patient in a quarantine ward, CNNs like xRGM-NET and X-rays can play an important role.
4. Conclusions
Moving forwards, we suggest a focus on increasing the accessibility of CNN models for detecting COVID-19. Although our model is more efficient on average than other computationally heavy models like VGG-19, it can still be further improved to work with low-end computers and even portable/mobile devices. While through our databases and data augmentation we have been able to make our model robust at detecting COVID-19 from a variety of sources, there is still room to reduce the impact of non-standardized qualities of X-rays fed into our model with more COVID-19 X-ray data as well as additional data augmentation techniques.
One significant obstacle in the development of machine learning models to detect COVID-19 is the shortage of pre-existing X-ray scan data on potential COVID-19 patients. Since hospitals are overloaded with treating patients, scans cannot be made readily available to the public.
To remedy this issue, it may be beneficial to develop a Generative Adversarial Network (GAN) that is capable of generating new X-ray scans from scratch based on the appearances of X-rays already present in the dataset. A GAN would be able to generate realistic X-ray scans that simulate the lungs of patients both with and without the virus, which will greatly increase the size of a model’s training data set. We predict that, by augmenting xRGM-NET’s training dataset, a model will produce more accurate outputs and learn to handle more variability and imperfections in scans. GANs are exceptional in data augmentation for datasets that are imbalanced [
36] and have been shown to greatly increase performance of COVID-19 detection algorithms [
37]. This imbalance is one of the major issues plaguing COVID-19 detection from X-rays as there are much more X-ray images of healthy patients than of COVID-19 infected patients. GAN data augmentation also solves the problem of sensitive data and the requirement for the anonymization of COVID-19 X-ray data [
36]. Because GANs generate these images, there is no person that they come from and thus there is no sensitive data that needs to be anonymized.
It may also be interesting to examine the best ratio of augmented images to non-augmented images in training a CNN. In our paper, we found that adding too many and too heavily augmented images could decrease the performance of our model. Thus, it may be important to find the optimized number of augmented images to maximize the accuracy of a CNN. It may also be important to find how heavily augmentation should be applied in order to maximize accuracy. For example, how much should brightness in an image be adjusted? At what point are images translated too much where they begin to lose information and begin harming the model? These are questions that may help improve the results of models that use data augmentation.
Regardless of these questions, xRGM-NET has shown its potential as a great tool for assisting doctors and radiologists in the rapid detection of COVID-19. It may be useful to test xRGM-NET in a hospital setting for diagnosing patients with COVID-19 to see how this real-world setting affects the accuracy of its diagnoses. Additionally, the lightweight yet robust architecture of xRGM-NET could be trained on other databases for other similar purposes, such as detecting pneumonia or various other lung diseases in patients.


