Mimics and Pitfalls of Primary Ovarian Malignancy Imaging

 ,
,  ,
, 
Abstract
:1. Introduction
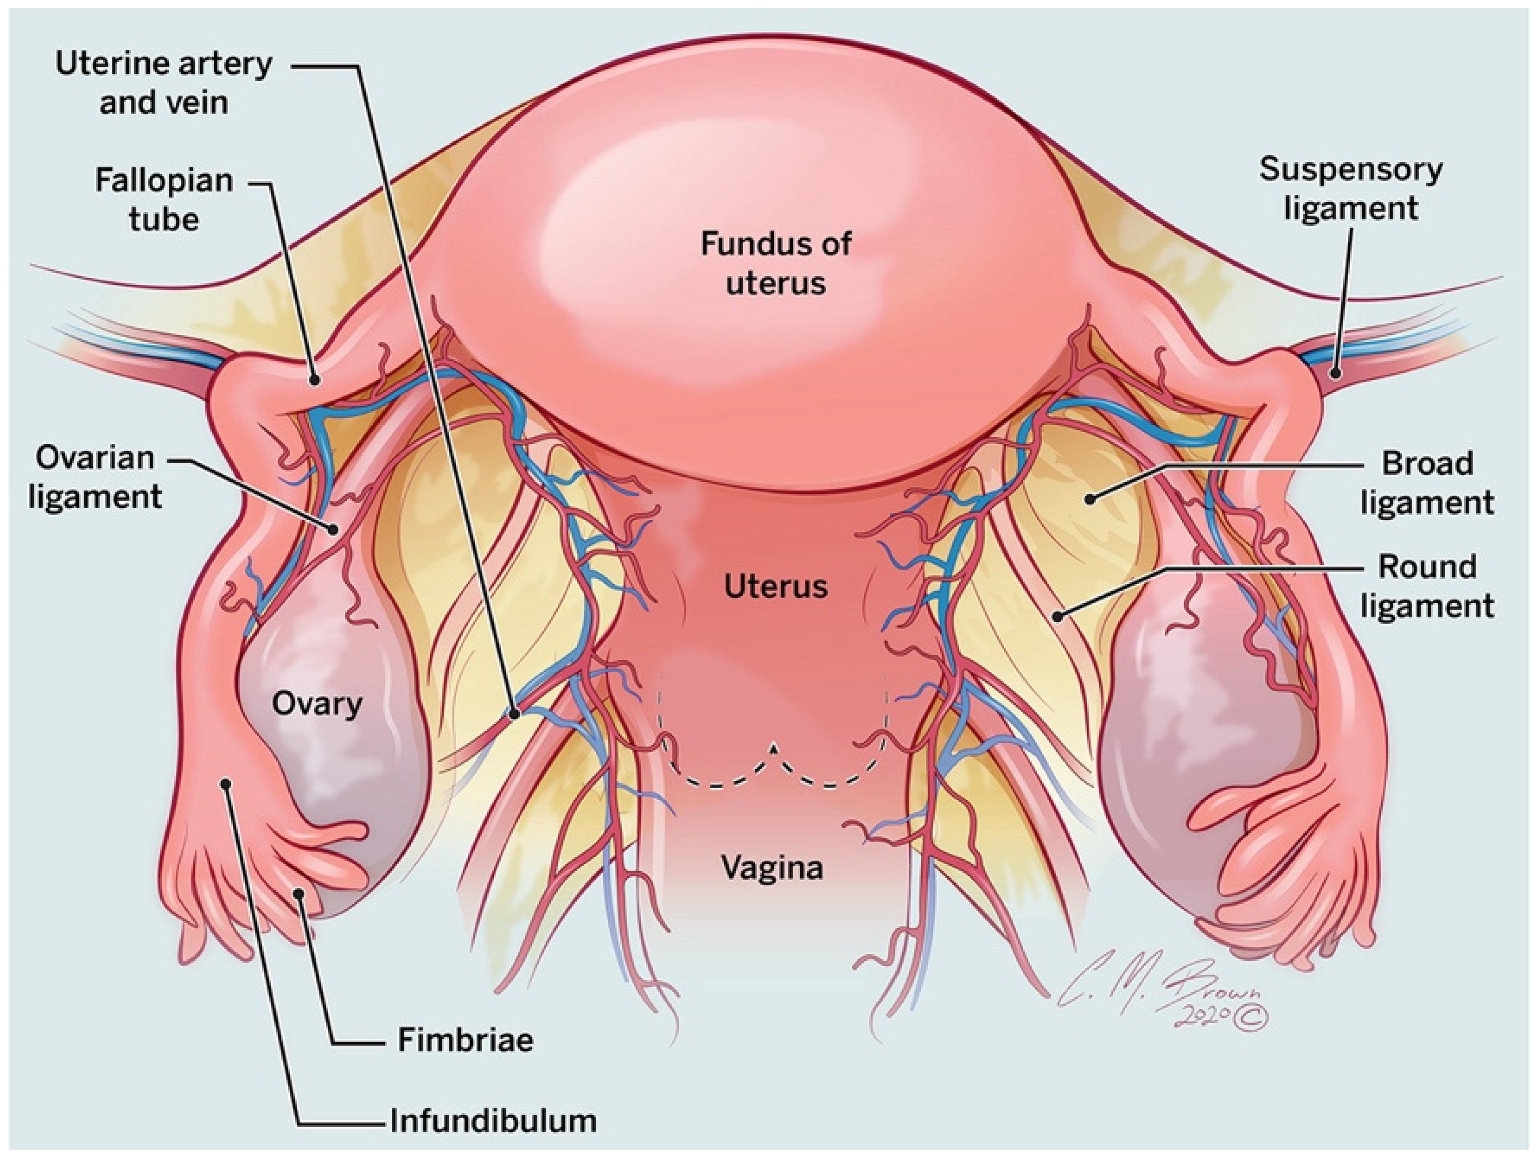
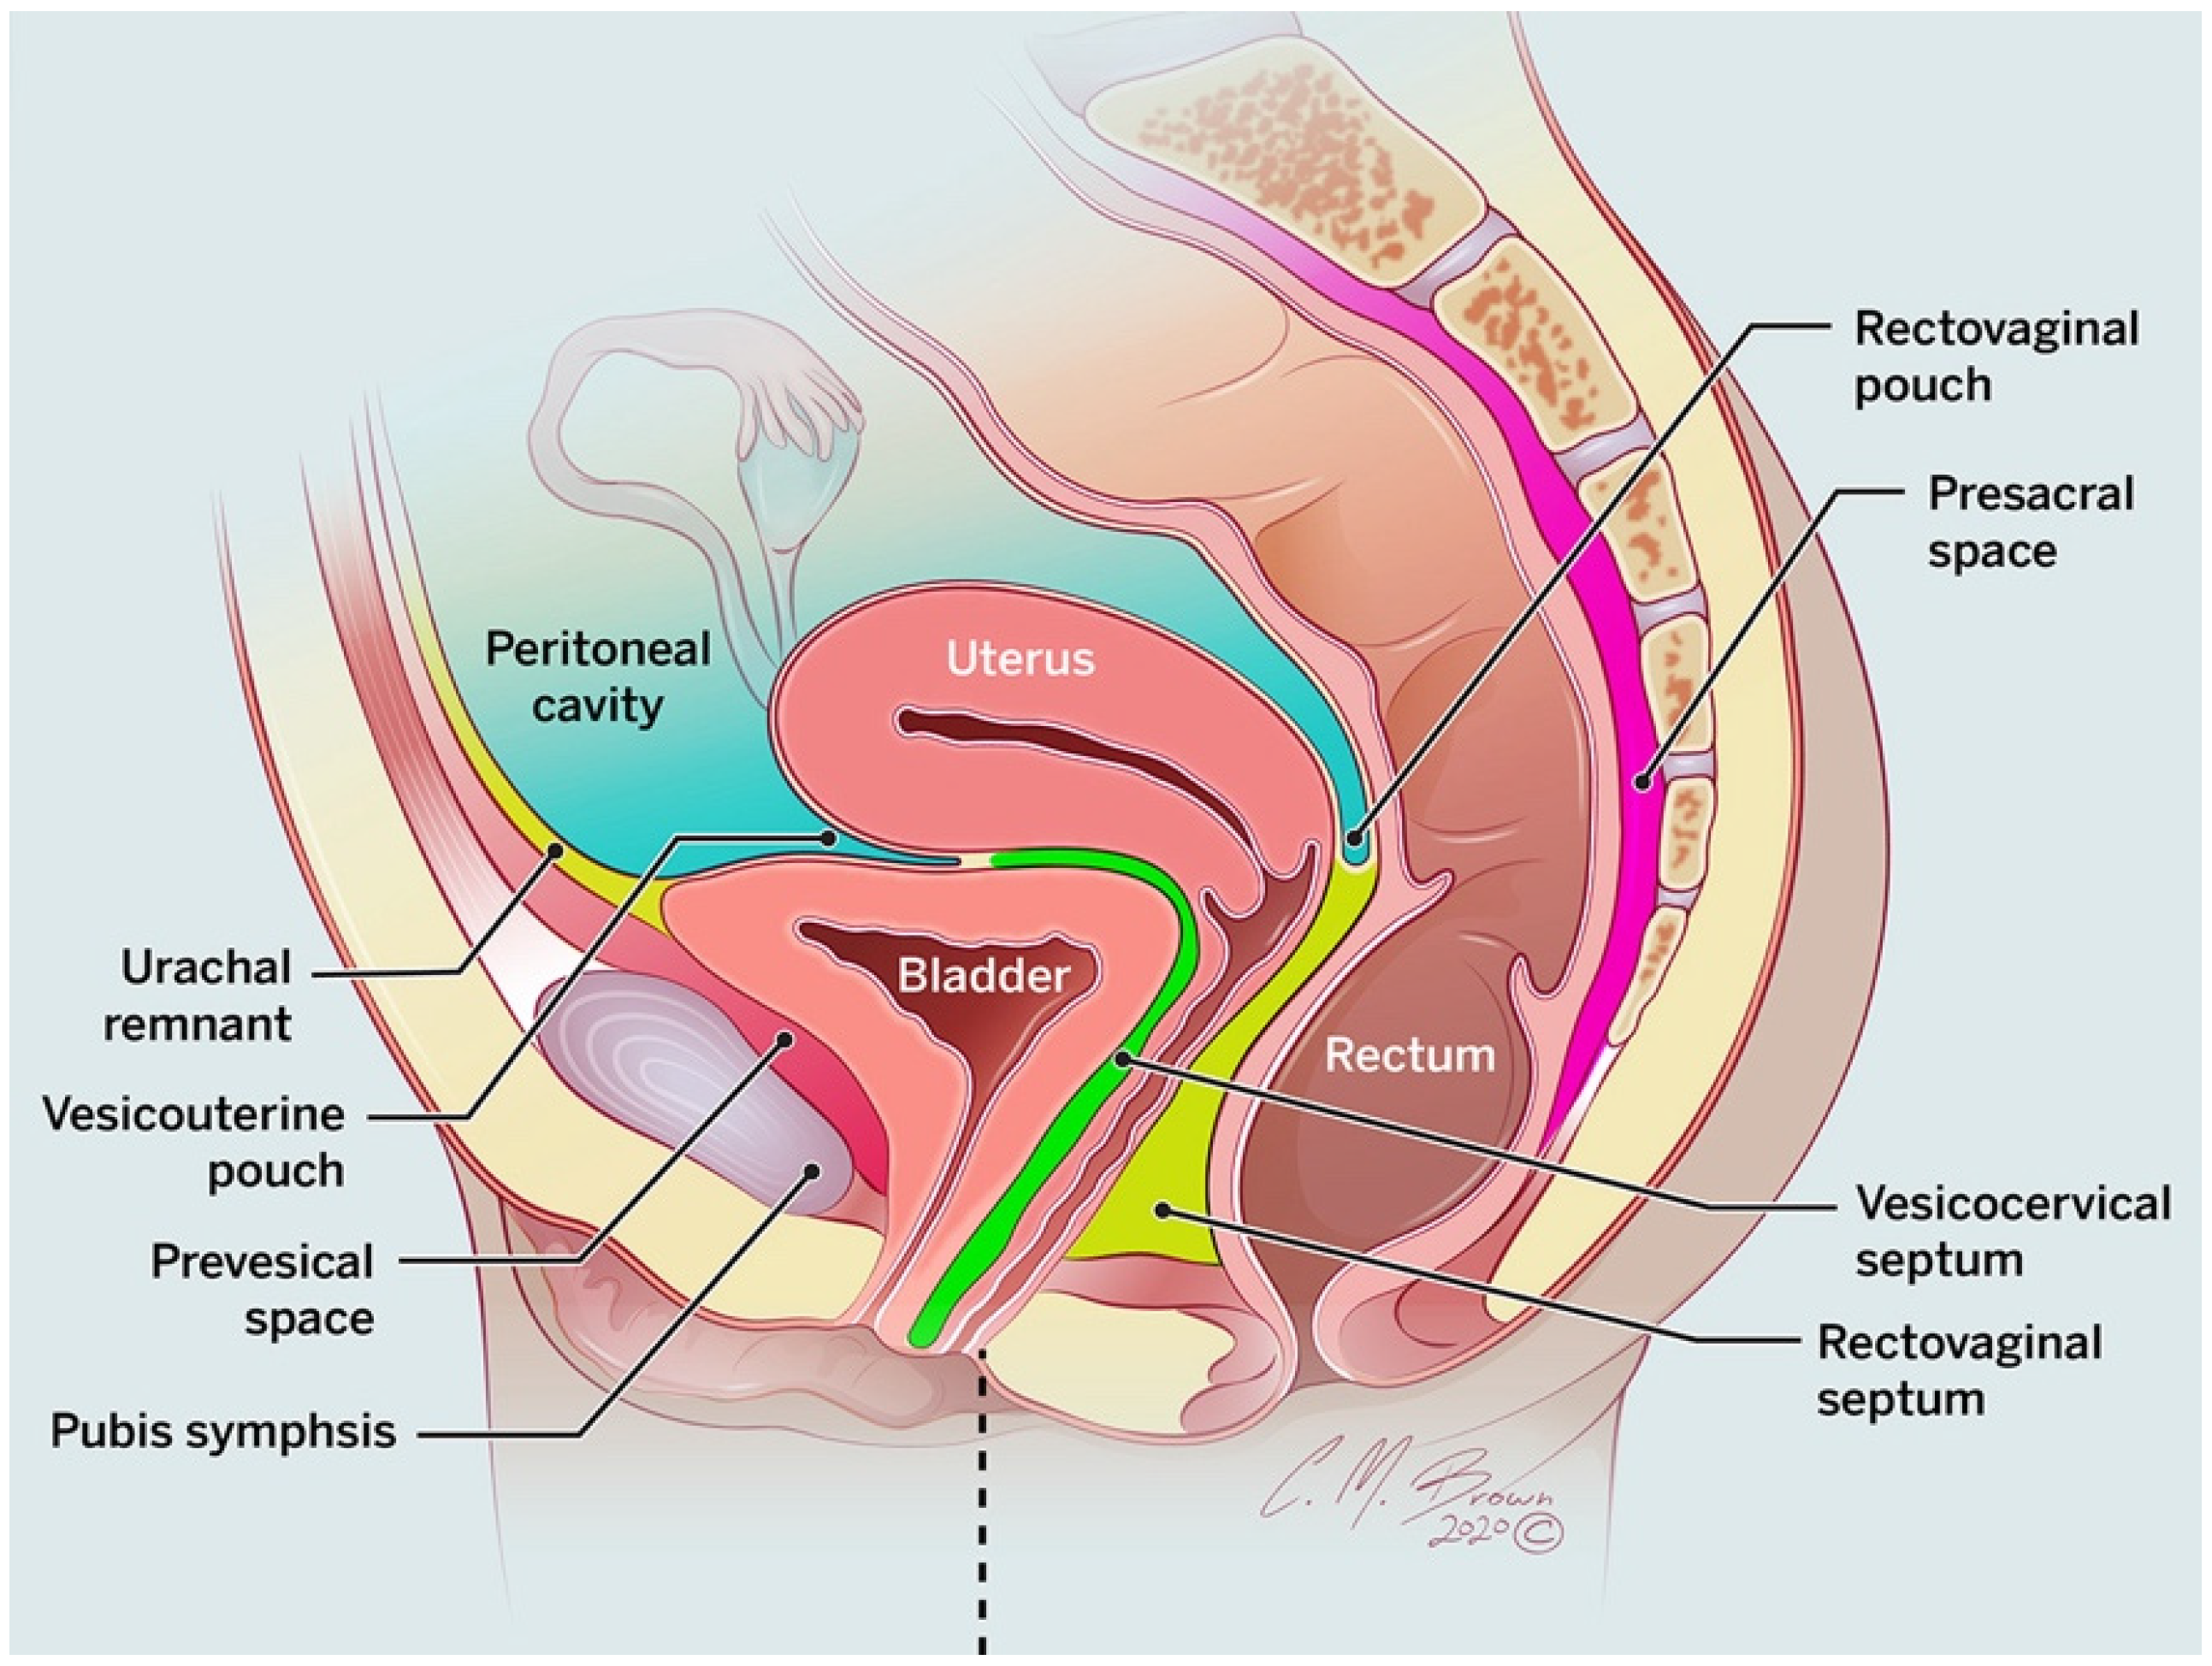
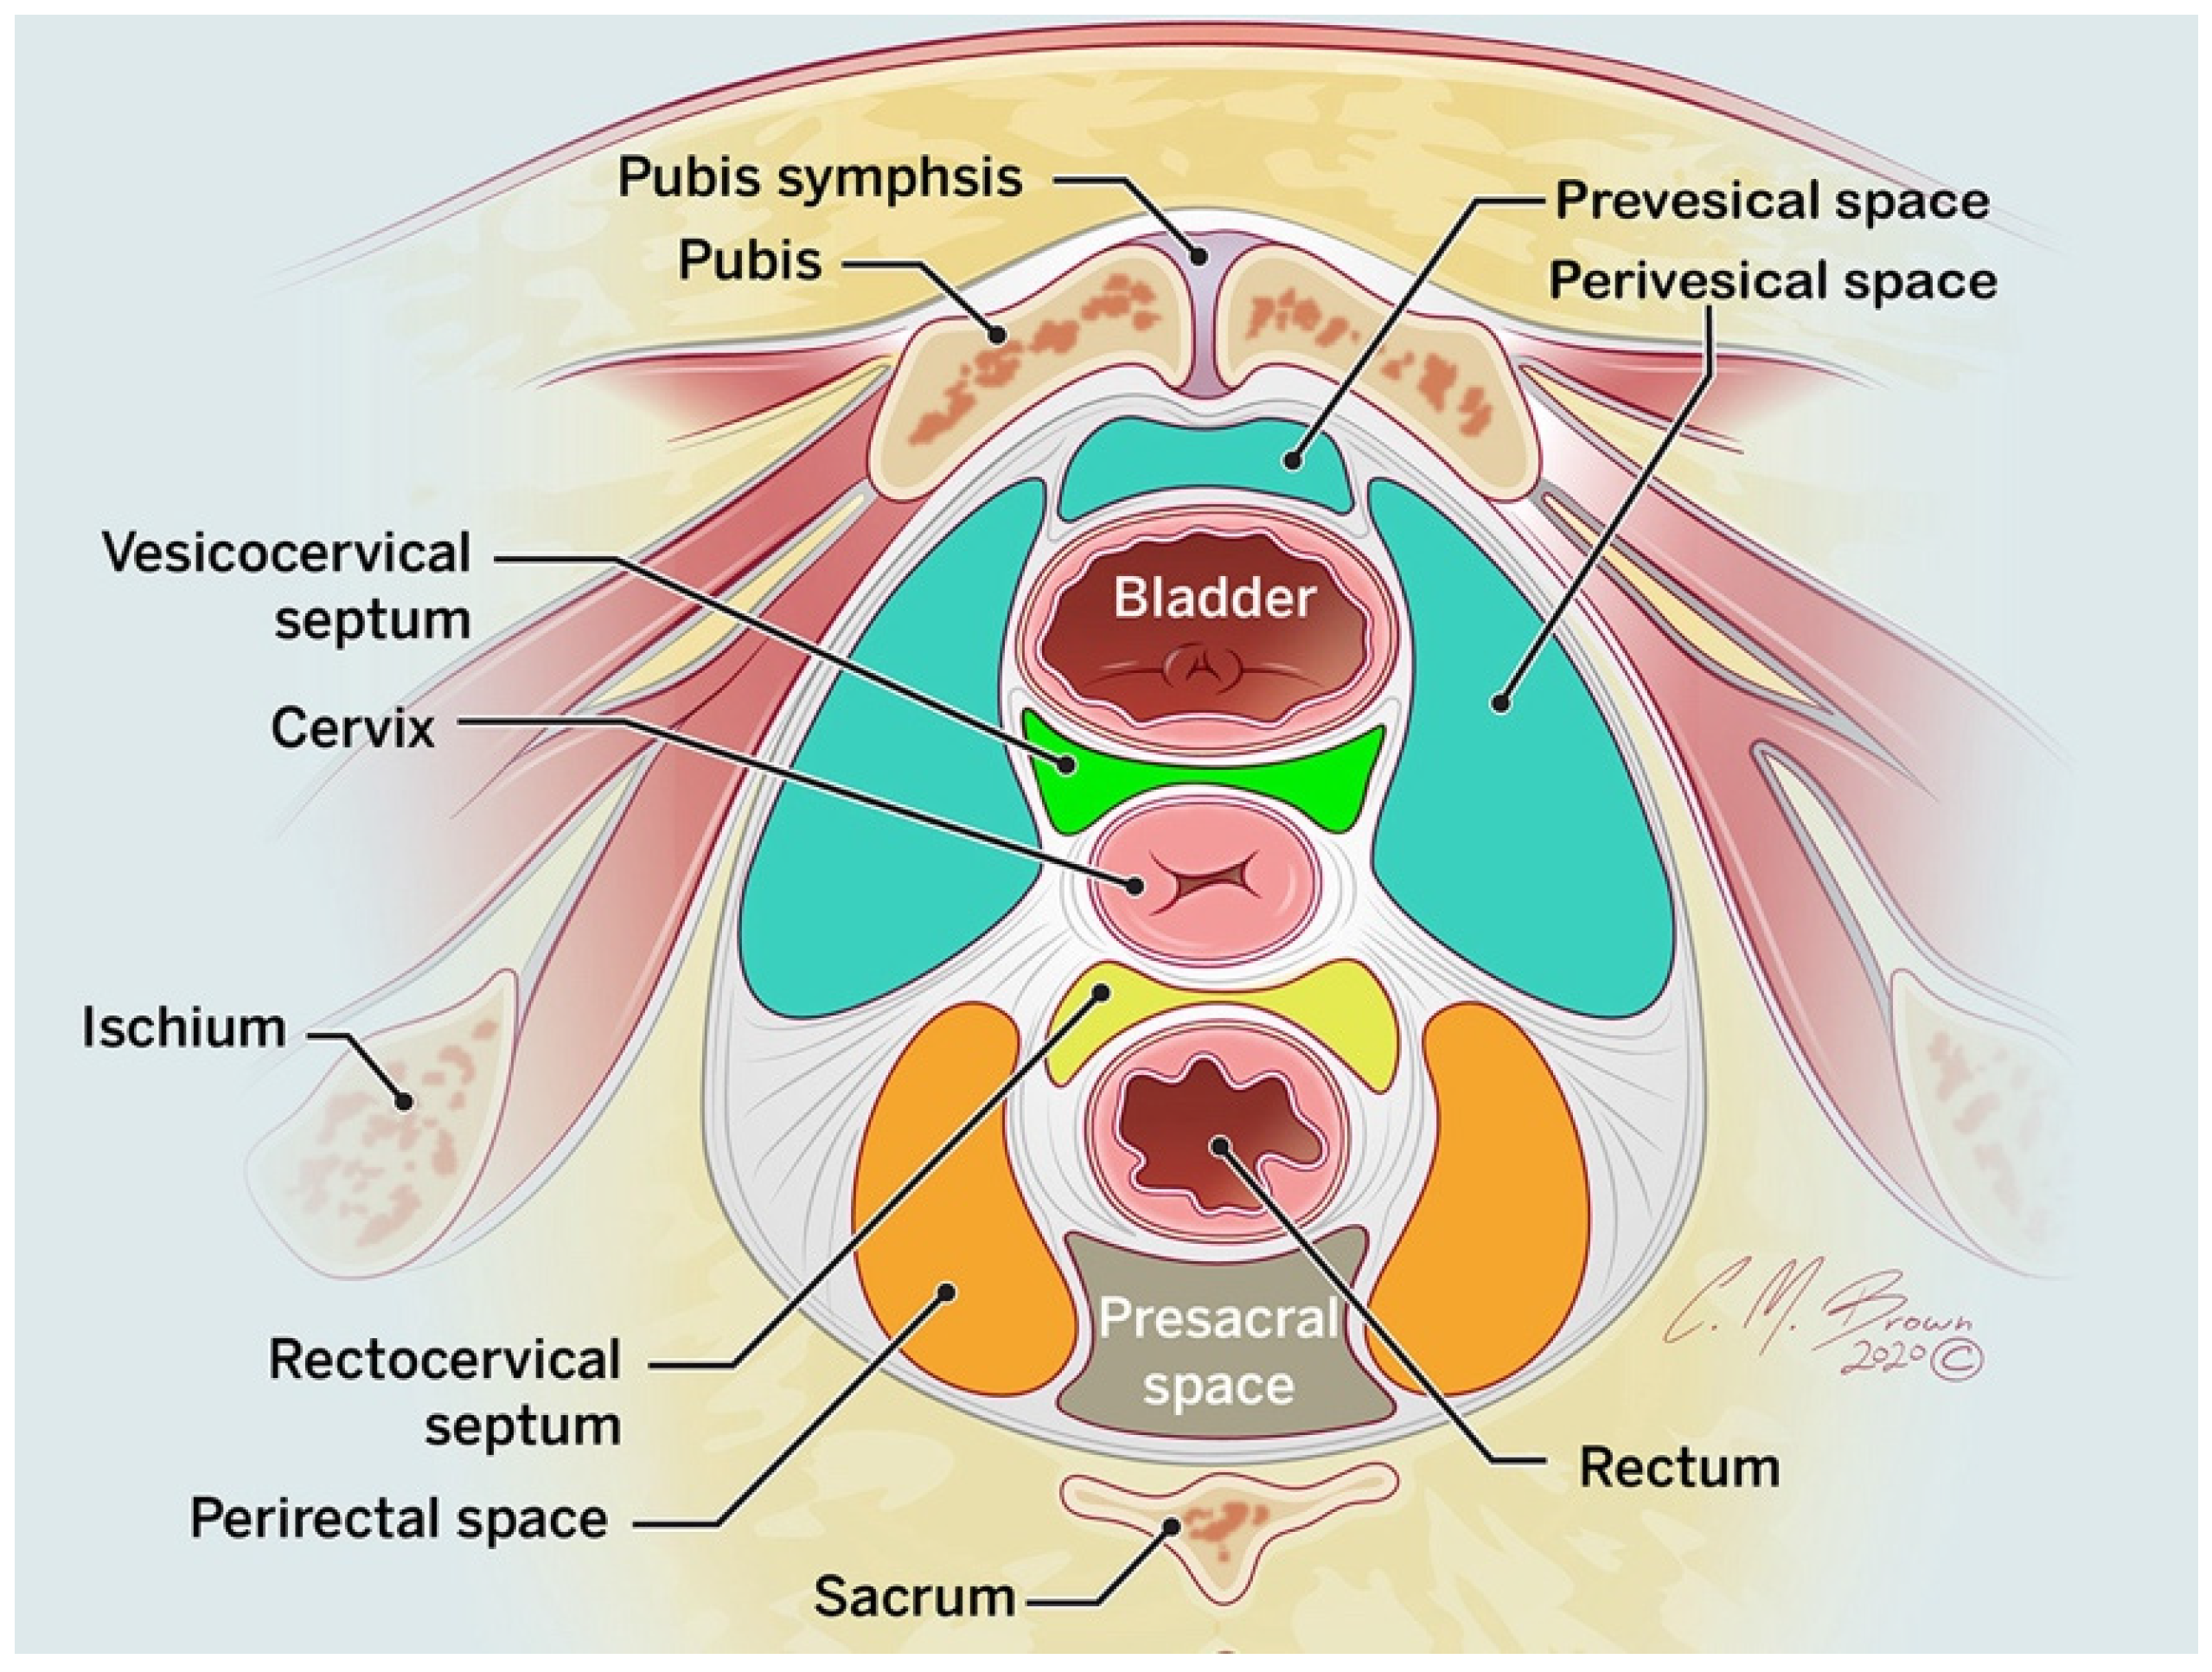
2. Anatomy
3. Is the Mass Ovarian or Extra-ovarian in Origin?
4. Imaging
5. Intraperitoneal Lesions
5.1. Extra-Ovarian Adnexal Lesions
5.1.1. Hydrosalpinx and Hematosalpinx
5.1.2. Pelvic Inflammatory Disease, Pyosalpinx, and Tubo-Ovarian Abscess
5.1.3. Adnexal Ectopic Pregnancy
5.1.4. Adnexal Torsion
5.1.5. Paraovarian Cyst
5.1.6. Peritoneal Inclusion Cyst
5.2. Uterine Lesions
5.2.1. Uterine Vasculature
5.2.2. Leiomyoma
5.3. Peritoneal Disease
5.3.1. Disseminated Peritoneal Leiomyomatosis
5.3.2. Peritoneal Carcinomatosis
5.3.3. Peritoneal Tuberculosis
5.4. Gastrointestinal Lesions
5.4.1. Appendicitis
5.4.2. Appendiceal Mucocele and Pseudomyxoma Peritonei
5.4.3. Gastrointestinal Stromal Tumor (GIST)
6. Extraperitoneal Lesions
6.1. Lymphoma
6.2. Retrorectal Cysts
6.3. Spinal Meningeal Cysts
6.4. Neurogenic Tumors
7. Either Intraperitoneal or Extraperitoneal Lesions
7.1. Hematoma
7.2. Lymphocele, Seroma, and Urinoma
7.3. Pelvic Abscess
8. Conclusions
Author Contributions
Funding
Institutional Review Board Statement
Informed Consent Statement
Data Availability Statement
Conflicts of Interest
References
- Rajkotia, K.; Veeramani, M.; Macura, K.J. Magnetic resonance imaging of adnexal masses. Top. Magn. Reson. Imaging 2006, 17, 379–397. [Google Scholar] [CrossRef] [PubMed]
- Ozat, M.; Altinkaya, S.O.; Gungor, T.; Cağlar, M.; Zergeroglu, S.; Karaca, M.; Besli, M.; Mollamahmutoglu, L. Extraovarian conditions mimicking ovarian cancer: A single center experience of 15 years. Arch. Gynecol. Obstet. 2011, 284, 713–719. [Google Scholar] [CrossRef] [PubMed]
- Nougaret, S.; Nikolovski, I.; Paroder, V.; Vargas, H.A.; Sala, E.; Carrere, S.; Tetreau, R.; Hoeffel, C.; Forstner, R.; Lakhman, Y. MRI of Tumors and Tumor Mimics in the Female Pelvis: Anatomic Pelvic Space-based Approach. Radiographics 2019, 39, 1205–1229. [Google Scholar] [CrossRef]
- Shetty, M. Nonovarian Mimics of Ovarian Malignancy. Semin. Ultrasound CT MRI 2019, 40, 319–331. [Google Scholar] [CrossRef]
- Saksouk, F.A.; Johnson, S.C. Recognition of the ovaries and ovarian origin of pelvic masses with CT. Radiographics 2004, 24 (Suppl. 1), S133–S146. [Google Scholar] [CrossRef]
- Levy, A.D.; Shaw, J.C.; Sobin, L.H. Secondary tumors and tumorlike lesions of the peritoneal cavity: Imaging features with pathologic correlation. Radiographics 2009, 29, 347–373. [Google Scholar] [CrossRef]
- O’Connell, A.M.; Duddy, L.; Lee, C.; Lee, M.J. CT of pelvic extraperitoneal spaces: An anatomical study in cadavers. Clin. Radiol. 2007, 62, 432–438. [Google Scholar] [CrossRef]
- Lee, J.H.; Jeong, Y.K.; Park, J.K.; Hwang, J.C. “Ovarian vascular pedicle” sign revealing organ of origin of a pelvic mass lesion on helical CT. Am. J. Roentgenol. 2003, 181, 131–137. [Google Scholar] [CrossRef]
- Oliveira, J.D.; Cunha, T.M.; Tereso, A. Tumors of the broad ligament: What and when to suspect such rare location. Radiol. Bras. 2020, 53, 349–355. [Google Scholar] [CrossRef] [PubMed]
- Thawait, S.K.; Batra, K.; Johnson, S.I.; Torigian, D.A.; Chhabra, A.; Zaheer, A. Magnetic resonance imaging evaluation of non ovarian adnexal lesions. Clin. Imaging 2016, 40, 33–45. [Google Scholar] [CrossRef] [PubMed]
- Sala, E.J.; Atri, M. Magnetic resonance imaging of benign adnexal disease. Top. Magn. Reson. Imaging 2003, 14, 305–327. [Google Scholar] [CrossRef]
- Gity, M.; Parviz, S.; Saligheh Rad, H.; Fathi Kazerooni, A.; Shirali, E.; Shakiba, M.; Baikpour, M. Differentiation of Benign from Malignant Adnexal Masses by Dynamic Contrast-Enhanced MRI (DCE-MRI): Quantitative and Semi-quantitative analysis at 3-Tesla MRI. Asian Pac. J. Cancer Prev. 2019, 20, 1073–1079. [Google Scholar] [CrossRef] [Green Version]
- Malek, M.; Oghabian, Z.; Tabibian, E.; Rahmani, M.; Miratashi Yazdi, S.N.; Oghabian, M.A.; Parviz, S. Comparison of Qualitative (Time Intensity Curve Analysis), Semi-Quantitative, and Quantitative Multi-Phase 3T DCEMRI Parameters as Predictors of Malignancy in Adnexal. Asian Pac. J. Cancer Prev. 2019, 20, 1603–1611. [Google Scholar] [CrossRef] [PubMed] [Green Version]
- Sharma, S.K.; Nemieboka, B.; Sala, E.; Lewis, J.S.; Zeglis, B.M. Molecular Imaging of Ovarian Cancer. J. Nucl. Med. 2016, 57, 827–833. [Google Scholar] [CrossRef] [PubMed] [Green Version]
- Iyer, V.R.; Lee, S.I. MRI, CT, and PET/CT for Ovarian Cancer Detection and Adnexal Lesion Characterization. Am. J. Roentgenol. 2010, 194, 311–321. [Google Scholar] [CrossRef]
- Benjaminov, O.; Atri, M. Sonography of the abnormal fallopian tube. Am. J. Roentgenol. 2004, 183, 737–742. [Google Scholar] [CrossRef] [PubMed]
- Rezvani, M.; Shaaban, A.M. Fallopian tube disease in the nonpregnant patient. Radiographics 2011, 31, 527–548. [Google Scholar] [CrossRef] [Green Version]
- Tukeva, T.A.; Aronen, H.J.; Karjalainen, P.T.; Molander, P.; Paavonen, T.; Paavonen, J. MR imaging in pelvic inflammatory disease: Comparison with laparoscopy and US. Radiology 1999, 210, 209–216. [Google Scholar] [CrossRef]
- Kim, S.H.; Kim, S.H.; Yang, D.M.; Kim, K.A. Unusual causes of tubo-ovarian abscess: CT and MR imaging findings. Radiographics 2004, 24, 1575–1589. [Google Scholar] [CrossRef] [Green Version]
- Anderson, F.W.; Hogan, J.G.; Ansbacher, R. Sudden death: Ectopic pregnancy mortality. Obstet. Gynecol. 2004, 103, 1218–1223. [Google Scholar] [CrossRef] [Green Version]
- Bouyer, J.; Coste, J.; Fernandez, H.; Pouly, J.L.; Job-Spira, N. Sites of ectopic pregnancy: A 10 year population-based study of 1800 cases. Hum. Reprod. 2002, 17, 3224–3230. [Google Scholar] [CrossRef] [Green Version]
- Creanga, A.A.; Shapiro-Mendoza, C.K.; Bish, C.L.; Zane, S.; Berg, C.J.; Callaghan, W.M. Trends in ectopic pregnancy mortality in the United States: 1980–2007. Obstet. Gynecol. 2011, 117, 837–843. [Google Scholar] [CrossRef] [PubMed]
- Foti, P.V.; Ognibene, N.; Spadola, S.; Caltabiano, R.; Farina, R.; Palmucci, S.; Milone, P.; Ettorre, G.C. Non-neoplastic diseases of the fallopian tube: MR imaging with emphasis on diffusion-weighted imaging. Insights Imaging 2016, 7, 311–327. [Google Scholar] [CrossRef] [Green Version]
- Dawood, M.T.; Naik, M.; Bharwani, N.; Sudderuddin, S.A.; Rockall, A.G.; Stewart, V.R. Adnexal Torsion: Review of Radiologic Appearances. Radiographics 2021, 41, 609–624. [Google Scholar] [CrossRef]
- Singh, A.; Danrad, R.; Hahn, P.F.; Blake, M.A.; Mueller, P.R.; Novelline, R.A. MR imaging of the acute abdomen and pelvis: Acute appendicitis and beyond. Radiographics 2007, 27, 1419–1431. [Google Scholar] [CrossRef] [Green Version]
- Varras, M.; Tsikini, A.; Polyzos, D.; Samara, C.; Hadjopoulos, G.; Akrivis, C. Uterine adnexal torsion: Pathologic and gray-scale ultrasonographic findings. Clin. Exp. Obstet. Gynecol. 2004, 31, 34–38. [Google Scholar]
- Albayram, F.; Hamper, U.M. Ovarian and adnexal torsion: Spectrum of sonographic findings with pathologic correlation. J. Ultrasound Med. 2001, 20, 1083–1089. [Google Scholar] [CrossRef] [PubMed]
- Rha, S.E.; Byun, J.Y.; Jung, S.E.; Jung, J.I.; Choi, B.G.; Kim, B.S.; Kim, H.; Lee, J.M. CT and MR imaging features of adnexal torsion. Radiographics 2002, 22, 283–294. [Google Scholar] [CrossRef]
- Moyle, P.L.; Kataoka, M.Y.; Nakai, A.; Takahata, A.; Reinhold, C.; Sala, E. Nonovarian cystic lesions of the pelvis. Radiographics 2010, 30, 921–938. [Google Scholar] [CrossRef]
- Kim, J.S.; Woo, S.K.; Suh, S.J.; Morettin, L.B. Sonographic diagnosis of paraovarian cysts: Value of detecting a separate ipsilateral ovary. Am. J. Roentgenol. 1995, 164, 1441–1444. [Google Scholar] [CrossRef] [PubMed] [Green Version]
- Jain, K.A. Imaging of peritoneal inclusion cysts. Am. J. Roentgenol. 2000, 174, 1559–1563. [Google Scholar] [CrossRef]
- Kim, J.S.; Lee, H.J.; Woo, S.K.; Lee, T.S. Peritoneal inclusion cysts and their relationship to the ovaries: Evaluation with sonography. Radiology 1997, 204, 481–484. [Google Scholar] [CrossRef]
- Koninckx, P.R.; Renaer, M.; Brosens, I.A. Origin of peritoneal fluid in women: An ovarian exudation product. BJOG Int. J. Obstet. Gynaecol. 1980, 87, 177–183. [Google Scholar] [CrossRef]
- Umeoka, S.; Koyama, T.; Togashi, K.; Kobayashi, H.; Akuta, K. Vascular dilatation in the pelvis: Identification with CT and MR imaging. Radiographics 2004, 24, 193–208. [Google Scholar] [CrossRef]
- Cohen, D.T.; Oliva, E.; Hahn, P.F.; Fuller, A.F., Jr.; Lee, S.I. Uterine smooth-muscle tumors with unusual growth patterns: Imaging with pathologic correlation. Am. J. Roentgenol. 2007, 188, 246–255. [Google Scholar] [CrossRef]
- Fasih, N.; Prasad Shanbhogue, A.K.; Macdonald, D.B.; Fraser-Hill, M.A.; Papadatos, D.; Kielar, A.Z.; Doherty, G.P.; Walsh, C.; McInnes, M.; Atri, M. Leiomyomas beyond the uterus: Unusual locations, rare manifestations. Radiographics 2008, 28, 1931–1948. [Google Scholar] [CrossRef]
- Rader, J.S.; Binette, S.P.; Brandt, T.D.; Sreekanth, S.; Chhablani, A. Ileal hemorrhage caused by a parasitic uterine leiomyoma. Obstet. Gynecol. 1990, 76, 531–534. [Google Scholar]
- Fulcher, A.S.; Szucs, R.A. Leiomyomatosis peritonealis disseminata complicated by sarcomatous transformation and ovarian torsion: Presentation of two cases and review of the literature. Abdom. Imaging 1998, 23, 640–644. [Google Scholar] [CrossRef]
- Diop, A.D.; Fontarensky, M.; Montoriol, P.F.; Da Ines, D. CT imaging of peritoneal carcinomatosis and its mimics. Diagn. Interv. Imaging 2014, 95, 861–872. [Google Scholar] [CrossRef] [Green Version]
- Low, R.N. MR imaging of the peritoneal spread of malignancy. Abdom. Imaging 2007, 32, 267–283. [Google Scholar] [CrossRef]
- Mehta, J.B.; Dutt, A.; Harvill, L.; Mathews, K.M. Epidemiology of extrapulmonary tuberculosis. A comparative analysis with pre-AIDS era. Chest 1991, 99, 1134–1138. [Google Scholar] [CrossRef] [PubMed] [Green Version]
- Tang, L.C.; Cho, H.K.; Wong Taam, V.C. Atypical presentation of female genital tract tuberculosis. Eur. J. Obstet. Gynecol. Reprod. Biol. 1984, 17, 355–363. [Google Scholar] [CrossRef]
- Sanai, F.M.; Bzeizi, K.I. Systematic review: Tuberculous peritonitis--presenting features, diagnostic strategies and treatment. Aliment. Pharmacol. Ther. 2005, 22, 685–700. [Google Scholar] [CrossRef]
- Choe, J.; Wortman, J.R.; Michaels, A.; Sarma, A.; Fulwadhva, U.P.; Sodickson, A.D. Beyond appendicitis: Ultrasound findings of acute bowel pathology. Emerg. Radiol. 2019, 26, 307–317. [Google Scholar] [CrossRef]
- Honnef, I.; Moschopulos, M.; Roeren, T. Appendiceal mucinous cystadenoma. Radiographics 2008, 28, 1524–1527. [Google Scholar] [CrossRef] [Green Version]
- Caspi, B.; Cassif, E.; Auslender, R.; Herman, A.; Hagay, Z.; Appelman, Z. The onion skin sign: A specific sonographic marker of appendiceal mucocele. J. Ultrasound Med. 2004, 23, 117–121. [Google Scholar] [CrossRef]
- Seshul, M.B.; Coulam, C.M. Pseudomyxoma peritonei: Computed tomography and sonography. Am. J. Roentgenol. 1981, 136, 803–806. [Google Scholar] [CrossRef]
- Isaacs, K.L.; Warshauer, D.M. Mucocele of the appendix: Computed tomographic, endoscopic, and pathologic correlation. Am. J. Gastroenterol. 1992, 87, 787–789. [Google Scholar] [PubMed]
- von Mehren, M.; Joensuu, H. Gastrointestinal Stromal Tumors. J. Clin. Oncol. 2018, 36, 136–143. [Google Scholar] [CrossRef] [PubMed]
- Lee, C.M.; Chen, H.C.; Leung, T.K.; Chen, Y.Y. Gastrointestinal stromal tumor: Computed tomographic features. World J. Gastroenterol. 2004, 10, 2417–2418. [Google Scholar] [CrossRef]
- Gangadhar, K.; Mahajan, A.; Sable, N.; Bhargava, P. Magnetic Resonance Imaging of Pelvic Masses: A Compartmental Approach. Semin. Ultrasound CT MRI 2017, 38, 213–230. [Google Scholar] [CrossRef]
- Jiang, Z.X.; Zhang, S.J.; Peng, W.J.; Yu, B.H. Rectal gastrointestinal stromal tumors: Imaging features with clinical and pathological correlation. World J. Gastroenterol. 2013, 19, 3108–3116. [Google Scholar] [CrossRef]
- Vijayakumar, S.; Serur, E.; Bybordi, B.; Lakhi, N. Primary gynecological non-Hodgkin’s lymphoma: A differential diagnosis of a pelvic mass. Gynecol Oncol Rep 2016, 18, 29–31. [Google Scholar] [CrossRef]
- Yassaee, F.; Hosseini, S. Pelvic lymphoma: An unusual presentation. J. Res. Med. Sci. 2011, 16, 1382–1385. [Google Scholar] [PubMed]
- Williams, M.P.; Olliff, J.F. Magnetic resonance imaging in extranodal pelvic lymphoma. Clin. Radiol. 1990, 42, 264–268. [Google Scholar] [CrossRef]
- Hassan, I.; Wietfeldt, E.D. Presacral tumors: Diagnosis and management. Clin. Colon Rectal Surg. 2009, 22, 84–93. [Google Scholar] [CrossRef] [PubMed] [Green Version]
- Pappalardo, G.; Frattaroli, F.M.; Casciani, E.; Moles, N.; Mascagni, D.; Spoletini, D.; Fanello, G.; Gualdi, G. Retrorectal tumors: The choice of surgical approach based on a new classification. Am. Surg. 2009, 75, 240–248. [Google Scholar] [CrossRef] [PubMed]
- Reiter, M.J.; Schwope, R.B.; Bui-Mansfield, L.T.; Lisanti, C.J.; Glasgow, S.C. Surgical management of retrorectal lesions: What the radiologist needs to know. Am. J. Roentgenol. 2015, 204, 386–395. [Google Scholar] [CrossRef]
- Killingsworth, C.; Gadacz, T.R. Tailgut cyst (retrorectal cystic hamartoma): Report of a case and review of the literature. Am. Surg. 2005, 71, 666–673. [Google Scholar] [CrossRef] [PubMed]
- Faria, S.C.; Elsherif, S.B.; Sagebiel, T.; Cox, V.; Rao, B.; Lall, C.; Bhosale, P.R. Ischiorectal fossa: Benign and malignant neoplasms of this “ignored” radiological anatomical space. Abdom. Radiol. 2019, 44, 1644–1674. [Google Scholar] [CrossRef]
- Yang, D.M.; Jung, D.H.; Kim, H.; Kang, J.H.; Kim, S.H.; Kim, J.H.; Hwang, H.Y. Retroperitoneal cystic masses: CT, clinical, and pathologic findings and literature review. Radiographics 2004, 24, 1353–1365. [Google Scholar] [CrossRef]
- Mathis, K.L.; Dozois, E.J.; Grewal, M.S.; Metzger, P.; Larson, D.W.; Devine, R.M. Malignant risk and surgical outcomes of presacral tailgut cysts. Br. J. Surg. 2010, 97, 575–579. [Google Scholar] [CrossRef]
- Hain, K.S.; Pickhardt, P.J.; Lubner, M.G.; Menias, C.O.; Bhalla, S. Presacral masses: Multimodality imaging of a multidisciplinary space. Radiographics 2013, 33, 1145–1167. [Google Scholar] [CrossRef] [Green Version]
- Beattie, C.H.; Garvey, C.J.; Hershman, M.J. Endorectal magnetic resonance imaging of a rectal duplication cyst. Br. J. Radiol. 1999, 72, 896–898. [Google Scholar] [CrossRef]
- Foshager, M.C.; Hood, L.L.; Walsh, J.W. Masses simulating gynecologic diseases at CT and MR imaging. Radiographics 1996, 16, 1085–1099. [Google Scholar] [CrossRef] [PubMed]
- Dahan, H.; Arrivé, L.; Wendum, D.; Docou le Pointe, H.; Djouhri, H.; Tubiana, J.M. Retrorectal developmental cysts in adults: Clinical and radiologic-histopathologic review, differential diagnosis, and treatment. Radiographics 2001, 21, 575–584. [Google Scholar] [CrossRef] [PubMed]
- Fattori, R.; Nienaber, C.A.; Descovich, B.; Ambrosetto, P.; Reggiani, L.B.; Pepe, G.; Kaufmann, U.; Negrini, E.; von Kodolitsch, Y.; Gensini, G.F. Importance of dural ectasia in phenotypic assessment of Marfan’s syndrome. Lancet 1999, 354, 910–913. [Google Scholar] [CrossRef]
- Rajiah, P.; Sinha, R.; Cuevas, C.; Dubinsky, T.J.; Bush, W.H., Jr.; Kolokythas, O. Imaging of uncommon retroperitoneal masses. Radiographics 2011, 31, 949–976. [Google Scholar] [CrossRef]
- Hoarau, N.; Slim, K.; Da Ines, D. CT and MR imaging of retroperitoneal schwannoma. Diagn. Interv. Imaging 2013, 94, 1133–1139. [Google Scholar] [CrossRef] [Green Version]
- Scali, E.P.; Chandler, T.M.; Heffernan, E.J.; Coyle, J.; Harris, A.C.; Chang, S.D. Primary retroperitoneal masses: What is the differential diagnosis? Abdom. Imaging 2015, 40, 1887–1903. [Google Scholar] [CrossRef] [PubMed]
- Rha, S.E.; Byun, J.Y.; Jung, S.E.; Chun, H.J.; Lee, H.G.; Lee, J.M. Neurogenic tumors in the abdomen: Tumor types and imaging characteristics. Radiographics 2003, 23, 29–43. [Google Scholar] [CrossRef] [PubMed]
- Ji, X.K.; Zheng, X.W.; Wu, X.L.; Yu, Z.P.; Shan, Y.F.; Zhang, Q.Y.; Zeng, Q.Q. Diagnosis and surgical treatment of retroperitoneal paraganglioma: A single-institution experience of 34 cases. Oncol. Lett. 2017, 14, 2268–2280. [Google Scholar] [CrossRef] [PubMed] [Green Version]
- Hahn, P.F.; Saini, S.; Stark, D.D.; Papanicolaou, N.; Ferrucci, J.T., Jr. Intraabdominal hematoma: The concentric-ring sign in MR imaging. Am. J. Roentgenol. 1987, 148, 115–119. [Google Scholar] [CrossRef] [PubMed] [Green Version]
- Titton, R.L.; Gervais, D.A.; Hahn, P.F.; Harisinghani, M.G.; Arellano, R.S.; Mueller, P.R. Urine leaks and urinomas: Diagnosis and imaging-guided intervention. Radiographics 2003, 23, 1133–1147. [Google Scholar] [CrossRef] [PubMed] [Green Version]


Publisher’s Note: MDPI stays neutral with regard to jurisdictional claims in published maps and institutional affiliations. |
© 2022 by the authors. Licensee MDPI, Basel, Switzerland. This article is an open access article distributed under the terms and conditions of the Creative Commons Attribution (CC BY) license (https://creativecommons.org/licenses/by/4.0/).
Share and Cite
Elsherif, S.B.; Agely, A.; Gopireddy, D.R.; Ganeshan, D.; Hew, K.E.; Sharma, S.; Lall, C. Mimics and Pitfalls of Primary Ovarian Malignancy Imaging. Tomography 2022, 8, 100-119. https://0-doi-org.brum.beds.ac.uk/10.3390/tomography8010009
Elsherif SB, Agely A, Gopireddy DR, Ganeshan D, Hew KE, Sharma S, Lall C. Mimics and Pitfalls of Primary Ovarian Malignancy Imaging. Tomography. 2022; 8(1):100-119. https://0-doi-org.brum.beds.ac.uk/10.3390/tomography8010009
Chicago/Turabian StyleElsherif, Sherif B., Ali Agely, Dheeraj R. Gopireddy, Dhakshinamoorthy Ganeshan, Karina E. Hew, Smita Sharma, and Chandana Lall. 2022. "Mimics and Pitfalls of Primary Ovarian Malignancy Imaging" Tomography 8, no. 1: 100-119. https://0-doi-org.brum.beds.ac.uk/10.3390/tomography8010009