
Impact of Particle Size on Toxicity, Tissue Distribution and Excretion Kinetics of Subchronic Intratracheal Instilled Silver Nanoparticles in Mice

 , , , , and
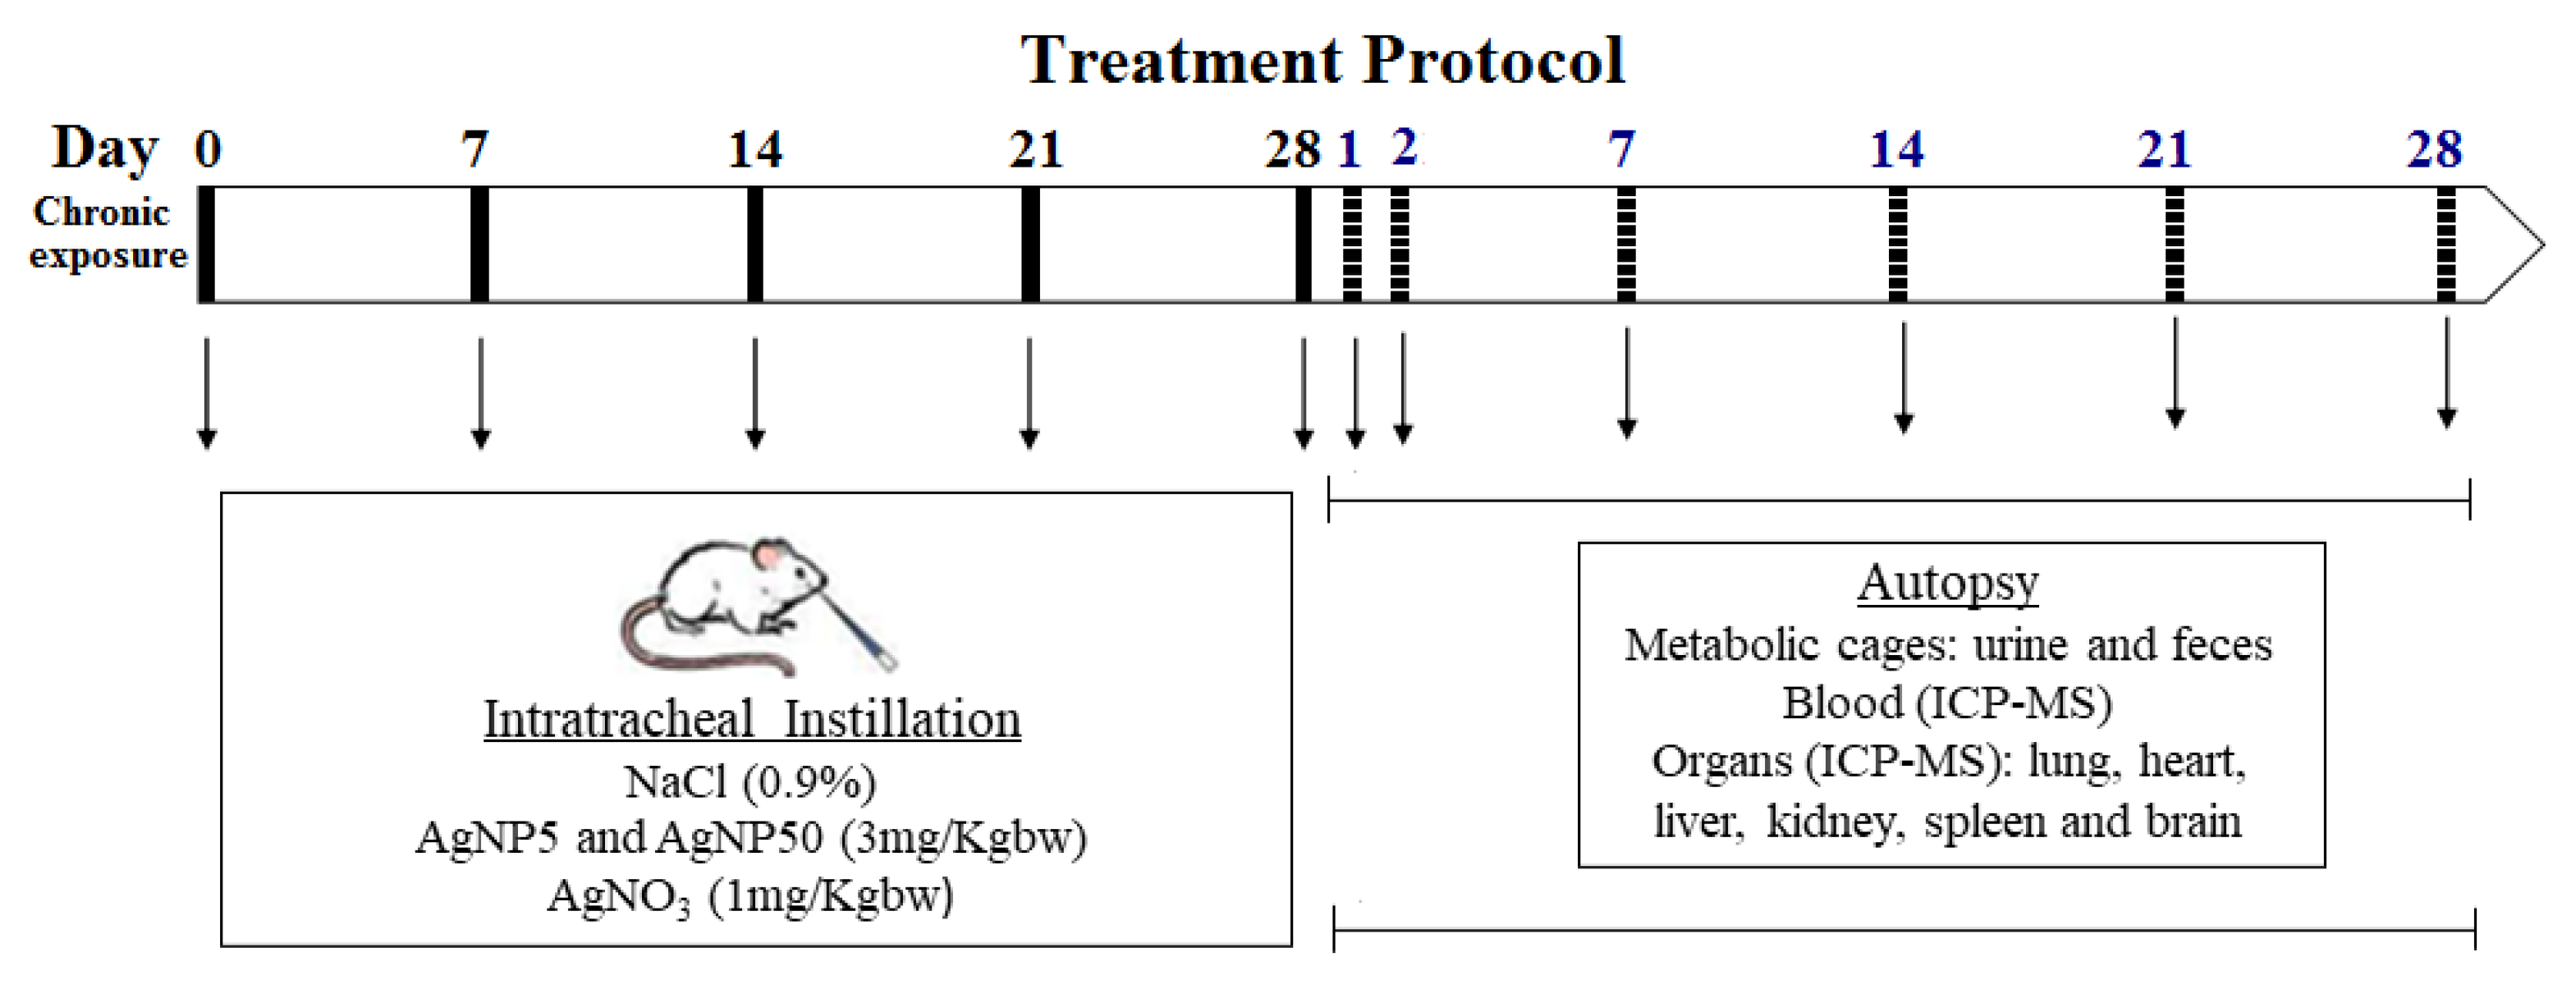
Abstract
:1. Introduction
2. Materials and Methods
2.1. AgNP and AgNO3 Treatments
2.2. Physicochemical Characterization of AgNPs
2.3. Mice
2.4. Study Groups and Dosing Regimen
2.5. Blood Collection and Analysis
2.6. Assessment of GSH and GSSG Levels
2.7. Silver Quantification Using ICP-MS
2.8. Modelling PBP Model
2.9. Statistical Analysis
3. Results
3.1. AgNPs Characterization
3.2. Mice Clinical Health Observations
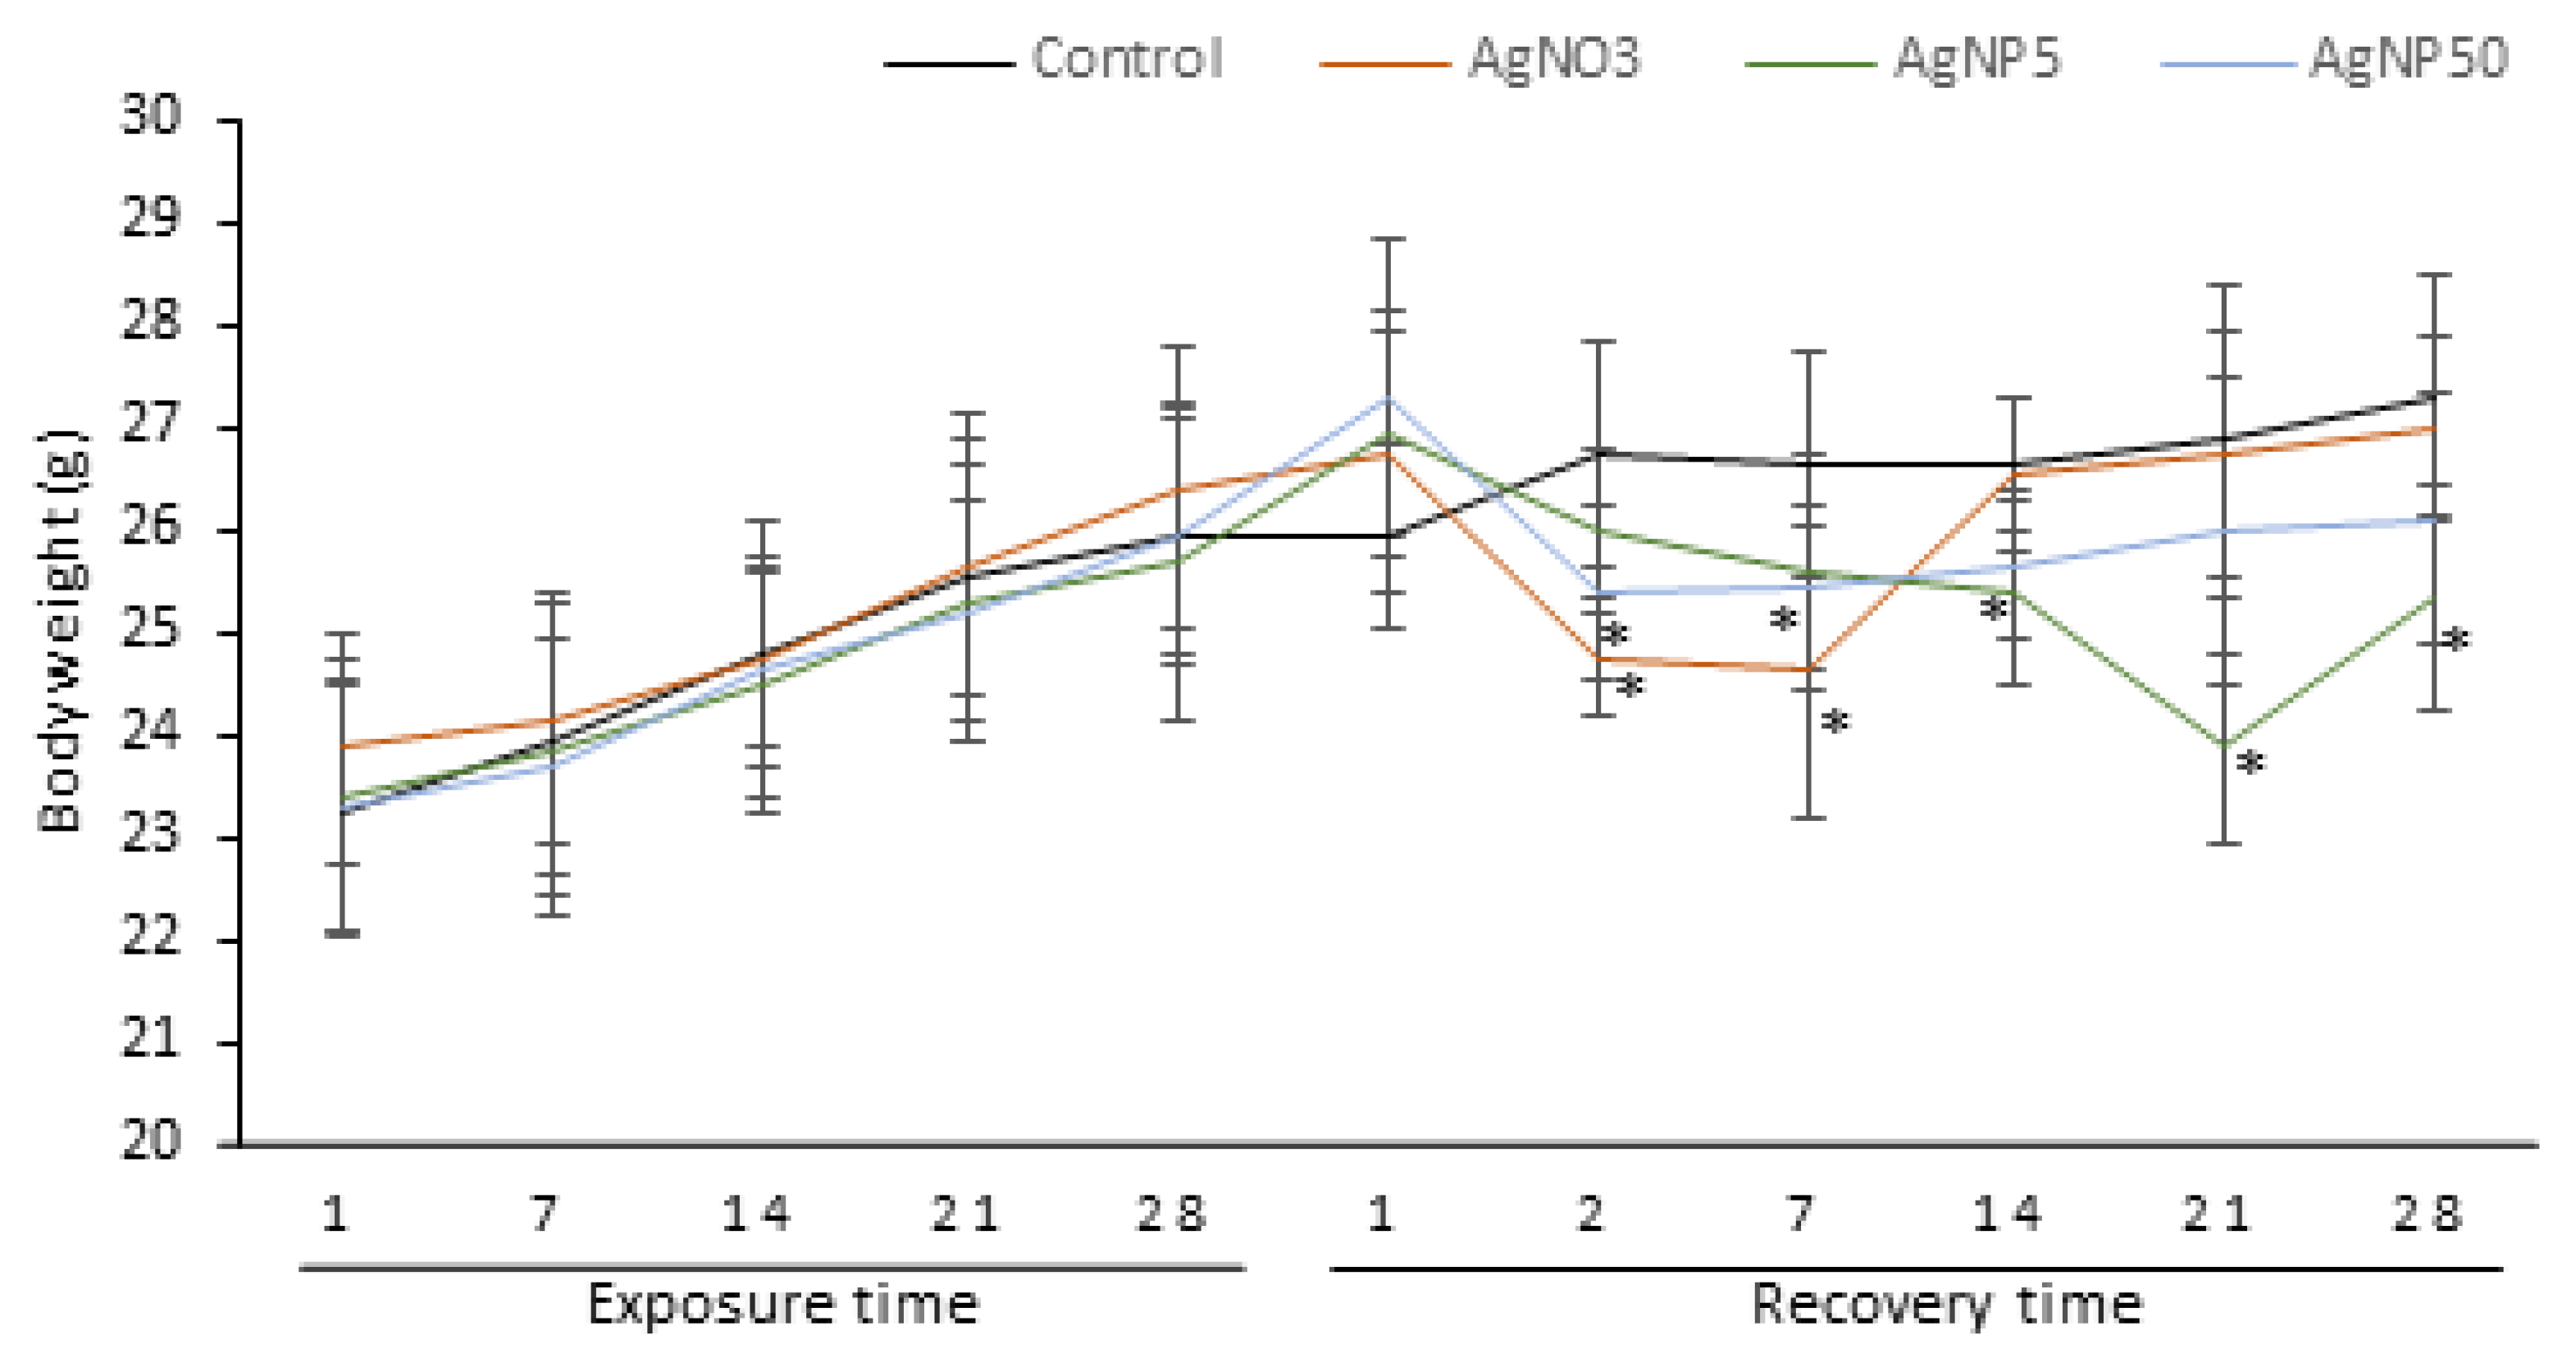
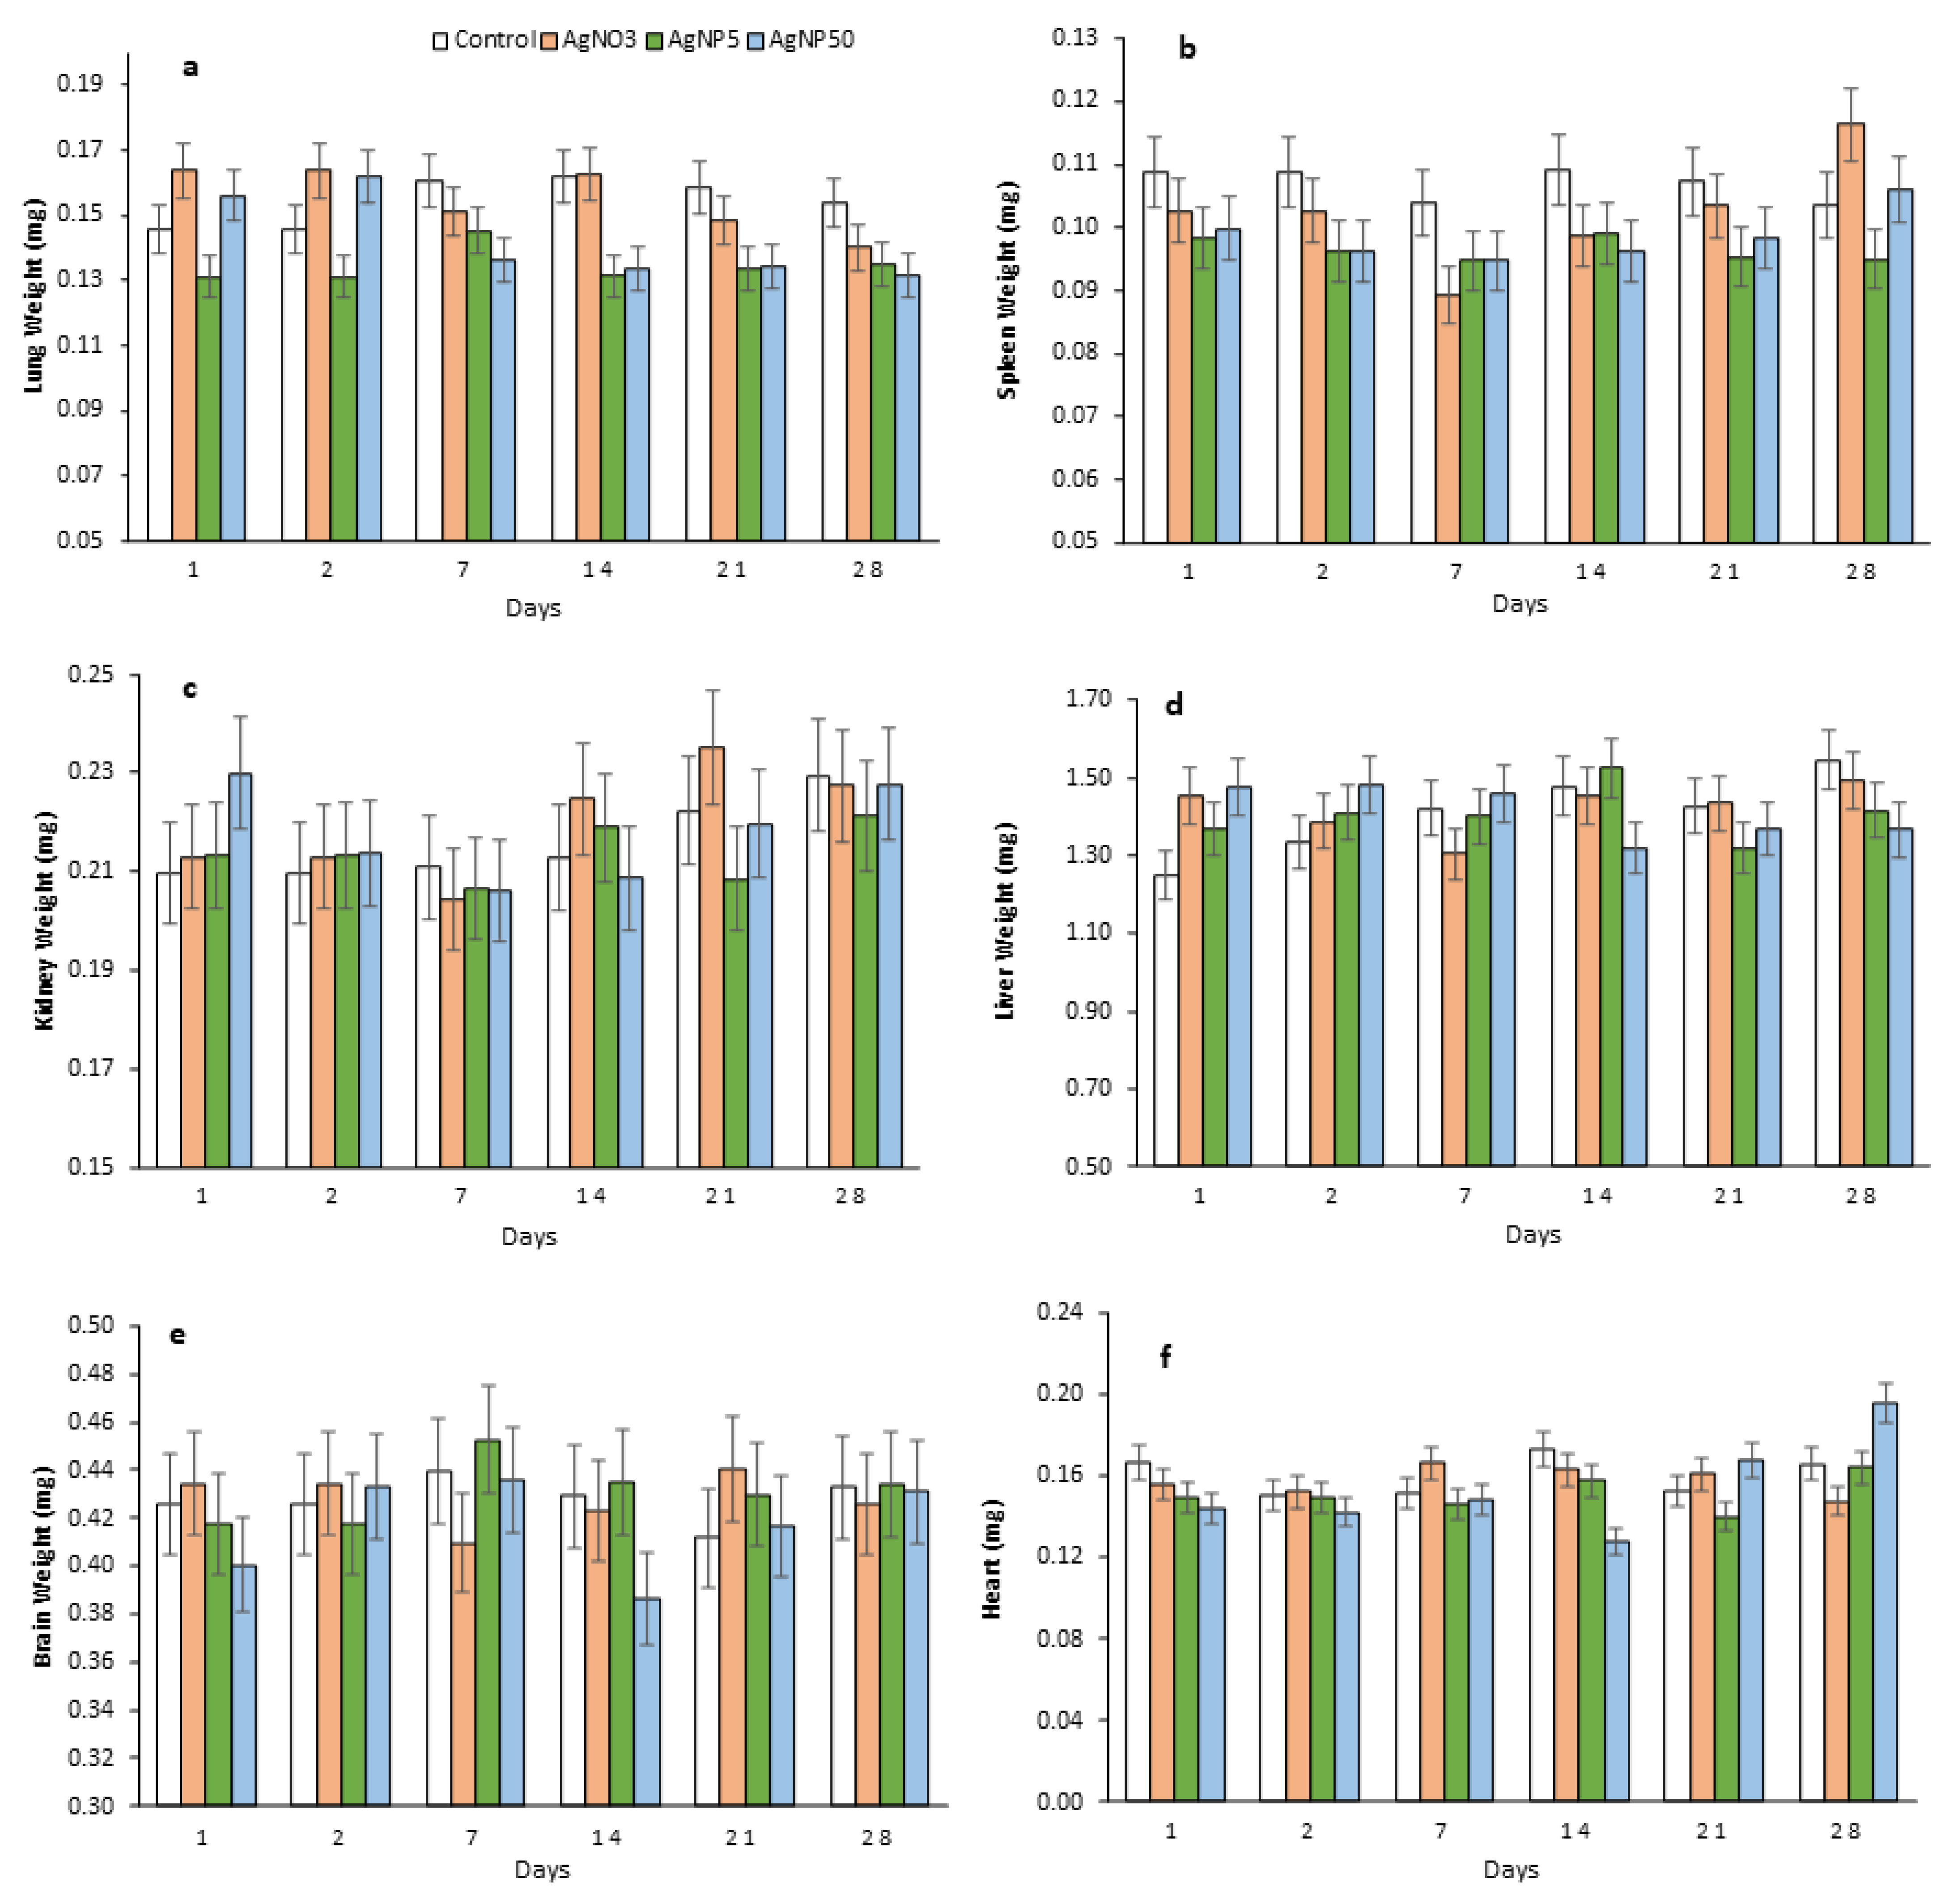
3.3. Body and Organ Weights
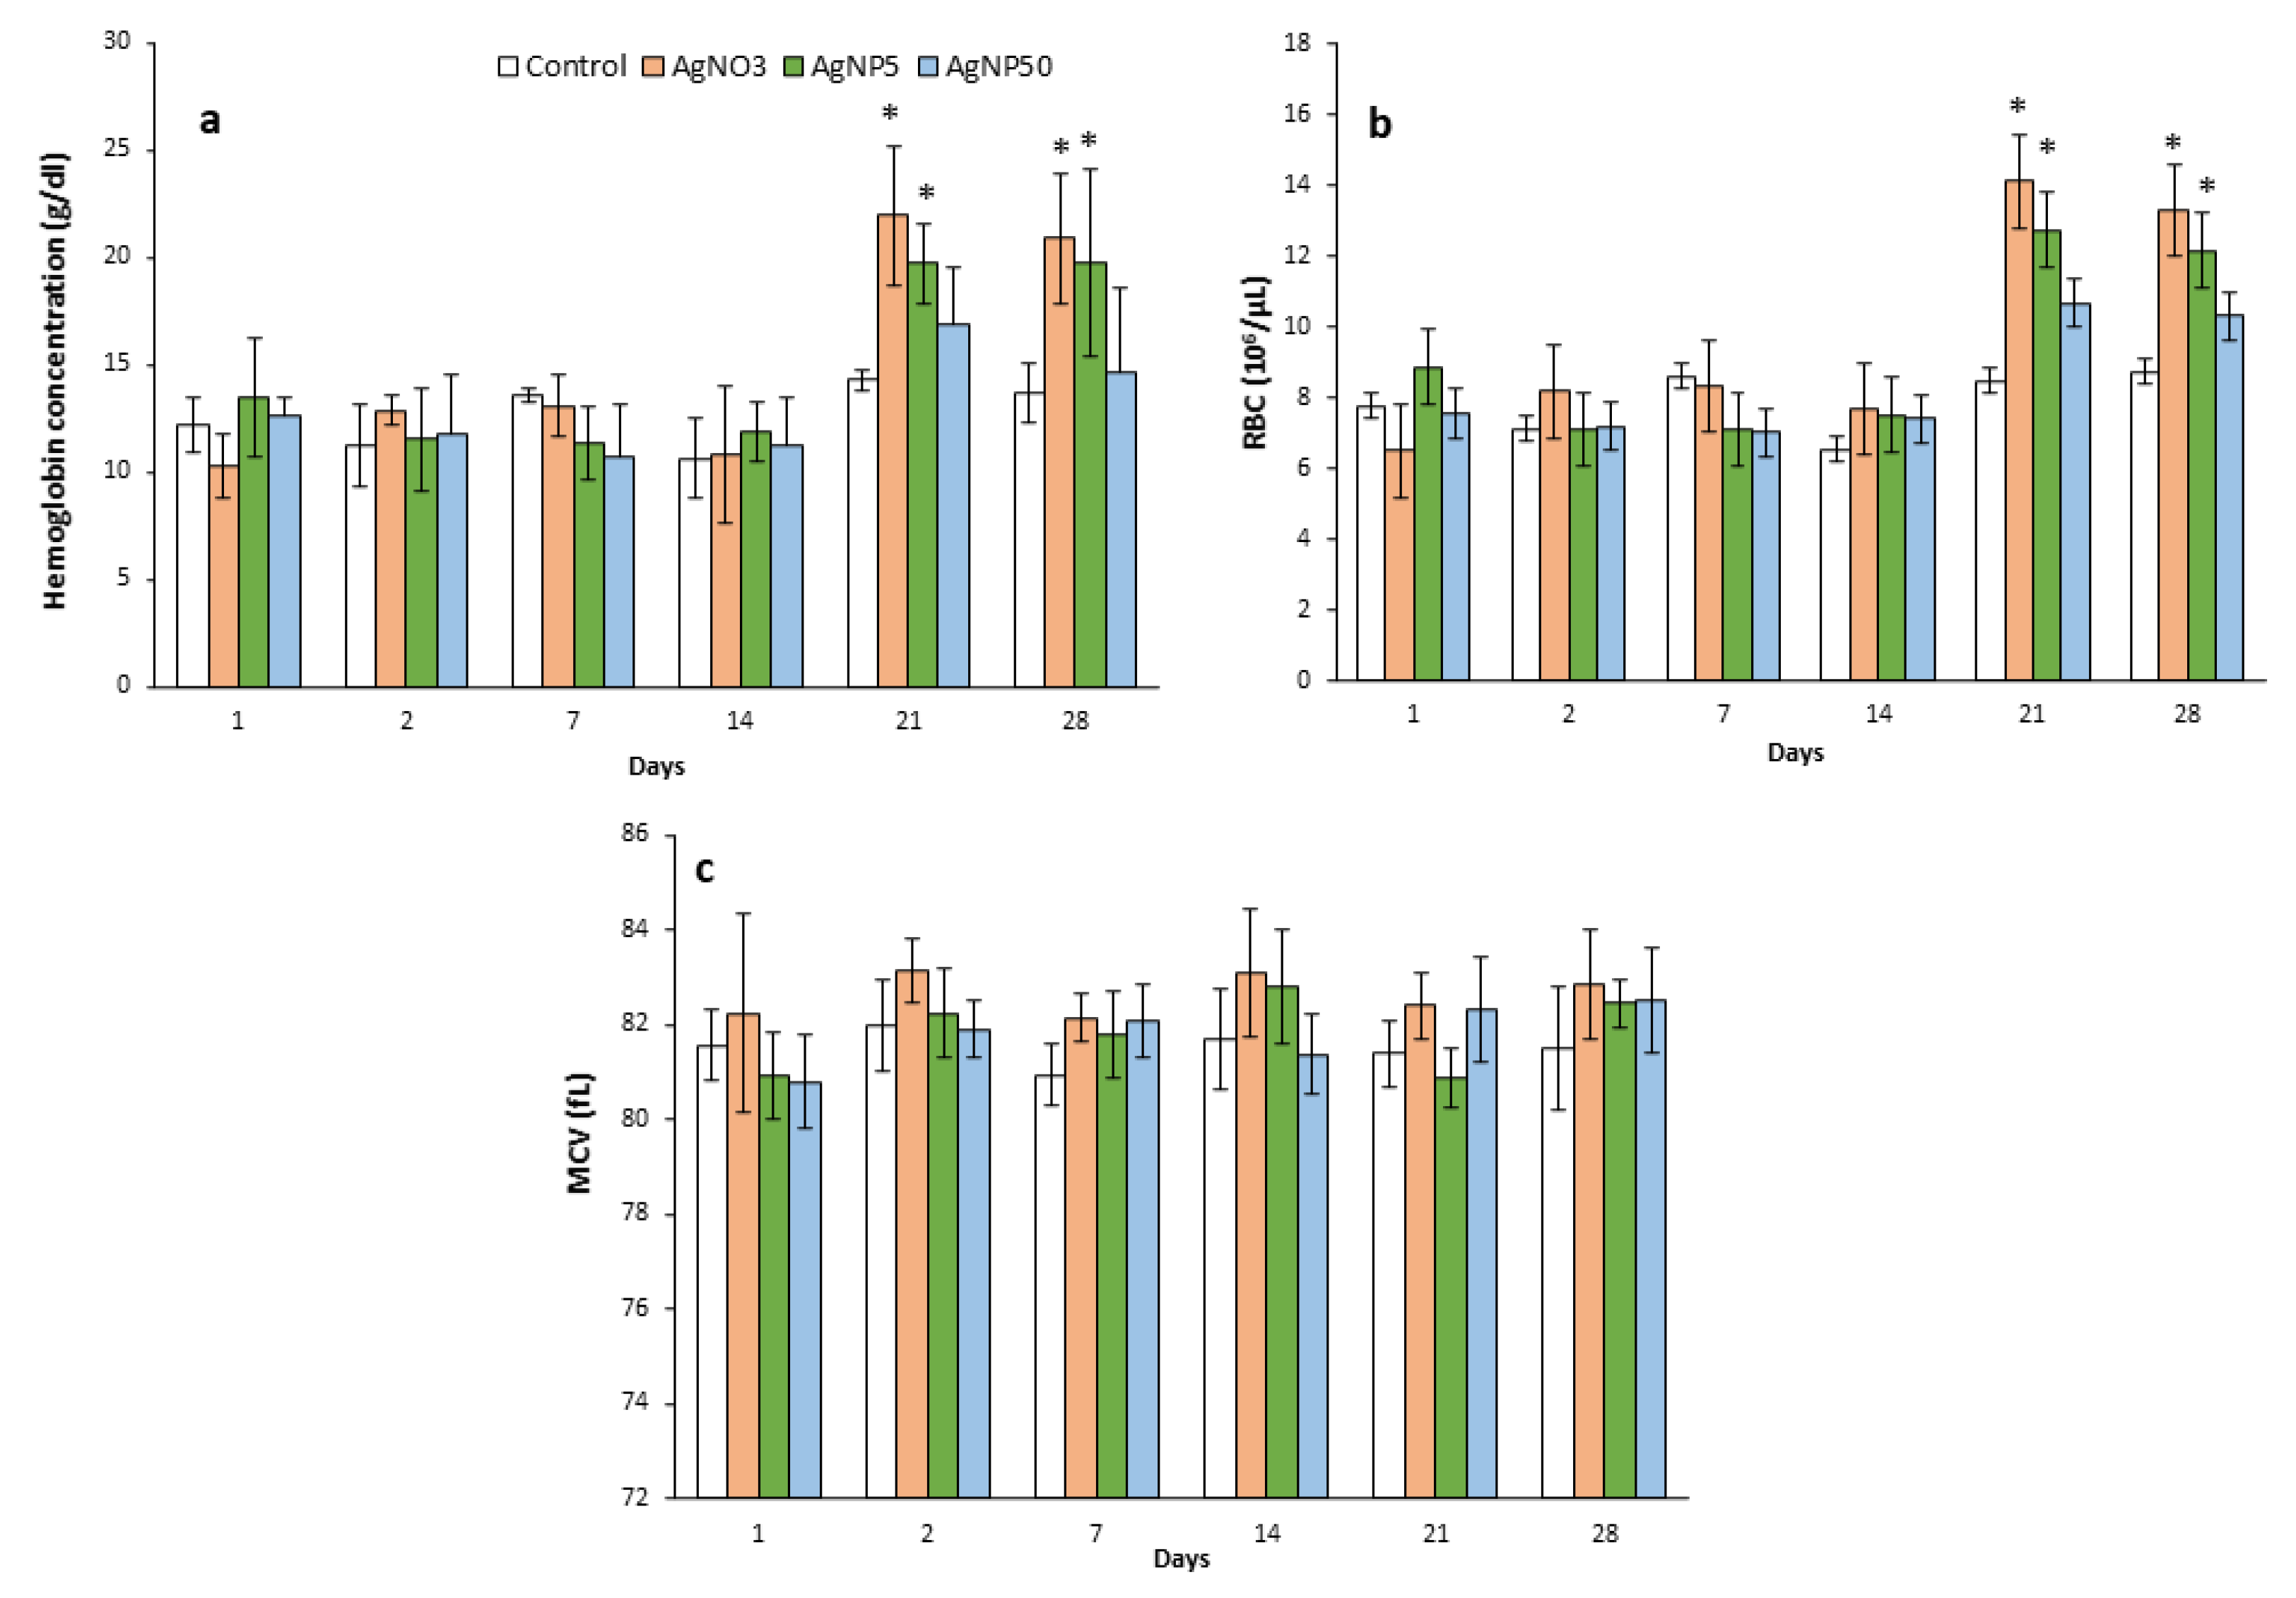
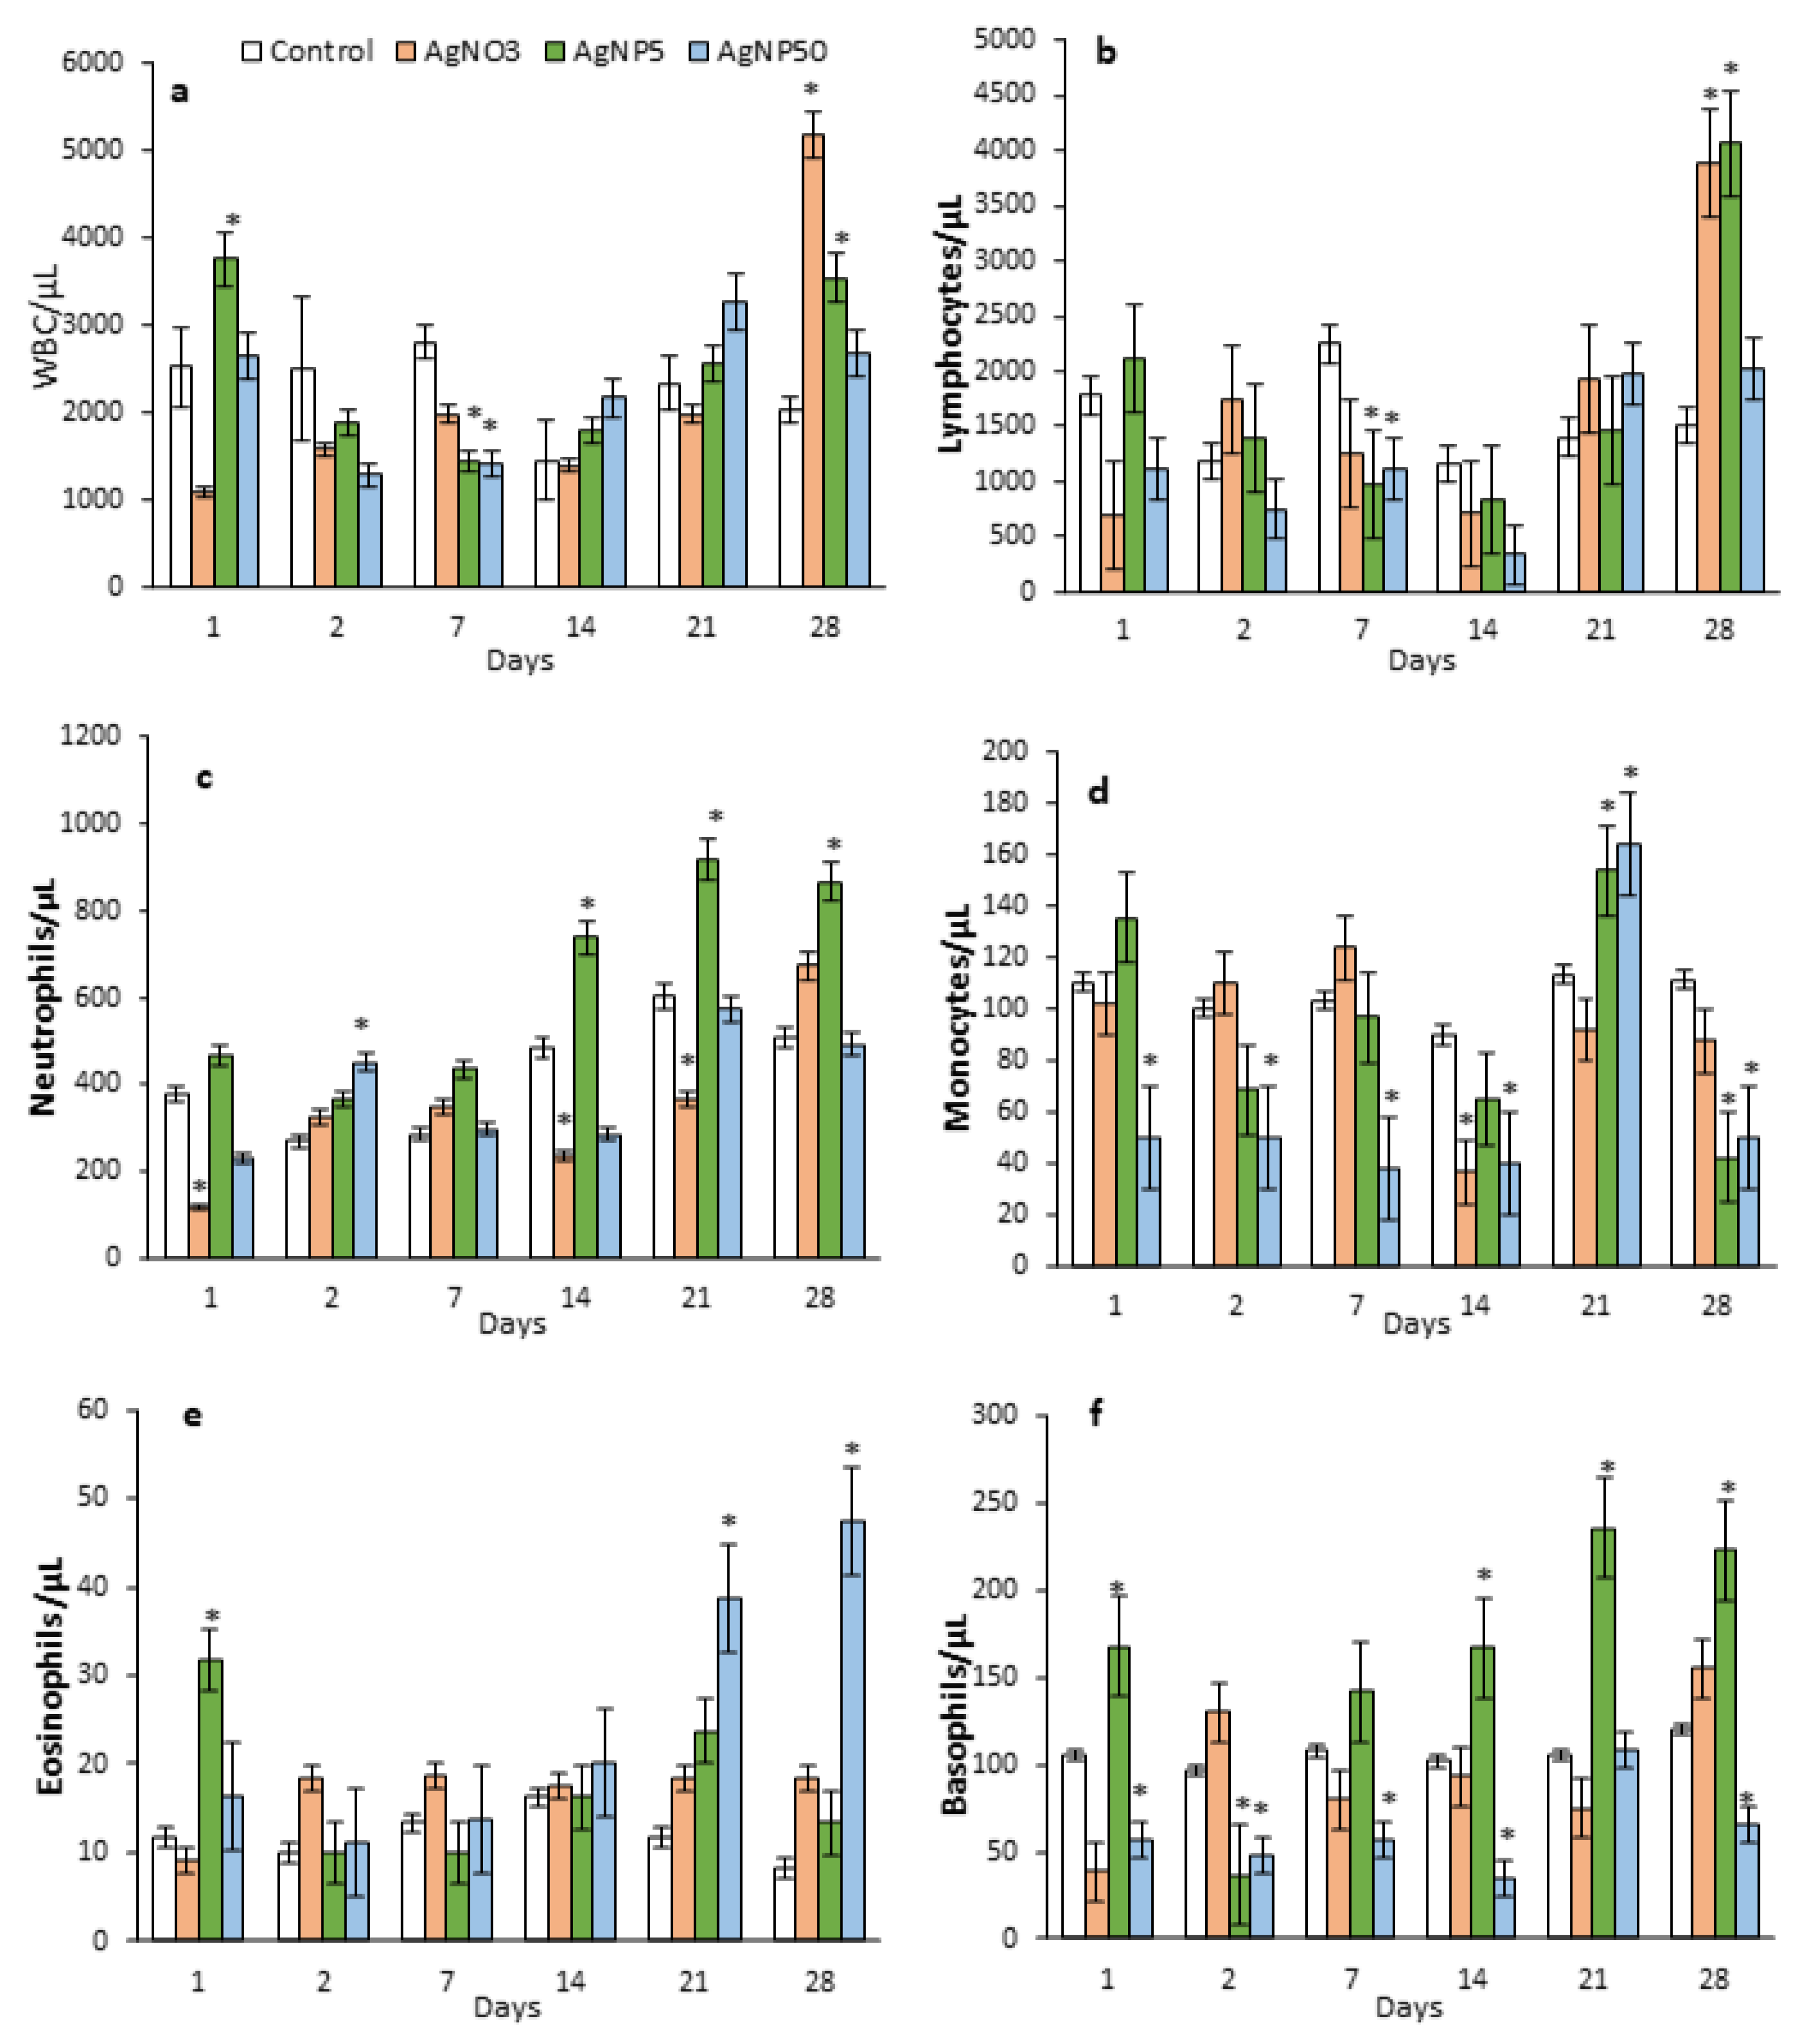
3.4. Blood Parameters
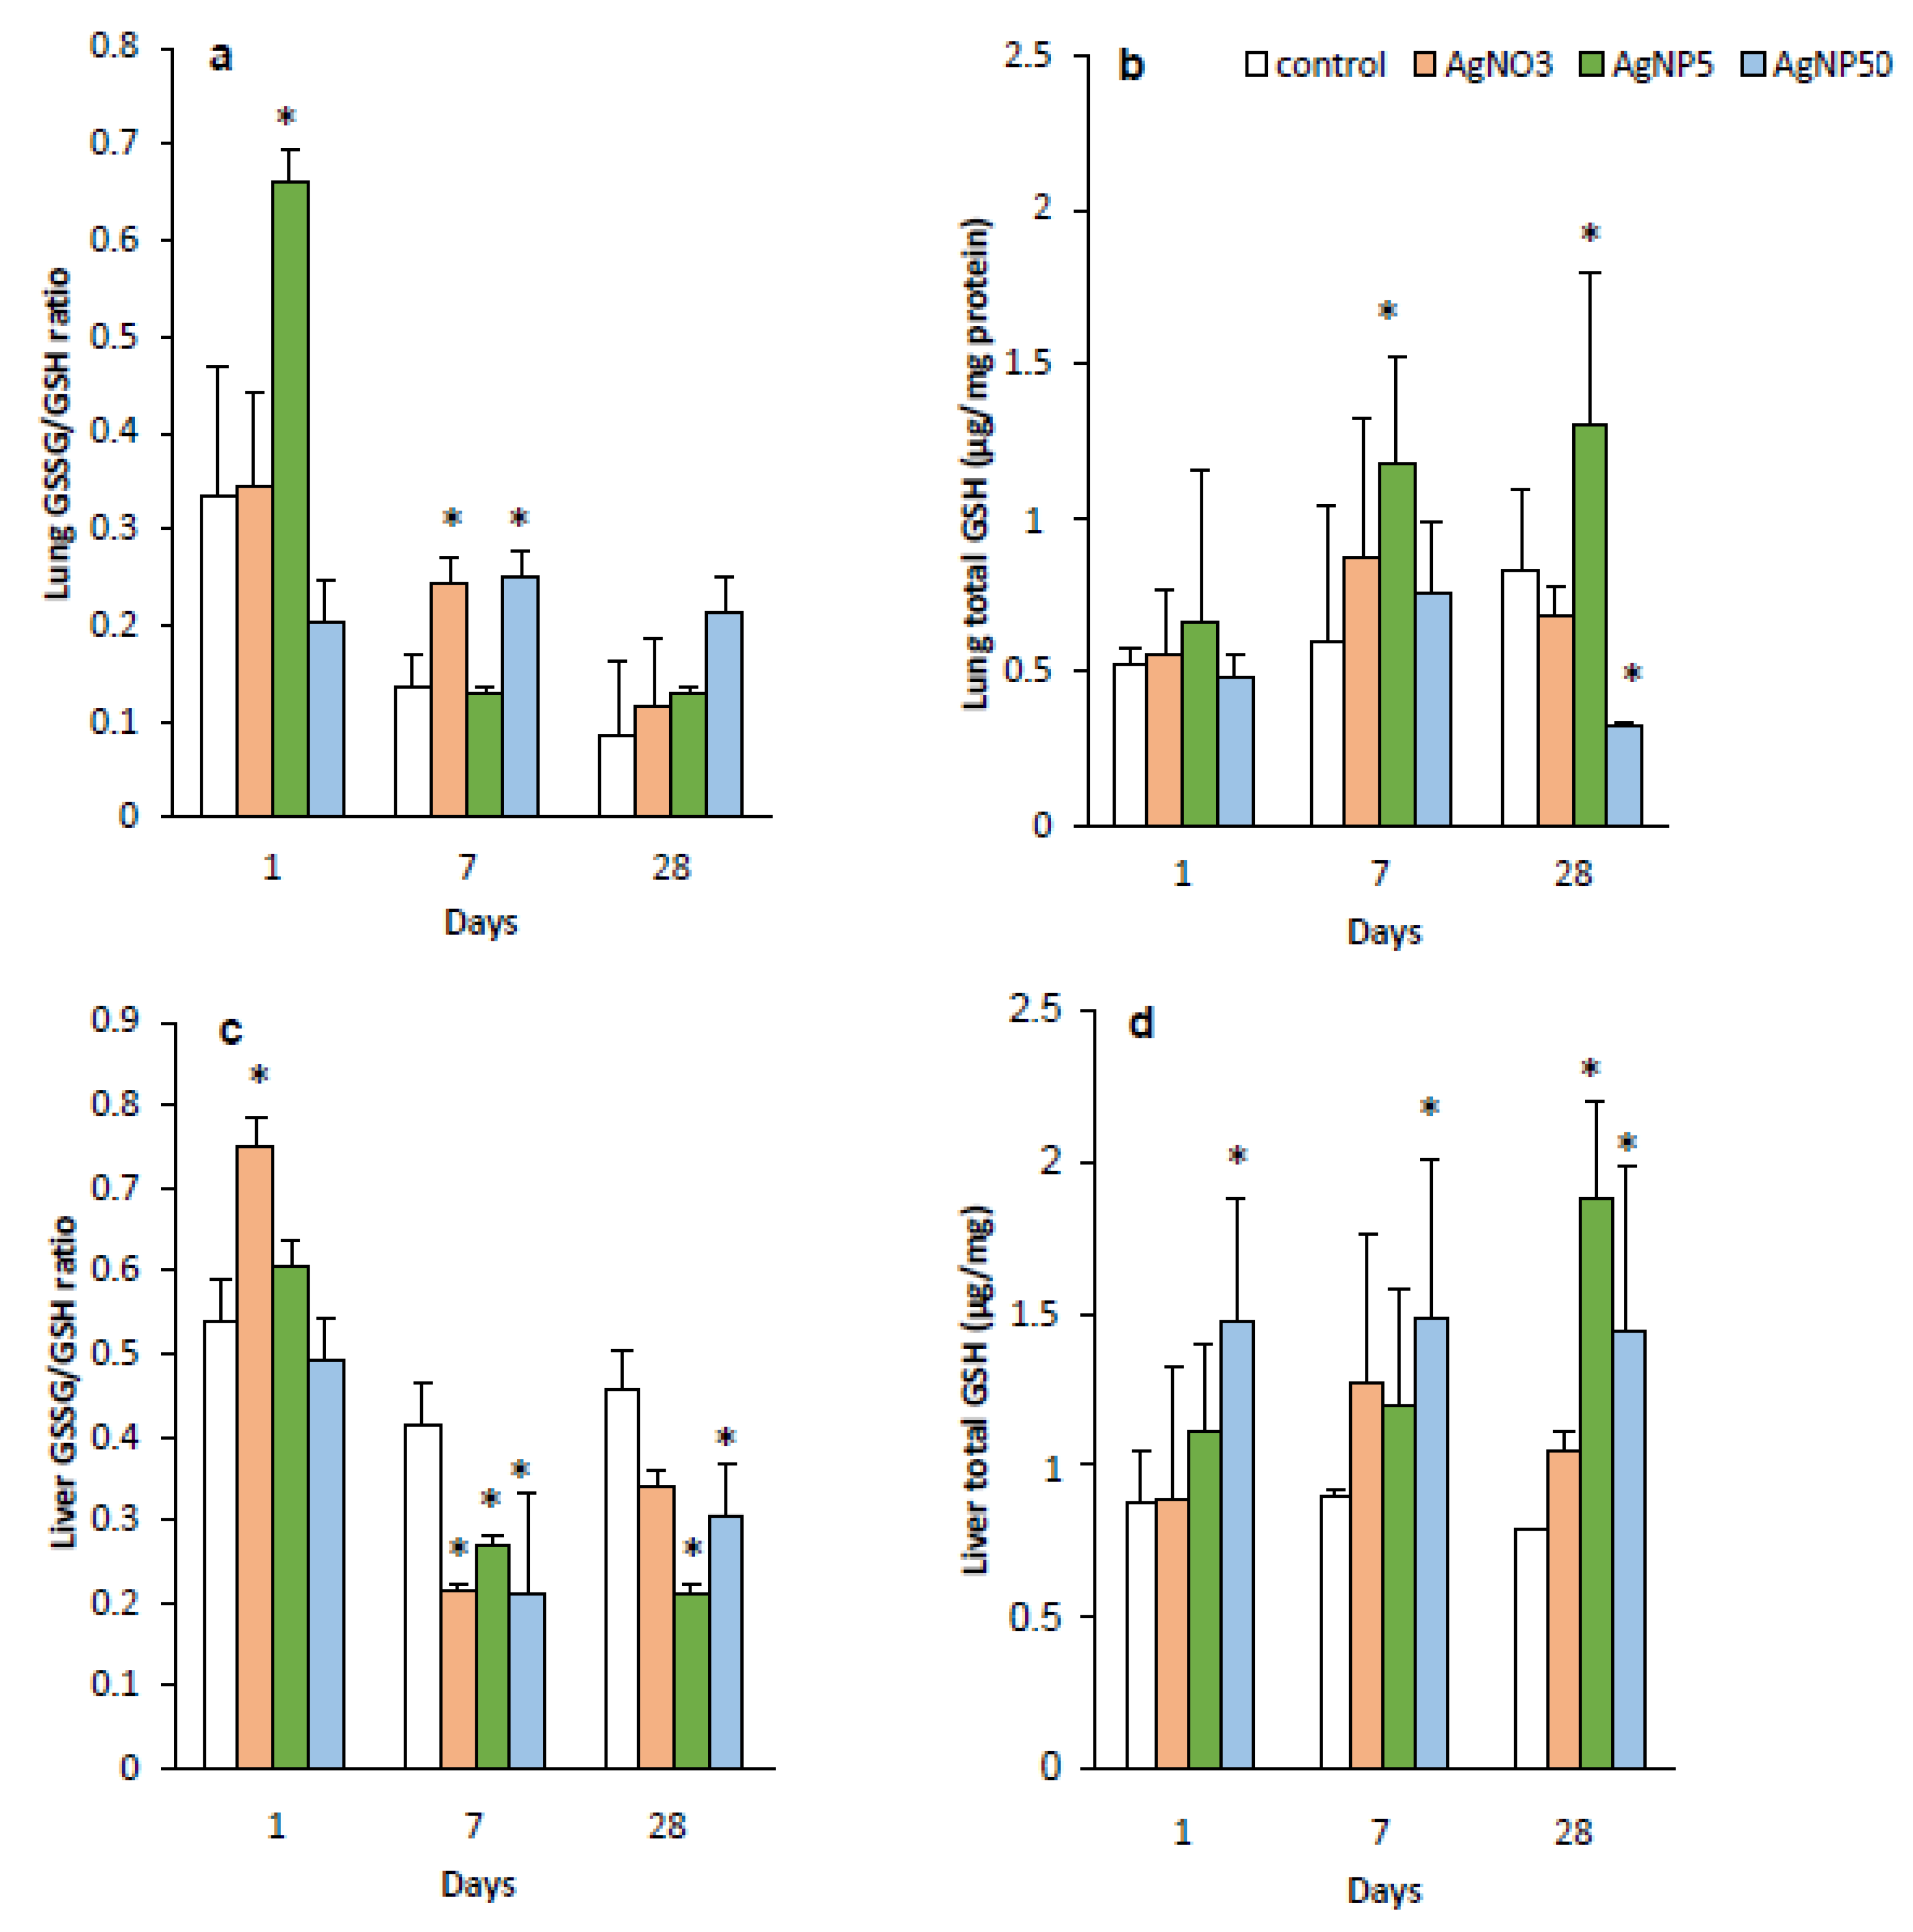
3.5. GSH and GSSG Levels
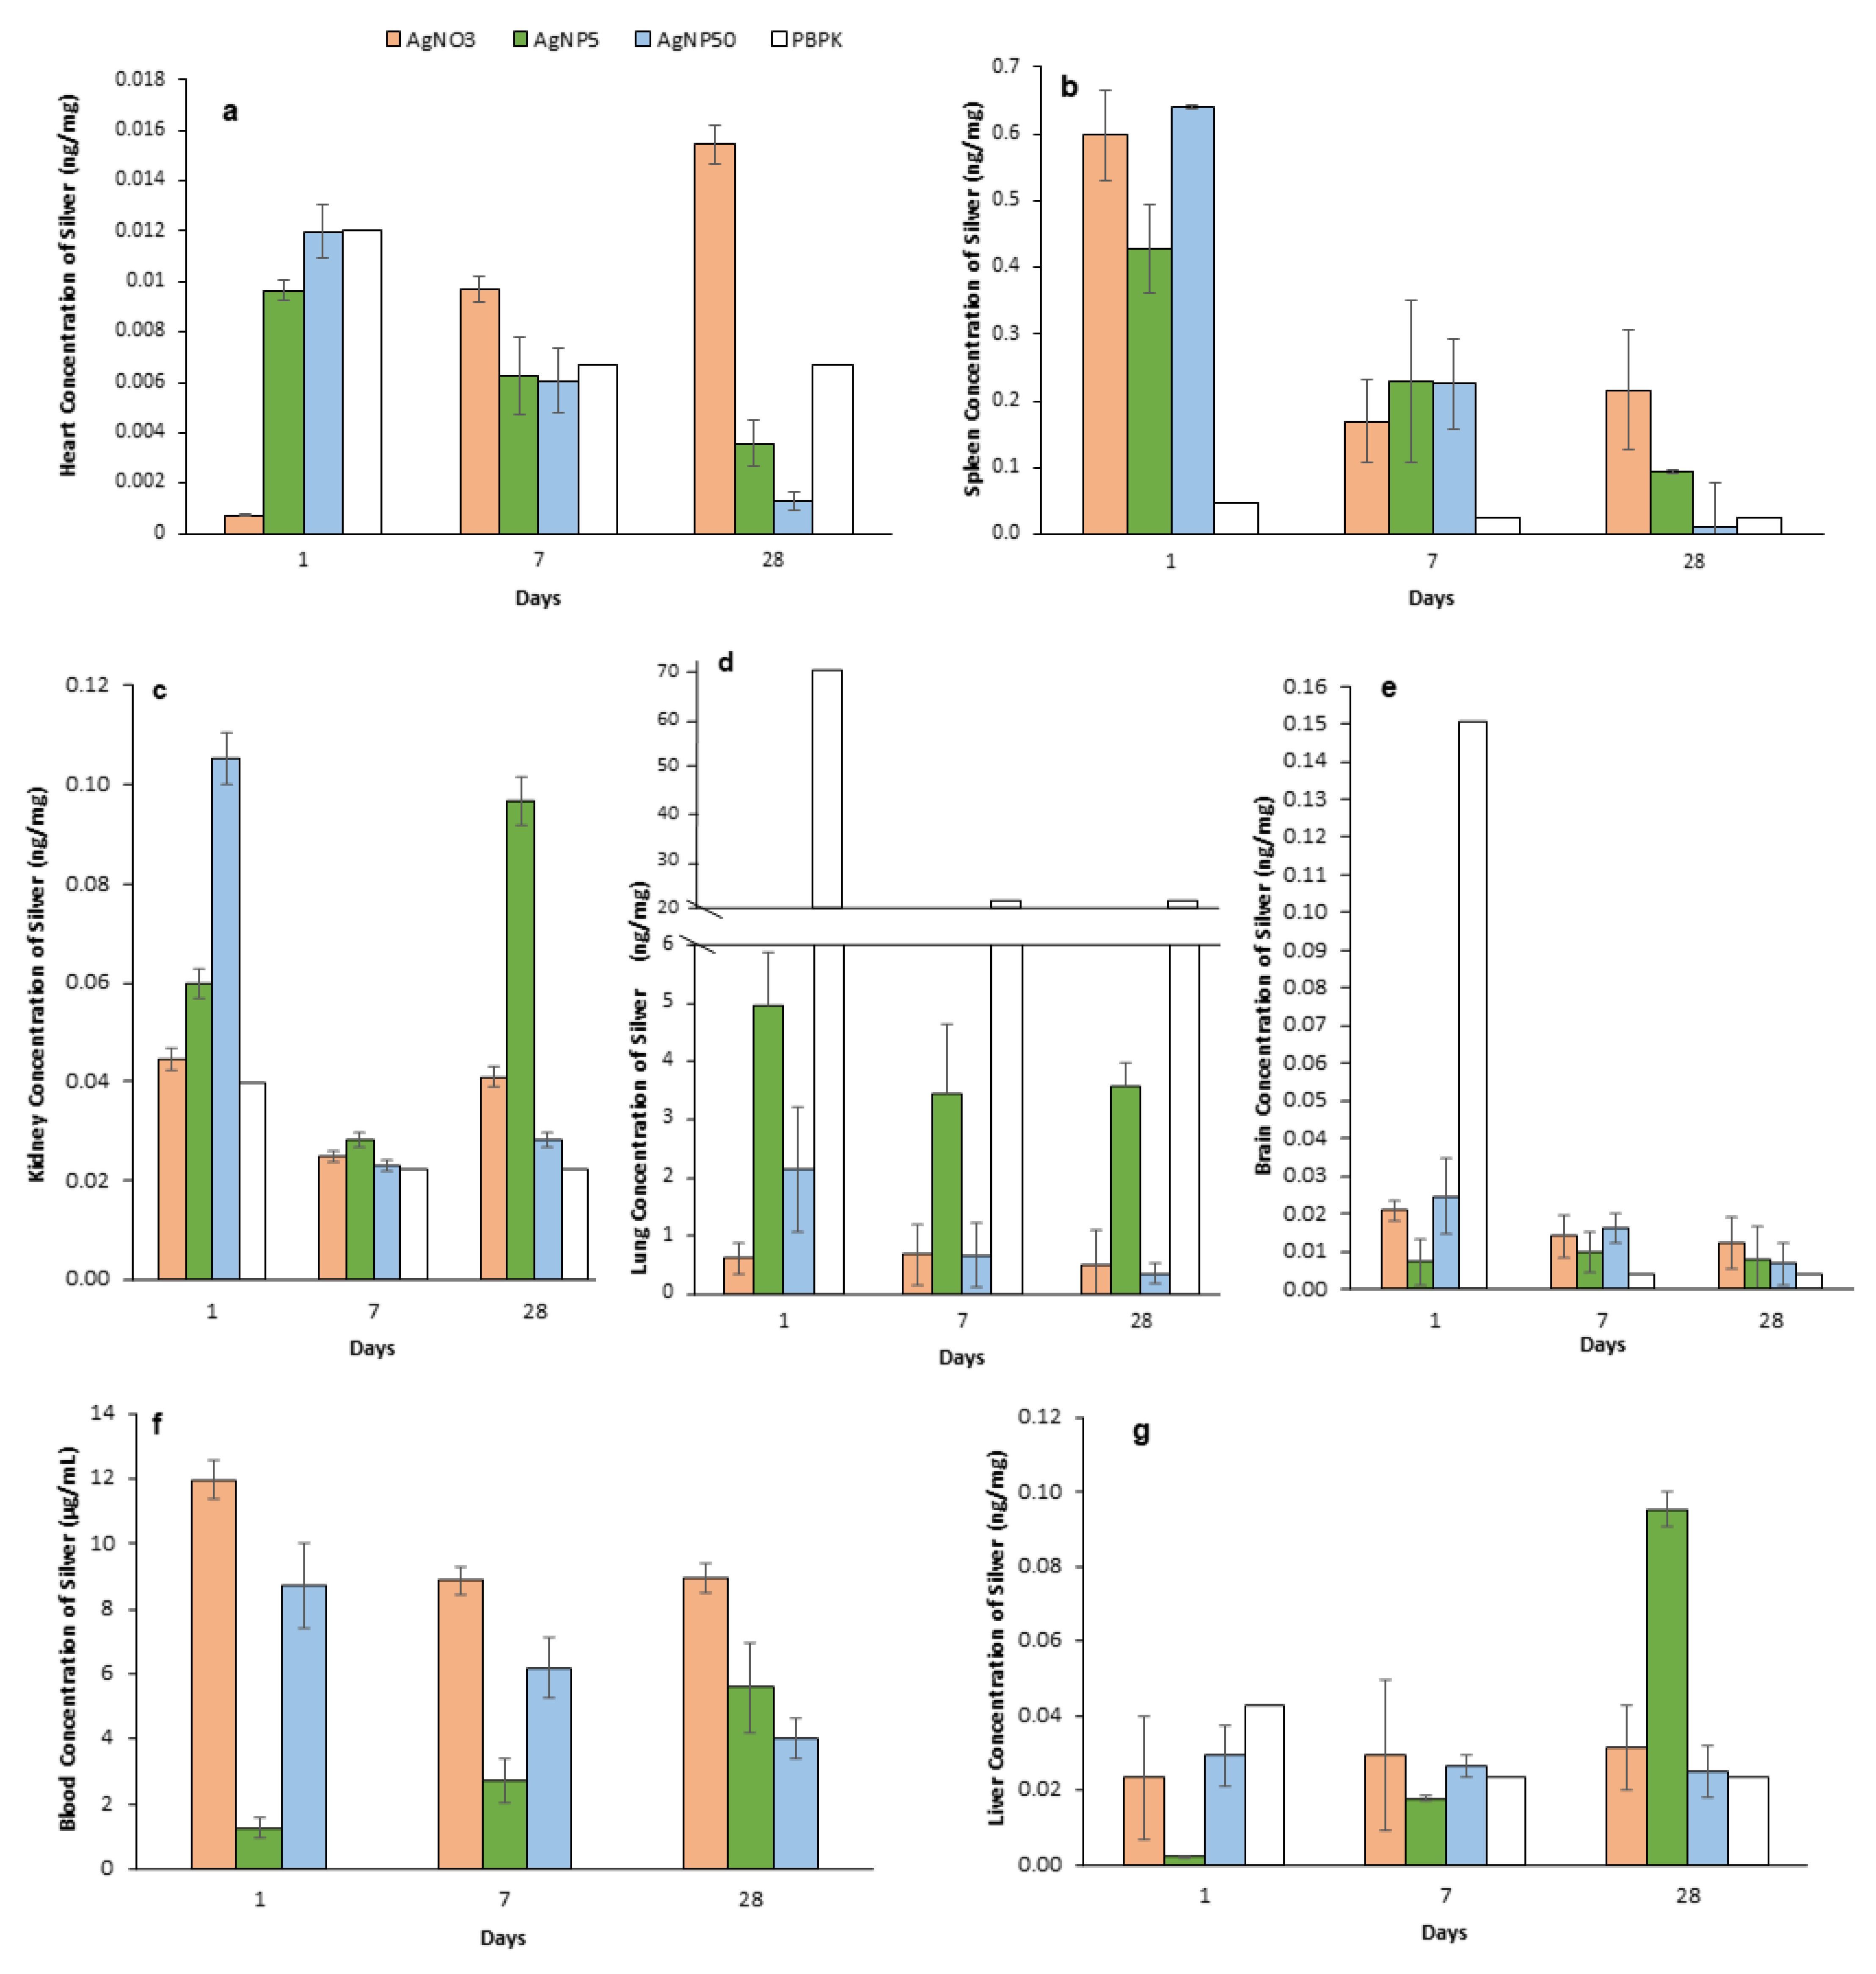
3.6. Biodistribution, Accumulation and Elimination of AgNPs
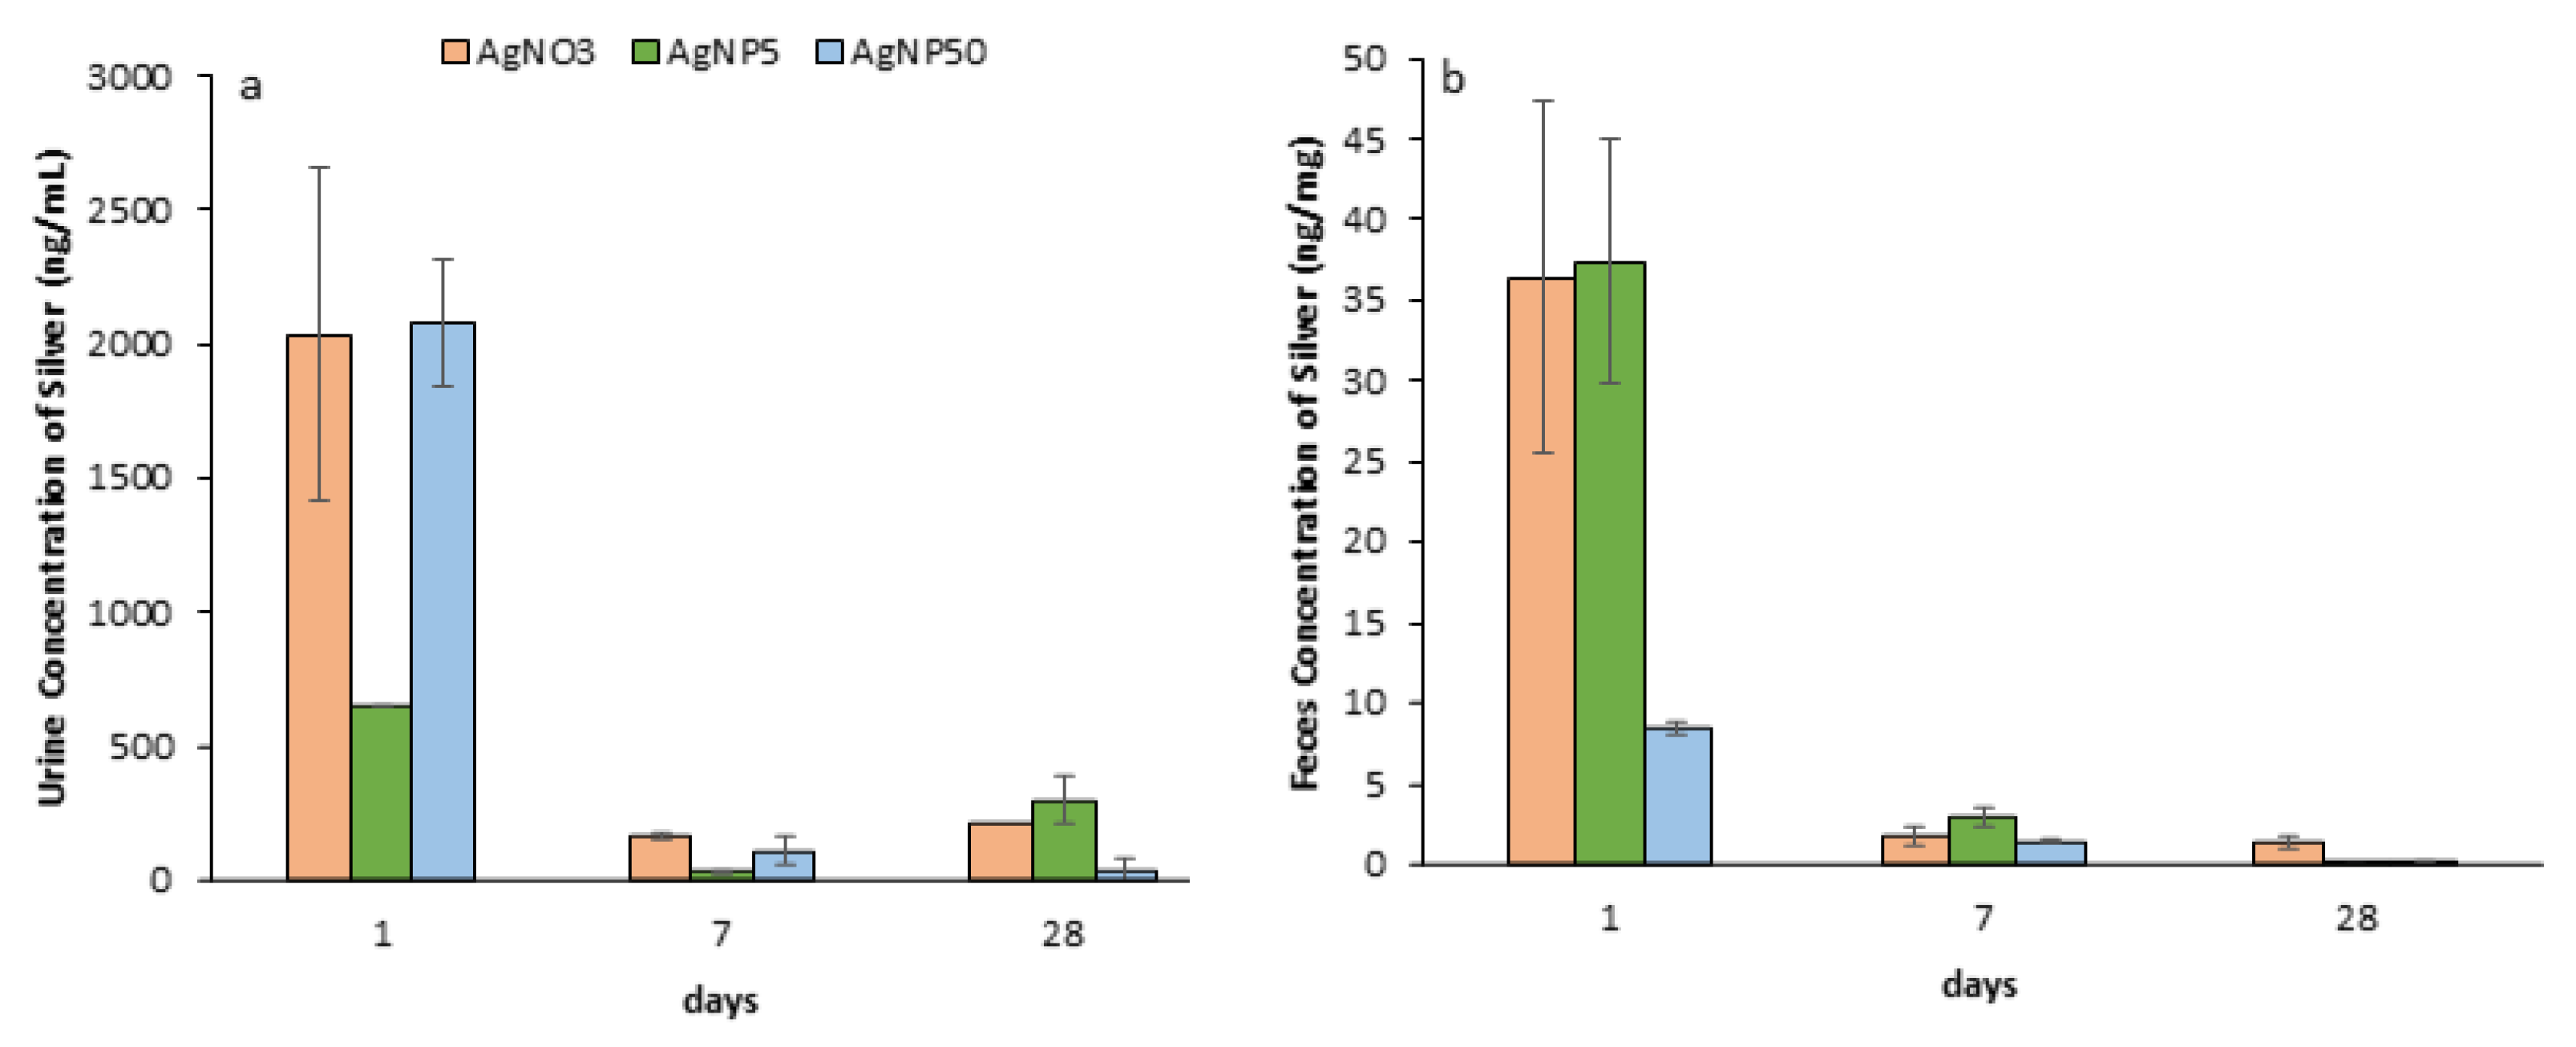
3.7. Excretion of AgNPs
3.8. PBPK Model
4. Discussion
5. Conclusions
Author Contributions
Funding
Institutional Review Board Statement
Informed Consent Statement
Data Availability Statement
Acknowledgments
Conflicts of Interest
References
- Wright, J.B.; Lam, K.; Hansen, D.; Burrell, R.E. Efficacy of Topical Silver against Fungal Burn Wound Pathogens. Am. J. Infect. Control 1999, 27, 344–350. [Google Scholar] [CrossRef]
- Kaweeteerawat, C.; Na Ubol, P.; Sangmuang, S.; Aueviriyavit, S.; Maniratanachote, R. Mechanisms of Antibiotic Resistance in Bacteria Mediated by Silver Nanoparticles. J. Toxicol. Environ. Health Part A 2017, 80, 1276–1289. [Google Scholar] [CrossRef] [PubMed]
- Percival, S.L.; Bowler, P.G.; Dolman, J. Antimicrobial Activity of Silver-Containing Dressings on Wound Microorganisms Using an in Vitro Biofilm Model. Int. Wound J. 2007, 4, 186–191. [Google Scholar] [CrossRef] [PubMed]
- Wijnhoven, S.W.P.; Peijnenburg, W.J.G.M.; Herberts, C.A.; Hagens, W.I.; Oomen, A.G.; Heugens, E.H.W.; Roszek, B.; Bisschops, J.; Gosens, I.; Van De Meent, D.; et al. Nano-Silver—A Review of Available Data and Knowledge Gaps in Human and Environmental Risk Assessment. Nanotoxicology 2009, 3, 109–138. [Google Scholar] [CrossRef]
- Sun, R.W.-Y.; Chen, R.; Chung, N.P.-Y.; Ho, C.-M.; Lin, C.-L.S.; Che, C.-M. Silver Nanoparticles Fabricated in Hepes Buffer Exhibit Cytoprotective Activities toward HIV-1 Infected Cells. Chem. Commun. 2005, 40, 5059–5061. [Google Scholar] [CrossRef] [PubMed]
- Nadworny, P.L.; Wang, J.; Tredget, E.E.; Burrell, R.E. Anti-Inflammatory Activity of Nanocrystalline Silver-Derived Solutions in Porcine Contact Dermatitis. J. Inflamm. 2010, 7, 13. [Google Scholar] [CrossRef] [Green Version]
- American Conference of Governmental Industrial Hygienists. 2008 TLVs and BEIs: Based on the Documentation of the Threshold Limit Values for Chemical Substances and Physical Agents and Biological Exposure Indices; American Conference of Governmental Industrial Hygienists: Cincinnati, OH, USA, 2008. [Google Scholar]
- Loeschner, K.; Hadrup, N.; Qvortrup, K.; Larsen, A.; Gao, X.; Vogel, U.; Mortensen, A.; Lam, H.R.; Larsen, E.H. Distribution of Silver in Rats Following 28 Days of Repeated Oral Exposure to Silver Nanoparticles or Silver Acetate. Part. Fibre Toxicol. 2011, 8, 1–14. [Google Scholar] [CrossRef] [Green Version]
- Lankveld, D.P.; Oomen, A.G.; Krystek, P.; Neigh, A.; Troost-de Jong, A.; Noorlander, C.W.; Van Eijkeren, J.C.; Geertsma, R.E.; De Jong, W.H. The Kinetics of the Tissue Distribution of Silver Nanoparticles of Different Sizes. Biomaterials 2010, 31, 8350–8361. [Google Scholar] [CrossRef]
- Da Cunha Martins, A., Jr.; Azevedo, L.F.; de Souza Rocha, C.C.; Carneiro, M.F.H.; Venancio, V.P.; de Almeida, M.R.; Antunes, L.M.G.; de Carvalho Hott, R.; Rodrigues, J.L.; Ogunjimi, A.T.; et al. Evaluation of Distribution, Redox Parameters, and Genotoxicity in Wistar Rats Co-Exposed to Silver and Titanium Dioxide Nanoparticles. J. Toxicol. Environ. Health Part A Curr. Issues 2017, 80, 1156–1165. [Google Scholar] [CrossRef]
- Lee, J.H.; Kim, Y.S.; Song, K.S.; Ryu, H.R.; Sung, J.H.; Park, J.D.; Park, H.M.; Song, N.W.; Shin, B.S.; Marshak, D.; et al. Biopersistence of Silver Nanoparticles in Tissues from Sprague-Dawley Rats. Part. Fibre Toxicol. 2013, 10, 36. [Google Scholar] [CrossRef] [Green Version]
- Silva, R.M.; Anderson, D.S.; Franzi, L.M.; Peake, J.L.; Edwards, P.C.; Van Winkle, L.S.; Pinkerton, K.E. Pulmonary Effects of Silver Nanoparticle Size, Coating, and Dose over Time upon Intratracheal Instillation. Toxicol. Sci. 2015, 144, 151–162. [Google Scholar] [CrossRef] [PubMed] [Green Version]
- Roberts, J.R.; McKinney, W.; Kan, H.; Krajnak, K.; Frazer, D.G.; Thomas, T.A.; Waugh, S.; Kenyon, A.; MacCuspie, R.I.; Hackley, V.A.; et al. Pulmonary and Cardiovascular Responses of Rats to Inhalation of Silver Nanoparticles. J. Toxicol. Environ. Health Part A Curr. Issues 2013, 76, 651–668. [Google Scholar] [CrossRef] [PubMed]
- Takenaka, S.; Karg, E. Pulmonary and Systemic Distribution of Inhaled Ultrafine Silver Particles in Rats. Environ. Health Perspect. 2001, 109 (Suppl. 4), 547–551. [Google Scholar] [PubMed] [Green Version]
- Sung, J.H.; Ji, J.H.; Park, J.D.; Yoon, J.U.; Kim, D.S.; Jeon, K.S.; Song, M.Y.; Jeong, J.; Han, B.S.; Han, J.H.; et al. Subchronic Inhalation Toxicity of Silver Nanoparticles. Toxicol. Sci. 2009, 108, 452–461. [Google Scholar] [CrossRef]
- Bachler, G.; Hungerbühler, K. A Physiologically Based Pharmacokinetic Model for Ionic Silver and Silver Nanoparticles. Int. J. Nanomed. 2013, 8, 3365–3382. [Google Scholar]
- Bachler, G.; von Goetz, N.; Hungerbuhler, K. Using Physiologically Based Pharmacokinetic (PBPK) Modeling for Dietary Risk Assessment of Titanium Dioxide (TiO2) Nanoparticles. Nanotoxicology 2015, 9, 373–380. [Google Scholar] [CrossRef]
- Rosário, F.; Duarte, I.F.; Pinto, R.J.B.; Santos, C.; Hoet, P.H.M.; Oliveira, H. Biodistribution and Pulmonary Metabolic Effects of Silver Nanoparticles in Mice Following Acute Intratracheal Instillations. Environ. Sci. Pollut. Res. 2020, 28, 2301–2314. [Google Scholar] [CrossRef]
- Rahman, I.; Kode, A.; Biswas, S.K. Assay for Quantitative Determination of Glutathione and Glutathione Disulfide Levels Using Enzymatic Recycling Method. Nat. Protoc. 2007, 1, 3159–3165. [Google Scholar] [CrossRef]
- Anger, C. Physiological Ranges and Variability in Organ Blood Flow in Laboratory Animals; Swedish University of Agricultural Sciences: Uppsala, Sweden, 2014. [Google Scholar]
- Arms, A.D.; Travis, C.C. Reference Physiological Parameters in Pharmacokinetic Modeling; United States Environmental Protection Agency, Office of Health and Environmental Assessment: Washington, DC, USA, 1988.
- Team, R.C. A Language and Environment for Statistical Computing; R Foundation for Statistical Computing: Vienna, Austria, 2014. [Google Scholar]
- Soetaert, K.; Petzoldt, T.; Setzer, R.W. Package DeSolve: Solving Initial Value Differential Equations in R. J. Stat. Softw. 2010, 33, 1–25. [Google Scholar] [CrossRef]
- Morimoto, Y.; Izumi, H.; Yoshiura, Y.; Fujishima, K.; Yatera, K.; Yamamoto, K. Usefulness of Intratracheal Instillation Studies for Estimating Nanoparticle-Induced Pulmonary Toxicity. Int. J. Mol. Sci. 2016, 17, 165. [Google Scholar] [CrossRef] [Green Version]
- American Conference of Governmental Industrial Hygienists. Threshold Limit Values for Chemical Substances and Physical Agents and Biological Exposure Indices, 7th ed.; American Conference of Governmental Industrial Hygienists: Cincinnati, OH, USA, 2001. [Google Scholar]
- Davenport, D.L.L.; Hsieh, H.; Eppert, D.B.L.; Carreira, D.V.S.; Krishan, D.M.; Ingle, D.T.; Howard, D.P.C.; Williams, M.T.; Vorhees, C.V.; Genter, M.B. Systemic and Behavioral Effects of Intranasal Administration of Silver Nanoparticles. Neurotoxicol. Teratol. 2015, 51, 68. [Google Scholar] [CrossRef] [Green Version]
- Shahare, B.; Yashpal, M. Toxic Effects of Repeated Oral Exposure of Silver Nanoparticles on Small Intestine Mucosa of Mice. Toxicol. Mech. Methods 2013, 23, 161–167. [Google Scholar] [CrossRef] [PubMed]
- Recordati, C.; De Maglie, M.; Bianchessi, S.; Argentiere, S.; Cella, C.; Mattiello, S.; Cubadda, F.; Aureli, F.; D’Amato, M.; Raggi, A.; et al. Tissue Distribution and Acute Toxicity of Silver after Single Intravenous Administration in Mice: Nano-Specific and Size-Dependent Effects. Part. Fibre Toxicol. 2016, 13, 1–17. [Google Scholar] [CrossRef] [PubMed] [Green Version]
- Chen, L.Q.; Fang, L.; Ling, J.; Ding, C.Z.; Kang, B.; Huang, C.Z. Nanotoxicity of Silver Nanoparticles to Red Blood Cells: Size Dependent Adsorption, Uptake, and Hemolytic Activity. Chem. Res. Toxicol. 2015, 28, 501–509. [Google Scholar] [CrossRef] [PubMed]
- Huang, H.; Lai, W.; Cui, M.; Liang, L.; Lin, Y.; Fang, Q.; Liu, Y.; Xie, L. An Evaluation of Blood Compatibility of Silver Nanoparticles. Sci. Rep. 2016, 6, 25518. [Google Scholar] [CrossRef] [PubMed] [Green Version]
- Wu, T.; Tang, M. Review of the Effects of Manufactured Nanoparticles on Mammalian Target Organs. J. Appl. Toxicol. 2018, 38, 25–40. [Google Scholar] [CrossRef] [PubMed]
- Morishige, T.; Yoshioka, Y.; Inakura, H.; Tanabe, A.; Narimatsu, S.; Yao, X.; Monobe, Y.; Imazawa, T.; Tsunoda, S.; Tsutsumi, Y.; et al. Suppression of Nanosilica Particle-Induced Inflammation by Surface Modification of the Particles. Arch. Toxicol. 2012, 86, 1297–1307. [Google Scholar] [CrossRef]
- Rettig, L.; Haen, S.P.; Bittermann, A.G.; von Boehmer, L.; Curioni, A.; Krämer, S.D.; Knuth, A.; Pascolo, S. Particle Size and Activation Threshold: A New Dimension of Danger Signaling. Blood 2010, 115, 4533–4541. [Google Scholar] [CrossRef] [Green Version]
- Warheit, D.B.; Webb, T.R.; Sayes, C.M.; Colvin, V.L.; Reed, K.L. Pulmonary Instillation Studies with Nanoscale TiO2 Rods and Dots in Rats: Toxicity Is Not Dependent upon Particle Size and Surface Area. Toxicol. Sci. 2006, 91, 227–236. [Google Scholar] [CrossRef]
- Mao, L.; Hu, M.; Pan, B.; Xie, Y.; Petersen, E.J. Biodistribution and Toxicity of Radio-Labeled Few Layer Graphene in Mice after Intratracheal Instillation. Part. Fibre Toxicol. 2016, 13, 1–12. [Google Scholar] [CrossRef] [Green Version]
- Ou, L.; Song, B.; Liang, H.; Liu, J.; Feng, X.; Deng, B.; Sun, T.; Shao, L. Toxicity of Graphene-Family Nanoparticles: A General Review of the Origins and Mechanisms. Part. Fibre Toxicol. 2016, 13, 1–24. [Google Scholar] [CrossRef] [PubMed] [Green Version]
- Owen, J.B.; Butterfield, D.A. Measurement of Oxidized/Reduced Glutathione Ratio. In Methods in Molecular Biology (Clifton, N.J.); Humana Press: Totowa, NJ, USA, 2010; Volume 648, pp. 269–277. [Google Scholar]
- Arora, S.; Rajwade, J.M.; Paknikar, K.M. Nanotoxicology and in Vitro Studies: The Need of the Hour. Toxicol. Appl. Pharmacol. 2012, 258, 151–165. [Google Scholar] [CrossRef] [PubMed]
- Gan, J.; Sun, J.; Chang, X.; Li, W.; Li, J.; Niu, S.; Kong, L.; Zhang, T.; Wu, T.; Tang, M.; et al. Biodistribution and Organ Oxidative Damage Following 28 Days Oral Administration of Nanosilver with/without Coating in Mice. J. Appl. Toxicol. 2020, 40, 815–831. [Google Scholar] [CrossRef] [PubMed]
- Lee, Y.-J.; Kim, J.; Oh, J.; Bae, S.; Lee, S.; Hong, I.S.; Kim, S.-H. Ion-Release Kinetics and Ecotoxicity Effects of Silver Nanoparticles. Environ. Toxicol. Chem. 2012, 31, 155–159. [Google Scholar] [CrossRef]
- Shi, H.; Magaye, R.; Castranova, V.; Zhao, J. Titanium Dioxide Nanoparticles: A Review of Current Toxicological Data. Part. Fibre Toxicol. 2013, 10, 15. [Google Scholar] [CrossRef] [Green Version]
- Fabian, E.; Landsiedel, R.; Ma-Hock, L.; Wiench, K.; Wohlleben, W.; Van Ravenzwaay, B. Tissue Distribution and Toxicity of Intravenously Administered Titanium Dioxide Nanoparticles in Rats. Arch. Toxicol. 2008, 82, 151–157. [Google Scholar] [CrossRef]
- Moghimi, S.M.; Hunter, A.C.; Murray, J.C. Nanomedicine: Current Status and Future Prospects. FASEB J. 2005, 19, 311–330. [Google Scholar] [CrossRef] [Green Version]
- Morimoto, Y.; Kobayashi, N.; Shinohara, N.; Myojo, T.; Tanaka, I.; Nakanishi, J. Hazard assessments of manufactured nanomaterials. J. Occup. Health 2010, 52, 325–334. [Google Scholar] [CrossRef] [Green Version]
- Ferdous, Z.; Al-Salam, S.; Yuvaraju, P.; Ali, B.H.; Nemmar, A. A Remote Effects and Biodistribution of Pulmonary Instilled Silver Nanoparticles in Mice. NanoImpact 2021, 22, 100310. [Google Scholar] [CrossRef]
- Fehaid, A.; Hamed, M.F.; Abouelmagd, M.M.; Taniguchi, A. A Time-Dependent Toxic Effect and Distribution of Silver Nanoparticles Compared to Silver Nitrate after Intratracheal Instillation in Rats. Am. J. Nanomater. 2016, 4, 12–19. [Google Scholar] [CrossRef]
- Chuang, H.C.; Hsiao, T.C.; Wu, C.K.; Chang, H.H.; Lee, C.H.; Chang, C.C.; Cheng, T.J. Allergenicity and Toxicology of Inhaled Silver Nanoparticles in Allergen-Provocation Mice Models. Int. J. Nanomed. 2013, 8, 4495–4506. [Google Scholar] [CrossRef] [PubMed] [Green Version]
- DiVincenzo, G.D.; Giordano, C.J.; Schriever, L.S. Biologic Monitoring of Workers Exposed to Silver. Int. Arch. Occup. Environ. Health 1985, 56, 207–215. [Google Scholar] [CrossRef] [PubMed]
- Longmire, M.; Choyke, P.L.; Kobayashi, H. Clearance Properties of Nano-Sized Particles and Molecules as Nanomedicine Imaging Agents: Considerations and Caveats. Nanomedicine 2012, 3, 703–717. [Google Scholar] [CrossRef] [PubMed] [Green Version]
- Soo Choi, H.; Liu, W.; Misra, P.; Tanaka, E.; Zimmer, J.P.; Itty Ipe, B.; Bawendi, M.G.; Frangioni, J. V Renal Clearance of Quantum Dots. Nat. Biotechnol. 2007, 25, 1165–1170. [Google Scholar] [CrossRef] [PubMed] [Green Version]
- Yuan, D.; He, H.; Wu, Y.; Fan, J.; Cao, Y. Physiologically Based Pharmacokinetic Modeling of Nanoparticles. J. Pharm. Sci. 2019, 108, 58–72. [Google Scholar] [CrossRef] [PubMed] [Green Version]
- Villaverde, A.F.; Banga, J.R. Reverse Engineering and Identification in Systems Biology: Strategies, Perspectives and Challenges. J. R. Soc. Interface 2014, 11, 20130505. [Google Scholar] [CrossRef] [Green Version]


Publisher’s Note: MDPI stays neutral with regard to jurisdictional claims in published maps and institutional affiliations. |
© 2022 by the authors. Licensee MDPI, Basel, Switzerland. This article is an open access article distributed under the terms and conditions of the Creative Commons Attribution (CC BY) license (https://creativecommons.org/licenses/by/4.0/).
Share and Cite
Rosário, F.; Creylman, J.; Verheyen, G.; Van Miert, S.; Santos, C.; Hoet, P.; Oliveira, H. Impact of Particle Size on Toxicity, Tissue Distribution and Excretion Kinetics of Subchronic Intratracheal Instilled Silver Nanoparticles in Mice. Toxics 2022, 10, 260. https://0-doi-org.brum.beds.ac.uk/10.3390/toxics10050260
Rosário F, Creylman J, Verheyen G, Van Miert S, Santos C, Hoet P, Oliveira H. Impact of Particle Size on Toxicity, Tissue Distribution and Excretion Kinetics of Subchronic Intratracheal Instilled Silver Nanoparticles in Mice. Toxics. 2022; 10(5):260. https://0-doi-org.brum.beds.ac.uk/10.3390/toxics10050260
Chicago/Turabian StyleRosário, Fernanda, Jan Creylman, Geert Verheyen, Sabine Van Miert, Conceição Santos, Peter Hoet, and Helena Oliveira. 2022. "Impact of Particle Size on Toxicity, Tissue Distribution and Excretion Kinetics of Subchronic Intratracheal Instilled Silver Nanoparticles in Mice" Toxics 10, no. 5: 260. https://0-doi-org.brum.beds.ac.uk/10.3390/toxics10050260