Serum P-Cresyl Sulfate Is a Predictor of Central Arterial Stiffness in Patients on Maintenance Hemodialysis

 , ,
, , 

Abstract
:1. Introduction
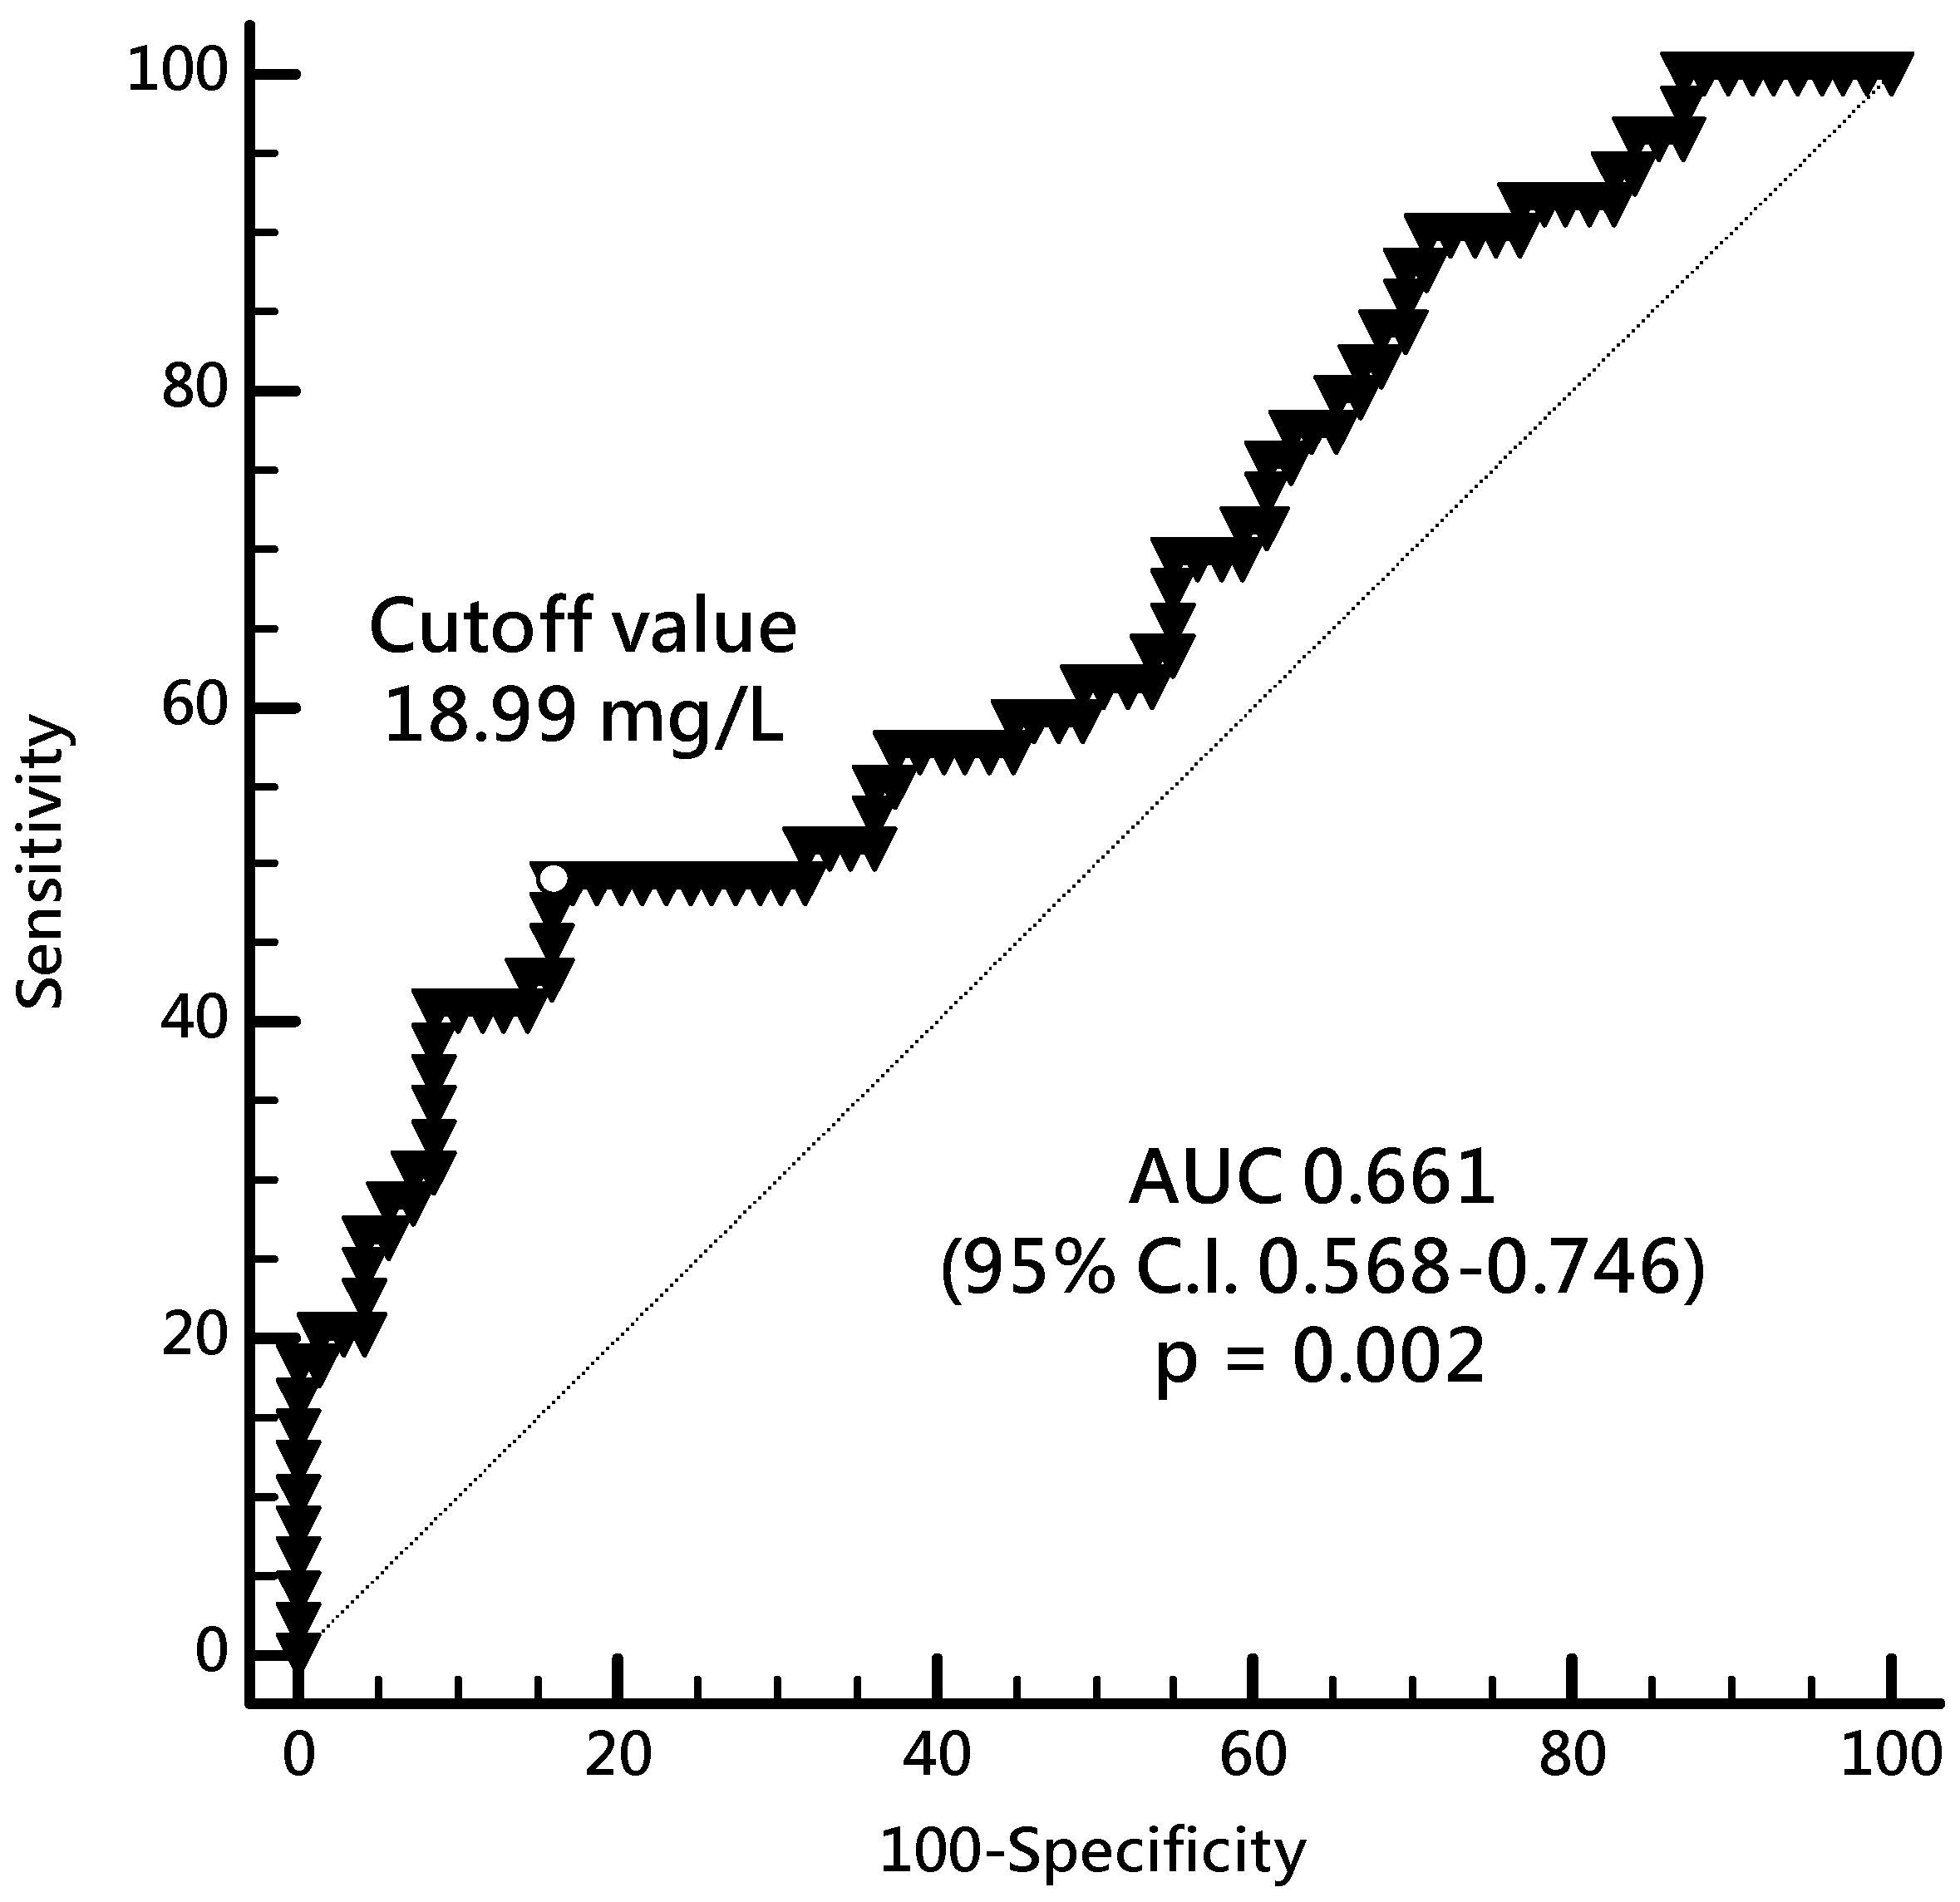
2. Results
3. Discussion
4. Conclusions
5. Materials and Methods
5.1. Participants
5.2. Biochemical and Anthropometic Analyses
5.3. Determination of Serum P-Cresyl Sulfate Levels
5.4. Carotid–Femoral PWV Measurements
5.5. Statistical Analysis
Author Contributions
Funding
Conflicts of Interest
References
- Wen, C.P.; Cheng, T.Y.; Tsai, M.K.; Chang, Y.C.; Chan, H.T.; Tsai, S.P.; Chiang, P.H.; Hsu, C.C.; Sung, P.K.; Hsu, Y.H.; et al. All-cause mortality attributable to chronic kidney disease: A prospective cohort study based on 462 293 adults in Taiwan. Lancet 2008, 371, 2173–2182. [Google Scholar] [CrossRef]
- Blacher, J.; Guerin, A.P.; Pannier, B.; Marchais, S.J.; Safar, M.E.; London, G.M. Impact of aortic stiffness on survival in end-stage renal disease. Circulation 1999, 99, 2434–2439. [Google Scholar] [CrossRef] [PubMed] [Green Version]
- Vlachopoulos, C.; Aznaouridis, K.; Stefanadis, C. Prediction of cardiovascular events and all-cause mortality with arterial stiffness: A systematic review and meta-analysis. J. Am. Coll. Cardiol. 2010, 55, 1318–1327. [Google Scholar] [CrossRef] [PubMed] [Green Version]
- Jono, S.; McKee, M.D.; Murry, C.E.; Shioi, A.; Nishizawa, Y.; Mori, K.; Morii, H.; Giachelli, C.M. Phosphate regulation of vascular smooth muscle cell calcification. Circ. Res. 2000, 87, E10–E17. [Google Scholar] [CrossRef]
- Ossareh, S. Vascular calcification in chronic kidney disease: Mechanisms and clinical implications. Iran. J. Kidney Dis. 2011, 5, 285–299. [Google Scholar]
- Vanholder, R.; Schepers, E.; Pletinck, A.; Nagler, E.V.; Glorieux, G. The uremic toxicity of indoxyl sulfate and p-cresyl sulfate: A systematic review. J. Am. Soc. Nephrol. 2014, 25, 1897–1907. [Google Scholar] [CrossRef]
- Townsend, R.R.; Anderson, A.H.; Chirinos, J.A.; Feldman, H.I.; Grunwald, J.E.; Nessel, L.; Roy, J.; Weir, M.R.; Wright, J.T., Jr.; Bansal, N.; et al. Association of pulse wave velocity with chronic kidney disease progression and mortality: Findings from the cric study (chronic renal insufficiency cohort). Hypertension 2018, 71, 1101–1107. [Google Scholar] [CrossRef]
- Wu, I.W.; Hsu, K.H.; Lee, C.C.; Sun, C.Y.; Hsu, H.J.; Tsai, C.J.; Tzen, C.Y.; Wang, Y.C.; Lin, C.Y.; Wu, M.S. P-cresyl sulphate and indoxyl sulphate predict progression of chronic kidney disease. Nephrol. Dial. Transplant. 2011, 26, 938–947. [Google Scholar] [CrossRef] [Green Version]
- Sun, C.Y.; Chang, S.C.; Wu, M.S. Uremic toxins induce kidney fibrosis by activating intrarenal renin-angiotensin-aldosterone system associated epithelial-to-mesenchymal transition. PLoS ONE 2012, 7, e34026. [Google Scholar] [CrossRef] [Green Version]
- Watanabe, H.; Miyamoto, Y.; Honda, D.; Tanaka, H.; Wu, Q.; Endo, M.; Noguchi, T.; Kadowaki, D.; Ishima, Y.; Kotani, S.; et al. P-cresyl sulfate causes renal tubular cell damage by inducing oxidative stress by activation of nadph oxidase. Kidney Int. 2013, 83, 582–592. [Google Scholar] [CrossRef] [Green Version]
- Cerini, C.; Dou, L.; Anfosso, F.; Sabatier, F.; Moal, V.; Glorieux, G.; De Smet, R.; Vanholder, R.; Dignat-George, F.; Sampol, J.; et al. P-cresol, a uremic retention solute, alters the endothelial barrier function in vitro. Thromb. Haemost. 2004, 92, 140–150. [Google Scholar] [PubMed] [Green Version]
- Dou, L.; Bertrand, E.; Cerini, C.; Faure, V.; Sampol, J.; Vanholder, R.; Berland, Y.; Brunet, P. The uremic solutes p-cresol and indoxyl sulfate inhibit endothelial proliferation and wound repair. Kidney Int. 2004, 65, 442–451. [Google Scholar] [CrossRef] [PubMed]
- Liabeuf, S.; Barreto, D.V.; Barreto, F.C.; Meert, N.; Glorieux, G.; Schepers, E.; Temmar, M.; Choukroun, G.; Vanholder, R.; Massy, Z.A.; et al. Free p-cresylsulphate is a predictor of mortality in patients at different stages of chronic kidney disease. Nephrol. Dial. Transplant. 2010, 25, 1183–1191. [Google Scholar] [CrossRef] [PubMed] [Green Version]
- Bammens, B.; Evenepoel, P.; Keuleers, H.; Verbeke, K.; Vanrenterghem, Y. Free serum concentrations of the protein-bound retention solute p-cresol predict mortality in hemodialysis patients. Kidney Int. 2006, 69, 1081–1087. [Google Scholar] [CrossRef] [PubMed]
- Meijers, B.K.; Claes, K.; Bammens, B.; de Loor, H.; Viaene, L.; Verbeke, K.; Kuypers, D.; Vanrenterghem, Y.; Evenepoel, P. P-cresol and cardiovascular risk in mild-to-moderate kidney disease. Clin. J. Am. Soc. Nephrol. 2010, 5, 1182–1189. [Google Scholar] [CrossRef] [PubMed] [Green Version]
- Karras, A.; Haymann, J.P.; Bozec, E.; Metzger, M.; Jacquot, C.; Maruani, G.; Houillier, P.; Froissart, M.; Stengel, B.; Guardiola, P.; et al. Large artery stiffening and remodeling are independently associated with all-cause mortality and cardiovascular events in chronic kidney disease. Hypertension 2012, 60, 1451–1457. [Google Scholar] [CrossRef] [Green Version]
- Moe, S.M.; Chen, N.X. Mechanisms of vascular calcification in chronic kidney disease. J. Am. Soc. Nephrol. 2008, 19, 213–216. [Google Scholar] [CrossRef] [Green Version]
- Cecelja, M.; Chowienczyk, P. Dissociation of aortic pulse wave velocity with risk factors for cardiovascular disease other than hypertension: A systematic review. Hypertension 2009, 54, 1328–1336. [Google Scholar] [CrossRef] [Green Version]
- Schram, M.T.; Henry, R.M.; van Dijk, R.A.; Kostense, P.J.; Dekker, J.M.; Nijpels, G.; Heine, R.J.; Bouter, L.M.; Westerhof, N.; Stehouwer, C.D. Increased central artery stiffness in impaired glucose metabolism and type 2 diabetes: The hoorn study. Hypertension 2004, 43, 176–181. [Google Scholar] [CrossRef]
- Agnoletti, D.; Mansour, A.S.; Zhang, Y.; Protogerou, A.D.; Ouerdane, S.; Blacher, J.; Safar, M.E. Clinical interaction between diabetes duration and aortic stiffness in type 2 diabetes mellitus. J. Hum. Hypertens. 2017, 31, 189–194. [Google Scholar] [CrossRef]
- McEniery, C.M.; McDonnell, B.J.; So, A.; Aitken, S.; Bolton, C.E.; Munnery, M.; Hickson, S.S.; Yasmin; Maki-Petaja, K.M.; Cockcroft, J.R.; et al. Aortic calcification is associated with aortic stiffness and isolated systolic hypertension in healthy individuals. Hypertension 2009, 53, 524–531. [Google Scholar] [CrossRef] [PubMed] [Green Version]
- Peyster, E.; Chen, J.; Feldman, H.I.; Go, A.S.; Gupta, J.; Mitra, N.; Pan, Q.; Porter, A.; Rahman, M.; Raj, D.; et al. Inflammation and arterial stiffness in chronic kidney disease: Findings from the cric study. Am. J. Hypertens. 2017, 30, 400–408. [Google Scholar] [CrossRef] [PubMed] [Green Version]
- Meijers, B.K.; Van Kerckhoven, S.; Verbeke, K.; Dehaen, W.; Vanrenterghem, Y.; Hoylaerts, M.F.; Evenepoel, P. The uremic retention solute p-cresyl sulfate and markers of endothelial damage. Am. J. Kidney Dis. 2009, 54, 891–901. [Google Scholar] [CrossRef] [PubMed]
- Opdebeeck, B.; Maudsley, S.; Azmi, A.; De Mare, A.; De Leger, W.; Meijers, B.; Verhulst, A.; Evenepoel, P.; D’Haese, P.C.; Neven, E. Indoxyl sulfate and p-cresyl sulfate promote vascular calcification and associate with glucose intolerance. J. Am. Soc. Nephrol. 2019, 30, 751–766. [Google Scholar] [CrossRef] [PubMed]
- Rossi, M.; Campbell, K.L.; Johnson, D.W.; Stanton, T.; Vesey, D.A.; Coombes, J.S.; Weston, K.S.; Hawley, C.M.; McWhinney, B.C.; Ungerer, J.P.; et al. Protein-bound uremic toxins, inflammation and oxidative stress: A cross-sectional study in stage 3–4 chronic kidney disease. Arch. Med. Res. 2014, 45, 309–317. [Google Scholar] [CrossRef]
- Wang, C.H.; Lai, Y.H.; Kuo, C.H.; Lin, Y.L.; Tsai, J.P.; Hsu, B.G. Association between serum indoxyl sulfate levels and endothelial function in non-dialysis chronic kidney disease. Toxins 2019, 11, 589. [Google Scholar] [CrossRef] [Green Version]
- Wang, J.H.; Lee, C.J.; Chen, M.L.; Yang, C.F.; Chen, Y.C.; Hsu, B.G. Association of serum osteoprotegerin levels with carotid-femoral pulse wave velocity in hypertensive patients. J. Clin. Hypertens. 2014, 16, 301–308. [Google Scholar] [CrossRef]
- Williams, B.; Mancia, G.; Spiering, W.; Agabiti Rosei, E.; Azizi, M.; Burnier, M.; Clement, D.L.; Coca, A.; de Simone, G.; Dominiczak, A.; et al. 2018 esc/esh guidelines for the management of arterial hypertension. Eur. Heart J. 2018, 39, 3021–3104. [Google Scholar] [CrossRef]


| Characteristics | All Patients (n = 118) | Control Group (n = 69) | High Arterial Stiffness Group (n = 49) | p |
|---|---|---|---|---|
| Carotid–femoral PWV (m/s) | 9.63 ± 2.55 | 7.83 ± 1.30 | 12.16 ± 1.48 | <0.001 * |
| Age (years) | 63.05 ± 13.28 | 61.32 ± 13.74 | 65.49 ± 12.34 | 0.093 |
| Female, n (%) | 59 (50.0) | 36 (52.2) | 23 (46.9) | 0.575 |
| Body mass index (kg/m2) | 24.92 ± 5.13 | 24.92 ± 5.45 | 24.92 ± 4.69 | 0.994 |
| Hemodialysis duration (months) | 56.02 (24.60–111.45) | 80.40 (22.38–133.80) | 45.72 (26.22–74.50) | 0.069 |
| Diabetes mellitus, n (%) | 55 (46.6) | 19 (27.5) | 36 (73.5) | <0.001 * |
| Hypertension, n (%) | 66 (55.9) | 34 (49.3) | 32 (65.3) | 0.084 |
| Systolic blood pressure (mmHg) | 142.13 ± 25.64 | 138.07 ± 26.99 | 147.84 ± 22.38 | 0.021 * |
| Diastolic blood pressure (mmHg) | 76.02 ± 15.61 | 76.17 ± 16.29 | 75.29 ± 15.17 | 0.765 |
| Heart rate (beats per minute) | 75.37 ± 12.79 | 76 ± 13.17 | 74.49 ± 12.32 | 0.629 |
| Blood urea nitrogen (mg/dL) | 60.36 ± 14.75 | 59.77 ± 13.64 | 61.20 ± 16.31 | 0.604 |
| Creatinine (mg/dL) | 9.17 ± 1.99 | 9.47 ± 1.98 | 8.73 ± 1.94 | 0.047 * |
| Urea reduction rate | 0.74 ± 0.04 | 0.74 ± 0.05 | 0.73 ± 0.04 | 0.501 |
| Kt/V (Gotch) | 1.35 ± 0.17 | 1.36 ± 0.19 | 1.33 ± 0.16 | 0.396 |
| Total cholesterol (mg/dL) | 143.19 ± 35.25 | 146.35 ± 38.11 | 138.73 ± 30.60 | 0.244 |
| Triglyceride (mg/dL) | 113.00 (86.75–178.75) | 109.00 (86.50–199.00) | 121.00 (85.00–174.50) | 0.785 |
| Glucose (mg/dL) | 136.50 (113.75–177.00) | 132.00 (110.50–162.00) | 143.00 (119.50–206.00) | 0.042 * |
| Total calcium (mg/dL) | 8.96 ± 0.75 | 8.94 ± 0.76 | 8.99 ± 0.75 | 0.732 |
| Phosphorus (mg/dL) | 4.65 ± 1.32 | 4.69 ± 1.35 | 4.61 ± 1.31 | 0.746 |
| Intact parathyroid hormone (pg/mL) | 186.50 (66.60–353.35) | 211.70 (101.10–413.15) | 136.80 (44.40–281.75) | 0.098 |
| C-reactive protein (mg/dL) | 0.34 (0.09–0.95) | 0.24 (0.08–0.86) | 0.57 (0.13–1.09) | 0.029 * |
| Total p-cresyl sulfate (mg/L) | 16.57 ± 9.07 | 13.95 ± 5.93 | 20.26 ± 11.27 | <0.001 * |
| Angiotensin receptor blocker, n (%) | 35 (29.7) | 19 (27.) | 16 (32.7) | 0.549 |
| β-blocker, n (%) | 39 (33.1) | 22 (31.9) | 17 (34.7) | 0.749 |
| Calcium channel blocker, n (%) | 46 (39.0) | 29 (42.0) | 17 (34.7) | 0.421 |
| Statin, n (%) | 19 (16.1) | 8 (11.6) | 11(22.4) | 0.114 |
| Fibrate, n (%) | 13 (11.0) | 9 (13.0) | 4 (8.2) | 0.404 |
| Variables | Odds Ratio | 95% Confidence Interval | p |
|---|---|---|---|
| Presence of diabetes mellitus | 4.095 | 1.429–11.739 | 0.009 * |
| Total p-cresyl sulfate, 1 mg/L | 1.072 | 1.002–1.147 | 0.043 * |
| Age, 1 year | 1.026 | 0.987–1.066 | 0.191 |
| Sex (female) | 0.610 | 0.223–1.690 | 0.336 |
| C-reactive protein, 0.1 mg/dL | 1.822 | 0.831–3.997 | 0.134 |
| Glucose, 1 mg/dL | 1.004 | 0.997–1.011 | 0.286 |
| Creatinine, 1 mg/dL | 0.945 | 0.710–1.259 | 0.700 |
| Systolic blood pressure, 1 mmHg | 1.002 | 0.983–1.022 | 0.838 |
| Heart rate, 1 beat per minute | 0.991 | 0.954–1.030 | 0.657 |
| Hemodialysis duration, 1 month | 0.997 | 0.988–1.005 | 0.433 |
| Variables | Central PWV (m/s) | ||||
|---|---|---|---|---|---|
| Simple Regression | Multivariate Regression | ||||
| r | p | Beta | Adjusted R2 Change | p | |
| Age (years) | 0.078 | 0.402 | - | - | - |
| Female sex | −0.085 | 0.357 | - | ||
| Body mass index (kg/m2) | 0.056 | 0.545 | - | - | - |
| Log-HD duration (months) | −0.255 | 0.005 * | - | - | - |
| Diabetes mellitus | 0.538 | <0.001 * | 0.446 | 0.283 | <0.001 * |
| Hypertension | 0.081 | 0.381 | - | - | - |
| Systolic blood pressure (mmHg) | 0.263 | 0.004 * | - | - | - |
| Diastolic blood pressure (mmHg) | 0.055 | 0.551 | - | - | - |
| Heart rate (beats per minute) | −0.112 | 0.228 | |||
| Blood urea nitrogen (mg/dL) | 0.016 | 0.867 | - | - | - |
| Creatinine (mg/dL) | −0.094 | 0.313 | - | - | - |
| Urea reduction rate | −0.099 | 0.285 | - | - | - |
| Kt/V (Gotch) | −0.104 | 0.264 | - | - | - |
| Total cholesterol (mg/dL) | −0.068 | 0.462 | - | - | - |
| Log-triglyceride (mg/dL) | −0.015 | 0.872 | - | - | - |
| Log-glucose (mg/dL) | 0.198 | 0.031 * | - | - | - |
| Total calcium (mg/dL) | 0.028 | 0.763 | - | - | - |
| Phosphorus (mg/dL) | 0.065 | 0.487 | - | - | - |
| Log-iPTH (pg/mL) | −0.088 | 0.341 | - | - | - |
| Log-CRP (mg/dL) | 0.135 | 0.144 | - | - | - |
| Total p-cresyl sulfate (mg/L) | 0.382 | <0.001 * | 0.174 | 0.028 | 0.018 * |
© 2019 by the authors. Licensee MDPI, Basel, Switzerland. This article is an open access article distributed under the terms and conditions of the Creative Commons Attribution (CC BY) license (http://creativecommons.org/licenses/by/4.0/).
Share and Cite
Lai, Y.-H.; Wang, C.-H.; Kuo, C.-H.; Lin, Y.-L.; Tsai, J.-P.; Hsu, B.-G. Serum P-Cresyl Sulfate Is a Predictor of Central Arterial Stiffness in Patients on Maintenance Hemodialysis. Toxins 2020, 12, 10. https://0-doi-org.brum.beds.ac.uk/10.3390/toxins12010010
Lai Y-H, Wang C-H, Kuo C-H, Lin Y-L, Tsai J-P, Hsu B-G. Serum P-Cresyl Sulfate Is a Predictor of Central Arterial Stiffness in Patients on Maintenance Hemodialysis. Toxins. 2020; 12(1):10. https://0-doi-org.brum.beds.ac.uk/10.3390/toxins12010010
Chicago/Turabian StyleLai, Yu-Hsien, Chih-Hsien Wang, Chiu-Huang Kuo, Yu-Li Lin, Jen-Pi Tsai, and Bang-Gee Hsu. 2020. "Serum P-Cresyl Sulfate Is a Predictor of Central Arterial Stiffness in Patients on Maintenance Hemodialysis" Toxins 12, no. 1: 10. https://0-doi-org.brum.beds.ac.uk/10.3390/toxins12010010