Effect of Zinc on Microcystis aeruginosa UTEX LB 2385 and Its Toxin Production


Department of Biological Sciences, Seton Hall University, South Orange, NJ 07079, USA
*
Author to whom correspondence should be addressed.
Toxins 2020, 12(2), 92; https://0-doi-org.brum.beds.ac.uk/10.3390/toxins12020092
Submission received: 1 January 2020
/
Revised: 26 January 2020
/
Accepted: 28 January 2020
/
Published: 30 January 2020
(This article belongs to the Special Issue Freshwater Algal Toxins: Monitoring and Toxicity Profile)
Abstract
:Cyanobacteria harmful algal blooms (CHABs) are primarily caused by man-made eutrophication and increasing climate-change conditions. The presence of heavy metal runoff in affected water systems may result in CHABs alteration to their ecological interactions. Certain CHABs produce by-products, such as microcystin (MC) cyanotoxins, that have detrimentally affected humans through contact via recreation activities within implicated water bodies, directly drinking contaminated water, ingesting biomagnified cyanotoxins in seafood, and/or contact through miscellaneous water treatment. Metallothionein (MT) is a small, metal-sequestration cysteine rich protein often upregulated within the stress response mechanism. This study focused on zinc metal resistance and stress response in a toxigenic cyanobacterium, Microcystis aeruginosa UTEX LB 2385, by monitoring cells with (0, 0.1, 0.25, and 0.5 mg/L) ZnCl2 treatment. Flow cytometry and phase contrast microscopy were used to evaluate physiological responses in cultures. Molecular assays and an immunosorbent assay were used to characterize the expression of MT and MC under zinc stress. The results showed that the half maximal inhibitory concentration (IC50) was 0.25 mg/L ZnCl2. Flow cytometry and phase contrast microscopy showed morphological changes occurred in cultures exposed to 0.25 and 0.5 mg/L ZnCl2. Quantitative PCR (qPCR) analysis of selected cDNA samples showed significant upregulation of Mmt through all time points, significant upregulation of mcyC at a later time point. ELISA MC-LR analysis showed extracellular MC-LR (µg/L) and intracellular MC-LR (µg/cell) quota measurements persisted through 15 days, although 0.25 mg/L ZnCl2 treatment produced half the normal cell biomass and 0.5 mg/L treatment largely inhibited growth. The 0.25 and 0.5 mg/L ZnCl2 treated cells demonstrated a ~40% and 33% increase of extracellular MC-LR(µg/L) equivalents, respectively, as early as Day 5 compared to control cells. The 0.5 mg/L ZnCl2 treated cells showed higher total MC-LR (µg/cell) quota yield by Day 8 than both 0 mg/L ZnCl2 control cells and 0.1 mg/L ZnCl2 treated cells, indicating release of MCs upon cell lysis. This study showed this Microcystis aeruginosa strain is able to survive in 0.25 mg/L ZnCl2 concentration. Certain morphological zinc stress responses and the upregulation of mt and mcy genes, as well as periodical increased extracellular MC-LR concentration with ZnCl2 treatment were observed.
Key Contribution: Zinc stress causes cyanotoxin production increase in M. aeruginosa UTEX LB 2385.
1. Introduction
Cyanobacteria harmful algal blooms (CHABs) are described as toxigenic or irritating biomasses of mostly oxygenic, photosynthetic bacteria on the rise worldwide due to anthropogenic eutrophication (via excessive P and N loading) and increasing climate-change conditions [1,2,3,4,5,6]. Oftentimes, metal pollutant runoff in water systems may also affect the ecological interaction of a given CHAB population [7]. Certain essential element processes, such as iron’s regulation by (FUR) uptake regulators, may act as growth-limiting factors in established cyanobacteria populations [1,8]. Additionally, the effects of different heavy metal compounds and concentrations on varying cyanobacteria populations and cyanotoxin production have been demonstrated in a few studies [9,10,11].
The rising occurrence of global CHABs may lead to a greater probability of human exposure and animal detrimental effects through environmental interactions [12,13]. Generally, humans may be exposed to CHABs cyanotoxins or irritants via recreation activities in contaminated water sources, imbibement or infusion (via medical dialysis) of contaminated water, ingestion of biomagnified cyanotoxins through food sources, and possible long-term chronic exposure through ingestion [14,15,16]. Cyanotoxins may structurally present as alkaloids, polyketides, cyclic peptides, and amino acid complexes, and are potently classified as neurotoxins, hepatotoxins, or cytotoxins [17,18]. The toxic health effects of cyanotoxins in humans are both varied and dependent on the class, but effects may display from mild symptoms to severe and fatal [16,19].
Aside from escalating incidences of detrimental effects to organisms, CHABs will most likely play an increasing role in global economic dynamics. The greater occurrence of global CHABs have reported some monitoring and contingency plan estimate costs of 10,000 s–1,000,000 s USD per country per year [20]. While these numbers do not often reflect loss of recreation revenue, cost of treatment actions, or socio-economic strategies (for anthropogenic P-N load reduction), an estimate report that took these components into account (within the United States) calculated potential losses in the billions USD per year [21].
Microcystis spp. and the hepatotoxins microcystins (MCs), have been identified as several of the most commonly encountered freshwater CHABs species and cyanotoxins, respectively, on a global scale and within the U.S. [22,23]. As such, studies evaluating both Microcystis and MCs have increased in importance in the recent years. Adding to the gravity of these considerations, examples of toxigenic Microcystis outcompeting non-toxigenic strains within elevated surface water temperature parameters have been observed [24,25]. This indicates a potentially competitive selection of toxigenic strains over non-toxigenic strains under climate change conditions. Microcystis aeruginosa is a commonly identified species of Microcystis within many CHABs, and have been found on all continents except for the Antarctic [26]. M. aeruginosa are typically 2–8 µm wide, unicellular planktonic cyanobacteria that possess variable, intracellular gas vesicles and often form colonies in natural and eutrophic conditions [27,28,29]. MCs (~995 Da for MC-LR) are water soluble, monocyclic heptapeptides that can be produced by freshwater, terrestrial, and benthic cyanobacteria. The most common genus and species producing a given variant(s) of the ~ 200 identified MCs are: Microcystis, Chroococcus, Planktothrix, Anabaena, Nostoc, Oscillatoria, Hapalosiphon, and Phormidium [18,30,31]. MCs are biosynthesized by a non-ribosomal peptide synthetase/polyketide synthase complex (known as microcystin synthetase) [18], and vary in toxicity depending on the L-amino acid components and binding capacity to receptor sites [32]. The role of MCs in the extracellular environment remains largely undetermined, but several studies have proposed an intercell signal-like characteristic where environmental conditions and introduced MCs enhanced mcy gene and toxin production in established cell populations [33,34]. Therefore, further evaluation of stimulatory MC release to the extracellular environment and their possible extracellular functions with environmental factors is of great importance. Zinc (Zn) is an important mineral integral to the physiological functions of all organisms. Zn naturally occurs as a trace element in world average river waters (0.27–27 µg/L), as ionic complexes in continental crust and world soil averages (70 mg/kg, respectively), and as precipitating minerals, organic, and inorganic compounds in water (~3.25 µg/L in worldwide, clean drinking water), but organic and inorganic zinc compounds are oftentimes identified as metal runoff contaminants within aqueous environments [35,36,37]. A comparison of the average Zn levels originating from a continental crustal average (52 ppm) was found to be significantly different to an anthropogenic impacted region, New York Harbor, United States (188–244 ppm), showing a further trend in heavy metal accumulation within water environments proximal to urbanized and industrial sources [38,39]. The toxicity of ZnCl2 has been known in many organisms [37,40,41] and can cause external irritation, severe inflammation, and gastrointestinal toxicity dependent on percent ingestion [42]. Cyanobacteria sensitivity, resistance or adaptive sequestration of heavy metal concentrations has been documented within both colonial CHABs and unicellular species [7,43,44,45]. Aside from the observed zinc metal-complexing potential of MCs (MC-LR-Zn = −617 ± 7 kcal mol−1; MC-RR-Zn =−777 ± 9 kcal mol−1) [46], metallothioneins (MTs) are well documented metal-cation chelating, cysteine-rich proteins (<10 kDa) ubiquitously found in prokaryotes and eukaryotes [47,48]. MTs have been shown to be upregulated in different species of cyanobacteria when exposed to Zn2+ or Cd2+ concentrations while remaining relatively constant at basal levels [49,50]. Because of the variability of the MC synthetase gene cluster (encoding mcyABC–mcyD–J) in different cyanobacteria clades and within strains [51] and a relative conservation of MT cysteine domain sequences and motifs across cyanobacteria and bacteria [48], these genes may be possible quantification method candidates involving heavy metal zinc response and resistance in identified MC producing Microcystis species and strains.
While the use of quantitative PCR (qPCR) has yielded both successes and noncorrelation in relating MC synthetase gene copy numbers or gene expressions with collection site MC concentrations [52], qPCR remains a very powerful and accessible technique for the study of gene regulation in known toxigenic or identified cyanobacteria species [53]. Along with other quantitative analysis (HPLC, LC/MS, ELISA) and sequencing profiles, it may lead to the development of known metal-response gene standards for important identified toxic cyanobacteria species and strains. These parameters may better assist in determining toxic vs. non-toxic cyanobacteria response and resistance to heavy metal pollution.
The aim of this study was (1) to study the growth and physiological effects of zinc concentrations on an established toxigenic M. aeruginosa strain; (2) to design mcyC, mcyE, and Mmt qPCR oligonucleotides to quantify mcyC, mcyE and Mmt relative gene expression profiles of this strain treated with varying Zn2+ concentrations; and (3) to determine relative quantitation of MC-LR equivalents within ZnCl2-treated M. aeruginosa using intracellular and extracellular portions.
2. Results
2.1. Growth Response to ZnCl2 in M. Aeruginosa UTEX LB 2385
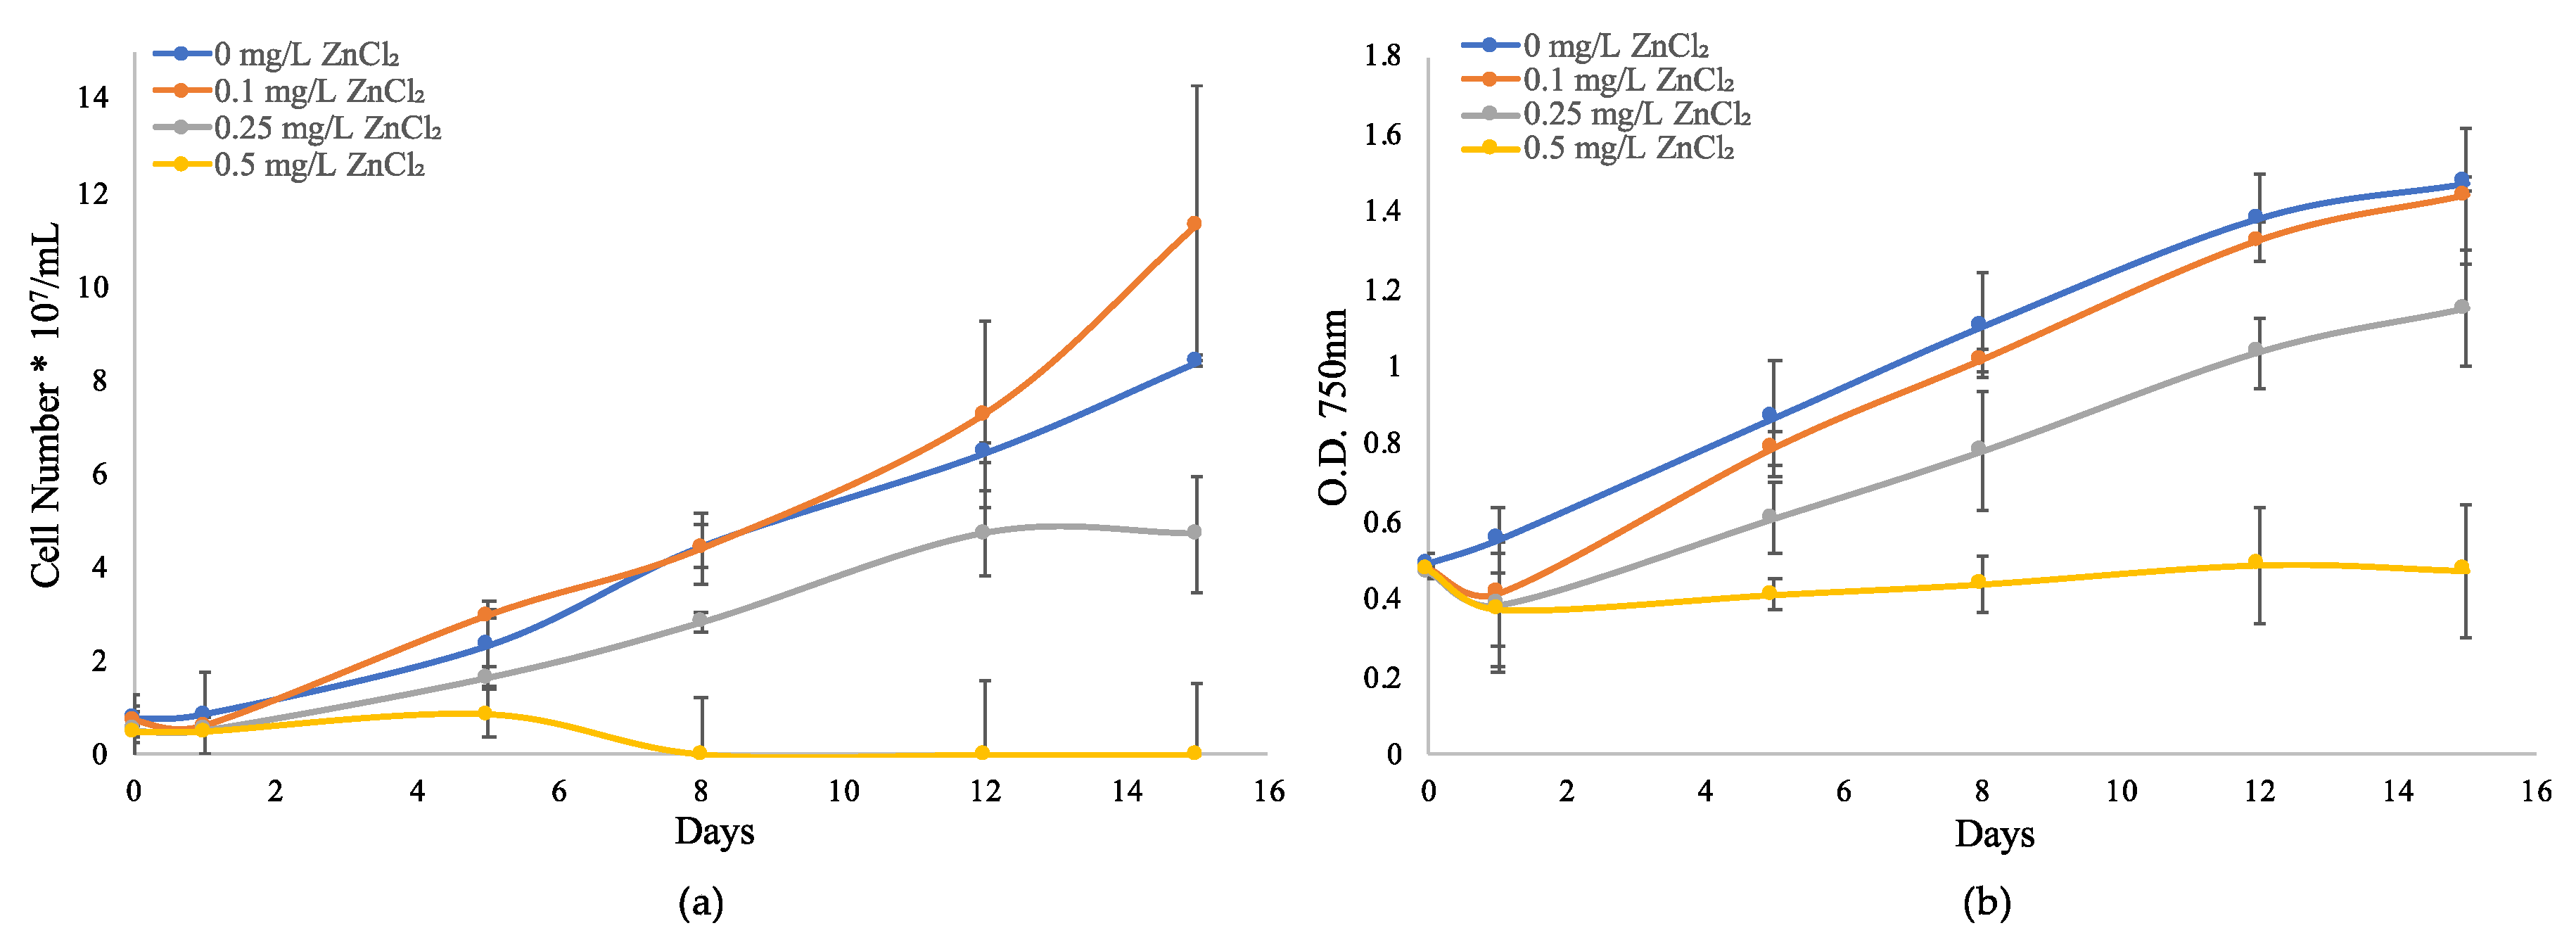
To better evaluate the zinc metal resistance and response mechanisms of a globally important toxigenic cyanobacteria species, M. aeruginosa UTEX LB 2385 cultures were used for the observation of physiological responses to long-term ZnCl2 concentrations exposure via growth monitoring (Figure 1). For M. aeruginosa—UTEX LB 2385 cells exposed to 0.1 mg/L ZnCl2, the cell concentration was similar to 0 mg/L ZnCl2 (control) through 15 days (Figure 1). However, the average turbidity for M. aeruginosa UTEX LB 2385 culture cells exposed to all ZnCl2 concentrations decreased below the initial control measurement (optical density, OD750 nm ≈ 0.47) for 0.1, 0.25, and 0.5 mg/L ZnCl2 by Day 1 (Figure 1b). When compared to control cells, M. aeruginosa UTEX LB 2385 culture cell numbers exposed to 0.25 mg/L ZnCl2 were reduced by ~28% by Day 15 ((4.73 ± 1.243/8.41 ± 0.122) × 100) (Figure 1a). At the highest concentration treatment (0.5 mg/L ZnCl2), M. aeruginosa UTEX LB 2385 culture cells were almost completely inhibited in comparison to 0.25 mg/L ZnCl2 cells by the end of the growth monitoring period. This concentration (0.5 mg/L ZnCl2) may therefore present as the ZnCl2 minimum inhibitory concentration (MIC) for M. aeruginosa UTEX LB 2385 within this study (Figure 1). Aside from these observations, M. aeruginosa UTEX LB 2385 culture cells treated with 0.25 and 0.5 mg/L ZnCl2 were observed via hemocytometer to possess larger aggregate cell clusters and extracellular debris compared to control cells.
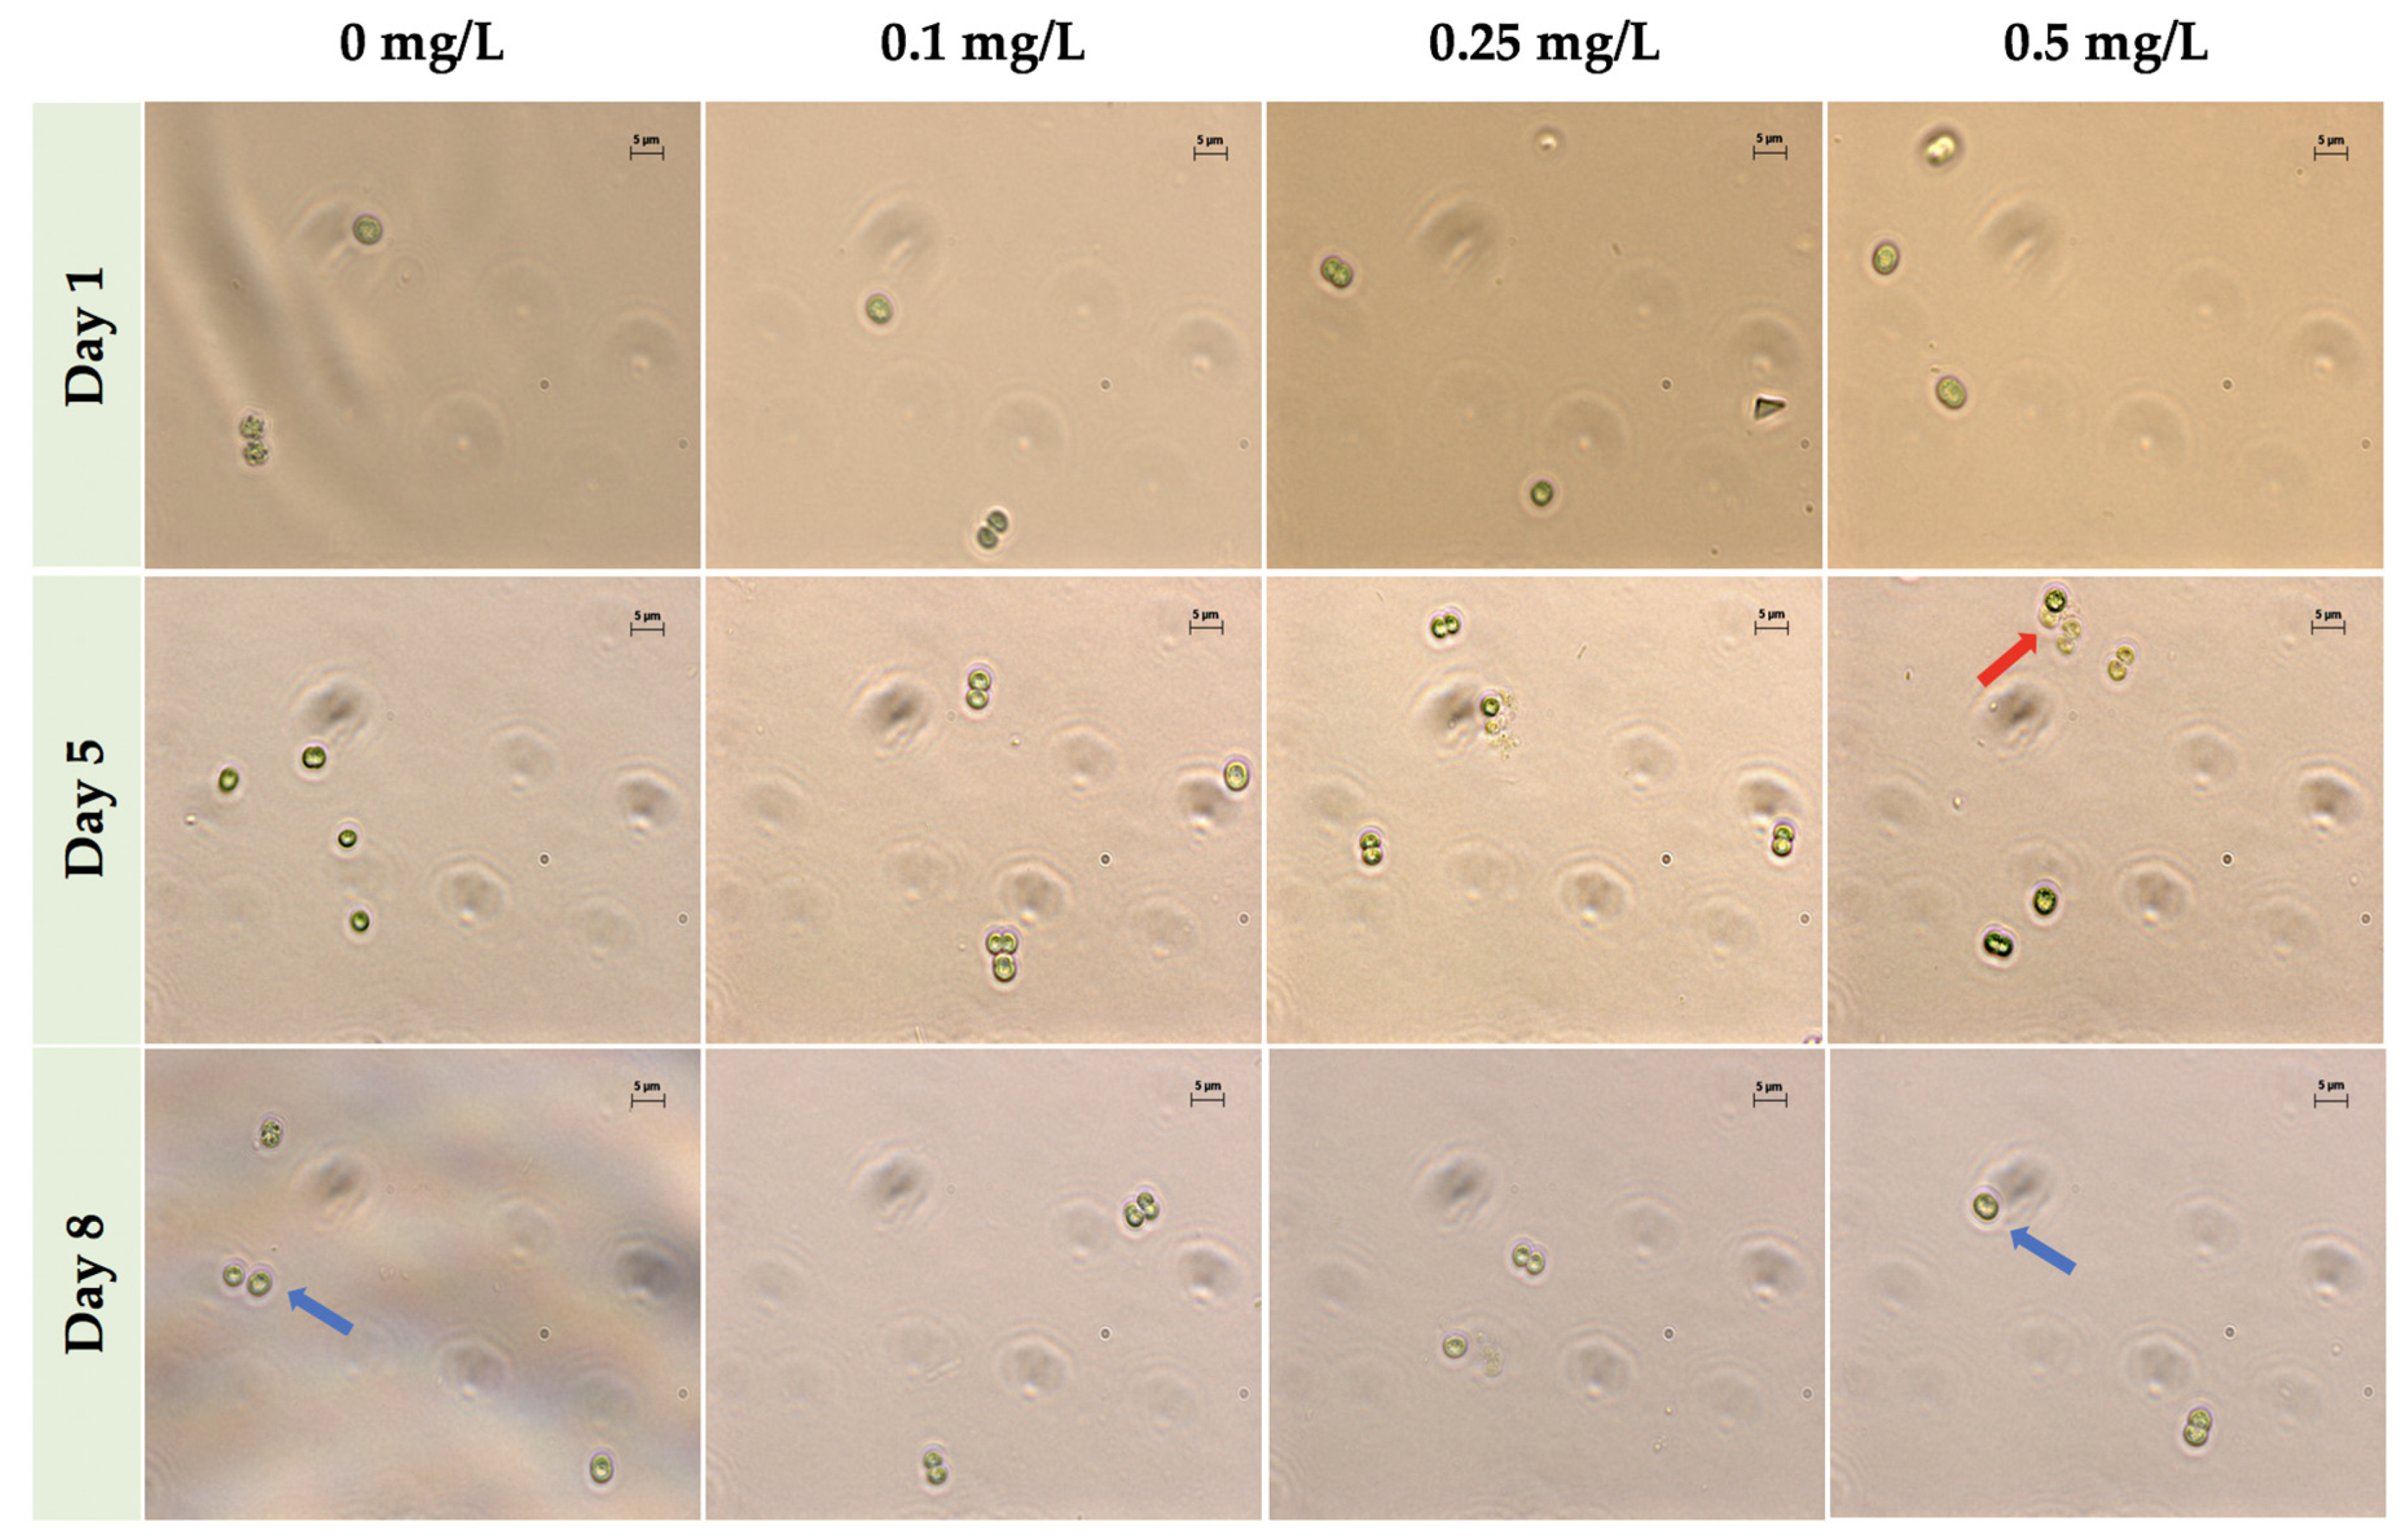
2.2. Phase Contrast Microscopy Imaging in ZnCl2 Exposed Cells
M. aeruginosa UTEX LB 2385 culture cells exposed to 0.25 mg/L ZnCl2 possessed morphological and size characteristics similar to the control cells through eight days as single cells (Figure 2), but also showed an increase in multi-paired cell aggregation and size by Days 5 and 8 when observed via phase contrast microscopy. Additionally, though 0.5 mg/L ZnCl2 treatment greatly inhibited M. aeruginosa UTEX LB 2385 culture cell numbers by Day 8 compared to the control, there was an observable number of cells possessing similar M. aeruginosa UTEX LB 2385 morphology to control cells (Figure 2). It also appeared a greater observable amount of multi-cell aggregation within 0.5 mg/L ZnCl2 treated cells versus control cells. Flow cytometry was used to further evaluate the population sizes of ZnCl2 treated M. aeruginosa UTEX LB 2385.
2.3. Flow Cytometry
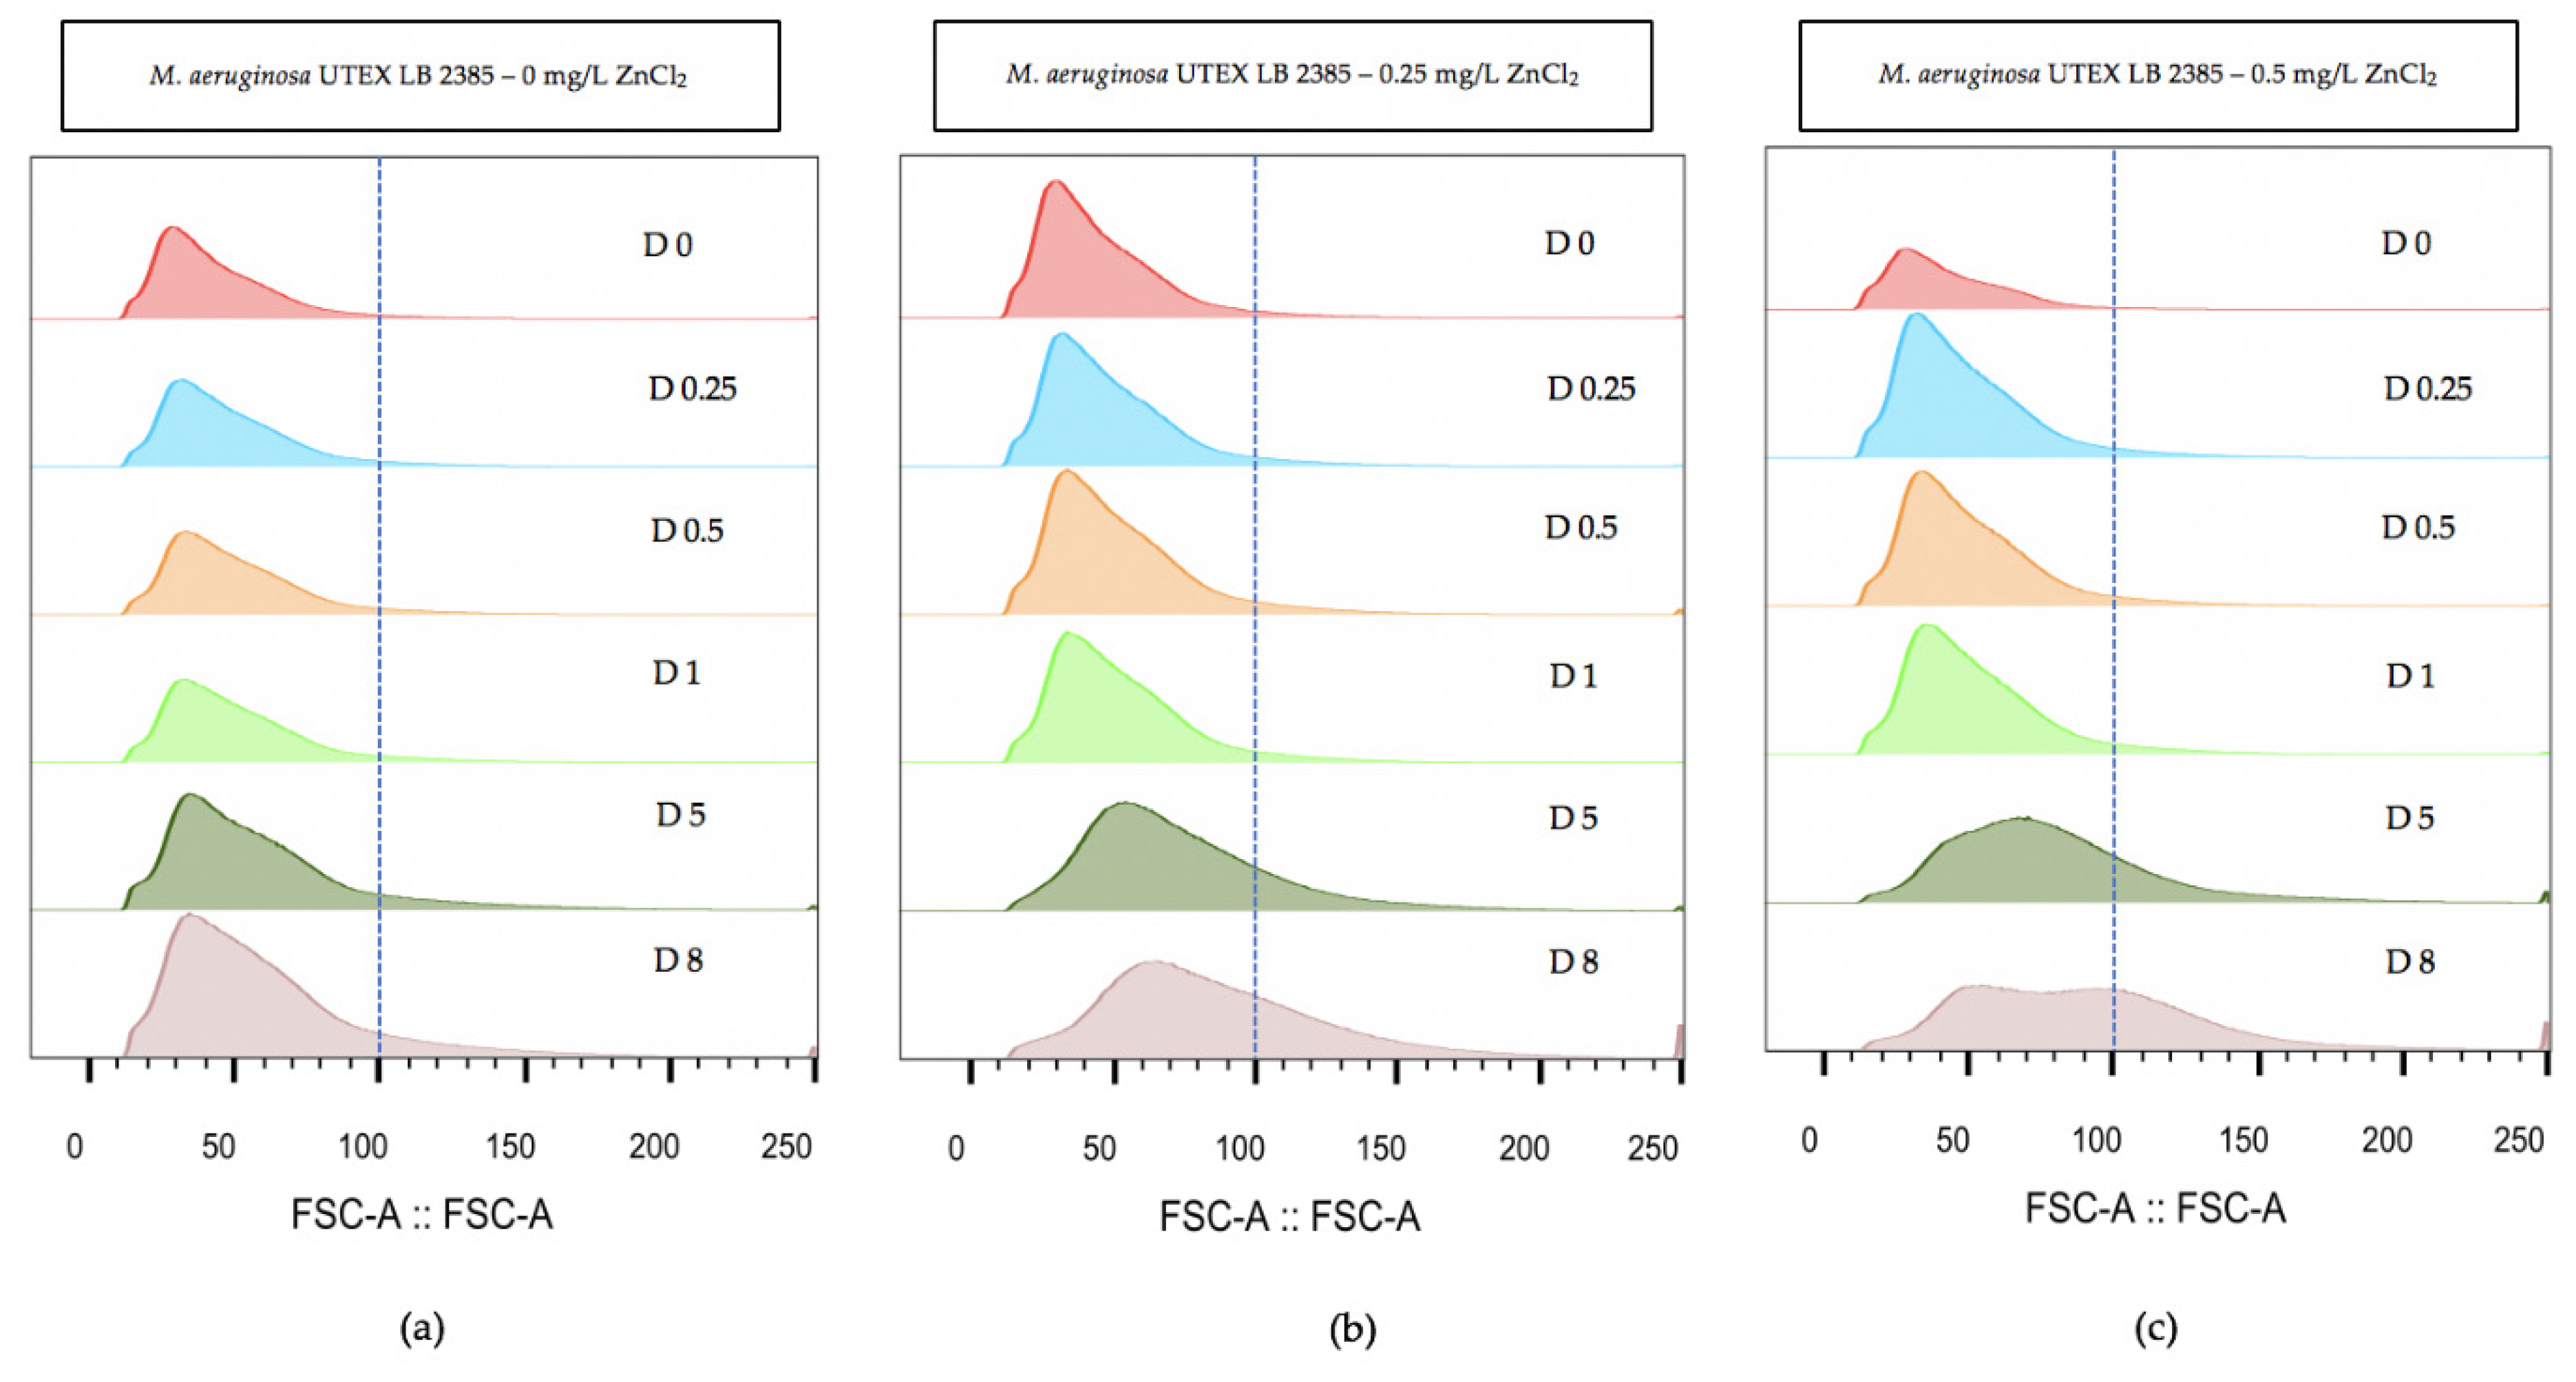
Flow cytometry was used over the eight day time-course to evaluate the relative morphology size of M. aeruginosa UTEX LB 2385 culture cell populations treated with the highest ZnCl2 concentrations (0.25 and 0.5 mg/L). The flow cytometry measurement (FCM) histogram profiles were ungated for subpopulations to evaluate overall distribution of single cell + multi-cell aggregates. Figure 3 demonstrates a histogram profile of 0, 0.25, and 0.5 mg/L ZnCl2 treated M. aeruginosa UTEX LB 2385 cultures through size (forward scatter: FSC-A) parameter. By Day 8, (Figure 3) the FSC-A histograms of M. aeruginosa UTEX LB 2385 cultures treated with 0.25 and 0.5 mg/L ZnCl2 had positively shifted in comparison to the control cultures, with increasing FSC-A measurement (Figure 3). M. aeruginosa UTEX LB 2385 cultures treated with 0.5 mg/L ZnCl2 showed a distinct, larger population size and two small peaks at Day 8 compared to the control—supporting both hemocytometer cell count and microscopic observations of greater numbers of multi-cell aggregates (Figure 3c(D8)). FlowJo software statistical analysis showed average 0.5 mg/L ZnCl2 treated cells FSC-A measurement was approximately 91 versus 62 for 0 mg/L ZnCl2 treated cells at Day 8.
2.4. Quantitative Polymerase Chain Reaction (qPCR) Analysis of M. Aeruginosa UTEX LB 2385
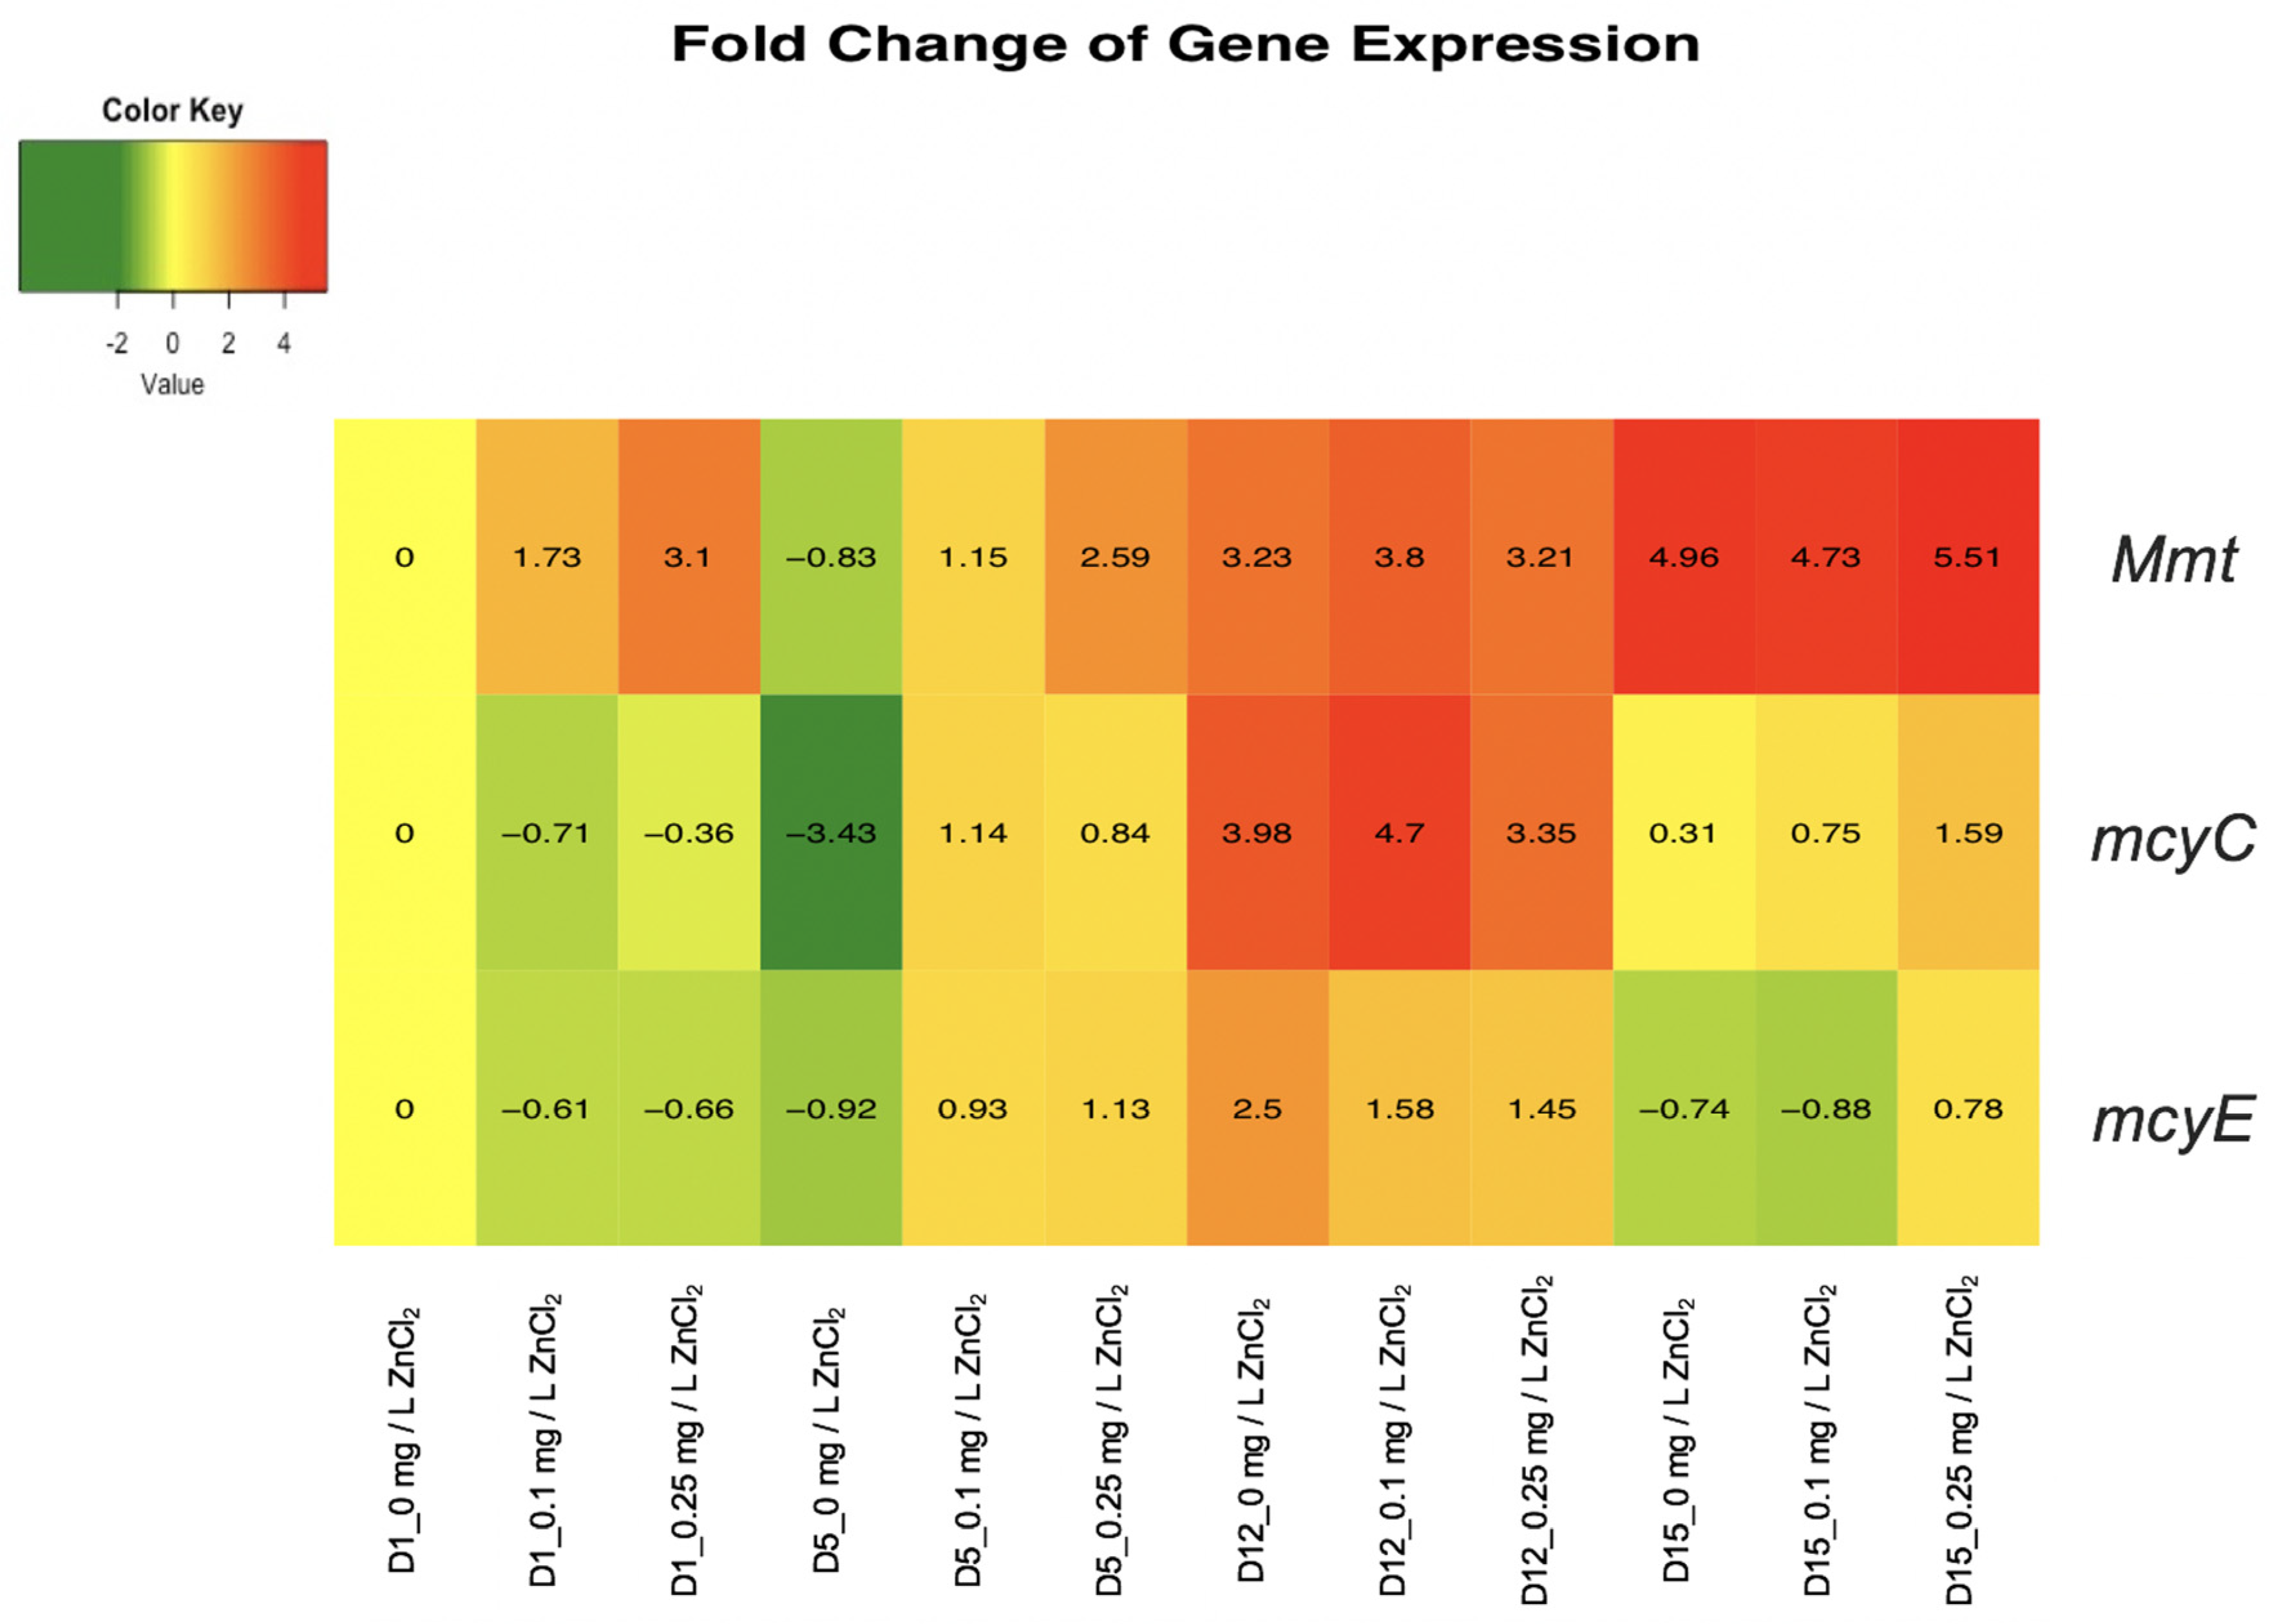
The qPCR analysis results were calculated as fold change gene expressions of Mmt, mcyC, and mcyE relative to the M. aeruginosa UTEX LB 2385 16S ribosomal RNA internal control, within the specific time period and samples (Days 1, 5, 12, 15 for 0, 0.1, and 0.25 mg/L ZnCl2) and the initial 0 mg/L ZnCl2 Day 1 sample. Fold change gene expression values were expressed as [2−ΔΔCt] and evaluated as a combined [log2(RQ)] heatmap within RStudio statistical software. The genes expressed in log2 > 0 were represented within an orange-red color scale and indicate upregulation as a response to ZnCl2 treatment, and the genes in log2 < 0 were represented within a green color scale and indicated downregulation as a response to ZnCl2 treatment. Welch two sample t-tests of 16S rRNA endogenous average Ct values control were found to not be statistically different within each sample condition (all p values > 0.05). The specific sample treatment and days were abbreviated as D1_0 mg/L ZnCl2, D1_0.1 mg/L ZnCl2, D1_0.25 mg/L ZnCl2, etc. Correlating to Day 1 treatments for 0, 0.1, and 0.25 mg/L ZnCl2, respectively (Figure 4).
M. aeruginosa UTEX LB 2385 Mmt expression displayed an overall upregulation over the time course period of 15 days, with 0.25 mg/L ZnCl2 treated cells showing > 3-fold expression by Day 1 (Figure 4). By Day 15 there was a > 5-fold Mmt gene expression within 0.25 mg/L ZnCl2 treated cells, demonstrating a steady increase of Mmt gene expression within this study. Additionally, the overall trend throughout 15 days showed 0.1 and 0.25 mg/L ZnCl2 treated cells to be comparable or greater than control (0 mg/L ZnCl2) cells (Figure 4—top row).
M. aeruginosa UTEX LB 2385 mcyE gene expression showed the least change of expression between both mcy genes profiles, with an initial slight mcyE down-regulation by Day 1 in 0.1 and 0.25 mg/L ZnCl2 treated cells. For 0.25 mg/L ZnCl2 treated cells, mcyE gene expression showed slight up-regulation from Days 5 to 15 in comparison to the control cells (Figure 4—bottom row). The expression of mcyC was shown to be significantly upregulated at Day 12, with >4.5 fold-increase in 0.1 mg/L ZnCl2 treated cells and >3 fold-increase in 0.25 mg/L ZnCl2 treated cells (Figure 4—middle row). The 0.25 mg/L ZnCl2 treated cells also showed a slight mcyC upregulation in comparison to both the control and 0.1 mg/L ZnCl2 treated cells at Day 15 (Figure 4—middle row, right). The mcyC gene expression profile in ZnCl2 treated cells showed an up-regulation trend at Days 5 and 12 in comparison to all other time periods (Figure 4—middle and bottom rows, center).
2.5. ELISA Analysis
ELISA quantitative analysis of 0, 0.1, 0.25, and 0.5 mg/L ZnCl2 treated M. aeruginosa UTEX LB 2385 cells was performed as MC-LR equivalents using an MC-LR standard curve generated with MC-LR standards (0–5 µg/L). A standard 2nd-order polynomial equation (y = 7.5536x2 − 54.927x + 96.06) was used to calculate MC-LR equivalents below the 2.5 µg/L standard range. The ELISA analysis was performed on extracted MC-LR intracellular and extracellular samples at time periods (Day: 1, 5, 8, 12, and 15). Total MC-LR (µg/cell) quota was calculated by adding intracellular and extracellular MC-LR equivalents and dividing by average cells/L. The Pearson’s r correlation showed that total MC-LR (µg/cell) quota was positively correlated with ZnCl2 concentration (p < 0.05, r = 0.6).
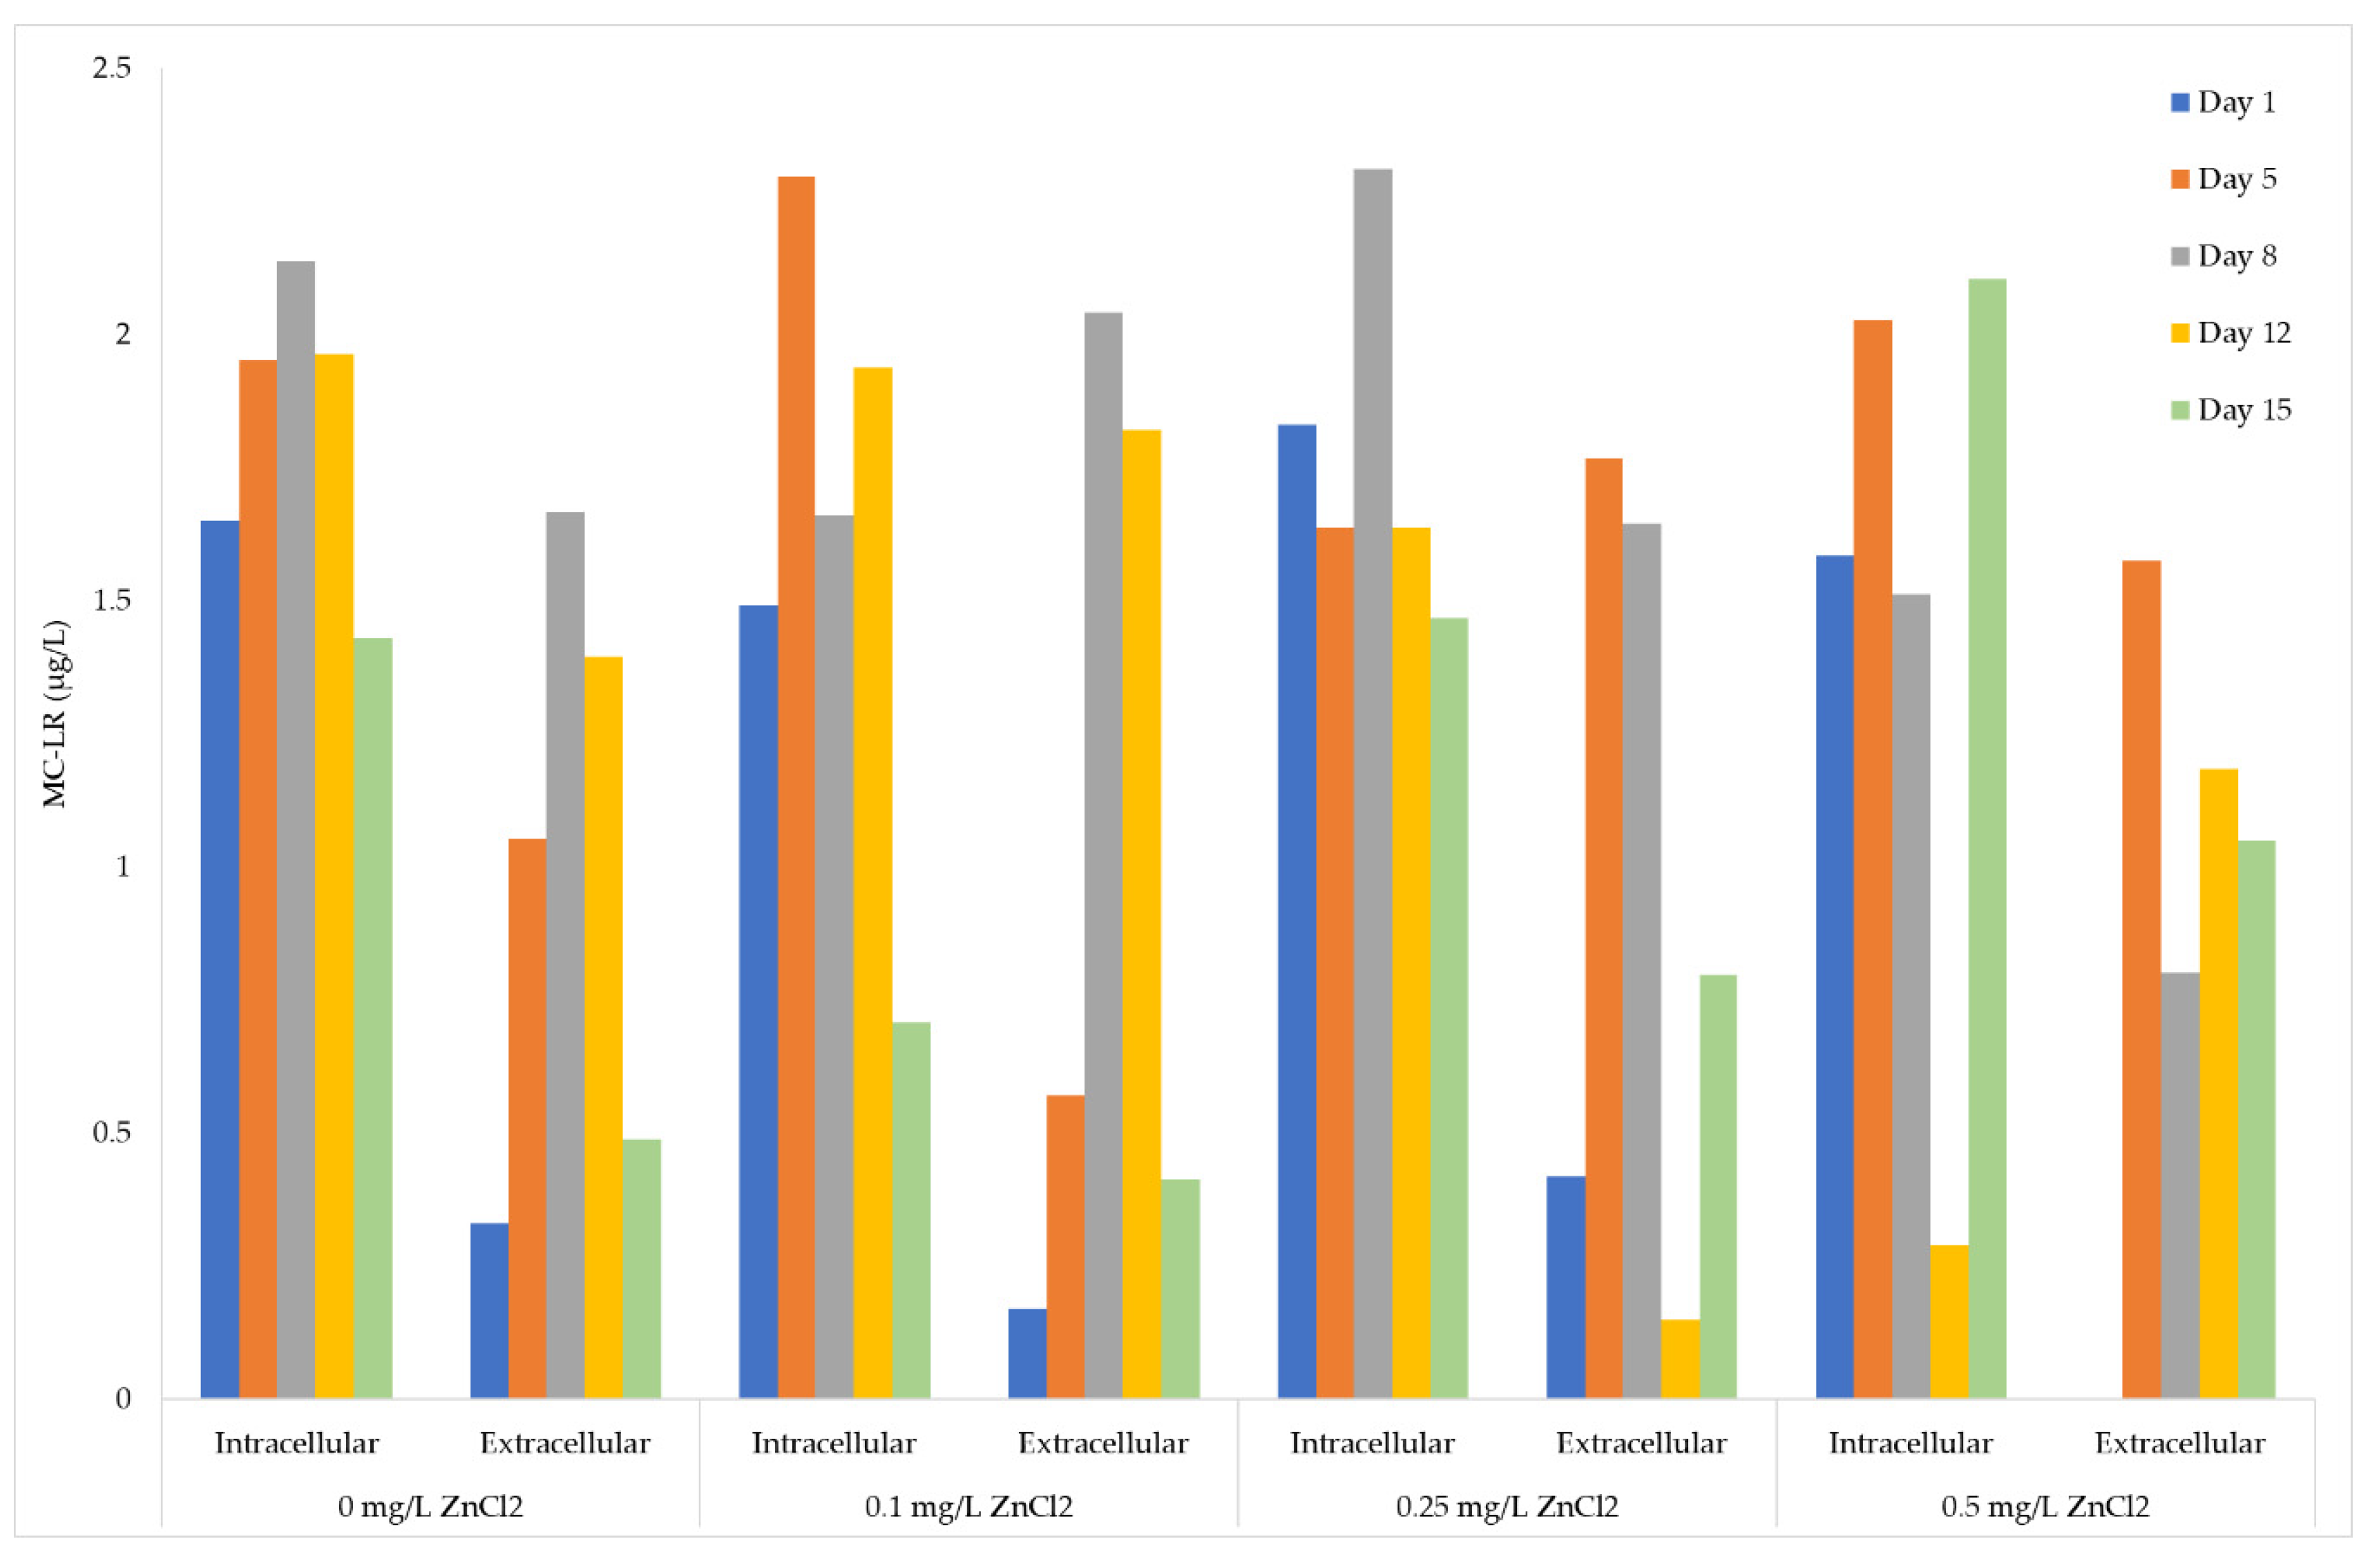
The data was presented as intracellular-extracellular MC-LR (µg/L) equivalents to better evaluate relative concentrations of MC-LR within each sample portion. The extracellular MC-LR (µg/L) equivalents for Days 8 and 12 of M. aeruginosa UTEX LB 2385 cultures treated with 0.1 mg/L ZnCl2 were comparable to 0 mg/L ZnCl2 control cells (18% increase of MC-LR equivalents for Day 8: {(1.67/2.04) × 100}; 23% increase of MC-LR equivalents for Day 12: {(1.40/1.82) × 100}) (Figure 5). Day 12 extracellular MC-LR (µg/L) equivalent measurements for 0.25 mg/L ZnCl2 treated cells decreased from Day 8, but once again increased comparable to control cells at Day 15 (Figure 5). This same time period saw a 40% increase in cell number/mL biomass within 0.25 mg/L ZnCl2 treated cells (see Figure 1a above) and a greater amount of multicell aggregates at Day 8. The 0.25 and 0.5 mg/L ZnCl2 treated cells possessed higher extracellular MC-LR (µg/L) equivalents at Day 5 compared to control cells {~ 40% increase for 0.25 mg/L ZnCl2 cells (1.05/1.77) × 100; ~ 30% increase for 0.5 mg/L ZnCl2 cells (1.05/1.57) × 100) (Figure 5). From Days 8 through 15 of this study, 0.5 mg/L ZnCl2 treated cells yielded significantly higher total MC-LR (µg/cell) quota yield (student’s t-test p < 0.05) than all other ZnCl2 treatment. However, the cell concentration had decreased from Day 5 to Day 8 for 0.5 mg/L ZnCl2 treated cells as stated above. This would indicate possible release of MCs into the extracellular matrix from lysed cells rather than increased MC production due to ZnCl2 concentration.
3. Discussion
Zn is a classified essential, transitional metal ubiquitously involved in numerous cellular biochemical pathways, and is often found within enzyme cavities and protein infrastructures. Zn is often employed in galvanization processes, vulcanization procedures, automobile applications, coating alloy formulations, and various manufacturing components where it often enters the environment in a sequential fashion after ZnO is formed [54]. Environmental chloride ions and pH often form ZnCl2 near man-made sources high in processed Zn [55].
The interactions of zinc and heavy metal pollution with organisms in naturally occurring and man-made aquatic environments presents its own immediate and long-term problems in our increasingly industrial societies. As an example, a surface river, estuary, and bay sediment study in highly industrial Jinzhou Bay, China found Cu, Zn, Pb, and Cd heavy metals concentrations to be correlated to man-made industrial activities, and has been identified as a polluted ecological risk [56]. Relatively, documented metal resistance and stress response mechanisms within cyanobacteria populations necessitates that focus shifts towards risk assessment, prevention, and treatment. Synechococcus sp. IU 625 cultures were shown to be highly tolerant to 25 mg/L ZnCl2 treatment, and a similar strain showed comparable growth to control when treated with 0.1 mg/L and 0.5 mg/L HgCl2 [43,50]. Relatively and conversely, a total-protein profile of an Anabaena flos-aquae isolate showed progressive decrease upon treatment with increasing concentrations of CdCl2 and CuCl2—with the highest concentrations presenting the most considerable biophysiological and biomass damage [57].
CHABs-associated species and strains often found in metal polluted environments must be given special attention due to their potential survivability and resultant detrimental effects (i.e., cyanotoxin release). Although distinct environmental factors have been observed to contribute to favorable conditions conducive to cyanobacteria growth, the specific combinations of effects that causes heavy metal tolerance or resistance in cyanobacteria population are not well understood, or in fact, remain unknown.
Our results showed that M. aeruginosa UTEX LB 2385 is tolerant to ZnCl2 concentrations of 0.1 and 0.25 mg/L, with 0.1 mg/L ZnCl2 treated cell numbers and turbidity measurements being similar to control cells through 15 days (Figure 1a,b). All cell concentrations were found to be statistically similar through five days (student’s t-test p > 0.05 for 0 mg/L and 0.5 mg/L ZnCl2 treated cells/mL). Further, 0.5 mg/L ZnCl2 concentration was found to largely inhibit cell concentration (cell/mL) by Day 15 {(0.01/8.41) × 100 ~ 99.9% inhibition} and decreased the turbidity of the culture. This result is similar to gradual cell density decrease with increasing Zn2+ concentration [11]. Additionally, it was also similar to M. aeruginosa Kütz 854 cultures showing chlorophyll and phycobiliprotein decrease at CdCl2 concentrations of 1 and 2 µM, and a bactericidal reaction at 4 µM CdCl2 treatment [58]. Both a toxic M. aeruginosa (FACHB-905) and a non-toxic strain (FACHB-469) were shown to accumulate Zn2+ and Cd2+ intracellularly as an uptake metal concentration vs. four-hour time rate [59]. This previous study observed intracellular Zn concentration was a good predictor of Zn toxicity in M. aeruginosa. In a different study, a 10 nM treatment of Zn as a free ion concentration did not decrease microcystin/chlorophyll-a (μg/μg) in comparison to UVR and Cu2+ metal treatments of M. aeruginosa strains (UTEX LB 2385 and LE3), but total added Zn to lake water did affect the final biomass and growth rates [60]. Different M. aeruginosa chlorophyll concentrations were also found to be more stable to CdNO3 treatment than to Pb(NO3)2, and only showed chlorophyll decrease at 20 mg/L Cd after 24 h [61]. Additionally, low levels of both Cd and Pb (1–5 mg/L) resulted in increases of chlorophyll fluorescence during 24-h incubation, and showed that specific M. aeruginosa strain was not inhibited at those concentrations. Conversely, Fe2+ and Fe3+ was shown to increase M. aeruginosa cell density with increasing concentrations up to 12 mg/L [11]. Lastly, M. aeruginosa (FACHB-905) cultures were observed to show levels of resistance and recovery to treatment with arsenic (III) concentrations (0.01, 0.1, and 1 mg/L) after 48 h incubation, and only showed marked damaging effects to growth and carotenoids production at 10 mg/L [62]. These observations indicate that heavy metal inhibition, possible resistance, or resultant growth rate in M. aeruginosa is likely dependent on strain and metal species.
Cell counts, phase-contrast microscopy, and flow cytometry (FSC-A) histogram profile showed that M. aeruginosa UTEX LB 2385 treated with 0.25 and 0.5 mg/L ZnCl2 possessed larger amounts of multi-cell aggregates compared to 0 and 0.1 mg/L ZnCl2 treated cells at Day 8 (Figure 3c(D8)). Progressive positive shifting of histograms occurred from Day 5 to Day 8 referenced from FCM of (100) FSC-A for 0.25 and 0.1 mg/L ZnCl2 treated cells (Figure 3). Future experiments should concentrate on the dynamics of aggregation formation as it relates to intracellular molecular profile, in response to increasing ZnCl2 concentrations. Aggregation of many Microcystis species is thought to contribute to possible natural bloom formation, and subsequent protection from environmental factors such as heavy metals [63]. M. aeruginosa were shown able to survive in low concentrations of variable heavy metal compounds, and Microcystis blooms showed a capacity to bioaccumulate and sequester heavy metal compounds within historically eutrophic lakes [7,10,58].
qPCR analysis of 0.1 and 0.25 mg/L ZnCl2 treated M. aeruginosa UTEX LB 2385 showed that Mmt gene expression within this strain was significantly upregulated by ZnCl2 concentration dependent and time period dependent parameters (Figure 4—top row). MTs are well documented divalent/monovalent metal sequestrating, intracellular proteins that are ubiquitously found from prokaryotes to humans. Our results are supported by the observations of cyanobacteria Synechococcus sp. IU 625, which showed a marked upregulation of smtA at 25 mg/L ZnCl2 when analyzed via transcriptome analysis and qPCR analysis [50], and a relative, Synechococcus elongatus PCC 7942, which showed upregulation of smtA with Zn treatment [64]. The expression of mcyC was significantly upregulated at Day 12 for 0.1 and 0.25 mg/L ZnCl2 treatment, while mcyE only showed slight upregulation for 0.1 and 0.25 mg/L ZnCl2 treatment cells at this same time point (Figure 4—middle and bottom row). While there is an obvious correlation of mcyC expression levels and ZnCl2 treatment within this study, mcyE expression level trends varied by both concentration and time period (0 and 0.1 mg/L ZnCl2 showed slight downregulation at Day 15 vs. mcyC) and was not predictive of ZnCl2 concentration response (Figure 4—middle and bottom row, right). Additional mcy gene expression, metal treatment studies should be performed to better assess possible intracellular MC functions. Though mcyC function in Microcystis aeruginosa PCC 7806 has been evaluated to be important in the final condensation reaction release of the entire MC heptapeptide [65], further analysis must be performed to evaluate mcyC gene relation to heavy metal stress response, MC-variant identification, and total MC release to the extracellular environment. The intracellular roles of MCs are still largely undetermined, but a possible siderophore-like function towards zinc and iron may exist under specific intracellular conditions [66]. Molecular modeling for MC-LR metal binding showed that the total potential energy (Kcal⋅mol−1) (relative stability) for MC-LR was: Zn > Cu ≥ Fe ≥ Mg > Ca [46].
ELISA quantitative analysis showed MC-LR (µg/L) were present in all ZnCl2 treated intracellular and extracellular M. aeruginosa UTEX LB 2385 culture portions (Figure 5). There was a higher correlation of MC-LR (µg/cell) yield to 0.5 mg/L ZnCl2 treatment cells from Day One to Day 15 versus 0, 0.1, and 0.2 mg/L ZnCl2 treated cells (p < 0.05, r = 0.6). This correlation was inversely associated with the decreased cell biomass through 15 days, indicating release of MC-LR into the extracellular environment. It was observed that intracellular microcystin production was decreased with increasing multiple metal concentrations, indicating a possible distribution of microcystins (intracellularly to extracellularly) due to cell lysis and/or cellular damage [10]. The 0.25 and 0.5 mg/L ZnCl2 treated cells showed a ~40% and 33% increase of extracellular MC-LR equivalents, respectively, as early as Day 5 (Figure 5). Although 0.5 mg/L ZnCl2 cell concentration was largely inhibited by the end of the monitor period (99.9% inhibition), a number of multi-cell aggregates and a very low cell number of individual cells (1 × 10⁵ cells/mL) were present at Day 15. The sum of all measured extracellular and intracellular MC-LR (µg/L) concentration through 15 days was slightly higher for cultures treated with 0, 0.1, and 0.25 mg/L ZnCl2 than for the 0.5 mg/L ZnCl2 treated culture. These results are supported by observations that total MC presence is largely associated with overall cell biomass [67]. Extracellular MC-LR (µg/L) equivalent measurements for 0.25 mg/L ZnCl2 treated cells fluctuated between Days 8, 12, and 15 (1.64, 0.15, 0.80 µg/L, respectively), but was decreased from Day 5 (Figure 5). Interestingly, the presence of observed multi-cell aggregates in both 0.25 and 0.5 mg/L ZnCl2 treated cells from Days 8 through 15 coincided with this observation. These structures may have possibly affected MC interactions with higher ZnCl2 concentrations (0.25 and 0.5 mg/L ZnCl2) in the extracellular environment for the measured time period. A further study of multi-cell aggregation, Exopolysaccharides (EPS) production, and the MC role in the extracellular environment must be evaluated to determine interaction dynamics and possible association. These observations are supported by the following studies. The application of 0.5 mg⋅L −1 Zn2+ was shown to increase the dissolve organic carbon (DOC) concentration of M. aeruginosa (FACHB 469) into the surrounding media by a 18-day study [68]. Furthermore, it was shown that the addition of MC-RR (0.25–10 µg⋅L−1) significantly enlarged Microcystis colony size, specifically increasing EPS production [69]. There are a number of undetermined factors concerning the interaction of MCs-metal species in the extracellular environment, and these factors are complicated by the presence of EPS, amino acids, and miscellaneous molecules produced by stress-responsive cells.
Further associative evaluation of Microcystis aggregation and the associated multi-cell components to heavy metal stress is necessary to determine potential resistance mechanisms and survivability dynamics of this cyanobacteria. A future transcriptomic evaluation of Zn heavy metal response in M. aeruginosa is necessary to profile which intracellular and extracellular localizing genes are in regulation, and to distinguish this important CHAB-associated cyanobacteria species from other cyanobacteria species. Finally, the role of MCs in the extracellular environment must be further determined to understand cyanobacteria-cyanobacteria environment dynamics.
4. Conclusions
This study exhibits the ZnCl2 metal stress response and resistance capabilities that a universal CHAB species, Microcystis aeruginosa (in this study with strain M. aeruginosa UTEX LB 2385) possesses, and the potential survivability this species demonstrates in increasing polluted aquatic environments. M. aeruginosa UTEX LB 2385 was observed to survive ZnCl2 concentrations of up to 0.25 mg/L, with increasing biomass through 15 days. Though mostly inhibited, 0.5 mg/L ZnCl2 treated cultures presented multi-cell aggregates and residual populations through 15 days. A persistent yield of the cyanotoxin MC-LR (µg/cell) was observed in all ZnCl2 treated cells by 15 days, indicating that this cyanotoxin remains present in the environment even with low cell concentrations. This finding was supported by qPCR data gene expression profiles of Mmt and mcyC, suggesting that M. aeruginosa UTEX LB 2385 possesses several metal response mechanisms.
5. Materials and Methods
5.1. Growth Monitoring
Microcystis aeruginosa UTEX LB 2385 (NCBI Taxon ID: 1296356) was acquired from UTEX Culture Collection of Algae, TX, USA, and was grown to late exponential growth phase (OD750 nm = 1.0; cells/mL = 6 × 10⁷) in sterile 1X Cyanobacteria BG-11 Freshwater Medium (Sigma Life Sciences, St. Louis, MO, USA), within a sterile 250 mL Borosilicate Erlenmeyer flask at 21 ± 2 °C under constant 24 h cool-white fluorescent light (24 µmol⋅m−2 s−1 photons) at a constant agitation of 100 rpm (Innova 2000 Platform Shaker—New Brunswick Scientific, Edison, NJ, USA). The 1X Cyanobacteria BG-11 media was prepared with sterile deionized Milli-Q water (Milli-Q Plus ultra-pure water system—Millipore, Billerica, MA, USA) and the pH was adjusted to 8.0 ± 0.1 with 1 M NaOH. Duplicate sets of four 20 mL volumes of M. aeruginosa UTEX LB 2385 culture were centrifuged at 2900× g for 10 min, the supernatants were discarded, and the cell pellets were gently washed with sterile deionized Milli-Q water. These cells were repelleted and constituted in 20 mL fresh sterile 1X Cyanobacteria BG-11 media. The 20 mL volumes were aseptically transferred and diluted with 80 mL fresh sterile 1X BG-11 Medium into eight new sterile 250 mL Borosilicate Erlenmeyer Flasks.
5.2. Experimental Design
A sterile 1% zinc chloride (ZnCl2) (Sigma-Aldrich, St. Louis, MO, USA) solution was added to each M. aeruginosa UTEX LB 2385 culture to yield relative ZnCl2 concentrations: 0 mg/L, 0.1 mg/L, 0.25 mg/L, and 0.5 mg/L (0 µM, 0.734 µM, 1.835 µM, 3.669 µM, respectively), as described previously [50,70]. These ZnCl2 concentrations were targeted through multiple growth curve analysis from past experiments, with concentrations as high as 10 mg/L ZnCl2 (data not shown). The rationale was predicated on a previously studied cyanobacterium, Synechococcus sp. IU 625 with ZnCl2. All ZnCl2-treated cultures were maintained at the same culture growth parameters described above and were monitored by turbidity observation at optical density (O.D.750 nm) with an UltraSpec III (Pharmacia LKB—Pfizer, New York, NY, USA) for a predetermined time course of Days: 0, 1, 5, 8, 12, and 15. All M. aeruginosa UTEX LB 2385 culture cell counts were performed via hemocytometer at 400× magnification using an Olympus BH2 BHS-312 Trinocular Microscope (Olympus Corp, Waltham, MA, USA), and all experiments were repeated in triplicates. The standard deviations of duplicate set means were used to generate the growth curves.
5.3. Phase Contrast Microscopy
To determine the physiological effects of ZnCl2 concentration on M. aeruginosa UTEX LB 2385 cultures, cell cultures were collected and imaged. All ZnCl2-treated M. aeruginosa UTEX LB 2385 cultures were collected during the set, predetermined time points (Days: 0, 1, 5, 8, 12, and 15) and immediately imaged with a Zeiss AxioLab A1 phase contrast microscope coupled with an AxioCam MrC camera (Carl Zeiss, Oberkochen, Germany) at 1000× total magnification.
5.4. Flow Cytometry
Sample cell size for ZnCl2-treated M. aeruginosa UTEX LB 2385 cultures was measured (FCM) in 10,000 events per sample within a calibrated MACSQuant Analyzer 10 (Miltenyi Biotec, Auburn, CA, USA) containing 405 nm, 488 nm, and 638 nm lasers, using the forward scatter setting (FSC-A) for a set short term and long term course period of 8 days (0, 0.25, 0.5, 1, 5, 8). For each time point, 1 mL of each cell treatment was aseptically transferred into a 1.5 mL microcentrifuge tubes, and the parameters were set to gently resuspend before 100 µL was measured in FCM. Different cyanobacteria populations may exhibit distinct patterns of size, complexity, and autofluorescence in regards to colony formation and to their phycobilisome complex. Furthermore, the light harvesting components and phycobilisome complex has been shown to be affected by heavy metals in concentration dependent kinetics [71,72]. Allophycocyanin and phycoerythrin fluorescent intensities for M. aeruginosa UTEX LB 2385 cells were measured in a calibrated MACSQuant Analyzer 10 (Miltenyi Biotec, Auburn, CA, USA) for the set time course period of 8 days (data not shown). All flow cytometry histograms and statistical analysis of measurements were generated via FlowJo software analysis (FlowJo, Ashland, OR, USA) to compare the effects of varying concentrations of ZnCl2 treatment within all cultures.
5.5. Total RNA Isolation and cDNA Synthesis
The ZnCl2 treatment (0.5 mg/L) was found to inhibit M. aeruginosa UTEX LB 2385 cell number and decrease turbidity by Day 8. Therefore, total RNA (M. aeruginosa UTEX LB 2385—0, 0.1, and 0.25 mg/L ZnCl2 for Days: 1, 5, 12, and 15) was isolated and purified using a modified Ambion® RiboPure™ Kit (Ambion, Austin, TX, USA) approach. Homogenization and sample disruption preparation was prepared by adding a volume of 48 mL of 100% EtOH to 60 mL of Wash Solution Concentrate. One mL TRI Reagent was then aseptically mixed with 250 µL of cultures within sterile 2 mL microcentrifuge tubes. The mixtures were homogenized (by vortexing), sonicated 15 times with 3 s pulses (20% power) using a Branson Sonifier Cell Disruptor 200 (Emerson Industrial, St. Louis, MO, USA), and incubated for 5 min at room temperature. Homogenates were centrifuged at 12,000× g for 10 min at 4 °C, and supernatants transferred to new sterile 2 mL microcentrifuge tubes. RNA extraction was performed by aseptically adding a volume of 200 µL CHCl3 solution to each sample, tightly capping and vortexing the sample tubes at 700× g for 15 s, and then incubating at room temperature for 5 min. Each sample was centrifuged at 12,000× g for 10 min at 4 °C before 400 µL of aqueous phase was aseptically transferred to sterile 2 mL microcentrifuge tubes. Then, 200 µL of 100% EtOH was aseptically added to the 400 µL of aqueous phase and immediately vortexed at 700× g for 5 s. The sample mixtures were aseptically transferred to a filter cartridge placed within a collection tube, capped, and centrifuged at 12,000× g for 30 s at room temperature. Each sample flow-through was discarded and the filter cartridge (with bound RNA) was replaced within the same collection tube. Next, 500 µL of wash solution was aseptically added to the filter cartridges, capped, and centrifuged at 12,000× g for 30 s at room temperature. Each sample flow-through was discarded and the filter cartridge was replaced within the same collection tube. The same wash solution step was repeated. Then, the filter cartridges were transferred to new sterile collection tubes and 100 µL elution buffer was added to each respective filter column. The samples were then incubated at RT for 2 min and centrifuged at 12,000× g for 30 s to elute RNA.
The concentration (µg/mL) and A260/280 ratios for total RNA samples were checked using a BioDrop UV/VIS Spectrophotometer (Denville Scientific, Metuchen, NJ, USA). The isolated RNA samples served as templates for cDNA synthesis with an ABI High Capacity cDNA Reverse Transcription Kit (Applied Biosystems-Life Technologies, Camarillo, CA, USA), using random hexamers as per the manufacturer’s specification. Briefly for each sample, 10 µL DNase-treated RNA was carefully mixed with 10 µL 2X RT MasterMix I (2 µL RT Buffer; 0.8 µL 25X dNTP Mix; 2 µL 10X RT Random Primers; 1 µL MultiScribe™ Reverse Transcriptase; 4.2 µL sterile nuclease-free H2O) within a 200 µL nuclease-free reaction tube. The sample tubes were placed and run in a Veriti 96 well Thermocycler (Applied Biosystems, Camarillo, CA, USA) via incubation at 25 °C for ten minutes, 37 °C for two hours, and RT inactivation at 85 °C for 5 m. cDNA sample concentrations and A260/280 ratios were checked using a BioDrop UV/VIS Spectrophotometer, and stored at −20 °C until prepared to use.
Microcystis aeruginosa Mmt, mcyC, and mcyE genes were chosen for primer design based upon phylogenetic analysis of 16S-23S rRNA ITS sequences, multiple alignment of Microcystis aeruginosa MC synthetase sequences, and multiple alignment of selected Microcystis MT amino acid sequences (T-Coffee Program) (data not shown).
5.6. Quantitative Polymerase Chain Reaction (qPCR)
Oligonucleotides for qPCR were designed using IDT qPCR PrimerQuest (IDT, IA, USA) based on Microcystis aeruginosa mt gene (M. aeruginosa PCC 7941 (NZ_HE973171), and qPCR mcyC and mcyE oligonucleotides were designed based on M. aeruginosa mcy genes (M. aeruginosa UTEX LB 2388: EU009881 and M. aeruginosa K-139: AB032549, respectively) using IDT qPCR PrimerQuest. The following primer pairs were generated: MmtRT2f: 5ʹ-TTGTGAATCCTGTACGTGTCAA-3ʹ and MmtRT2r: 5ʹ-GTCCACAGCCTTTCCCTTTA-3ʹ; mcyC_RT1f: 5ʹ-GGCTAAACCTGACGGGTATAAA-3ʹ and mcyC_RT1r: 5ʹ-CGCAATATTGAGGGAACACAAG-3ʹ; mcyE_RT1f: 5ʹ-AAGTGGGACCAAGACCAATAC-3ʹ and mcyE_RT1r: 5ʹ-TCTAAGCCACGATTGAGAGAAC-3ʹ. An endogenous control was designed to normalize the relative gene expression of mcyC, mcyE, and mt genes using IDT PrimerQuest with M. aeruginosa UTEX LB 2385 (KF372572) 16S ribosomal RNA {MA8516S_RT1F: 5ʹ-GTAGCAGGAATTCCCAGTGTAG-3ʹ and MA8516S_RT1R: 5ʹ-TTCGTCCCTGAGTGTCAGATA-3ʹ}.
The cDNA samples were diluted to a concentration of ~100 µg/mL and measured with a BioDrop UV/VIS Spectrophotometer to determine A260/280 ratios. The comparative CT relative gene expression method was used with the final equation:
Fold change = 2−ΔΔCt
Quantitative RT PCR reactions were performed within 96-well plate assays using an Applied Biosystems StepOnePlus™ Real Time PCR System (ThermoFisher Scientific, MA, USA) with a Luna® Universal qPCR Master Mix (New England BioLabs, Ipswich, MA, USA) (containing Hot Start Taq DNA Polymerase). SYBR green dye chemistry was used for reactions containing: 10 µL qPCR Master Mix, 7 µL nuclease-free H2O, 1 µL of forward and 1 µL reverse primers for a total final 1 µM concentration, and 1 µL < 100 ng final mass of diluted cDNA. The qPCR reactions were performed in triplicates through an initial incubation of 50 °C for two minutes, an initial one-cycle denaturation step at 95 °C for 60 s, and 40 cycles of 95 °C denaturation for 15 s with 60 °C extension for 30 s.
5.7. Enzyme-Linked Immunosorbent Assay (ELISA)
ZnCl2-treated M. aeruginosa UTEX LB 2385 cultures were collected for a predetermined course of 15 days (Days: 1, 5, 8, 12, and 15) by centrifuging at 2900× g for 10 min at RT. The supernatants were aseptically removed from the pellets and filtered into new sterile centrifuge tubes using sterile microfiltration apparatus (with sterile ≤ 0.22 µm membrane filters). All pellet and supernatant samples were frozen at −20 °C and stored for 15 days. Intracellular microcystin samples were extracted via modified extraction methods [22,73]. Briefly, frozen M. aeruginosa UTEX LB 2385 pellet samples were thawed, refrozen at −20 °C and thawed again, before 5 mL 75% methanol was added and samples were sonicated for 1 min at 20% power using a Branson Sonifier Cell Disruptor 200 (Emerson Industrial, St. Louis, MO, USA). The homogenized pellet samples were allowed to sit at RT for 5 min before they were transferred to a sterile microfiltration device/apparatus (with a sterile ≤ 0.22 µm membrane filter). For initial supernatant samples, 5 mL 75% methanol was added and mixed, before aseptically transferring to their respective sterile microfiltration device/apparatus. The total filtrates were diluted to final 1 mL 4% methanol working sample solutions.
ELISA quantitation for intracellular and extracellular microcystin-LR equivalents was performed using a Microcystin-LR ELISA kit (colorimetric) (Abnova, Taipei, Taiwan) as per manufacturer specifications. Final absorbances were read at 450 nm in duplicates using a Varioskan™ LUX multimode microplate reader (ThermoFisher Scientific, Waltham, MA, USA) with SkanIt Software.
5.8. Statistical Analysis
The growth analysis experiments were performed in triplicates and the standard deviation of means were used to generate growth curves. The statistical analysis of flow cytometry measurements (FCM) were generated via FlowJo software analysis (FlowJo, Ashland, OR, USA). The initial raw data was analyzed using the comparative Ct method in the ABI StepOne Software (Life Technologies, Camarillo, CA, USA). To ascertain if the endogenous 16S rRNA reference gene varied due to experimental conditions, student’s t-tests were performed for all accumulated averaged Ct values organized as treatment groups [74]. The full form of the comparative Ct method equation (1) was used to evaluate relative quantifications of mcyE, mcyC, and mt genes using the MA_UTEX LB 2385-specific 16S rRNA endogenous control for the calculations. A Welch two sample t-test was used to evaluate possible statistical significance between different, pooled ZnCl2 treatment groupings of 16S rRNA endogenous control, using RStudio statistical software (RStudio Team, 2018). A standard 2nd-order polynomial equation (y = 7.5536x2 −54.927x + 96.06) was used to calculate MC-LR equivalents below the 2.5 µg/L standard range. Total MC-LR (µg/cell) quota was calculated by adding intracellular-extracellular MC-LR equivalents (µg/L) and dividing by average cells/L. A Pearson’s product-moment r correlation was used to evaluate increasing ZnCl2 concentration.
Author Contributions
Conceptualization, T.C.; methodology, J.L.P., and T.C.; investigation, J.L.P.; formal analysis, J.L.P., and T.C.; resources, T.C.; data curation, T.C.; writing—original draft preparation, J.LP.; writing—review and editing, T.C.; visualization, J.L.P., and T.C.; supervision, T.C.; project administration, T.C.; funding acquisition, T.C. All authors have read and agreed to the published version of the manuscript.
Funding
This research was funded by Seton Hall University (SHU) Biological Sciences Department Annual Research Fund and William and Doreen Wong Foundation to T.C.
Conflicts of Interest
The authors declare no conflicts of interest.
References
- Cassier-Chauvat, C.; Chauvat, F. Responses to Oxidative and Heavy Metal Stresses in Cyanobacteria: Recent Advances. IJMS 2014, 16, 871–886. [Google Scholar] [CrossRef] [PubMed] [Green Version]
- O’Neil, J.M.; Davis, T.W.; Burford, M.A.; Gobler, C.J. The rise of harmful cyanobacteria blooms: The potential roles of eutrophication and climate change. Harmful Algae 2012, 14, 313–334. [Google Scholar] [CrossRef]
- Paerl, H.W.; Fulton, R.S.; Moisander, P.H.; Dyble, J. Harmful Freshwater Algal Blooms, With an Emphasis on Cyanobacteria. Sci. World J. 2001, 1, 76–113. [Google Scholar] [CrossRef] [PubMed]
- Paerl, H.W.; Hall, N.S.; Calandrino, E.S. Controlling harmful cyanobacterial blooms in a world experiencing anthropogenic and climatic-induced change. Sci. Total Environ. 2011, 409, 1739–1745. [Google Scholar] [CrossRef] [PubMed]
- Patidar, S.K.; Chokshi, K.; George, B.; Bhattacharya, S.; Mishra, S. Dominance of cyanobacterial and cryptophytic assemblage correlated to CDOM at heavy metal contamination sites of Gujarat, India. Environ. Monit. Assess 2015, 187, 4118. [Google Scholar] [CrossRef] [PubMed]
- Visser, P.M.; Verspagen, J.M.H.; Sandrini, G.; Stal, L.J.; Matthijs, H.C.P.; Davis, T.W.; Paerl, H.W.; Huisman, J. How rising CO2 and global warming may stimulate harmful cyanobacterial blooms. Harmful Algae 2016, 54, 145–159. [Google Scholar] [CrossRef] [Green Version]
- Jia, Y.; Chen, W.; Zuo, Y.; Lin, L.; Song, L. Heavy metal migration and risk transference associated with cyanobacterial blooms in eutrophic freshwater. Sci. Total Environ. 2018, 613–614, 1324–1330. Available online: https://0-www-sciencedirect-com.brum.beds.ac.uk/science/article/pii/S0048969717325317?via%3Dihub (accessed on 20 December 2019). [CrossRef]
- Ludwig, M.; Chua, T.T.; Chew, C.Y.; Bryant, D.A. Fur-type transcriptional repressors and metal homeostasis in the cyanobacterium Synechococcus sp. PCC 7002. Front. Microbiol. 2015, 6, 1217. [Google Scholar] [CrossRef] [Green Version]
- Martínez-Ruiz, E.B.; Martínez-Jerónimo, F. How do toxic metals affect harmful cyanobacteria? An integrative study with a toxigenic strain of Microcystis aeruginosa exposed to nickel stress. Ecotoxicol. Environ. Saf. 2016, 133, 36–46. [Google Scholar] [CrossRef]
- Polyak, Y.; Zaytseva, T.; Medvedeva, N. Response of Toxic Cyanobacterium Microcystis aeruginosa to Environmental Pollution. Water Air Soil Pollut. 2013, 224, 1494. [Google Scholar] [CrossRef]
- Zhou, H.; Chen, X.; Liu, X.; Xuan, Y.; Hu, T. Effects and control of metal nutrients and species on Microcystis aeruginosa growth and bloom. Water Environ. Res. 2019, 91, 21–31. [Google Scholar] [CrossRef] [PubMed]
- Cheung, M.Y.; Liang, S.; Lee, J. Toxin-producing cyanobacteria in freshwater: A review of the problems, impact on drinking water safety, and efforts for protecting public health. J. Microbiol. 2013, 51, 1–10. [Google Scholar] [CrossRef] [PubMed]
- Lopez-Rodas, V.; Maneiro, E.; Lanzarot, M.P.; Perdigones, N.; Costas, E. Mass wildlife mortality due to cyanobacteria in the Donana National Park, Spain. Vet Rec. 2008, 162, 317–318. [Google Scholar] [CrossRef] [PubMed]
- Codd, G.; Bell, S.; Kaya, K.; Ward, C.; Beattie, K.; Metcalf, J. Cyanobacterial toxins, exposure routes and human health. Eur. J. Phycol. 1999, 34, 405–415. [Google Scholar] [CrossRef]
- Hitzfeld, B.C.; Hoger, S.J.; Dietrich, D.R. Cyanobacterial toxins: Removal during drinking water treatment, and human risk assessment. Environ. Health Perspect. 2000, 108, 10. [Google Scholar]
- Otten, T.G.; Paerl, H.W. Health Effects of Toxic Cyanobacteria in U.S. Drinking and Recreational Waters: Our Current Understanding and Proposed Direction. Curr. Envir. Health Rpt. 2015, 2, 75–84. [Google Scholar] [CrossRef] [Green Version]
- Carmichael, W.W. Cyanobacteria secondary metabolites-the cyanotoxins. J. Appl. Bacteriol. 1992, 72, 445–459. [Google Scholar] [CrossRef]
- Dittmann, E.; Fewer, D.P.; Neilan, B.A. Cyanobacterial toxins: biosynthetic routes and evolutionary roots. Fems. Microbiol. Rev. 2013, 37, 23–43. [Google Scholar] [CrossRef]
- Carmichael, W.W.; Azevedo, S.M.; An, J.S.; Molica, R.J.; Jochimsen, E.M.; Lau, S.; Rinehart, K.L.; Shaw, G.R.; Eaglesham, G.K. Human fatalities from cyanobacteria: chemical and biological evidence for cyanotoxins. Envrion. Health Perspect 2001, 109, 663–668. [Google Scholar] [CrossRef]
- Sanseverino, I.; Conduto, D.; Pozzoli, L.; Dobricic, S.; Lettieri, T.; European, C.; Joint Research, C. Algal Bloom and Its Economic Impact; JRC Science Hub: Ispra, Italy, 2016; Volume 52, Available online: https://publications.jrc.ec.europa.eu/repository/bitstream/JRC101253/lbna27905enn.pdf. (accessed on 20 December 2019).
- Dodds, W.K.; Bouska, W.W.; Eitzmann, J.L.; Pilger, T.J.; Pitts, K.L.; Riley, A.J.; Schloesser, J.T.; Thornbrugh, D.J. Eutrophication of U.S. Freshwaters: Analysis of Potential Economic Damages. Environ. Sci. Technol. 2009, 43, 12–19. [Google Scholar] [CrossRef] [Green Version]
- Chorus, I.; Falconer, I.R.; Salas, H.J.; Bartram, J. Health risks caused by freshwater cyanobacteria in recreational waters. J. Toxicol Environ. Health B Crit. Rev. 2000, 3, 323–347. [Google Scholar] [CrossRef]
- D’Anglada, L.V. Editorial on the special issue “harmful algal blooms (HABs) and public health: progress and current challenges”. Toxins (Basel) 2015, 7, 4437–4441. [Google Scholar] [CrossRef] [PubMed] [Green Version]
- Davis, T.W.; Berry, D.L.; Boyer, G.L.; Gobler, C.J. The effects of temperature and nutrients on the growth and dynamics of toxic and non-toxic strains of Microcystis during cyanobacteria blooms. Harmful Algae 2009, 8, 715–725. [Google Scholar] [CrossRef]
- Dziallas, C.; Grossart, H.P. Increasing oxygen radicals and water temperature select for toxic Microcystis sp. PloS ONE 2011, 6, e25569. [Google Scholar] [CrossRef] [Green Version]
- van Gremberghe, I.; Leliaert, F.; Mergeay, J.; Vanormelingen, P.; Van der Gucht, K.; Debeer, A.E.; Lacerot, G.; De Meester, L.; Vyverman, W. Lack of phylogeographic structure in the freshwater cyanobacterium Microcystis aeruginosa suggests global dispersal. PLoS ONE 2011, 6, e19561. [Google Scholar] [CrossRef] [Green Version]
- Mlouka, A.; Comte, K.; Castets, A.M.; Bouchier, C.; Tandeau de Marsac, N. The gas vesicle gene cluster from Microcystis aeruginosa and DNA rearrangements that lead to loss of cell buoyancy. J. Bacteriol. 2004, 186, 2355–2365. [Google Scholar] [CrossRef] [Green Version]
- Mlouka, A.; Comte, K.; Tandeau de Marsac, N. Mobile DNA elements in the gas vesicle gene cluster of the planktonic cyanobacteria Microcystis aeruginosa. Fems. Microbiol Lett. 2004, 237, 27–34. [Google Scholar] [CrossRef]
- Wu, Z.-X.; Gan, N.-Q.; Huang, Q.; Song, L.-R. Response of Microcystis to copper stress – Do phenotypes of Microcystis make a difference in stress tolerance? Environ. Pollut. 2007, 147, 324–330. [Google Scholar] [CrossRef]
- Hu, C.; Rzymski, P. Programmed Cell Death-Like and Accompanying Release of Microcystin in Freshwater Bloom-Forming Cyanobacterium Microcystis: From Identification to Ecological Relevance. Toxins (Basel) 2019, 11, 706. [Google Scholar] [CrossRef] [Green Version]
- Oksanen, I.; Lohtander, K.; Sivonen, K.; Rikkinen, J. Repeat-type distribution in trnL intron does not correspond with species phylogeny: comparison of the genetic markers 16S rRNA and trnL intron in heterocystous cyanobacteria. Int. J. Syst. Evol. Microbiol. 2004, 54, 765–772. [Google Scholar] [CrossRef]
- Atencio, L.; Moreno, I.; Jos, A.; Prieto, A.I.; Moyano, R.; Blanco, A.; Camean, A.M. Effects of dietary selenium on the oxidative stress and pathological changes in tilapia (Oreochromis niloticus) exposed to a microcystin-producing cyanobacterial water bloom. Toxicon 2009, 53, 269–282. [Google Scholar] [CrossRef]
- Omidi, A.; Esterhuizen-Londt, M.; Pflugmacher, S. Still challenging: the ecological function of the cyanobacterial toxin microcystin – What we know so far. Toxin Rev. 2018, 37, 87–105. [Google Scholar] [CrossRef] [Green Version]
- Yeung, A.C.Y.; D’Agostino, P.M.; Poljak, A.; McDonald, J.; Bligh, M.W.; Waite, T.D.; Neilan, B.A. Physiological and Proteomic Responses of Continuous Cultures of Microcystis aeruginosa PCC 7806 to Changes in Iron Bioavailability and Growth Rate. Appl. Environ. Microbiol. 2016, 82, 5918–5929. [Google Scholar] [CrossRef] [Green Version]
- Gasperi, J.; Garnaud, S.; Rocher, V.; Moilleron, R. Priority pollutants in wastewater and combined sewer overflow. Sci. Total Enviorn. 2008, 407, 263–272. [Google Scholar] [CrossRef]
- Sakson, G.; Brzezinska, A.; Zawilski, M. Emission of heavy metals from an urban catchment into receiving water and possibility of its limitation on the example of Lodz city. Enviorn. Monit. Assess 2018, 190, 281. [Google Scholar] [CrossRef] [Green Version]
- Sandstead, H.H.; Au, W. Zinc. In Handbook on the Toxicology of Metals; Nordberg, G.F., Fowler, B.A., Nordberg, M., Friberg, L.T., Eds.; Academic Press: Cambridge, MA, USA, 2007; pp. 925–947. Available online: https://0-www-sciencedirect-com.brum.beds.ac.uk/book/9780444594532/handbook-on-the-toxicology-of-metals (accessed on 20 December 2019).
- Martin, G.D.; George, R.; Shaiju, P.; Muraleedharan, K.R.; Nair, S.M.; Chandramohanakumar, N. Toxic Metals Enrichment in the Surficial Sediments of a Eutrophic Tropical Estuary (Cochin Backwaters, Southwest Coast of India). Sci. World J. 2012, 2012, 1–17. [Google Scholar] [CrossRef] [Green Version]
- USEPA; USACE; USDOE-BNL. Fast Track Dredged Material Decontamination Demonstration for the Port of New York and New Jersey; USEPA: Springfield, VA, USA, 1999; Volume 65. Available online: https://www.nj.gov/dep/passaicdocs/docs/NJDOTSupportingCosts/DECON-REPORT-EPA-FastTrkDredgedMatDeconDemoPortNYNJ1999.pdf (accessed on 20 December 2019).
- Hemalatha, S.; Banerjee, T.K. Histopathological analysis of sublethal toxicity of zinc chloride to the respiratory organs of the airbreathing catfish Heteropneustes fossilis (Bloch). Biol. Res. 1997, 30, 11–21. [Google Scholar]
- Salvaggio, A.; Marino, F.; Albano, M.; Pecoraro, R.; Camiolo, G.; Tibullo, D.; Bramanti, V.; Lombardo, B.M.; Saccone, S.; Mazzei, V.; et al. Toxic Effects of Zinc Chloride on the Bone Development in Danio rerio (Hamilton, 1822). Front Physiol. 2016, 7, 153. [Google Scholar] [CrossRef] [Green Version]
- Roney, N.; Smith, C.V.; Williams, M.; Osier, M.; Paikoff, S.J. Toxicological Profile for Zinc. ATSDR, 2005; p. 352. Available online: https://www.atsdr.cdc.gov/toxprofiles/tp60.pdf (accessed on 20 December 2019).
- Chu, T.-C.; Murray, S.R.; Todd, J.; Perez, W.; Yarborough, J.R.; Okafor, C.; Lee, L.H. Adaption of Synechococcus sp. IU 625 to growth in the presence of mercuric chloride. Acta Histochem. 2012, 114, 6–11. [Google Scholar] [CrossRef] [Green Version]
- Dudkowiak, A.; Olejarz, B.; Łukasiewicz, J.; Banaszek, J.; Sikora, J.; Wiktorowicz, K. Heavy Metals Effect on Cyanobacteria Synechocystis aquatilis Study Using Absorption, Fluorescence, Flow Cytometry, and Photothermal Measurements. Int. J. Thermophys 2011, 32, 762–773. [Google Scholar] [CrossRef] [Green Version]
- Morby, A.P.; Turner, J.S.; Huckle, J.W.; Robinson, N.J. SmtB is a metal-dependent repressor of the cyanobacterial metallothionein gene smtA: identification of a Zn inhibited DNA-protein complex. Nucleic Acids Res. 1993, 21, 921–925. [Google Scholar] [CrossRef] [Green Version]
- Pochodylo, A.L.; Klein, A.R.; Aristilde, L. Metal-binding selectivity and coordination dynamics for cyanobacterial microcystins with Zn, Cu, Fe, Mg, and Ca. Environ. Chem Lett. 2017, 15, 695–701. [Google Scholar] [CrossRef]
- Capdevila, M.; Atrian, S. Metallothionein protein evolution: A miniassay. J. Biol. Inorg. Chem. 2011, 16, 977–989. [Google Scholar] [CrossRef]
- Gutiérrez, J.-C.; de Francisco, P.; Amaro, F.; Díaz, S.; Martín-González, A. Structural and Functional Diversity of Microbial Metallothionein Genes. In Microbial Diversity in the Genomic Era; Academic Press: Cambridge, MA, USA, 2019; pp. 387–407. Available online: https://0-www-sciencedirect-com.brum.beds.ac.uk/science/article/pii/B9780128148495000228?via%3Dihub (accessed on 20 December 2019).
- Liu, T.; Nakashima, S.; Hirose, K.; Uemura, Y.; Shibasaka, M.; Katsuhara, M.; Kasamo, K. A metallothionein and CPx-ATPase handle heavy-metal tolerance in the filamentous cyanobacterium Oscillatoria brevis. Febs. Lett. 2003, 542, 159–163. [Google Scholar] [CrossRef] [Green Version]
- Newby, R.; Lee, L.H.; Perez, J.L.; Tao, X.; Chu, T. Characterization of zinc stress response in Cyanobacterium Synechococcus sp. IU 625. Aquat. Toxicol. 2017, 186, 159–170. [Google Scholar] [CrossRef]
- Mikalsen, B.; Boison, G.; Skulberg, O.M.; Fastner, J.; Davies, W.; Gabrielsen, T.M.; Rudi, K.; Jakobsen, K.S. Natural Variation in the Microcystin Synthetase Operon mcyABC and Impact on Microcystin Production in Microcystis Strains. J. Bacteriol. 2003, 185, 2774–2785. [Google Scholar] [CrossRef] [Green Version]
- Pacheco, A.; Guedes, I.; Azevedo, S. Is qPCR a Reliable Indicator of Cyanotoxin Risk in Freshwater? Toxins 2016, 8, 172. [Google Scholar] [CrossRef] [Green Version]
- Chiu, Y.-T.; Chen, Y.-H.; Wang, T.-S.; Yen, H.-K.; Lin, T.-F. A qPCR-Based Tool to Diagnose the Presence of Harmful Cyanobacteria and Cyanotoxins in Drinking Water Sources. Ijerph 2017, 14, 547. [Google Scholar] [CrossRef] [Green Version]
- Wallinder, I.O.; Leygraf, C. A Critical Review on Corrosion and Runoff from Zinc and Zinc-Based Alloys in Atmospheric Environments. Corrosion 2017, 73, 1060–1077. [Google Scholar] [CrossRef]
- Vera, R.; Guerrero, F.; Delgado, D.; Araya, R. Atmospheric Corrosion of Galvanized Steel and Precipitation Runoff from Zinc in a Marine Environment. J. Braz. Chem. Soc. 2013, ,24, 449–458. [Google Scholar] [CrossRef] [Green Version]
- Li, X.; Liu, L.; Wang, Y.; Luo, G.; Chen, X.; Yang, X.; Gao, B.; He, X. Integrated Assessment of Heavy Metal Contamination in Sediments from a Coastal Industrial Basin, NE China. PLoS ONE 2012, 7, 10. [Google Scholar] [CrossRef]
- Surosz, W.; Palinska, K.A. Effects of Heavy-Metal Stress on Cyanobacterium Anabaena flos-aquae. Arch. Environ. Contam. Toxicol 2004, 48, 40–48. [Google Scholar] [CrossRef]
- Zhou, W.; Juneau, P.; Qiu, B. Growth and photosynthetic responses of the bloom-forming cyanobacterium Microcystis aeruginosa to elevated levels of cadmium. Chemosphere 2006, 65, 1738–1746. [Google Scholar] [CrossRef]
- Zeng, J.; Yang, L.; Wang, W.X. Cadmium and zinc uptake and toxicity in two strains of Microcystis aeruginosa predicted by metal free ion activity and intracellular concentration. Aquat. Toxicol. 2009, 91, 212–220. [Google Scholar] [CrossRef]
- Gouvêa, S.P.; Boyer, G.L.; Twiss, M.R. Influence of ultraviolet radiation, copper, and zinc on microcystin content in Microcystis aeruginosa (Cyanobacteria). Harmful Algae 2008, 7, 194–205. [Google Scholar] [CrossRef]
- Rzymski, P.; Poniedzialek, B.; Niedzielski, P.; Tabaczewski, P.; Wiktorowicz, K. Cadmium and lead toxicity and bioaccumulation in Microcystis aeruginosa. Front. Environ. Sci. Eng. 2014, 8, 427–432. [Google Scholar] [CrossRef]
- Wang, S.; Zhang, D.; Pan, X. Effects of arsenic on growth and photosystem II (PSII) activity of Microcystis aeruginosa. Ecotoxicol. Environ. Saf. 2012, 84, 104–111. [Google Scholar] [CrossRef]
- Xiao, M.; Li, M.; Reynolds, C.S. Colony formation in the cyanobacterium Microcystis. Biol. Rev. Camb. Philos. Soc. 2018, 93, 1399–1420. [Google Scholar] [CrossRef] [Green Version]
- Ybarra, G.R.; Webb, R. Effects of Divalent Metal Cations and Resistance Mechanisms of the Cyanobacterium Synechococcus SP. Strain PCC 7942. J. Hazard. Subst. Res. 1999, 2, 11. [Google Scholar] [CrossRef] [Green Version]
- Tillett, D.; Dittmann, E.; Erhard, M.; von Döhren, H.; Börner, T.; Neilan, B.A. Structural organization of microcystin biosynthesis in Microcystis aeruginosa PCC7806: an integrated peptide–polyketide synthetase system. Chem. Biol. 2000, 7, 753–764. [Google Scholar] [CrossRef] [Green Version]
- Kaebernick, M.; Neilan, B.A. Ecological and molecular investigations of cyanotoxin production. Fems Microbiol. Ecol. 2001, 35, 1–9. [Google Scholar] [CrossRef]
- Yu, L.; Kong, F.; Zhang, M.; Yang, Z.; Shi, X.; Du, M. The Dynamics of Microcystis Genotypes and Microcystin Production and Associations with Environmental Factors during Blooms in Lake Chaohu, China. Toxins 2014, 6, 3238–3257. [Google Scholar] [CrossRef]
- Wu, H.; Lin, L.; Shen, G.; Li, M. Heavy-metal pollution alters dissolved organic matter released by bloom-forming Microcystis aeruginosa. Rsc. Adv. 2017, 7, 18421–18427. [Google Scholar] [CrossRef] [Green Version]
- Gan, N.; Xiao, Y.; Zhu, L.; Wu, Z.; Liu, J.; Hu, C.; Song, L. The role of microcystins in maintaining colonies of bloom-forming Microcystis spp.: Microcystis colony maintenance by microcystins. Environ. Microbiol. 2012, 14, 730–742. [Google Scholar] [CrossRef]
- Nohomovich, B.; Nguyen, B.T.; Quintanilla, M.; Lee, L.H.; Murray, S.R.; Chu, T.-C. Physiological effects of nickel chloride on the freshwater cyanobacterium Synechococcus sp. IU 625. ABB 2013, 04, 10–14. [Google Scholar] [CrossRef] [Green Version]
- Babu, N.G.; Sarma, P.A.; Attitalla, I.H.; Murthy, S.D.S. Effect of Selected Heavy Metal Ions on the Photosynthetic Electron Transport and Energy Transfer in the Thylakoid Membrane of the Cyanobacterium, Spirulina platensis. Acad. J. Plant. Sci 2010, 3, 46–49. [Google Scholar]
- Khattar, J.I.S.; Sarma, T.A.; Sharma, A. Effect of Cr6+ Stress on Photosynthetic Pigments and Certain Physiological Processes in the Cyanobacterium Anacystis nidulans and Its Chromium Resistant Strain. J. Microbiol Biotech. 2004, 14, 1211–1216. [Google Scholar]
- Spoof, L.; Vesterkvist, P.; Lindholm, T.; Meriluoto, J. Screening for cyanobacterial hepatotoxins, microcystins and nodularin in environmental water samples by reversed-phase liquid chromatography-electrospray ionisation mass spectrometry. J. Chromatogr A 2003, 1020, 105–119. [Google Scholar] [CrossRef]
- Schmittgen, T.D.; Livak, K.J. Analyzing real-time PCR data by the comparative CT method. Nat. Protoc 2008, 3, 1101–1108. [Google Scholar] [CrossRef]
Figure 1.
Growth curves of Microcystis aeruginosa UTEX LB 2385 treated with 0, 0.1, 0.25, and 0.5 mg/L ZnCl2. (a) Direct count of cell number was made via hemocytometer through 15 days. (b) Turbidity was evaluated via optical density (OD750 nm) readings through 15 days. Data is presented as mean ± SD of three replicates.

Figure 2.
Phase-contrast microscopy of Microcystis aeruginosa UTEX LB 2385 treated with 0, 0.1, 0.25, and 0.5 mg/L ZnCl2 at Days 1, 5, and 8, 1000× total magnification. Although greatly reduced in cell number, M. aeruginosa UTEX LB 2385 cells treated with 0.5 mg/L ZnCl2 presented morphology similar to 0 mg/L cells through Day 8, as indicated by blue arrows. The red arrow indicates a small cluster of multi-cell aggregation at Day 5 for 0.5 mg/L ZnCl2 cells. Scale bar: 5 μm.

Figure 3.
Flow cytometry analysis of population size (forward scatter: FSC-A) histograms within Microcystis aeruginosa UTEX LB 2385 treated with 0, 0.25, and 0.5 mg/L ZnCl2. (a) 0 mg/L ZnCl2 cells showed relative uniform FSC-A size through eight days. (b) 0.25 mg/L ZnCl2 cells and (c) 0.5 mg/L ZnCl2 cells showed increased FSC-A population size at Day 8 compared to control cells. Histograms were generated via FlowJo software analysis. (D represent days).

Figure 4.
qPCR analysis after cDNA synthesis, of three genes: Mmt, mcyC, and mcyE as potential zinc metal response genes in M. aeruginosa UTEX LB 2385. Mmt (top row) overall expression was shown to be highest in 0.25 mg/L ZnCl2 treated cells, with significant (Day 1) upregulation in comparison to 0 and 0.1 mg/L ZnCl2 treatment. mcyC and mcyE (middle and bottom rows, respectively) were distinct in expression patterns, with mcyC gene significantly upregulating at Day 12, showing a fold-increase >2.5 in ZnCl2 treated cells. For 0.1 and 0.25 mg/L ZnCl2 treated cells, Day 12 showed gene expression increase for Mmt and mcyC genes. (D represent days; 0, 0.1, 0.25 mg/L represent ZnCl2 concentrations; color scale of yellow refers to no change, green-downregulation, orange-red-upregulation).

Figure 5.
ELISA quantitative analysis of intracellular and extracellular MC-LR (µg/L) equivalents within Microcystis aeruginosa UTEX LB 2385 treated with 0, 0.1, 0.25, and 0.5 mg/L ZnCl2 at Days: One, 5, 8, 12, 15. Extracellular MC-LR equivalents (µg/L) of 0.1 mg/L ZnCl2 cells showed a 18% and 23% increase for Days 8 and 12 compared to control; 0.25 and 0.5 mg/L ZnCl2 treated cells showed a ~40% and 33% increase of extracellular MC-LR, respectively, as early as day 5. The 0.25 mg/L ZnCl2 extracellular MC-LR (µg/L) equivalents decreased and increased from Days 8 to 15, and 0.5 mg/L ZnCl2 intracellular MC-LR (µg/L) intracellular measurements decreased and increased from this same time point. All samples were performed as duplicate replicates.

© 2020 by the authors. Licensee MDPI, Basel, Switzerland. This article is an open access article distributed under the terms and conditions of the Creative Commons Attribution (CC BY) license (http://creativecommons.org/licenses/by/4.0/).
Share and Cite
MDPI and ACS Style
Perez, J.L.; Chu, T. Effect of Zinc on Microcystis aeruginosa UTEX LB 2385 and Its Toxin Production. Toxins 2020, 12, 92. https://0-doi-org.brum.beds.ac.uk/10.3390/toxins12020092
AMA Style
Perez JL, Chu T. Effect of Zinc on Microcystis aeruginosa UTEX LB 2385 and Its Toxin Production. Toxins. 2020; 12(2):92. https://0-doi-org.brum.beds.ac.uk/10.3390/toxins12020092
Chicago/Turabian StylePerez, Jose L., and Tinchun Chu. 2020. "Effect of Zinc on Microcystis aeruginosa UTEX LB 2385 and Its Toxin Production" Toxins 12, no. 2: 92. https://0-doi-org.brum.beds.ac.uk/10.3390/toxins12020092
Note that from the first issue of 2016, this journal uses article numbers instead of page numbers. See further details here.