Article

Assessing the Validity of Normalizing Aflatoxin B1-Lysine Albumin Adduct Biomarker Measurements to Total Serum Albumin Concentration across Multiple Human Population Studies

1
Department of Environmental Health and Engineering, Johns Hopkins Bloomberg School of Public Health, Baltimore, MD 21205, USA
2
Department of Epidemiology, Johns Hopkins Bloomberg School of Public Health, Baltimore, MD 21205, USA
3
Division of Cancer Epidemiology and Genetics, National Cancer Institute, Rockville, MD 20850, USA
4
Department of Epidemiology, Qidong Liver Cancer Institute, Qidong 226200, China
5
Public Health Sciences Division, Fred Hutchinson Cancer Research Center, Seattle, WA 98109, USA
6
Research Center for the Prevention of Chronic Diseases, Institute of Nutrition of Central America and Panama, Guatemala City 1188, Guatemala
*
Author to whom correspondence should be addressed.
Submission received: 14 January 2022 / Revised: 14 February 2022 / Accepted: 15 February 2022 / Published: 23 February 2022
(This article belongs to the Special Issue Mycotoxin Biomarkers: Innovation and Utility)

Abstract

:
The assessment of aflatoxin B1 (AFB1) exposure using isotope-dilution liquid chromatography-mass spectrometry (LCMS) of AFB1-lysine adducts in human serum albumin (HSA) has proven to be a highly productive strategy for the biomonitoring of AFB1 exposure. To compare samples across different individuals and settings, the conventional practice has involved the normalization of raw AFB1-lysine adduct concentrations (e.g., pg/mL serum or plasma) to the total circulating HSA concentration (e.g., pg/mg HSA). It is hypothesized that this practice corrects for technical error, between-person variance in HSA synthesis or AFB1 metabolism, and other factors. However, the validity of this hypothesis has been largely unexamined by empirical analysis. The objective of this work was to test the concept that HSA normalization of AFB1-lysine adduct concentrations effectively adjusts for biological and technical variance and improves AFB1 internal dose estimates. Using data from AFB1-lysine and HSA measurements in 763 subjects, in combination with regression and Monte Carlo simulation techniques, we found that HSA accounts for essentially none of the between-person variance in HSA-normalized (R2 = 0.04) or raw AFB1-lysine measurements (R2 = 0.0001), and that HSA normalization of AFB1-lysine levels with empirical HSA values does not reduce measurement error any better than does the use of simulated data (n = 20,000). These findings were robust across diverse populations (Guatemala, China, Chile), AFB1 exposures (105 range), HSA assays (dye-binding and immunoassay), and disease states (healthy, gallstones, and gallbladder cancer). HSA normalization results in arithmetic transformation with the addition of technical error from the measurement of HSA. Combined with the added analysis time, cost, and sample consumption, these results suggest that it may be prudent to abandon the practice of normalizing adducts to HSA concentration when measuring any HSA adducts—not only AFB1-lys adducts—when using LCMS in serum/plasma.
Key Contribution: Challenges current practice in albumin carcinogen adduct dosimetry by demonstrating, using Monte Carlo simulation and statistical inference, a detrimental effect of normalizing serum or plasma AFB1-albumin adduct concentration to total circulating albumin levels.

1. Introduction

Aflatoxin B1 (AFB1) is a potent carcinogen that contaminates staple grains worldwide [1] and contributes to the global hepatocellular carcinoma burden [2]. Hepatic activation of AFB1 to its carcinogenic epoxide metabolite [3] results in the formation of mutagenic DNA adducts and adducts to lysine in albumin (AFB1-lys), both of which can be used as biomarkers of AFB1 exposure [4]. Quantitation of the AFB1-lys adduct biomarker using the current state-of-the-art isotope-dilution liquid chromatography-mass spectrometry (LCMS) analytical method [5] results in data expressed in units of volumetric concentration (e.g., pg AFB1-lys adduct/mL of serum or plasma). Conventionally, these values are transformed by dividing the measured AFB1-lys concentration by the concentration of total circulating human serum albumin (HSA), resulting in the quantitation of the AFB1-lys adduct relative to the total HSA concentration (e.g., pg AFB1-lys adduct/mg total HSA). This practice is grounded in prior analytical approaches for AFB1-lys adduct quantitation, such as immunoassays [6] or immunoaffinity purification of AFB1-lys from serum/plasma digests prior to quantification by liquid chromatography and fluorescence detection [7]. In both traditional methods, HSA precipitation or immunoaffinity purification of digested AFB1-lys increases assay sensitivity. However, since quantitated AFB1-lys values are no longer directly representative of the original volume of the sample from which they were derived (due to the precipitation or immunoaffinity purification), the values had to be normalized for assay input with a denominator other than the input volume. Thus, after the measurement of the total HSA concentration using one of the several available analytical approaches, AFB1-lys adduct values were normalized for assay input through their expression relative to the total HSA in the sample. These analytical methods are no longer the state-of-the-art approach for the measurement of AFB1-lys adducts, but the practice of normalization to HSA measured in a separate aliquot of serum (or plasma) has remained as a convention, including in previous reports from our group [8,9,10,11,12,13,14].
The purpose of this study was to assess whether the conventional practice of normalizing raw AFB1-lys adduct levels (expressed as a volumetric concentration, such as pg adduct/mL) to total HSA concentration (e.g., pg adduct/mg HSA) is warranted, given the added financial, labor, and sample consumption costs. Two approaches to assess this question could be: (1) to compare the internal dose values yielded by normalized vs. raw AFB1-lys adduct concentrations to measured levels of aflatoxin intake, or (2) to compare the predictive or prognostic value of normalized vs. raw AFB1-lys adduct values with disease incidence or outcomes in which aflatoxin plays an accepted etiological role. In regard to option 1, while our group has reported AFB1-lys adduct concentrations in humans with known levels of AFB1 intake [7,15], these analyses were performed using older AFB1-lys analytical methods rather than the current LCMS approach [5] and the samples are not available for re-analysis. Other groups have used the second approach, examining differences between HSA-normalized vs. raw AFB1-lys values within associations of AFB1 and hepatocellular carcinoma incidence [16]; however, the investigators utilized HSA precipitation prior to ELISA determination of AFB1-lys adduct levels, such that the total HSA measurement was used for normalization of the assay input. Additionally, while AFB1-lys measurement was conducted in samples from individuals, the association with hepatocellular carcinoma incidence was limited to ecological analysis, limiting the precision of the results.
In this report, we used a simulation approach to determine the efficacy of HSA normalization of AFB1-lys values determined by LCMS. To do so, we have paired a dataset of AFB1-lys adduct and HSA concentrations from nearly 800 persons with analysis by Monte Carlo simulation and regression, to interrogate whether normalization of AFB1-lys adduct levels to total HSA performs better than chance—independent of HSA assay format, study population, longitudinal changes in aflatoxin exposure, or the presence of hepatobiliary disease. Consistency in inferences between simulated and empirical data would suggest that the standardization of AFB1-lys values to HSA is not necessary and that it only reflects random error that is not associated with biological processes or technical variance.

2. Results

2.1. Normalization of AFB1-Lys Adduct Concentrations to Total HSA Corrects Estimates of AFB1 Internal Dose No Better than Chance in Guatemalan and Chinese Adults

Initial studies compared the relative contribution of variance components derived from AFB1-lys (pg/mL) and total HSA (mg/mL) measurements, within normalized AFB1-lys (pg/mg HSA) values. To do so, using data from our previously published cross-sectional study of AFB1 exposure in Guatemalan adults [8], we constructed bivariate and multiple linear regression models in which the dependent variable, AFB1-lys normalized to HSA (pg AFB1-lys/mg HSA), was regressed against the components of that calculated value, i.e., raw AFB1-lys (pg/mL) or HSA (mg/mL). In addition to AFB1-lys and total HSA measurements (Figure 1A–C), this dataset also contains a variety of demographic, behavioral, and clinical assessments; those previously found to be significantly predictive of AFB1 exposure in this population [8] were included in the multiple regression models. In a bivariate model, as expected, raw AFB1-lys concentrations were significantly, positively, and strongly predictive of HSA-normalized AFB1-lys concentrations (log[pg/mg] = 1.009 × log[pg/mL] 1.643, p < 0.0001, R2 = 0.97, Figure 1D). Given the use of HSA as the denominator in the normalization of raw AFB1-lys levels, total HSA concentrations were, as expected, inversely and significantly associated with HSA-normalized AFB1-lys concentrations (log[pg/mg] = −1.343 × log[mg/mL HSA] + 3.103, p < 0.0001). However, despite the significant linear relationship and in contrast with raw AFB1-lys, total HSA was a very poor predictor of normalized AFB1-lys concentrations (R2 = 0.04, Figure 1E). HSA levels were not significantly associated with concentrations of the raw AFB1-lys biomarker (p = 0.31, R2 = 0.0001, Figure 1F). These relationships were essentially unchanged in multiple regression models after adding demographic predictors of aflatoxin exposure [8] (Table 1). Notably, male sex, residence location (urban or rural), and income quintile were all stronger predictors of raw AFB1-lys levels (pg/mL) than was total HSA. These results, while expected, demonstrate that HSA levels account for very little of the variance in AFB1 internal dose (whether in raw or HSA-normalized units), bringing into question whether the HSA normalization practice removes biological or technical variance, as proposed.
Next, we sought to assess whether the variance attributed to HSA in the above analysis was biologically informative (e.g., normalization to HSA accounts for between-subject differences in liver function), or whether it was non-informative (e.g., HSA levels do not accurately reflect between-subject differences in liver function, or normalization to HSA adds variance due to technical errors intrinsic to the HSA assay). To do so, we compared empirical data from the Guatemala cross-sectional study to a simulated data set with the same distribution parameters as the empirical data, but populated with “participants” assigned randomly generated AFB1-lys and HSA values (n = 20,000 simulated subjects). As seen in Figure 1A–C, the distributions of the empirical data and the simulated dataset were identical for measurements of HSA (Figure 1A), raw AFB1-lys concentrations (Figure 1B), and normalized AFB1-lys (Figure 1C). To isolate the contribution of HSA measurement within the normalized AFB1-lys values, we revisited the bivariate regression model in which raw AFB1-lys concentrations were used to predict normalized AFB1-lys values (Figure 1D). Thus, any deviation from a perfect regression fit (i.e., the regression residual) is due to the contribution of the HSA denominator within normalized AFB1-lys values (Figure 1G). The regression residuals (standardized as Z-scores) were then plotted against the HSA concentration recorded for that participant (Figure 1H), reflecting the relationship between HSA concentration and the “correction” to raw AFB1-lys values achieved by normalization to HSA. As seen in Figure 1H, the empirical dataset collected from Guatemala is indistinguishable from randomly simulated data, suggesting that the “correction” applied to raw AFB1-lys values through HSA normalization is no different than that which would arise by chance alone.
We next tested these findings in a second population of adults with AFB1 exposure—residents of Qidong, Jiangsu Province, China. Previously [14], we have shown that AFB1-lys levels in residents of this community steadily decreased over a period of ~20 years, reflecting a dramatic shift from essentially universal AFB1 exposure in 1995 (98% detection prevalence) to the elimination of nearly all exposure by 2012 (7%). Thus, using these data (except for 2012, which did not have enough detectable samples), we attempted to replicate our findings from the Guatemalan study. As seen in Figure 2, as expected, we observed no trends in HSA levels from 1995–2009 (Figure 2A), but did observe temporally changing distributions of raw AFB1-lys (Figure 2B) and normalized AFB1-lys concentrations (Figure 2C). Simulated datasets reflected the distribution parameters for all years combined (coral tracings). As in Guatemala, measurements made in Chinese adults over a 14-year period of declining AFB1 exposure produced regression residuals (derived from the model in Figure 2D) that were indistinguishable from residuals generated by chance using the simulated dataset (Figure 2E).

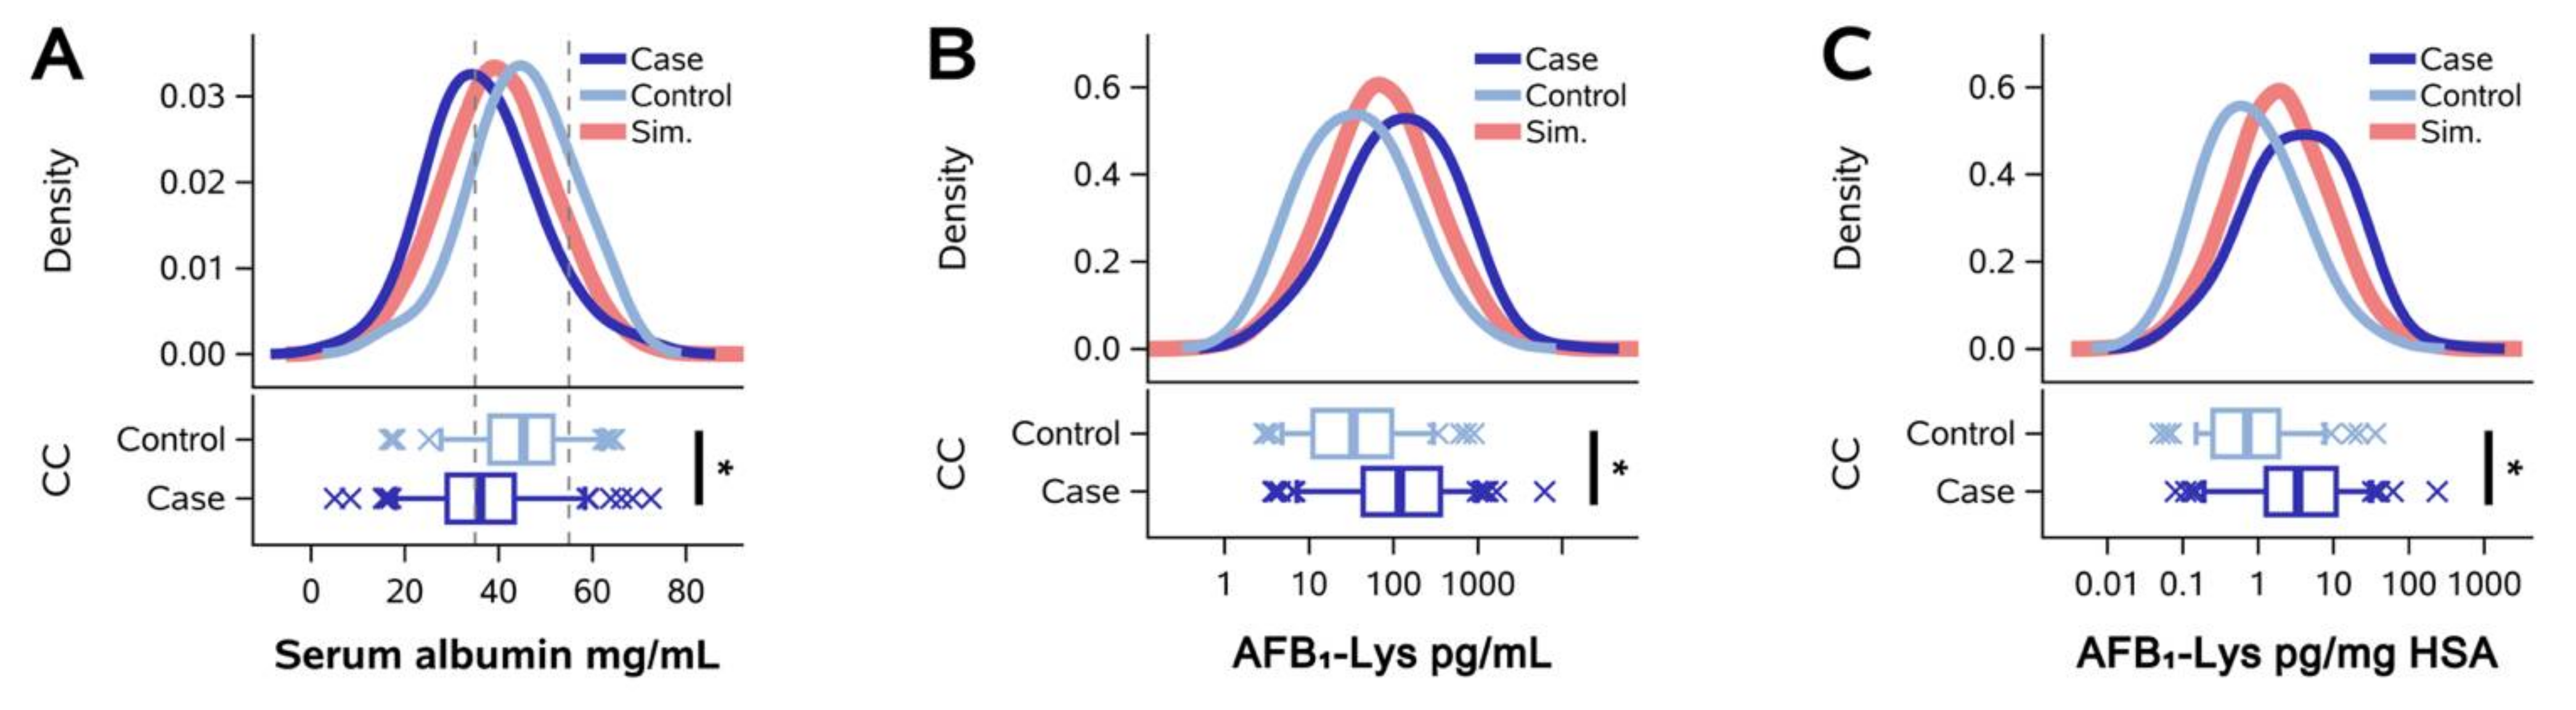
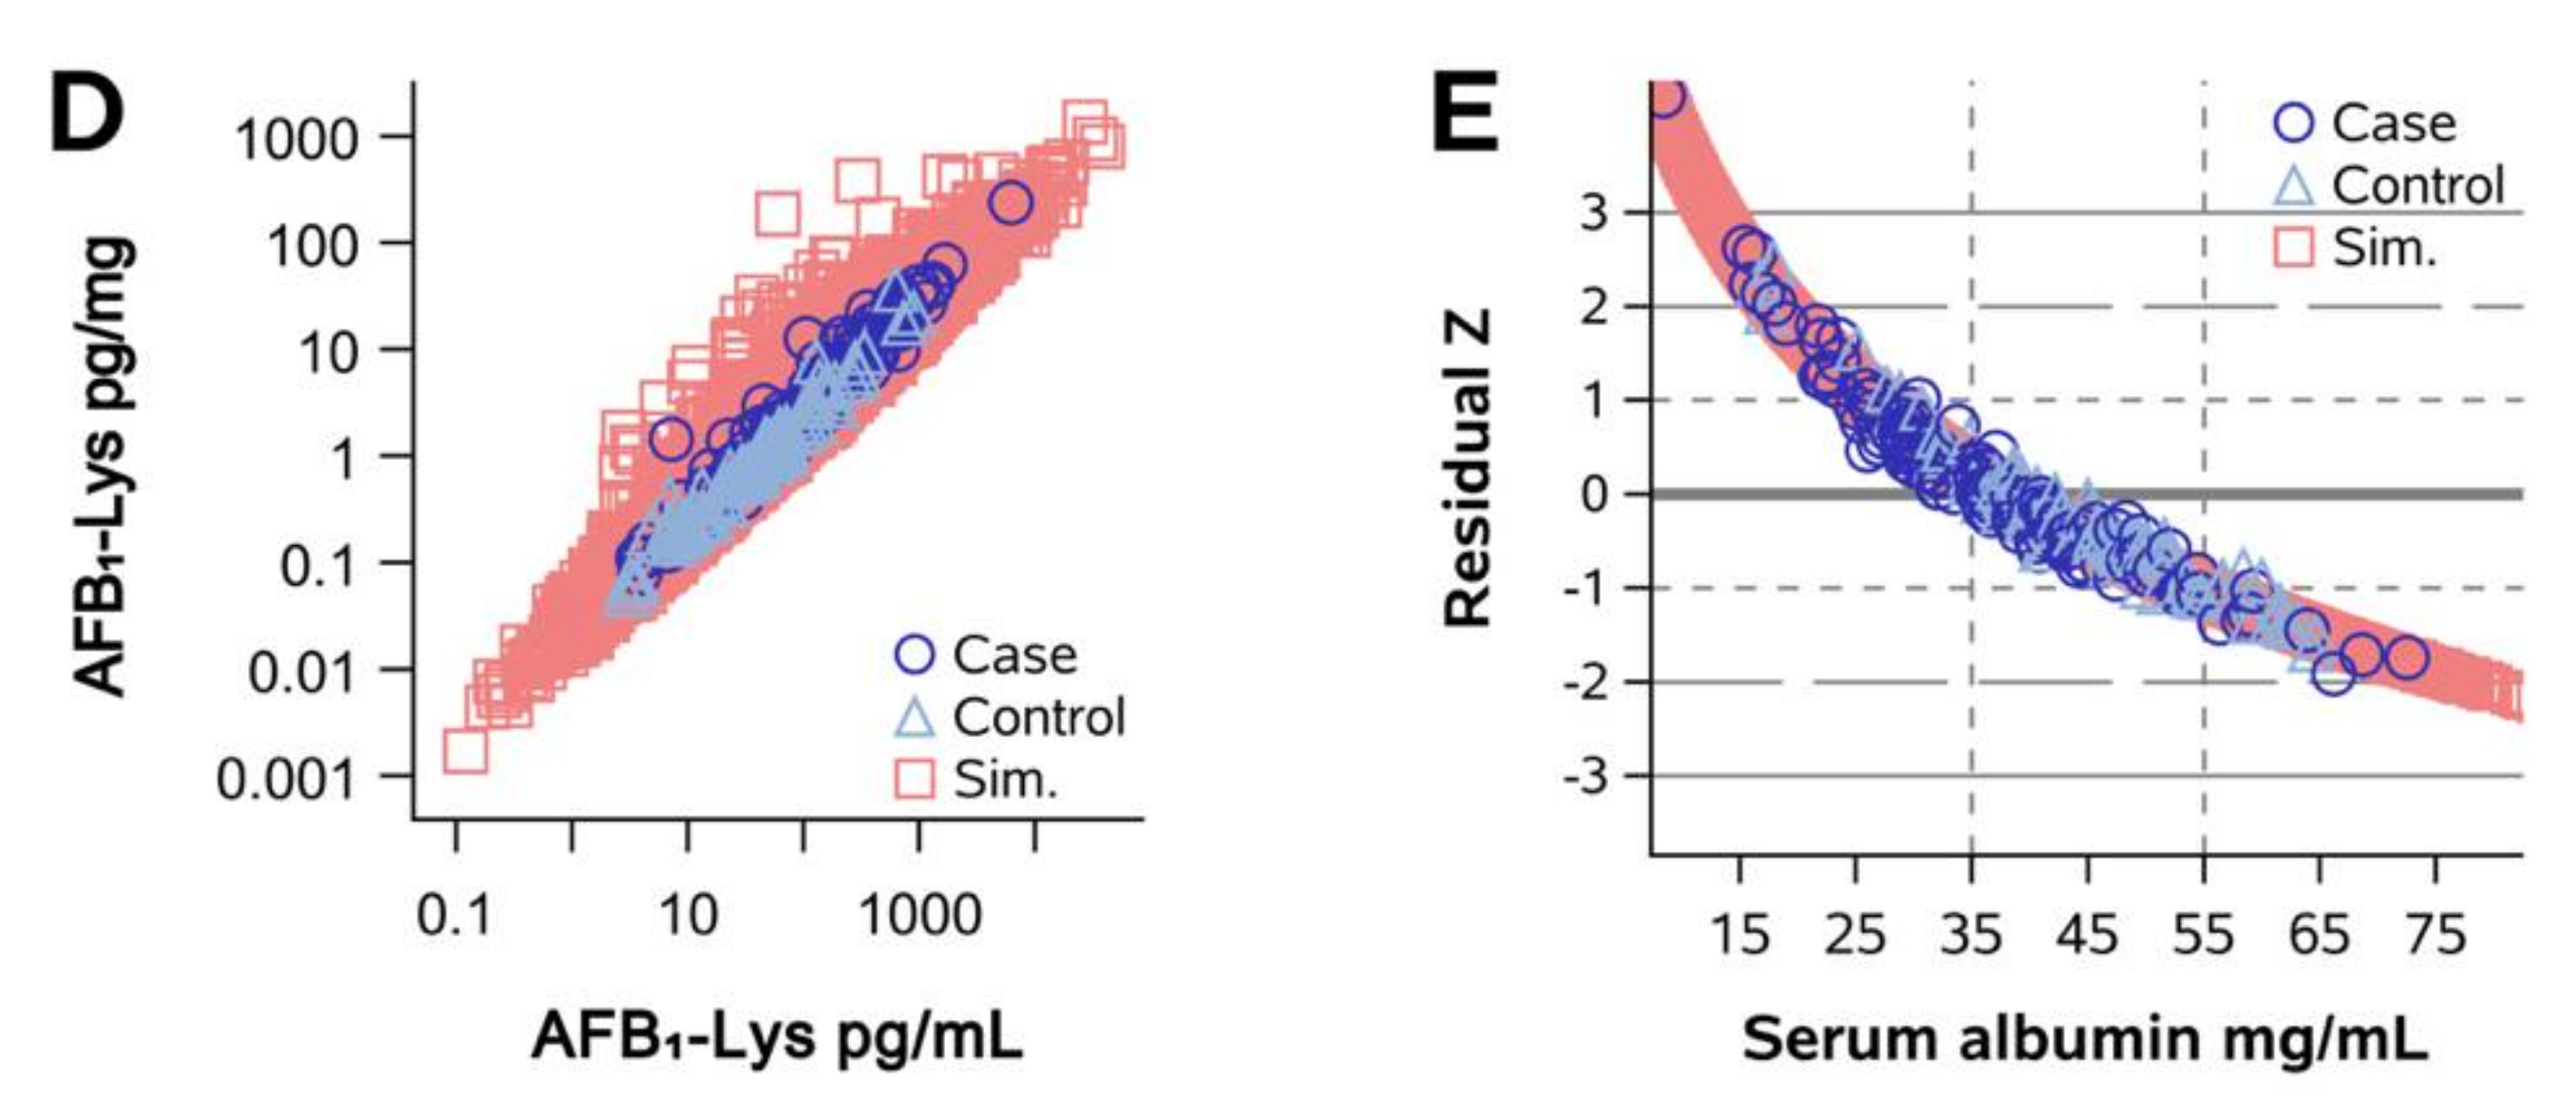
2.2. Normalization of AFB1-Lys Adduct Concentrations to Total HSA Corrects Estimates of AFB1 Internal Dose No Better than Chance in Adults with Gallbladder Cancer

To assess whether HSA normalization of AFB1-lys adduct levels corrects for diminished protein synthesis or metabolic function in individuals with hepatobiliary disease, as has been proposed, we replicated our analysis using data from two published case-control studies, both of which reported a significantly increased risk of gallbladder cancer with elevated AFB1 exposure [11,12]. In line with these prior reports, the pooled analysis in the present study found that AFB1-lys adduct concentrations were significantly higher in gallbladder cancer cases than in controls or persons with gallstones, regardless of whether the values were untransformed (Figure 3B) or HSA-normalized (Figure 3C). However, circulating HSA exhibited an inverse relationship, such that HSA concentrations were significantly lower in gallbladder cancer cases than in controls (Figure 3A). Data for each of the two study sites (Chile and China) are shown separately in Supplemental Figure S1. As observed in Chinese and Guatemalan participants without hepatobiliary disease (Figure 1 and Figure 2), HSA normalization produced a distribution of regression residuals that were no different than those observed with simulated data (Figure 3D,E), again suggesting that normalization to empirically observed HSA concentrations reduces model variance no better than that achieved through normalization to randomly simulated values.

3. Discussion

In this study, we sought to test the hypothesis that the normalization of AFB1-lys adduct levels to total HSA concentrations does not improve the accuracy of internal dose estimates determined using the current state-of-the-art LCMS AFB1-lys assay. Our analysis attempted to quantify the effect of HSA normalization on the residual error present in AFB1-lys internal dose estimates. While the raw AFB1-lys adduct concentration is highly predictive of the HSA-normalized AFB1-lys value, there is error in the linear relationship between the two, such that the exact HSA-normalized AFB1-lys values cannot be predicted as a function of the raw AFB1-lys concentration alone (i.e., the R2 of the regression between raw and HSA-normalized AFB1-lys is not equal to 1). Since the HSA-normalized AFB1-lys value is, by definition, the quotient of error-prone estimates of raw AFB1-lys and HSA concentrations, this is to be expected. However, while the presence of error is to be expected, the sources and structures of the error can be informative and are worth further investigation.
Although the true error is unobservable, it is approximated by the residuals of linear regression analysis: at a given level of the independent variable, the residual is the difference between an empirical observation of the dependent variable and the best-fit regression prediction of the dependent variable. Furthermore, although the residuals shown in Figure 1D are represented as a single error term in the linear regression equation ( y = β 1 x + β 0 + ε ), they receive contributions from multiple sources: technical (e.g., assay imprecision, operational mistakes, protease digestion efficiency, numerical rounding), biological (e.g., relationships between aflatoxin metabolism and HSA synthesis, between-person differences in the sample matrix composition, unaccounted confounding variables), and random error. Of course, these sources of variation within HSA-normalized AFB1-lys values are derived from the errors accompanying analytical estimates of both HSA and raw AFB1-lys adduct levels. However, in the case of the regression analysis in Figure 1D, the observed residuals can be attributed entirely to the HSA component of the HSA-normalized AFB1-lys value—if the dependent variable were also the raw AFB1-lys concentration instead of being the HSA-normalized AFB1-lys value, the mean squared error would be 0 and the R2 would equal 1. Thus, the regression analysis presented in Figure 1 (and subsequently, in other figures) isolates and reveals the contribution of HSA normalization to the error present in HSA-normalized AFB1-lys adduct estimates.
The regression residuals are either informative (the magnitude, direction, and distributions collectively explain a portion of the technical and biological error in the measurements), are a result of statistical noise, or are a combination of the two. Under an assumption that HSA normalization adds information by systematically accounting for variation in hepatic function or other confounding variables, the regression residuals would reflect the gains in precision from the normalization operation. In other words, HSA normalization adds value if it is true that the raw AFB1-lys adduct concentration imprecisely reflects the AFB1 internal dose or AFB1-related disease risk, and that the adjustment made by HSA normalization minimizes error and moves the estimate closer to the unknown true value. Conversely, if the HSA concentration does not adequately account for or is entirely unassociated with error contributed by the confounding variable(s), then the regression residuals document a deleterious addition of error. This would result in a diminution in statistical power, a bias towards or away from the null hypothesis, or both. Clearly, distinguishing which case is more reflective of the truth is critical to the use of the AFB1-lys adduct biomarker going forward.
One way to test this question is to compare relationships observed empirically in data from human samples with those that arise from randomly simulated values obtained from distributions with parameters equivalent to those in the empirical data. If the observed data are largely identical to those derived from simulated data, it can be deduced that the normalization of AFB1-lys to HSA is uninformative and adds error to estimates of exposure or disease risk. On the other hand, if the observed data deviate significantly from simulated distributions, then it can be assumed that biological mechanisms, or some other systematic source of error, account for this deviation and that HSA normalization is—to some degree—informative.
Specifically, we focused on the relationship between HSA concentrations and the residuals from the linear regression of raw vs. HSA-normalized AFB1-lys adduct levels, since the residuals of this regression analysis isolate the variance derived from the HSA component of the HSA-normalized AFB1-lys value. However, we must first define the null hypothesis, where there exists no biological relationship between HSA concentrations and HSA-normalization regression residuals. In fact, this null hypothesis is presented by the simulated data sets, since simulated HSA and AFB1-lys values within each of the n = 20,000 “participants” per data set were randomly generated and paired to produce simulated HSA-normalized AFB1-lys values. As seen in Figure 1H, Figure 2E and Figure 3E, as the simulated HSA concentration decreases, the Z-scored regression residuals increase; the opposite occurs with increasing HSA levels. These patterns are to be expected in the randomly simulated data, given the internal arithmetic of HSA normalization.
We now compare the null hypothesis above with the alternative hypothesis, formed on the assumption that the normalization of raw AFB1-lys to HSA is biologically valid and effective in reducing measurement error. If low HSA concentration reflects reduced hepatic metabolic capacity or a limited availability of protein substrate for the adduction of AFB1 to HSA, one could hypothesize that in the presence of low circulating HSA levels, raw AFB1-lys adduct concentration would underestimate the AFB1 internal dose. Thus, at constant levels of AFB1 exposure, AFB1-lys adduct concentrations would decrease in some proportion with HSA and normalization could be useful to correct for the underestimation. To support this hypothesis, it would be expected that, in contrast to simulated data, the empirically observed HSA-normalization regression residuals do not deviate greatly from zero at low concentrations of HSA, as this is the range where normalization is proposed to be most effective. Instead, we consistently observed the opposite—empirical residuals at HSA concentrations lower than the normal reference range (35–55 mg/mL) exhibit a monotonic increasing trend with decreasing HSA and demonstrate no inflection point where the hypothesized normalizing effect may occur. Additionally, aside from sample size, the residuals in the empirical data and the simulated data appear nearly identical—indicating that empirically determined HSA is no better than randomly simulated values for the purposes of reducing error in AFB1-lys adduct internal dose estimates.
To assure ourselves that our initial results in the Guatemalan study were not idiosyncratic to a specific population, a particular method of HSA measurement, or a particular range of AFB1 exposures, we repeated our analyses with raw data from a previously published report in Qidong, People‘s Republic of China [14]. As shown in Figure 2A–C, between 1995 and 2009, while HSA concentrations remained within normal reference ranges, AFB1-lys adduct levels progressively decreased by approximately 80%; our original publication found that this was likely due to shifts in Chinese agro-economic policy [14] and that this diminished AFB1 exposure contributed significantly to a now 30-year trend of decreasing liver cancer mortality in Qidong [17]. While AFB1-lys adducts in this study were measured using the same method as that used in the Guatemalan study (using the same mass spectrometer and calibration standards), this Qidong ecological study utilized a different HSA assay (bromocresol purple vs. sandwich ELISA in the Guatemalan study), featured a different participant population, and exhibited a lower range of aflatoxin internal dose (52.4–165.4 pg/mL inter-quartile range in Qidong vs. 156.7–702.7 pg/mL in the Guatemala study). Despite the differences with the Guatemalan study, we replicated our earlier findings—across four screenings spanning 14 years, HSA was consistently no better of a normalizer for raw AFB1-lys than randomly simulated values.
Finally, we wanted to test our approach in a context where AFB1 exposure may be concurrent with hepatobiliary disease, where decreases in hepatic metabolic capacity and HSA concentrations are etiologically linked. Specifically, we explored the use of HSA for normalization of raw AFB1-lys adduct levels in two case-control studies of gallbladder cancer. In contrast to the temporal stability of HSA concentrations in the longitudinal Qidong study, HSA concentrations were not equivalent between gallbladder cancer cases and controls—HSA levels in the cancer cases were significantly lower than in the controls (p < 0.0001), likely a result of hepatic injury secondary to bile duct obstruction or damage [18,19,20]. In the Guatemala and Qidong study participants, where hepatic function was likely within normal ranges, our data suggest that HSA normalization does not reduce error any better than chance. However, in the setting of gallbladder cancer, where the groups to be compared on the basis of AFB1-lys internal dose likely also differ in hepatic function, normalization with HSA as a surrogate for liver injury may be warranted. Nonetheless, we found that regression residuals from gallbladder cancer cases and controls were indistinguishable from one another and were no different than residuals from simulated data. Thus, these results indicate that HSA normalization does not reduce the error in AFB1-lys internal dose estimates in the setting of hepatic disease secondary to gallbladder cancer, but likely adds technical variance, reducing estimate precision and potentially increasing the risk of a type 2 error in statistical inference.
While the HSA normalization approach has been considered conventional practice for reporting AFB1-lys adduct levels, the various justifications for its continued use do not withstand scrutiny. Fundamentally, all rationales cited in support of HSA normalization argue that the practice corrects for between-sample variation in HSA concentration and thus the pool of HSA from which the stoichiometrically rare HSA molecules carrying an AFB1-lys adduct are sampled. This variation in true HSA concentration within a given sample originates from either random chance during sampling of a volume of serum or plasma or from biological factors (between-person differences in hepatic metabolism of AFB1, HSA synthesis, etc.), and is added to the technical variation inherent in the assay used to produce estimates of HSA concentrations (assay precision). Utility of the HSA normalization approach thus depends on both effective correction for random and/or biological variance sources and low technical variance within the assay.
With the current LCMS approach for AFB1-lys measurement, analysis is performed directly using serum/plasma samples rather than HSA precipitates or immunoaffinity purified fractions, as in prior methods [6,7]. Thus, the volume of the sample is precisely known and can serve as a valid denominator for quantitative estimates of internal dose, as with many other circulating biomarkers. Since calibrated pipettors dispense the 200 μL typically used in the LCMS assay at an accuracy within ±1% (ISO specification 8655-2:2002), random variance during sampling is not a substantial contributor to overall AFB1-lys measurement error and does not necessitate correction with HSA normalization.
Additionally, the LCMS assay utilizes an isotopically labeled AFB1-lys internal standard, which corrects for analyte recovery by solid-phase extraction (SPE) during processing [5]. HSA assays used for normalization cannot address this source of technical variation within the LCMS assay, not only because SPE recovery variance is introduced after proteolytic digestion of HSA to single amino acid residues (which eliminates the capacity for HSA determination in the digested, extracted sample), but also because determinations of total HSA and AFB1-lys levels are not performed in the same aliquot of serum/plasma. Although measurement of HSA in a second aliquot clearly should produce values that are correlated with the concentration of HSA present in the aliquot used for LCMS analysis, this correlation between repeated measurements is subject to technical error within the HSA assay—error which can be substantial, depending on the approach used for HSA determination [21]. As a result, if the measurement of HSA in a second aliquot is to be used as an estimate of HSA concentrations in the aliquot used for LCMS AFB1-lys analysis, the utility of such an approach is dependent upon the technical variance within the HSA assay being substantially smaller than the true between-person variance in HSA concentration. Furthermore, samples exhibiting significant hemolysis can lead to aberrant HSA determinations, adding additional technical error [22,23]. In a recent publication in which we used a validated ELISA-based HSA assay [8], the percent coefficient of variation (%CV) for HSA concentrations across 400 persons (measured in technical duplicates) was 20.9%, while the inter-assay %CV for a pooled serum quality control sample was 17.2% across 15 assays (measured in technical duplicates in each assay). Thus, in the case of this validated HSA assay, technical variance from the HSA measurement itself appears to account for most of the between-person variance observed in humans. In comparison, in a recent study from our group, the average %CV for raw AFB1-lys adduct concentrations determined by LCMS in pooled serum quality control samples—measured at 3 separate levels in each of 35 separate analytical batches—was 10.8% [24]. Thus, HSA normalization does not appear to be an effective strategy to account for technical variance in aflatoxin internal dose estimates, as the HSA denominator likely contributes substantially more technical variance to the final estimate than does the AFB1-lys numerator.
Several rationales based on the following established physiological facts have been presented in support of HSA normalization of AFB1-lys adduct values: (1) AFB1-lys adduct formation likely occurs exclusively in the liver, as it is the site of both HSA synthesis and the metabolic activation of AFB1 by cytochrome P450 enzymes to its reactive carcinogenic metabolite (for which the AFB1-lys adduct is a surrogate biomarker) [4]; (2) HSA is a major regulator of oncotic pressure in circulation [25].
First, it has been proposed that since hepatic injury or disease can broadly impair hepatic protein synthesis and metabolism, including the metabolism of AFB1, HSA concentrations can be used as a surrogate biomarker of HSA synthesis and, ultimately, hepatic function. It is true that HSA synthesis and HSA levels are reduced in severe hepatic or perihepatic disease, such as cirrhosis and gallbladder cancer [18,19,20,26,27]. Additionally, measurements of hepatic metabolic capacity correlate with circulating HSA concentration in persons with chronic liver disease [28,29]. However, while circulating HSA and hepatic function (assessed by antipyrine clearance or similar approaches) are weakly correlated in cases of severe liver disease, HSA is not a sensitive biomarker of changes in hepatic function in these individuals [30,31]. Thus, it is not surprising that HSA is not predictive of hepatic metabolic capacity in persons without disease [28]. In an average adult, a substantial and clinically relevant decrease in HSA concentration (e.g., 20%, from 42 mg/mL to 34 mg/mL; an excursion outside of the reference range) does not necessarily have any association with hepatic metabolic capacity. As a result, HSA normalization would not be effective in accounting for between-person variation in hepatic function.
Plasma volume can be affected by hydration status (through ingestion, excretion, or perspiration), disease (e.g., sepsis), and certain physiological states (e.g., pregnancy). A second rationale for HSA normalization suggests that alterations in plasma volume could increase or decrease the volumetric concentration of circulating AFB1-lys adducts, despite a constant level of AFB1 exposure and a constant rate of AFB1-lys adduct formation. It has been proposed that HSA concentration is similarly altered by changes in plasma volume and thus can be used to adjust for between-person variation in plasma osmolarity, comparable to how creatinine is used to normalize concentrations of urinary biomarkers [32]. However, this hypothesis assumes that HSA concentrations change with plasma osmolarity as a simple function of volumetric dilution or concentration, in parallel with other circulating compounds. In reality, HSA accounts for roughly 80% of oncotic pressure [30], which directly regulates its synthesis [25]. Thus, a decrease in plasma volume will result in a compensatory increase in HSA synthesis. Given this dynamic system (and the movement of HSA between vascular and interstitial spaces [30]), it is inaccurate to use circulating HSA concentration as an independent biomarker of the relative dilution or concentration of plasma. As an example, consider an HSA measurement in an individual that is roughly 20% higher than the population mean (e.g., 50 mg/mL). Interpreted strictly as a volumetric concentrating effect (and ignoring the possibility of inaccurate quantitation by HSA assay), this would require a decrease of roughly 0.6 L plasma volume in the average adult [33,34], enough to induce hypovolemic shock. Such HSA values are not uncommon in clinical and epidemiological data.
Finally, certain exogenous factors (e.g., nutritional status, infection, hepatic injury or disease) can decrease circulating HSA concentrations. It has been proposed that decreased hepatic HSA production could reduce the availability of HSA as a substrate for the formation of AFB1-lys adducts. Assuming this hypothesis is correct, given that circulating HSA concentration is generally reflective of hepatic HSA synthesis [30], the serum/plasma HSA concentration could be used to adjust for between-person variation in hepatic HSA synthesis and downstream AFB1-lys adduct formation. However, circulating HSA is not a reliable indicator of nutritional status, except in severe cases of protein malnutrition, such as kwashiorkor [30,35,36]. In addition, decreases in HSA during acute infection is not due to decreased synthesis, but predominantly due to increased vascular permeability and a loss of circulating HSA to the interstitial compartment [30].
Moreover, perhaps the strongest case against this rationale for HSA normalization can be derived from the inference that, given essentially any level of aflatoxin exposure, HSA is not a limiting reagent for AFB1-lys adduct formation. While HSA synthesis is indeed reduced due to liver disease or injury, even in a setting of extremely high aflatoxin exposure (e.g., 1 μg/day), HSA is present in the liver at a molar ratio of roughly 100,000:1 relative to AFB1 (see Appendix A). This calculation is based on the known masses of AFB1 and HSA, coupled with experimental data regarding the proportion of ingested AFB1 that reaches the liver (~40% [37,38]) and the average rate of hepatic HSA synthesis (~150 mg/kg/day [30]). Thus, HSA is present in in the liver in such stoichiometric excess that, even given a dramatic reduction in synthesis rate due to hepatic disease, HSA would still not be a limiting reagent for AFB1-lys adduct formation.
Thus, HSA normalization: (1) does not or cannot address random technical variance present in AFB1-lys measurements, (2) may add more technical variance than the existing between-person biological variance that it is meant to adjust for, and (3) cannot or is not needed to control for between-person biological variance in hepatic metabolism, plasma osmolarity, or HSA synthesis. Furthermore, while AFB1-lys internal dose values can be translated to estimates of dietary intake—as we have done in a recent study of mother-child dyads in Bangladesh and Malawi [24]—HSA normalization adds complexity and error to this work due to quantitative biases of various HSA assays used across disparate studies. Coupled with the added time, financial costs, and sample consumption required to perform HSA measurements alongside each AFB1-lys determination, there is no compelling basis for the continued use of HSA normalization in AFB1-lys adduct dosimetry when using the current state-of-the-art LCMS AFB1-lys assay.

4. Conclusions

Overall, the effect of HSA “normalization” in HSA-corrected AFB1-lys adduct values appears to be the result of arithmetic transformation and the addition of technical error, rather than a reduction in biological or technical variance. In future work, this conclusion could be further tested using subject-level data on hepatocellular carcinoma incidence and AFB1-lys adduct levels, assessing whether raw or HSA-normalized AFB1-lys values better recapitulate the well-established causal relationship between this cancer and AFB1 exposure, or by comparing measured AFB1 intake with raw vs. normalized AFB1-lys values. However, given our current results and combined with the added cost, analysis time, sample consumption, and heterogeneity between HSA assays, it seems prudent to abandon the practice of normalizing HSA adducts to the total circulating HSA concentration when measuring any HSA adducts—not only AFB1-lys adducts—by isotope-dilution mass spectrometry in serum or plasma. As a result, we have initiated this shift within our own laboratory, recently showing that elevated raw AFB1-lys concentrations were significantly associated with the cervical detection of oncogenic strains of HPV in Kenyan women [39] and, separately, revealing seasonal, demographic, and behavioral predictors of aflatoxin exposure in 828 mother-child dyads from Bangladesh and Malawi [24]. Eschewing unnecessary and resource-consuming practices such as the HSA normalization of AFB1-lys adducts will allow for more efficient use of precious samples and research funds, while producing superior data.

5. Materials and Methods

All HSA and AFB1-lys adduct data used for this secondary analysis have been previously peer-reviewed.

5.1. Guatemala Study

This study was conducted between May and October of 2016 and was approved by the institutional review boards at the Johns Hopkins Bloomberg School of Public Health and the Institute of Nutrition of Central America and Panama (INCAP). Study details have been published previously [8,40]. All participants provided informed consent. Overall, 461 individuals were recruited from five departments in Guatemala (Quiché, Sololá, Suchitepéquez, Escuintla, and Guatemala). Serum was obtained from 444 individuals, of which 443 had suitable volume for AFB1-lys adduct determination by LCMS [5], HSA by ELISA, and HBV and HCV infection status by automated immunoassay, as previously described [8]. Participants were considered for inclusion in the study if they had an HSA measurement, detectable AFB1-lys (≥0.01 pg/μL), valid determination of HCV and HBV infection status, and self-reported weekly ethanol consumption. A total of 400 persons without any missing data were available for the present analysis. Individuals were excluded from further analysis on the basis of excessive alcohol use (≥98 g ethanol/7 drinks per week for women or ≥196 g ethanol/14 drinks per week for men; n = 11), positive HBV or HCV status (n = 54), excessive alcohol use and positive HBV or HCV status (n = 4), or missing HBV or HCV status (n = 4). The final analytical sample was n = 327.

5.2. Qidong Community Longitudinal Study

This study was approved by the institutional review boards at the Johns Hopkins Bloomberg School of Public Health and the Qidong Liver Cancer Institute (QDLCI). All study participants provided informed consent. Samples for this study were collected as part of screening protocols for liver cancer early detection and chemoprevention studies in Qidong, People’s Republic of China, dating to the 1980s. From our biorepository, we randomly selected age-matched subsamples of 50 males and 50 females, residing in two neighboring townships (Hezuo and Daxin, ~25 km apart), obtained from screening protocols conducted during the years of 1995, 1999, 2003, 2009, and 2012. Each subsample consisted of a unique set of community residents; subject-level repeated sampling across survey years was not available. Serum samples from the participants were analyzed for AFB1-lys by LCMS [5] and HSA by bromocresol purple dye-binding assay (BCP); these results have been published previously [14]. Participants were considered for inclusion if they had both a valid HSA measurement and detectable AFB1-lys (≥0.01 pg/μL). Due to the very low rate of detectable AFB1-lys in samples from 2012 (7%), subjects from the 2012 sub-sample were excluded from further analysis in the present study. A total of 306 persons from four community screenings (1995, 1999, 2003, and 2009) had AFB1-lys and HSA data available for analysis (1995, n = 97; 1999, n = 92; 2003, n = 87; 2009, n = 30).

5.3. Gallbladder Cancer Case-Control Studies

We have previously reported positive associations between aflatoxin exposure and gallbladder cancer (GBC) in two case-control studies, conducted in the country of Chile [11] and in Shanghai, China [12]. Each study was approved by the institutional review boards at the National Cancer Institute and the respective local study coordinating sites, the Catholic Pontifical University of Santiago, and the Shanghai Cancer Institute, respectively. Details of each study have been published previously [11,12]. In Chile, persons with GBC (with or without the concurrent detection of gallstones) were recruited from hospitals in Santiago, Concepción, and Temuco. Controls consisted of persons with gallstones or community members and were matched to GBC cases by age and sex. Controls were additionally matched to GBC cases by location of enrollment, while persons with gallstones were matched to GBC cases diagnosed at the same referring hospital. Hereafter, “controls” will be used to refer to either persons with gallstones or community participants. For the study conducted in China, persons with GBC (with or without the concurrent detection of gallstones) were referred for enrollment from the Shanghai Cancer Institute and 42 collaborating Shanghai hospitals from June 1997 through May 2001. Persons undergoing medical treatment or cholecystectomy for gallstones at the same hospital as an enrolled GBC case were matched by sex and age (within five years) and referred for study enrollment as controls. In both the Chilean and the Chinese studies, serum samples were analyzed for AFB1-lys by LCMS [5] and HSA by bromocresol purple dye-binding assay (BCP); these results have been published previously [11,12]. Participants were considered for inclusion if they had both a valid HSA measurement and detectable AFB1-lys (≥0.01 pg/μL); in prior publications [11,12], only participants with normalized AFB1-lys levels ≥0.05 pg/mg HSA were included for analysis. Data were pooled across both study sites, resulting in a final analytical sample size of n = 130 persons with GBC (Chile, n = 23; China, n = 107) and n = 85 controls (Chile, n = 8 persons with gallstones and n = 10 community controls; China, n = 67 persons with gallstones). The combined data set was analyzed as one study, referred to hereafter as the “GBC case-control” study.

5.4. Data Analysis

All analyses were conducted using SAS 9.4 (SAS Institute, Cary, NC). “Raw” AFB1-lys adduct refers to serum AFB1-lys—albumin adduct concentration—in the units of pg AFB1-lys adduct/mL serum. “HSA-normalized” or “normalized” AFB1-lys adduct levels refers to the raw AFB1-lys adduct level divided by the total HSA concentration (in mg/mL), resulting in the final units of pg AFB1-lys adduct/mg HSA. Within the GBC case-control study, the distributions of HSA, raw AFB1-lys adduct levels, and HSA-normalized AFB1-lys concentrations were compared in cases and controls using the non-parametric Wilcoxon signed-rank test using the PROC NPAR1WAY procedure.
Linear regression models were used to assess the relative contributions of HSA, raw AFB1-lys levels, and various demographic parameters to the total observed variance in AFB1-lys internal dose in the Guatemalan dataset. Multiple models were constructed, with either raw AFB1-lys or HSA-normalized AFB1-lys as the dependent variable and the independent variables consisting of HSA, raw AFB1-lys, and various demographic factors (sex, urban/rural residence, educational attainment, and income) that we have found to be associated with aflatoxin exposure in Guatemala [8]. In all models, slope estimates were used to assess the importance of each parameter in the model, and the adjusted R2 was used to assess the proportion of explained variation (vs. coefficient of determination) of the AFB1-lys internal dose.
A Monte Carlo simulation approach [41] was used to construct simulated data sets of HSA and raw AFB1-lys adduct concentrations, modeled on the empirical data from each study. Specifically, within each study, the empirically observed mean and standard deviation values for HSA concentration were used to construct 20 normally or lognormally distributed simulated samples of 1000 randomly generated observations each, using the RDRAND function in SAS and a seed value of 0 [42]; these 20 independent samples were then combined into a single dataset of 20,000 simulated observations. A 20,000-observation simulated dataset was similarly constructed for the raw AFB1-lys adduct concentrations using the empirically observed raw AFB1-lys adduct mean and standard deviation. Next, the randomly generated HSA and AFB1-lys values in each dataset were sequentially paired, without replacement, to create a third dataset of simulated study participants, and the HSA-normalized AFB1-lys adduct values were calculated for each simulated participant. Within each study (Guatemala, China, GBC case-control), these simulated datasets were constructed using distribution parameters drawn from the entire sample, independent of the year of sample collection (China), disease status (GBC case-control), or study site (GBC case-control). Thus, for each of the three studies, we created a unique 20,000-observation simulated dataset with distribution parameters essentially identical to the empirical data, but where intra-person relationships between raw and HSA-normalized AFB1-lys adduct levels were the result of arithmetic transformation and random variation rather than biology.
Linear regression was used to assess the relationship between raw AFB1-lys adduct levels and HSA-normalized adduct levels. Residuals were obtained from linear regression models in which the raw AFB1-lys adduct level was the lone independent variable and the HSA-normalized AFB1-lys concentration was the dependent variable to be predicted. Thus, the regression residuals constitute the differences between the empirically observed HSA-normalized AFB1-lys adduct level (pg/mg HSA) at a given concentration of the raw AFB1-lys adduct (pg/mL serum or plasma) vs. the predicted HSA-normalized AFB1-lys adduct level at the same concentration of the raw AFB1-lys adduct. In other words, the residuals were visualized as the ordinate (y-axis) deviation of an individual observation from the best-fit linear regression line describing the relationship between raw and HSA-normalized adduct levels. To compare residuals across five orders of magnitude of raw AFB1-lys adduct levels, Studentized regression residuals were standardized as Z-scores ( z =   x x ¯     /   s ). Simulated data were analyzed in the same fashion as empirical observations and distributions of empirical and simulated residuals were compared.

Supplementary Materials

The following supporting information can be downloaded at: https://0-www-mdpi-com.brum.beds.ac.uk/article/10.3390/toxins14030162/s1, Figure S1: HSA, raw AFB1-lys, and normalized AFB1-lys levels in each gallbladder cancer (GBC) case-control study.

Author Contributions

Conceptualization, J.W.S. and J.D.G.; formal analysis, J.W.S. and D.K.N.; funding acquisition, T.W.K., J.K., M.R.-Z., K.A.M. and J.D.G.; investigation, J.W.S., C.S.A., P.A.E., S.M.B., J.-G.C., J.K., A.R.-A. and M.F.K.-L.; methodology, J.W.S. and D.K.N.; project administration, J.D.G.; resources, T.W.K., M.R.-Z., K.A.M. and J.D.G.; supervision, J.D.G.; visualization, J.W.S.; writing—original draft, J.W.S. All authors have read and agreed to the published version of the manuscript.

Funding

The primary studies and the secondary analyses in this work were funded by the National Institutes of Health (USA) Intramural Research program and grants P01ES006052, P30CA006973, and T32ES00714; Comisión Nacional de Investigación Científica y Tecnológica (Chile) grant 15130011; Fondo Nacional de Investigación y Desarrollo en Salud (Chile) grant SA11I2205; and National Science and Technology Mega-Projects (China) grants 2008ZX10002-015 and 2012ZX10002-008.

Institutional Review Board Statement

Studies were approved by institutional review boards at the Johns Hopkins Bloomberg School of Public Health (approval numbers H.18.98.12.01.A2, H.18.01.10.15.A2, H.18.01.10.09.A1, 00002015, 00003494, 00006877, and 00011020), National Cancer Institute of the National Institutes of Health (12CN020 and OH97CN028), the Institute of Nutrition of Central America and Panama (53), the Catholic Pontifical University of Santiago (15-099), the Araucanía Sur Health Service Directorate (183), the Qidong Liver Cancer Institute, and the Shanghai Cancer Institute.

Informed Consent Statement

Informed consent was obtained from all subjects involved in the study.

Data Availability Statement

SAS code and raw data will be made available upon request.

Conflicts of Interest

The authors declare no conflict of interest.

Appendix A

Ratio of hepatic HSA/AFB1 in 70 kg adult, assuming:
  • 1 μg daily AFB1 dose, or 3.20 nmol/day (AFB1 mol. weight, 312.3 g/mol);
  • ~40% of ingested AFB1 reaches the liver via portal circulation [37,38];
  • Hepatic HSA synthesis rate of 150 mg/kg/day [31], or 2.26 μmol/kg/day (HSA mol. weight, 66,472 g/mol)
2.26   μ mol   HSA * kg 1 *   day 1 0.00320   μ mol   AFB 1 * 0.40 * 70   kg 1 * day 1 = 123 , 594   mol   HSA 1   mol   AFB 1

References

  1. Council for Agricultural Science and Technology. Mycotoxins: Risks in Plant, Animal, and Human Systems; Council for Agricultural Science and Technology: Ames, IA, USA, 2003; ISBN 0194-4088. [Google Scholar]
  2. Kensler, T.W.; Roebuck, B.D.; Wogan, G.N.; Groopman, J.D. Aflatoxin: A 50-year odyssey of mechanistic and translational toxicology. Toxicol. Sci. 2011, 120, S28–S48. [Google Scholar] [CrossRef] [PubMed] [Green Version]
  3. Deng, J.; Zhao, L.; Zhang, N.-Y.; Karrow, N.A.; Krumm, C.S.; Qi, D.-S.; Sun, L.-H. Aflatoxin B1 metabolism: Regulation by phase I and II metabolizing enzymes and chemoprotective agents. Mutat. Res. Rev. Mutat. Res. 2018, 778, 79–89. [Google Scholar] [CrossRef] [PubMed]
  4. Smith, J.W.; Groopman, J.D. Aflatoxins. In Encyclopedia of Cancer, 3rd ed.; Boffetta, P., Hainaut, P.L., Eds.; Elsevier: Cambridge, MA, USA, 2018. [Google Scholar]
  5. McCoy, L.F.; Scholl, P.F.; Schleicher, R.L.; Groopman, J.D.; Powers, C.D.; Pfeiffer, C.M. Analysis of aflatoxin B1-lysine adduct in serum using isotope-dilution liquid chromatography/tandem mass spectrometry. Rapid Commun. Mass Spectrom. 2005, 19, 2203–2210. [Google Scholar] [CrossRef] [PubMed]
  6. Wild, C.P.; Jiang, Y.-Z.; Sabbioni, G.; Chapot, B.; Montesano, R. Evaluation of methods for quantitation of aflatoxin-albumin adducts and their application to human exposure assessment. Cancer Res. 1990, 50, 245–251. [Google Scholar]
  7. Sabbioni, G.; Ambs, S.; Wogan, G.N.; Groopman, J.D. The aflatoxin-lysine adduct quantified by high-performance liquid chromatography from human serum albumin samples. Carcinogenesis 1990, 11, 2063–2066. [Google Scholar] [CrossRef]
  8. Smith, J.W.; Kroker-Lobos, M.F.; Lazo, M.; Rivera-Andrade, A.; Egner, P.A.; Wedemeyer, H.; Torres, O.; Freedman, N.D.; McGlynn, K.A.; Guallar, E.; et al. Aflatoxin and viral hepatitis exposures in Guatemala: Molecular biomarkers reveal a unique profile of risk factors in a region of high liver cancer incidence. PLoS ONE 2017, 12, e0189255. [Google Scholar] [CrossRef] [Green Version]
  9. Alvarez, C.S.; Hernández, E.; Escobar, K.; Villagrán, C.I.; Kroker-Lobos, M.F.; Rivera-Andrade, A.; Smith, J.W.; Egner, P.A.; Lazo, M.; Freedman, N.D.; et al. Aflatoxin B 1 exposure and liver cirrhosis in Guatemala: A case–control study. BMJ Open Gastroenterol. 2020, 7, e000380. [Google Scholar] [CrossRef]
  10. Kroker-Lobos, M.F.; Alvarez, C.S.; Rivera-Andrade, A.; Smith, J.W.; Egner, P.A.; Torres, O.; Lazo, M.; Freedman, N.D.; Guallar, E.; Graubard, B.I.; et al. Association between aflatoxin-albumin adduct levels and tortilla consumption in Guatemalan adults. Toxicol. Rep. 2019, 6, 465–471. [Google Scholar] [CrossRef]
  11. Nogueira, L.; Foerster, C.; Groopman, J.D.; Egner, P.A.; Koshiol, J.; Ferreccio, C. Association of aflatoxin with gallbladder cancer in Chile. JAMA 2015, 313, 26–28. [Google Scholar] [CrossRef] [Green Version]
  12. Koshiol, J.; Gao, Y.T.; Dean, M.; Egner, P.A.; Nepal, C.; Jones, K.; Wang, B.; Rashid, A.; Luo, W.; Van Dyke, A.L.; et al. Association of aflatoxin and gallbladder cancer. Gastroenterology 2017, 153, 488–494. [Google Scholar] [CrossRef]
  13. Groopman, J.D.; Egner, P.A.; Schulze, K.J.; Wu, L.S.-F.; Merrill, R.; Mehra, S.; Shamim, A.A.; Ali, H.; Shaikh, S.; Gernand, A.; et al. Aflatoxin exposure during the first 1000 days of life in rural South Asia assessed by aflatoxin B1-lysine albumin biomarkers. Food Chem. Toxicol. 2014, 74, 184–189. [Google Scholar] [CrossRef] [PubMed] [Green Version]
  14. Chen, J.-G.; Egner, P.A.; Ng, D.; Jacobson, L.P.; Muñoz, A.; Zhu, Y.-R.; Qian, G.-S.; Wu, F.; Yuan, J.-M.; Groopman, J.D.; et al. Reduced aflatoxin exposure presages decline in liver cancer mortality in an endemic region of China. Cancer Prev. Res. 2013, 6, 1038–1045. [Google Scholar] [CrossRef] [PubMed] [Green Version]
  15. Wild, C.P.; Hudson, G.J.; Sabbioni, G.; Chapot, B.; Hall, A.J.; Wogan, G.N.; Whittle, H.; Montesano, R.; Groopman, J.D. Dietary intake of aflatoxins and the level of albumin-bound aflatoxin in peripheral blood in The Gambia, West Africa. Cancer Epidemiol. Biomarkers Prev. 1992, 1, 229–234. [Google Scholar] [PubMed]
  16. Peng, T.; Li, L.Q.; Peng, M.H.; Liu, Z.M.; Liu, T.W.; Yan, L.N.; Shen, H.M.; Wang, L.; Wang, Q.; Wang, K.B.; et al. Is correction for protein concentration appropriate for protein adduct dosimetry? Hypothesis and clues from an aflatoxin B1-exposed population. Cancer Sci. 2007, 98, 140–146. [Google Scholar] [CrossRef] [PubMed]
  17. Chen, J.; Zhu, J.; Wang, G.; Groopman, J.D.; Kensler, T.W. Qidong: A crucible for studies on liver cancer etiology and prevention. Cancer Biol. Med. 2019, 16, 24–37. [Google Scholar] [CrossRef] [Green Version]
  18. Goussous, N.; Maqsood, H.; Patel, K.; Ferdosi, H.; Muhammad, N.; Sill, A.M.; Kowdley, G.C.; Cunningham, S.C. Clues to predict incidental gallbladder cancer. Hepatobil. Pancreat. Dis. Int. 2018, 17, 149–154. [Google Scholar] [CrossRef]
  19. Koshenkov, V.P.; Koru-Sengul, T.; Franceschi, D.; DiPasco, P.J.; Rodgers, S.E. Predictors of incidental gallbladder cancer in patients undergoing cholecystectomy for benign gallbladder disease. J. Surg. Oncol. 2013, 107, 118–123. [Google Scholar] [CrossRef]
  20. Pitt, S.C.; Jin, L.X.; Hall, B.L.; Strasberg, S.M.; Pitt, H.A. Incidental gallbladder cancer at cholecystectomy. Ann. Surg. 2014, 260, 128–133. [Google Scholar] [CrossRef]
  21. Duly, E.B.; Grimason, S.; Grimason, P.; Barnes, G.; Trinick, T.R. Measurement of serum albumin by capillary zone electrophoresis, bromocresol green, bromocresol purple, and immuoassay methods. J. Clin. Pathol. 2003, 56, 780–782. [Google Scholar] [CrossRef] [Green Version]
  22. Lippi, G.; Salvagno, G.L.; Montagnana, M.; Brocco, G.; Guidi, G.C. Influence of hemolysis on routine clinical chemistry testing. Clin. Chem. Lab. Med. 2006, 44, 311–316. [Google Scholar] [CrossRef]
  23. Lippi, G.; Plebani, M.; Di Somma, S.; Cervellin, G. Hemolyzed specimens: A major challenge for emergency departments and clinical laboratories. Crit. Rev. Clin. Lab. Sci. 2011, 48, 143–153. [Google Scholar] [CrossRef] [PubMed]
  24. Smith, J.W.; Matchado, A.J.; Wu, L.S.-F.; Arnold, C.D.; Burke, S.M.; Maleta, K.M.; Ashorn, P.; Stewart, C.P.; Shaikh, S.; Ali, H.; et al. Longitudinal assessment of prenatal, perinatal, and early-life aflatoxin B1 exposure in 828 mother-child dyads from Bangladesh and Malawi. Curr. Dev. Nutr. 2022, 6, nzab153. [Google Scholar] [CrossRef] [PubMed]
  25. Fanali, G.; di Masi, A.; Trezza, V.; Marino, M.; Fasano, M.; Ascenzi, P. Human serum albumin: From bench to bedside. Mol. Aspects Med. 2012, 33, 209–290. [Google Scholar] [CrossRef] [PubMed]
  26. Ballmer, P.E.; Walshe, D.; McNurlan, M.A.; Watson, H.; Brunt, P.W.; Garlic, P.J. Albumin synthesis rates in cirrhosis: Correlation with Child-Turcotte classification. Hepatology 1993, 18, 292–297. [Google Scholar] [CrossRef]
  27. Ballmer, P.E.; Reichen, J.; Mcnurlan, M.A.; Sterchi, A.-B.; Anderson, S.E.; Garlick, P.J. Albumin but not fibronogen synthesis correlates with galactose elimination capacity in patients with cirrhosis of the liver. Hepatology 1996, 24, 53–59. [Google Scholar] [CrossRef]
  28. Branch, R.A.; James, J.A.; Read, A.E. The clearance of antipyrine and indocyanine green in normal subjects and in patients with chronic lever disease. Clin. Pharmacol. Ther. 1976, 20, 81–89. [Google Scholar] [CrossRef]
  29. Hepner, G.W.; Vesell, E.S. Assessment of aminopyrine metabolism in man by breath analysis after oral administration of 14C-aminopyrine. Effects of phenobarbital, disulfiram and portal cirrhosis. N. Engl. J. Med. 1974, 291, 1384–1388. [Google Scholar] [CrossRef]
  30. Levitt, D.G.; Levitt, M.D. Human serum albumin homeostatis: A new look at the roles of synthesis, catabolism, renal and gastrointestinal excretion, and the clinical value of serum albumin measurements. Int. J. Gen. Med. 2016, 6, 229–255. [Google Scholar] [CrossRef] [Green Version]
  31. Andreasen, P.B.; Ranek, L.; Statland, B.E.; Tygstrup, N. Clearance of antipyrine-dependence of quantitative liver function. Eur. J. Clin. Investig. 1974, 4, 129–134. [Google Scholar] [CrossRef]
  32. Groopman, J.D.; Hall, A.J.; Montesano, R.; Wild, C.P.; Whittle, H.; Hudson, G.J.; Wogan, G.N. Molecular dosimetry of aflatoxin-N7-guanine in human urine obtained in The Gambia, west Africa. Cancer Epidemiol. Biomarkers Prev. 1992, 1, 221–227. [Google Scholar]
  33. Yiengst, M.J.; Shock, N.W. Blood and plasma volume in adult males. J. Appl. Physiol. 1962, 17, 195–198. [Google Scholar] [CrossRef]
  34. Crispell, K.R.; Porter, B.; Nieset, R.T. Studies of plasma volume using human serum albumin tagged with radioactive iodine-181. J. Clin. Investig. 1950, 29, 513–516. [Google Scholar] [CrossRef] [PubMed]
  35. Friedman, A.N.; Fadem, S.Z. Reassessment of albumin as a nutritional marker in kidney disease. J. Am. Soc. Nephrol. 2010, 21, 223–230. [Google Scholar] [CrossRef] [PubMed] [Green Version]
  36. White, J.V.; Guenter, P.; Jensen, G.; Malone, A.; Schofield, M. Consensus statement of the Academy of Nutrition and Dietetics/American Society for Parenteral and Enteral Nutrition: Indicators recommended for the identification and documentation of pediatric malnutrition (undernutrition). J. Acad. Nutr. Diet. 2014, 114, 1988–2000. [Google Scholar] [CrossRef]
  37. Wogan, G.N.; Edwards, G.S.; Shank, R.C. Excretion and tissue distribution of radioactivity from aflatoxin B1-14C in rats. Cancer Res. 1967, 27, 1729–1736. [Google Scholar]
  38. Groopman, J.D.; Fowler, K.W.; Busby, W.F.J.; Wogan, G.N. Nuclear distribution of aflatoxin B2 and its interaction with histones in rat liver in vivo. Carcinogenesis 1980, 2, 1371–1373. [Google Scholar] [CrossRef]
  39. Zhang, J.; Orang’o, O.; Tonui, P.; Tong, Y.; Maina, T.; Kiptoo, S.; Muthoka, K.; Groopman, J.D.; Smith, J.W.; Madeen, E.; et al. Detection and concentration of plasma aflatoxin is associated with detection of oncogenic human papillomavirus in Kenyan women. Open Forum Infect. Dis. 2019, 6, ofz354. [Google Scholar] [CrossRef]
  40. Rivera-Andrade, A.; Kroker-Lobos, M.F.; Lazo, M.; Freedman, N.D.; Smith, J.W.; Torres, O.; McGlynn, K.A.; Groopman, J.D.; Guallar, E.; Ramirez-Zea, M. High prevalence of non-alcoholic fatty liver disease and metabolic risk factors in Guatemala: A population-based study. Nutr. Metab. Cardiovasc. Dis. 2019, 29, 191–200. [Google Scholar] [CrossRef]
  41. Harrison, R.L. Introduction to Monte Carlo Simulation. Proc. AIP Conf. Proc. 2010, 1204, 17–21. [Google Scholar]
  42. Brinkley, J. Introduction to Data Simulation. In Proceedings of the Southeast SAS Users Group Meeting, St. Pete Beach, FL, USA, 14–17 October 2018; p. 135. [Google Scholar]
Figure 1. Guatemalan study (AC), Density plots of HSA (A), AFB1-lys (B), and albumin-normalized AFB1-lys (C) concentrations in the empirically observed and simulated data. The dark blue tracing represents the empirically observed Guatemalan sample (n = 327); the coral tracing represents the simulated sample (n = 20,000). (D) Regression of AFB1-lys adducts as raw (pg/mL serum) vs. albumin-normalized values (pg/mg HSA) in empirically observed and simulated datasets. (E) Regression of HSA levels (mg/mL) vs. albumin-normalized values. (F) Regression of HSA levels vs. raw AFB1-lys concentrations. (G) Subset of observations from empirical data regression analysis in (D), red arrows denote regression residuals and illustrate the impact of albumin normalization on units of the AFB1 internal dose. (H) Standardized regression residuals (Z-scored Studentized residuals) vs. serum total HSA concentration. Vertical dashed lines in (A,E,F,H) designate the reference range of HSA.
Toxins 14 00162 g001aToxins 14 00162 g001b
Figure 2. Qidong longitudinal study (AC), Density plots of HSA (A), AFB1-lys (B), and albumin-normalized AFB1-lys (C) concentrations in the empirically observed and simulated data. Blue and purple tracings represent each of the four years in the empirically observed Chinese cohort (1995, n = 97; 1999, n = 92; 2003, n = 87; 2009, n = 30); coral tracings represent the simulated sample (n = 20,000). (D) Regression of AFB1-lys adducts as raw (pg/mL serum) vs. albumin-normalized values (pg/mg HSA) in empirically observed and simulated datasets. (E) Plot of standardized regression residuals from (D) vs. serum total HSA concentration. Vertical dashed lines in (A,E) designate the reference range of HSA.
Toxins 14 00162 g002aToxins 14 00162 g002b
Figure 3. Gallbladder cancer case-control study (AC), Density and boxplots of HSA (A), AFB1-lys (B), and albumin-normalized AFB1-lys (C) concentrations in the empirically observed and simulated data. Dark blue and light blue tracings represent persons with gallbladder cancer (Case; Chile n = 23, Shanghai n = 107) and controls, or persons with gallstones (Control; Chile n = 18, Shanghai n = 67), respectively. Coral tracings represent the simulated sample (n = 20,000). (D) Regression of AFB1-lys adducts as raw (pg/mL serum) vs. albumin-normalized values (pg/mg HSA) in empirically observed and simulated datasets. (E) Plot of standardized regression residuals from (D) vs. serum total HSA concentration. Vertical dashed lines in (A,E) designate the reference range of HSA.* p < 0.0001.
Toxins 14 00162 g003aToxins 14 00162 g003b
Table 1. Multiple linear regression of AFB1-lys adduct concentrations in the Guatemalan study. 1.
1 Normalized (pg/mg HSA)1 Raw (pg/mL Serum)
Model 1Model 2Model 1
ParameterEstimate (SE)pR2Estimate (SE)pR2Estimate (SE)pR2
Intercept3.086 (0.556)<0.00010.124−1.595 (0.038)<0.00010.9763.086 (0.556)<0.00010.083
2 Raw AFB1-lys--0.999 (0.009)<0.0001--
2 HSA−0.951 (0.336)0.005--0.049 (0.336)0.883
3 Male−0.140 (0.057)0.016−0.003 (0.010)0.761−0.140 (0.057)0.016
4 Urban−0.194 (0.063)0.002−0.051 (0.010)<0.0001−0.194 (0.063)0.002
5 Education−0.004 (0.008)0.668−0.001 (0.001)0.602−0.004 (0.008)0.668
6 Income−0.097 (0.033)0.0030.002 (0.006)0.674−0.097 (0.033)0.003
1n = 325, two participants had missing data for income. 2 AFB1-lys and HSA concentrations were log10-transformed before analysis. 3 vs. female. 4 vs. rural. 5 per year of education. 6 per income quintile.
Publisher’s Note: MDPI stays neutral with regard to jurisdictional claims in published maps and institutional affiliations.

