Studying Asymptotic Giant Branch Stars in the JWST Era

1
INAF, Osservatorio Astronomico di Roma, Via Frascati 33, 00078 Monte Porzio Catone, Italy
2
Dipartimento di Matematica e Fisica, Universitá Degli Studi Roma Tre, Via Della Vasca Navale 84, 00100 Roma, Italy
*
Author to whom correspondence should be addressed.
Universe 2020, 6(12), 223; https://0-doi-org.brum.beds.ac.uk/10.3390/universe6120223
Submission received: 27 October 2020
/
Revised: 18 November 2020
/
Accepted: 19 November 2020
/
Published: 26 November 2020
(This article belongs to the Special Issue AGB Stars: Element Forges of the Universe)
Abstract
:We explore the potential offered by the incoming launch of the James Webb Space Telescope, to study the stars evolving through the asymptotic giant branch (AGB) phase. To this aim we compare data of AGB stars in the Large Magellanic Cloud, taken with the IRS spectrograph, with the results from modelling of AGB evolution and dust formation in the wind. We find that the best diagrams to study M- and C-stars are, respectively, ([F770W]−[F2500W], [F770W]) and ([F770W]−[F1800W], [F1800W]). ([F770W]−[F2500W], [F770W]) turns out to be the best way of studying the AGB population in its entirely.
1. Introduction
Despite the fact that the AGB phase lasts much shorter than the core hydrogen and helium burning phases, AGB stars have gained the interest of the astrophysical community in the last decades, because they are not only important “gas polluters” [1] and enrich the interstellar medium with dust [2].
A full comprehension of the dust formation mechanism in the outflow of AGB stars is crucial to interpret the observations, because the dust particles absorb and scatter the radiation coming from the photosphere, thus causing a shift of the spectral energy distribution (SED) to the infrared part (IR) of the spectrum. Some stellar evolution codes have been recently updated to account for the formation of dust in the wind of AGB stars [3,4,5]. However, several uncertainties still affect the robustness of the results, related to the poor knowledge of some physical mechanisms and of the dynamics of stellar winds.
These studies will definitively benefit from the incoming launch of the James Webb Space Telescope (JWST), which will allow an exhaustive census of the evolved stellar populations of the galaxies within the Local Group, and possibly beyond. The transmission curve of some of the filters of the MIRI camera, mounted onboard of the JWST, are overlapped with the spectral features related to the presence of specific dust species, which allow a detailed analysis of the dust mineralogy.
In this contribution we report on an ongoing research project based on the analysis of AGB stars in the Large Magellanic Cloud (LMC), for which data taken with the IRS instrument onboard of the Spitzer Space Telescope are available. The goal of this study is to provide a characterisation of the sources observed, to understand the evolution of the SED of the stars as they evolve through the AGB, with the ultimate aim to select the observational planes, based on the MIRI magnitudes, which allow the best identification of the stars observed.
2. AGB Evolution and Dust Production
In this section we show results based on evolutionary computations of stars of metallicity , obtained by means of the ATON code for stellar evolution [6]. The afore mentioned metallicity is typical of the stars in the LMC [7]. Dust formation in the wind is described by means of the schematization proposed by the Heidelberg group [2], in which the growth rate of the dust particles is determined based on the stellar parameters found via evolution modelling, i.e., mass, luminosity, effective temperature, mass-loss rate and the surface chemistry. For all the model stars we build a sequence of synthetic spectra, using the DUSTY code [8], assuming as input the results from star + dust formation modelling.
2.1. The Surface Chemistry of AGB Stars
The variation in the surface chemical composition of AGB stars is altered by the occurrence of third dredge-up (TDU) episodes, taking place after each thermal pulse, when the bottom of the convective envelope penetrates down to regions enriched in carbon [9]. Repeated TDU events may cause the number of carbon nuclei in the surface regions to exceed that of oxygen, with the formation of intermediate chemical type S-stars and of carbon stars. Reaching the C-star stage has relevant effects on the evolution of the star: the increase in the surface molecular opacities, favoured by the formation of C-bearing molecules [10], triggers a significant expansion of the surface regions, the decrease in the surface gravities, thus an enhancement in the mass-loss rate [11,12].
In stars with core mass above ∼0.8 (which is reflected in an initial mass ∼) the most relevant mechanism affecting the surface chemistry is hot bottom burning (HBB), the ignition of p-capture activity at the base of the external mantle, once the temperature exceeds ∼30 MK [13]. The activation of HBB makes the surface chemical composition to reflect the equilibria of CNO nucleosynthesis, with significant depletion of C and increase in the surface N. Strong HBB conditions lead to the destruction of the surface O, a phenomenon occuring mostly in metal-poor AGB stars [14]. Ignition of HBB triggers a significant increase in the luminosity, which, in turn, reflects into higher mass-loss rates. The luminosity of the stars experiencing HBB decreases during the late AGB phases, when the loss of the external mantle eventually turns HBB off.
2.2. AGB Stars as Dust Manufacturers
The evolution of the surface chemical composition is extremely important for the formation of dust in the wind of AGB stars, as the mineralogy of dust depends on the surface abundances of the various chemical species, primarily on the surface C/O ratio [2].
In the outflow of carbon stars the dominant dust species are silicon carbide (SiC), solid carbon and iron [2]. SiC, the most stable compound, forms in a region of the circumstellar envelope ∼2 stellar radii away from the stellar surface; carbon grains form at a distance of ∼5 from the surface of the star, whereas the condensation zone of solid iron is more external than the carbon dust formation region. The extinction of stellar radiation and the acceleration of the outflow is mostly determined by solid carbon particles: this is due to the higher availability of carbon when compared to silicon, and to the larger extinction coefficients of carbon with respect to SiC.
In M-stars most of the dust produced is under the form of silicates, aggregates composed by silicon, magnesium and oxygen molecules, which form at distances ∼ away from the stellar surface. Alumina dust particles form in a more internal region, but their effect on the extinction of the radiation is significantly smaller than silicates, owing to the much lower abundance of aluminium with respect to silicon. Iron dust is also formed, in a more external zone.
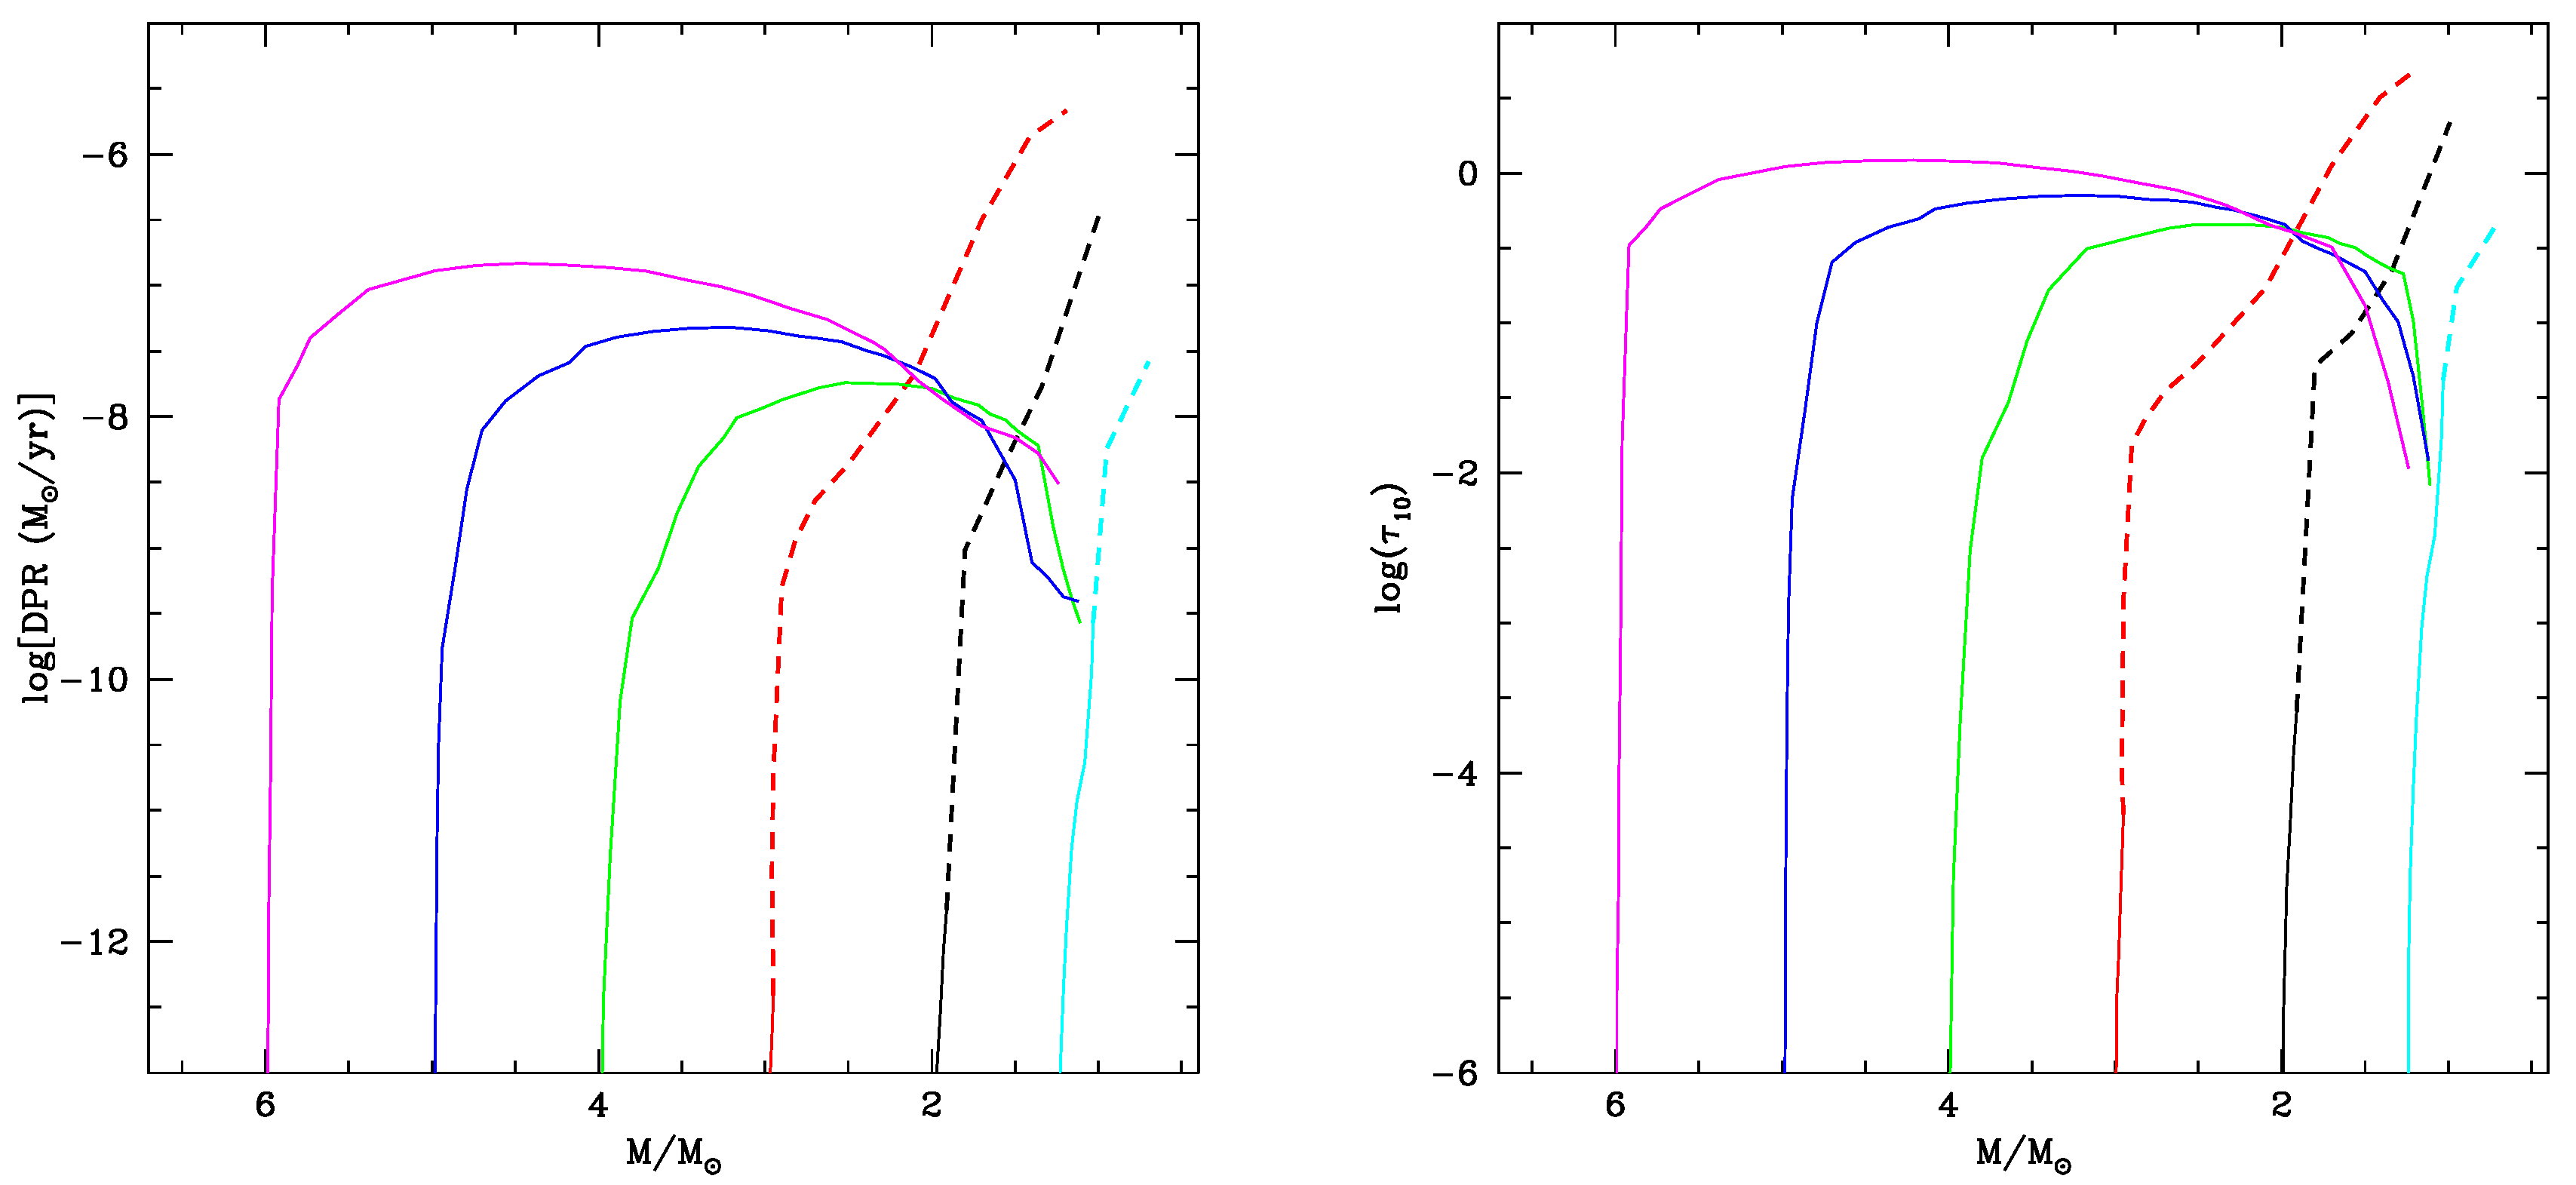
Figure 1 reports the evolution of dust production during the AGB phase of stars of different initial mass. The quantities shown in Figure 1 are the dust production rate (DPR) and the optical depth, estimated at the wavelength m. The former quantity is the rate at which dust is produced during a given evolutionary phase, whereas is calculated by integration of the product between the geometrical cross-section of the dust particles in the outflow and the extinction coefficient.
Low-mass stars () produce silicates during the initial AGB phase, then carbonaceous dust after becoming C-stars. DPR and increase significantly after the C-star stage is reached, because the number of carbon molecules available to dust condensation is generally higher than the number of silicon molecules present in the circumstellar envelope during the O-rich phases; furthermore, the extinction coefficients of carbon dust are higher than those of the other dust species.
As far as the oxygen-rich phase is concerned, the lower the mass of the progenitor the larger the DPR and reached. We see in Figure 1 that in the model star at the end of the O-rich phase, while in the models we find . This is because stars reach the C-star phase after a substantial fraction of the envelope was lost: during the phases just before the beginning of the C-star evolution these stars evolve at low surface gravities, which favour large , dense winds, thus large numbers of gaseous molecules available to condensation into dust. On the contrary, stars of initial mass experience very small mass-loss rates during the oxygen-rich phase, with negligible dust production [16].
The dust production efficiency of low-mass stars increases until the end of the AGB phase, because more and more quantities of carbon dust are formed during the evolution, owing to the effects of reiterated TDU events, which lead to a gradual accumulation of carbon in the surface regions. The stars reaching the largest DPR (∼yr) and (∼5) are those with mass in the range, because they experience a higher number of TDU events, thus enter the final AGB phases with large carbon mass fractions (X(C in the surface regions.
The stars descending from progenitors produce silicates, alumina dust and solid iron only, because HBB prevents the formation of C-stars. The largest DPR and optical depths are reached when the HBB is at the maximum efficiency, in conjunction with the largest values of the luminosity and the mass-loss rate. It is clear from Figure 1 that the peak values of DPR and increase with the initial mass of the star, because the higher the mass the stronger the HBB experienced, which makes the stars to evolve at larger luminosities and mass-loss rates, which favours higher densities of the wind [4,5].
2.3. Change in the Spectral Energy Distribution
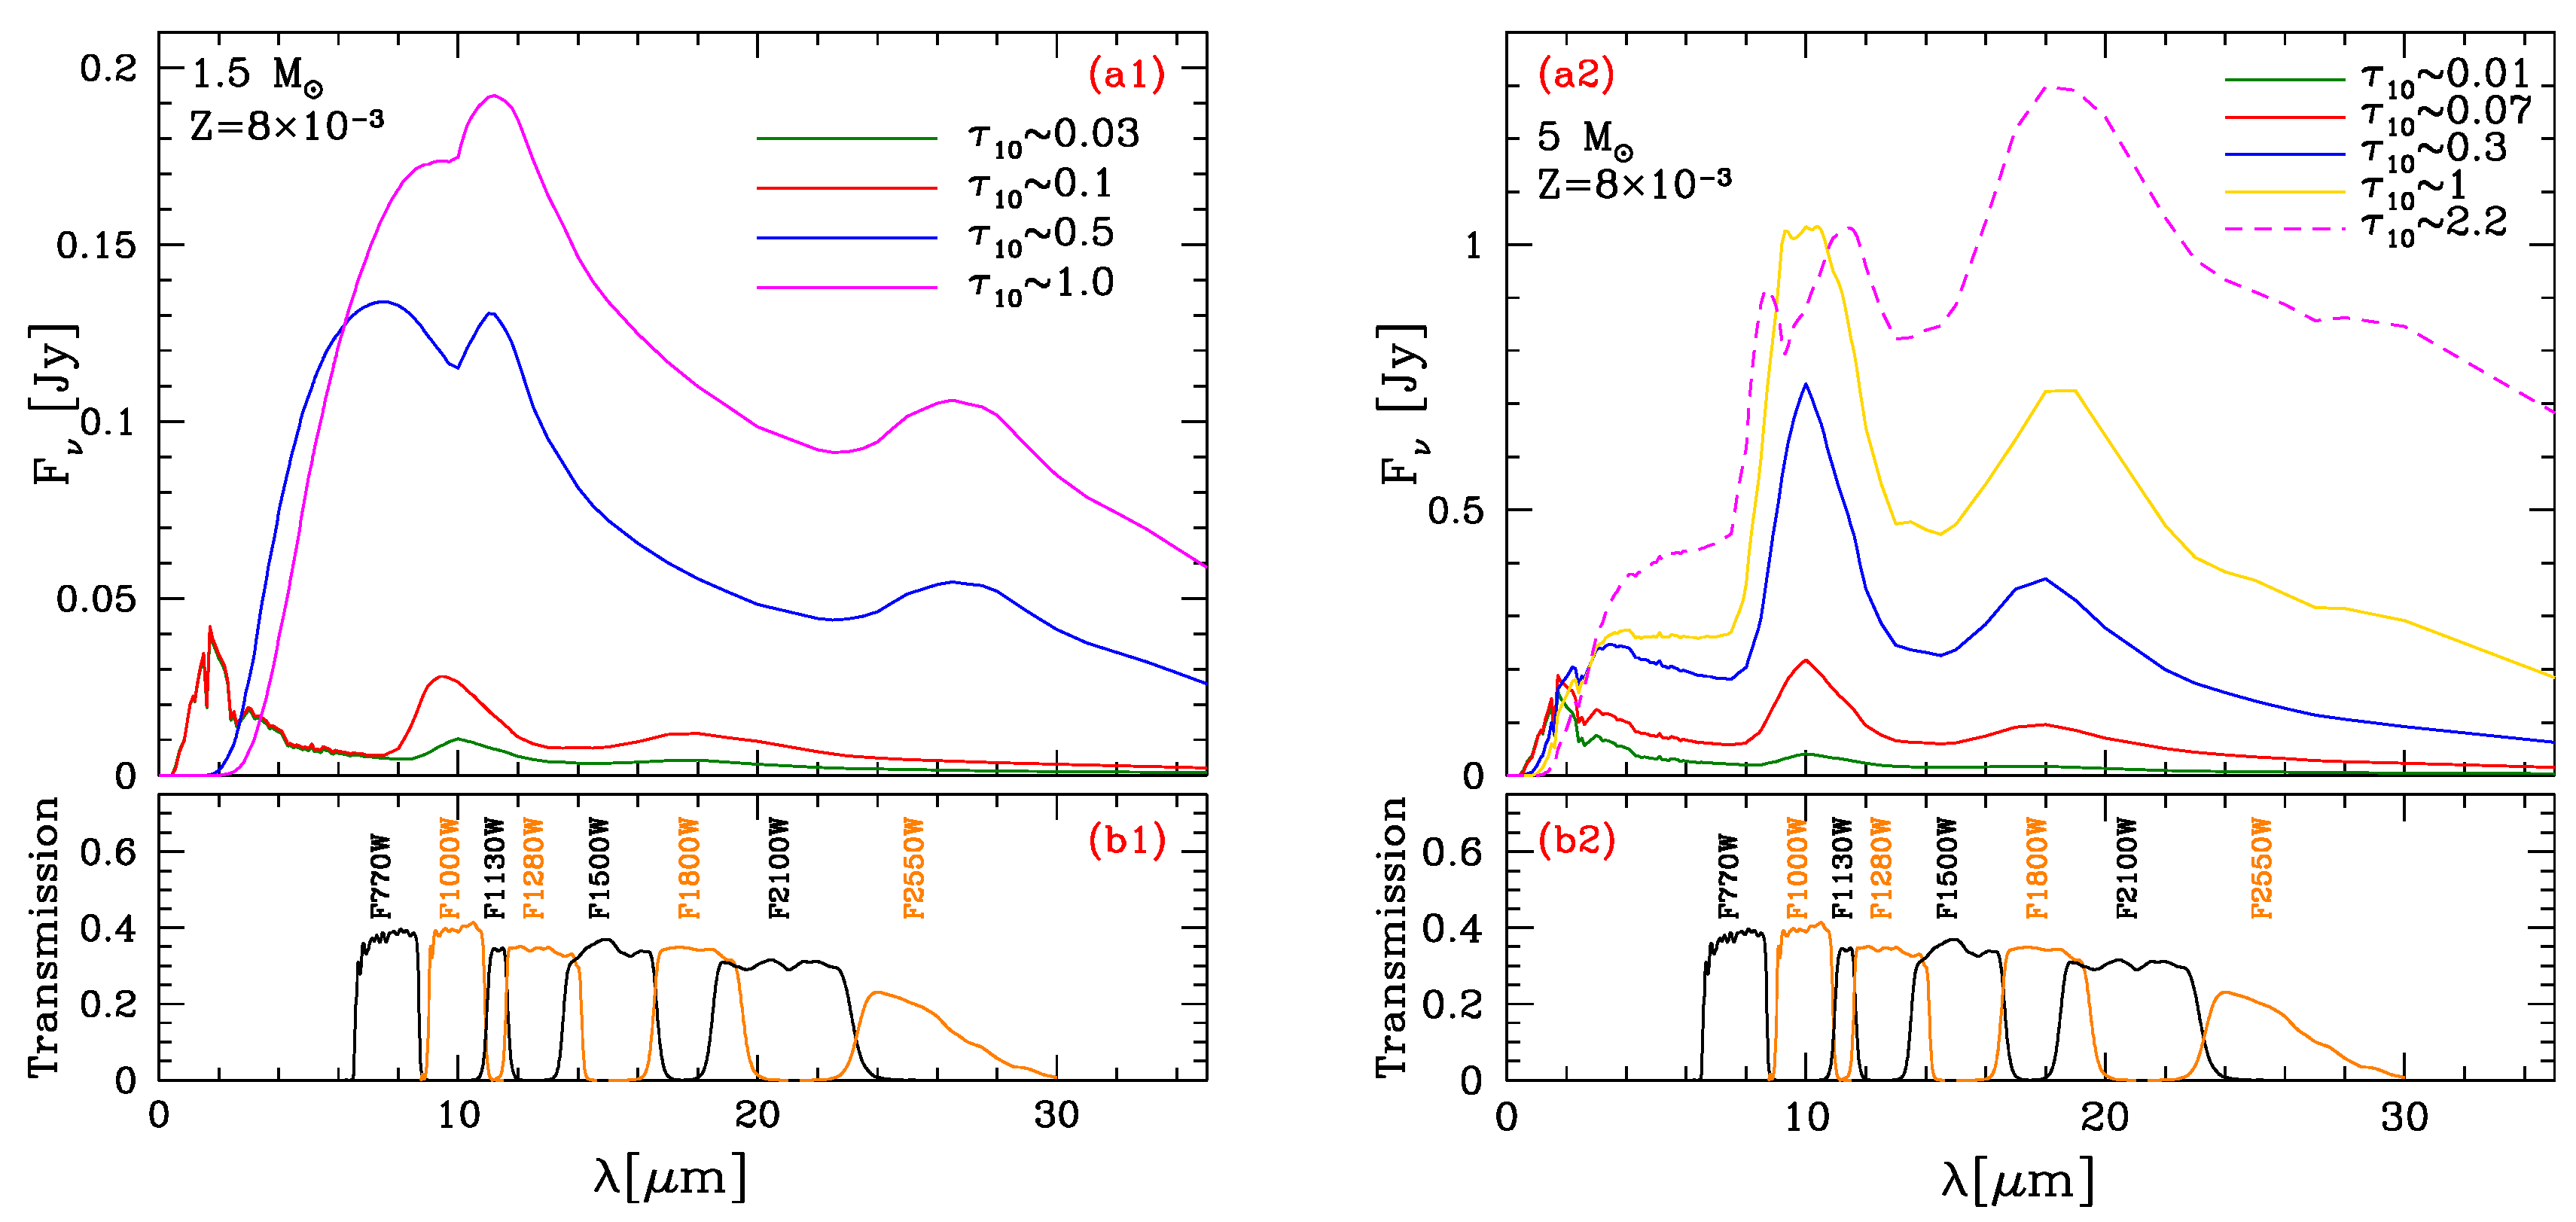
Figure 2 shows the evolution of the SED of two model stars of initial mass and , taken as representative, respectively, of low-mass AGBs, that become C-stars, and massive AGBs. These results are in fair agreement with the dust condensation sequences deduced on the basis of IRAS observations [17].
The stars in the low-mass domain evolve initially as M-stars and exhibit the silicate features at m and m. The features become more and more prominent during the evolution, owing to the increase in the optical depth. After the star becomes a C-star the silicate feature is replaced by the SiC one, centered at m. We notice in Figure 2 the m bump, generally attributed to the presence of MgS dust. On this regard, we believe important to warn the reader that there is still no general consensus that MgS is indeed the carrier for the broad m feature, because MgS grains cannot well fit the observed feature without introducing the elliptical-shaped grains. Other possibilities, e.g., graphite, are currently considered. Here we follow the analysis by [18], who presented a number of arguments in favour of the MgS hypothesis. In every case, the rise in the mid-IR fluxes is connected to the increase in , in turn related to the larger and larger amounts of dust formed in the wind.
The star evolves as oxygen rich for all the AGB phase. In this case the progressive increase in reflects into more prominent silicate features. This trend is reversed once exceeds unity, as the m feature turns into absorption, whereas the m feature becomes the dominant one.
3. Studying AGB Stars in the Mid-Infrared with JWST
The analysis of the SED of AGB stars proves the best tool to infer the dust composition of the outflow of these objects. On this regard the most exhaustive observational data-set is the collection of LMC, AGB spectra from the SAGE-Spec database at the NASA/IPAC Infrared Science Archive. This database includes all staring-mode observations with the Spitzer IRS taken in the area of the sky covered by the SAGE survey [19], which covers the LMC in its entirely.
In this section we compare the IRS data with the sequence of synthetic spectra for stars of different mass, calculated by means of the AGB+dust modelling described in the previous section. Both for the IRS and the synthetic SED we calculate the expected MIRI magnitudes, via convolution with the trasmission curves of the various filters, shown at the bottom of Figure 2. This allows us to select the observational planes most appropriate for the study of AGB stars.
On this regard, we believe important to mention the study by [20], who examined the sample of AGB stars in the Small Magellanic Cloud, finding that the best MIRI filters for separating C-stars from O-rich AGBs are F560W, F770W and F2100W. Ref [21] investigated AGB stars in the Local Group, and recommended use of F560W, F770W and F1800W to discriminate O-rich from C-rich stars. Finally, Ref [22] investigated the AGB stars in the LMC and concluded that the ([F1500W]−[F2100W]) colour can be safely used to separate C- and O-rich stars.
3.1. Oxygen-Rich AGB Stars in the LMC
In a recent study [15] analysed the M-star sample of evolved stars in the LMC, providing a reliable characterization of the individual sources, in terms of luminosity, optical depth and of the quantity and mineralogy of the dust formed in the wind. To this aim, [15] did a detailed comparison between the IRS data of each source and the sequence of synthetic spectra for each model star, obtained according to the methods described in the previous section.
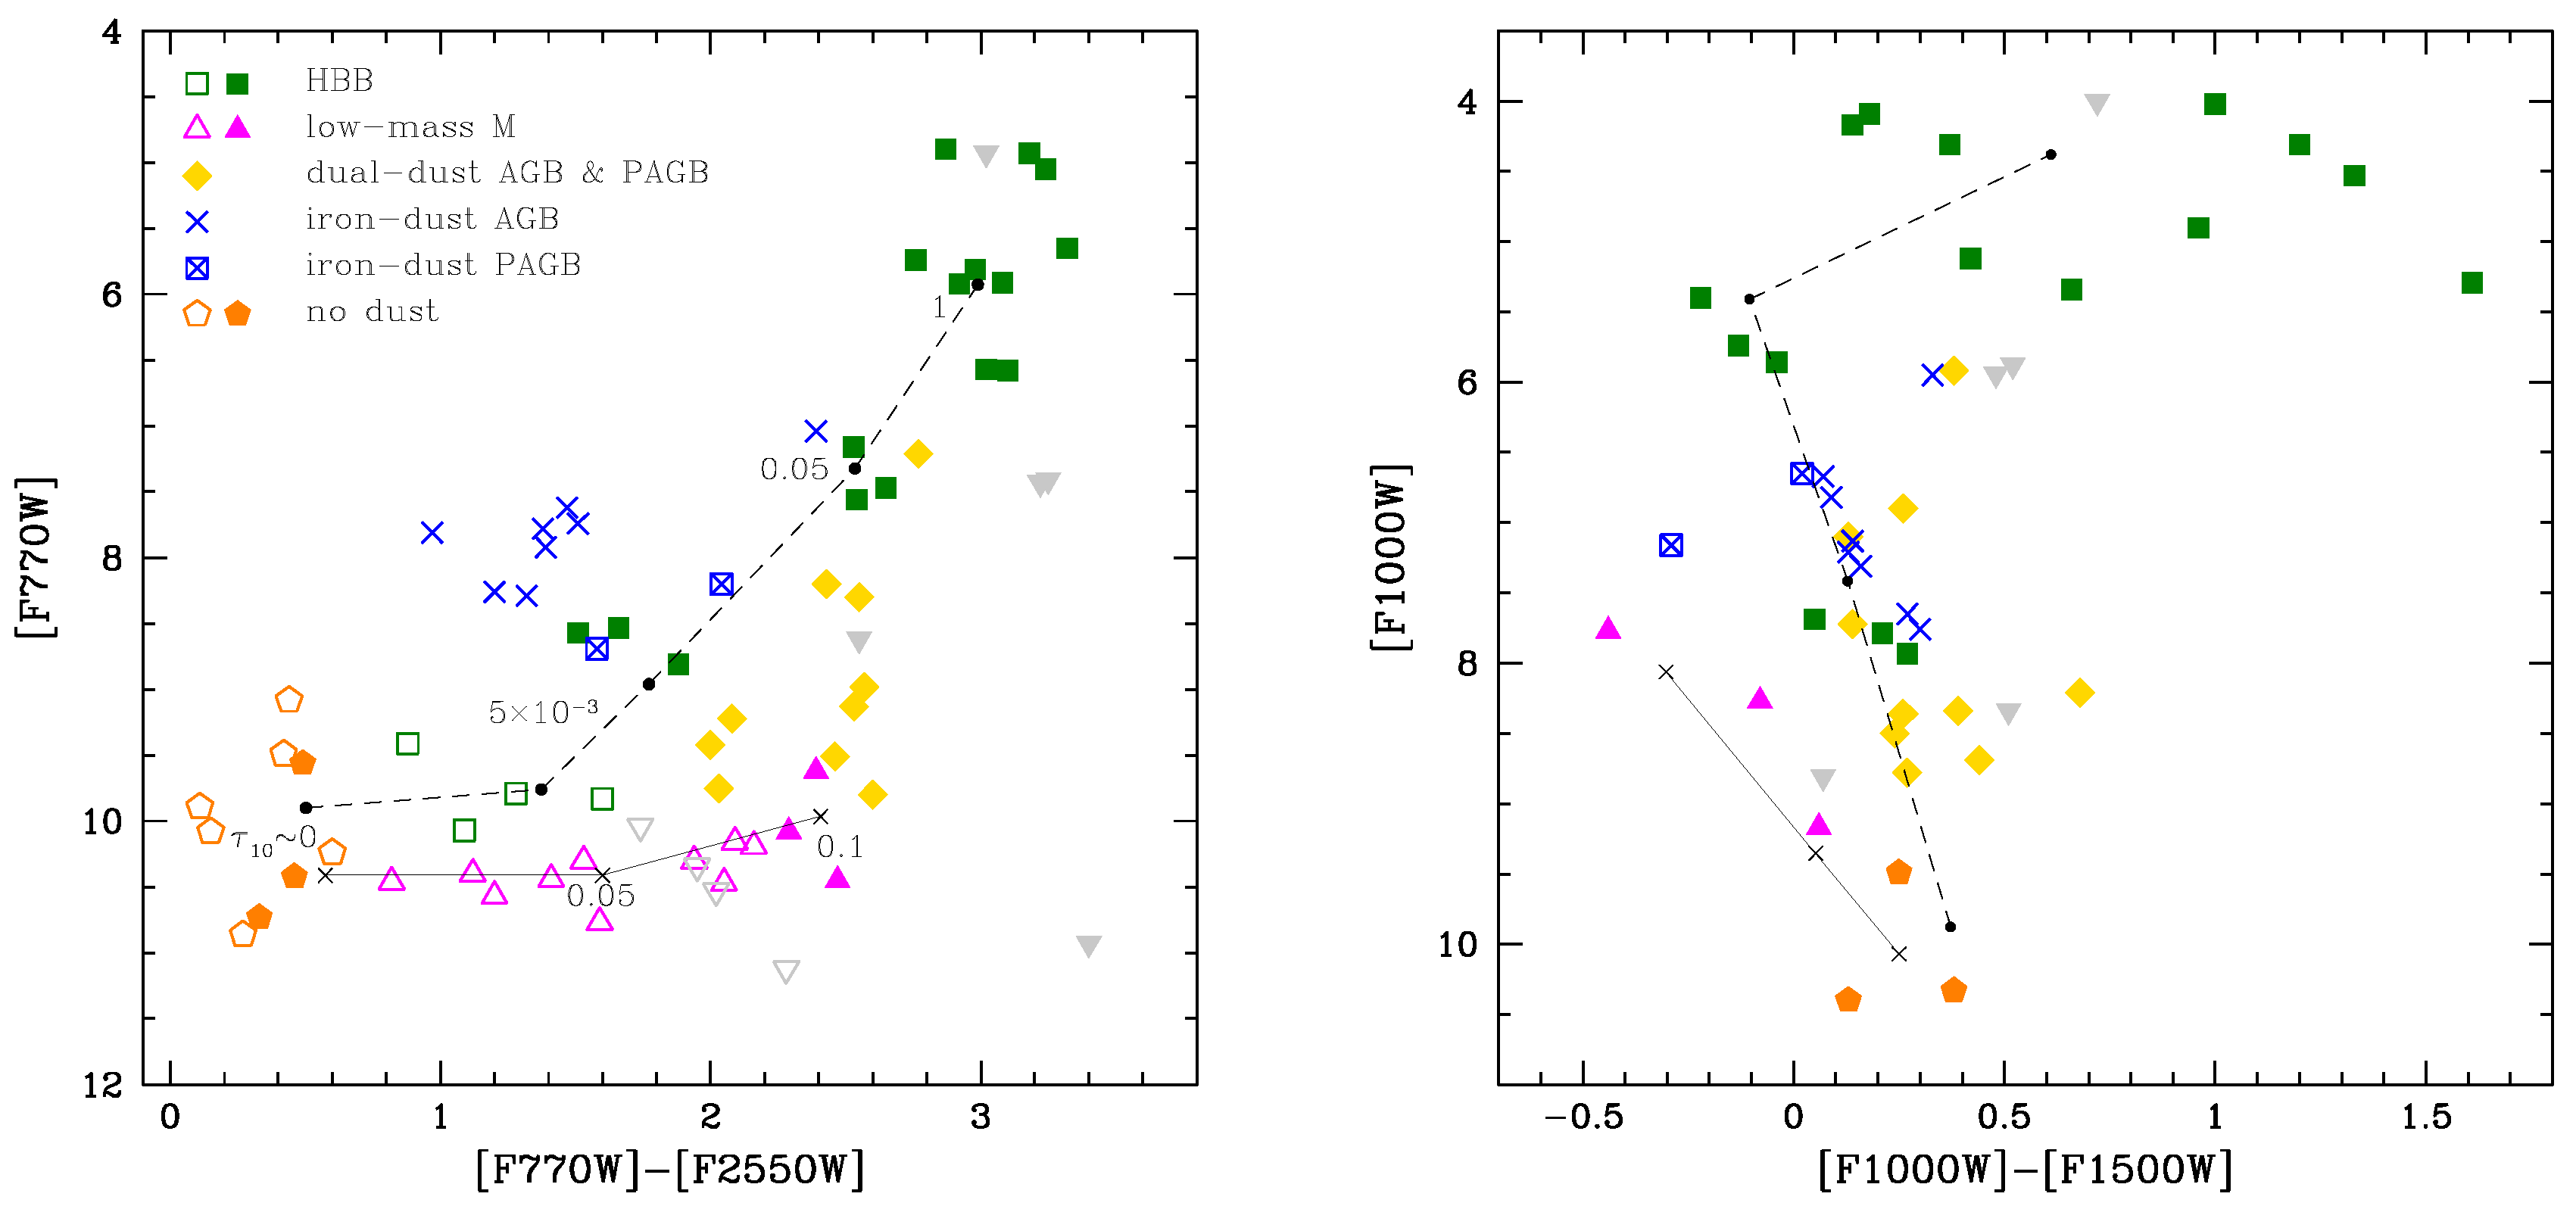
One of the main results of [15] was that the observational plane allowing the most exhaustive characterisation of M-type AGBs is the colour-magnitude ([F770W]−[F2500W], [F770W]) diagram. The left panel of Figure 3 shows with coloured points the distribution of the sample stars in this diagram, and two sequences of low-mass and massive AGB stars, calculated on the basis of synthetic modelling. The solid line refers to the evolution of a star (limited to the phases during which the star is oxygen-rich). The reddening sequence is almost horizontal, because: (a) the luminosity of the stars during the oxygen-rich phase is within the range; (b) when increases, the m feature becomes more prominent, while the flux in the m region keeps approximately constant, owing to the presence of a clear minimum of the SED in that region of the spectrum (see the red and green lines in the left panel of Figure 2). The evolutionary sequence of stars (not shown) extend to [F770W]−[F2500W], because, as discussed in Section 2.2, these stars produce negligible quantities of dust during the O-rich phase. The dashed sequence refers to the evolution of a model, taken as representative of the stars experiencing HBB. The tracks of stars would be overlapped to the dashed line in the left panel of Figure 3, because the most relevant physical quantity in this context is the temperature at the base of the envelope, which determines the strength of HBB, thus the luminosity and the rate of dust production [5]. The difference among stars of different mass is that the higher the initial mass of the star the larger the maximum reached during the AGB phase (see Figure 1).
The stars in the lower part of the diagram, indicated with magenta triangles, are interpreted as the progeny of stars, evolving through the AGB phases earlier than the achievement of the C-star stage. The higher , the redder ([F770W]−[F2500W]), as can be understood by looking at the synthetic SEDs shown in the left panel of Figure 2, where we note a gradual increase in the F2500W flux with respect to F770W. According to the previous discussion, the stars populating the region at [F770W]−[F2500W] descend from progenitors with initial mass in the range.
The diagonal sequence of stars, indicated with green squares, are interpreted as massive AGB stars, characterized by different . We find for M-stars a maximum of ∼1, a result at odds with the observations, which indicate that the most obscured M stars evolve at .
The analysis of the position of the stars in the diagram discussed here allows to identify: (a) metal-poor, massive AGBs, whose main dust component is solid iron [23]; (b) dual chemistry AGB stars, surrounded by an internal dust layer, composed of carbonaceous dust, and a more external region, harbouring silicates [24].
Other observational diagrams are less useful for the characterization of M-type AGB stars. This is due to the non linear response of the silicate features to the increase in the optical depth, as shown in the right panel of Figure 2: the evolutionary sequences in the diagrams with [F1000W] or [F1800W] show changes in the slope, which makes hard their use to characterise the individual sources. As an example, we show in the right panel of Figure 3 the distribution of the LMC M-type AGB stars in the ([F1000W]−[F1500W], [F1000W]) diagram. The sequence of low-mass stars defines a diagonal line, with the most obscured stars having bluer colours. This is because the larger the amount of silicates in the circumstellar envelope the higher the F1000W flux. Higher mass models define a similar trend in the first part of their sequence: they evolve towards the blue because the appearance of the main silicate feature increases the F1000W flux and diminishes the emission in the wavelength region around [F1500W]. However, when exceeds 0.1, the sequence turns towards the red because the whole mid-IR flux is raised, together with the F1500W flux, which makes ([F1000W]−[F1500W]) redder. The most obscured stars follow an approximately horizontal trend on this diagram because for > 1 the silicate feature gradually turns into absorption, thus no further increase in the F1000W flux occurs. Note that in this diagram the stars are spread within a narrower region than in the ([F770W]−[F2500W], [F770W]) diagram, with a ([F1000W]−[F1500W]) spread of ∼2 mag, to be compared to the ([F770W]−[F2500W]) spread, which is ∼3 mag. Additionally, the stars surrounded by iron dust and those with dual chemistry dust are not clearly separated from the main AGB population.
3.2. Carbon Stars in the LMC
We extend to the C-stars sample in the LMC the analysis proposed for M-type AGB stars. Based on the discussion of the previous section, the stars to be considered are low-mass stars, evolving through the final part of the AGB phase. Metal-poor, higher mass AGBs can also be taken into account, because they may turn to carbon stars during the very final AGB phases, after HBB is turned off, and a few TDU events can easily rise the surface C/O above unity.
In the previous section we discussed the gradual increase in the surface carbon taking place during the AGB phase, owing to the effects of reiterated TDU events. This reflects into a higher rate of (carbonaceous) dust formation and larger optical depths, as shown in Figure 1.
For carbon stars, use of the ([F770W]−[F2500W], [F770W]) diagram is less straightforward compared to the M-star population, because the F2500W flux is affected by the m bump, which is observed only in some of the C-rich sources in the LMC. The diagrams allowing the most exhaustive characterisation of carbon stars are ([F770W]−[F1800W], [F1800W]) and ([F1000W]−[F1800W], [F1800W]). The spectral region around m is free of features associated to carbon-bearing molecules, which makes the F1800W flux a valuable indicator of the luminosity of C-stars.
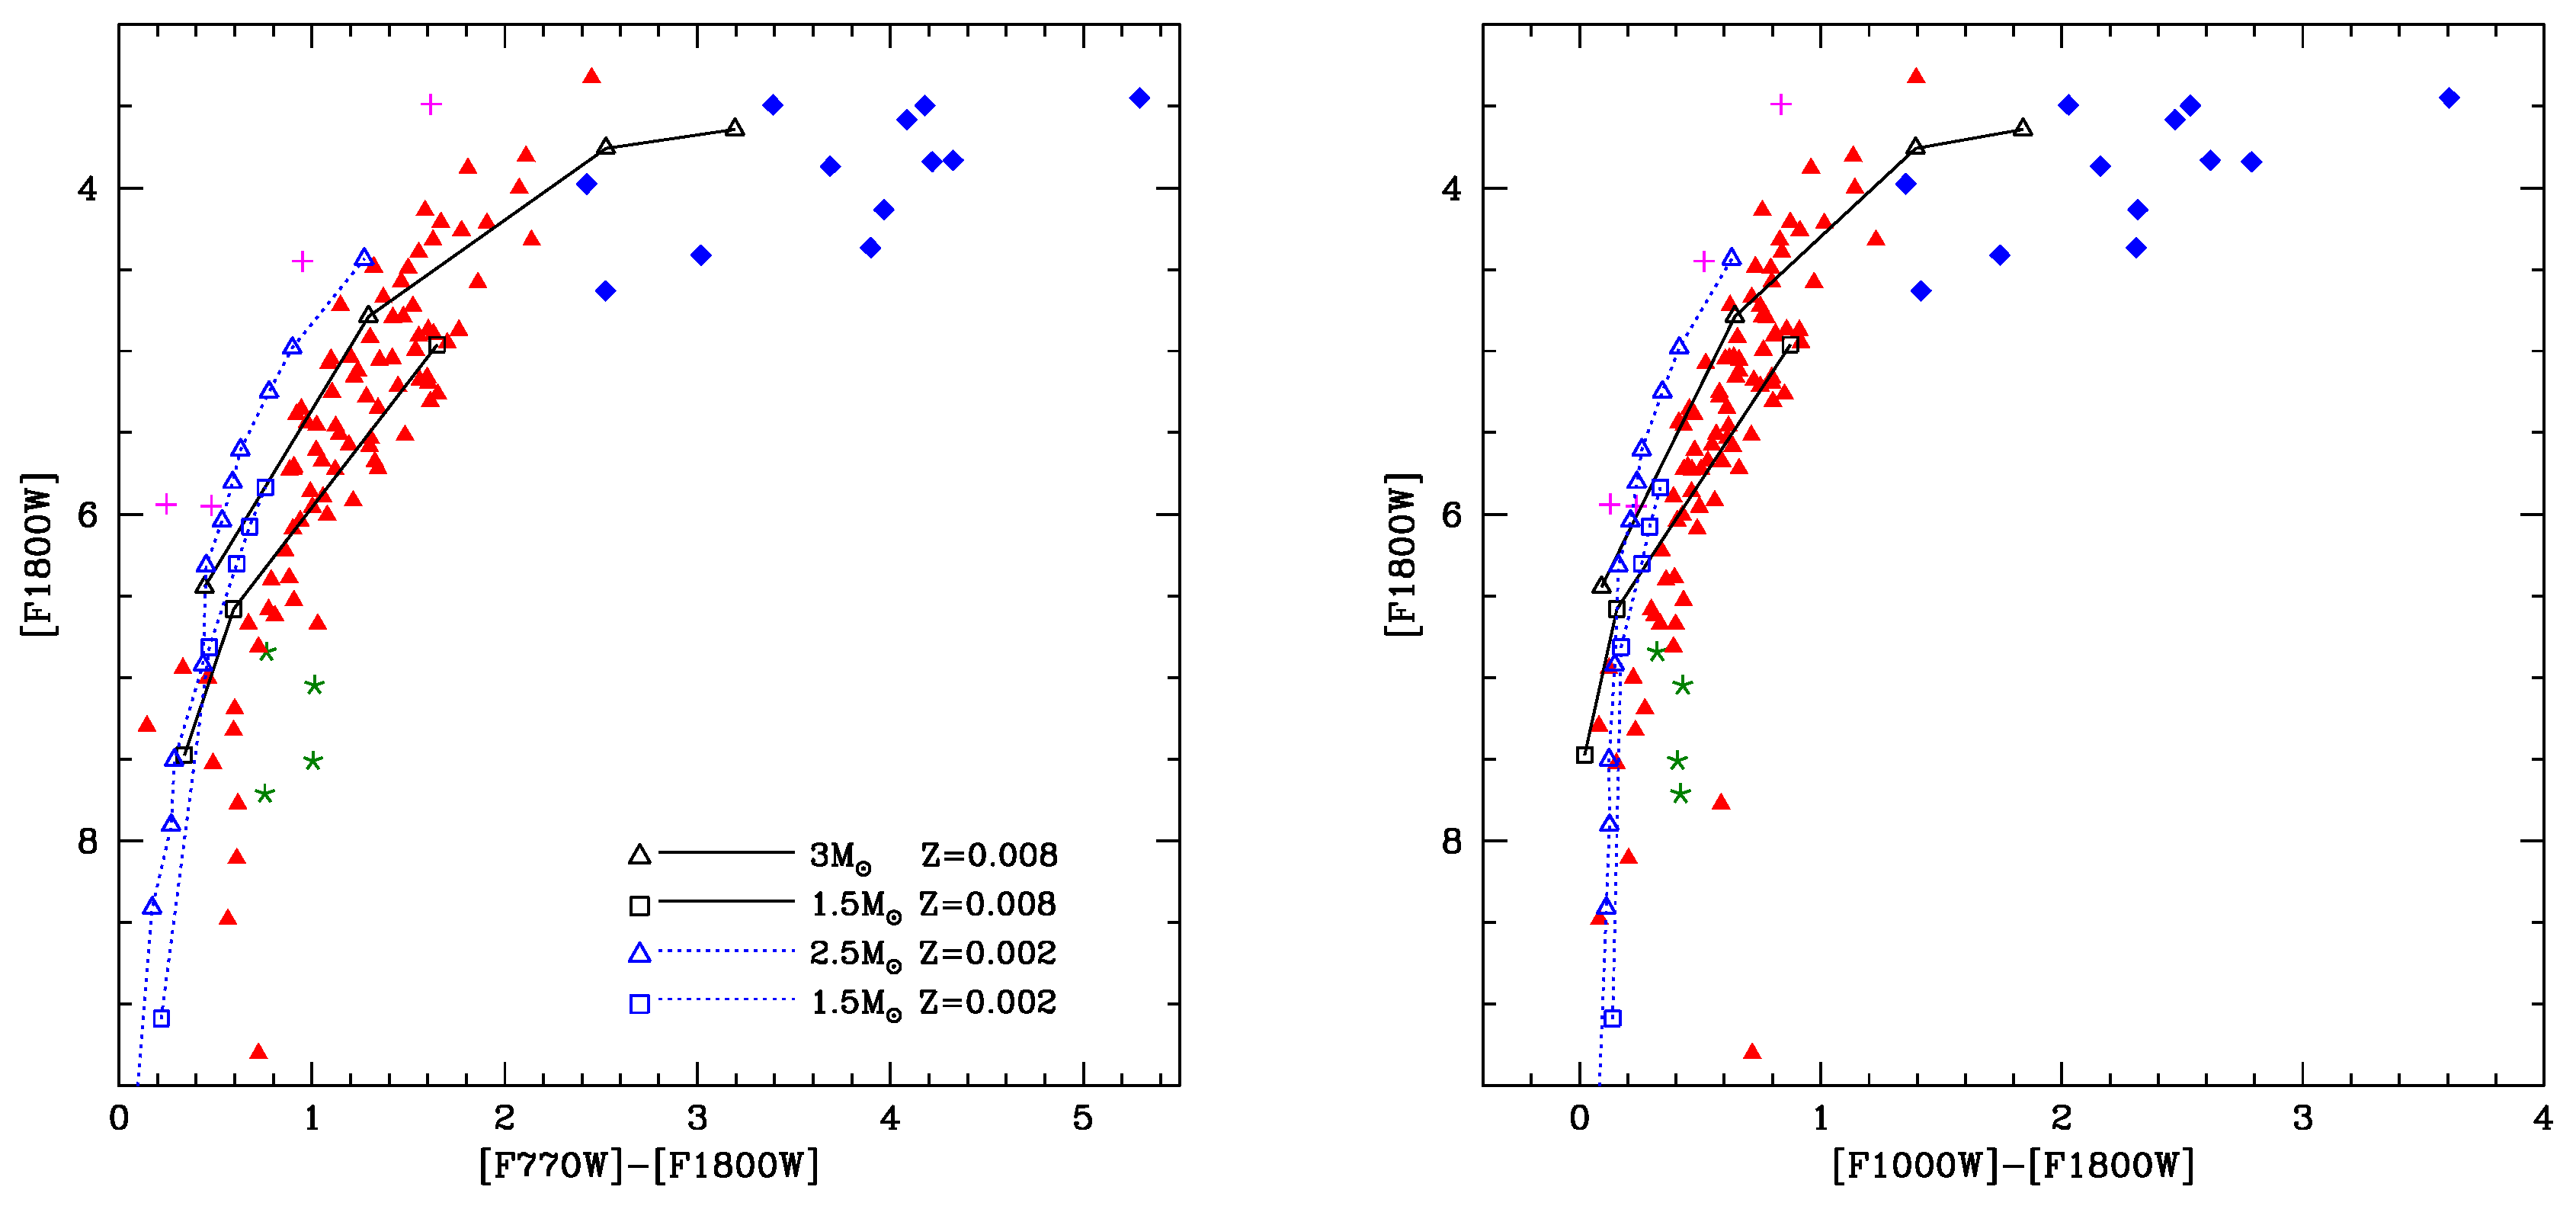
The distribution of carbon stars in the ([F770W]−[F1800W], [F1800W]) diagram is reported in the left panel of Figure 4, where we also show the evolutionary sequences of low-mass stars of different initial mass, restricted to the C-star phase. The tracks evolve to the red as the optical depth increases and the peak of the SED is shifted to longer wavelengths, as shown in the left panel of Figure 2. The ([F770W]−[F1800W]) colour, which spans an interval of ∼4 mag, proves a reliable indicator of the optical depth, which changes from , for the dust-free stars in the bottom, left side of the plane, to , for the reddest sources.
For a given ([F770W]−[F1800W]) the observed points define a ∼1 mag spread in F1800W, connected to a luminosity spread, related to the presence of stars of different mass. Indeed the luminosity of carbon stars is sensitive to the mass of the progenitors, ranging from ∼, for ∼ stars, to ∼, for . The sequence of stars in the upper region of the plane exhibits a larger redwards excursion than their fainter counterparts; this is consistent with the results of Figure 1, showing that the higher the mass of the progenitor, the larger the optical depth attained during the final AGB phases.
The evolutionary tracks provide a nice fit of the observations, with the exception of the stars indicated with blue diamonds in Figure 4, which are in a region of the plane beyond the reddest point reached by the tracks. The analysis of the SED of these objects demands optical depths , only partly overlapped with the range derived from AGB+dust modelling. The mismatch between modelling and observations is particularly important for the stars with F1800W , interpreted as low-mass stars, which are not expected to reach optical depths above unity (see Figure 1). Binarity might be a possible explanation for these red colours [25].
Regarding the stars indicated with magenta crosses, the luminosities derived by SED fitting are in the range, significantly higher than those reached by low-mass AGBs. For these stars we suggest that either a) they descend from progenitors and are currently evolving through an evolutionary phase when they have reached the C-star phase, owing to the effects of TDU events, whereas HBB has not yet been activated, or b) they descend from metal-poor, massive (∼) progenitors, currently evolving through the very final AGB phases, after HBB was turned off.
Green asterisks in Figure 4 refer to stars with luminosities below ; this creates some tension with the results from AGB modelling, according to which the C-star phase begins at . We suggest that these objects are C-stars which have recently undergone a thermal pulse, such that the CNO burning shell has not been fully re-activated, thus the luminosity is lower than during the inter-pulse phase.
The distribution of the stars in the ([F1000W]−[F1800W], [F1800W]) diagram is shown in the right panel of Figure 4, where we also report the evolutionary tracks of the same model stars shown in the left panel. The pattern traced by the stars on the two diagrams are substantially similar, with the difference that ([F1000W]−[F1800W]) is less sensitive to than ([F770W]−[F1800W]): the former spans a magnitude interval of ∼3 mag, against ∼4 mag, for ([F770W]−[F1800W]). On the other hand, the F1000W flux is sensitive to the metallicity of the star, because the transmission curve of F1000W overlaps with the m feature, which is affected by the amount of silicon in the external regions of the star. This allows use of ([F1000W]−F1800W) as a metallicity indicator: the distribution of stars in the right panel of Figure 4 outlines that the tracks of metal-poor stars better reproduce the position of the stars in the bottom, left region of the diagram, which we expect to be mainly populated by low-mass stars: this suggests that a significant fraction of these objects formed in a metal-poor environment, consistently with the star formation history of the LMC [7].
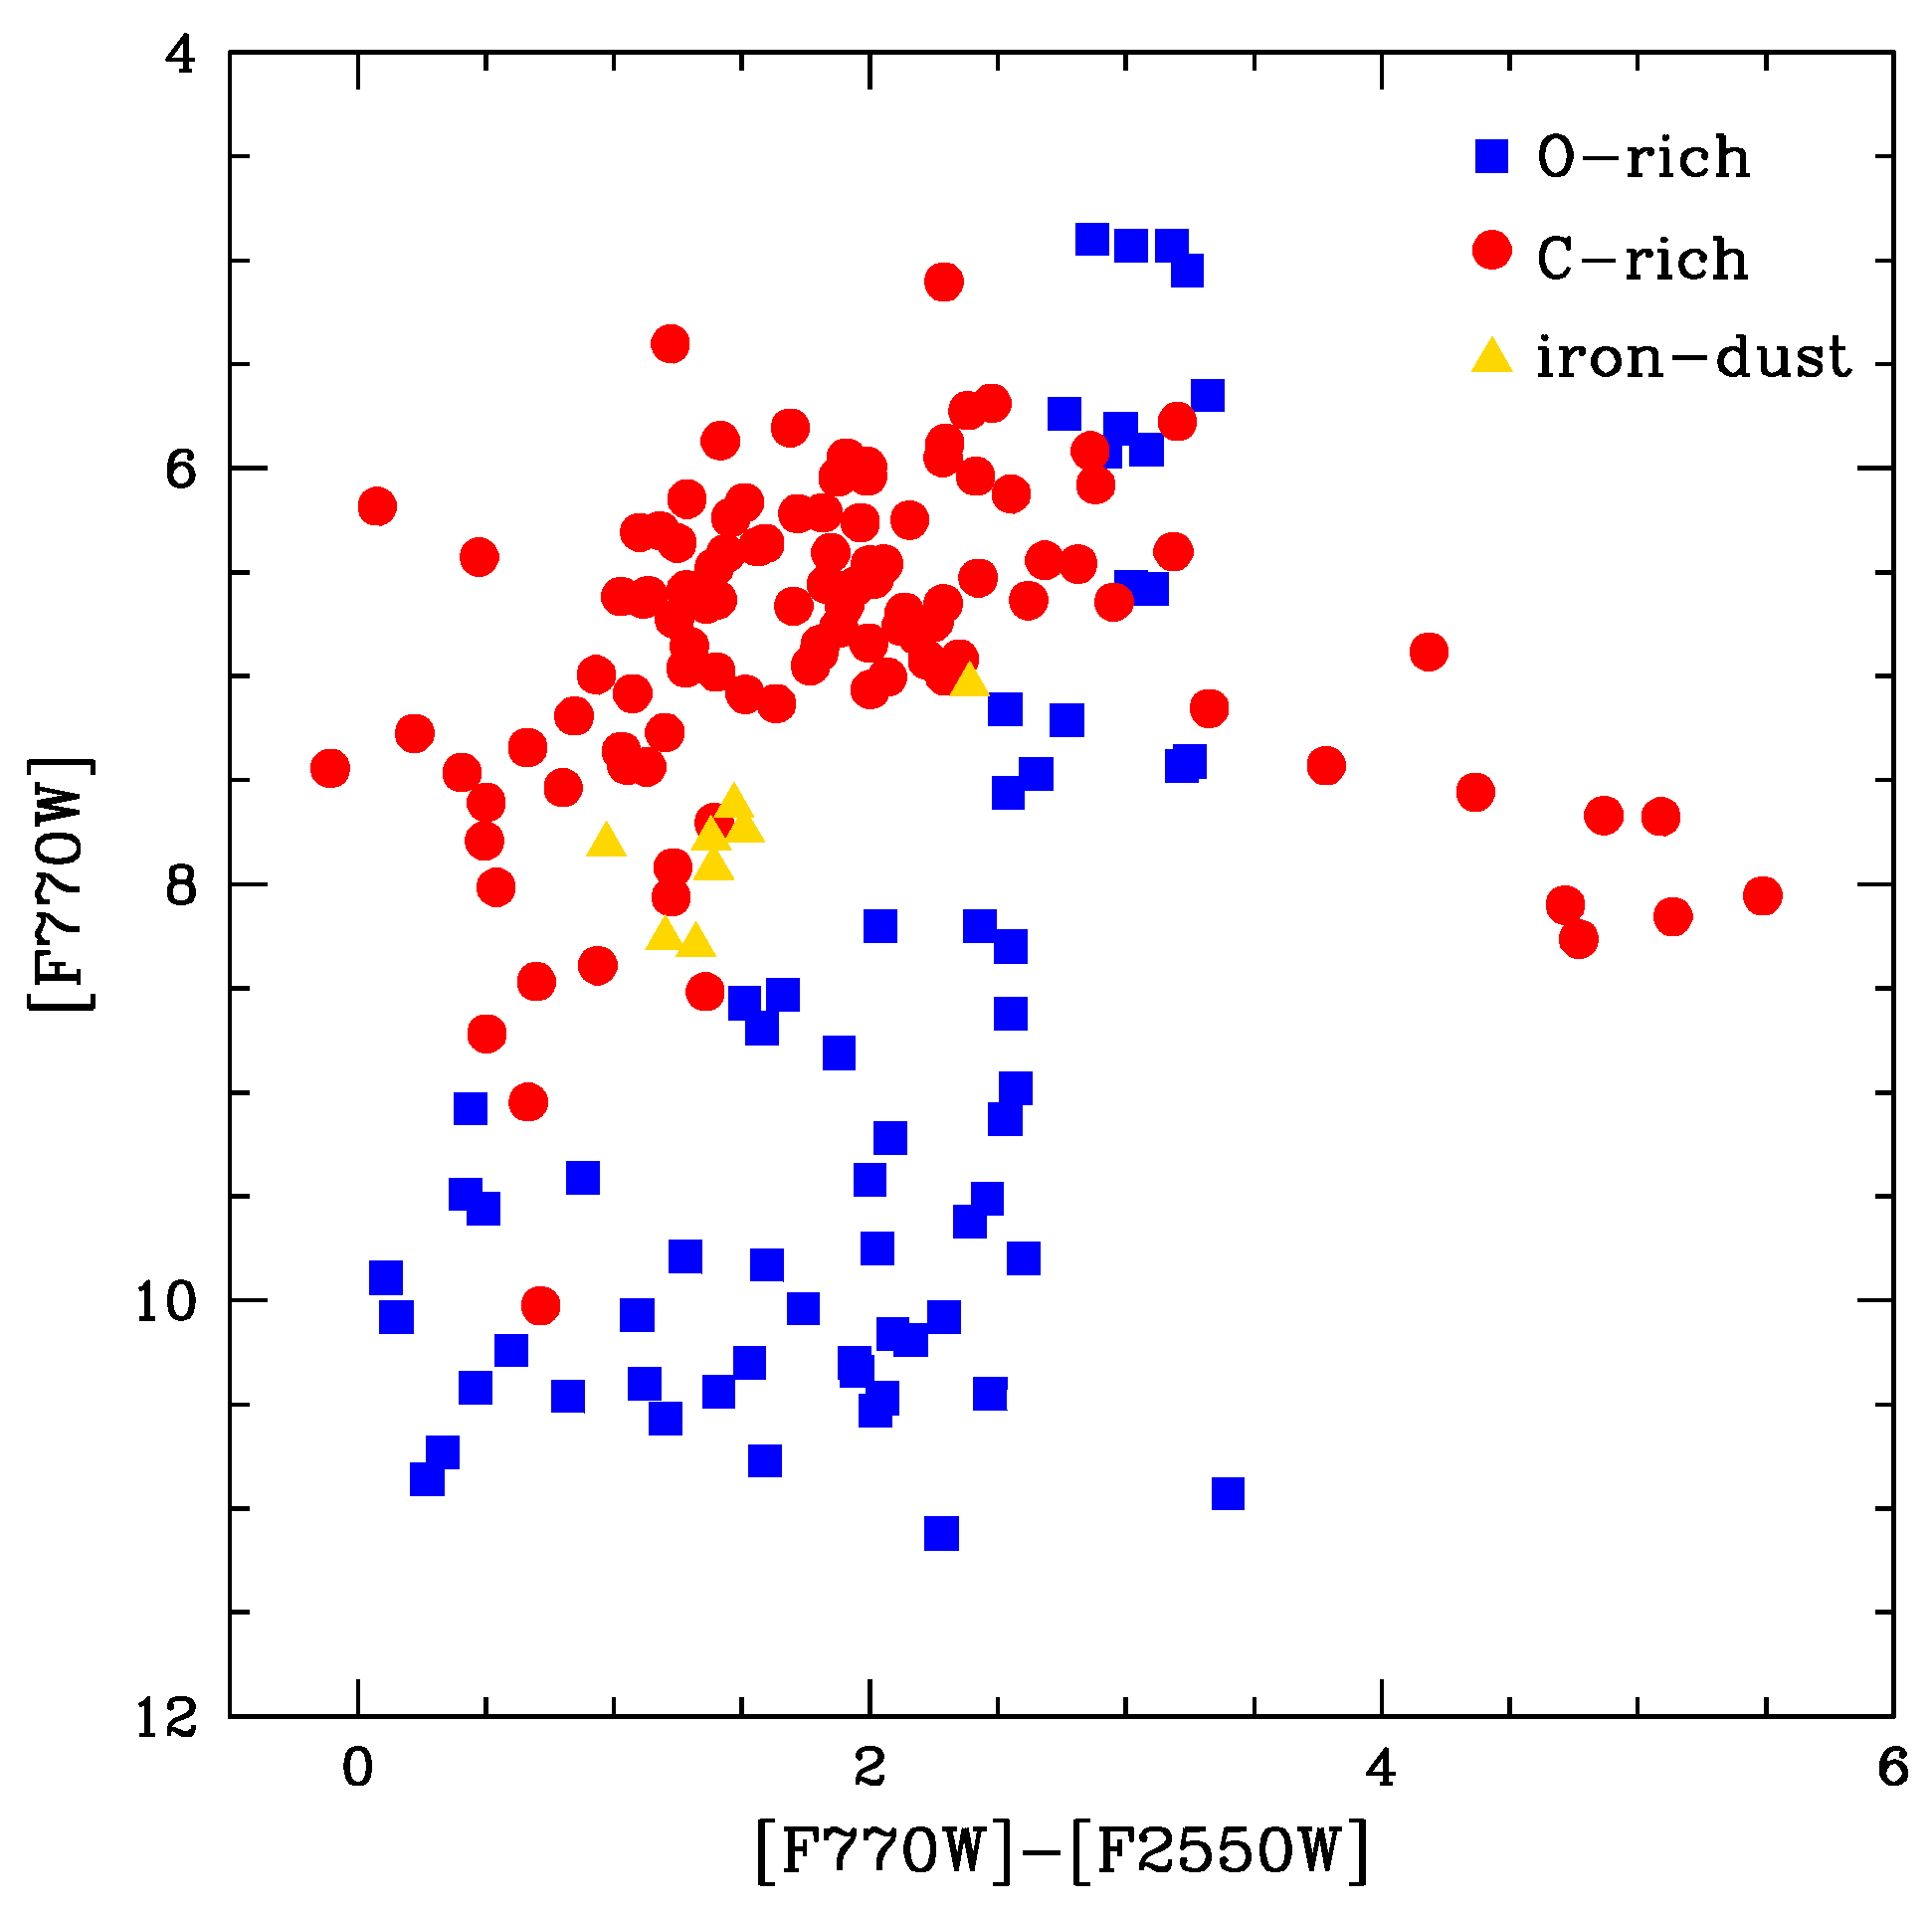
3.3. Drawing the Origin of AGB Stars through a JWST CMD
We have discussed separately the diagrams most suitable to characterise carbon stars and oxygen-rich sources. On the other hand it is important to consider observations aimed at investigating the whole AGB population, to be applied to other galaxies in the Local Group. On this regard, we suggest the ([F770W]−[F2500W], [F770W]) diagram as the best diagram to study dusty AGB sources. As shown in Figure 5, carbon stars and M-type AGBs define two distinct sequences, which can be used to distinguish stars belonging to either groups.
The reddening sequence traced by carbon stars exhibits a rising trend up to ([F770W]−[F2500W] and [F770W, then the F770W flux decreases for redder colours, because for the peak of the SED gets close to ∼m (see left panel of Figure 2). The C-star sequence extends to redder colours than M stars, because the largest attained by C-stars are significantly higher than the peak reached by M-type AGBs (see Figure 1). A further reason for the higher extension of the C-star sequence in this diagram is the presence of the m bump in the SED of carbon stars, which rises the F2500W flux (see Figure 2).
Unlike C-stars, the path traced by oxygen-rich AGB is very steep, with a positive slope, extending to ([F770W]−[F2500W] and [F770W] . The reason for this difference is that M-type AGBs never evolve to and their luminosity increases as HBB becomes more and more vigorous, and larger quantities of dust is formed in their wind.
The sequences of C- and M-type AGB stars are separated also in the low domain, in the ([F770W]−[F2500W] region of the diagram. Carbon stars are on the average brighter here, because the C-star stage is reached only after the luminosity exceeds ∼. Furthermore, as discussed earlier in this section, the reddening pattern traced by low-mass, M-type AGBs is substantially horizontal.
In the diagram examined here the only ambiguity is related to the M-stars interpreted as surrounded mainly by iron dust, which overlaps with carbon stars. This is because solid iron, similarly to carbon dust, is a featureless species, which renders the reddening patterns extremely similar.
4. Conclusions
We investigated the expected distribution of AGB stars in the observational planes obtained with the magnitudes in the MIRI filters. This study was based on the detailed comparison between the IRS spectra of evolved stars in the LMC with results from synthetic modelling, based on the description of the structure and evolution of AGB stars and of dust formation in the wind.
We find that the plane most suitable for the description of oxygen-rich AGB stars is the ([F770W]−[F2500W], [F770W]) diagram. Use of this diagram allows disentangling the reddening sequences of low-mass stars (limited to the evolution preceding the C-star phase) and massive AGBs, experiencing HBB. Regarding carbon stars, the diagram allowing the most exhaustive characterisation of the individual sources is the ([F770W]−[F1800W], [F1800W]) diagram. This is because the spectral region covered by the F1800W transmission curve is substantially free of molecular features, which makes [F1800W] a valuable indicator of luminosity. Furthermore, [F770W]−[F1800W] can be used as a reliable estimator of the optical depth.
([F770W]−[F2500W], [F770W]) proves the best diagram to study the overall AGB population of galaxies, since the sequences of carbon stars and M-type AGBs are fairly well separated, which allows a solid characterisation of the sources observed.
This study can be used as a benchmark to future investigations of galaxies with JWST in the mid-IR spectral regions. A parallel analysis focused on the near-IR spectral regions is required for a full exploration of the JWST potentialities in this field.
Author Contributions
Conceptualization, P.V.; Investigation, E.M. and S.T.; Supervision, F.D.; Writing — original draft, P.V. All authors have read and agreed to the published version of the manuscript.
Funding
This research received no external funding.
Conflicts of Interest
The authors declare no conflict of interest.
References
- Romano, D.; Karakas, A.I.; Tosi, M.; Matteucci, F. Quantifying the uncertainties of chemical evolution studies. II. Stellar yields. Astron. Astrophys. 2010, 522, A32. [Google Scholar] [CrossRef]
- Ferrarotti, A.; Gail, H.P. Composition and quantities of dust produced by AGB-stars and returned to the interstellar medium. Astron. Astrophys. 2006, 447, 553–576. [Google Scholar] [CrossRef]
- Nanni, A.; Bressan, A.; Marigo, P.; Girardi, L. Evolution of thermally pulsing asymptotic giant branch stars—II. Dust production at varying metallicity. Mon. Not. R. Astron. Soc. 2013, 434, 2390–2417. [Google Scholar] [CrossRef] [Green Version]
- Ventura, P.; Cirscienzo, M.D.; Schneider, R.; Carini, R.; Valiante, R.; D’Antona, F.; Gallerani, S.; Maiolino, R. Tornambé, A. Dust formation around AGB and SAGB stars: A trend with metallicity? Mon. Not. R. Astron. Soc. 2012, 424, 2345–2357. [Google Scholar] [CrossRef] [Green Version]
- Ventura, P.; Dell’Agli, F.; Schneider, R.; Criscienzo, M.D.; Rossi, C.; Franca, F.L.; Gallerani, S.; Valiante, R. Dust from asymptotic giant branch stars: Relevant factors and modelling uncertainties. Mon. Not. R. Astron. Soc. 2014, 439, 977–989. [Google Scholar] [CrossRef] [Green Version]
- Ventura, P.; Zeppieri, A.; Mazzitelli, I.; D’Antona, F. Full spectrum of turbulence convective mixing: I. theoretical main sequences and turn-off for 0.6–15 Msun. Astron. Astrophys. 1998, 334, 953–968. [Google Scholar]
- Harris, J.; Zaritsky, D. The Star Formation History of the Large Magellanic Cloud. Astron. J. 2009, 139, 1243–1260. [Google Scholar] [CrossRef]
- Nenkova, M.; Ivezic, Z.; Elitzur, M. DUSTY: A Publicly Available Code for Continuum Radiative Transfer in Astrophysical Environments. Lunar Planet. Inst. 1999, 969, 20. [Google Scholar]
- Marigo, P. Asymptotic Giant Branch evolution at varying surface C/O ratio: Effects of changes in molecular opacities. Astron. Astrophys. 2002, 387, 507–519. [Google Scholar] [CrossRef]
- Marigo, P. Post Main Sequence Evolution of Single Stars. Annu. Rev. Astron. Astrophys. 1974, 12, 215–256. Available online: https://www.overleaf.com/project/5f7c492065e4fb0001e9d3f8 (accessed on 19 November 2020).
- Ventura, P.; Marigo, P. Asymptotic giant branch stars at low metallicity: The challenging interplay between the mass-loss and molecular opacities. Mon. Not. R. Astron. Soc. 2010, 408, 2476–2486. [Google Scholar] [CrossRef] [Green Version]
- Ventura, P.; Marigo, P. Evolution and chemical yields of AGB stars: Effects of low-temperature opacities. Mon. Not. R. Astron. Soc. 2009, 399, L54–L58. [Google Scholar] [CrossRef] [Green Version]
- Bloecker, T.; Schöenberner, D. A 7M⊙ AGB model sequence not complying with the core mass-luminosity relation. Astron. Astrophys. 1991, 244, L43–L46. [Google Scholar]
- Dell’Agli, F.; Garcia-Hernandez, D.A.; Ventura, P.; Mészáros, S.Z.; Masseron, T.; Fernández-Trincado, J.G.; Tang, B.; Shetrone, M.; Zamora, O.; Lucatello, S. A view of the H-band light-element chemical patterns in globular clusters under the AGB self-enrichment scenario. Mon. Not. R. Astron. Soc. 2018, 475, 3098–3116. [Google Scholar] [CrossRef] [Green Version]
- Marini, E.; Dell’Agli, F.; Criscienzo, M.; García-Hernández, D.A.; Ventura, P.; Groenewegen, M.A.T.; Mattsson, L.; Kamath, D.; Puccetti, S.; Tailo, M. Characterization of M-stars in the LMC in the JWST era. Mon. Not. R. Astron. Soc. 2020, 340, 2996–3013. [Google Scholar] [CrossRef]
- Dell’Agli, F.; Ventura, P.; Schneider, R.; Criscienzo, M.; García-Hernández, D.A.; Rossi, C.; Brocatoet, E. Asymptotic giant branch stars in the Large Magellanic Cloud: Evolution of dust in circumstellar envelopes. Mon. Not. R. Astron. Soc. 2015, 447, 2992–3015. [Google Scholar] [CrossRef]
- Thompson, G.D.; Corman, A.B.; Speck, A.K.; Dijkstra, C. Challenging the Carbon Star Dust Condensation Sequence: Anarchist C Stars. Astrophys. J. 2006, 652, 1654–1673. [Google Scholar] [CrossRef] [Green Version]
- Sloan, G.C.; Lagadec, E.; Zijlstra, A.A.; Kraemer, K.E.; Weis, A.P.; Matsuura, M.; Volk, K.; Duley, K.K.; Cami, J. Carbon-rich Dust Past the Asymptotic Giant Branch: Aliphatics, Aromatics, and Fullerenes in the Magellanic Clouds. Astrophys. J. 2014, 791, 28–57. [Google Scholar] [CrossRef] [Green Version]
- Meixner, M.; Gordon, K.D.; Indebetouw, R.; Hora, L.J.; Whitney, B.; Blum, R.; Reach, W.; Bernard, J.P.; Meade, M.; Babler, B. Spitzer Survey of the Large Magellanic Cloud: Surveying the Agents of a Galaxy’s Evolution (SAGE). I. Overview and initial results. Astron. J. 2006, 132, 2268–2288. [Google Scholar] [CrossRef] [Green Version]
- Kraemer, K.E.; Sloan, G.C.; Wood, P.R.; Jones, O.C. Characterizing the Population of Bright Infrared Sources in the Small Magellanic Cloud. Astrophys. J. 2017, 834, 185–204. [Google Scholar] [CrossRef] [Green Version]
- Groenewegen, M.A.T.; Sloan, G.C. Luminosities and mass-loss rates of Local Group AGB stars and red supergiants. Astron. Astrophys. 2018, 609, A114. [Google Scholar] [CrossRef] [Green Version]
- Jones, O.C.; Meixner, M.; Justtanont, K.; Glasse, A. Probing the Dusty Stellar Populations of the Local Volume Galaxies with JWST/MIRI. Astrophys. J. 2017, 841, 15–28. [Google Scholar] [CrossRef] [Green Version]
- Marini, E.; Dell’Agli, F.; Criscienzo, M.D.; Puccetti, S. Discovery of Stars Surrounded by Iron Dust in the Large Magellanic Cloud. Astrophys. J. 2019, 871, L16–L20. [Google Scholar] [CrossRef]
- Marini, E.; Dell’Agli, F.; Criscienzo, M.D.; Groenewegen, M.A.T.; Puccetti, P.; Ventura, P.; Villaver, E. Do evolved stars in the LMC show dual dust chemistry? Mon. Not. R. Astron. Soc. 2019, 488, L85–L89. [Google Scholar] [CrossRef] [Green Version]
- Sloan, G.C.; Kraemer, K.E.; McDonald, I.; Groenewegen, M.A.T.; Wood, P.R.; Zijlstra, A.A.; Lagadec, E.; Boyer, M.L.; Kemper, F.; Matsuura, M. The Infrared Spectral Properties of Magellanic Carbon Stars. Astrophys. J. 2016, 826, 44–64. [Google Scholar] [CrossRef]
Figure 1.
Evolution of the dust production rate (left) and optical depth at m (right) during the AGB phase of stars of initial mass (cyan), (black), (red), (green), (blue), (magenta). In the abscissa we show the current mass of the star. The dashed parts of the tracks refer to the phases during which the star is carbon rich. The evolutionary sequences shown are the same used by [15].

Figure 2.
(a1,b1): Evolution of the spectral energy distribution of a model star, in 4 stages chosen during the AGB phase. Green and red lines refer to the initial oxygen-rich phase, whereas the blue and magenta tracks are chosen within the C-rich evolution. (a2,b2): Solid lines refer to 4 evolutionary phases, taken during the AGB evolution of a model. The dashed line shows the SED of the star in case that ; this value of the optical depth is not expected on the basis of the dust modelling used here, but is demanded by the observations.

Figure 3.
Distribution of M-type AGB stars in the LMC in the colour-magnitude ([F770W]−[F2550W], [F770W]) (left panel) and ([F1000W]−[F1500W], [F1000W]) (right) diagrams. Empty symbols indicate stars with the IRS spectrum limited to m, for which [F2550W] was taken as the MIPS m magnitude. Grey triangles indicate points whose SED could not be reproduced by sinthetic modelling; orange pentagons indicate dust-free M stars. Green squares refer to stars, which experience HBB during the AGB phase. Blue squares filled with crosses and some of the yellow diamonds are interpreted as stars that left the AGB and are currently evolving through the post-AGB phase. Solid and dashed tracks indicate the evolution of models stars of and , respectively. The numbers along the sequences in the left panel indicate the corresponding values of .

Figure 4.
Distribution of carbon stars (red triangles) in the LMC in the colour-magnitude ([F770W]−[F1800W], F1800W) (left panel) and ([F1000W]−F1800W, F1800W) (right) diagrams. The meaning of the symbols is the following: blue diamonds: stars characterised by large infrared excess, not reproduced by single star modelling; magenta crosses: bright carbon stars; green asterisks: carbon stars with . Solid lines indicate the evolutionary tracks of (squares) and stars (triangles) of metallicity , dotted tracks refer to the evolution of (squares) and (triangles) stars, of metallicity .

Figure 5.
Distribution of AGB stars classified as C-stars (red circles) and oxygen-rich stars (blue squares) on the colour-magnitude ([F770W]−[F2500W], [F770W]) diagram. Yellow triangles indicate the oxygen-rich stars identified by [23] as the progeny of ∼, metal-poor stars.
Figure 5.
Distribution of AGB stars classified as C-stars (red circles) and oxygen-rich stars (blue squares) on the colour-magnitude ([F770W]−[F2500W], [F770W]) diagram. Yellow triangles indicate the oxygen-rich stars identified by [23] as the progeny of ∼, metal-poor stars.

Publisher’s Note: MDPI stays neutral with regard to jurisdictional claims in published maps and institutional affiliations. |
© 2020 by the authors. Licensee MDPI, Basel, Switzerland. This article is an open access article distributed under the terms and conditions of the Creative Commons Attribution (CC BY) license (http://creativecommons.org/licenses/by/4.0/).
Share and Cite
MDPI and ACS Style
Ventura, P.; Marini, E.; Tosi, S.; Dell’Agli, F. Studying Asymptotic Giant Branch Stars in the JWST Era. Universe 2020, 6, 223. https://0-doi-org.brum.beds.ac.uk/10.3390/universe6120223
AMA Style
Ventura P, Marini E, Tosi S, Dell’Agli F. Studying Asymptotic Giant Branch Stars in the JWST Era. Universe. 2020; 6(12):223. https://0-doi-org.brum.beds.ac.uk/10.3390/universe6120223
Chicago/Turabian StyleVentura, Paolo, Ester Marini, Silvia Tosi, and Flavia Dell’Agli. 2020. "Studying Asymptotic Giant Branch Stars in the JWST Era" Universe 6, no. 12: 223. https://0-doi-org.brum.beds.ac.uk/10.3390/universe6120223
Note that from the first issue of 2016, this journal uses article numbers instead of page numbers. See further details here.