
Non-Unitary Neutrino Mixing in the NOνA Near Detector Data


Centre for Astro-Particle Physics (CAPP), Department of Physics, University of Johannesburg, P.O. Box 524, Auckland Park, Johannesburg 2006, South Africa
*
Author to whom correspondence should be addressed.
Universe 2022, 8(4), 238; https://0-doi-org.brum.beds.ac.uk/10.3390/universe8040238
Submission received: 15 March 2022
/
Revised: 5 April 2022
/
Accepted: 6 April 2022
/
Published: 13 April 2022
(This article belongs to the Special Issue Recent Advances in Neutrino Physics: From Theory to Experiments)
Abstract
:The oscillation probability over a short baseline (≲1 km) would be negligible for the case when the mixing matrix for three active neutrinos is unitary. However, in the case of a non-unitary mixing of three neutrinos, this probability would be non-negligible due to the so-called “zero distance” effect. Hence, the near detector of accelerator experiments such as NOA can provide strong constraints on the parameters of the non-unitary mixing with very large statistics. By analyzing the NOA near-detector data, we find that the non-unitary mixing does not improve fits to the or events over the standard unitary mixing. This leads to constraints on the non-unitary parameters: , , and at 90% C.L. A combined analysis with the near- and far-detector data does not change these constraints significantly.
1. Introduction
The latest results from the NOA [1,2] and T2K [3] show that there exists a tension between the two experiments. Their best-fit points in the plane, with a unitary mixing hypothesis, are far apart from each other and without any overlap between their respective confidence regions. Moreover, while separate analyses of the NOA and T2K data prefers a normal hierarchy (NH), the combined analysis prefers an inverted hierarchy (IH) over a NH [4]. Several papers have tried to resolve this tension with the help of beyond-the-standard-model (BSM) physics. Refs. [5,6] considered a neutral current non-standard interaction during propagation, while Ref. [7] considered a CP-violating Lorentz invariance violation during propagation. However, the new physics signatures are not stronger than significance in these analyses and no other neutrino oscillation experiments have observed these signatures yet. Ref. [8] instead considered non-unitary mixing as a solution to the tension between the NOA and T2K data. Non-unitary mixing implies the presence of extra neutrino generations, which is in accordance with the LSND [9] and MiniBooNe [10] results. However, a recent analysis [11] shows that the data from the short baseline reactor neutrino experiments strongly disfavors non-unitary mixing. Therefore, further analyses of additionally available data are needed to search for signatures of non-unitary mixing in long baseline neutrino oscillation experiments. Here, we analyze the NOA near-detector (ND) data with the non-unitary neutrino mixing hypothesis for the first time.
The accelerator neutrino energy is in the 1–10 GeV range. Since the neutrino oscillation probability depends on , where is the mass-squared difference between the neutrinos of masses and , L is the length of the baseline, and E is the neutrino energy, the oscillation probability for the standard unitary mixing, driven by at this energy range, is negligible at km. This is not true, however, in the case of non-unitary mixing. The non-unitary mixing matrix is defined as [12]:
where is the unitary PMNS mixing matrix. In the matrix, the diagonal term(s) must deviate from unity and/or the off-diagonal term(s) must deviate from zero to allow for the non-unitary effect. Non-unitary mixing leads to a zero-distance oscillation effect due to interactions of the active neutrinos with extra-heavy fermions at production. The oscillation probability at , in this case, is given by [12]:
Therefore, in the case of non-unitary mixing, it is possible to observe neutrino oscillations even over a very short distance, which is called the “zero distance” effect. This effect can be tested with data from the short baseline neutrino oscillation experiments, as well as the near detector of long baseline experiments such as NOA and T2K. Although the analysis in Ref. [11] shows that short baseline neutrino experiments such as NOMAD [13] and NuTeV [14] strongly disfavor non-unitary mixing, the reactor neutrino fluxes have large uncertainties [15]. Accelerator neutrino fluxes are better known. In this paper, we have looked for the signal of non-unitary mixing in the NOA ND data. We also perform a combined analysis of the NOA ND and far-detector (FD) data to test the two mixing schemes, which is unique for the same experiment. A similar analysis with the T2K near and far detectors would be equally interesting; however, T2K ND data is not publicly available [16].
The NOA ND is a 290 ton totally active scintillator detector, placed 100 m underground (to minimize background fluxes) and 1.9 mrad off-axis, approximately 1 km away from the source at the Fermilab [17]. In the case of unitary mixing, the ND will not observe any oscillations at such a short distance, and the observed electron events will come from the contamination in the beam. However, as explained in Equation (2), there will be an excess of electron events due to the conversion in the case of non-unitary mixing. Effects of non-unitary mixing at the ND will be sensitive to the parameters and , and also on , because of the condition [18,19]. There is essentially no dependence on the phase associated with in the ND data. For our analyses, we have used () protons-on-target (POTs) data in the neutrino (antineutrino) mode for the ND, and () POTs data for the FD [1,2].
In this paper, we have discussed the analysis in Section 2, and presented the results in Section 3. Our conclusion has been drawn in Section 4. We show the oscillation probabilities and fits to the event distributions in the Appendix A.
2. Analysis of NOA Data
We calculate the theoretical muon and electron event rates and the between the theoretical and experimental data by using the software GLoBES [20,21]. We have modified the probability code of GLoBES so that it can handle non-unitary mixing for simulating theoretical events. A detailed algorithm used for the probability calculation with non-unitary mixing has been given in Ref. [8]. We have also fixed the efficiencies of the electron and muon events for each energy bin according to the expected event rates at the ND and FD, which are provided by the NOA collaboration [2]. For the analyses, we have kept and , where , at their best-fit values of and , respectively [22]. We have varied and in their respective ranges, as given in Ref. [22]. We have also varied in its range, around the MINOS best-fit value with uncertainty [23], where is related to by the following relation [24]:
We have varied the CP-violating phase in its complete range [:]. For the non-unitary parameters, we have varied and in the range [0.7:1] and in the range [0:0.2]. We have varied the phase , where , in its complete range [:]. We have also implemented the condition throughout the analysis. We have kept the other non-unitary parameters fixed at their unitary values, as their effects are negligible.
We have implemented automatic bin-based energy smearing for generated theoretical events, as described in the GLoBES manual [20,21]. For this purpose, we have used a Gaussian smearing function for the true neutrino energy E:
where is the reconstructed energy. The energy resolution function is given by:
For the NOA FD, we have used , and for () charged-current (CC) events. For () CC events, values for the FD are , . For the ND, we have used , , for both the muon and electron events as well as for both neutrinos and anti-neutrinos. For the FD, we have used normalization and energy calibration systematic uncertainties for both the e-like and -like events [17]. We calculated the systematic uncertainties at the ND using the following method: we assumed the normalization and energy calibration systematic uncertainties at ND to be and , respectively, for both the e-like and the -like events. We then analyzed both the ND and FD data together with the standard three-flavor oscillation hypothesis, while both and were varied in the range [0:0.3]. For this purpose, we kept the standard oscillation parameters , , , and fixed at their best-fit values for the NH taken from the analysis of the NOA collaboration [1,2]. and were fixed at their best-fit values, as taken from Ref. [25]. We calculated the between theory and experiment and found that the minimum occurs at . Thus, we fixed the normalization and energy calibration uncertainties at and , respectively.
We calculated for both the NH and IH of the neutrino masses. The minimum obtained by varying parameters is subtracted from the other values to calculate . During the calculation, Gaussian priors have been added to the . Further details of the analysis are given in Ref. [8]. Before proceeding to analyze the data with the non-unitary mixing, we have analyzed data with the standard mixing hypothesis and found that the NOA ND data does not have any sensitivity to the unitary oscillation parameters. This complies with the physics of standard oscillations. In Refs. [7,8], we presented results from analyzing the FD data with the standard unitary mixing. We matched these results to the standard analyses published by the NOA collaboration to validate our analyses. We present results of our analyses with non-unitary mixing in the next section.
3. Results and Discussion
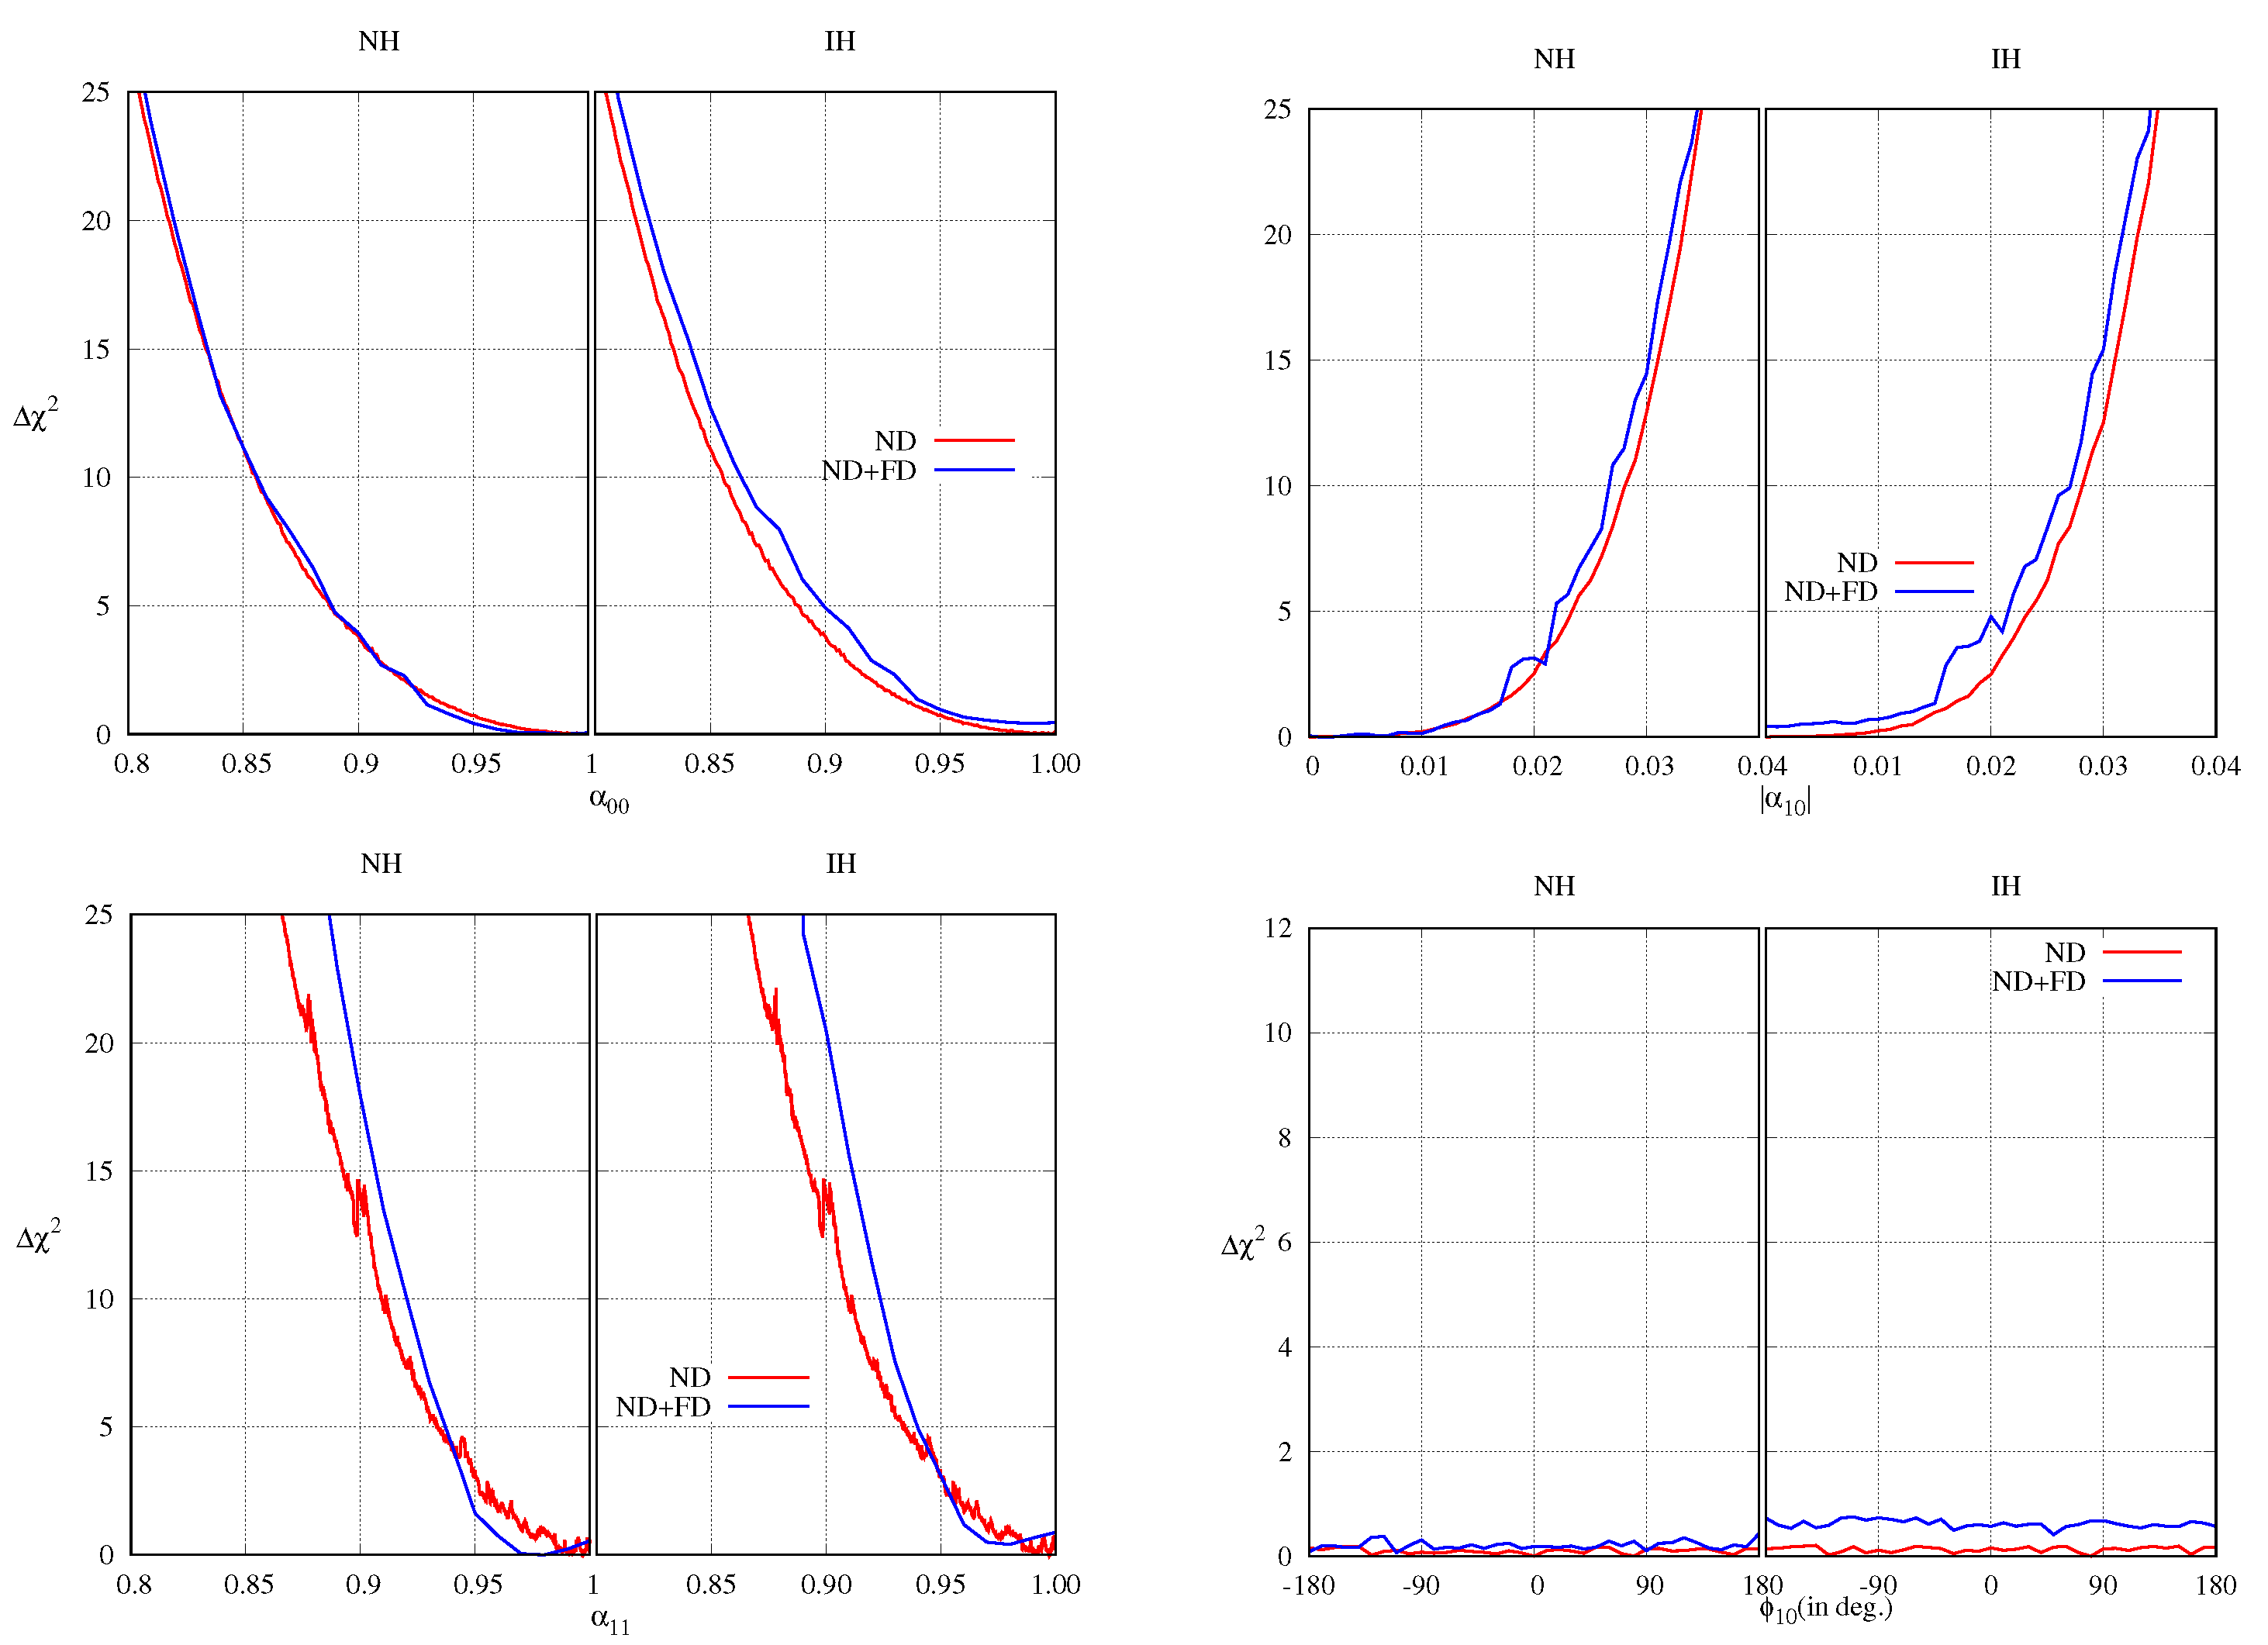
After fitting the NOA ND data with both the standard unitary and non-unitary mixing schemes, we found that the best-fit point occurs at , , and . In Figure 1, we show the values for the non-unitary parameters. The standard unitary oscillation gives as good a fit as the non-unitary mixing to the data with and with four degrees of freedom (d.o.f.) fewer. Therefore, it can be stated that the NOA ND data does not have any signature of non-unitary mixing. As mentioned earlier, the ND data from NOA does not have any sensitivity to the phase , nor does it have any sensitivity to hierarchy. The C.L. () limits on the non-unitary parameters from the ND data of NOA are:
Fitting the combined data from the ND and FD, the best-fit points were found to be , , and . In this case also, the standard oscillation gives as good a fit to the data as non-unitary mixing with . Thus, just like the ND data alone, the combined fit of the data from both ND and FD of NOA does not show any signature of non-unitary mixing (see Figure 1). The C.L. () limits on the non-unitary parameters from the ND and FD data of NOA are:
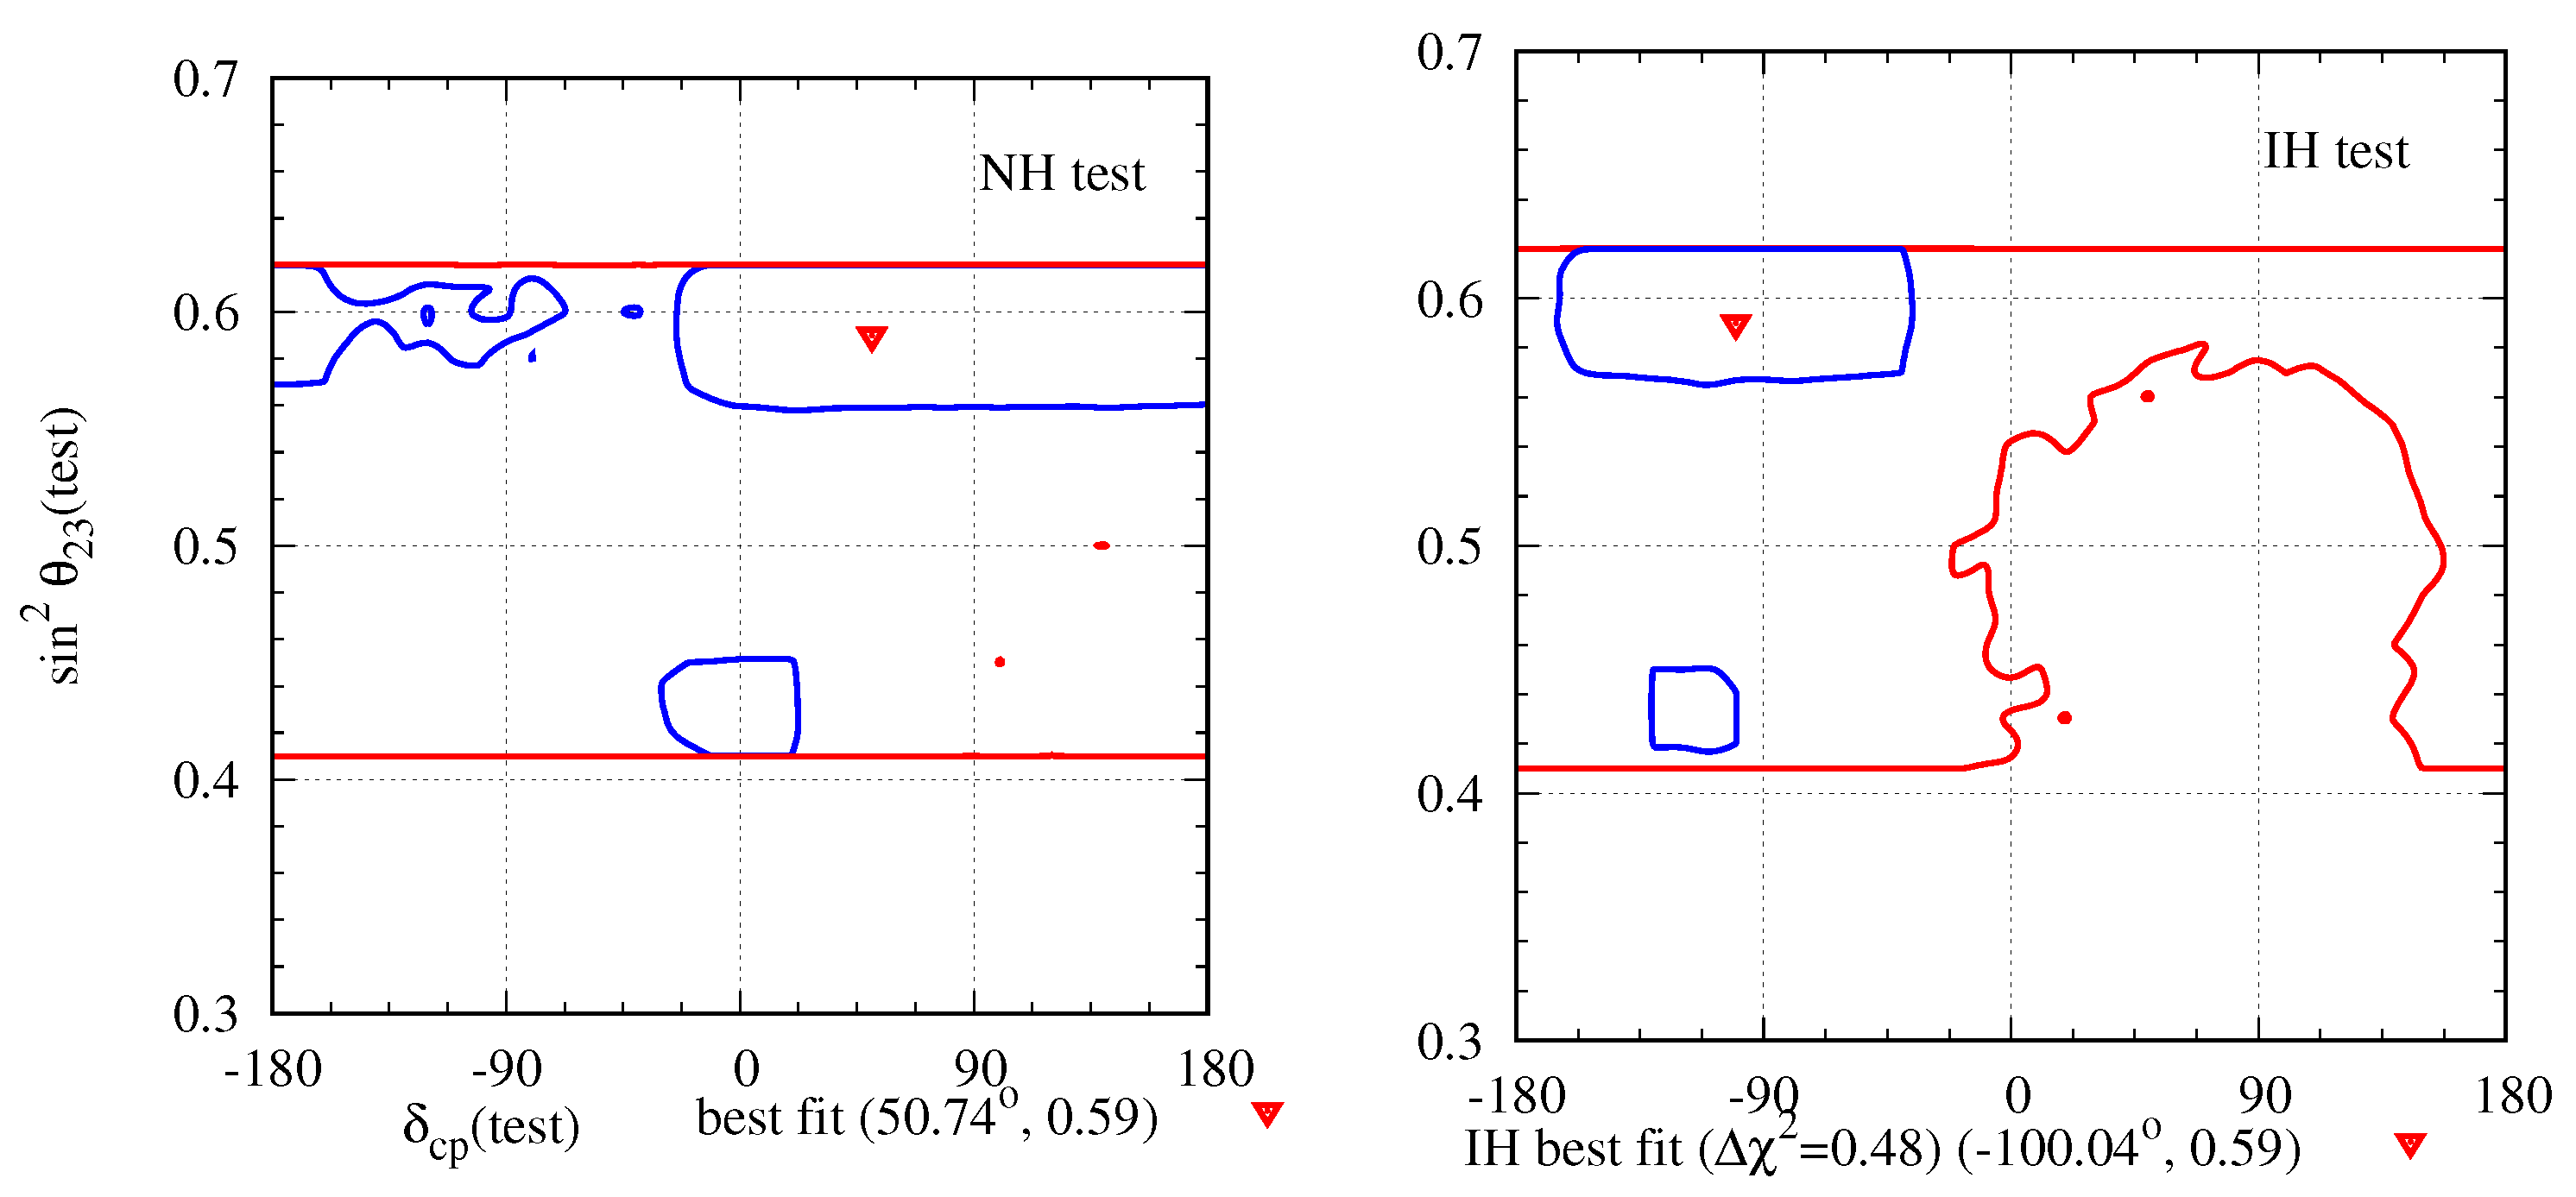
Although, as mentioned earlier, the ND data is not sensitive to the standard oscillation parameters, the combined ND and FD data are sensitive to those parameters. In Figure 2, we show the and allowed regions in the plane after the combined analysis. It is important to note that the best-fit points and the allowed regions are very close to each other for the non-unitary and standard unitary mixing. This is precisely because the sensitivity to the standard oscillation parameters is dominated by the FD data, and the deviation from the unitarity is very small. In Ref. [8], we did not include the NOA ND data; thus, the deviation from non-unitarity at the FD data was large. Hence, the shift in the values of the standard unitary parameters with non-unitary mixing was large. It should also be noted, in Figure 2, that the IH cannot be ruled out, even at C.L., and the hierarchy- degeneracy is present in the data when analyzed with non-unitary mixing.
4. Conclusions
The NOA ND data does not show any signature of non-unitary mixing. At the best-fit point, the deviation from the unitary mixing is negligible. Although the deviation from unitary mixing at the best-fit point is larger after combining the ND and FD data, the unitary mixing continues to give as good a fit to the data as the non-unitary mixing. The limits obtained on the non-unitary parameters , , and are consistent with the limits obtained in Ref. [11] from analyzing short baseline neutrino data. The addition of the FD data gives a sensitivity to the standard oscillation parameters. However, since the ND data allows only a small deviation from the unitary mixing, the results in the plane are almost similar to those obtained with the unitary mixing using only the FD data.
The results obtained from the ND data of NOA are in tension with the analysis of FD data alone, as presented in Ref. [8]. The FD data of NOA prefers non-unitary mixing over unitary mixing at C.L., and also the deviation from unitarity at the best-fit point is quite large. Thus, it is important to fit the ND data of T2K, as well as future experiments such as DUNE [26] and T2HK [27], to the non-unitary mixing scheme to investigate if a similar trend persists in them as well.
Author Contributions
Conceptualization, S.R.; methodology, U.R. and S.R.; software, U.R.; validation, U.R. and S.R.; formal analysis, U.R.; investigation, U.R.; resources, S.R.; data curation, U.R.; writing—original draft preparation, U.R.; writing—review and editing, S.R.; visualization, S.R.; supervision, S.R.; project administration, S.R.; funding acquisition, S.R. All authors have read and agreed to the published version of the manuscript.
Funding
U.R. and S.R. were funded by the University of Johannesburg Research Council grant number RB40/3624.
Institutional Review Board Statement
Not applicable for studies not involving humans or animals.
Informed Consent Statement
Not applicable.
Data Availability Statement
Acknowledgments
We thank Alexander Himmel for the valuable discussions and helps as provided through private communications regarding the NOA near detector. This work was supported by a grant from the University of Johannesburg Research Council.
Conflicts of Interest
The authors declare no conflict of interest. The funders had no role in the design of the study; in the collection, analyses, or interpretation of data; in the writing of the manuscript, or in the decision to publish the results.
Appendix A. Oscillation Probabilities and Fits to Event Distributions
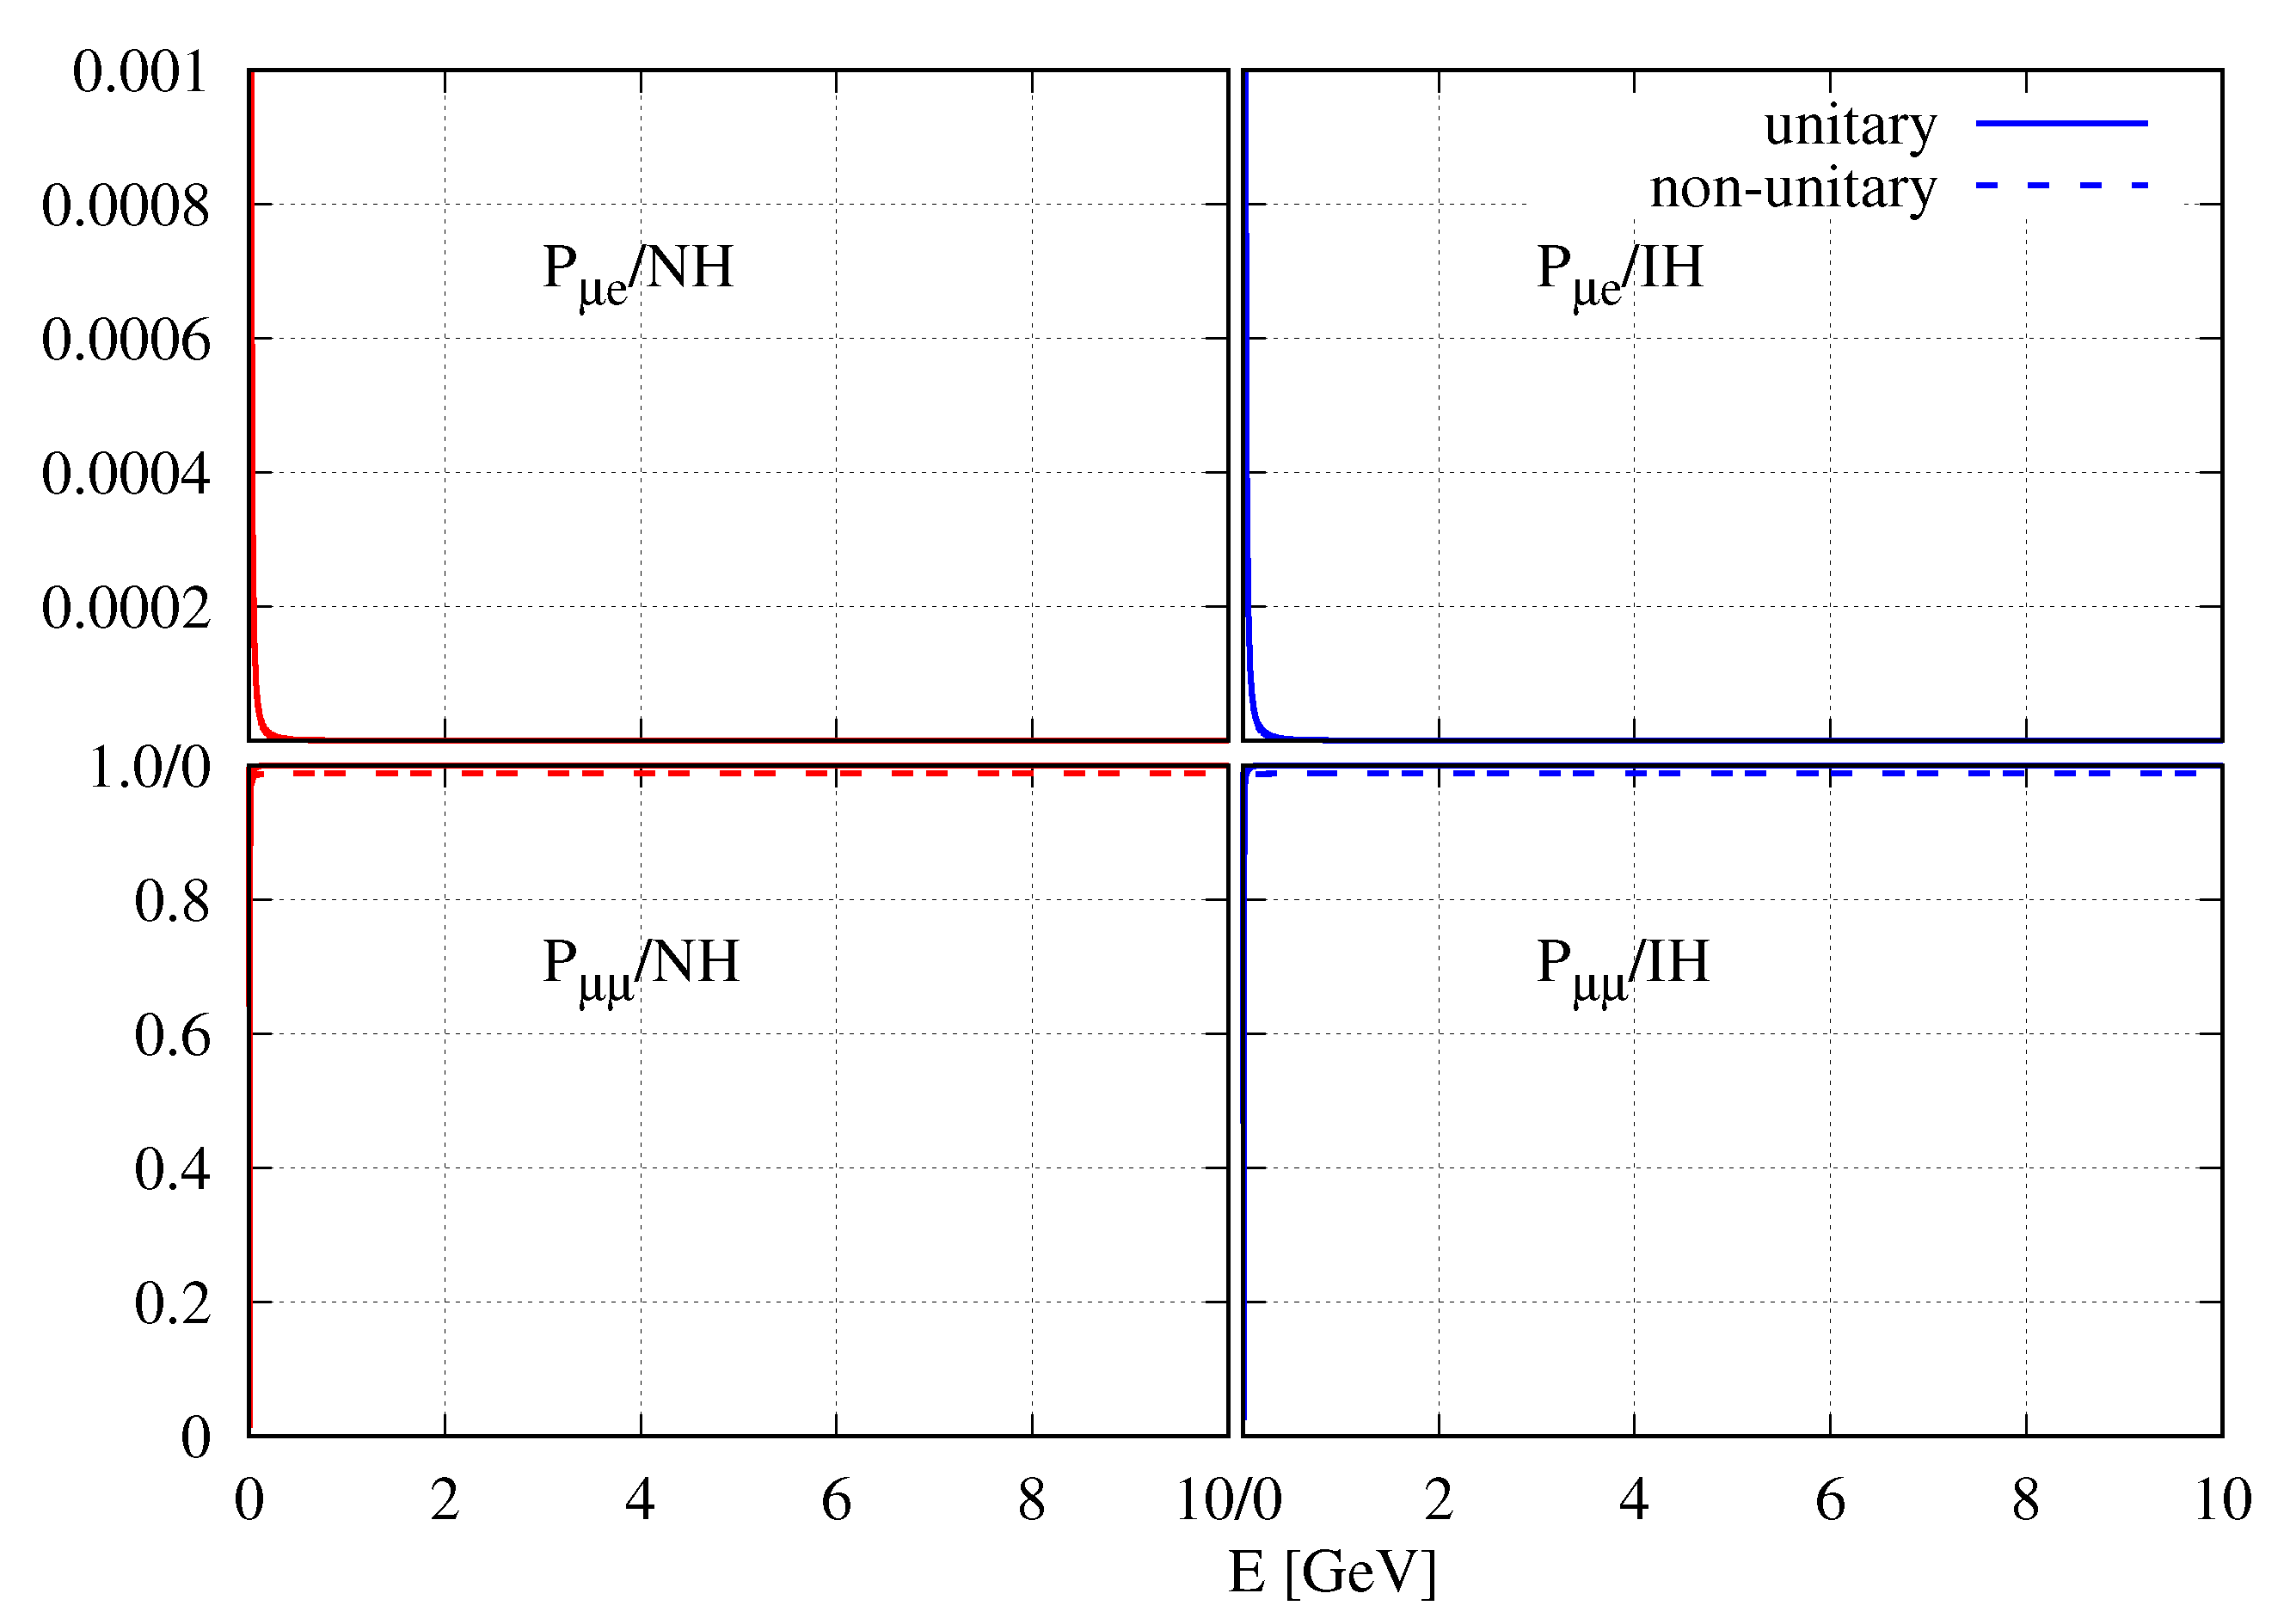
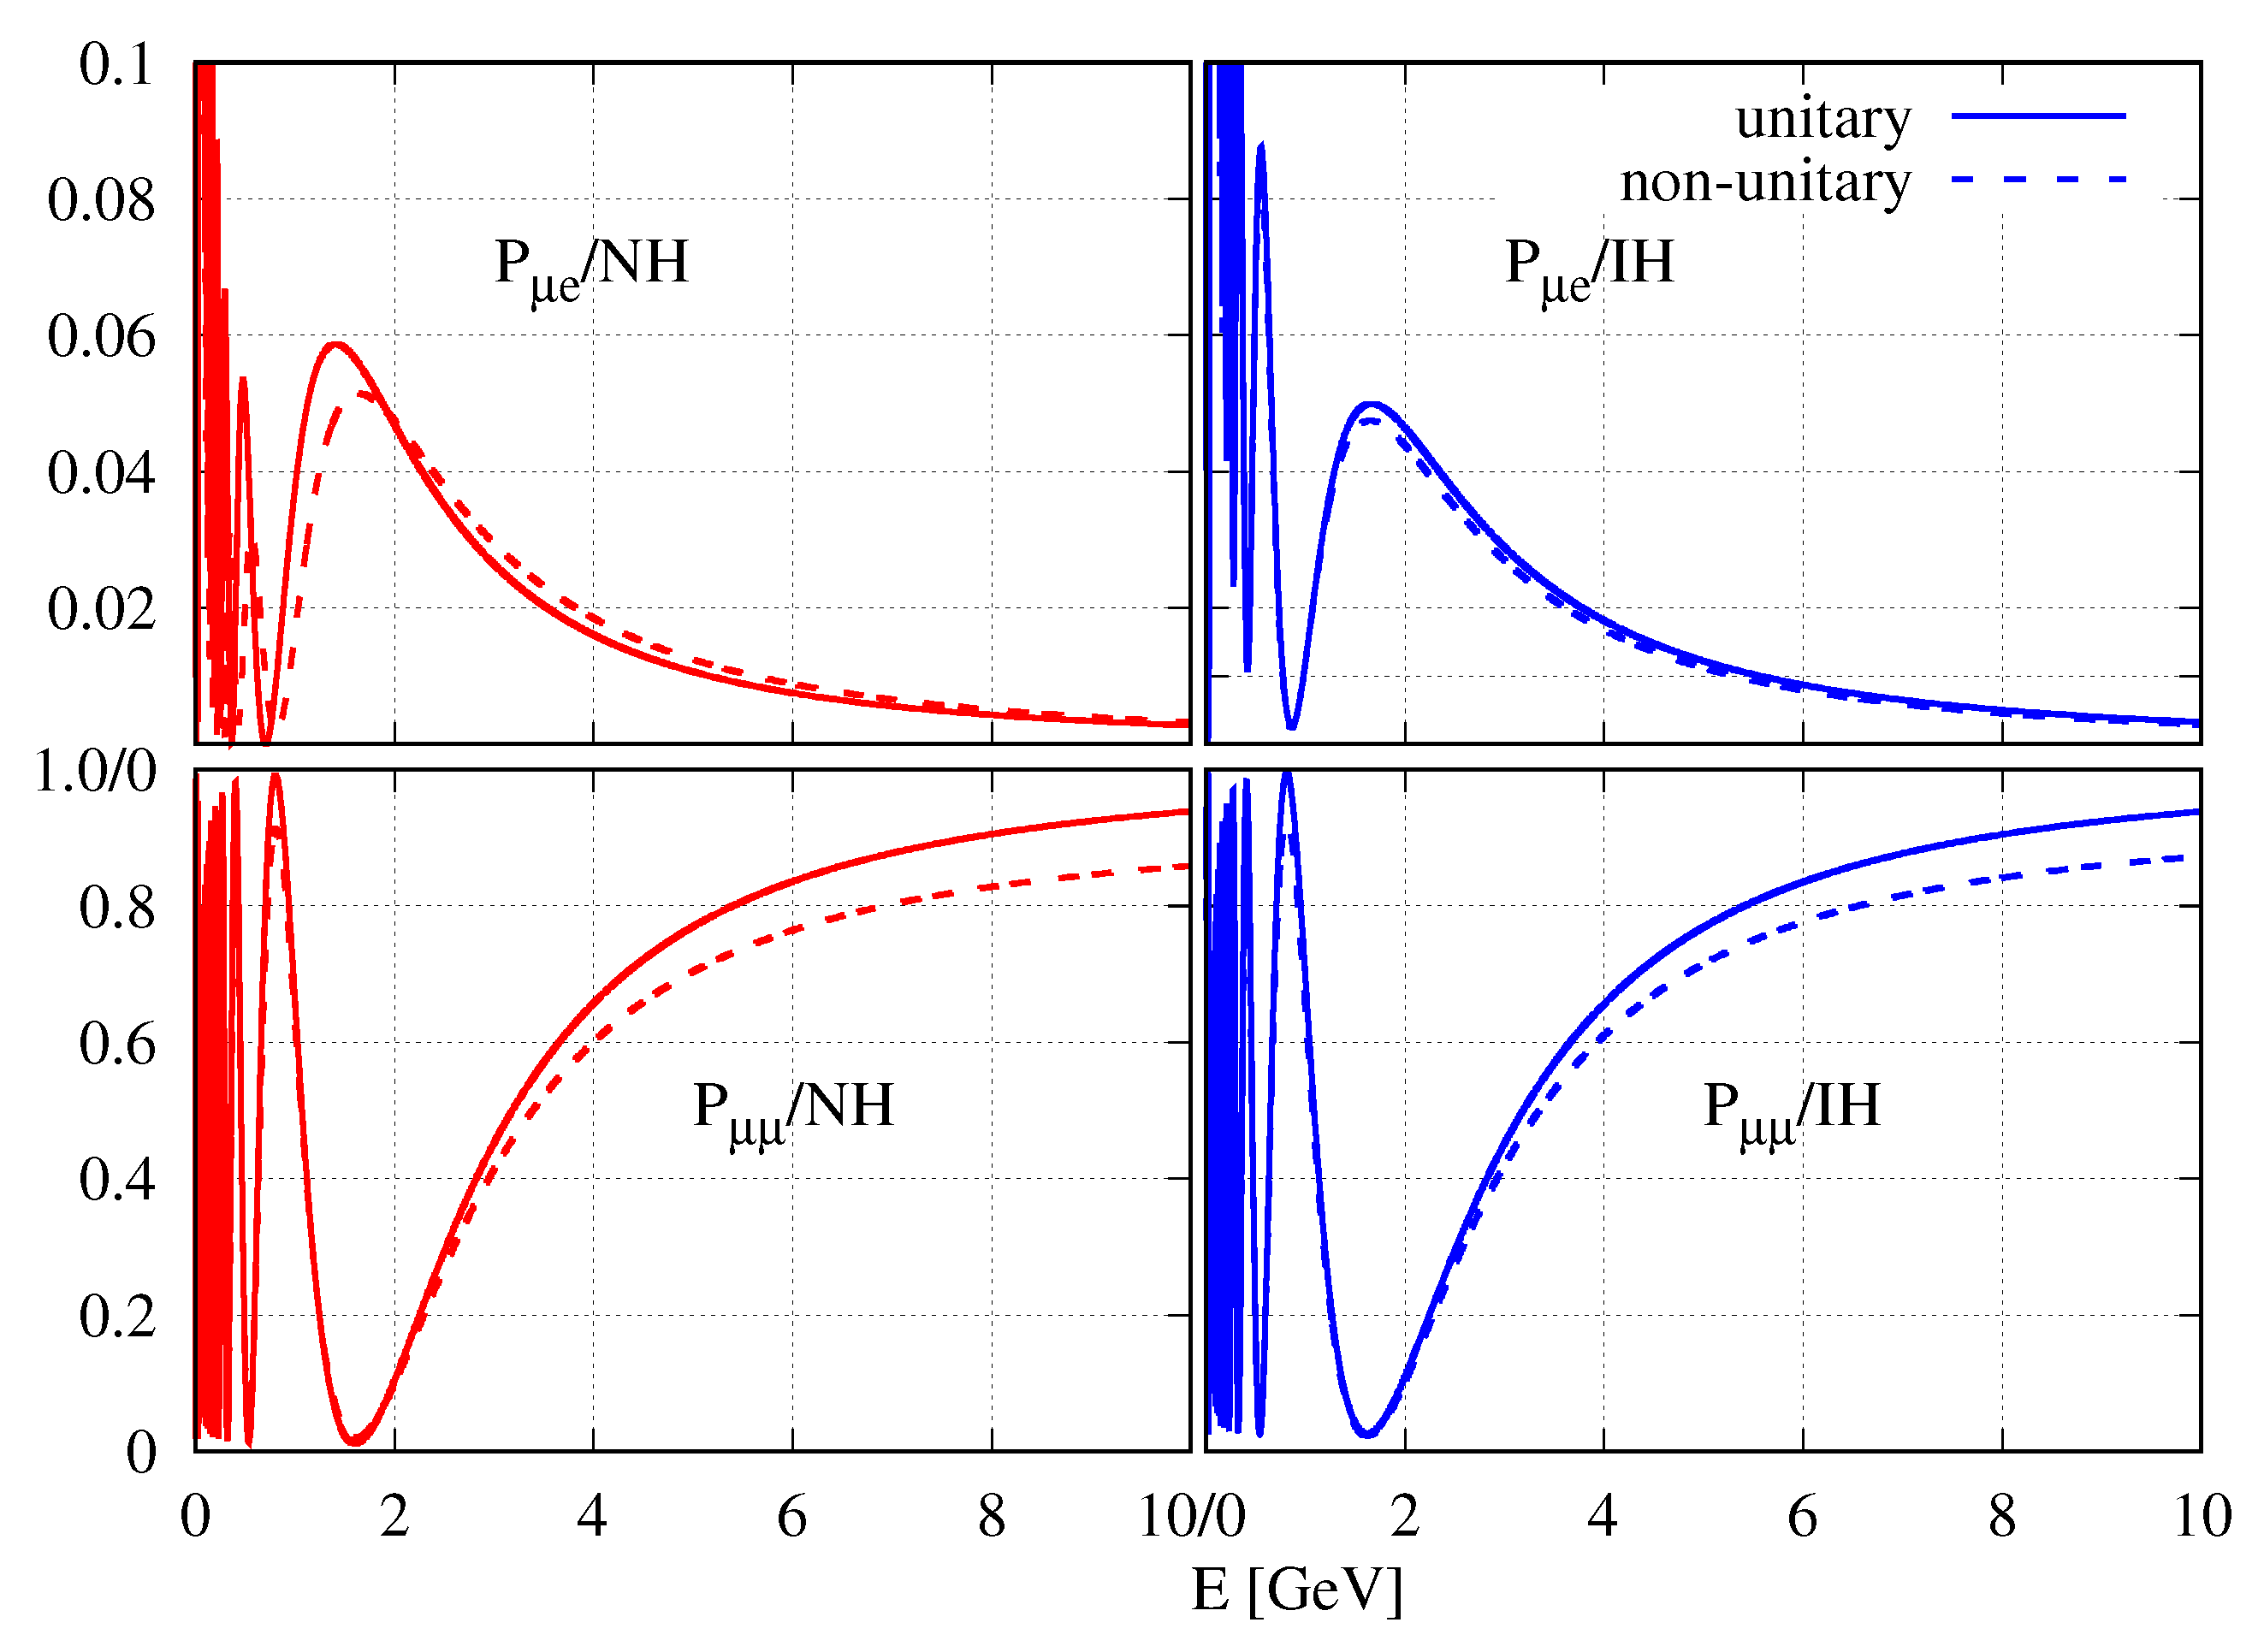
In Figure A1, we have presented the transition probability and survival probability as functions of energy at the ND for both the unitary and non-unitary mixing schemes. To do so, we changed the probability code in GLoBES such that it can calculate the exact appearance and survival probabilities with non-unitary mixing and without any approximation at a particular baseline, however small. This is discussed in detail in Ref. [8]. We fixed the standard unitary oscillation parameter values at their current NOA best-fit values. The non-unitary parameter values have been fixed at the best-fit values we obtained after analyzing the ND data from NOA. It is obvious from Figure A1 that, for unitary mixing at the ND, the appearance probability is 0, and the survival probability is 1 for all energies. At the present best-fit point found after fitting the ND data, the oscillation and survival probabilities do not change. The characteristics do not change for the probability shown in Figure A2.
Figure A1.
transition ( survival) probability as a function of energy at the ND in the upper (lower) panel. The left (right) panel is for NH (IH). The solid (dashed) line represents (non-) unitary mixing.
Figure A1.
transition ( survival) probability as a function of energy at the ND in the upper (lower) panel. The left (right) panel is for NH (IH). The solid (dashed) line represents (non-) unitary mixing.

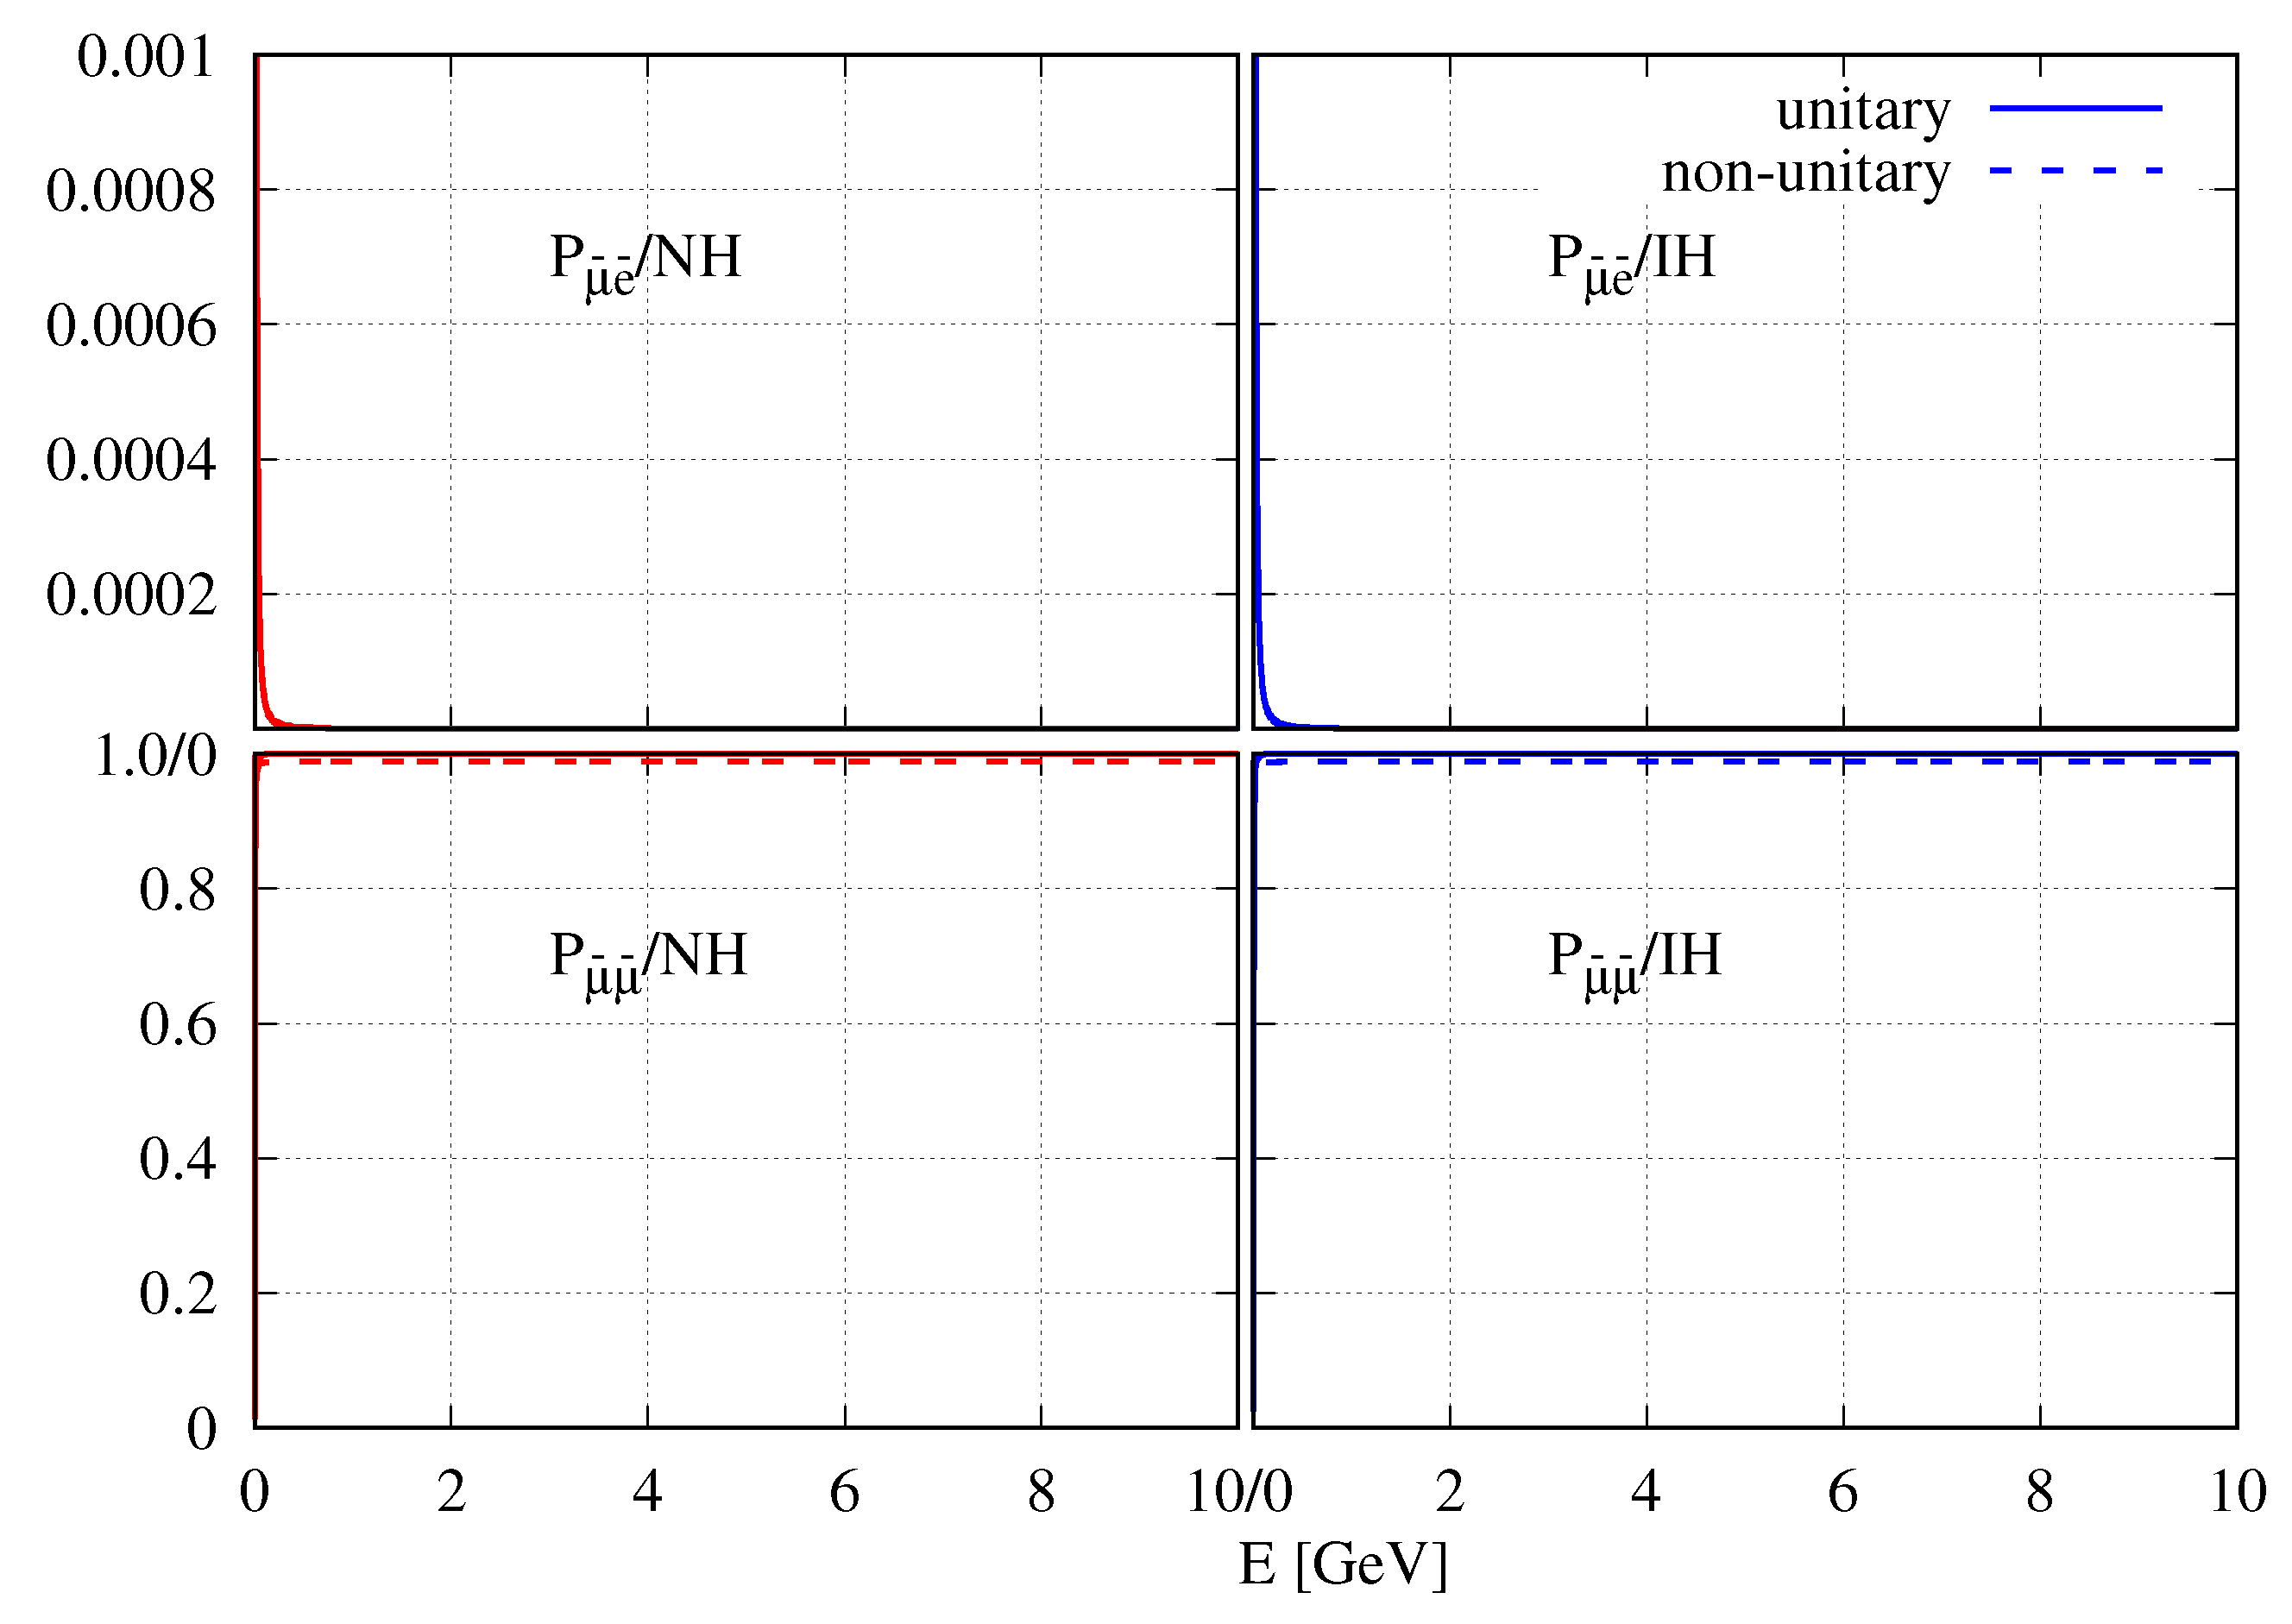
Figure A2.
The same as Figure A1, but for antineutrinos.
Figure A2.
The same as Figure A1, but for antineutrinos.

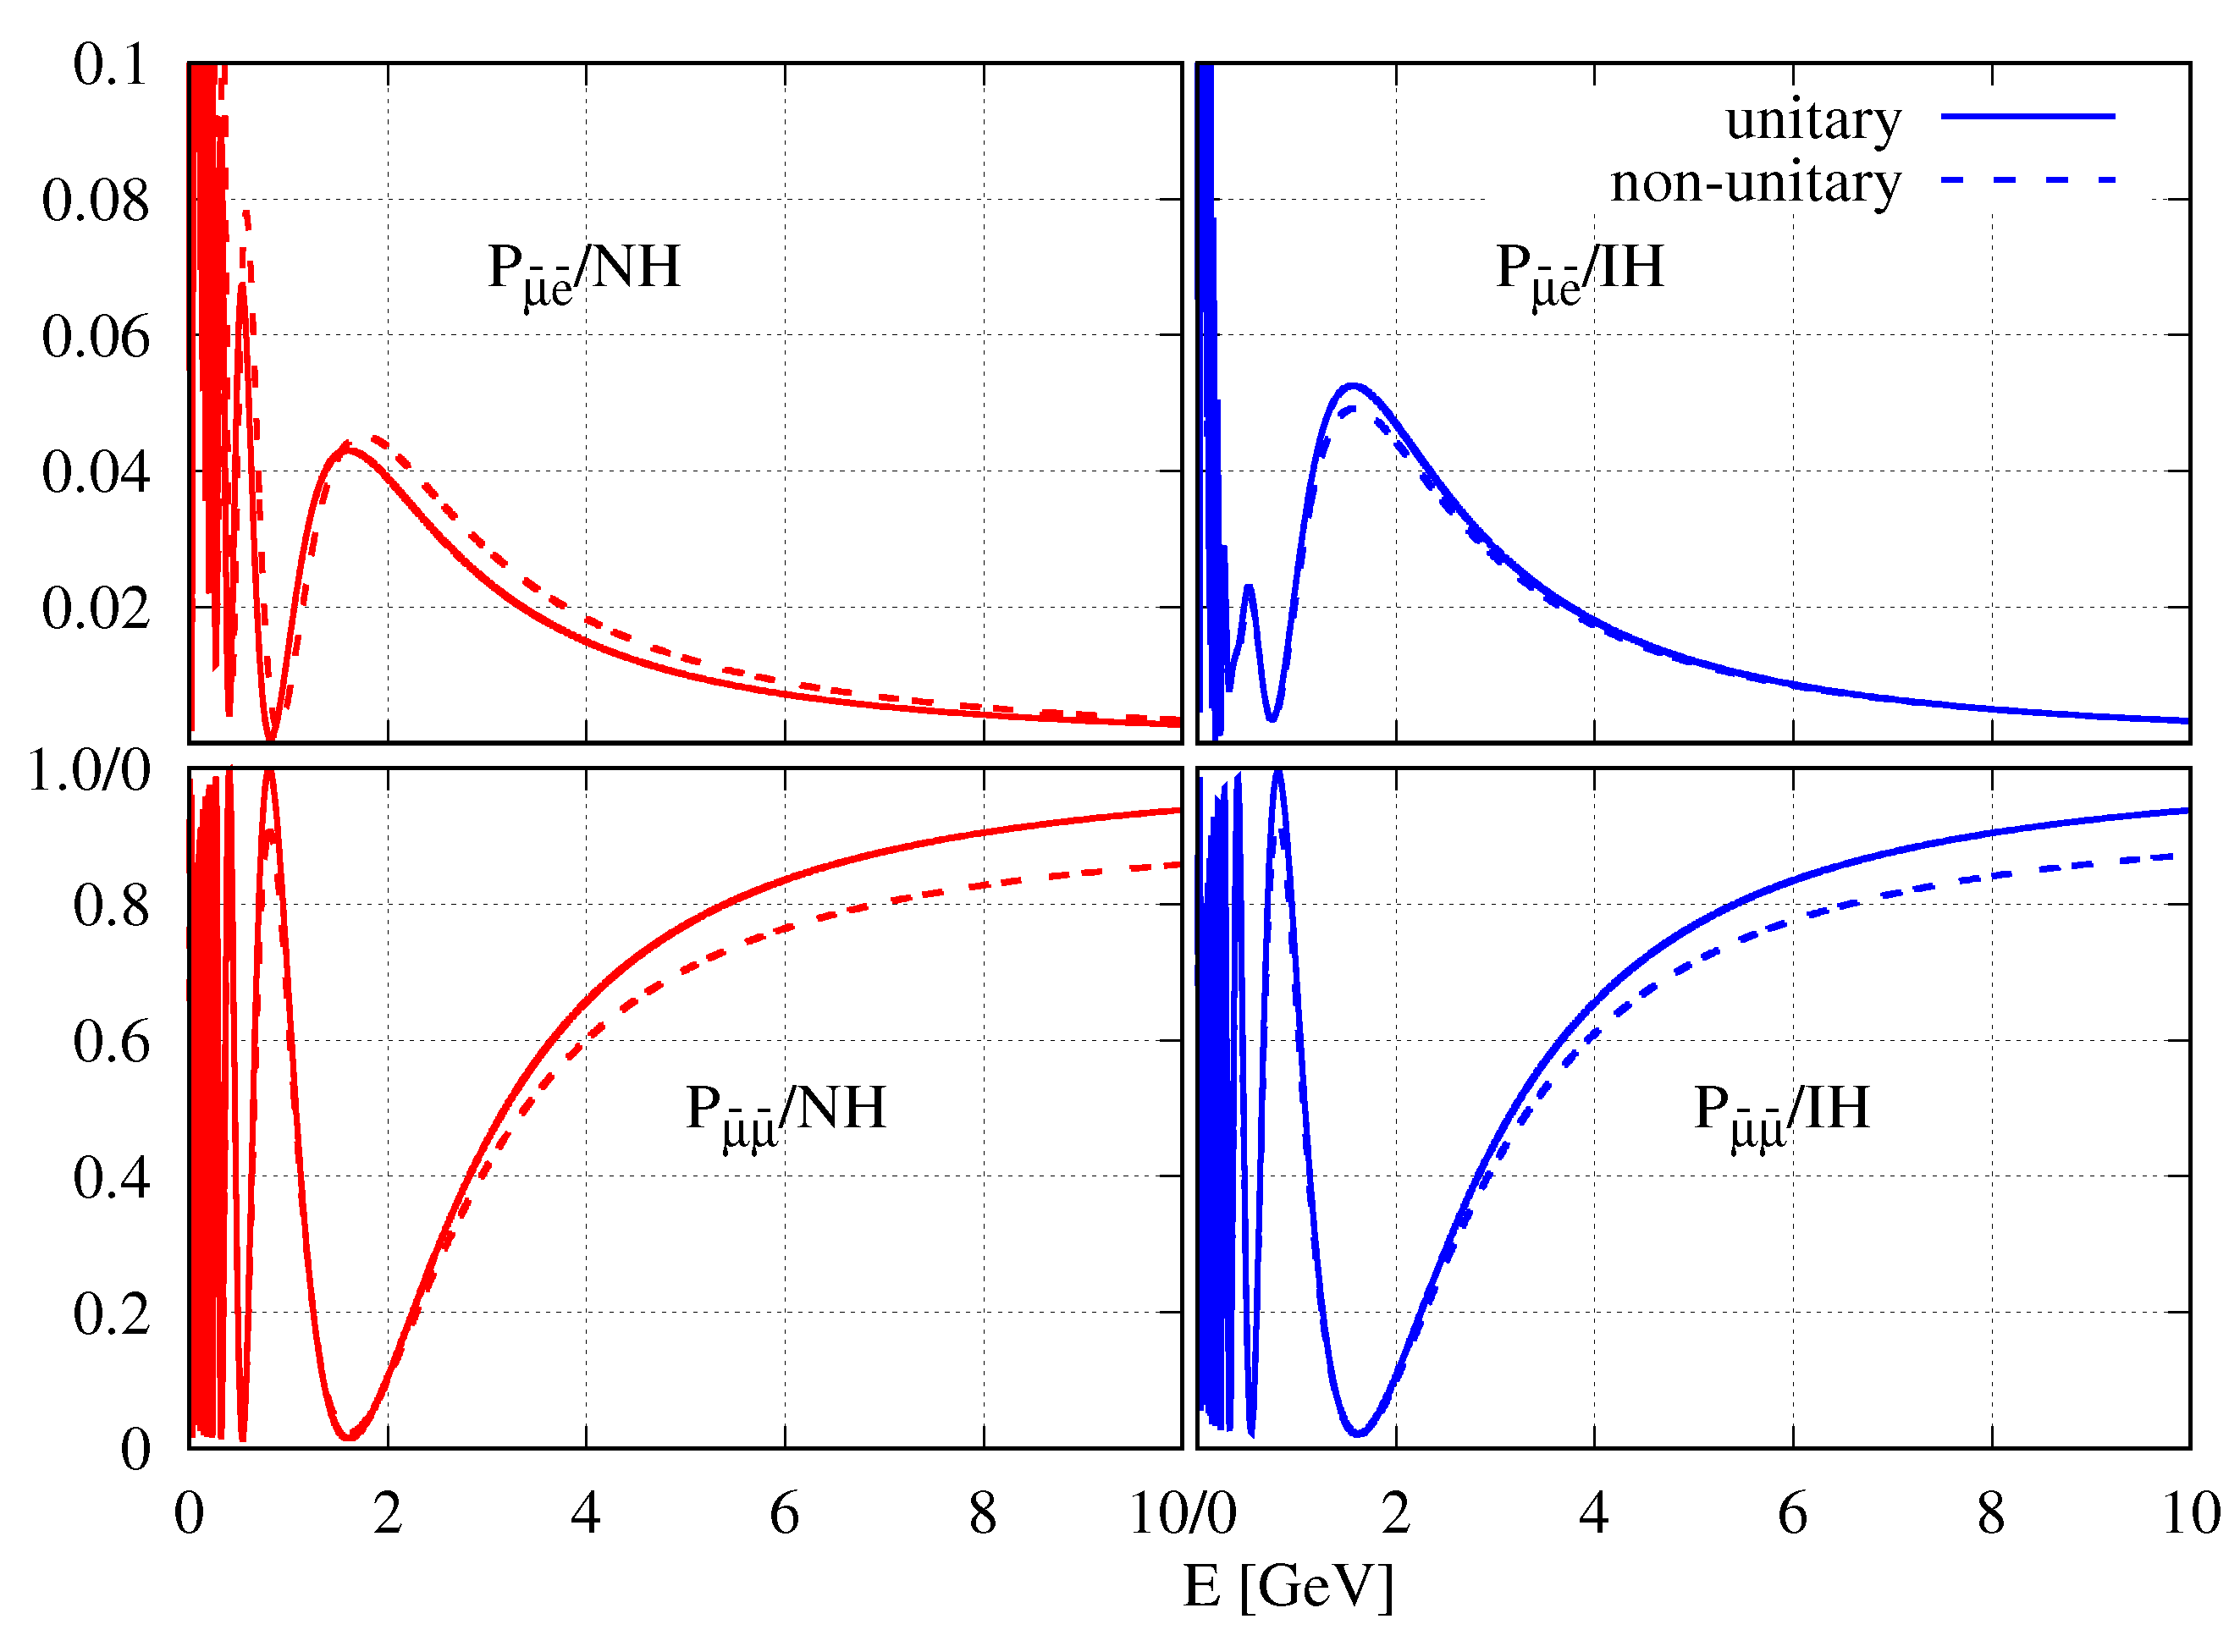
In Figure A3 and Figure A4, we have shown the same probabilities at the FD. For unitary mixing, we have fixed the standard oscillation probabilities at the present best-fit values given by the NOA collaboration. For non-unitary mixing, we have fixed both the standard and non-standard oscillation parameters at the best-fit values we have obtained after analyzing the ND and FD data with the non-unitary mixing hypothesis. It is obvious that the distinction between the two hypotheses at the FD is small at the present best-fit values.
Figure A3.
transition ( survival) probability as a function of energy at the FD in the upper (lower) panel. The left (right) panel is for NH (IH). The solid (dashed) line represents (non-) unitary mixing.
Figure A3.
transition ( survival) probability as a function of energy at the FD in the upper (lower) panel. The left (right) panel is for NH (IH). The solid (dashed) line represents (non-) unitary mixing.

Figure A4.
The same as Figure A3, but for antineutrinos.
Figure A4.
The same as Figure A3, but for antineutrinos.

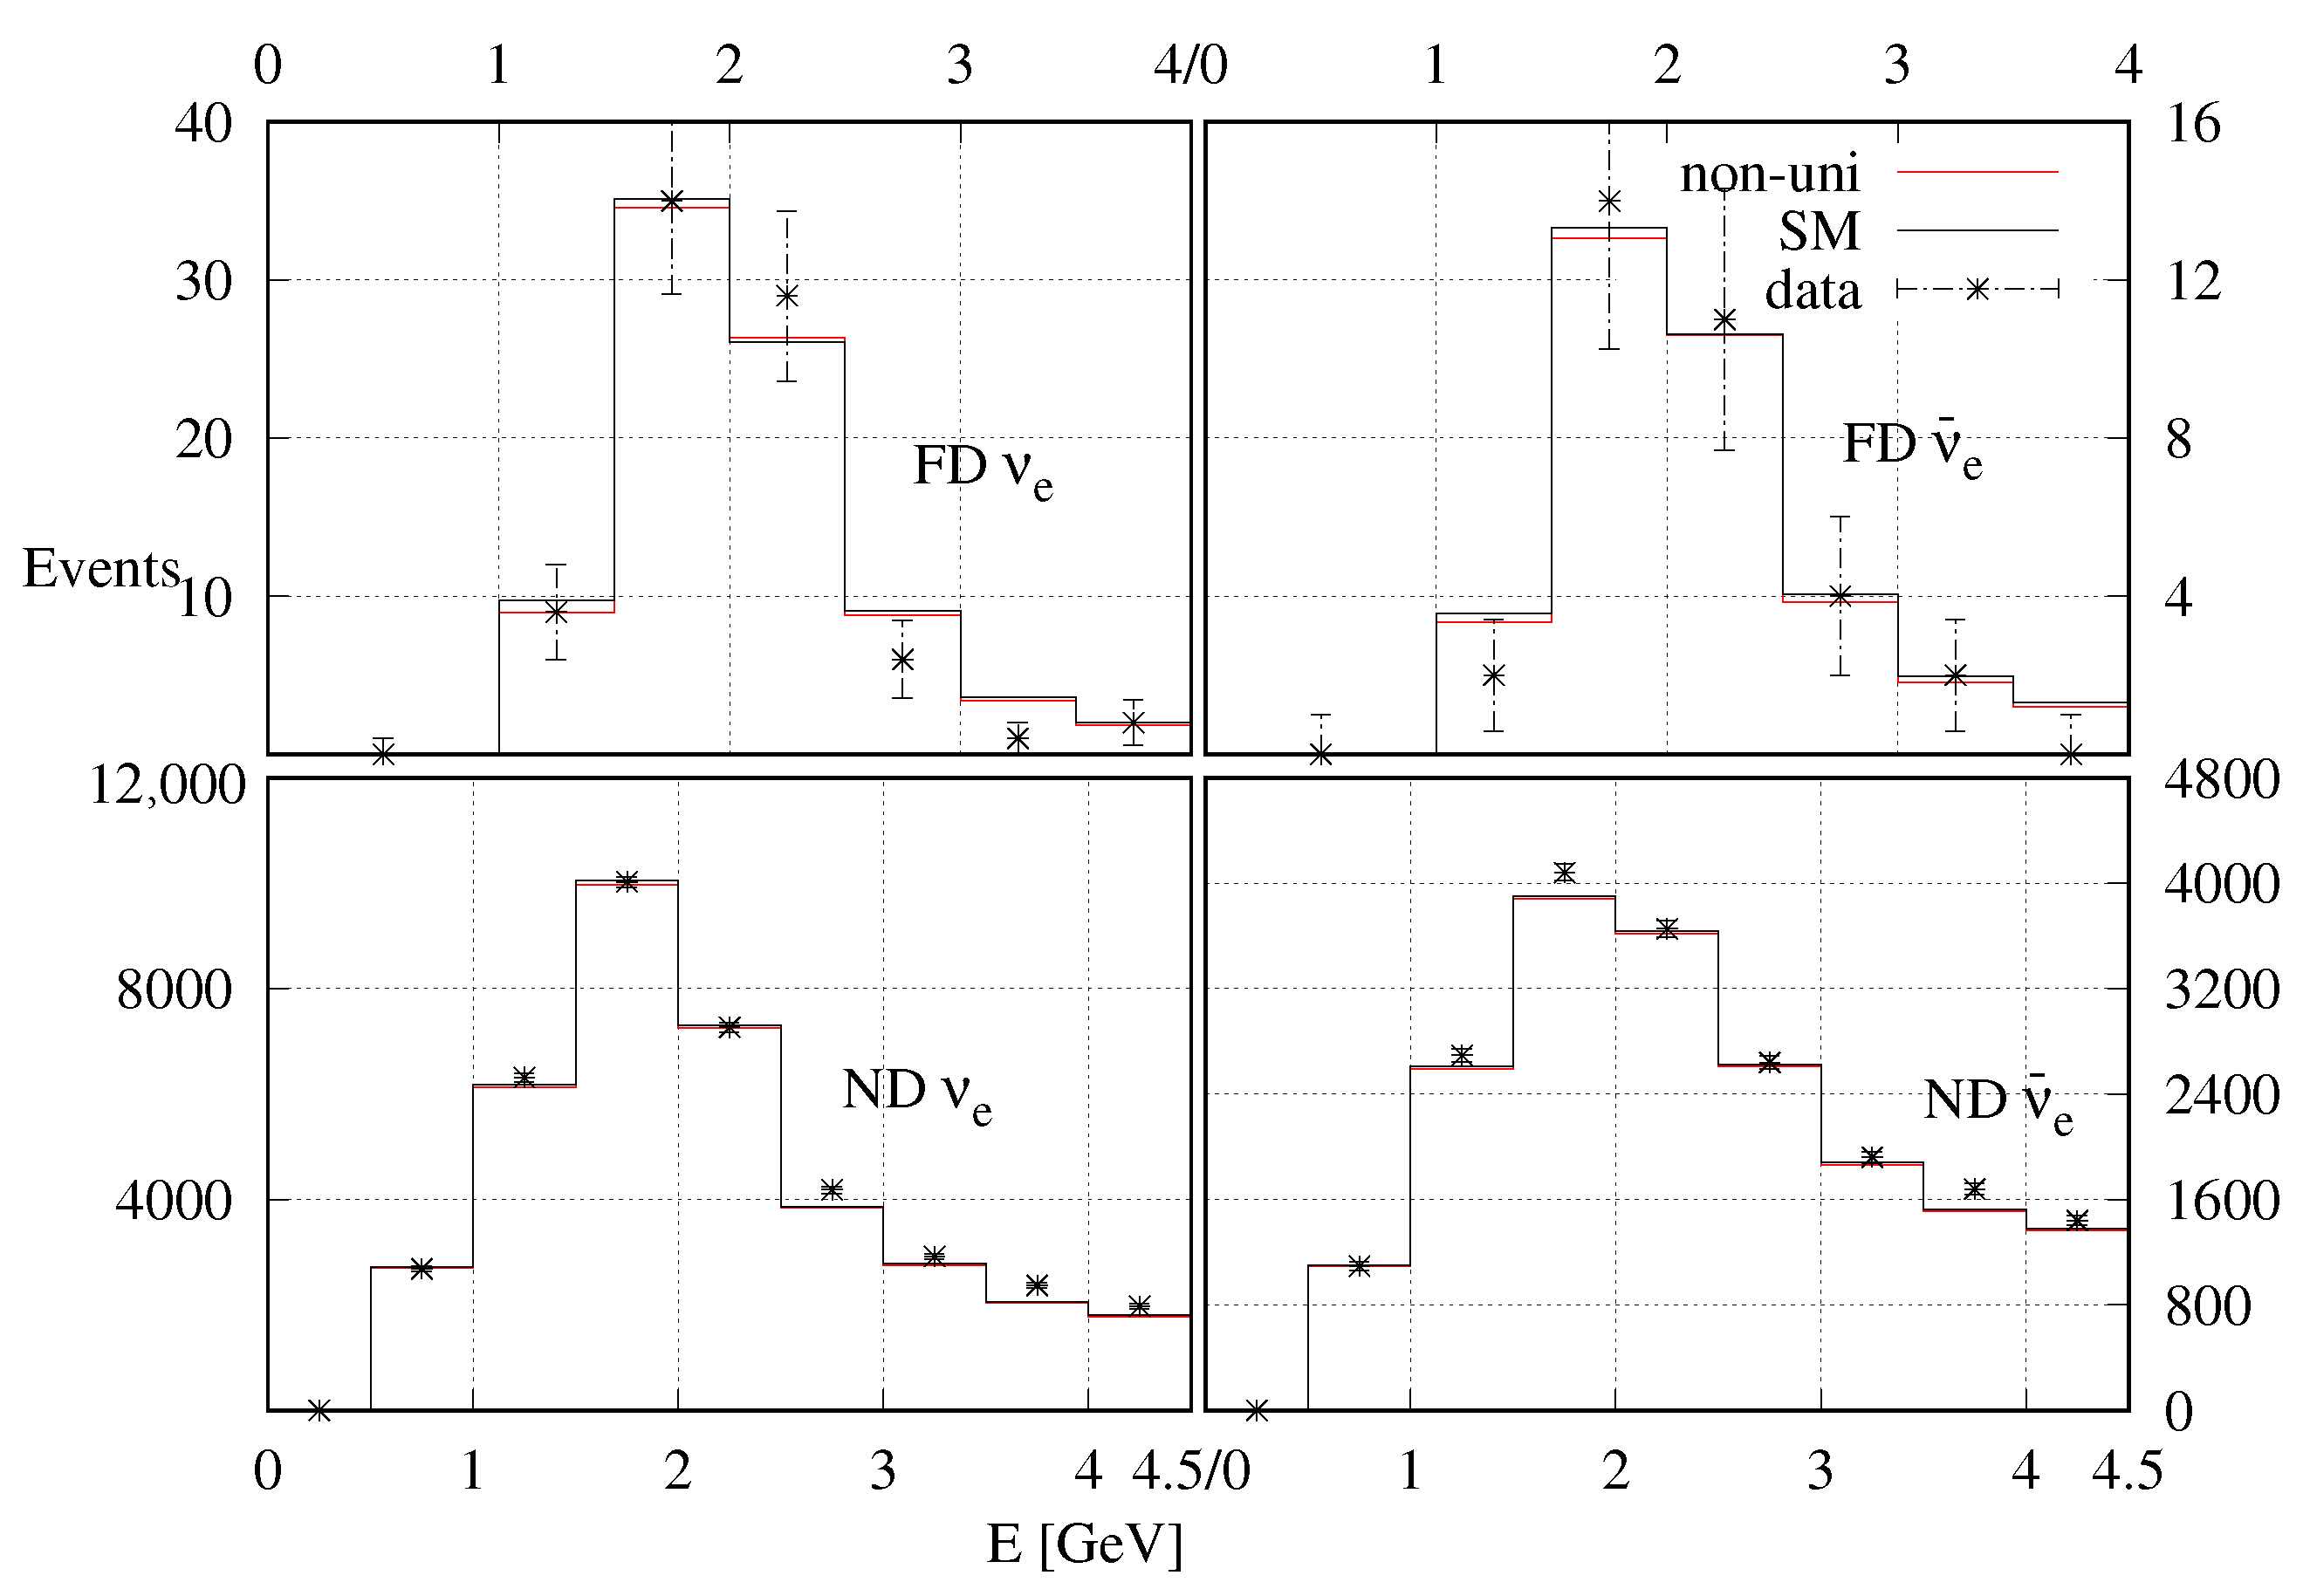
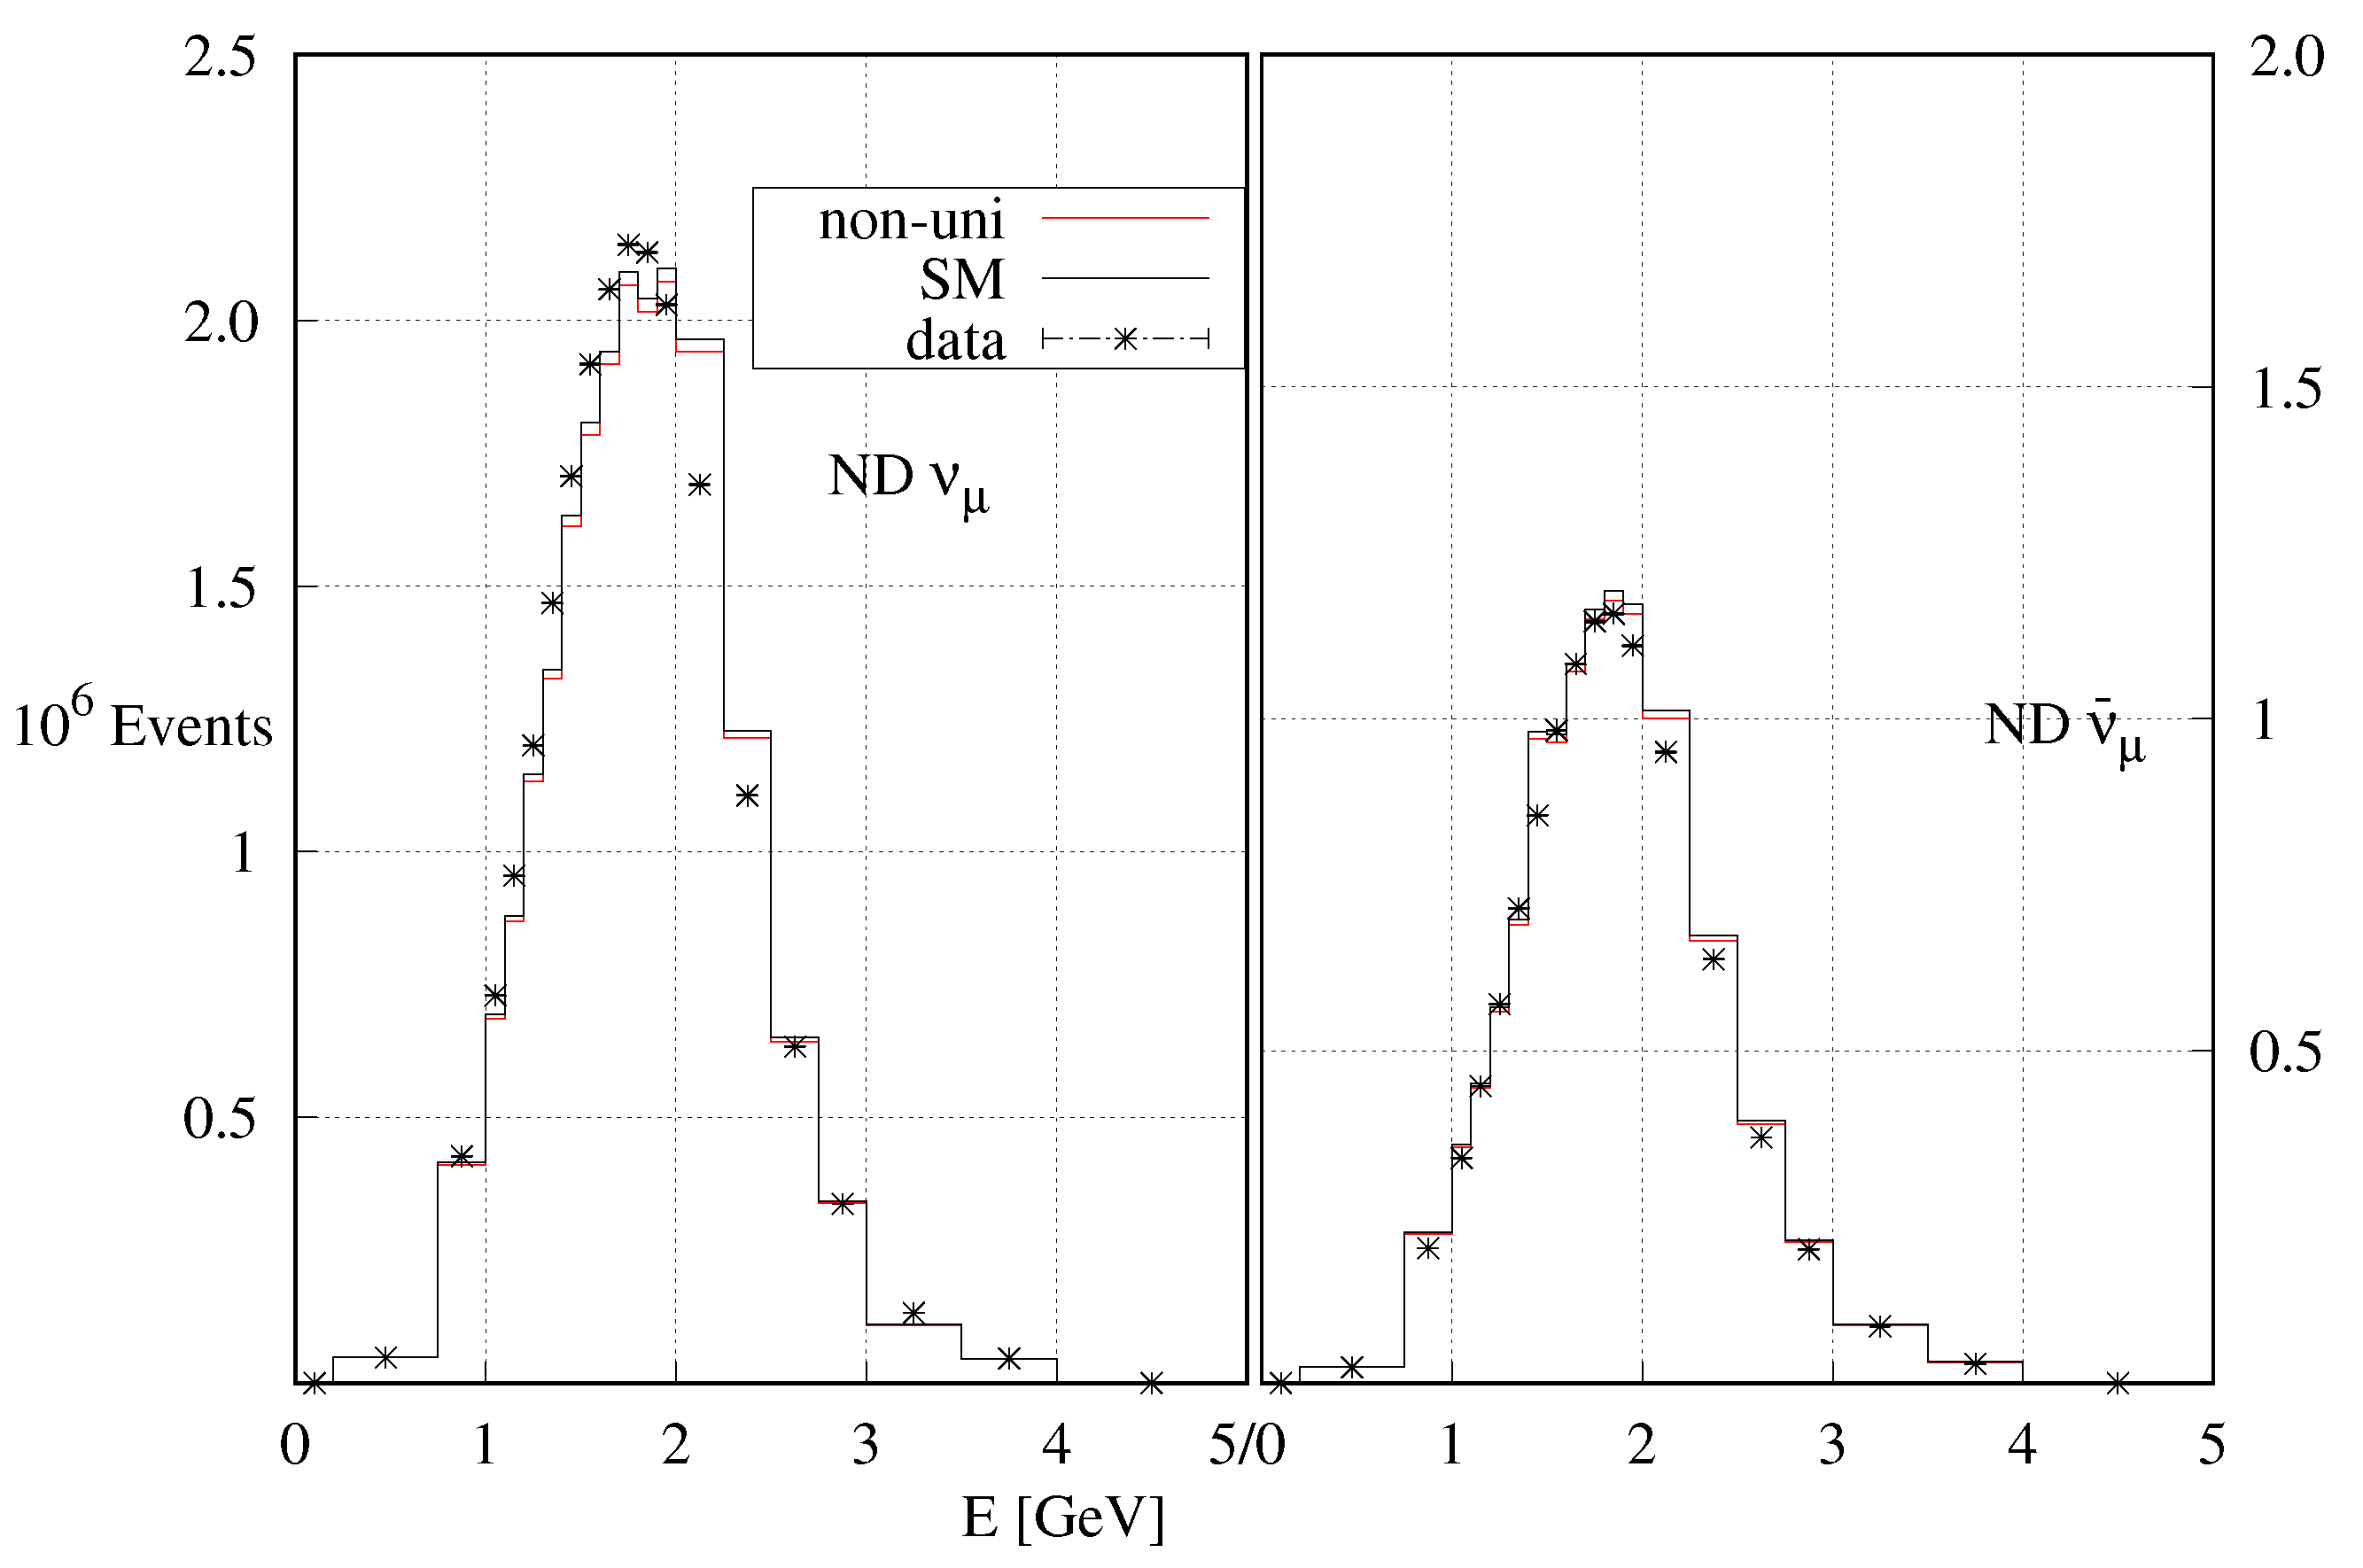
In Figure A5, we have shown the comparison between the observed and events at the NOA ND and FD with the expected events for the standard unitary and non-unitary mixing schemes. Expected events are calculated with mixing parameters at the respective best-fit points of the two schemes. The difference in expected event numbers at the FD between unitary and non-unitary mixing is very small. At the ND, the expected event numbers at the best-fit points for both the mixing hypotheses are essentially the same, and both give a good fit to the data. In Figure A6, we have shown the difference between the expected and observed and events at the ND as a function of energy for both the unitary and non-unitary mixing.
Figure A5.
Comparison between the observed and expected and events at their respective best-fit points for both unitary and non-unitary mixing at the ND and FD.
Figure A5.
Comparison between the observed and expected and events at their respective best-fit points for both unitary and non-unitary mixing at the ND and FD.

Figure A6.
Same as Figure A5, but for and events.
Figure A6.
Same as Figure A5, but for and events.

References
- Himmel, A. New Oscillation Results from the NOνA Experiments. Talk Given at the Neutrino 2020 Meeting on 2 July 2020. 2020. Available online: https://indico.fnal.gov/event/43209/contributions/187840/attachments/130740/159597/NOvA-Oscilations-NEUTRINO2020.pdf (accessed on 1 April 2022).
- Acero, M.A.; Adamson, P.; Aliaga, L.; Anfimov, N.; Antoshkin, A.; Arrieta-Diaz, E.; Asquith, L.; Aurisano, A.; Back, A.; Backhouse, C.; et al. An Improved Measurement of Neutrino Oscillation Parameters by the NOνA Experiment. arXiv 2021, arXiv:2108.08219. [Google Scholar]
- Dunne, P. Latest Neutrino Oscillation Results from T2K. Talk Given at the Neutrino 2020 Meeting on 2 July 2020. 2020. Available online: https://indico.fnal.gov/event/43209/contributions/187830/attachments/129636/159603/T2K_Neutrino2020.pdf (accessed on 1 April 2022).
- Kelly, K.J.; Machado, P.A.N.; Parke, S.J.; Perez-Gonzalez, Y.F.; Funchal, R.Z. Neutrino mass ordering in light of recent data. Phys. Rev. D 2021, 103, 013004. [Google Scholar] [CrossRef]
- Chatterjee, S.S.; Palazzo, A. Nonstandard Neutrino Interactions as a Solution to the NOνA and T2K Discrepancy. Phys. Rev. Lett. 2021, 126, 051802. [Google Scholar] [CrossRef] [PubMed]
- Denton, P.B.; Gehrlein, J.; Pestes, R. CP—Violating Neutrino Nonstandard Interactions in Long-Baseline-Accelerator Data. Phys. Rev. Lett. 2021, 126, 051801. [Google Scholar] [CrossRef]
- Rahaman, U. Looking for Lorentz invariance violation (LIV) in the latest long baseline accelerator neutrino oscillation data. arXiv 2021, arXiv:2103.04576. [Google Scholar] [CrossRef]
- Miranda, L.S.; Pasquini, P.; Rahaman, U.; Razzaque, S. Searching for non-unitary neutrino oscillations in the present T2K and NOνA data. Eur. Phys. J. C 2021, 81, 444. [Google Scholar] [CrossRef]
- Aguilar, A.; Auerbach, L.B.; Burman, R.L.; Caldwell, D.O.; Church, E.D.; Cochran, A.K.; Donahue, J.B.; Fazely, A.; Garvey, G.T.; Gunasingha, R.M.; et al. Evidence for neutrino oscillations from the observation of anti-neutrino(electron) appearance in a anti-neutrino(muon) beam. Phys. Rev. D 2001, 64, 112007. [Google Scholar] [CrossRef] [Green Version]
- Aguilar-Arevalo, A.A.; Brown, B.C.; Bugel, L.; Cheng, G.; Conrad, J.M.; Cooper, R.L.; Dharmapalan, R.; Diaz, A.; Djurcic, Z.; Finley, D.A.; et al. Significant Excess of ElectronLike Events in the MiniBooNE Short-Baseline Neutrino Experiment. Phys. Rev. Lett. 2018, 121, 221801. [Google Scholar] [CrossRef] [Green Version]
- Forero, D.V.; Giunti, C.; Ternes, C.A.; Tortola, M. Non-unitary neutrino mixing in short and long-baseline experiments. arXiv 2021, arXiv:2103.01998. [Google Scholar]
- Escrihuela, F.J.; Forero, D.V.; Miranda, O.G.; Tortola, M.; Valle, J.W.F. On the description of nonunitary neutrino mixing. Phys. Rev. D 2015, 92, 053009, Erratum in Phys. Rev. D 2016, 93, 119905. [Google Scholar] [CrossRef] [Green Version]
- Astier, P.; Autiero, D.; Baldisseri, A.; Baldo-Ceolin, M.; Banner, M.; Bassompierre, G.; Benslama, K.; Besson, N.; Bird, I.; Blumenfeld, B.; et al. Search for νμ → νe oscillations in the NOMAD experiment. Phys. Lett. B 2003, 570, 19–31. [Google Scholar] [CrossRef]
- Avvakumov, S.; de Barbaro, P.; Bodek, A.; Budd, H.; Harris, D.A.; Sakumoto, W.K.; Yang, U.K.; Adams, T.; Alton, A.; Bolton, T.; et al. A Search for νμ → νe and μ → e Oscillations at NuTeV. Phys. Rev. Lett. 2002, 89, 011804. [Google Scholar] [CrossRef] [PubMed] [Green Version]
- Dentler, M.; Hernández-Cabezudo, A.; Kopp, J.; Maltoni, M.; Schwetz, T. Sterile neutrinos or flux uncertainties?—Status of the reactor anti-neutrino anomaly. J. High Energy Phys. 2017, 11, 99. [Google Scholar] [CrossRef] [Green Version]
- Dunne, P.; Imperial College of Science Technology and Medicine, London, UK. Personal communication. 2021. [Google Scholar]
- Acero, M.A.; Adamson, P.; Aliaga, L.; Alion, T.; Allakhverdian, V.; Anfimov, N.; Antoshkin, A.; Arrieta-Diaz, E.; Aurisano, A.; Back, A.; et al. New constraints on oscillation parameters from νe appearance and νμ disappearance in the NOνA experiment. Phys. Rev. D 2018, 98, 032012. [Google Scholar] [CrossRef] [Green Version]
- Antusch, S.; Fischer, O. Non-unitarity of the leptonic mixing matrix: Present bounds and future sensitivities. J. High Energy Phys. 2014, 2014, 94. [Google Scholar] [CrossRef] [Green Version]
- Escrihuela, F.J.; Forero, D.V.; Miranda, O.G.; Tórtola, M.; Valle, J.W.F. Probing CP violation with non-unitary mixing in long-baseline neutrino oscillation experiments: DUNE as a case study. New J. Phys. 2017, 19, 093005. [Google Scholar] [CrossRef] [Green Version]
- Huber, P.; Lindner, M.; Winter, W. Simulation of long-baseline neutrino oscillation experiments with GLoBES (General Long Baseline Experiment Simulator). Comput. Phys. Commun. 2005, 167, 195. [Google Scholar] [CrossRef] [Green Version]
- Huber, P.; Kopp, J.; Lindner, M.; Rolinec, M.; Winter, W. New features in the simulation of neutrino oscillation experiments with GLoBES 3.0: General Long Baseline Experiment Simulator. Comput. Phys. Commun. 2007, 177, 432–438. [Google Scholar] [CrossRef] [Green Version]
- Esteban, I.; Gonzalez-Garcia, M.C.; Hernandez-Cabezudo, A.; Maltoni, M.; Schwetz, T. Global analysis of three-flavour neutrino oscillations: Synergies and tensions in the determination of θ23, δCP, and the mass ordering. J. High Energy Phys. 2019, 1, 106. [Google Scholar] [CrossRef]
- Nichol, R. Final MINOS Results. In Proceedings of the Neutrino 2012 Conference, Kyoto, Japan, 3–9 June 2012; Available online: http://neu2012.kek.jp/ (accessed on 1 April 2022).
- Nunokawa, H.; Parke, S.J.; Zukanovich Funchal, R. Another possible way to determine the neutrino mass hierarchy. Phys. Rev. D 2005, 72, 013009. [Google Scholar] [CrossRef] [Green Version]
- Nufit. 2019. Available online: http://www.nu-fit.org/?q=node/211 (accessed on 1 April 2022).
- Abi, B.; Acciarri, R.; Acero, M.A.; Adamowski, M.; Adams, C.; Adams, D.; Adamson, P.; Adinolfi, M.; Ahmad, Z.; Albright, C.H.; et al. The DUNE Far Detector Interim Design Report Volume 1: Physics, Technology and Strategies. arXiv 2018, arXiv:1807.10334. [Google Scholar]
- Ishida, T. T2HK: J-PARC upgrade plan for future and beyond T2K. arXiv 2013, arXiv:1311.5287. [Google Scholar]
Figure 1.
as a function of individual non-unitary parameters for the NOA ND (red lines) and ND + FD (blue lines) data.
Figure 1.
as a function of individual non-unitary parameters for the NOA ND (red lines) and ND + FD (blue lines) data.

Figure 2.
Allowed regions in the plane after a combined analysis of the NOA ND and FD data. The blue (red) lines represent the boundary of () C.L.
Figure 2.
Allowed regions in the plane after a combined analysis of the NOA ND and FD data. The blue (red) lines represent the boundary of () C.L.

Publisher’s Note: MDPI stays neutral with regard to jurisdictional claims in published maps and institutional affiliations. |
© 2022 by the authors. Licensee MDPI, Basel, Switzerland. This article is an open access article distributed under the terms and conditions of the Creative Commons Attribution (CC BY) license (https://creativecommons.org/licenses/by/4.0/).
Share and Cite
MDPI and ACS Style
Rahaman, U.; Razzaque, S. Non-Unitary Neutrino Mixing in the NOνA Near Detector Data. Universe 2022, 8, 238. https://0-doi-org.brum.beds.ac.uk/10.3390/universe8040238
AMA Style
Rahaman U, Razzaque S. Non-Unitary Neutrino Mixing in the NOνA Near Detector Data. Universe. 2022; 8(4):238. https://0-doi-org.brum.beds.ac.uk/10.3390/universe8040238
Chicago/Turabian StyleRahaman, Ushak, and Soebur Razzaque. 2022. "Non-Unitary Neutrino Mixing in the NOνA Near Detector Data" Universe 8, no. 4: 238. https://0-doi-org.brum.beds.ac.uk/10.3390/universe8040238
Note that from the first issue of 2016, this journal uses article numbers instead of page numbers. See further details here.