
Analysis of the Capability of Detection of Extensive Air Showers by Simple Scintillator Detectors

 ,
,  , ,
, ,  , , , , , , ,
  , , , and
Abstract
:1. Introduction
2. Methodology
2.1. Simulations and Data
2.2. Data Analysis
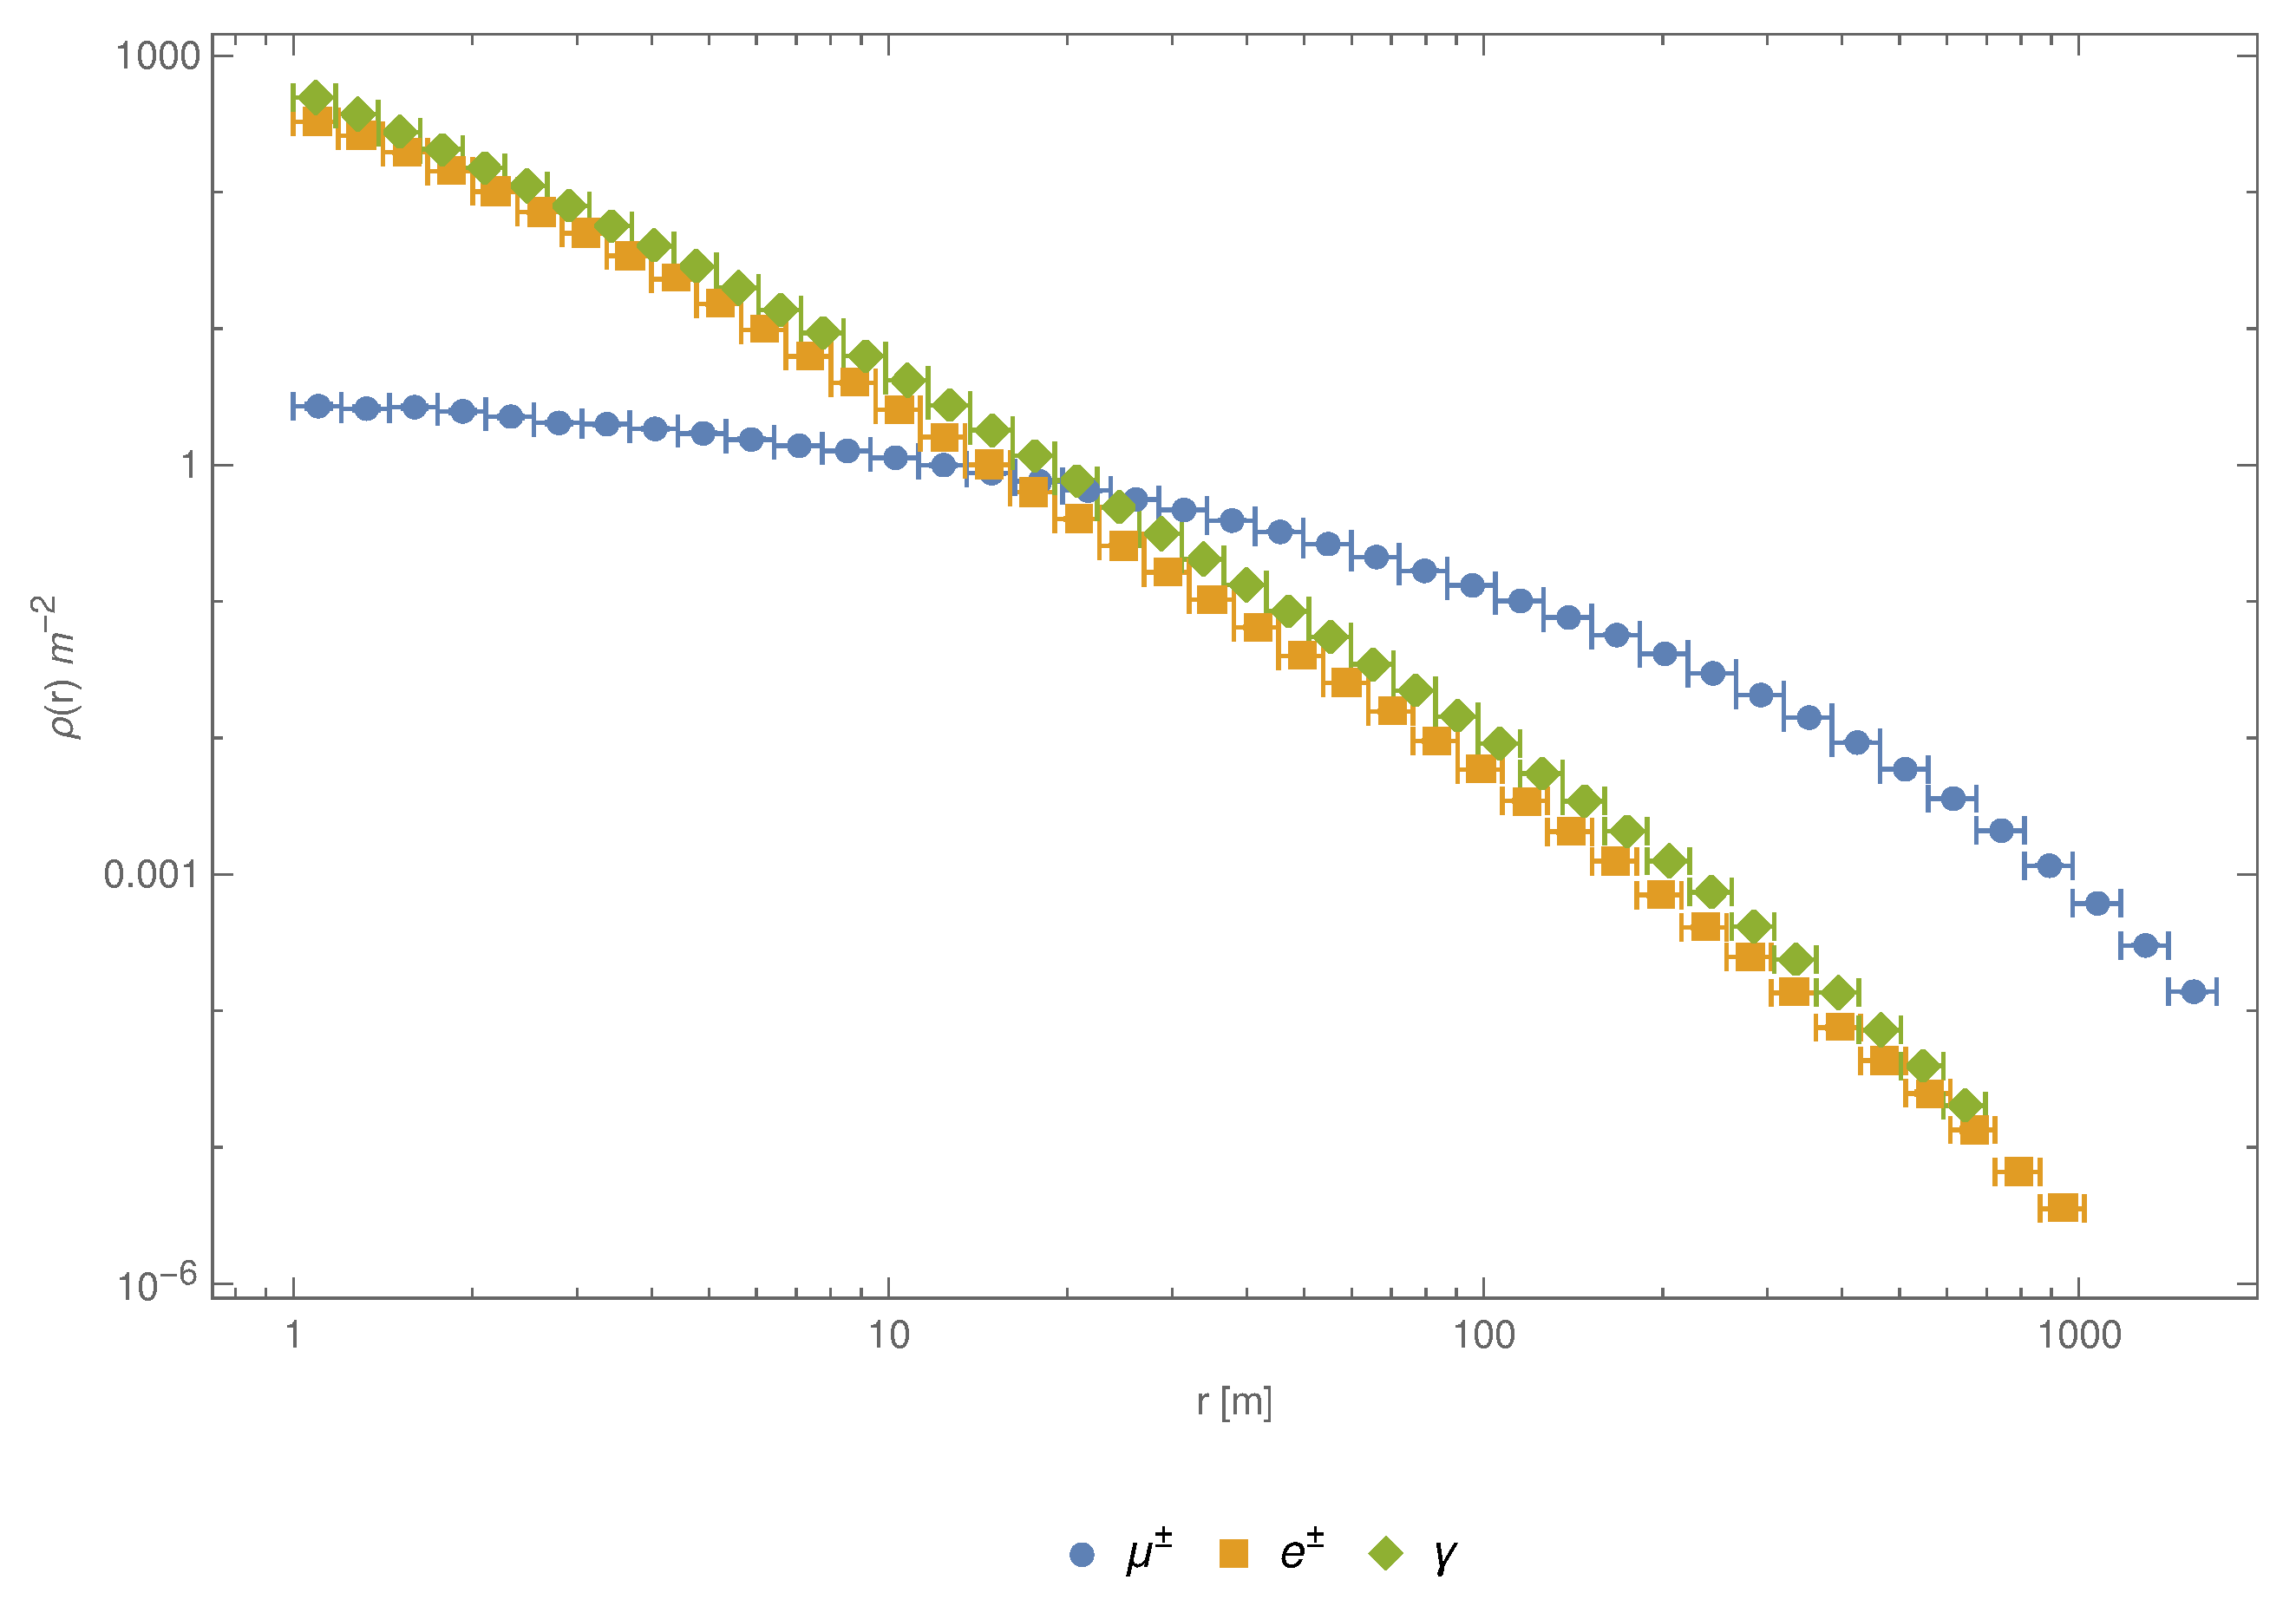
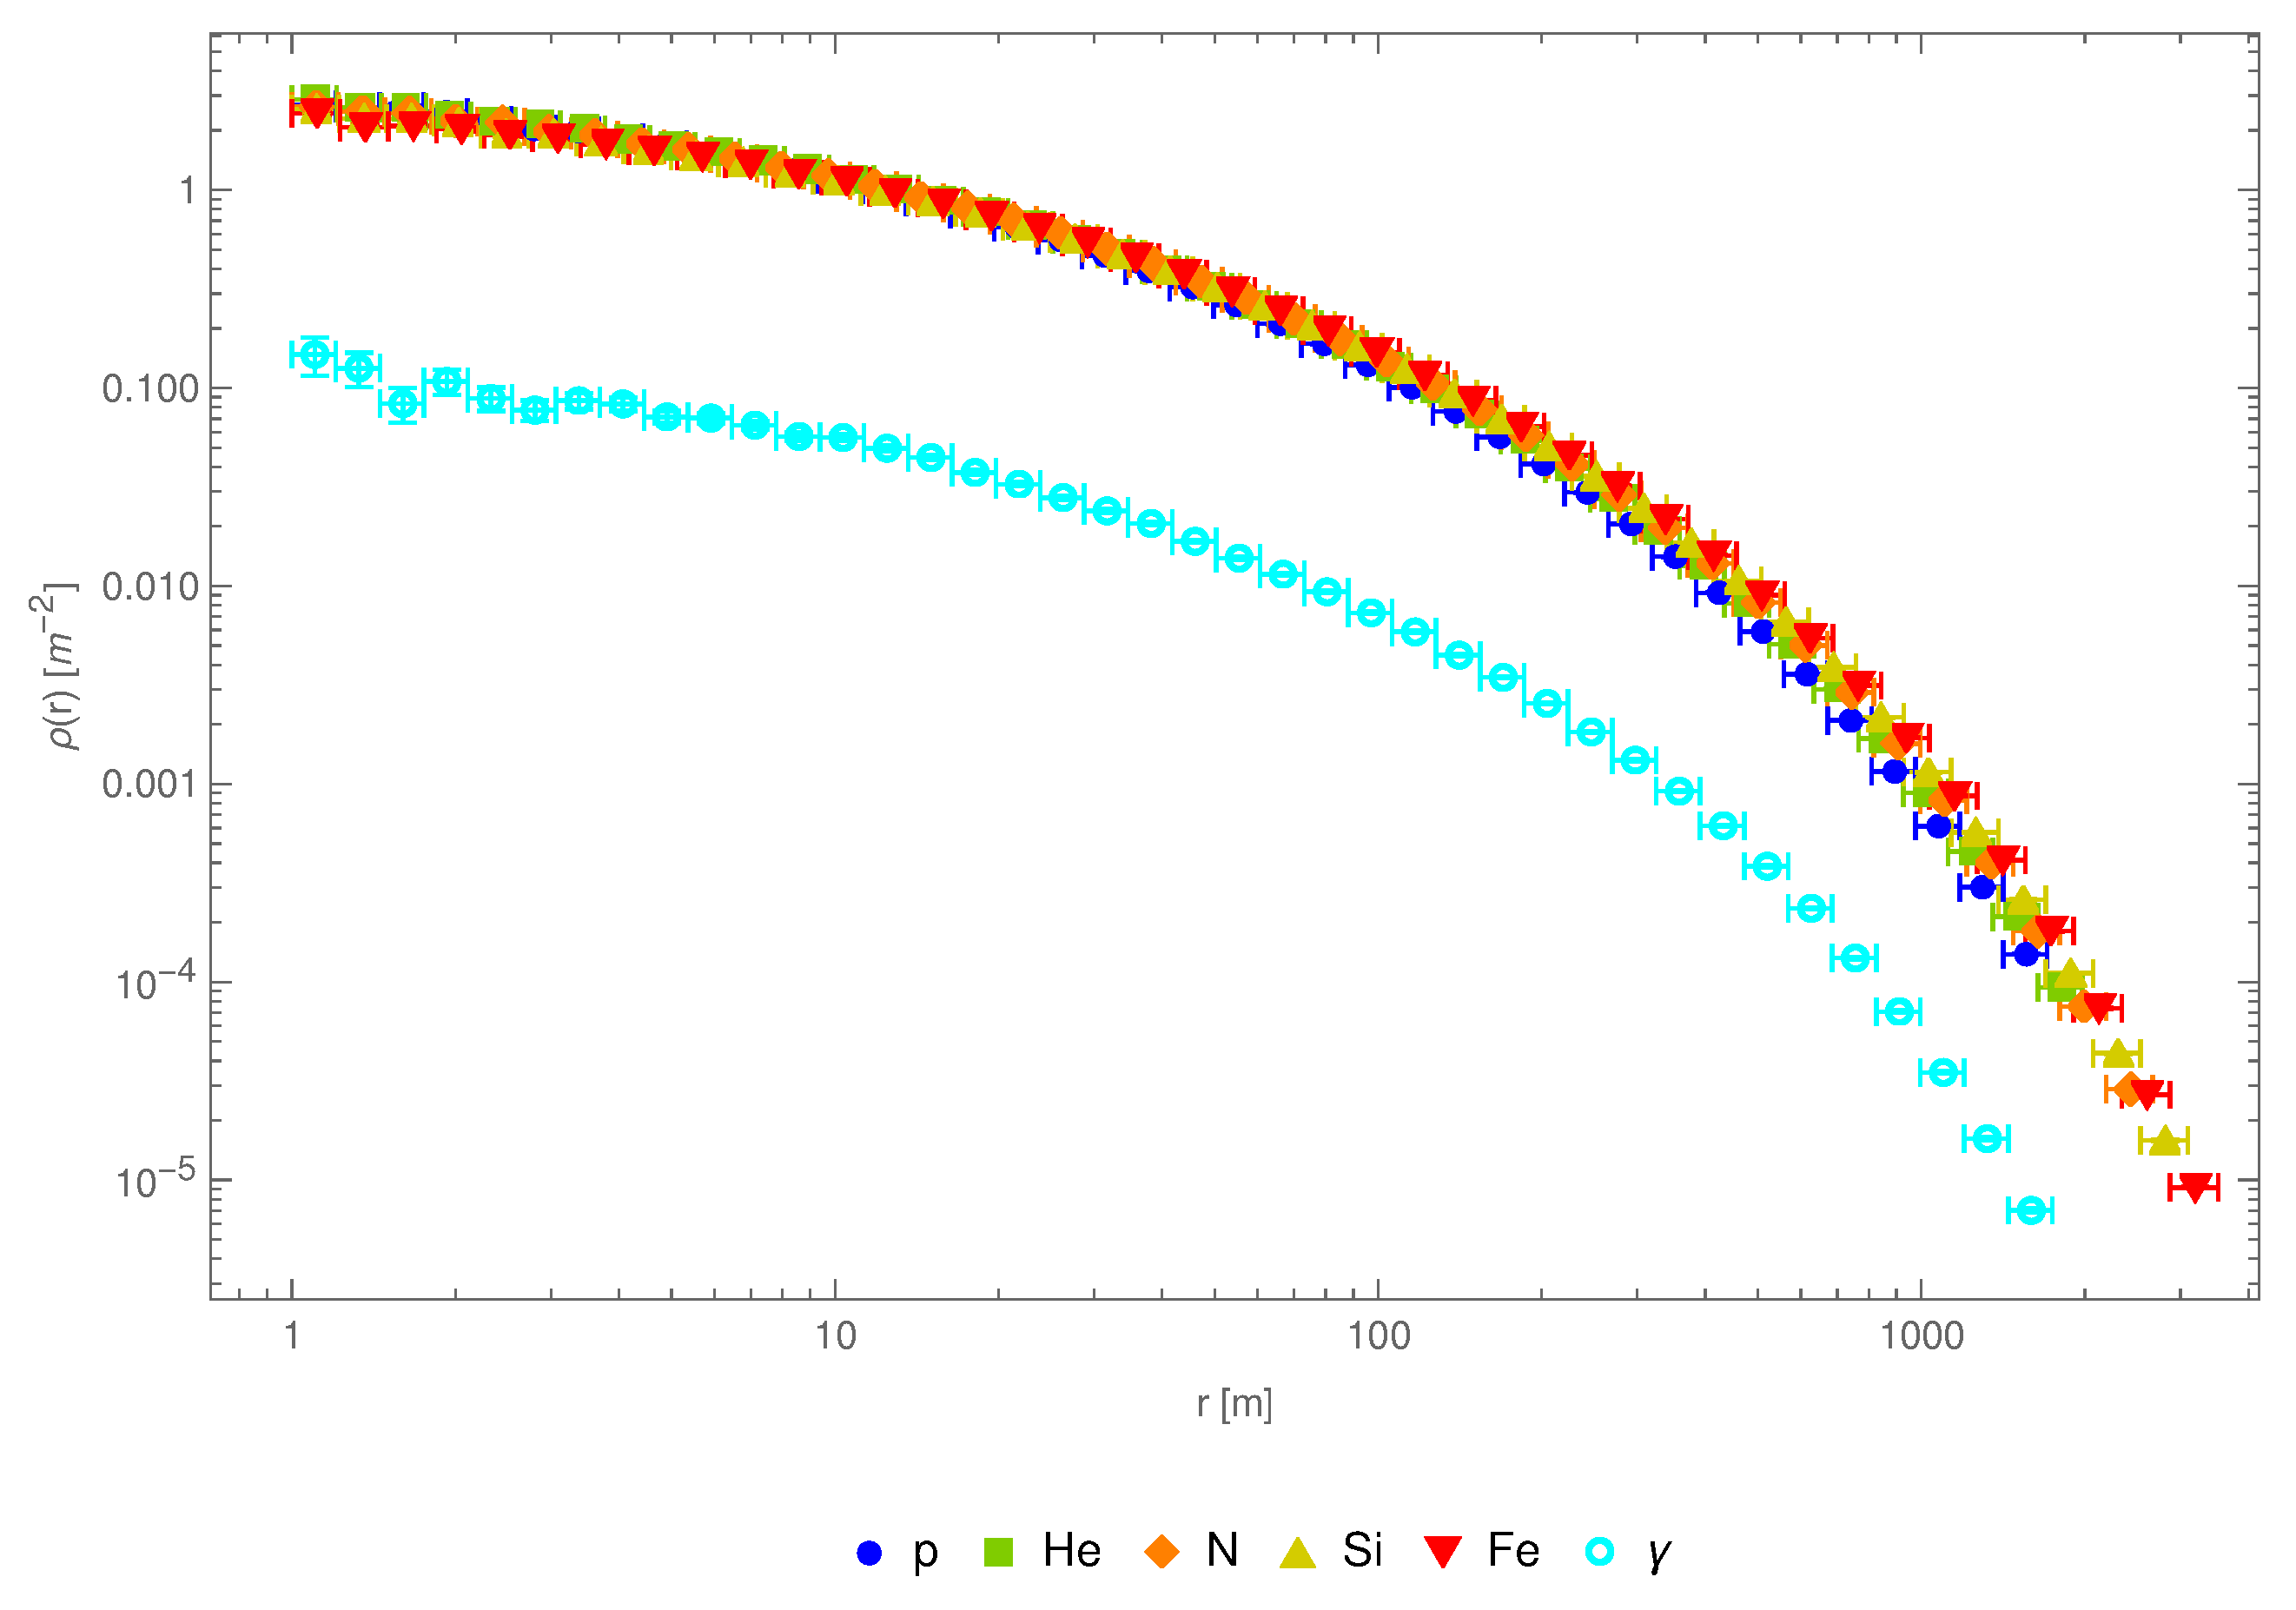
- —is a function which defines the standard “profile” of the footprint of the cascade. It represents relation between particle density and distance from the centre of the shower. This function is fitted for vertical cascades of a chosen energy. It is assumed that particle density for cascades with different energies or other parameters are generally similar but need corrections which depend on parameters of the cascade considered. The following factors , , and are normalised to unity for the “standard” cascade and provide correction to the particles density if the parameters of a cascade are different. Figure 1 presents the shape of this distribution for different types of particles in the shower.
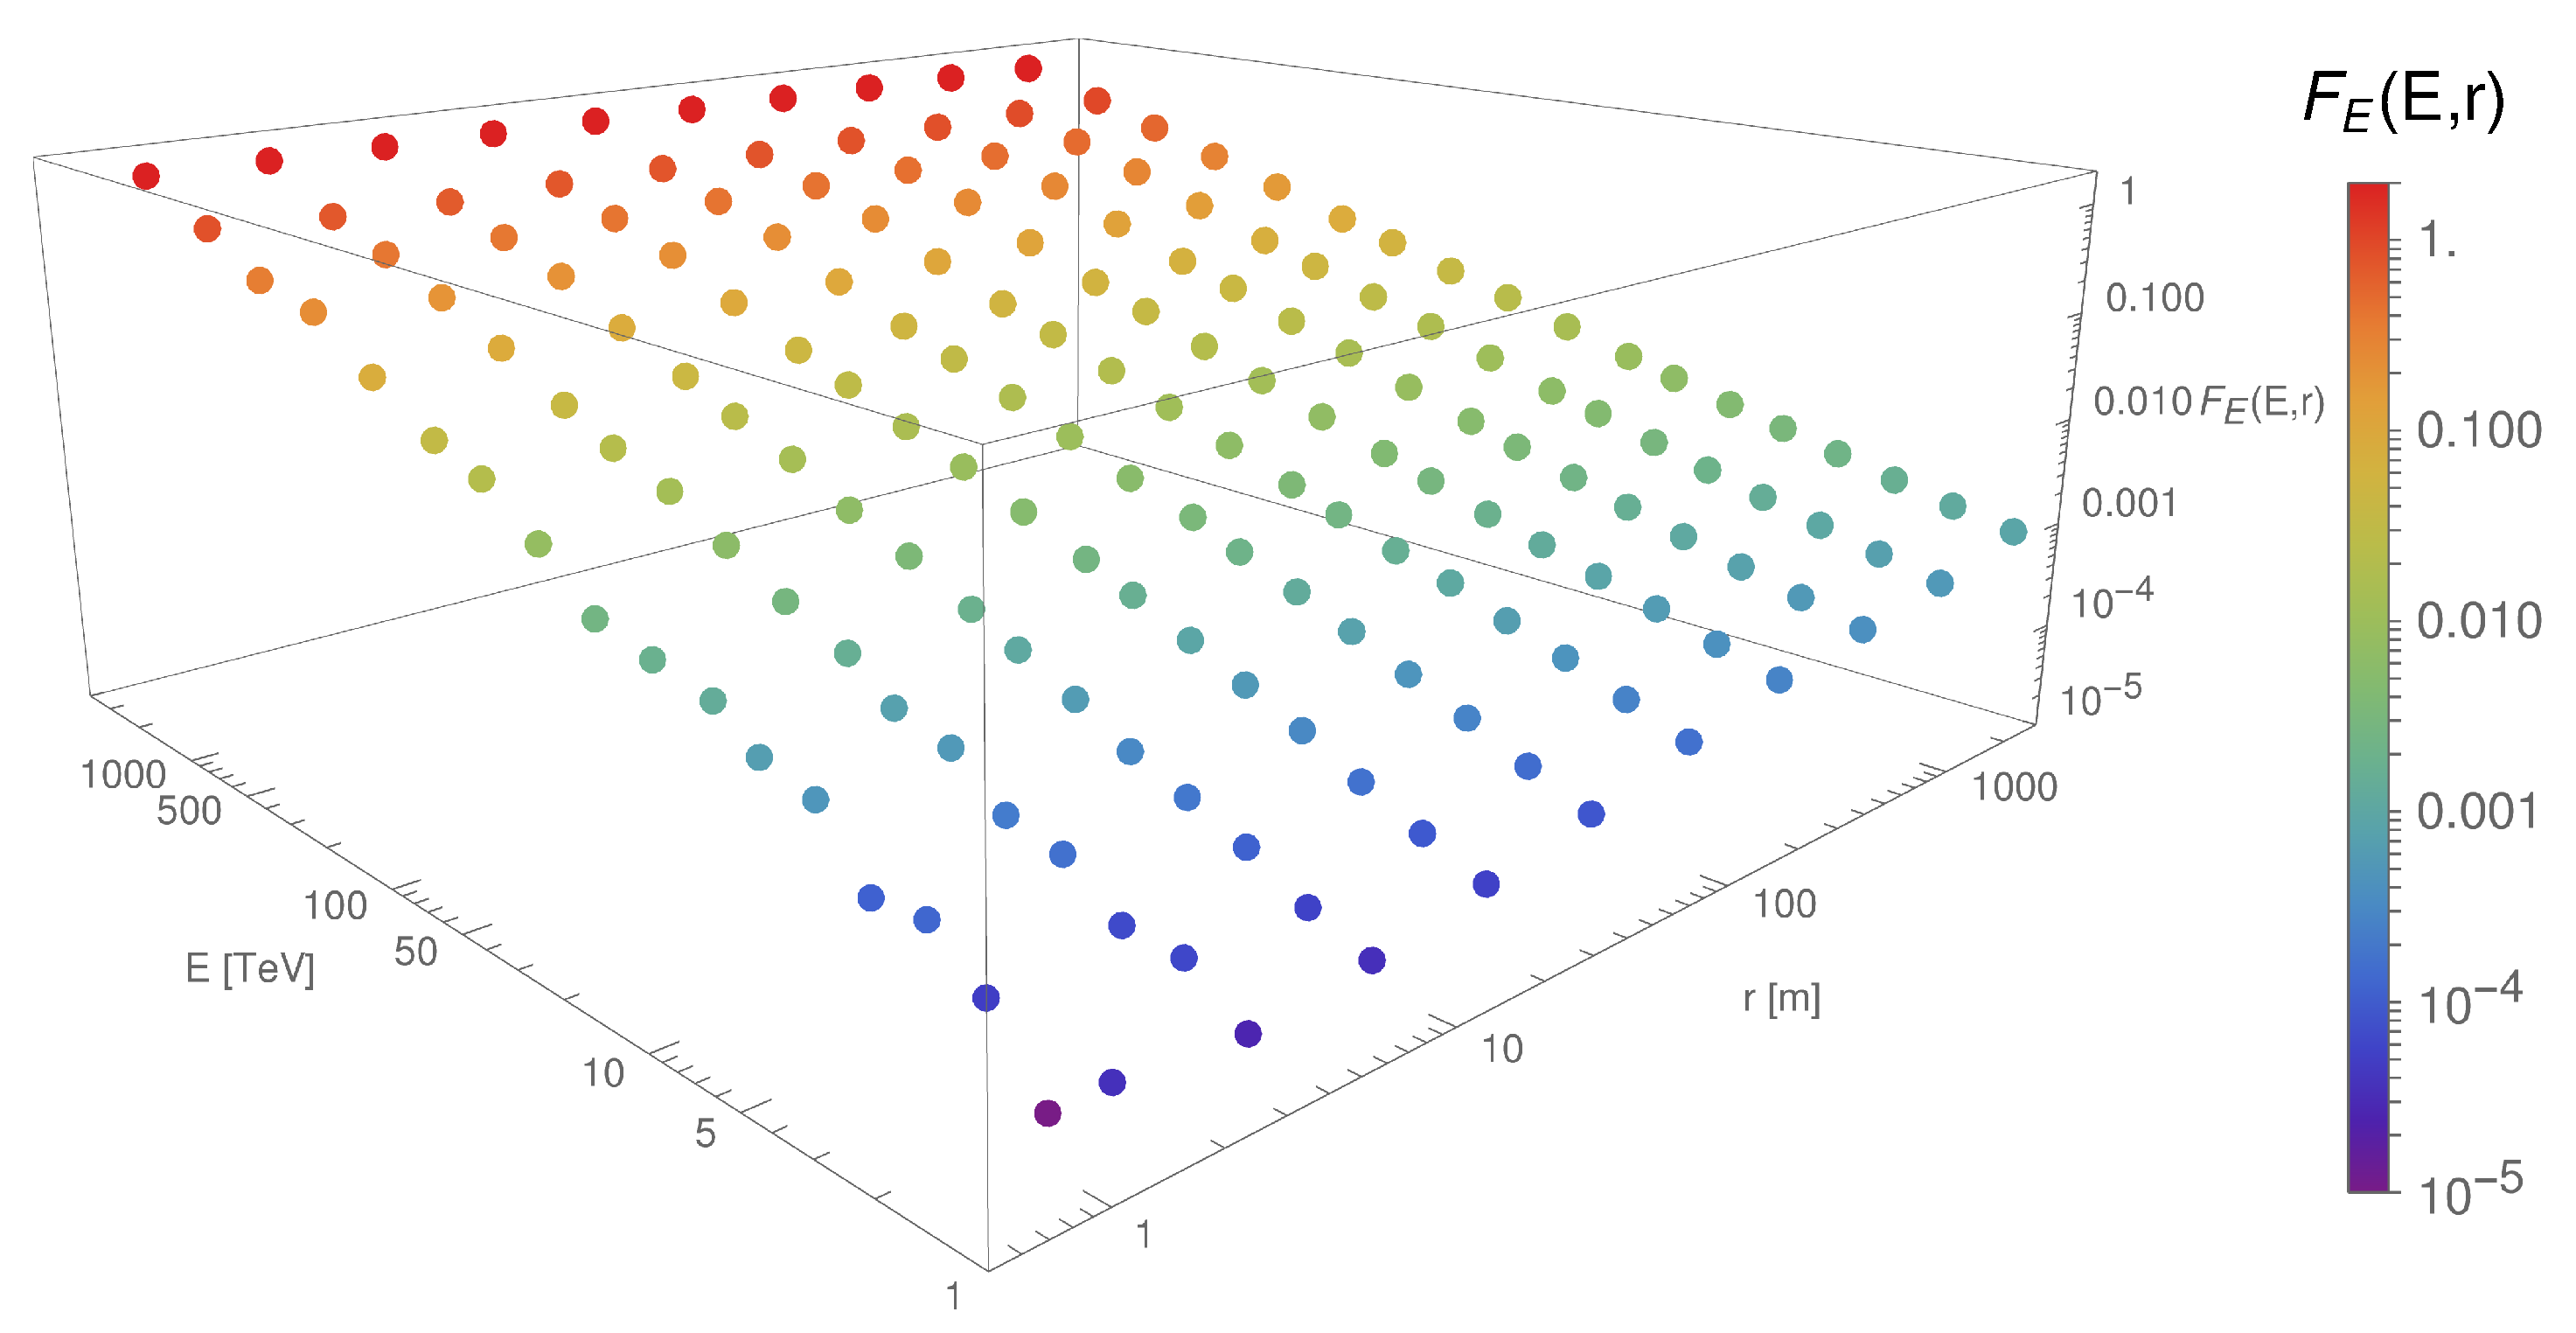
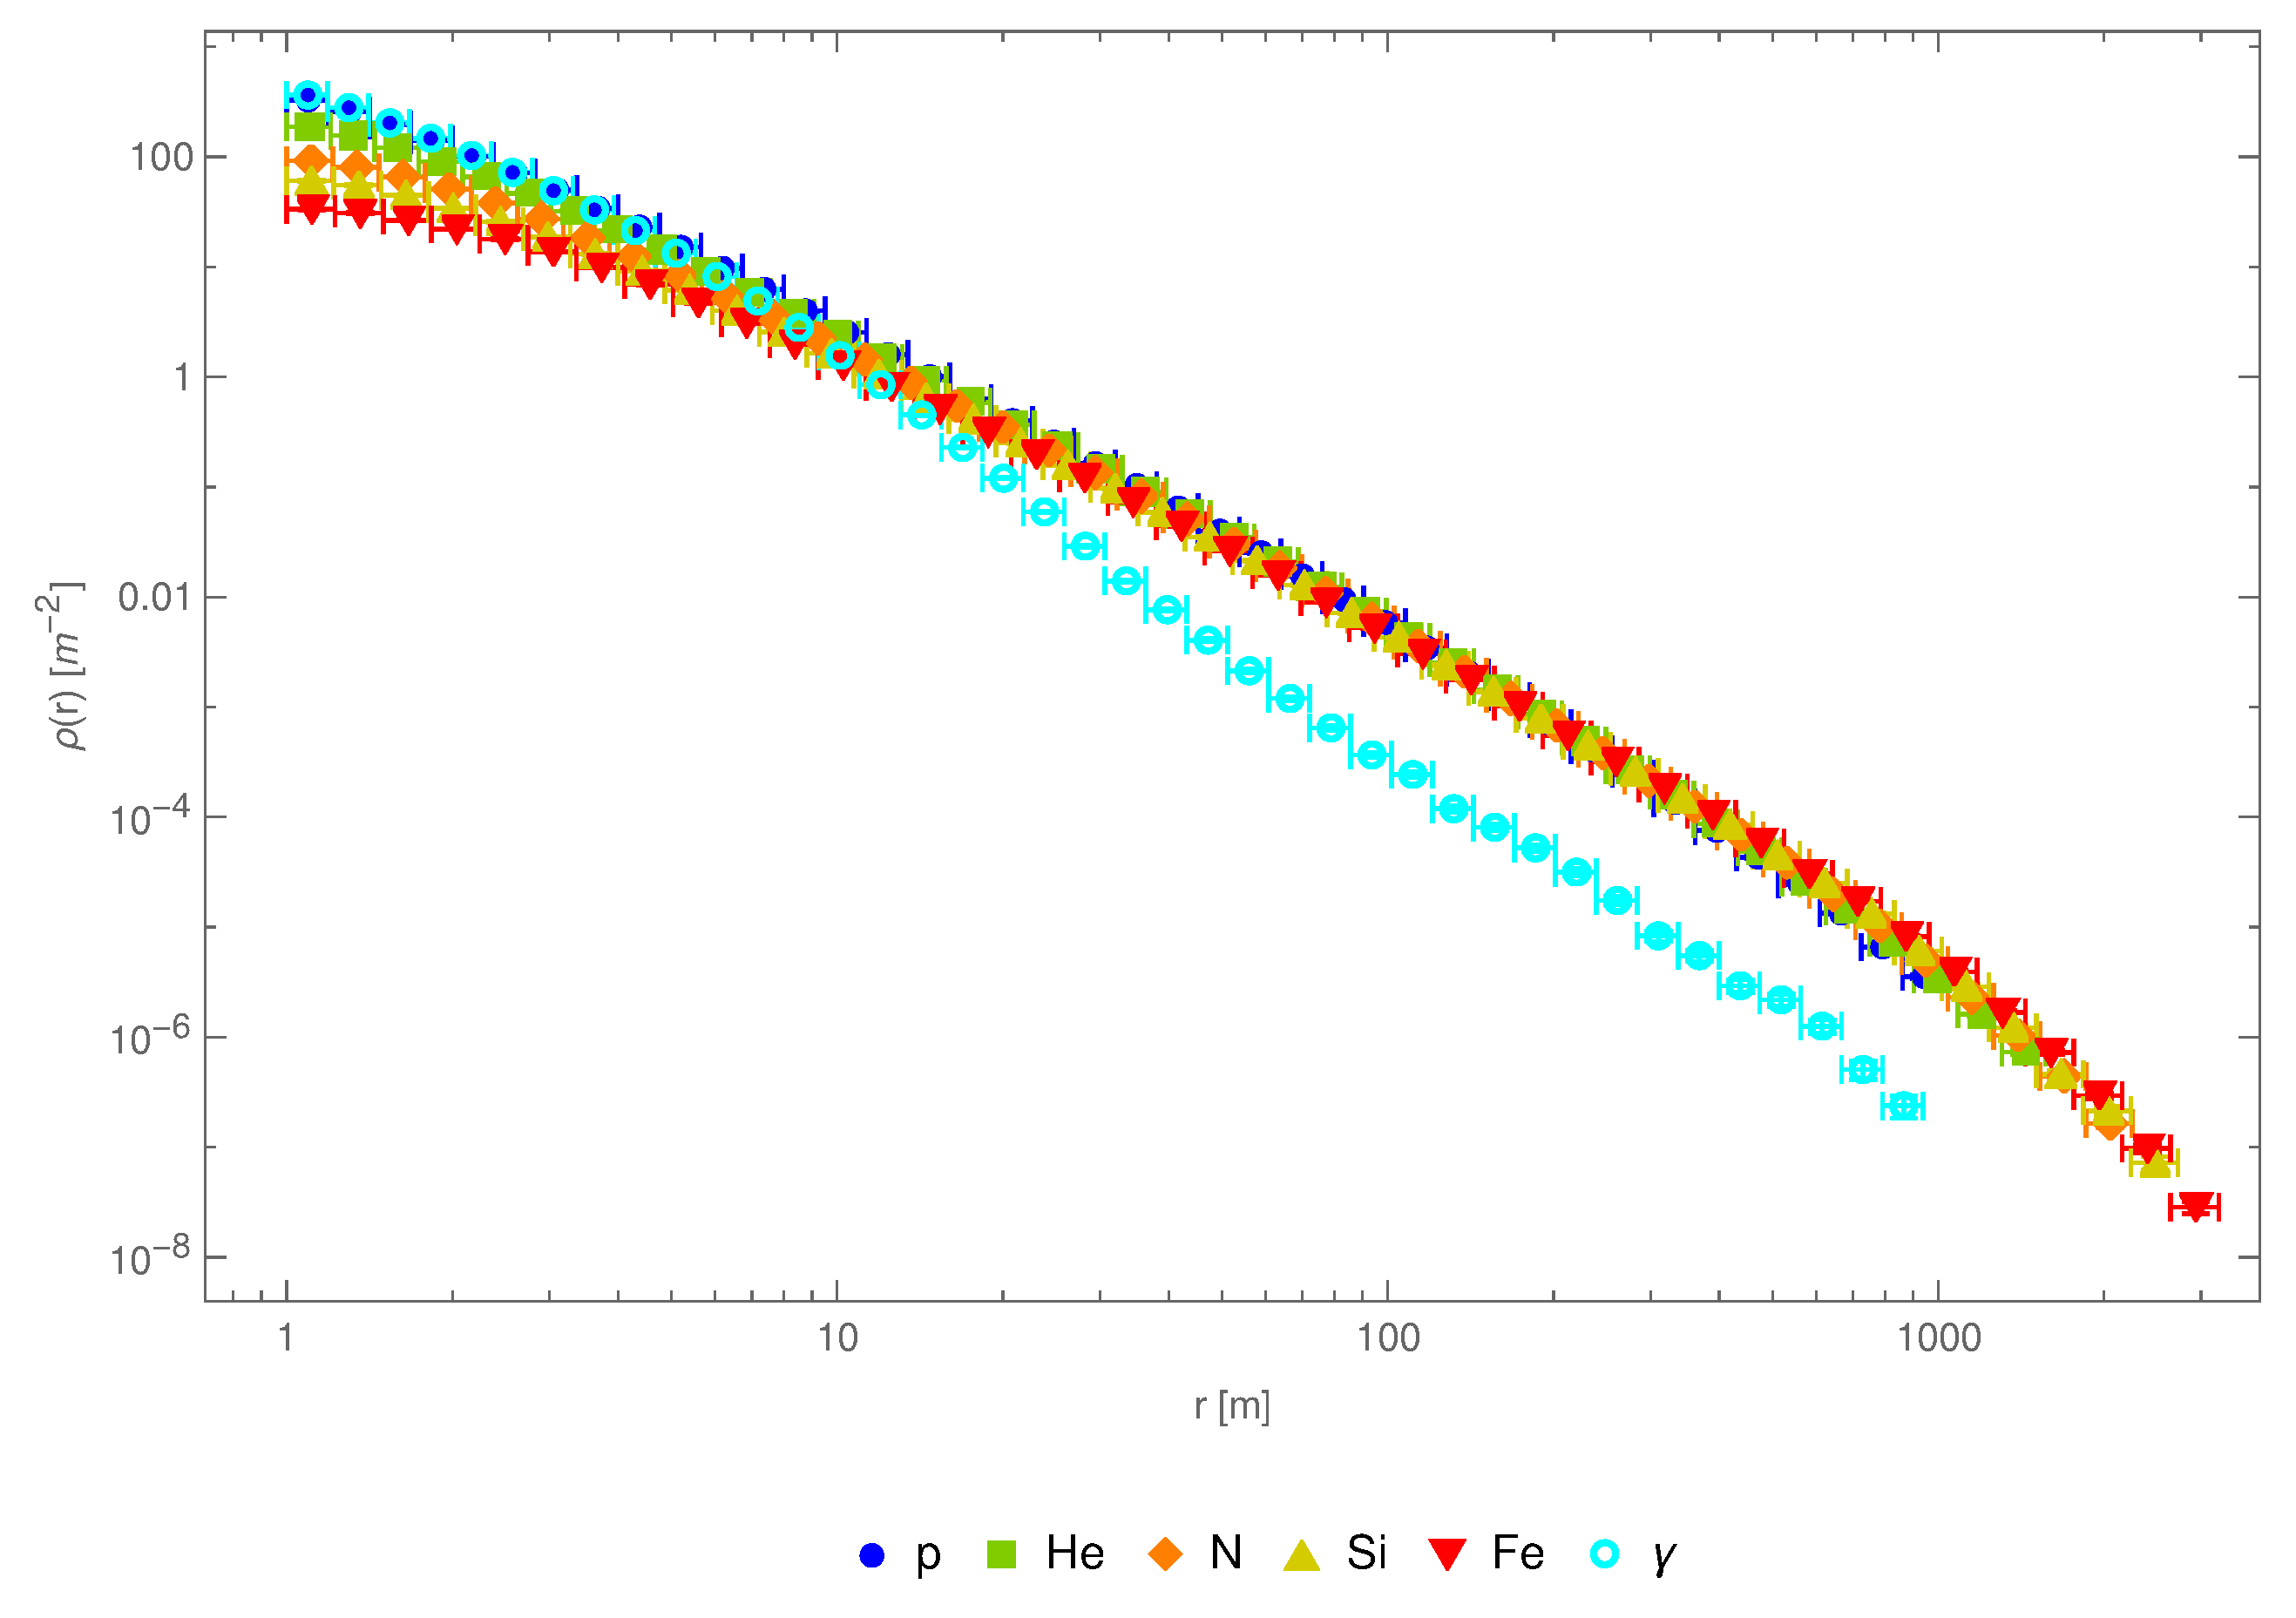
- —is a factor which defines how much the density of secondary particles is changing with the energy of the primary cosmic-ray particle. It affects not only the normalised density but also modifies the dependence on the distance r. The two-dimensional function presented in Figure 2 is smooth and can be easily parameterised.
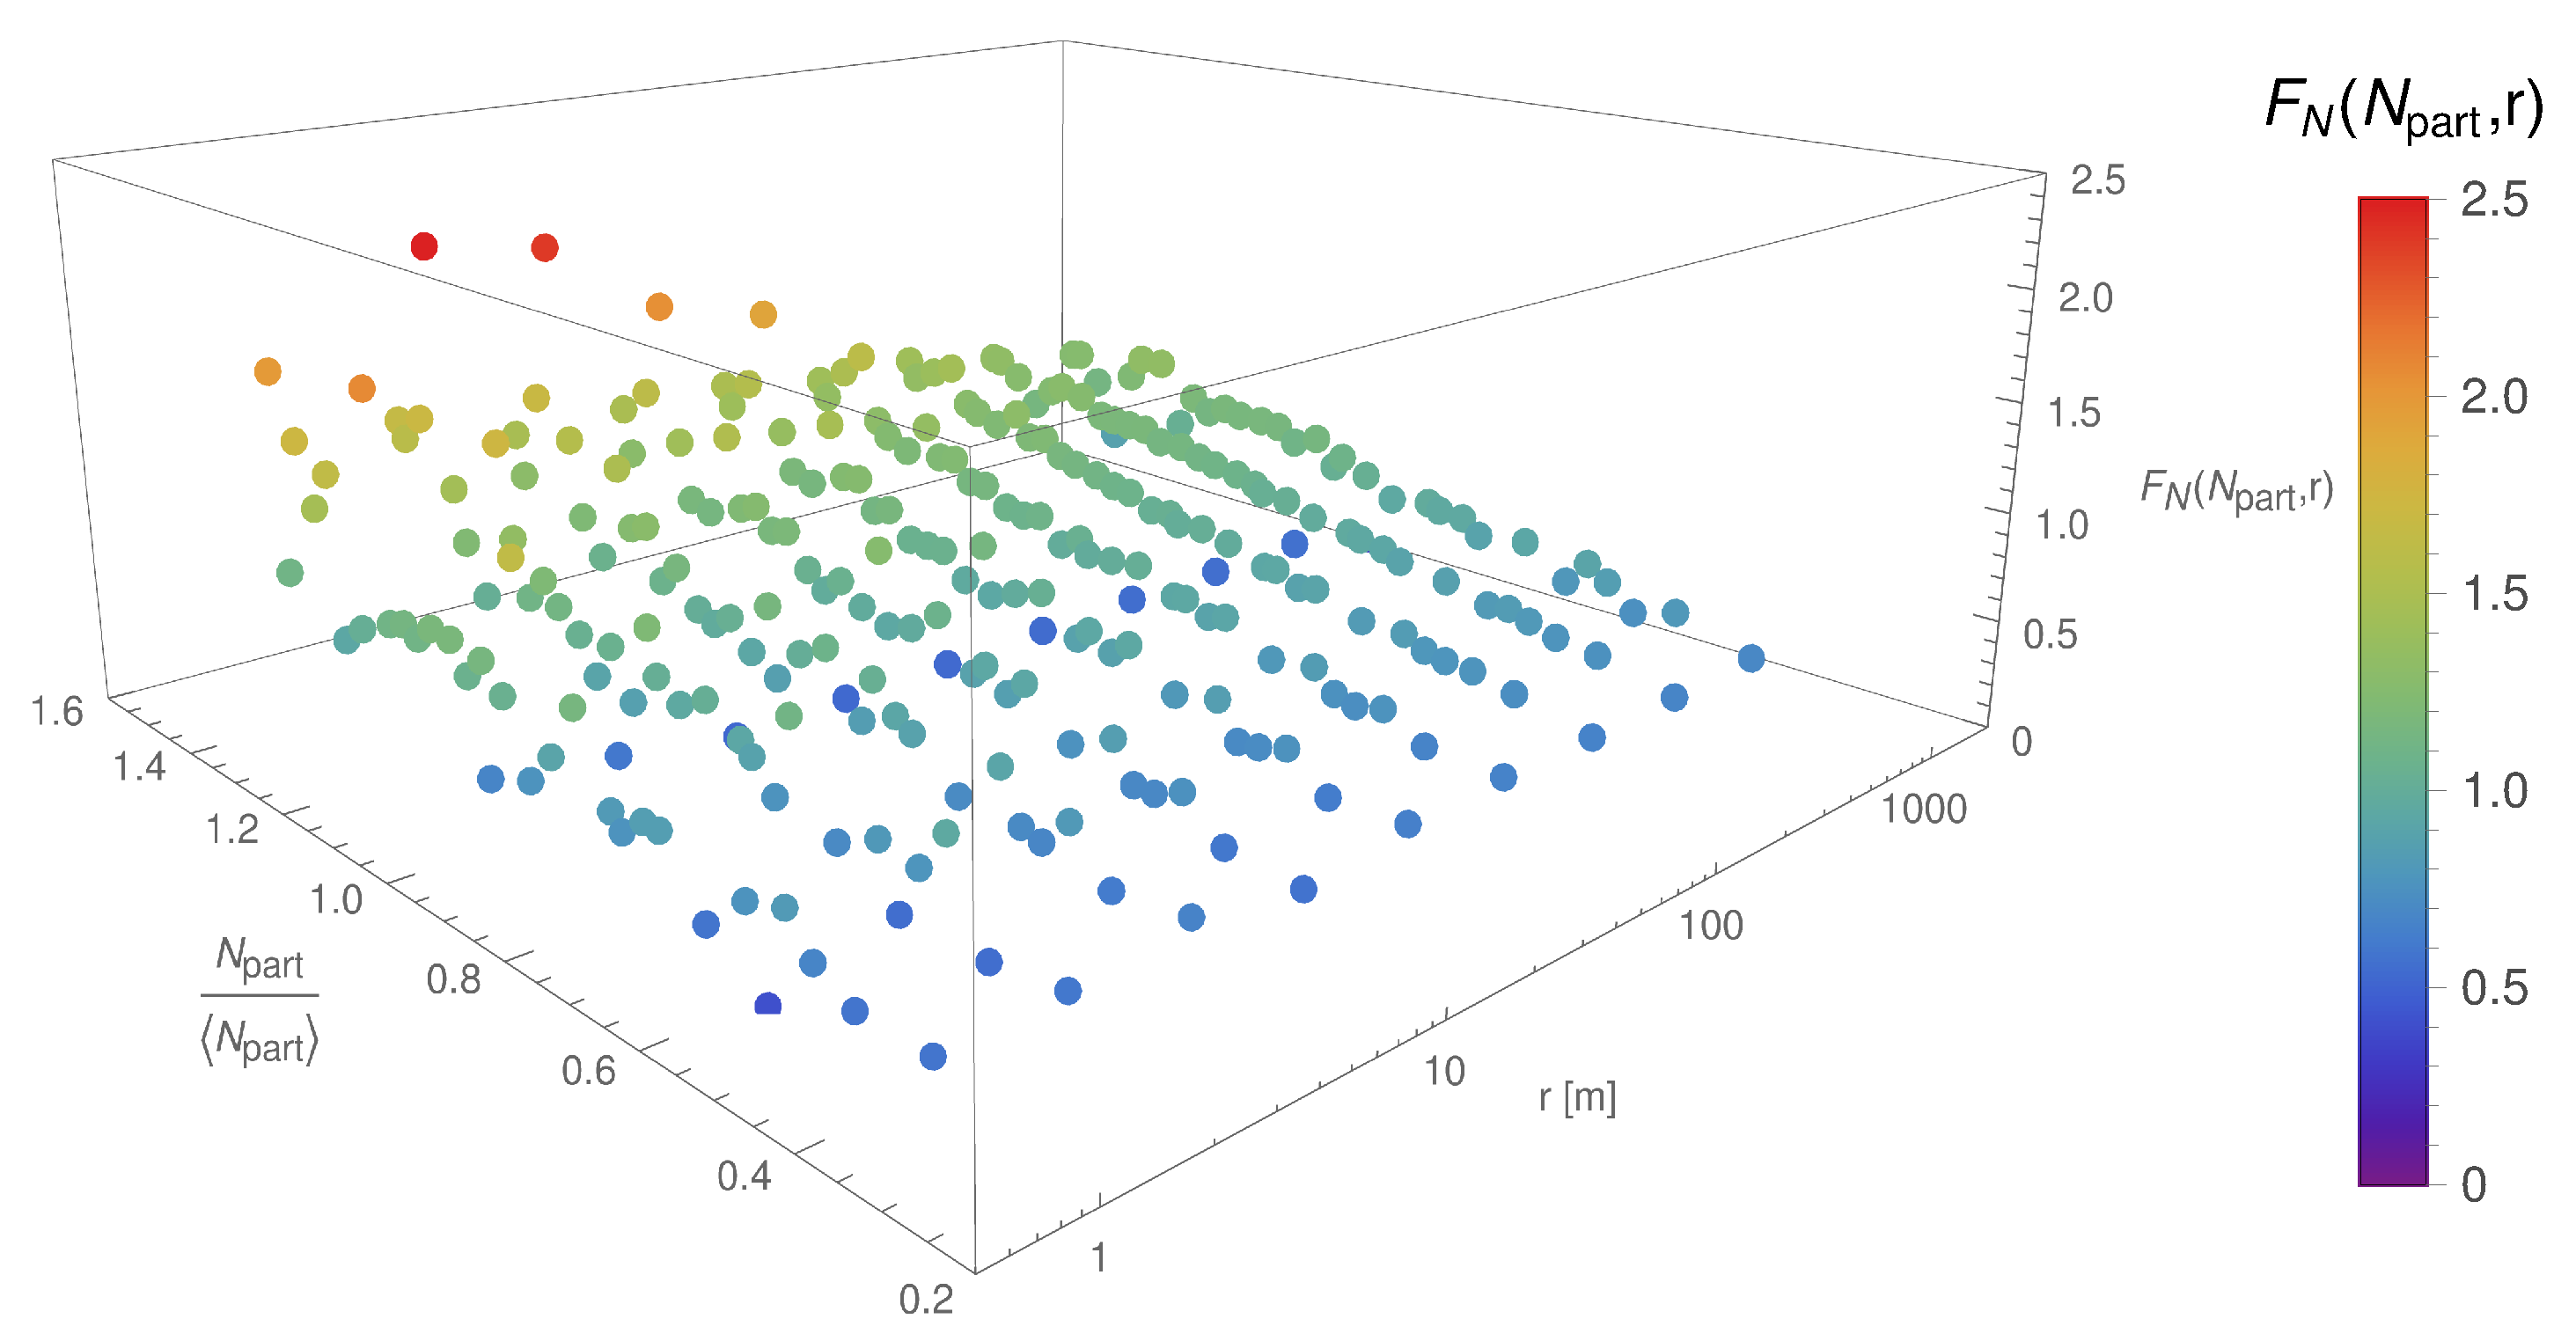
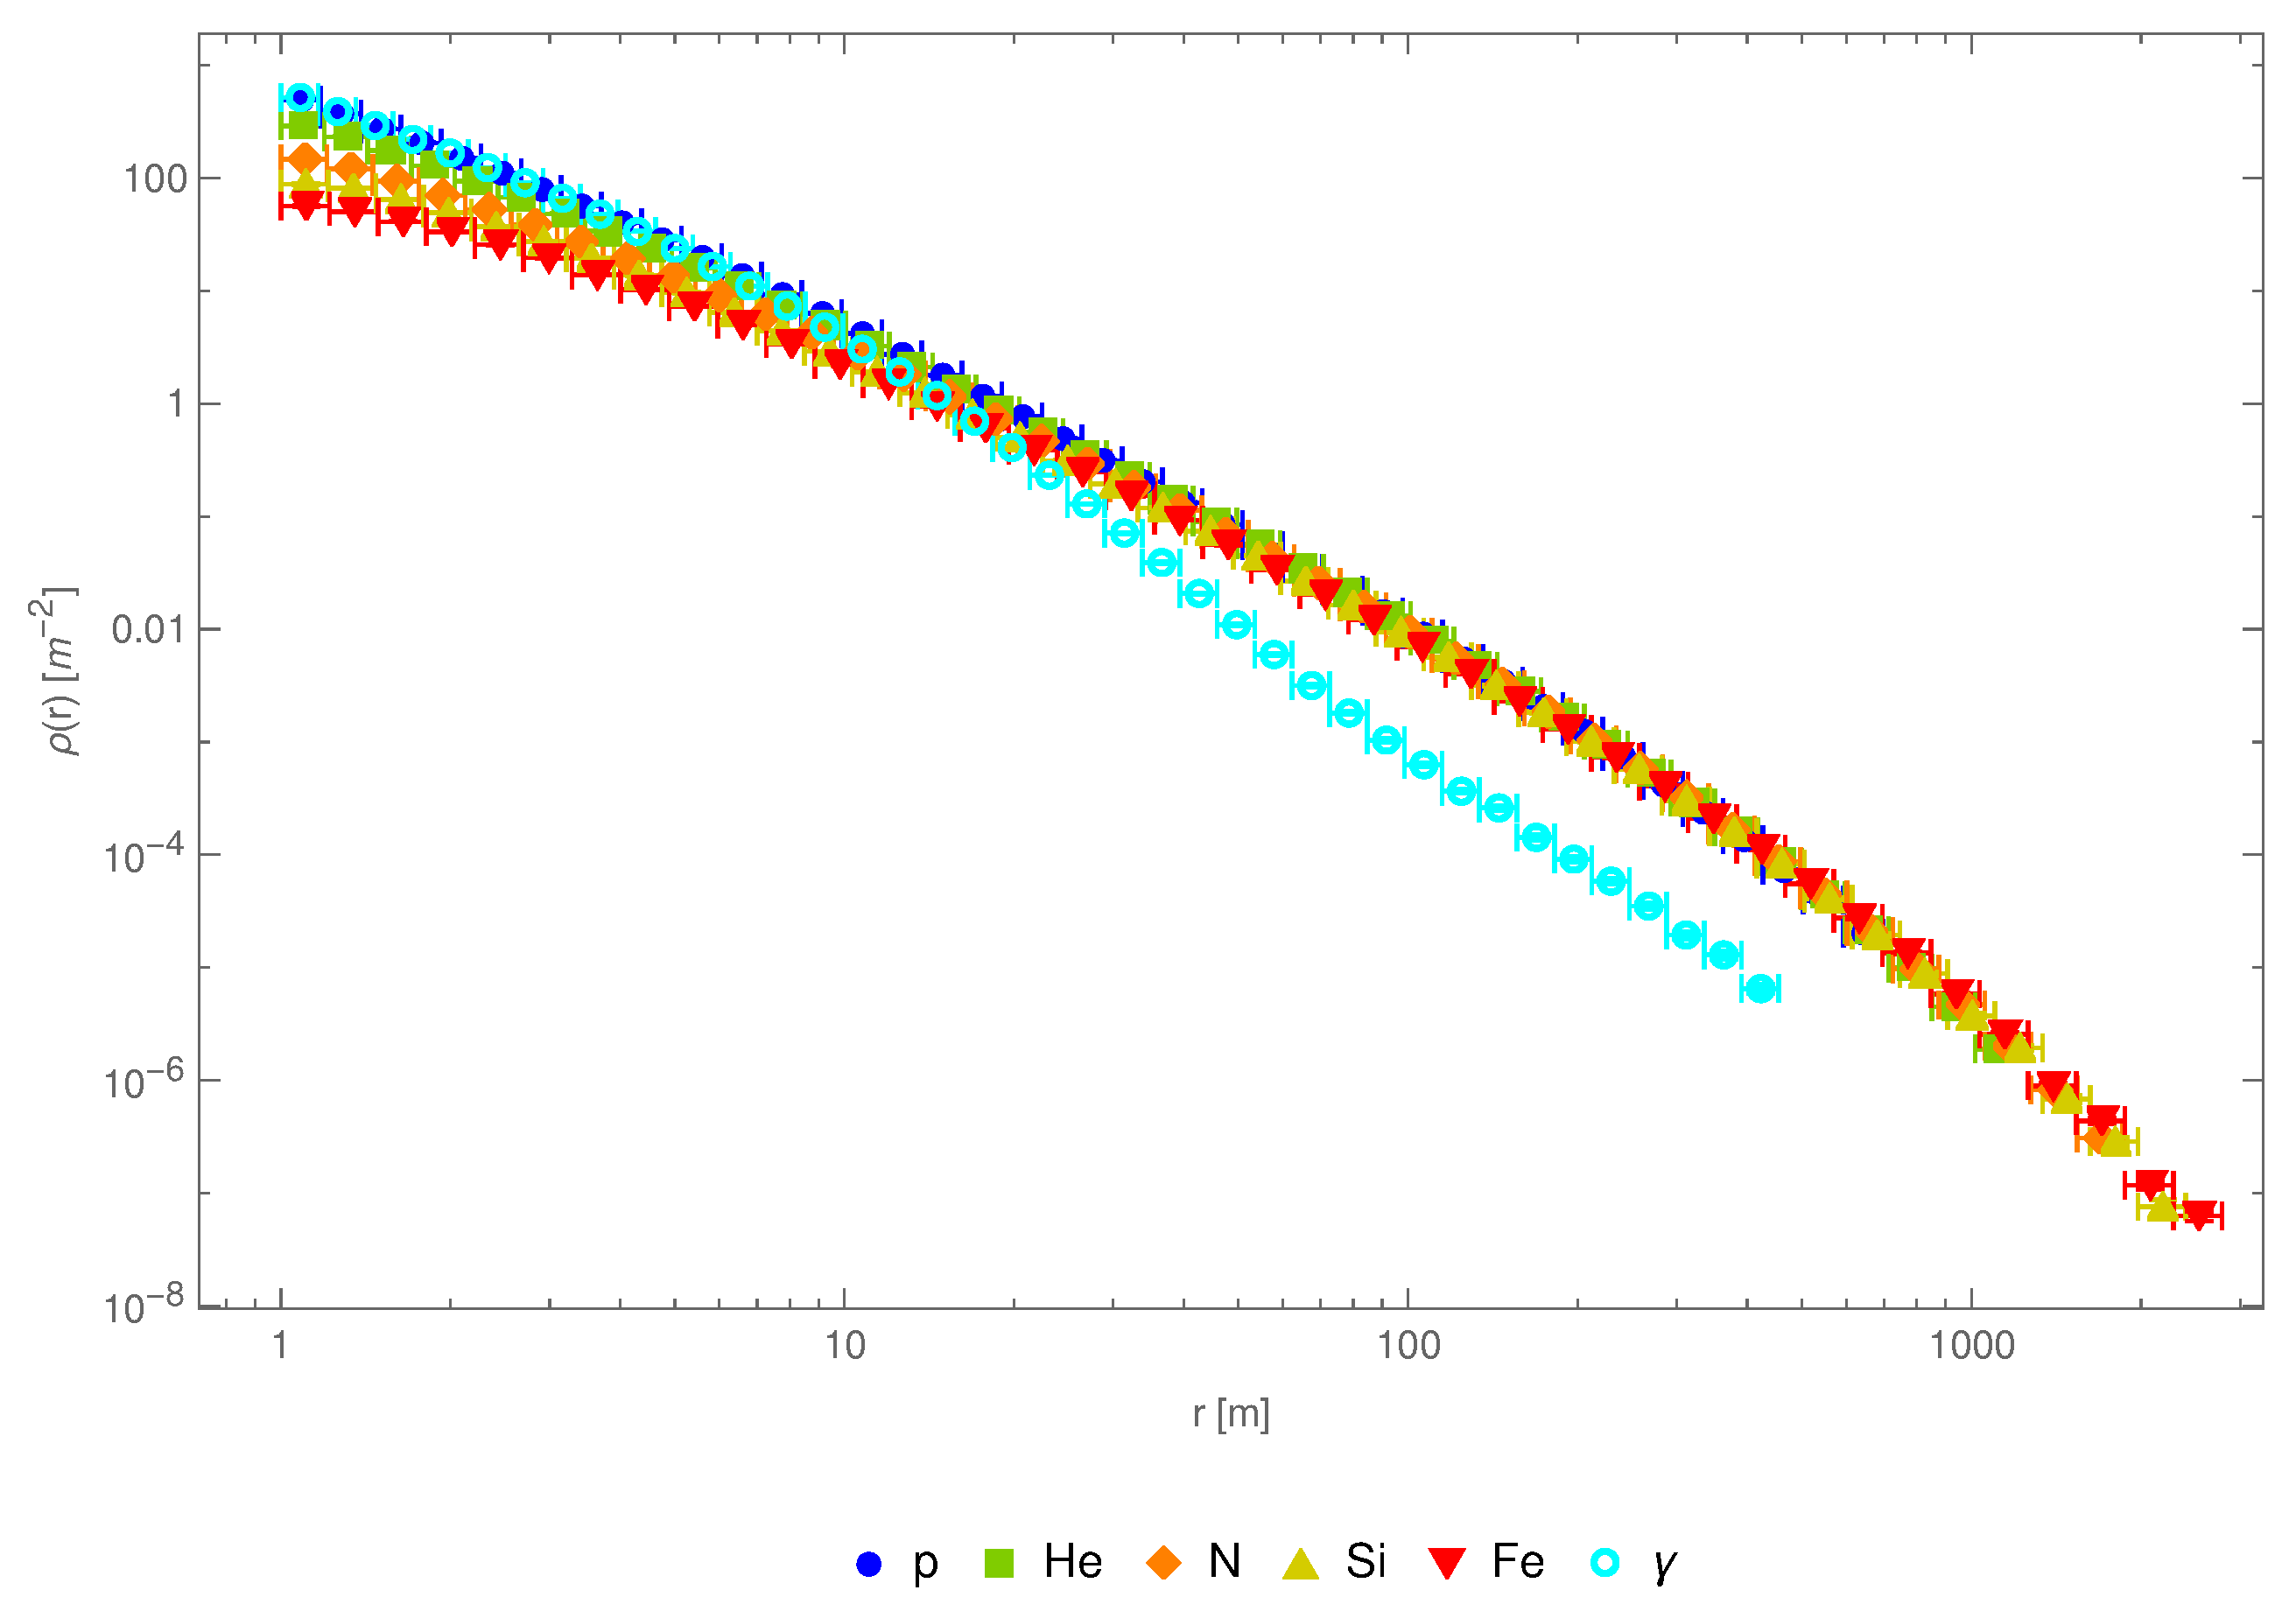
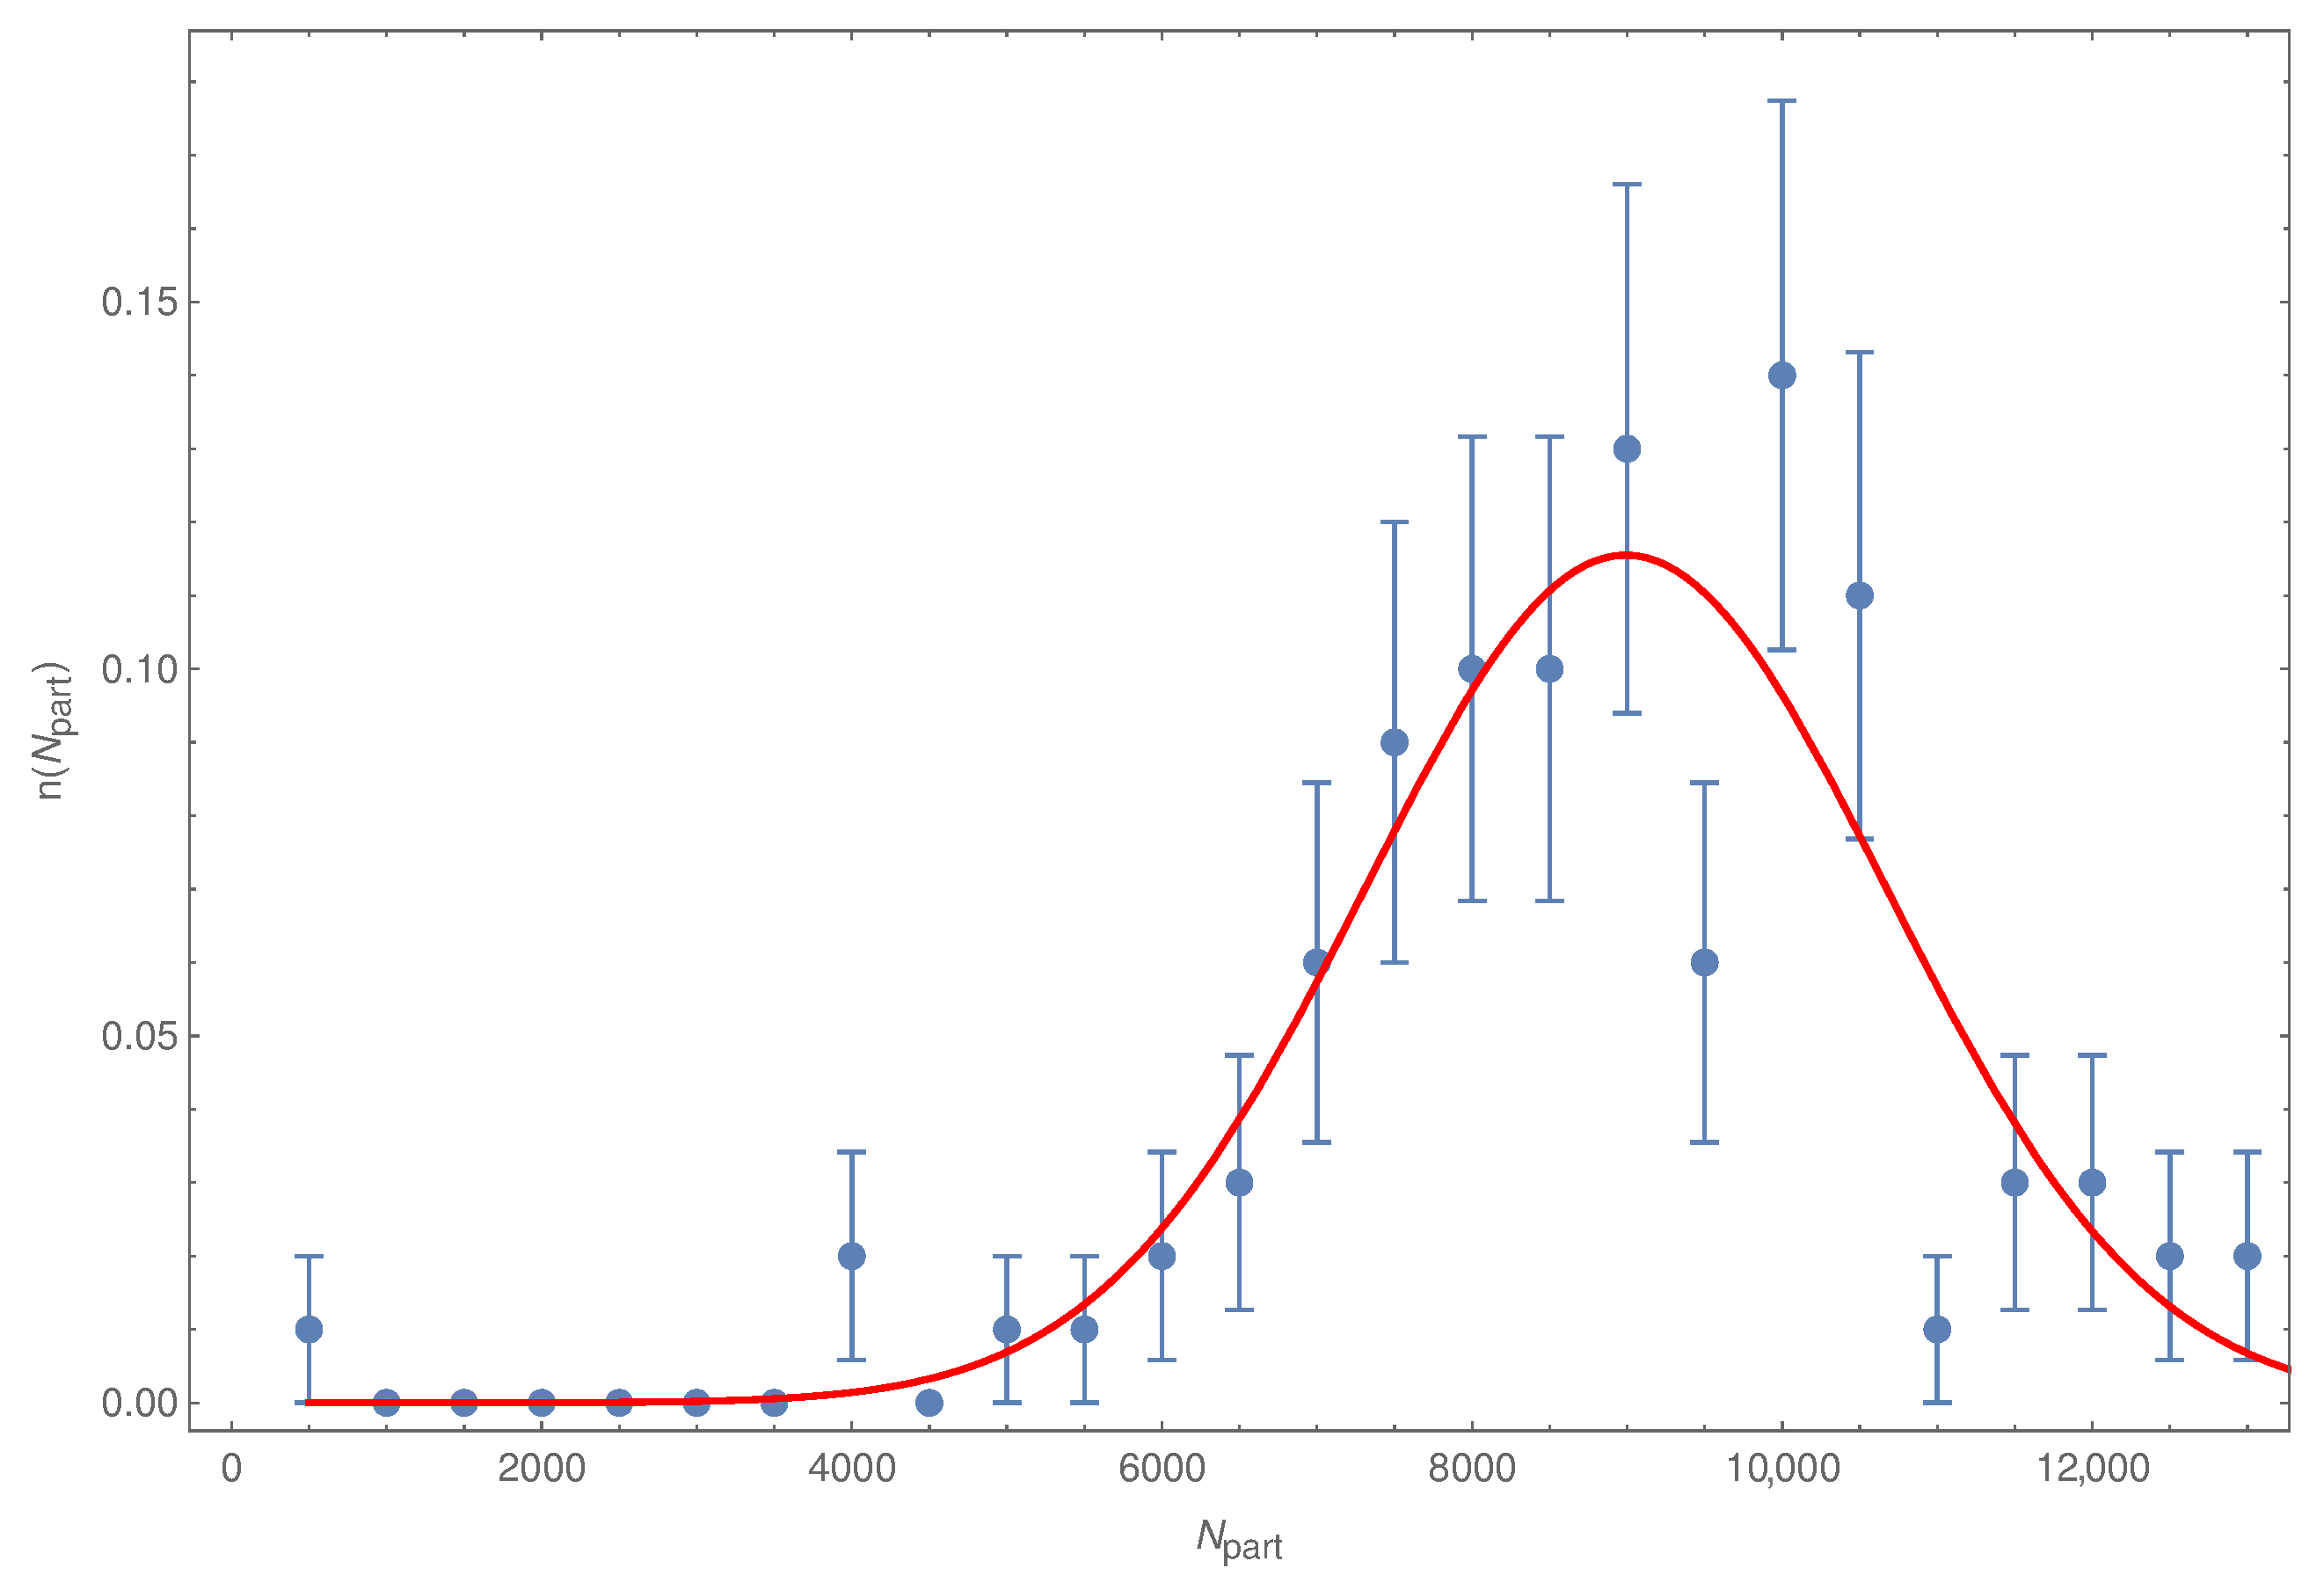
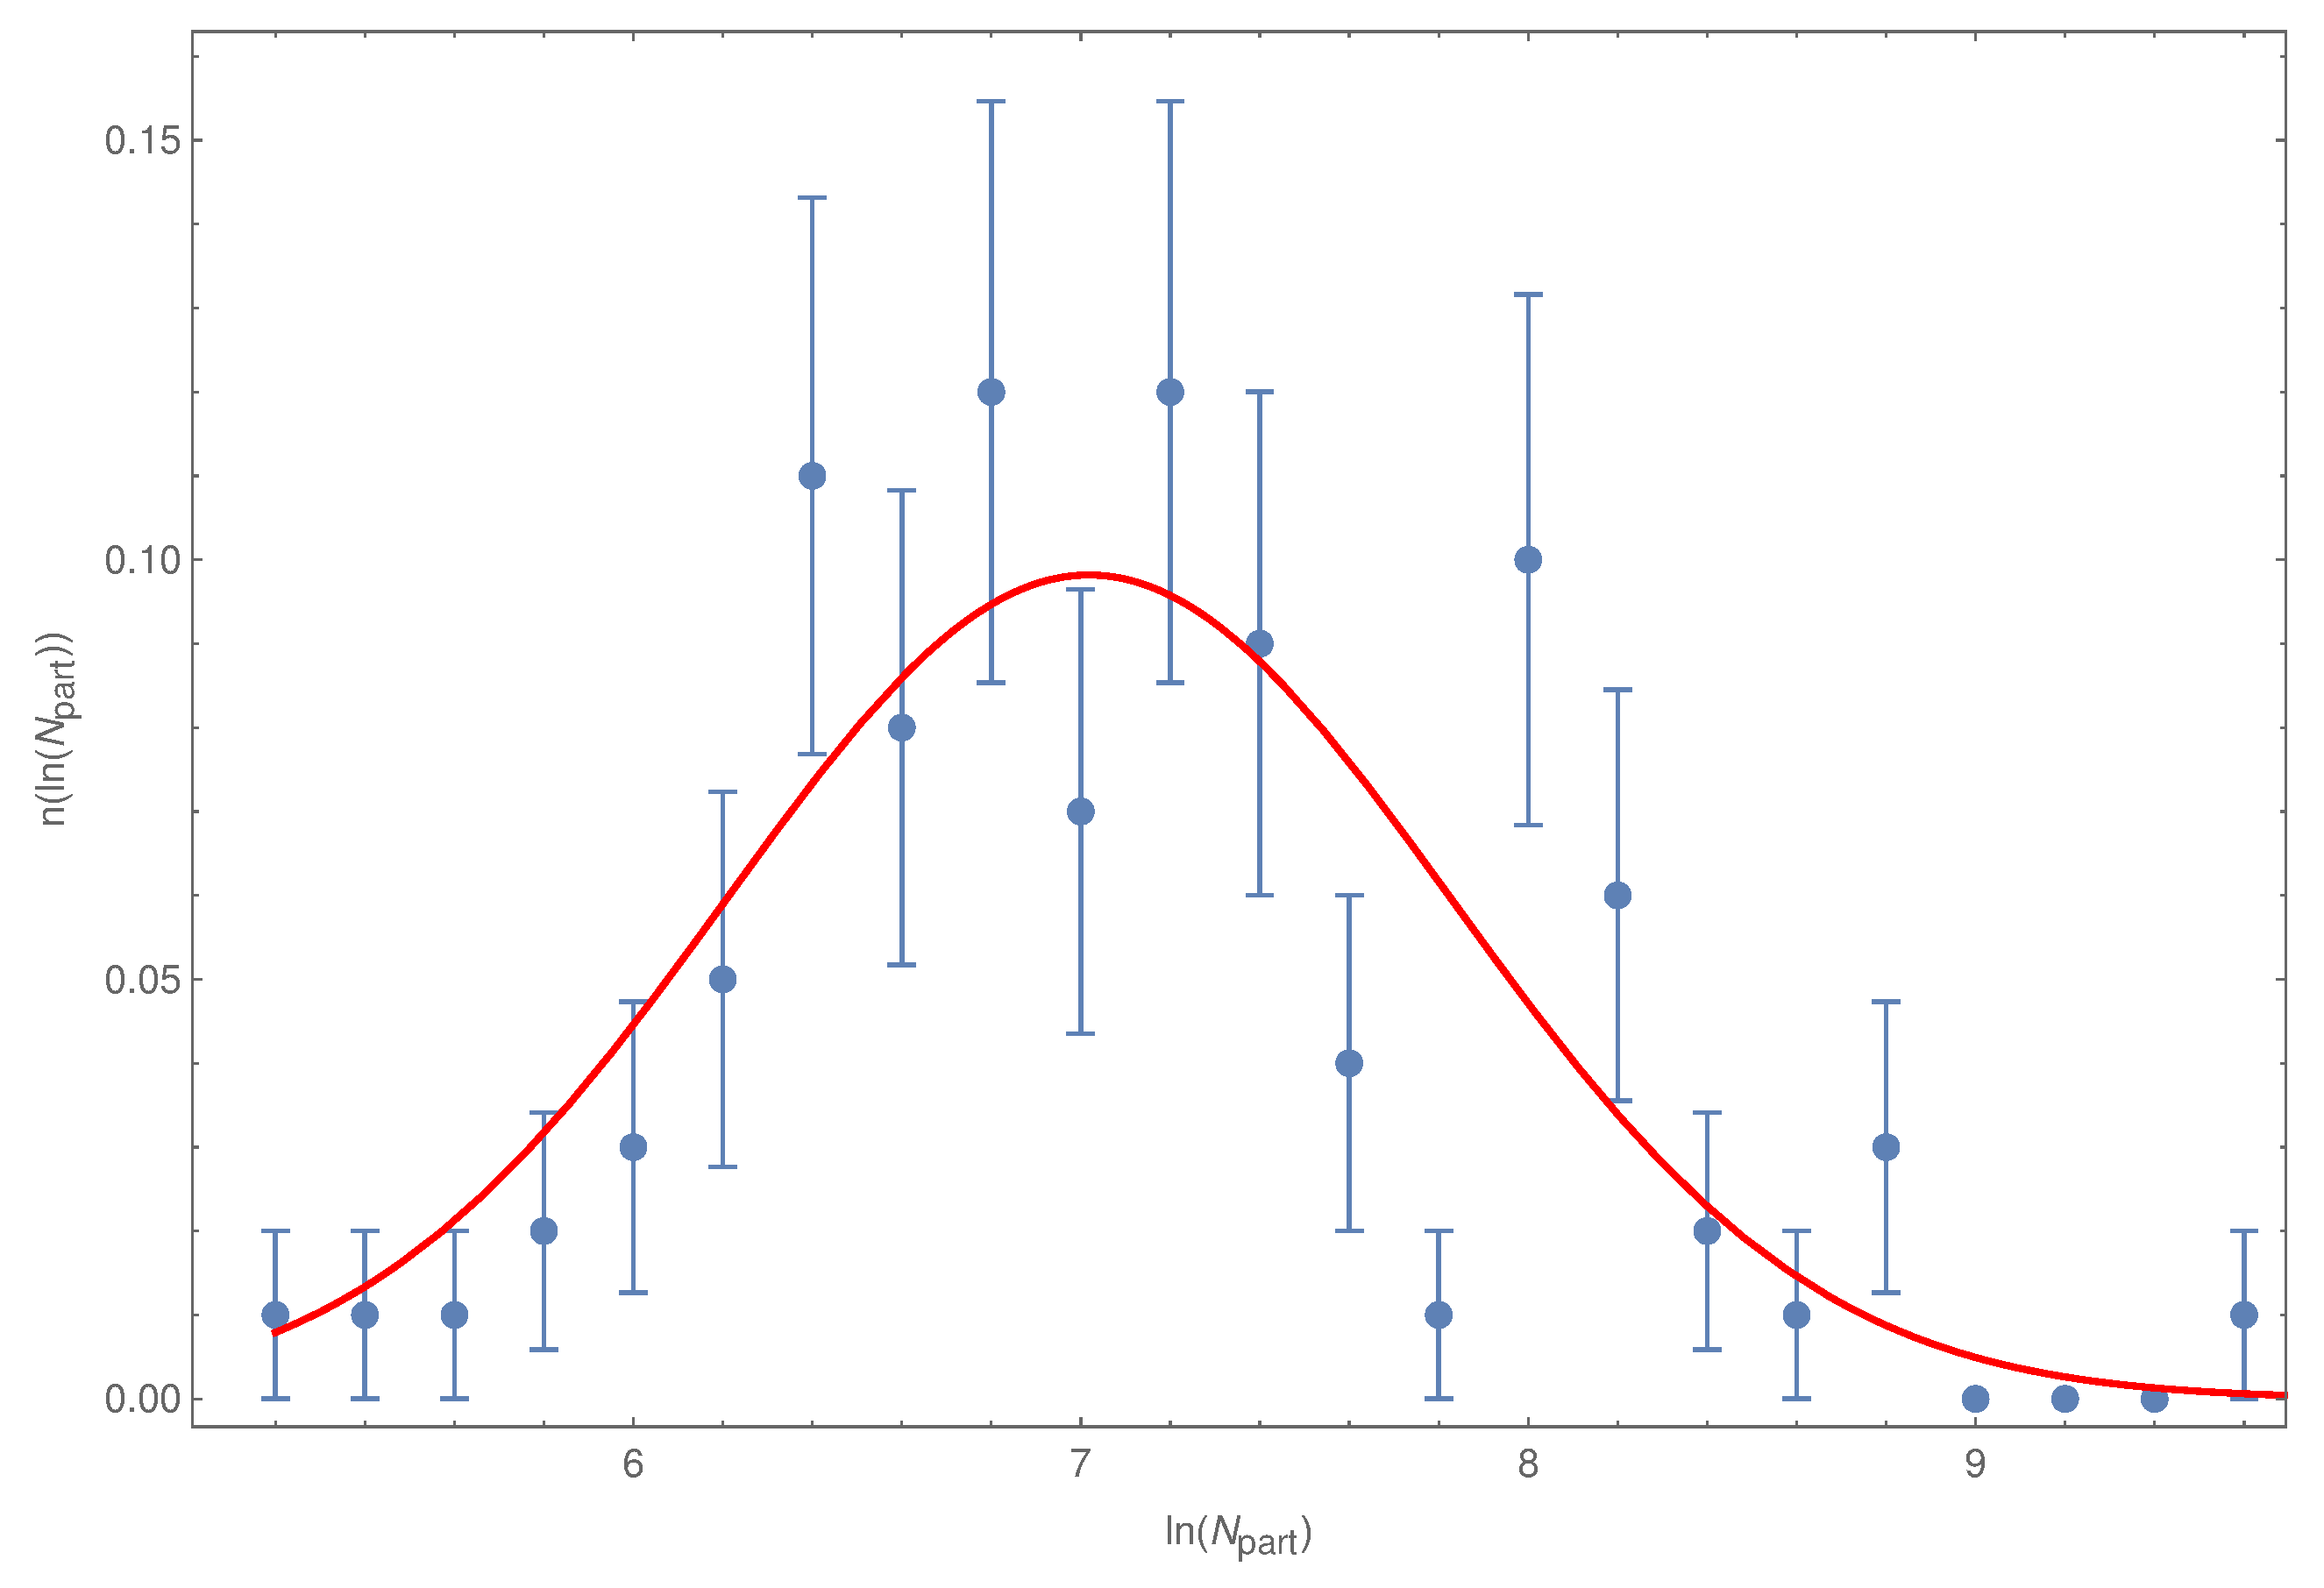
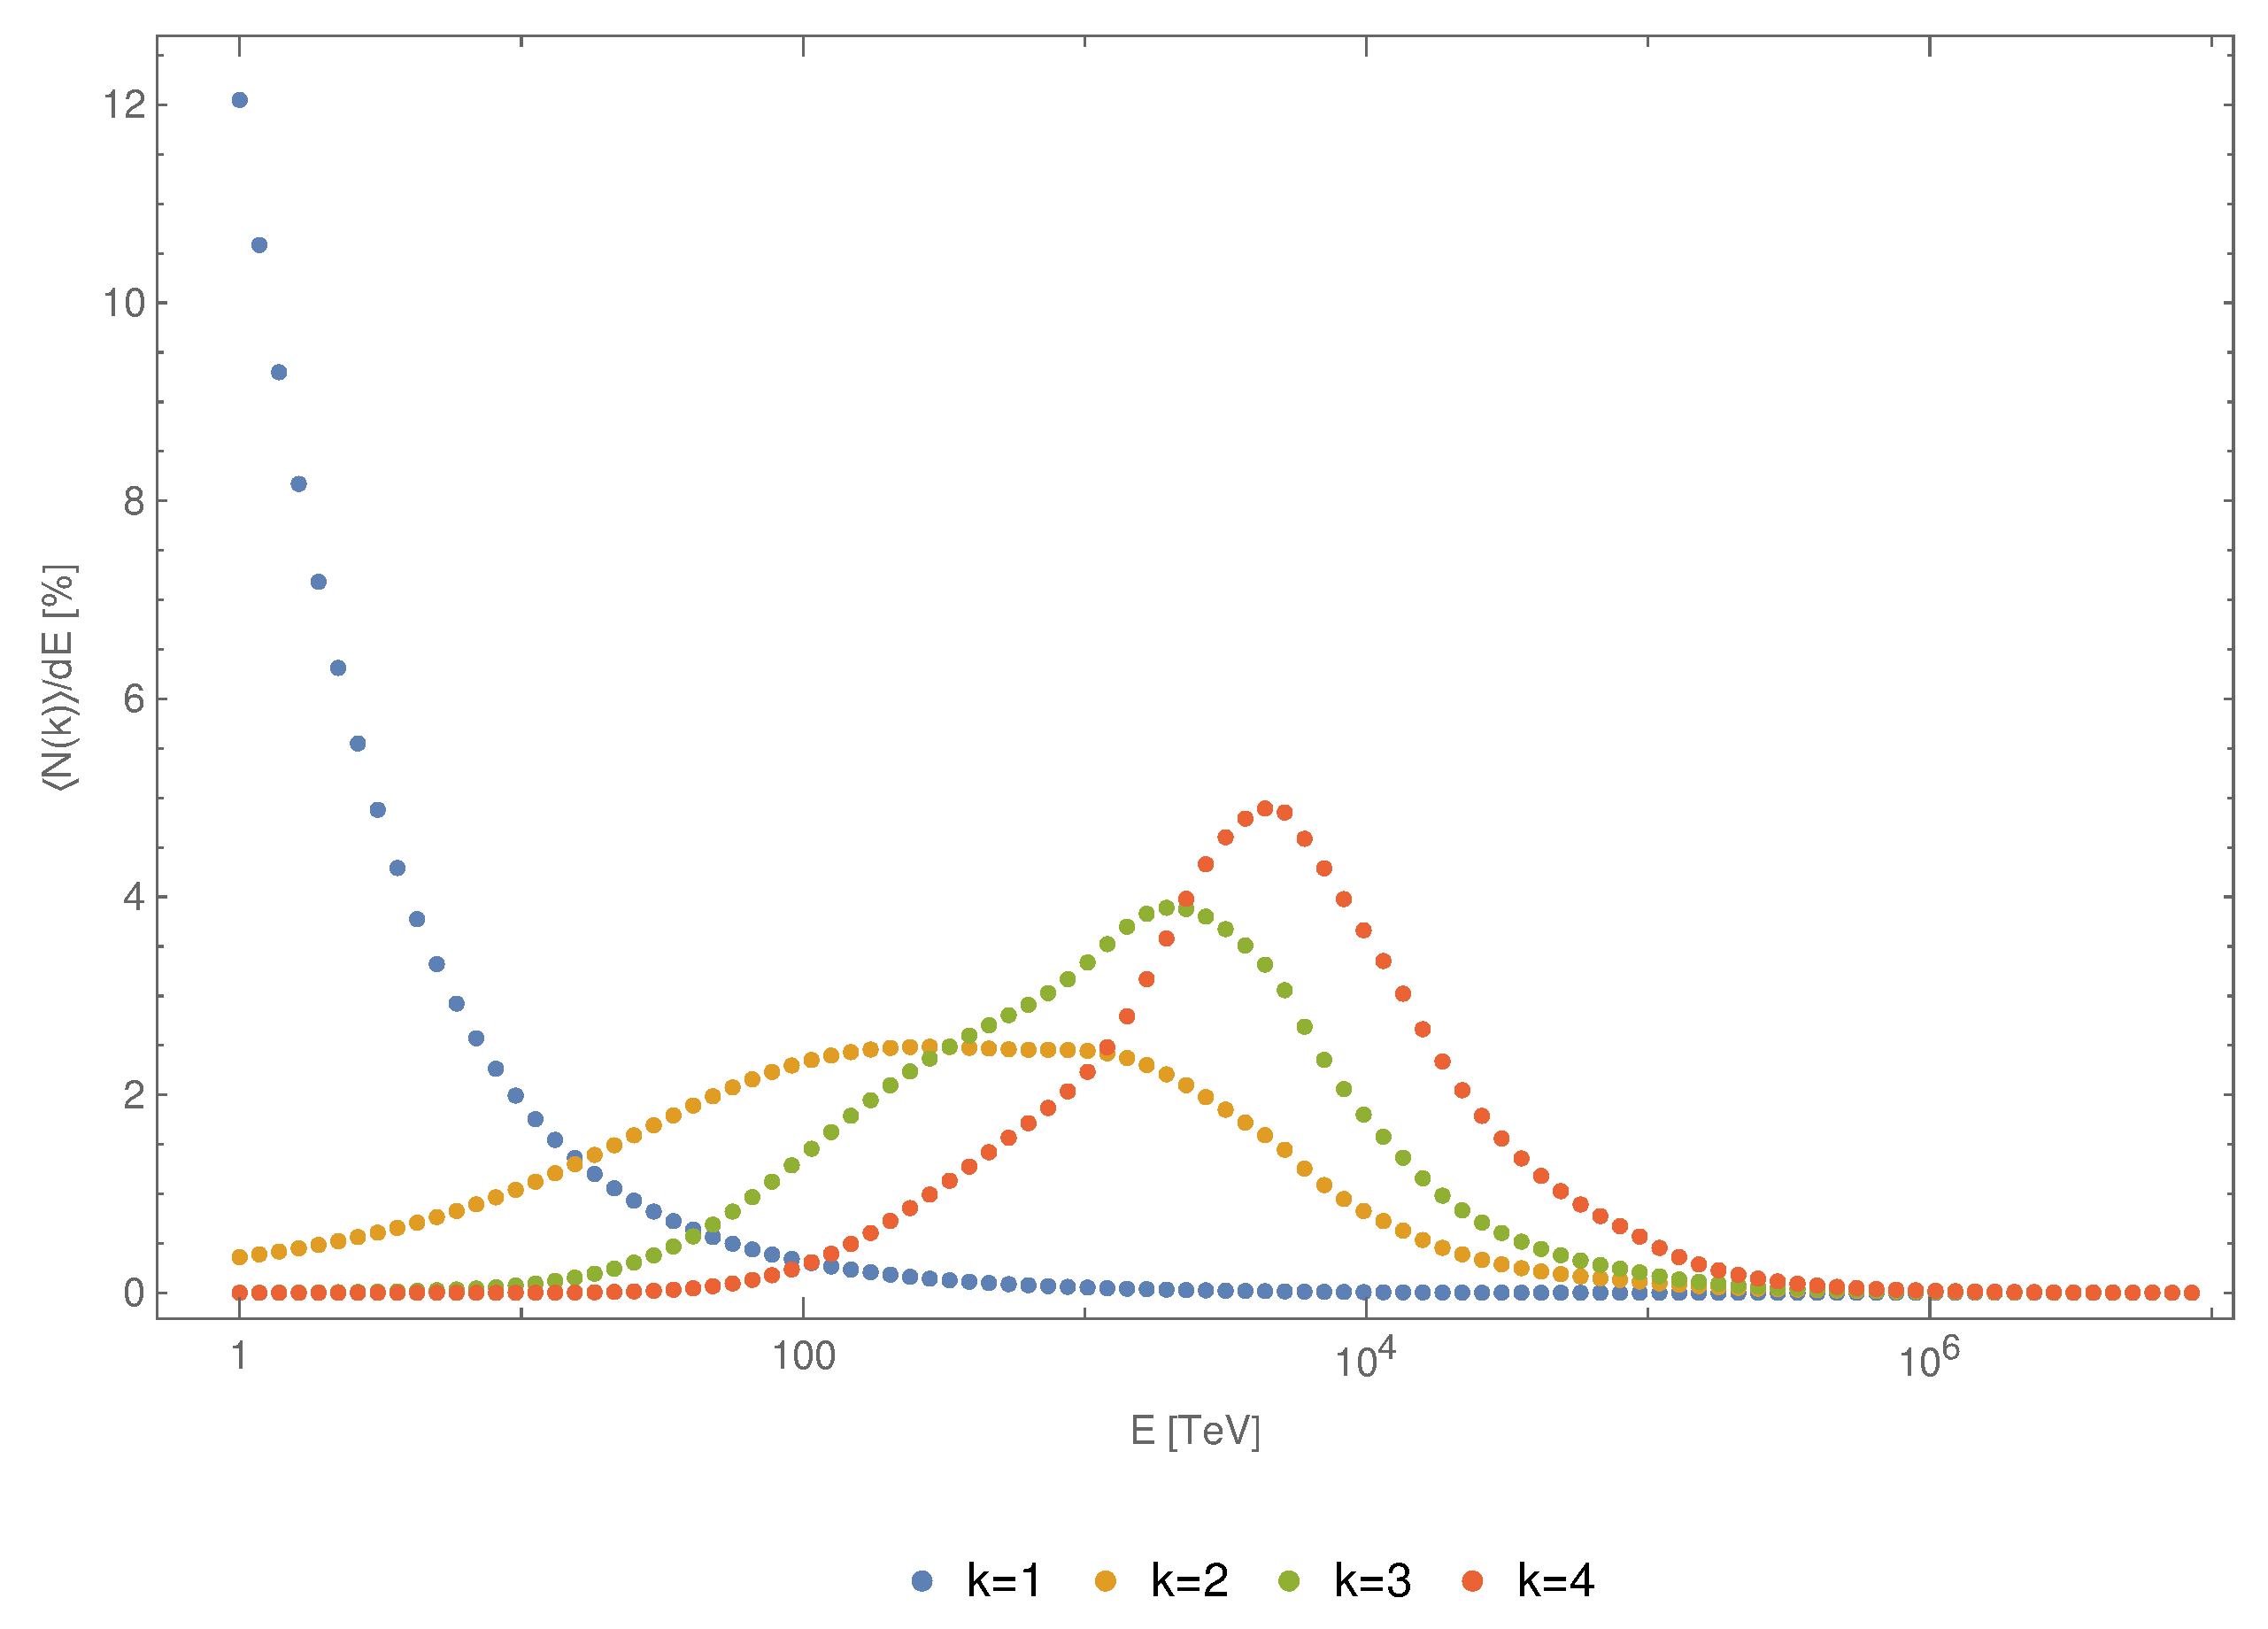
- —the number of particles produced in the shower which reach the ground level, , is strongly correlated with the (unknown) altitude at which the cascade started to form. Thus, depending on the actual development of the cascade at a given energy, not only the total number of particles fluctuates around average , but also the dependence on the distance r is slightly changing. This factor relates fluctuations in the total number of produced particles with a density profile of the EAS. Figure 3 presents the correction which needs to be applied to account for this effect.
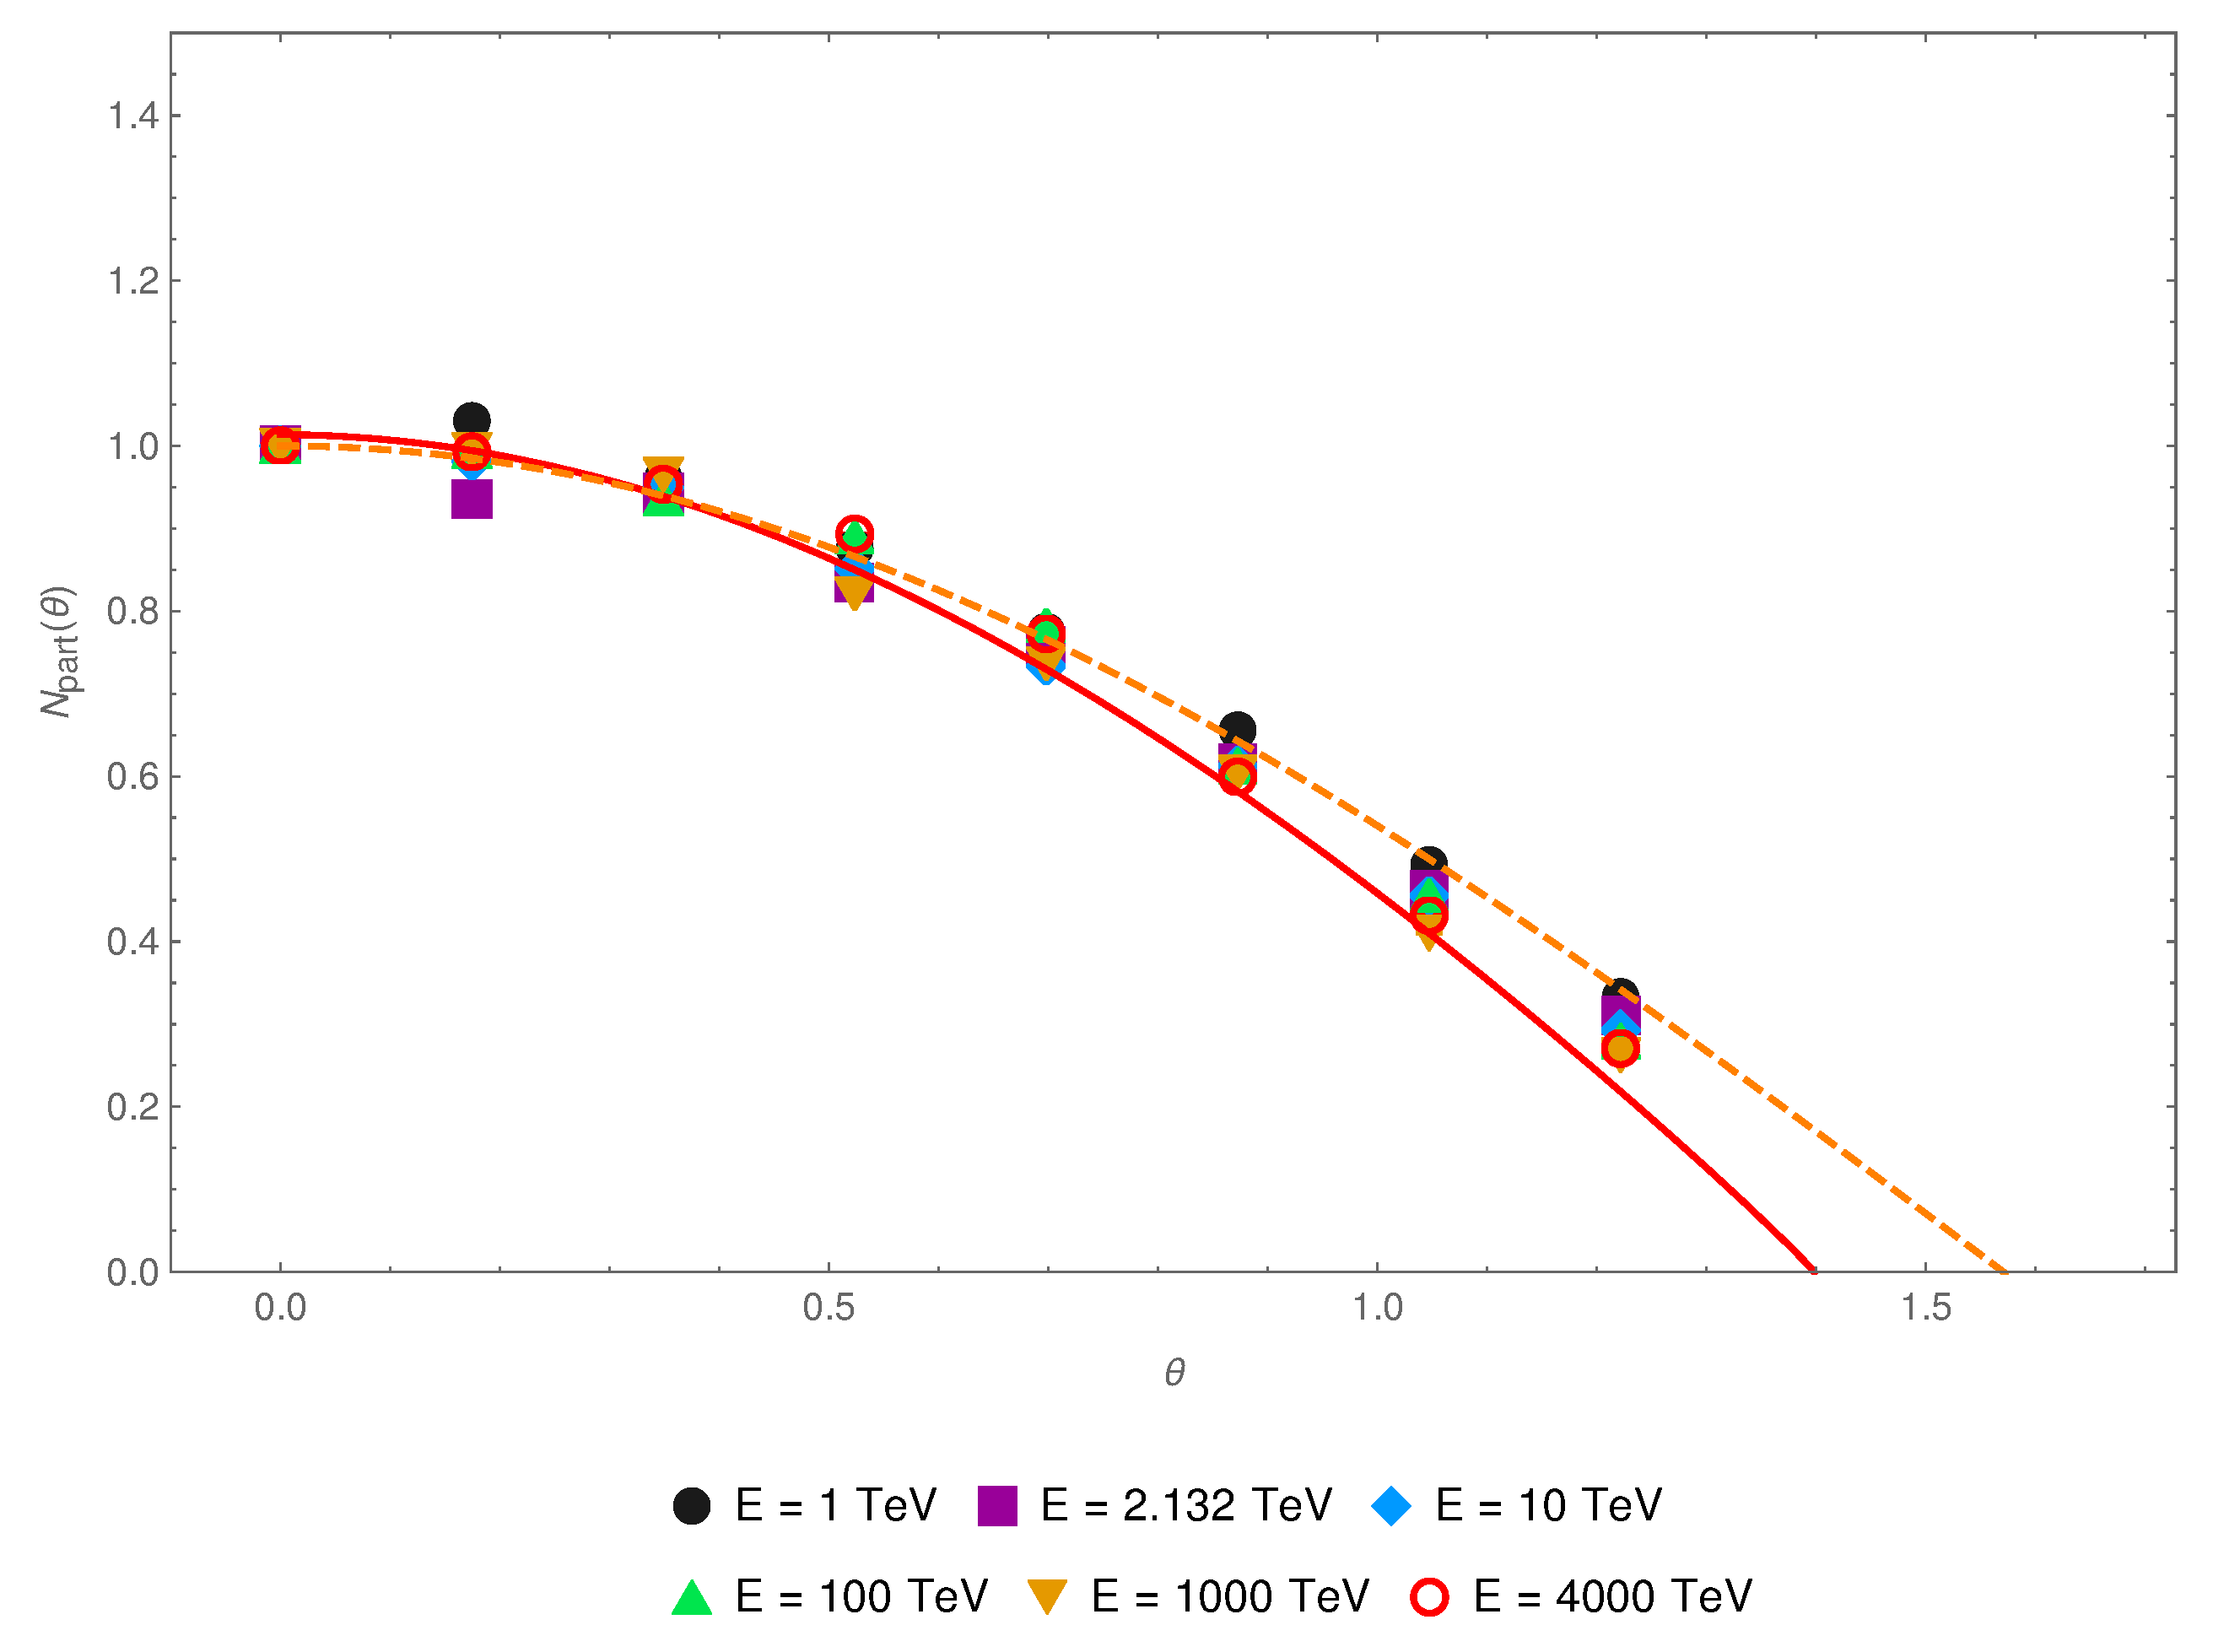
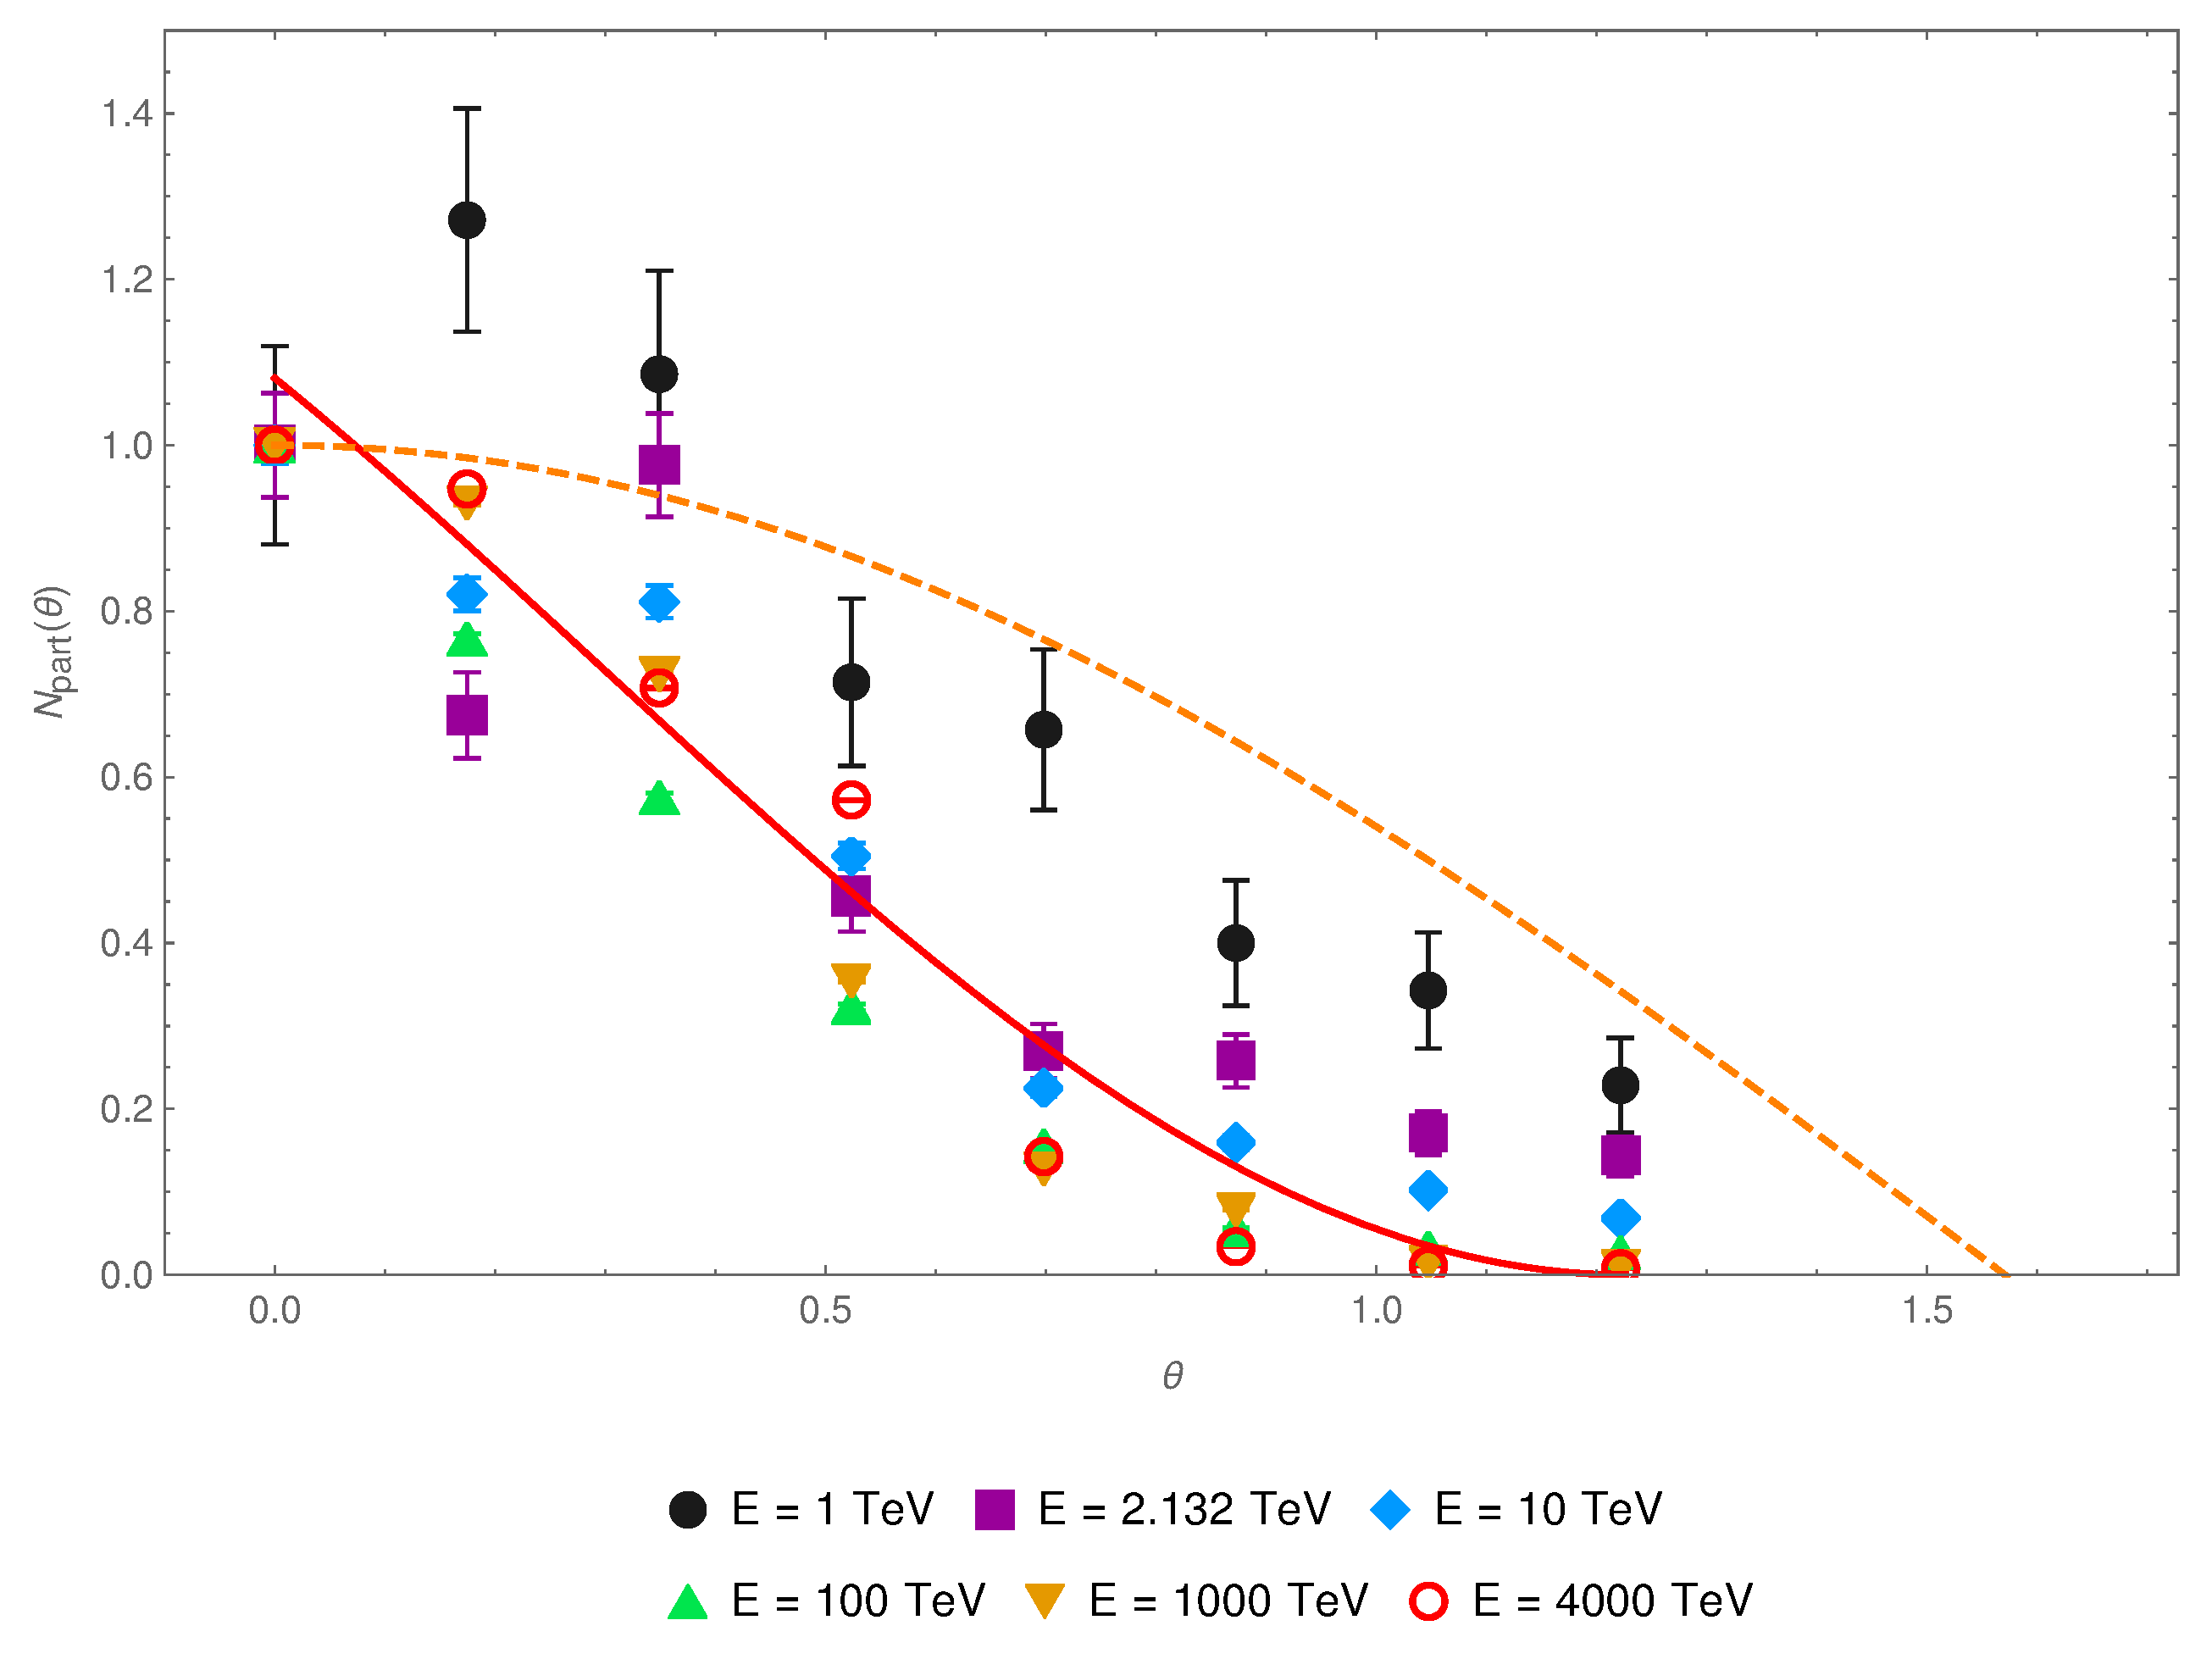
- —is a factor which relates the secondary particle density with the zenith angle of the primary cosmic-ray particle. Considering only geometrical effects for a flat detector on the ground, it should decrease as . However, the way in which the angle of incidence modifies particle density on the ground is more complicated, as it is affected by the varying thickness of the atmosphere. This was analysed only briefly, assuming that, for fixed energy, the density changes the same way as the total number of particles reaching the ground. Figure 4 and Figure 5 present this relation. A function fitting this dependence and the dependence from simple geometrical considerations are the two alternatives considered in the analysis.
2.3. Background Estimation
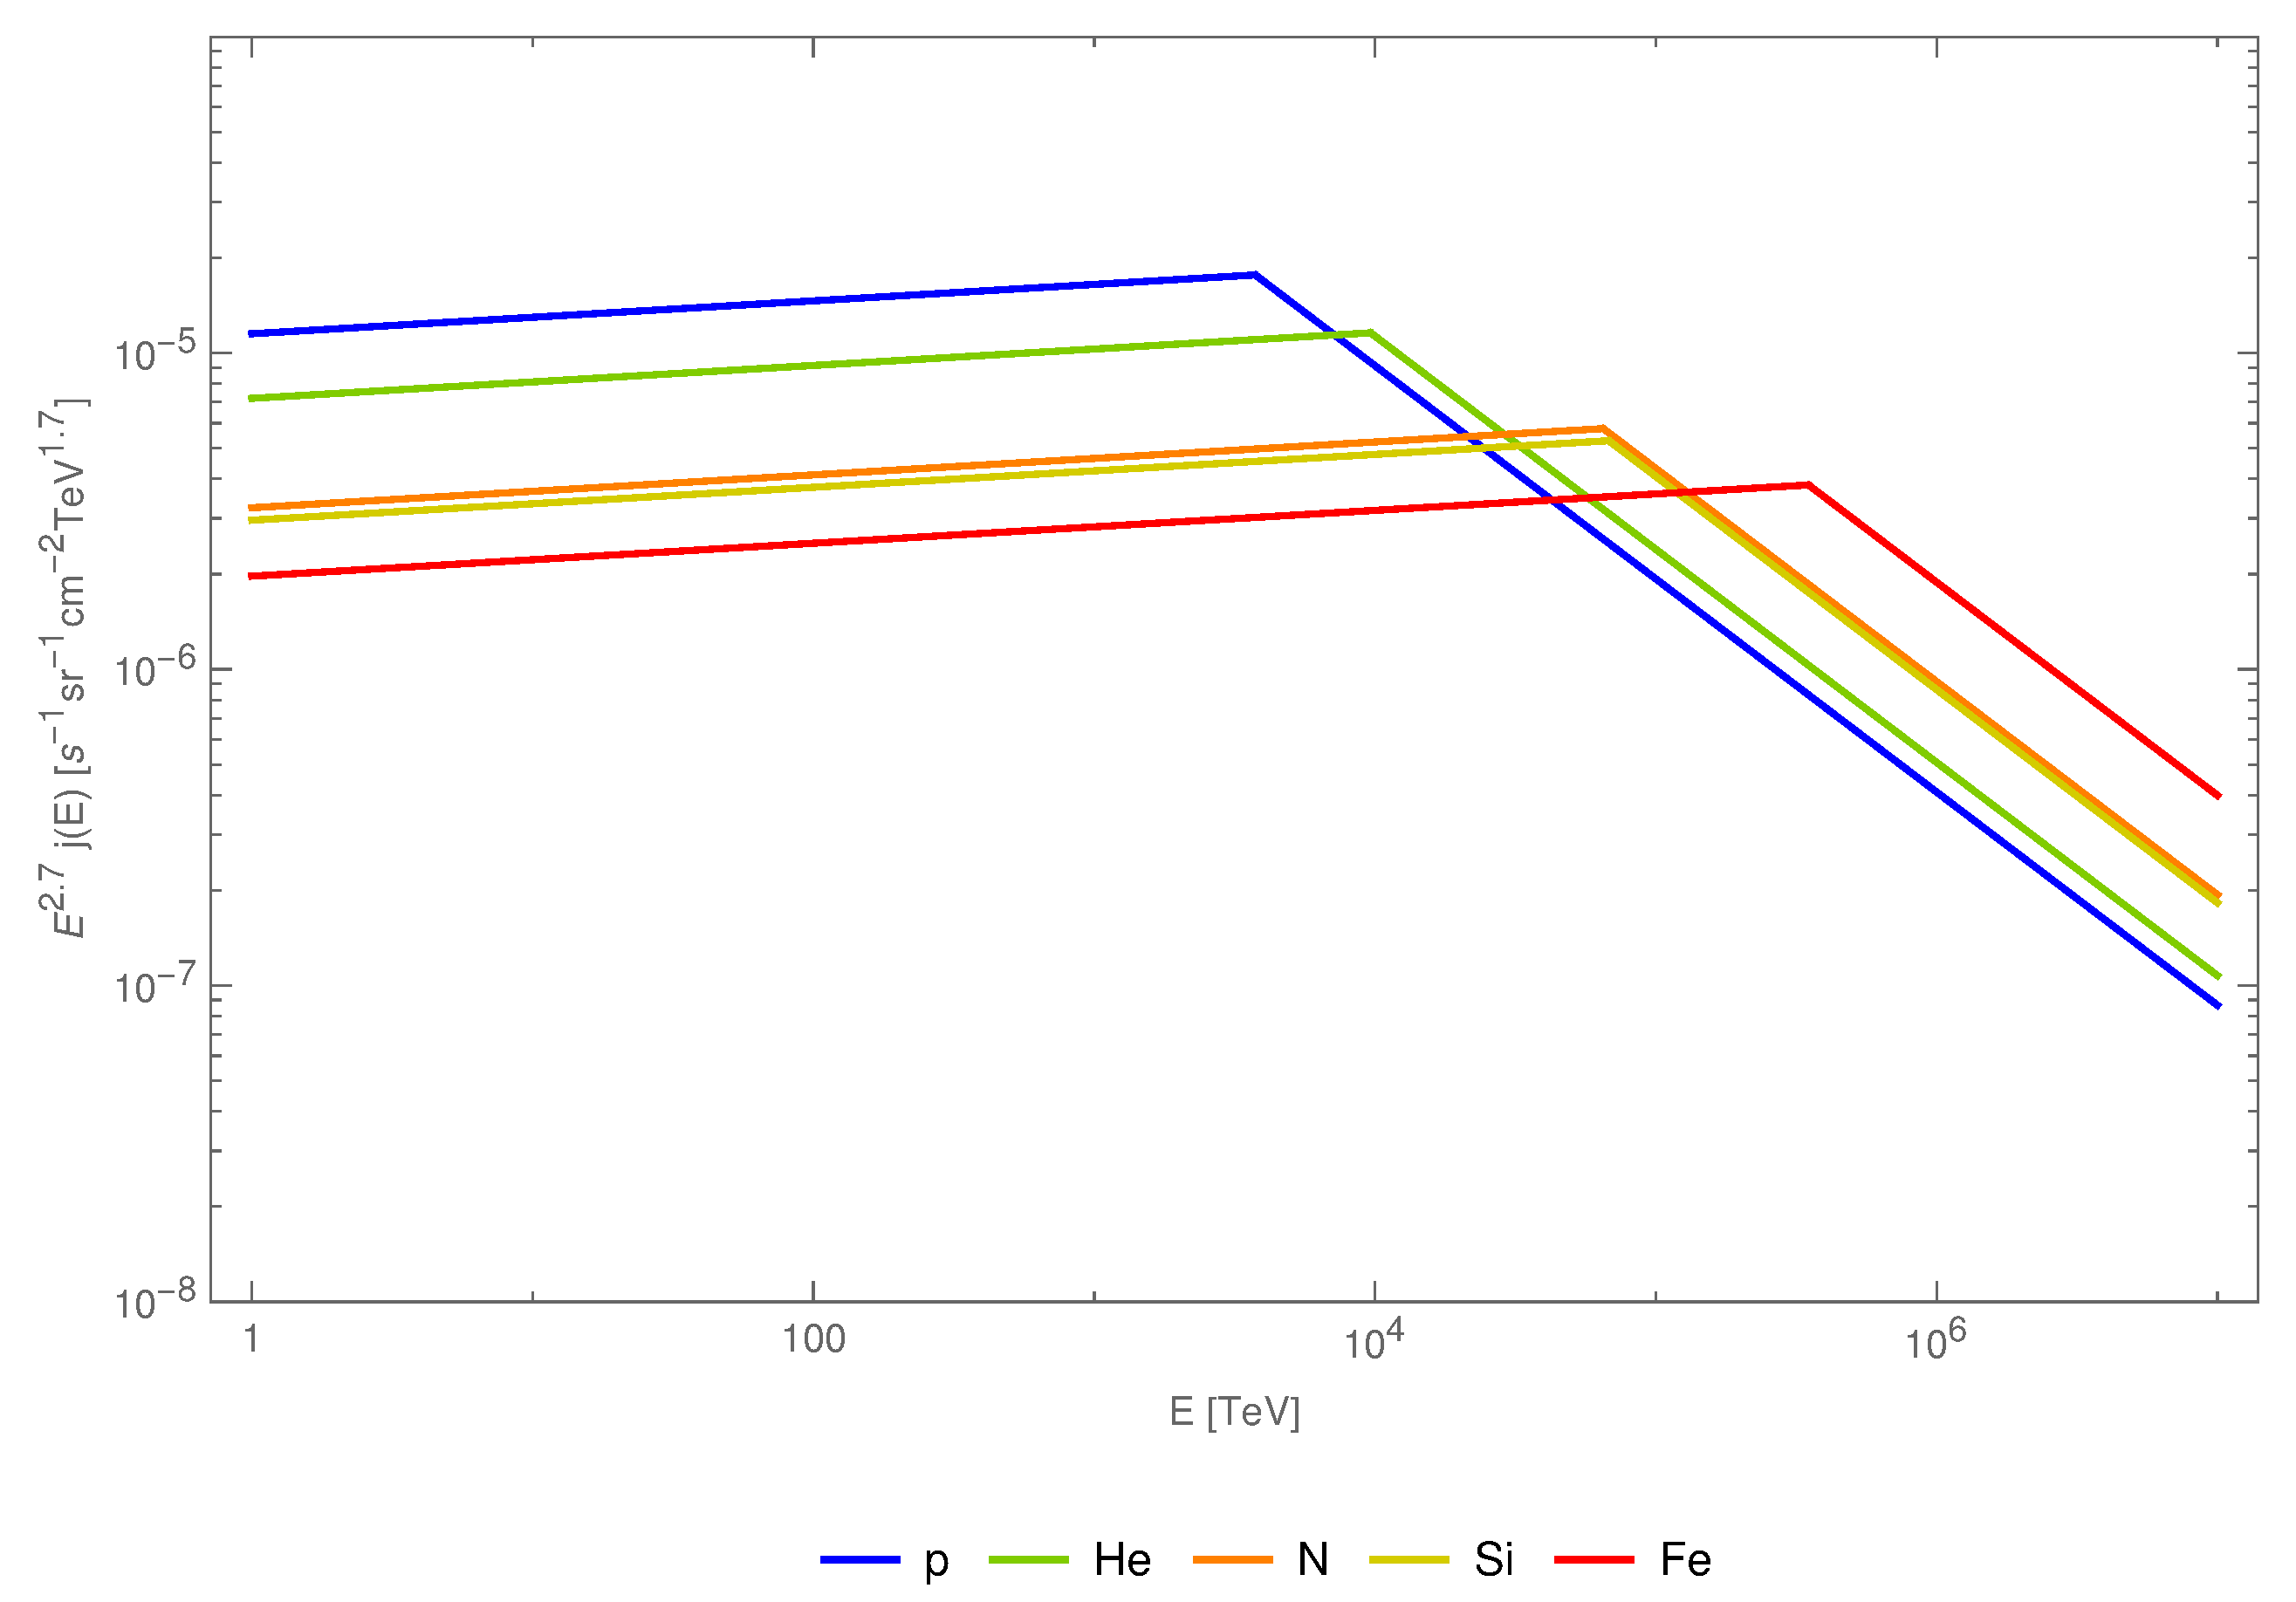
2.4. Cosmic-Ray Energy Spectra
2.5. Signal Estimation
3. Results
- Model 2—in place of dependence obtained from the fit, the simple geometrical correction is used, in order to estimate how large change related to the zenith angle dependence may be expected;
- Model 3—in place of complicated version of a simple linear approximation is used:,which changes the normalisation but does not modify the dependence on r;
- Model 4—uses both simplified versions of the functions and linear version of ;
- Model 5—uses particle density defined as a function of distance r and the number of particles which reach the ground only—a commonly accepted approximation for muons [17], described in details in Appendix A.2. As the appropriate function for electromagnetic component of EAS is not available in [17], the same functional form as for muons is used (even if it is obviously not accurate). The particle density is then modified by a scaling factor described earlier.
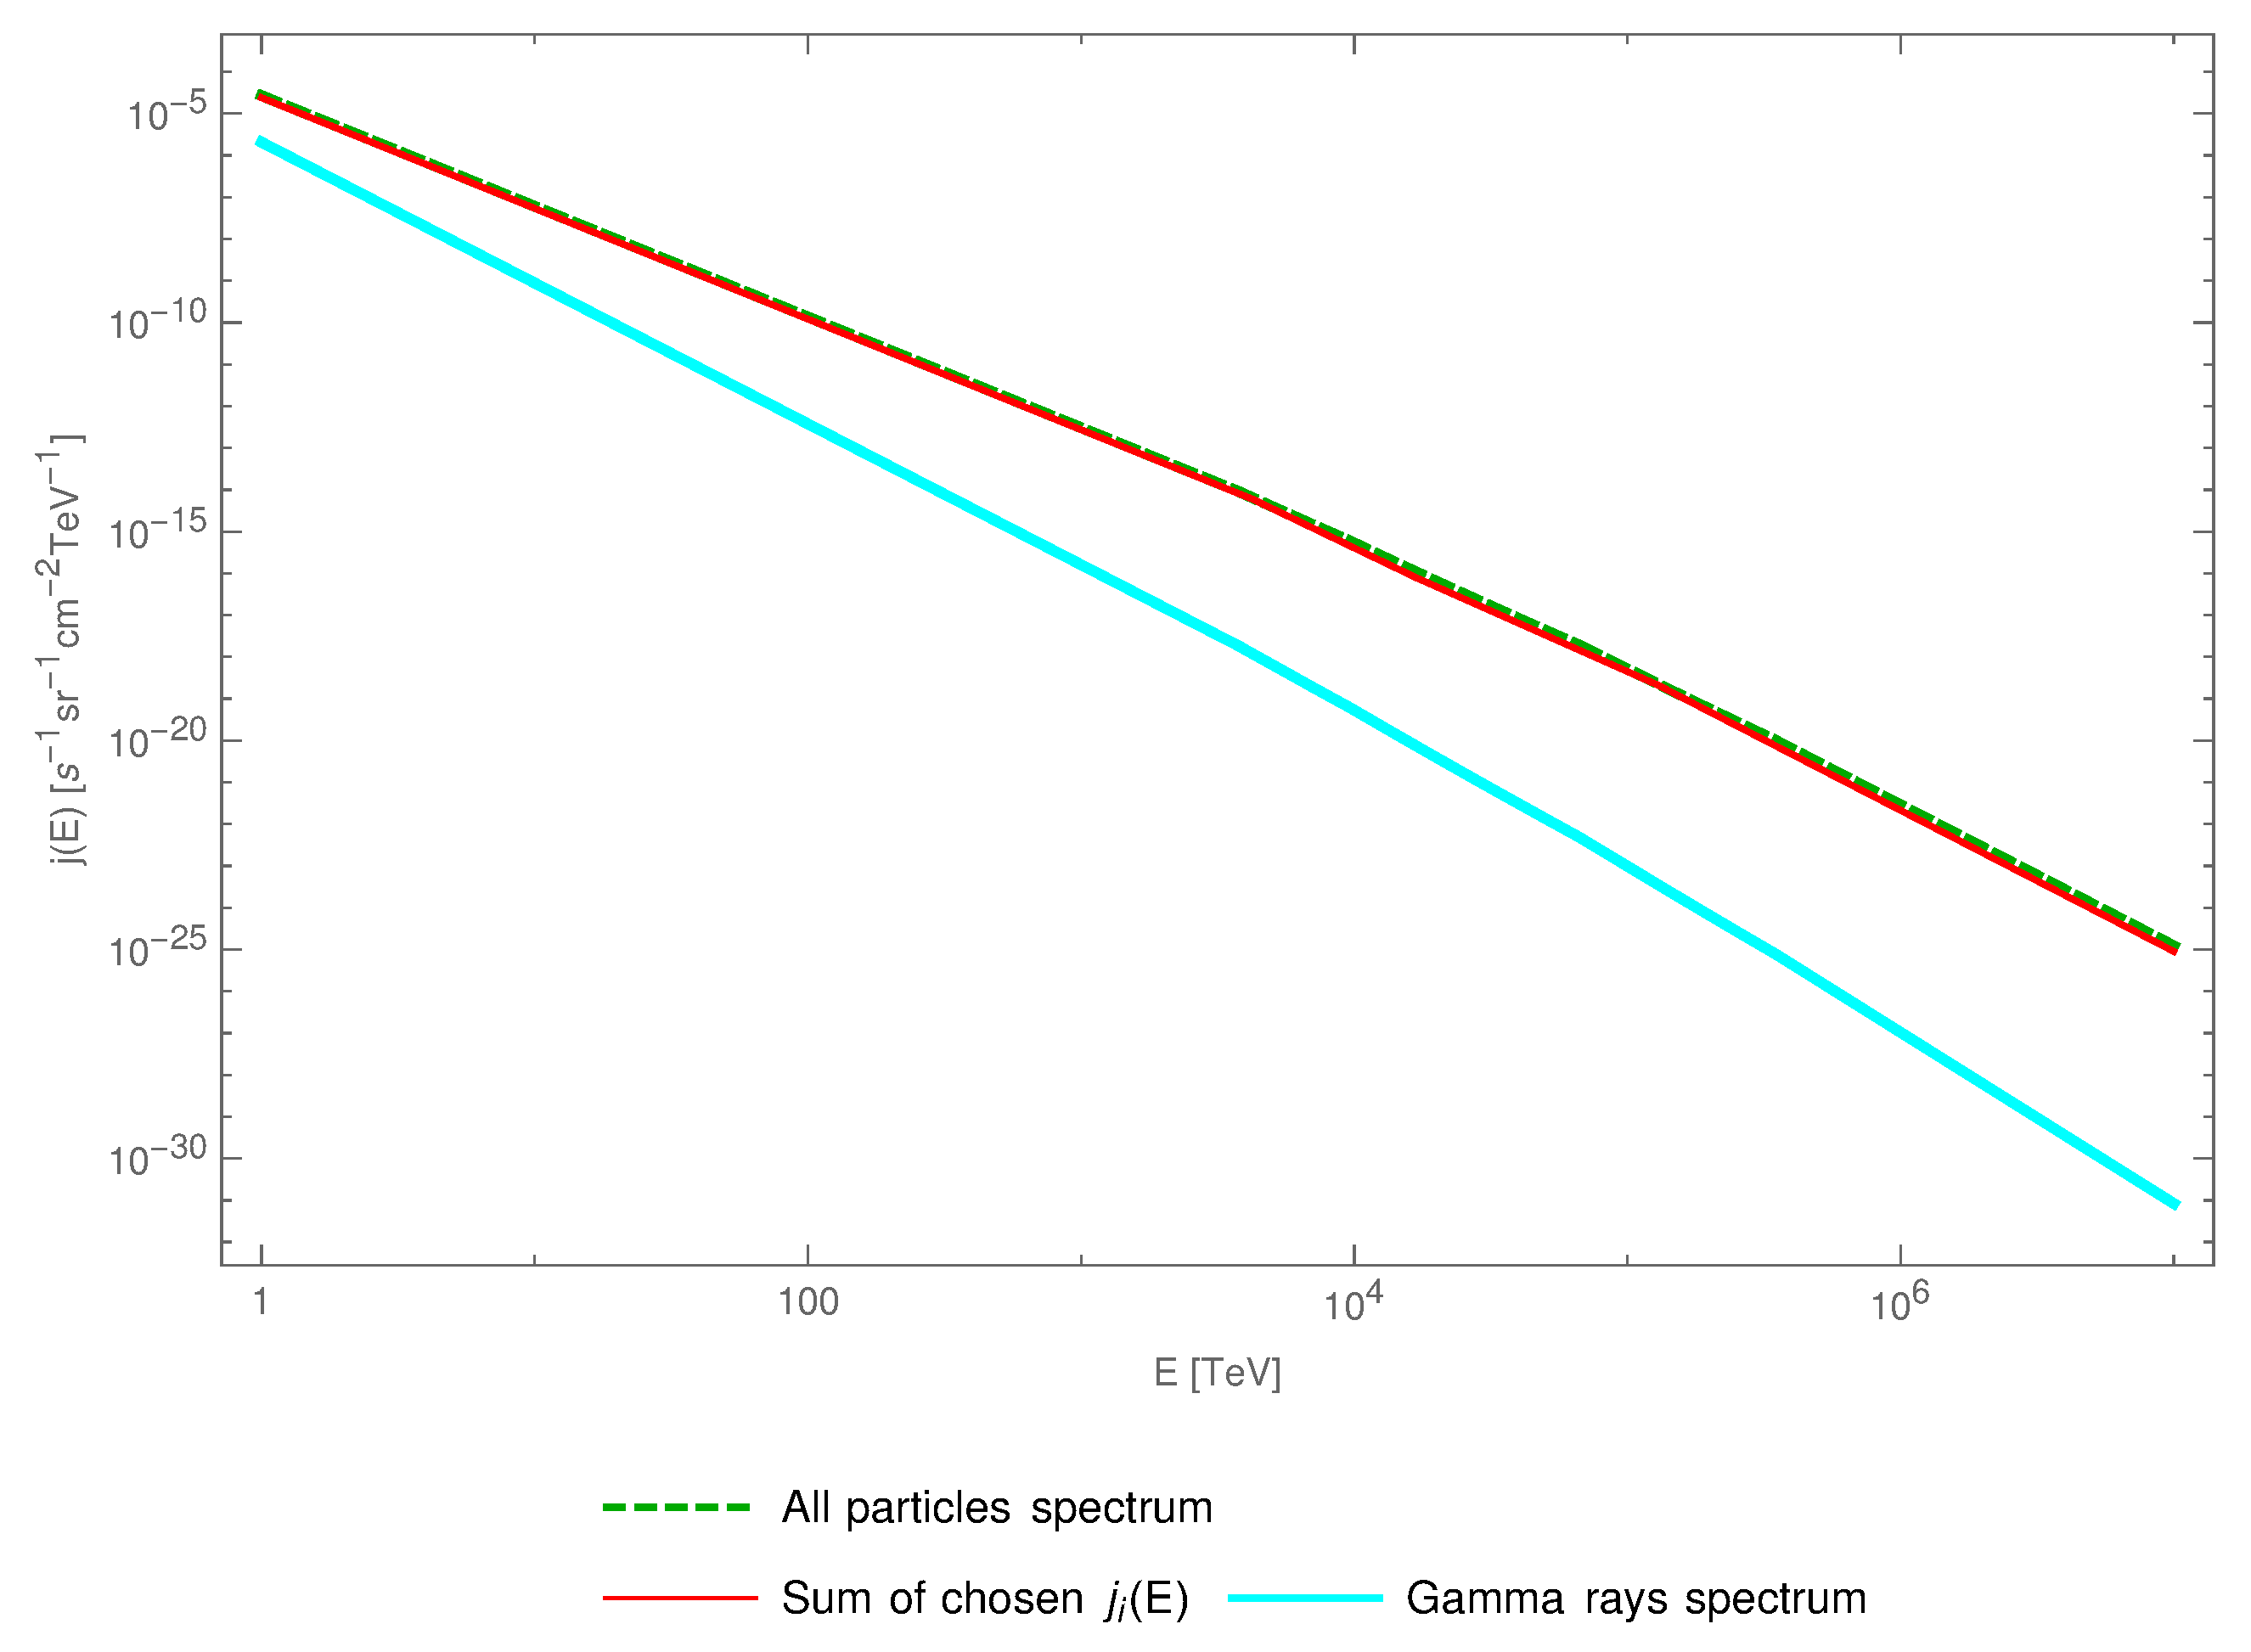
4. Photon Cascades
5. Conclusions
Author Contributions
Funding
Institutional Review Board Statement
Informed Consent Statement
Data Availability Statement
Acknowledgments
Conflicts of Interest
Abbreviations
| EAS | Extensive Air Shower |
| CREDO | Cosmic-Ray Extremely Distributed Observatory |
| CRE | Cosmic-Ray Ensembles |
Appendix A. Versions of ρ Function
Appendix A.1. Fitted Factors

| Factor | Form of the Function | Form of Parameters Functions |
|---|---|---|
| - | ||
| - | ||
Appendix A.2. Approximation of ρ in Model 5
Appendix B. Distance rmax nalysis

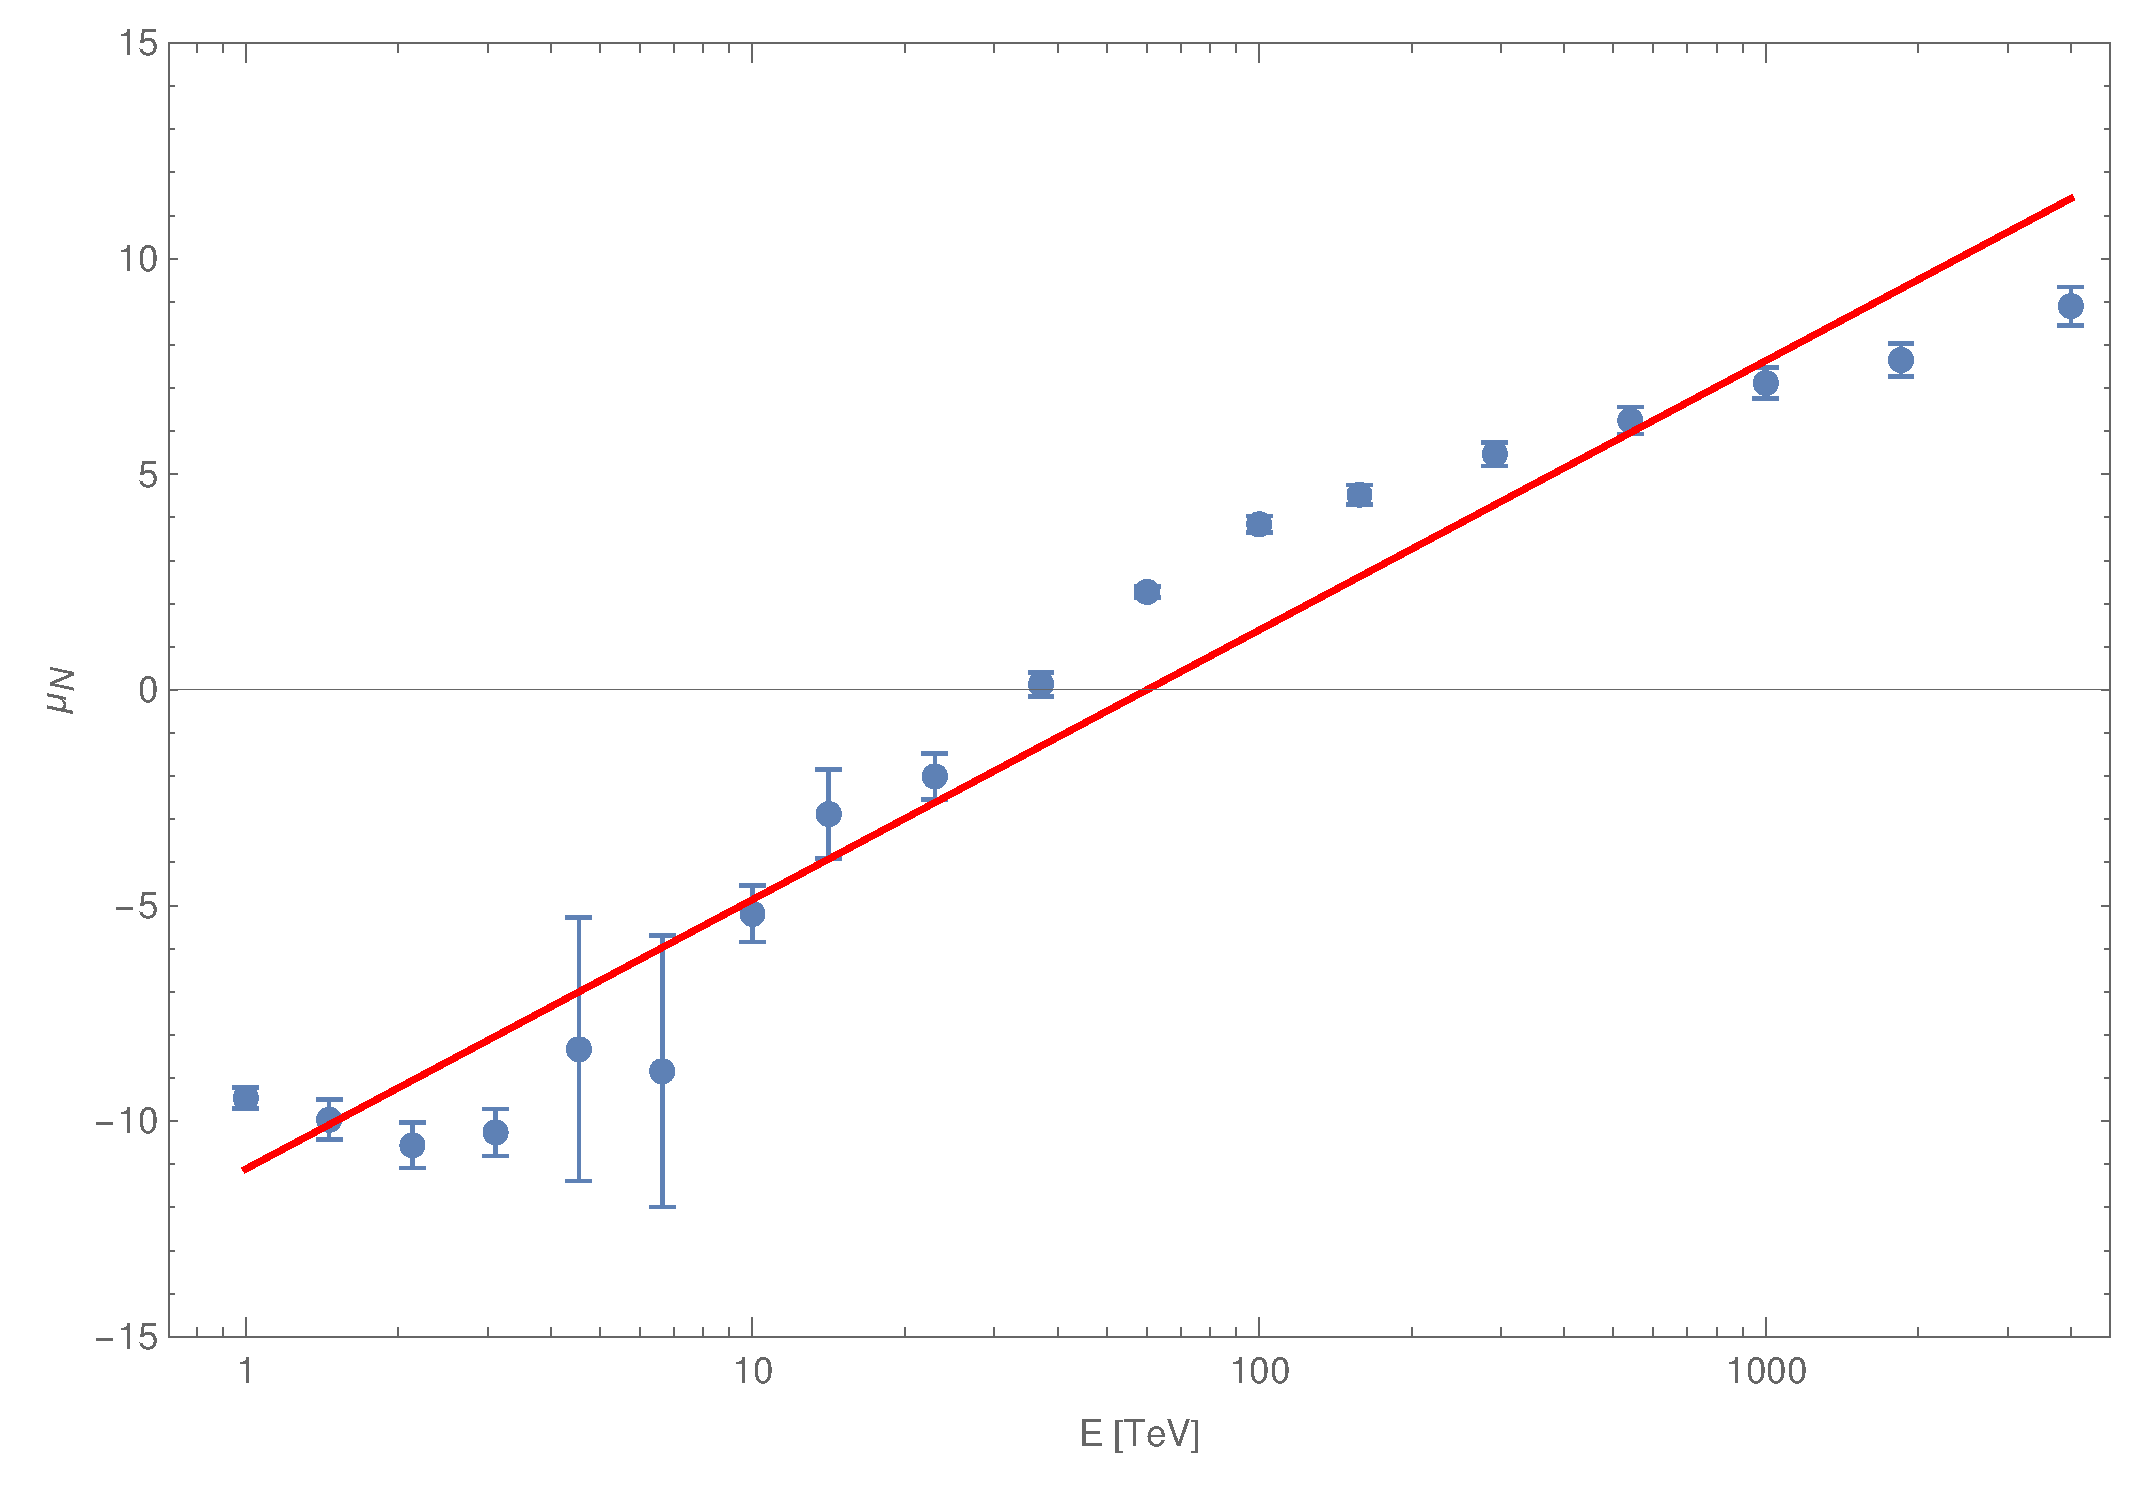
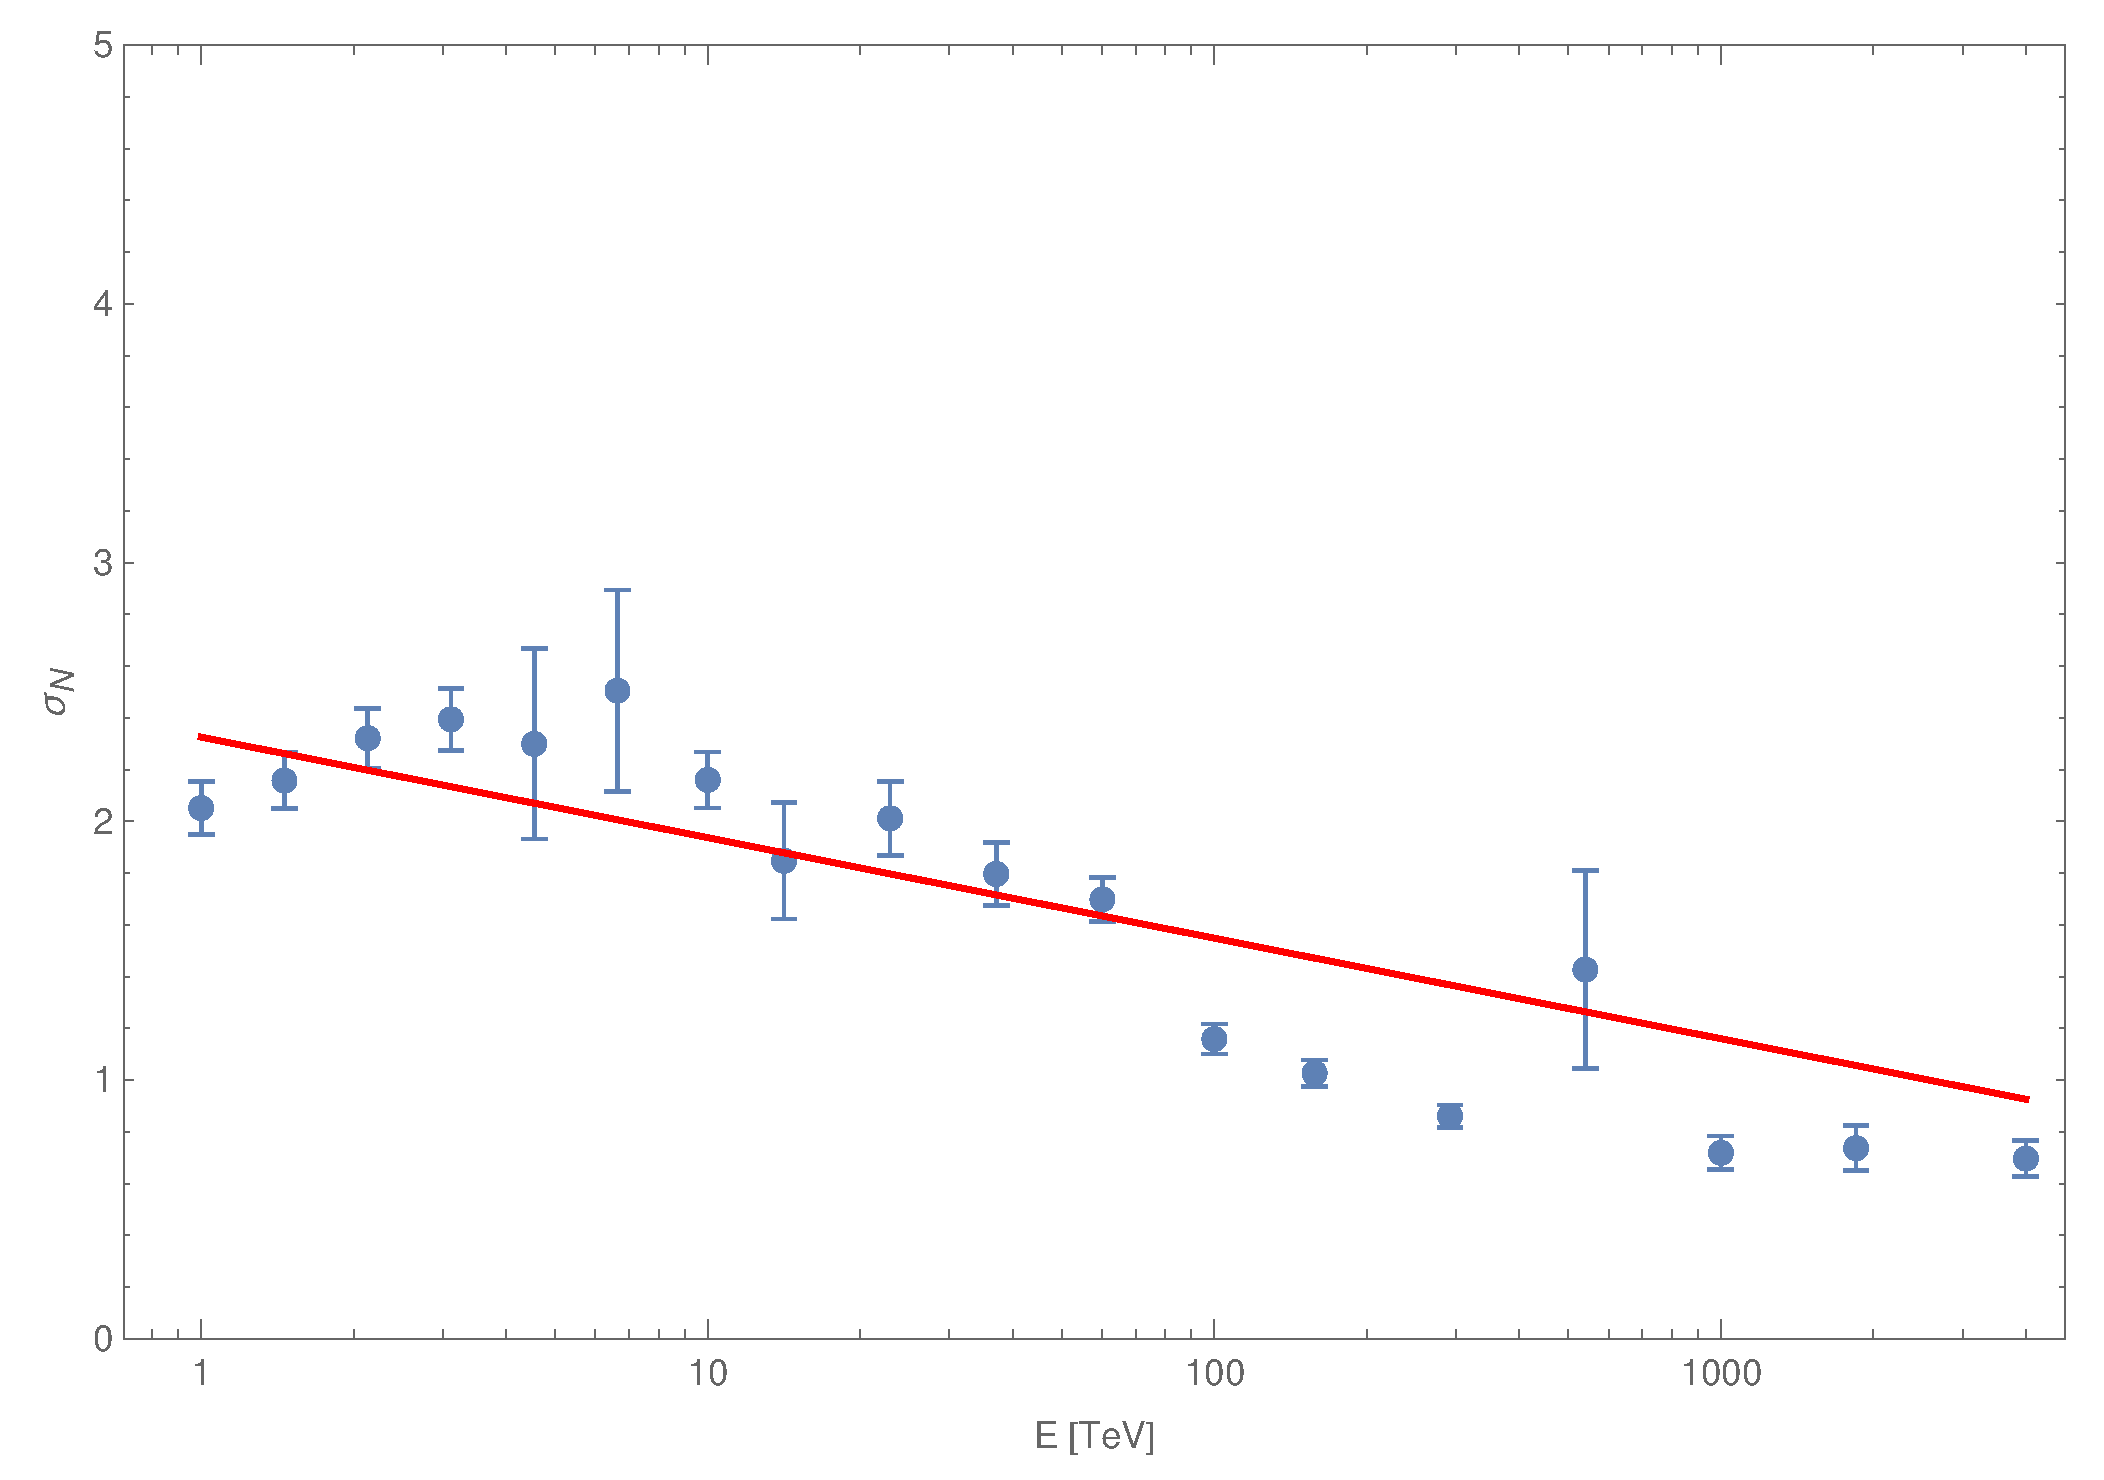
Appendix C. Parameterisation of the Distribution of the Number of Particles


Appendix D. Detector System Configuration
| Parameter | n | A | ||||
| Value | 4 | 25 cm | s | 163 s m | 0.1 s |
References
- Homola, P.; Beznosko, D.; Bhatta, G.; Bibrzycki, Ł.; Borczyńska, M.; Bratek, .; Budnev, N.; Burakowski, D.; Alvarez-Castillo, D.E.; Almeida Cheminant, K.; et al. Cosmic-ray extremely distributed observatory. Symmetry 2020, 12, 1835. [Google Scholar] [CrossRef]
- Smith, G.R.; Ogmen, M.; Buller, E.; Standil, S. Possible observation of a burst of cosmic-ray events in the form of extensive air showers. Phys. Rev. Lett. 1983, 50, 2110. [Google Scholar] [CrossRef]
- Fegan, D.J.; McBreen, B.; O’Sullivan, C. Observation of a burst of cosmic rays at energies above 7 × 10¹³ ev. Phys. Rev. Lett. 1983, 51, 2341. [Google Scholar] [CrossRef]
- Dhital, N.; Homola, P.; Alvarez-Castillo, D.; Góra, D.; Wilczyński, H.; Cheminant, K.A.; Poncyljusz, B.; Mędrala, J.; Opiła, G.; Bhatt, A.; et al. Cosmic ray ensembles as signatures of ultra-high energy photons interacting with the solar magnetic field. J. Cosmol. Astropart. Phys. 2022, 2022, 038. [Google Scholar] [CrossRef]
- Bibrzycki, Ł.; Burakowski, D.; Homola, P.; Piekarczyk, M.; Niedźwiecki, M.; Rzecki, K.; Stuglik, S.; Tursunov, A.; Hnatyk, B.; Castillo, D.E.A.; et al. Towards A Global Cosmic Ray Sensor Network: CREDO Detector as the First Open-Source Mobile Application Enabling Detection of Penetrating Radiation. Symmetry 2020, 12, 1802. [Google Scholar] [CrossRef]
- Clay, R.; Singh, J.; Homola, P.; Bar, O.; Beznosko, D.; Bhatt, A.; Bhatta, G.; Bibrzycki, Ł.; Budnev, N.; Alvarez-Castillo, D.E.; et al. A Search for Cosmic Ray Bursts at 0.1 PeV with a Small Air Shower Array. Symmetry 2022, 14, 501. [Google Scholar] [CrossRef]
- Wibig, T.; Karbowiak, M. CREDO-Maze Cosmic Ray Mini-Array for Educational Purposes. Symmetry 2022, 14, 500. [Google Scholar] [CrossRef]
- Heck, D.; Knapp, J.; Capdevielle, J.N.; Schatz, G.; Thouw, T. CORSIKA: A Monte Carlo Code to Simulate Extensive Air Showers; Forschungszentrum Karlsruhe Report FZKA 6019; Karlsruhe Institute for Technology (KIT): Karlsruhe, Germany, 1998. [Google Scholar]
- Heck, D.; Pierog, T. Extensive Air Shower Simulation with CORSIKA: A User’s Guide (Version 7.7100 from October 1, 2019); Karlsruhe Institute for Technology (KIT): Karlsruhe, Germany, 2019. [Google Scholar]
- Pierog, T.; Karpenko, I.; Katzy, J.M.; Yatsenko, E.; Werner, K. EPOS LHC: Test of collective hadronization with data measured at the CERN Large Hadron Collider. Phys. Rev. C 2015, 92, 034906. [Google Scholar] [CrossRef]
- Bass, S.A.; Belkacem, M.; Bleicher, M.; Brandstetter, M.; Bravina, L.; Ernst, C.; Gerland, L.; Hofmann, M.; Hofmann, S.; Konopka, J.; et al. Microscopic models for ultrarelativistic heavy ion collisions. Prog. Part. Nucl. Phys. 1998, 41, 255–369. [Google Scholar] [CrossRef]
- Bleicher, M.; Zabrodin, E.; Spieles, C.; Bass, S.A.; Ernst, C.; Soff, S.; Bravina, L.; Belkacem, M.; Weber, H.; Stöcker, H.; et al. Relativistic Hadron-Hadron Collisions Ultra-Relativ. Quantum Mol. Dyn. Model. J. Phys. G: Nucl. Part. Phys. 1999, 25, 1859–1896. [Google Scholar] [CrossRef]
- Kamata, K.; Nishimura, J. The Lateral and the Angular Structure Functions of Electron Showers. Prog. Theor. Phys. Suppl. 1958, 6, 93–155. [Google Scholar] [CrossRef]
- Greisen, K. Cosmic Ray Showers. Annu. Rev. Nucl. Sci. 1960, 10, 63–108. [Google Scholar] [CrossRef]
- Nelson, W.R.; Hirayama, H.; Rogers, D.W. EGS4 Code System, Report SLAC 265; Stanford Linear Accelerator Center: Menlo Park, CA, United States, 1985. [Google Scholar]
- Grieder, P.K. Cosmic Rays at Earth; Elsevier: Amsterdam, The Netherlands, 2001; Chapter 5.4.7; pp. 806–837. [Google Scholar]
- Group, P.D.; Zyla, P.; Barnett, R.; Beringer, J.; Dahl, O.; Dwyer, D.; Groom, D.; Lin, C.J.; Lugovsky, K.; Pianori, E.; et al. Review of particle physics. Prog. Theor. Exp. Phys. 2020, 2020, 083C01. [Google Scholar] [CrossRef]
- Matthews, J.; Collaboration, U.M.C. Recent results from the CASA-MIA experiment. AIP Conf. Proc. 1995, 338, 823–827. [Google Scholar]
- Aartsen, M.; Abbasi, R.; Abdou, Y.; Ackermann, M.; Adams, J.; Aguilar, J.; Ahlers, M.; Altmann, D.; Auffenberg, J.; Bai, X.; et al. Measurement of the cosmic ray energy spectrum with IceTop-73. Phys. Rev. D 2013, 88, 042004. [Google Scholar] [CrossRef]
- Axani, S.; Frankiewicz, K.; Conrad, J. CosmicWatch: The Desktop Muon Detector. J. Instrum. 2018, 13, 03. [Google Scholar] [CrossRef]
- Karbowiak, M.; Wibig, T.; Alvarez-Castillo, D.; Beznosko, D.; Duffy, A.R.; Góra, D.; Homola, P.; Kasztelan, M.; Niedźwiecki, M. The first CREDO registration of extensive air shower. Phys. Educ. 2020, 55, 055021. [Google Scholar] [CrossRef]
- Erlykin, A.; Wolfendale, A. Structure in the cosmic ray spectrum: An update. J. Phys. G Nucl. Part. Phys. 2001, 27, 1005. [Google Scholar] [CrossRef]
- Erlykin, A.; Wolfendale, A. Further evidence favouring the single source model for cosmic rays. Astropart. Phys. 2005, 23, 1–9. [Google Scholar] [CrossRef]
- Catanese, M.; Borione, A.; Covault, C.; Cronin, J.; Fick, B.; Fortson, L.; Gibbs, K.; Glasmacher, M.; Green, K.; Kieda, D.; et al. A Search for Ultrahigh-Energy Gamma Rays from EGRET-detected Active Galactic Nuclei Using CASA-MIA. Astrophys. J. 1996, 469, 572. [Google Scholar] [CrossRef]
- Apel, E.W.; Arteaga, J.; Badea, A.; Bekk, K.; Bertaina, M.; Blümer, J.; Bozdog, H.; Brancus, I.; Buchholz, P.; Cantoni, E.; et al. The KASCADE-grande experiment. Nucl. Instrum. Methods Phys. Res. Sect. A Accel. Spectrometers Detect. Assoc. Equip. 2010, 620, 202–216. [Google Scholar] [CrossRef]


| k | Background | Model 1 | Model 2 | Model 3 | Model 4 | Model 5 |
|---|---|---|---|---|---|---|
| 1 | 1,168,000 | 131,100 | 257,300 | 159,050 | 219,600 | 147,100 |
| 2 | 779 | 4414 | 29.5 | 164 | 315 | |
| 3 | 170 | 1067 | 6.1 | 33.1 | 125 | |
| 4 | 78 | 541 | 3.9 | 20.2 | 132 |
| k | Events | Background | Model 1 | Model 2 | Model 3 | Model 4 | Model 5 |
|---|---|---|---|---|---|---|---|
| 2 | 94 | <0.169 | 130 | 736 | 5.39 | 27.9 | 53 |
| 3 | 2 | < | 28.5 | 178 | 1.03 | 5.55 | 21 |
| 4 | 1 | < | 13 | 90 | 0.66 | 3.37 | 22 |
Publisher’s Note: MDPI stays neutral with regard to jurisdictional claims in published maps and institutional affiliations. |
© 2022 by the authors. Licensee MDPI, Basel, Switzerland. This article is an open access article distributed under the terms and conditions of the Creative Commons Attribution (CC BY) license (https://creativecommons.org/licenses/by/4.0/).
Share and Cite
Pryga, J.S.; Stanek, W.; Woźniak, K.W.; Homola, P.; Almeida Cheminant, K.; Stuglik, S.; Alvarez-Castillo, D.; Bibrzycki, Ł.; Piekarczyk, M.; Bar, O.; et al. Analysis of the Capability of Detection of Extensive Air Showers by Simple Scintillator Detectors. Universe 2022, 8, 425. https://0-doi-org.brum.beds.ac.uk/10.3390/universe8080425
Pryga JS, Stanek W, Woźniak KW, Homola P, Almeida Cheminant K, Stuglik S, Alvarez-Castillo D, Bibrzycki Ł, Piekarczyk M, Bar O, et al. Analysis of the Capability of Detection of Extensive Air Showers by Simple Scintillator Detectors. Universe. 2022; 8(8):425. https://0-doi-org.brum.beds.ac.uk/10.3390/universe8080425
Chicago/Turabian StylePryga, Jerzy Seweryn, Weronika Stanek, Krzysztof Wiesław Woźniak, Piotr Homola, Kevin Almeida Cheminant, Sławomir Stuglik, David Alvarez-Castillo, Łukasz Bibrzycki, Marcin Piekarczyk, Olaf Bar, and et al. 2022. "Analysis of the Capability of Detection of Extensive Air Showers by Simple Scintillator Detectors" Universe 8, no. 8: 425. https://0-doi-org.brum.beds.ac.uk/10.3390/universe8080425