Development of a Measure of Permeability between Private and Public Space

1
Departamento de Arquitetura e Urbanismo, Universidade Federal da Paraíba—UFPB, Campus I, João Pessoa, PB CEP 58051-900, Brasil
2
Department of Architecture, Chalmers University of Technology, Eklandagatan 86, SE-412 96 Gothenburg, Sweden
3
Programa de Pós-Graduação em Desenvolvimento Urbano—MDU, Universidade Federal de Pernambuco—UFPE, Av. dos Reitores, s/n, Cidade Universitária, Recife, PE CEP 50741-530, Brasil
*
Author to whom correspondence should be addressed.
Urban Sci. 2018, 2(3), 87; https://0-doi-org.brum.beds.ac.uk/10.3390/urbansci2030087
Submission received: 19 June 2018
/
Revised: 5 September 2018
/
Accepted: 7 September 2018
/
Published: 12 September 2018
(This article belongs to the Special Issue Formalizing Urban Methodologies)
Abstract
:This article focuses on the development of a measure for frontage permeability, which we argue is needed to complement existing metrics used to describe urban environments and assess, amongst others, social performativity. Built density and street network centrality are two characteristics often discussed in relation to urban vitality. However, high densities and high centrality do not always result in higher urban vitality, which can be partially explained by a typical densification model often used in Brazil and in some other Latin-American cities with high-rise residential buildings. To understand the relation between urban form and social performativity, the metrics for density and network centrality are thus not sufficient and we propose to add two other urban form properties: frontage permeability and plot size. The hypothesis is that the mentioned densification model combines higher density with larger plots and lower permeability. Many scholars have shown that higher density is often associated with increased urban vitality, but larger plots are said to have the opposite effect and in Latin American cities, it is observed that lower vitality is found where buildings have less permeable frontages. This research aims at studying the combined effect of density, permeability, and plot size on urban vitality or, more generally, social performativity. However, there is no well-developed method to measure frontage permeability. Therefore, this article first presents a method to measure frontage permeability, both in qualitative and quantitative terms. This measure is then combined with existing measures of density and plot size to analyse how these three urban form metrics relate to each other. In a forthcoming paper, pedestrian observation data will be added to the analysis, to be able to give more insight in the relation between the three urban form metrics and urban vitality using pedestrian counts as proxy. We will show that the developed measure seems to be coherent and effective in describing permeability. Further, the preliminary results confirm the hypothesis that the Brazilian densification model with high-rise residential buildings generates a decrease in frontage permeability, although it does not appear to significantly change plot sizes.
1. Introduction
The Natural Movement theory [1] states that street configuration or network centrality is the primary generator of pedestrian movement and activities, with the latter two influencing each other. Further, it is often pointed out that high density also generates a higher intensity of activities and movement in cities [2,3,4,5].
However, in Latin American cities and, more specifically, in this article, Brazilian cities, this may not be the case. In these cities, urban developments with high network centrality and high density can present a low presence of people in public spaces.
The hypothesis is that, regarding urban morphology, this is caused by the specific way in which densification takes place. Present-day Brazilian cities have a typical verticalization process aimed primarily at attending the housing market. The high-rise residential buildings reach more than twenty or even forty stories high, with a semi-underground floor and often also a ground floor car parking area, because of an urban planning and mobility policy that prioritized motorized private transport.
We want to introduce two characteristics related to this densification type that are not addressed in the Natural Movement theory, nor in the large body of literature concerning density, but, we argue, could contribute to less inviting and less safe streets that in turn affect the amount of people in the streets. First, the big size of plots. Because of urban legislation requirements for a more balanced relationship between total built area and plot area, higher buildings demand larger plots. These are achieved by joining several plots, consequently reducing the number of plots per urban block. This is a process contrary to the Burgage cycle concept that describes a process of urbanization resulting in smaller plots [6]. Second, the consequent low frontage permeability. Because of the reduced plot numbers and entrances, as well as the presence of blind walls due to semi-underground floors for car parking, there is less interaction between private buildings and public streets.
It has been shown that plot size influences socioeconomic processes in cities. Marcus [7] shows empirically that plot size relates to urban diversity and argues that this is because of the fact that the plot actually represents an actor presence with particular action strategies in the city. Thus, an urban area composed of many plots would tend to present a higher amount of such actors and strategies. These diverse strategies would lead to a greater potential for diversity of land use.
Renowned authors, such as Jacobs [2], Gehl [8,9], and Panerai et al. [10], refer to the importance of the interaction between public and private spaces with respect to the quality of public spaces and to an active street life. Jacobs’ “eyes on the street” concept [2] very clearly shows how visual permeability between plots and streets can contribute to their vitality and safety.
The “constitution” map [11] (pp. 104–106) is a method developed within the framework of Space Syntax research and represents this interface between the private and public realm in terms of accessibility; if there is an entrance between buildings or plot boundaries and their adjacent public convex spaces (Convex spaces refer to the urban space representation in its convex fragments, that is, spaces in which no straight line drawn between any two points goes outside the space [11]), a link between them is drawn, thus representing an entrance. Hanson [12] developed this further and introduced the “constitutedness rate”, which quantitatively describes the percentage of public spaces that are constituted by entrances.
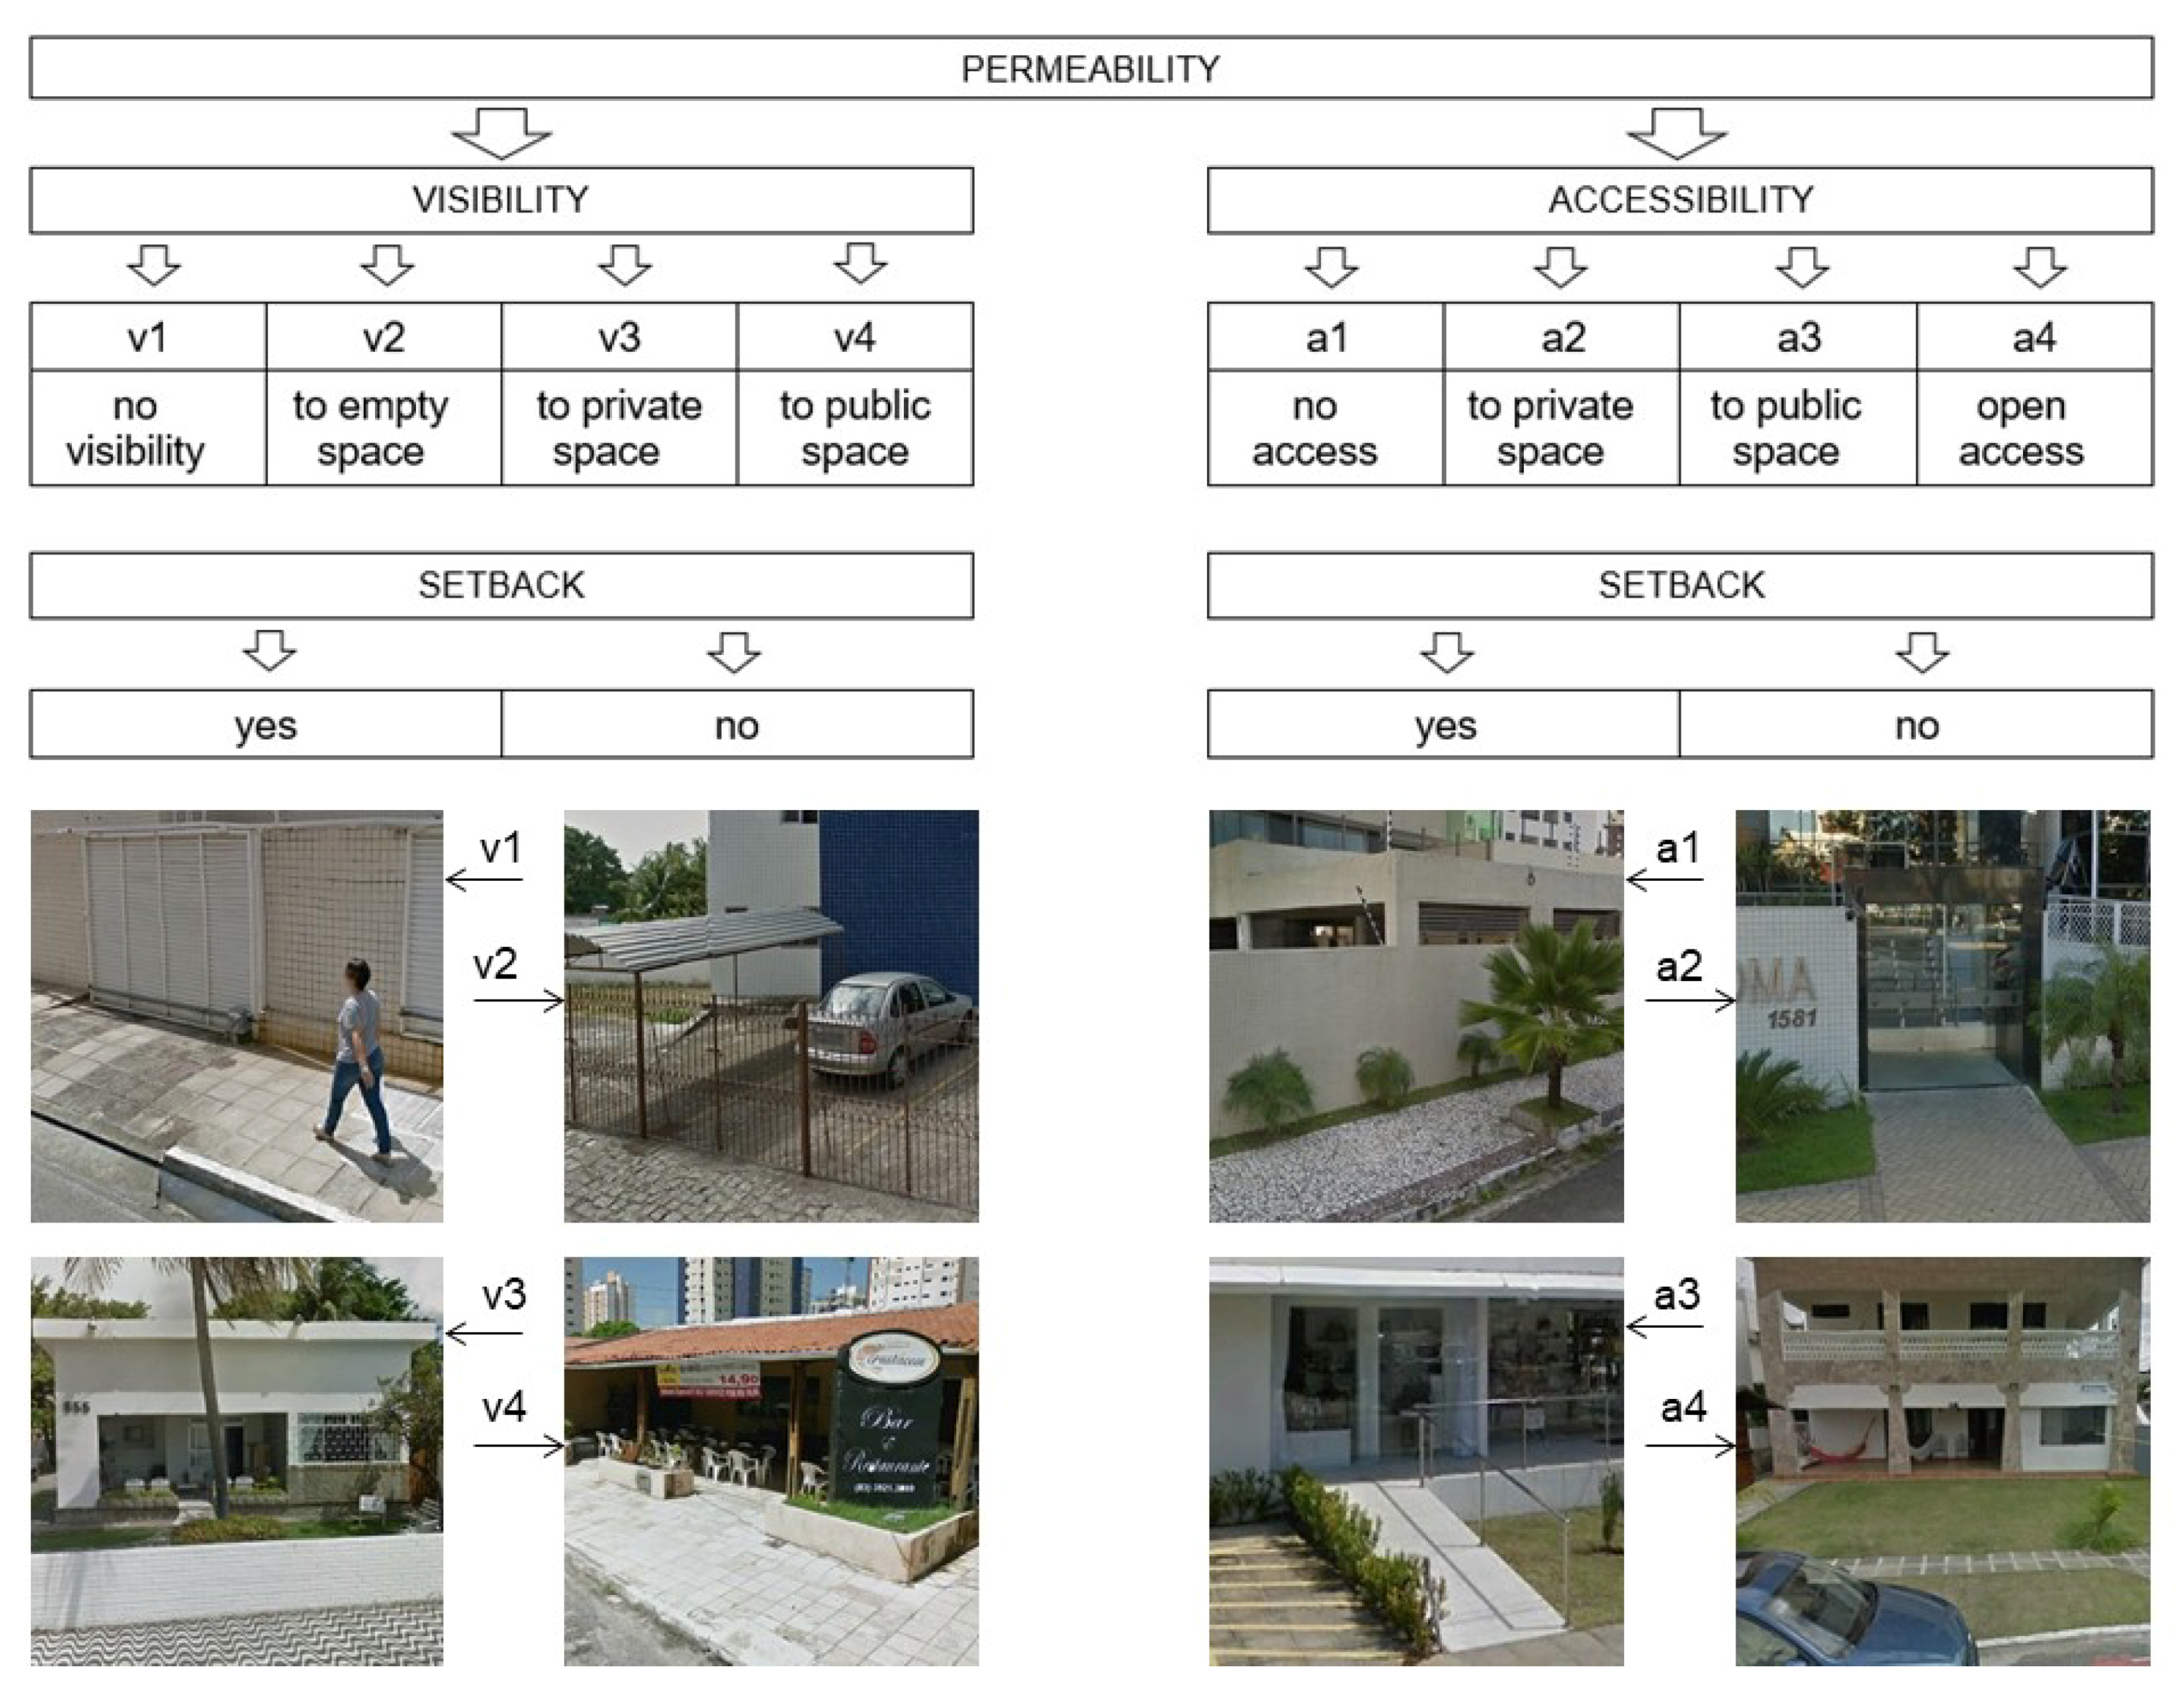
This article’s contribution is to introduce a measure that captures the frontage permeability, both in qualitative and quantitative terms, by verifying the following: (a) the frontage visibility and accessibility separately; (b) the presence of setback, and its depth and use; (c) the type of space (referring to land use) to which there is permeability.
The article starts with a description of the developed frontage permeability measure. Next, the measuring procedures for density and plot sizes are briefly described based on existing methods, as well as measures of network centrality and accessibility. Then, a pilot study aimed at testing the permeability measure is presented, focusing on four areas of a district in João Pessoa, Brazil. In these areas, we evaluate the correlation between the proposed permeability measure and the density, plot size, and land use properties. The article ends with a discussion including future research steps; that is, expanding the test area and correlating the results to pedestrian survey.
The results are preliminary and partial, but they indicate that the developed measure is coherent and effective. They also indicate the confirmation of the hypothesis that the increasing densification model in Brazilian cities with high-rise residential buildings generates low frontages permeability, although this model does not appear to significantly change the plot sizes and the frontages lengths.
The content of this article is part of a doctoral research on the relations between density and urban form and its influence on social performativity.
2. Materials and Methods
2.1. Development of Permeability Measure
For the purpose of this research, the frontage permeability is understood as the property of these frontiers that allows interpersonal interactions between the spaces delimited by them; namely the public space, that is, the street and the private space, that is, the plot. These interactions may be visual—people on the streets may or may not see what goes on inside the plot, and vice versa—as well as physical—people may or may not cross the border between public and private space defined by the frontage.
These interactions need to be understood bearing in mind that they have a certain inequality. The public space is, by definition, commonly open and accessible to all people, while the plot, often being privately owned, tends to have controlled visibility and access. The frontage partition, for example, may purposefully conceal the view from the street to the plot, but not the opposite way around. In the same way, doors and gates aim at controlling the access to the plot, rather than the exit to the public space. The study looks at the public–private interface from the public space perspective.
In the proposed method, the permeability measure was divided into two variables: (a) visibility—the frontage property that allows people to see through it; and (b) accessibility—the frontage property that allows people to pass through it. These variables are measured separately, as they are not necessarily correlated. For instance, a transparent frontage may not allow movement through it, as well as a high and opaque frontage can allow access to users, if it is a gate.
The visibility and accessibility measures were defined by combining a quantitative measure—the degree of how visually or physically permeable the frontage is—and a qualitative classification of the type of space that is visible or accessible. This type refers to a socio-spatial qualification according to the land use—if it is a public or private space, occupied, underutilized, or empty. This differentiation is important as land use may encourage or, conversely, discourage the interaction between street and lot, interfering in its contribution to urban vitality. The visibility to a vacant plot, for example, presumably does not contribute to the quality, safety, or vitality of the public space adjacent to it. Urban voids make the street environment more desolate, abandoned, and monotonous, thus less attractive and safe for people. Conversely, the visibility or access to a restaurant or to a store is a factor of people attraction.
To measure the visibility variable, we defined four categories: (a) no visibility (v1); (b) visibility to an empty space (v2); (c) visibility to a private space (v3); and (d) visibility to a (semi-)public space (v4)—see Scheme 1. The “empty space” class includes vacant plots, and residual and underutilized spaces, defined as follows: (a) vacant plots are the private plots without occupation and use; (b) residual spaces are small areas between buildings within plots, without defined function and idle; (c) underutilized spaces are those spaces whose uses are not proper for social interactions, such as closed or abandoned buildings, parking lots, and garages. The “private space” class comprises single-family and multifamily residential uses, while “(semi-)public space” encompasses all other public, semi-public, or collective uses: retail, services, and so on. This scale is based on the principle that the visibility to a (semi-)public space presents more potential to promote interaction between the street and the plot than that to a private space, which is usually more controlled and isolated. Likewise, visibility of a private space generates more potential interaction than visibility of an empty space, which in scale, only surpasses the no visibility condition.
The definition of land use, and the concepts and degrees of public–private are much more diffuse and complex than this categorization. However, we tried to avoid a model with too detailed categories—and thereby non-generic—or with too abstract ones—and thereby too broad. The developed method seems to be effective enough to differentiate the basic types of land use, and economic enough to not be too complicated.
The accessibility variable measure is also based on a four-category scale: (a) no access (a1); (b) controlled access to a private space (a2); (c) controlled access to a (semi-)public space (a3); and (d) open access (a4)—see Scheme 1. It was opportune to differentiate the controlled access—that with doors or gates—from open access. It is not necessary to qualify the plot use when an open access is found. Prevailed its quality of being devoid of barriers, it does not matter if the open access is to a public or private space, or even to an empty one. An open access to a private or semi-public space works as an urban incubator that promotes the convergence between street and plot spaces. When it is directed to an empty space, it can promote space occupation, as commonly seen in Brazilian cities where squares are often lacking, as well as public equipment for leisure and sports. Open (with no walls) vacant plots are thus spontaneously converted by the population into football fields.
A “controlled access to empty space” category was not necessary. The entrances to closed buildings and the exclusive gates for cars were considered as part of the “no access” category (a1). In the first case (closed buildings), there is in fact no access. In the second case (parking lots and garages), there is a controlled access used only by vehicles, so it does not generate social interaction between public and private realms, that is, the street and the plot. The mixed-use gates, both for pedestrians and vehicles, were considered as controlled accesses, either in the a2 category (to a private use space) or in the a3 (to a (semi-)public space).
Another analyzed variable was the setback, observed when the barrier that delimits street and plot is recessed from the plot’s limit and a part of the private property is, so to speak, given to the public use. When a setback is present, depending on its use, it can have a positive effect by means of semi-public uses, generating gradations between public and private spaces, or a negative effect, by reinforcing the separation of these two realms with residual spaces. The following was verified: (a) the existence of the setback space; (b) its dimension; and (c) its eventual occupation. The setback dimension was considered as the average distance between the plot’s limit with the street and the barrier built inside the plot. When this distance was less than two meters, the setback was disregarded. It should be noted that the building with setbacks, that is, the building located in the center of the plot and surrounded by walls, is common in Brazilian cities. In these cases, the building does not define permeability, but rather the walls that surround it, which are the physical elements that delimit the public and private realms.
Once the variables and their categories of analysis were defined, frontage mapping was conducted in the chosen areas. Some measurement parameters were established. Visibility values were registered based on the average eye height of a pedestrian (about 1.60 m) that walks on the sidewalk level. Based on the possibility of visual interaction with the ground level of the plot, an opaque barrier of 1.70 m or higher was included in the “no visibility” category. In situations of discontinuous vision, because of, for instance, the presence of fences, interspersed posts, or hollow bricks, the visibility was considered existent.
In accessibility, the “open access” category was set for situations with no barriers higher than 40 cm from the sidewalk level. Forty centimeters is the average height of a seat and of an adult knee, so it is supposed to be easier to pass over an obstacle of that height. Obviously, a 50-cm high wall can also be crossed, but the height limit to “open access” was defined considering the intention of territory demarcation. Space accessibility is not only about being able to cross or enter, but also about permission to do so [13].
The Google Street (with updated data from September 2017) and Google Earth tools were used for data gathering. Using the images on these online platforms, the different components of each plot frontage (e.g., wall, gate, fence) were verified. Their lengths were recorded in meters (recesses were considered irrelevant and thus not measured), as well as their different conditions of visibility, accessibility, and setback. This level of detail is relevant, as the frontage of a plot can be very heterogeneous along its length. In that case, assigning only one accessibility, visibility, or setback value to it would not express its actual condition.
The initial mapping of measurements was performed on AutoCAD 2017 software, using DWG files originating from georeferenced files. For the geometric representation of each frontage component, lines were used as entities with attributes according to Scheme 1. This means that, besides a length value, each line has a visibility category (v1, v2, v3, or v4) and an accessibility one (a1, a2, a3, or a4), as well as, in case of a setback, its dimension and use. The DWG files were then exported as vector images to the ArcGIS 10.2 software, which was used for the final mapping, processing, and analysis of the data.
Various indexes expressing the frontage permeability were developed based on the total length of each visibility (v1, v2, v3, and v4) and accessibility category (a1, a2, a3, and a4) per plot. The indexes were calculated as follows:
where:
VI = 1 − (v1/(v1 + v2 + v3 + v4))
AI = 1 − (a1/(a1 + a2 + a3 + a4))
- VI = Visibility Index;
- v1 = frontage length with no visibility;
- v2 = frontage length with visibility to empty space;
- v3 = frontage length with visibility to private space;
- v4 = frontage length with visibility to (semi-)public space;
- AI = Accessibility Index;
- a1 = frontage length with no access;
- a2 = frontage length with controlled access to private space;
- a3 = frontage length with controlled access to (semi-)public space;
- a4 = frontage length with open access.
Besides these main indexes, some sub-indexes were developed based on certain categories of visibility and accessibility, so that they can be assessed separately. To calculate the permeability indexes to (semi-)public spaces, the following equations were used:
where:
VIpu = v4/(v1 + v2 + v3 + v4)
AIpu = Na3/(a1 + a2 + a3 + a4)
- VIpu = Visibility Index to (semi-)public space;
- AIpu = Accessibility Index to (semi-)public space;
- Na3 = number of controlled accesses to (semi-)public space.
Indexes were also developed to measure permeability to both (semi-)public and private space, as well as an open access index, using the following equations:
where:
VIpri pu = (v3 + v4)/(v1 + v2 + v3 + v4)
AIpri pu = (Na2 + Na3)/(a1 + a2 + a3 + a4)
AIop = a4/(a1 + a2 + a3 + a4)
- VIpri pu = Visibility Index to private and (semi-)public space;
- AIpri pu = Accessibility Index to private and (semi-)public space;
- Na2 = number of controlled accesses to private space;
- AIop = Accessibility Index for open access.
In Equations (4) and (6), the numerator indicates the number of accesses, not length. The quantity of accesses seems to be more effective for the assessment of accessibility to specific spaces according to use (that is, (semi-)public and private spaces) than the entrances length.
Equation (3) can demonstrate the potential urban diversity, as it registers the Visibility Index for all non-private uses. Equation (5) can express Jacob’s “eyes on the street” [2], as it registers the Visibility Index for all private and (semi-)public uses. Therefore, it includes spaces whose uses can contribute to the natural surveillance of the streets (assuming that visibility also occurs from the plot interior to its exterior).
The accessibility sub-indexes to (semi-)public space (AIpu) and to both private and (semi-)public space (AIpri pu) are important for describing accessibility to spaces whose uses are conducive to social interactions between streets and plots.
The open access index (AIop) records the proportion of spaces with no barriers between the street and the plot, that is, the convergence spaces that contribute to the interactions between streets and plots.
All indexes were calculated in Microsoft Office Excel tables.
2.2. Measures of Density and Plot Sizes
In order to test the hypothesis, the permeability indexes were correlated to the local density, plot size, and land use.
For density measures, the Spacematrix method was used [14]. It calculates the built density using multiple density indexes including Floor Space Index (FSI), also referred to as Floor Area Ratio (FAR) - which is calculated as the ratio between gross floor area and the base land area - and Ground Space Index (GSI), also referred to as Coverage, which is calculated as the ratio between the building footprint and the base land area. Together, these multiple density indexes have shown to effectively describe building types. The results are represented in diagrams that synthesize various density characteristics of the analyzed areas and classify the building types found.
The data on gross floor area and plot area were obtained from the registry of the municipal government of João Pessoa. These data presented inconsistencies and errors, and were outdated in some aspects. To overcome these inconsistencies, a three-step analytical procedure was developed. Firstly, a sampling of typical blocks and plots of the case study areas was statistically calculated. Secondly, the gross floor area values of the referred set were manually recalculated and compared with those obtained from the registry. As a result of this procedure, we could detect the most frequent error patterns and choose the plot types whose floor area should be recalculated manually. Thirdly, the plot area values were recalculated automatically on ArcGIS 10.2 software, based on each plot’s cartographic geometry. Once the gross floor area and the plot area were checked and calibrated, we were able to obtain a more reliable FSI.
The measures related to the plot size were based on Bobkova et al. [15], who develops morphological measures of plot systems, capturing size; openness and compactness; and configurational measures, such as accessible number of plots and accessible diversity of plots, using the Place Syntax Tool (PST). PST is a plug-in tool for QGIS that uses Space Syntax analysis for measuring the accessibility through the street to different contents of urban space (e.g., density or plot area), rather than the accessibility of the streets themselves. The PST measures can be said to be closer to the cognitive experience of a person walking through the urban space, and his or her perception of variations in densities, plot sizes, types of buildings, and so on. [16,17].
The local measurements in the test areas were combined with configurational measures at various scales, using Space Syntax [18] network centrality measures integration and choice (also referred to as closeness centrality and betweeness centrality, respectively) on a segment map. With the segment map, it is applied the angular analysis [19], which differs from the axial one because it can use not only topological measures, but also angular (geometric) and metric measures, within a stipulated radius. The angular analysis improves the axial representation assumption that people walk in a straight line, by assuming that people walk in a straight line, making the path with the least angular deviation. Thus, it considers the angle between the streets to weight the topological distance. The measures were performed at a range of scales: radii 500 m, 800 m, 1 km, 2 km, 3 km, 5 km, and global (capturing the whole city); and in the topo-geometric radii r3, r7, and r12. With this range of scales, it was possible to verify the effects of the network from different scalar perspectives. On the local scale, the network analysis informs us which streets are more integrated on that level as the global analysis gives us the understanding of how streets perform on city scale. One street can be well integrated locally, but not globally or vice versa. Various studies have shown that the most vital urban areas tend to be where streets have high centrality values with both high and low radii. [20,21]
2.3. Pilot Study
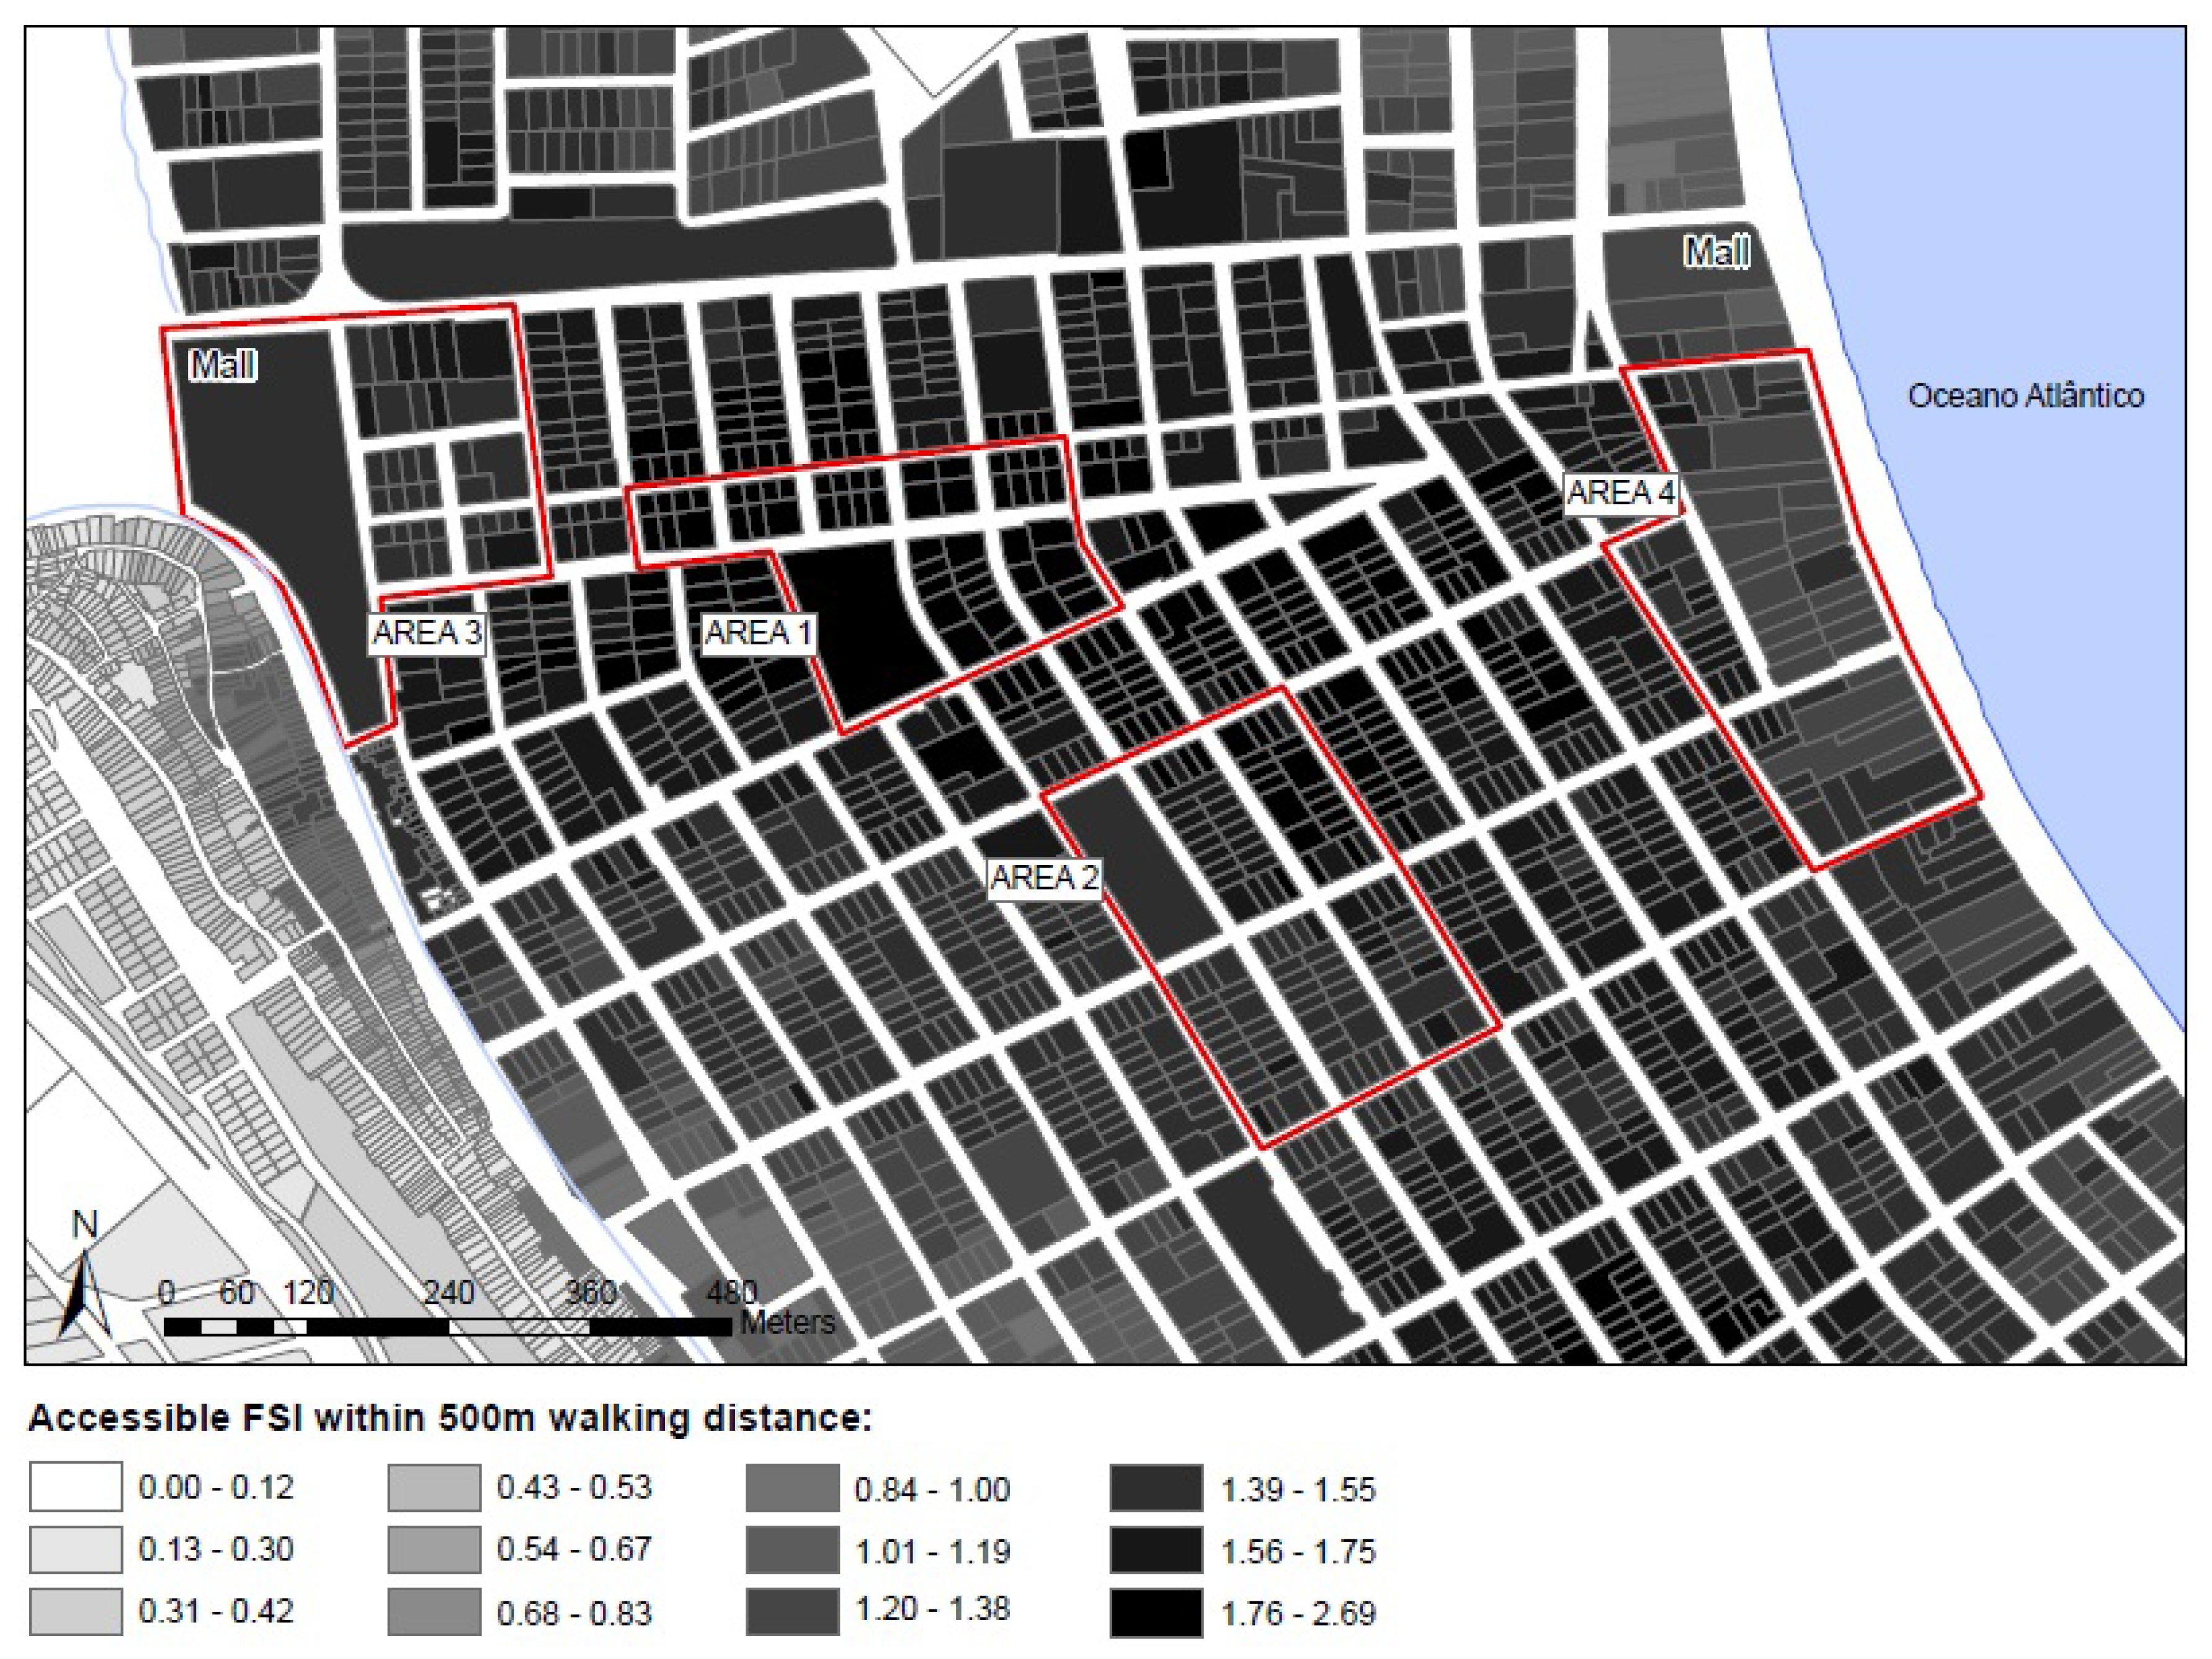
The initial tests were performed in four selected areas of Manaíra district, in João Pessoa, Brasil. João Pessoa, the capital of Paraíba province in Brasil, has a population of 811,598 inhabitants in 211.5 km2, and a population density of 3837 inhab/km2. It is part of a 1.26 million inhabitants” metropolitan area (data from 2016–2017) [22]. Manaíra integrates the high-income coastal subcenter of João Pessoa, which is one of its new centralities that resulted from an urban development process started in the 1970s [23]. Subcenters result from urban expansion, concentrating retails and services in housing areas, in order to reduce users displacements in search of urban facilities. Unlike traditional centers, subcenters usually serve only parts of the city [24].
Manaíra has 26,369 inhabitants in 2.42 km2, with a high population density of 10,896 inhab/km2. It is the city’s fourth most populated district (in absolute numbers) and the seventh most densely populated. It is also among the districts that present the highest built density levels [25]. Integration and choice values indicate that Manaíra presents medium to high centrality and accessibility in local and global radii. The accessible density measure also shows high values in all radii. Therefore, Manaíra district presents economic-functional centrality (it is a subcenter with housing, retail, and services), demographic centrality (high population density), and morphological centrality (high FSIs, and, in configurational terms, high centrality, accessibility, and accessible density). Based on the Natural Movement theory [1], we would expect high levels of pedestrian movement and activities, which, however, does not seem to be the case.
Four areas were selected for initial testing in Manaíra (see Figure 1). Areas 1 and 2 present the highest values of accessible density in local radii (500 m and 800 m), within the district range. Areas 3 and 4 present medium to high accessible density values in the same radii, within the district range, and they are located next to malls that act as attractors.
As the testing areas have high centrality and accessible density, it would be expected to present urban vitality. The other variables (plot size and frontage permeability) that were measured may, according to our hypothesis, affect this relation between density, centrality, and urban life.
3. Results
In what follows, we will present the test results of the two hypotheses central to this paper: the densification by verticalization with high-rise residential buildings in Brazil results in (1) big plot sizes and (2) low frontage permeability. The test results will be presented below after a short presentation of the distribution of permeability and plot sizes in the test areas and some general results of the gathered data on permeability.
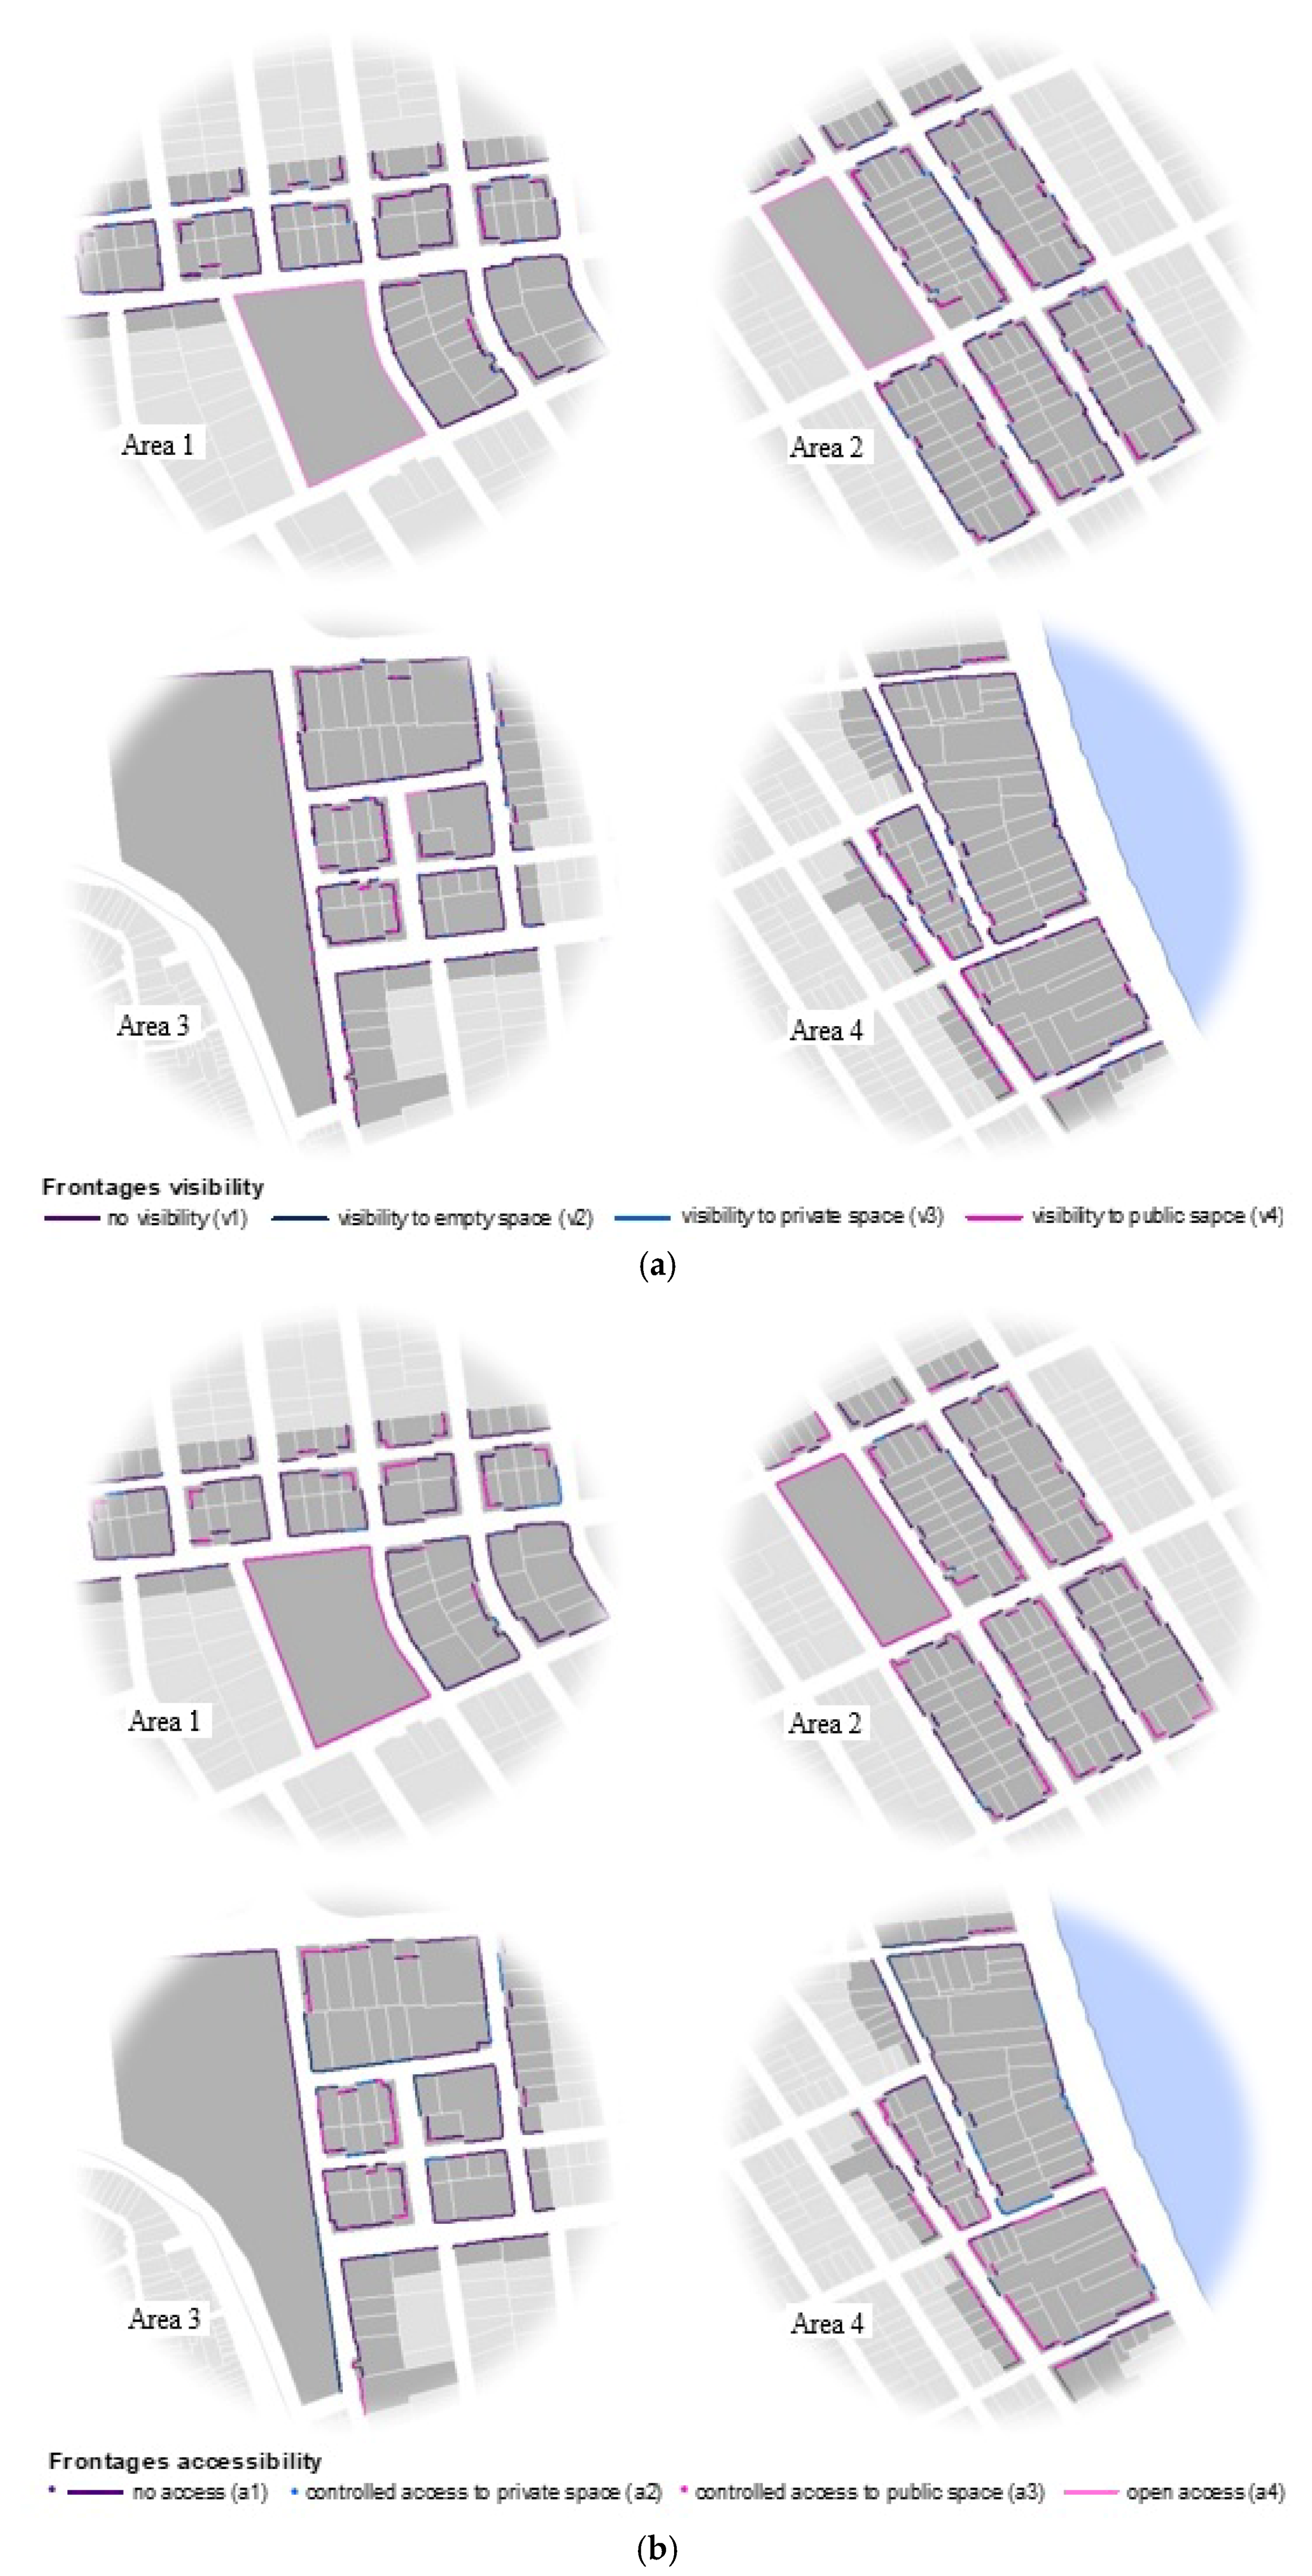
The frontage visibility and frontage accessibility maps (see Figure 2) show an overview of the frontage permeability in the testing areas, demonstrating that in all areas, there are many frontages with low visibility. There are also the following particularities: Area 1 presents more frontage permeability to private spaces, indicating it to be a more residential stretch. Area 2 is a more commercial one, as it presents more frontage permeability to (semi-)public spaces (retail and services). Areas 5 and 6 are mixed—they present stretches with permeability to private spaces close to stretches with permeability to (semi-)public spaces.
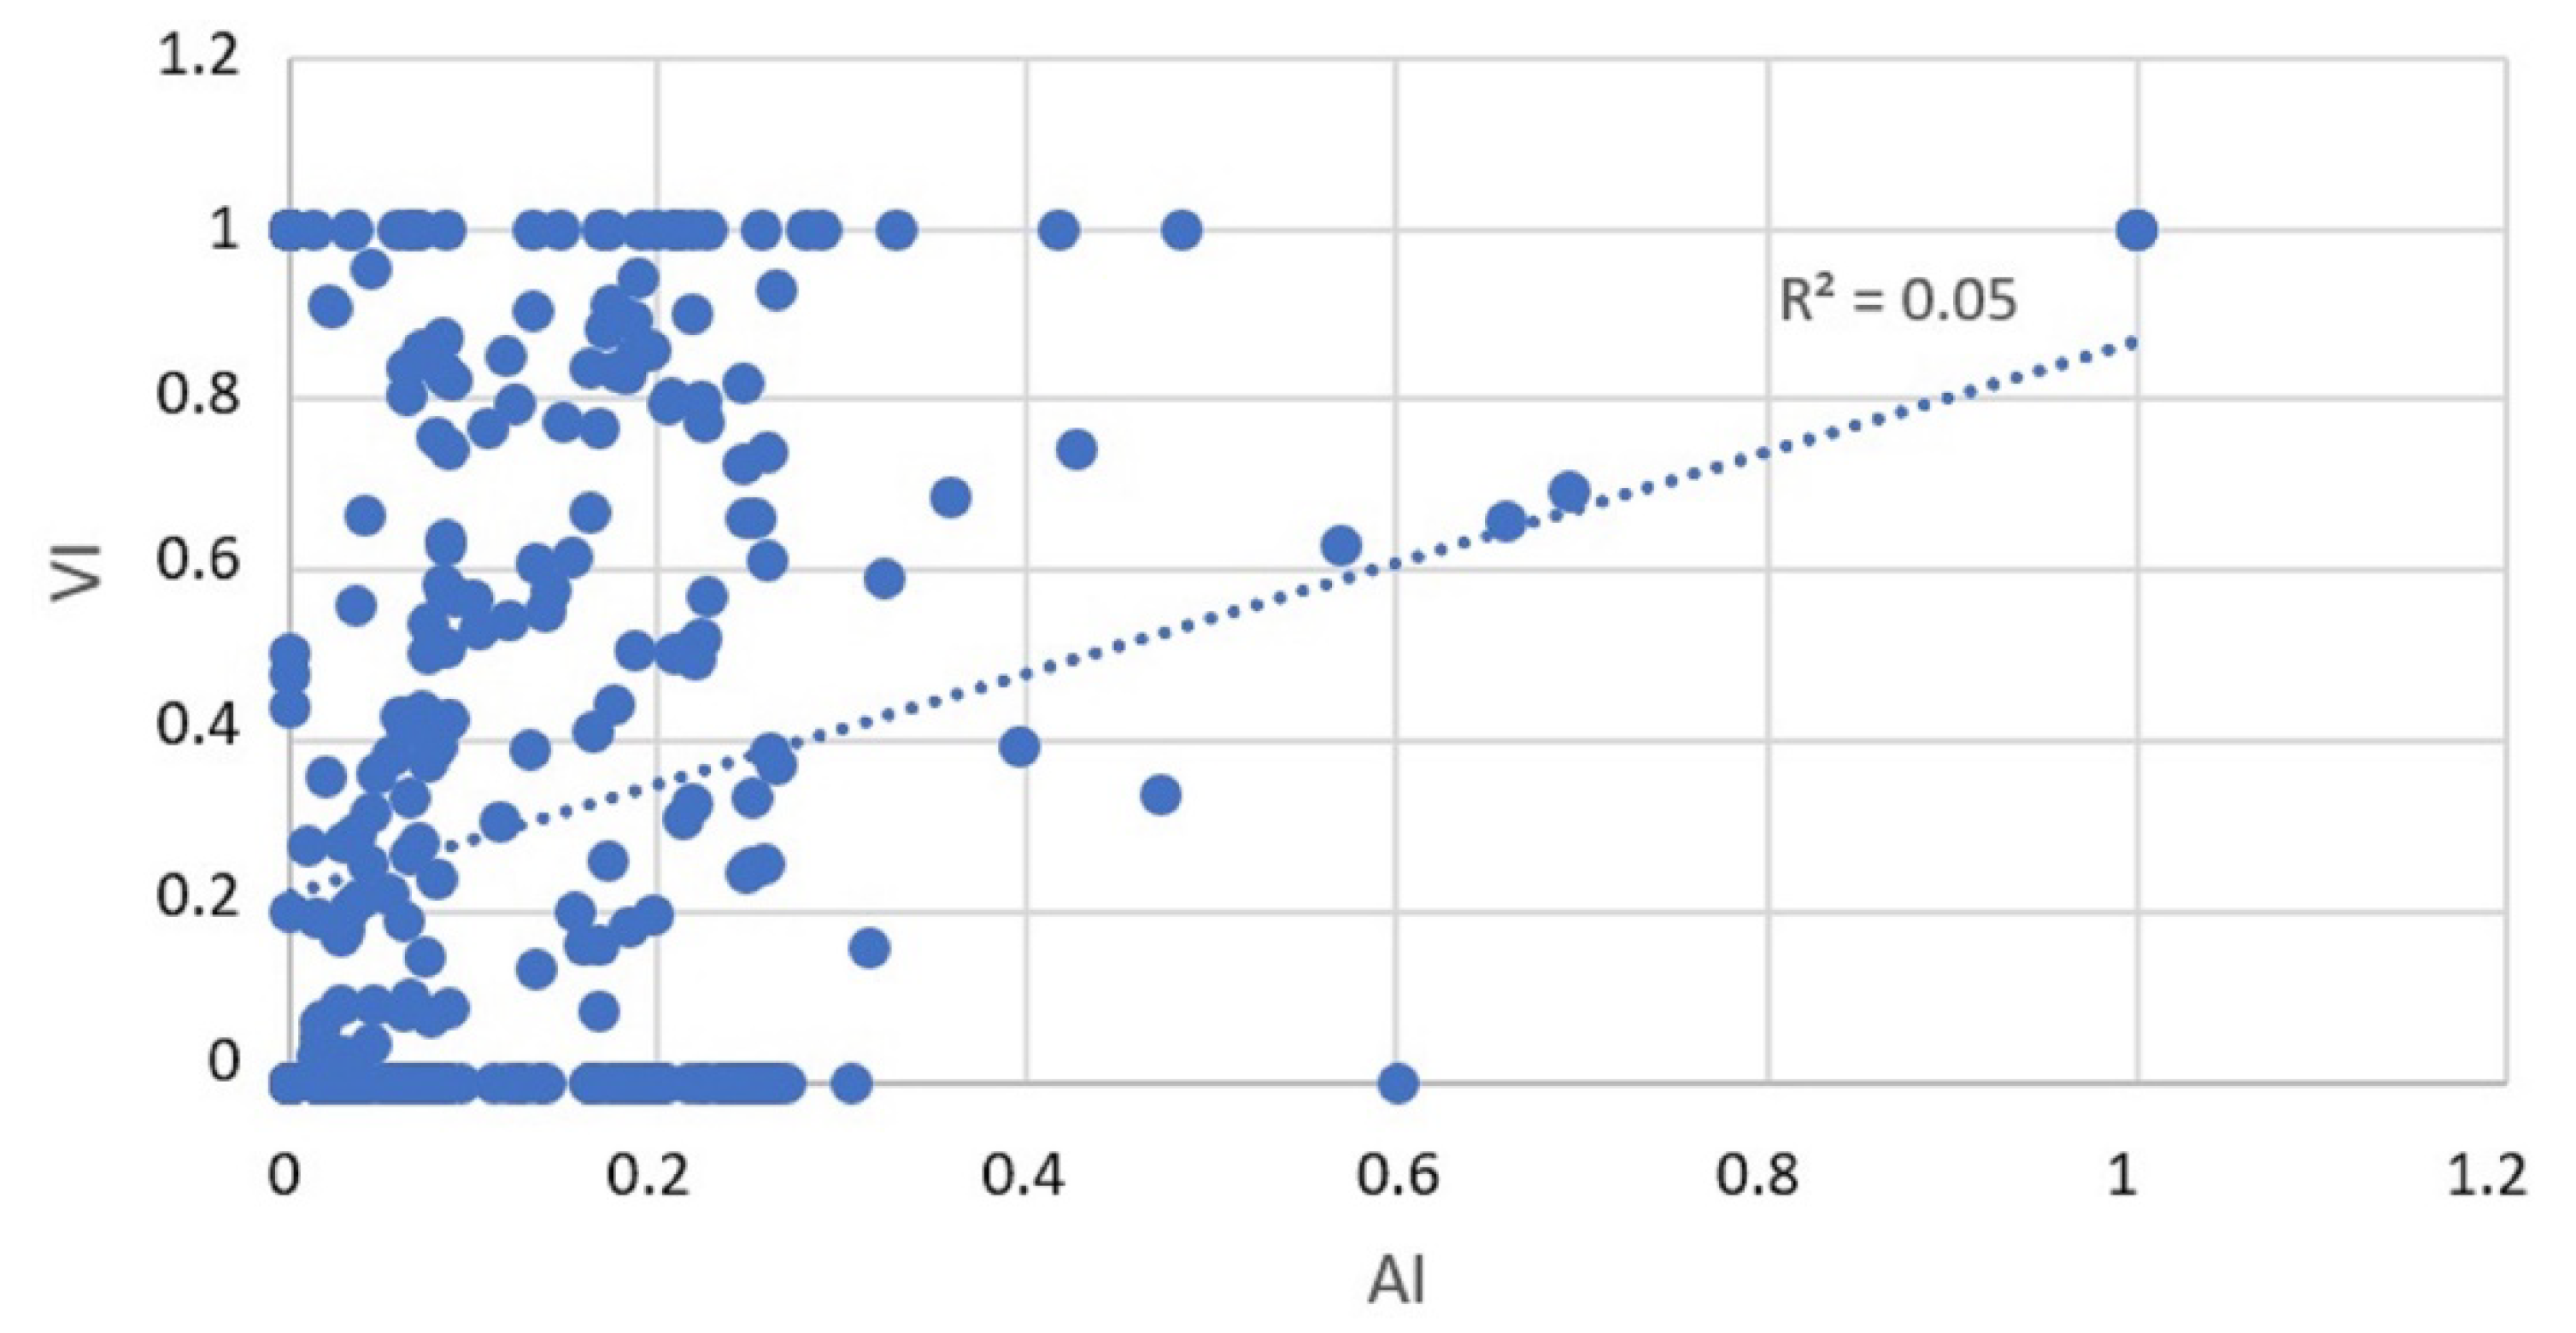
There is no statistical correlation between Accessibility Index—AI and Visibility Index—VI (R2 = 0.05), which means that accessibility and visibility do not necessarily occur together. This shows the pertinence of the proposed method in measuring these two variables separately (see Figure 3).
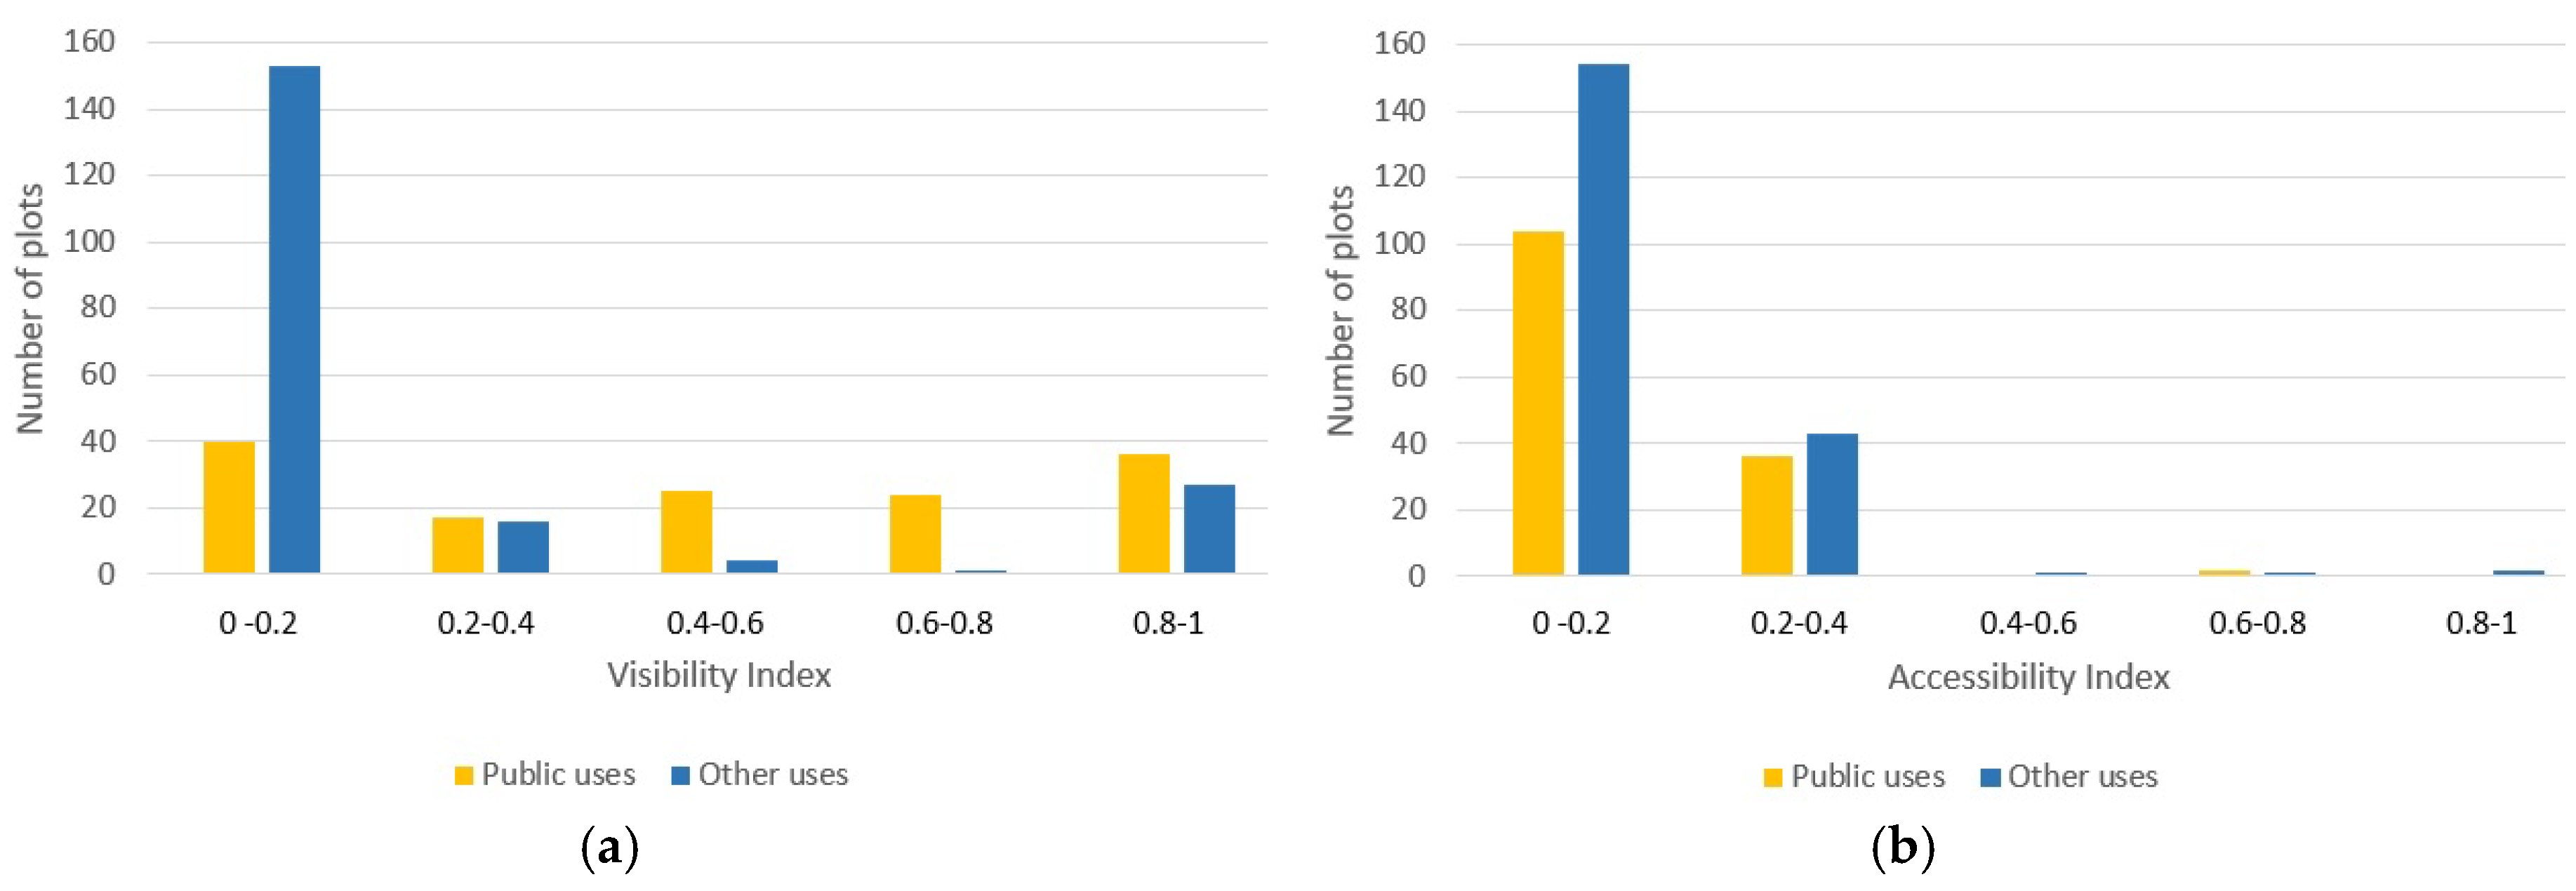
The two charts in Figure 4, which relate number of plots with (semi-)public uses and other uses to VI and to AI, respectively, show that both (semi-)public-use plots (retail and services) and those with other uses (housing, underutilization, and no use) present high and low frontage permeability, although in plots with other uses, the low values predominate. This indicates that the frontages of (semi-)public-use plots are not necessarily more permeable.
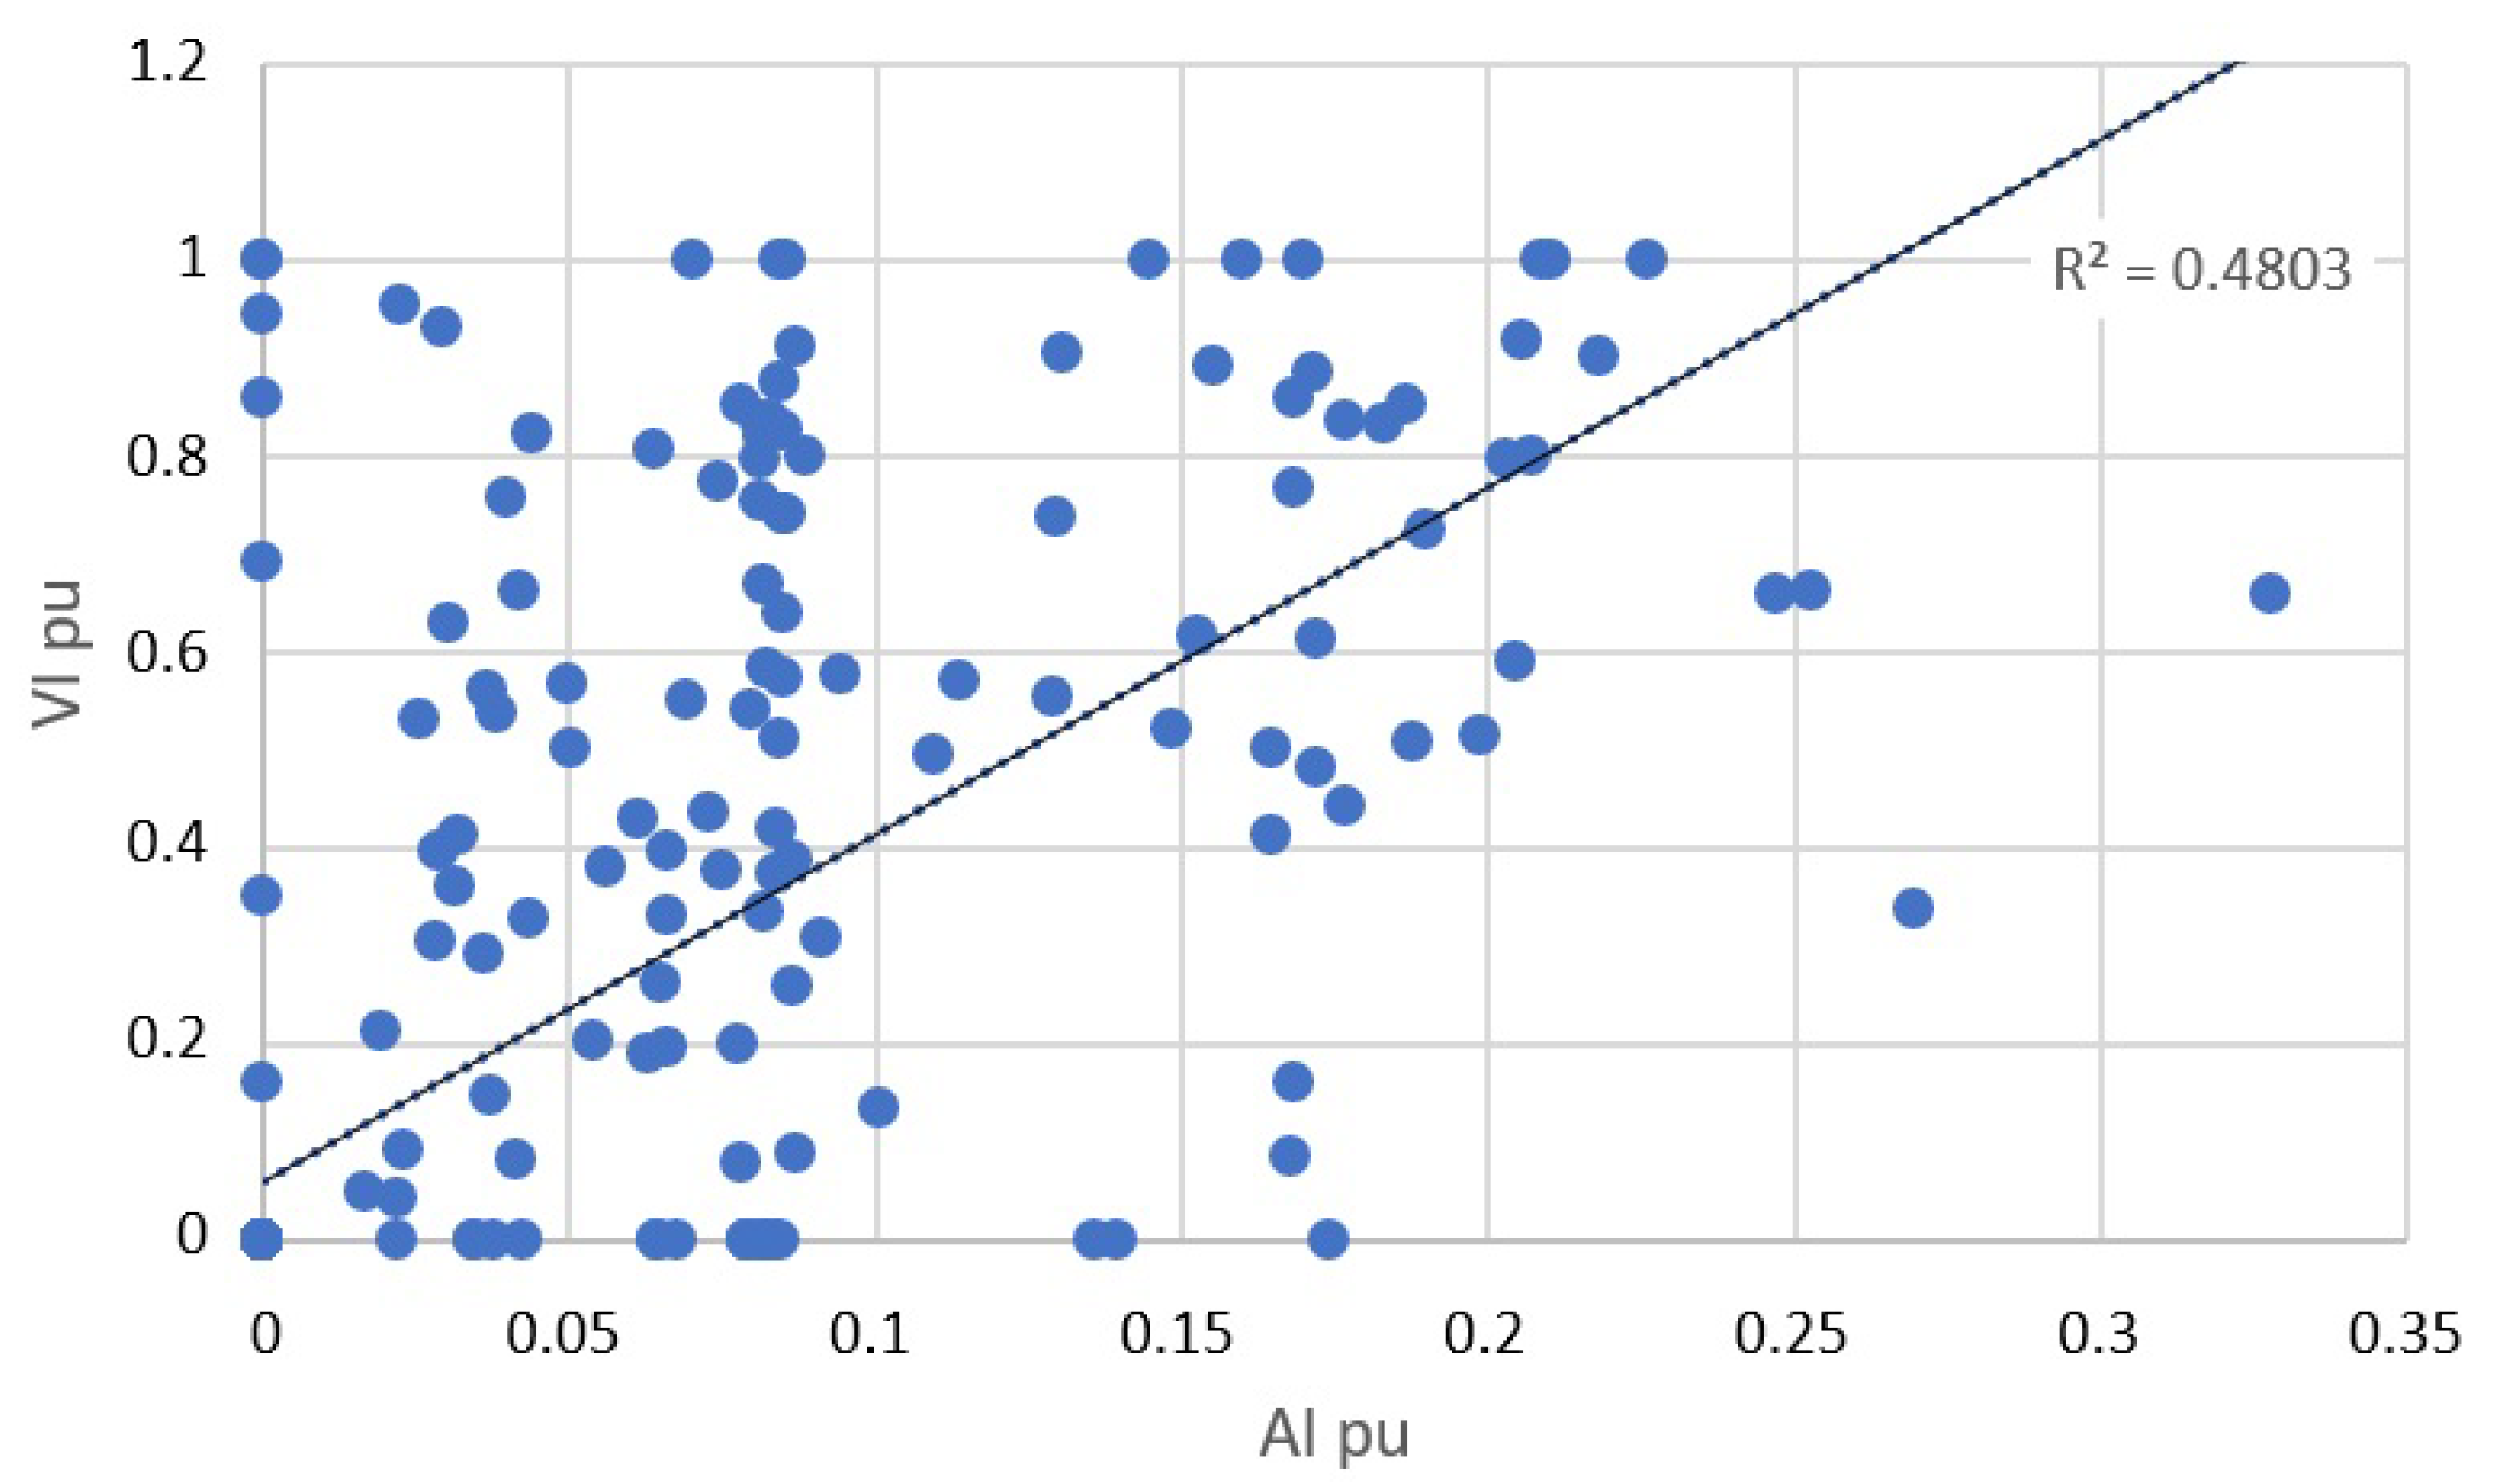
However, we found a strong correlation (R2 = 0.48) between the Accessibility Index to (semi)public space (AIpu) and the Visibility Index to (semi-)public space (VIpu), which indicates that, when there is higher accessibility to (semi-)public spaces, there is also higher visibility (see Figure 5).
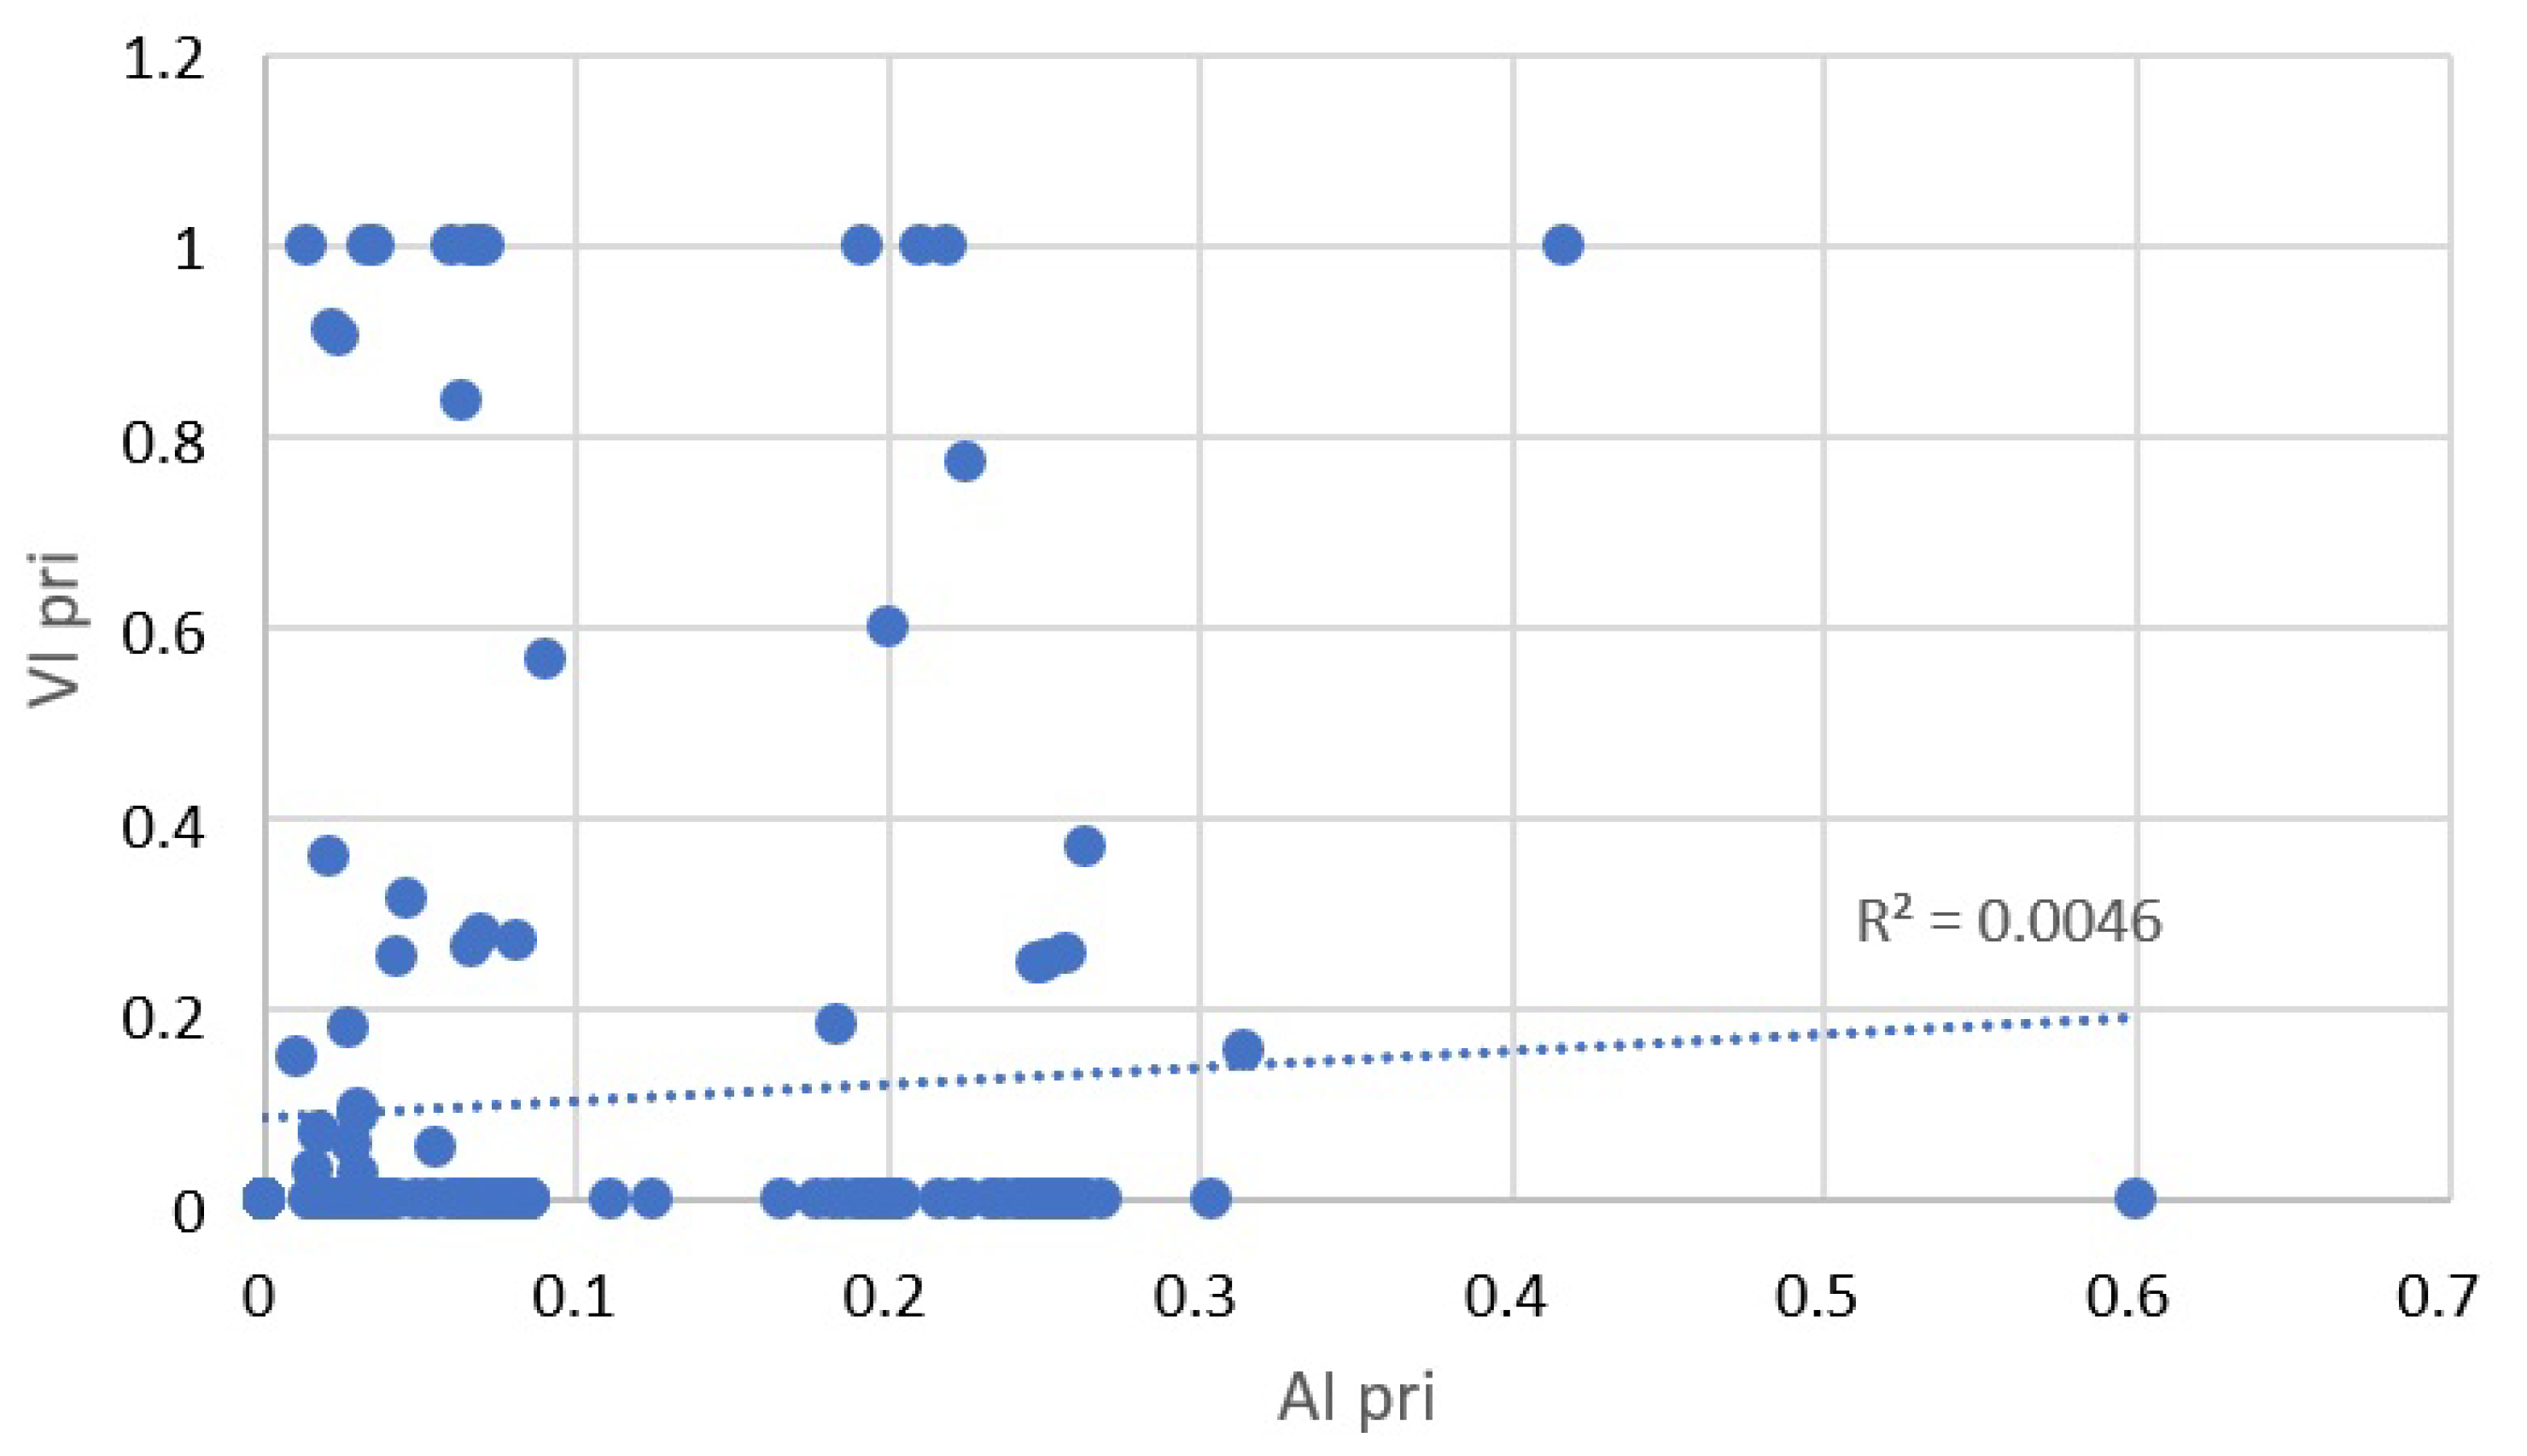
Differently, the Accessibility Index to private space (AIpri) and the Visibility Index to private space (VIpri) are not correlated (R2 = 0.0046), which means that the higher accessibility to private spaces is not necessarily accompanied by higher visibility (see Figure 6).
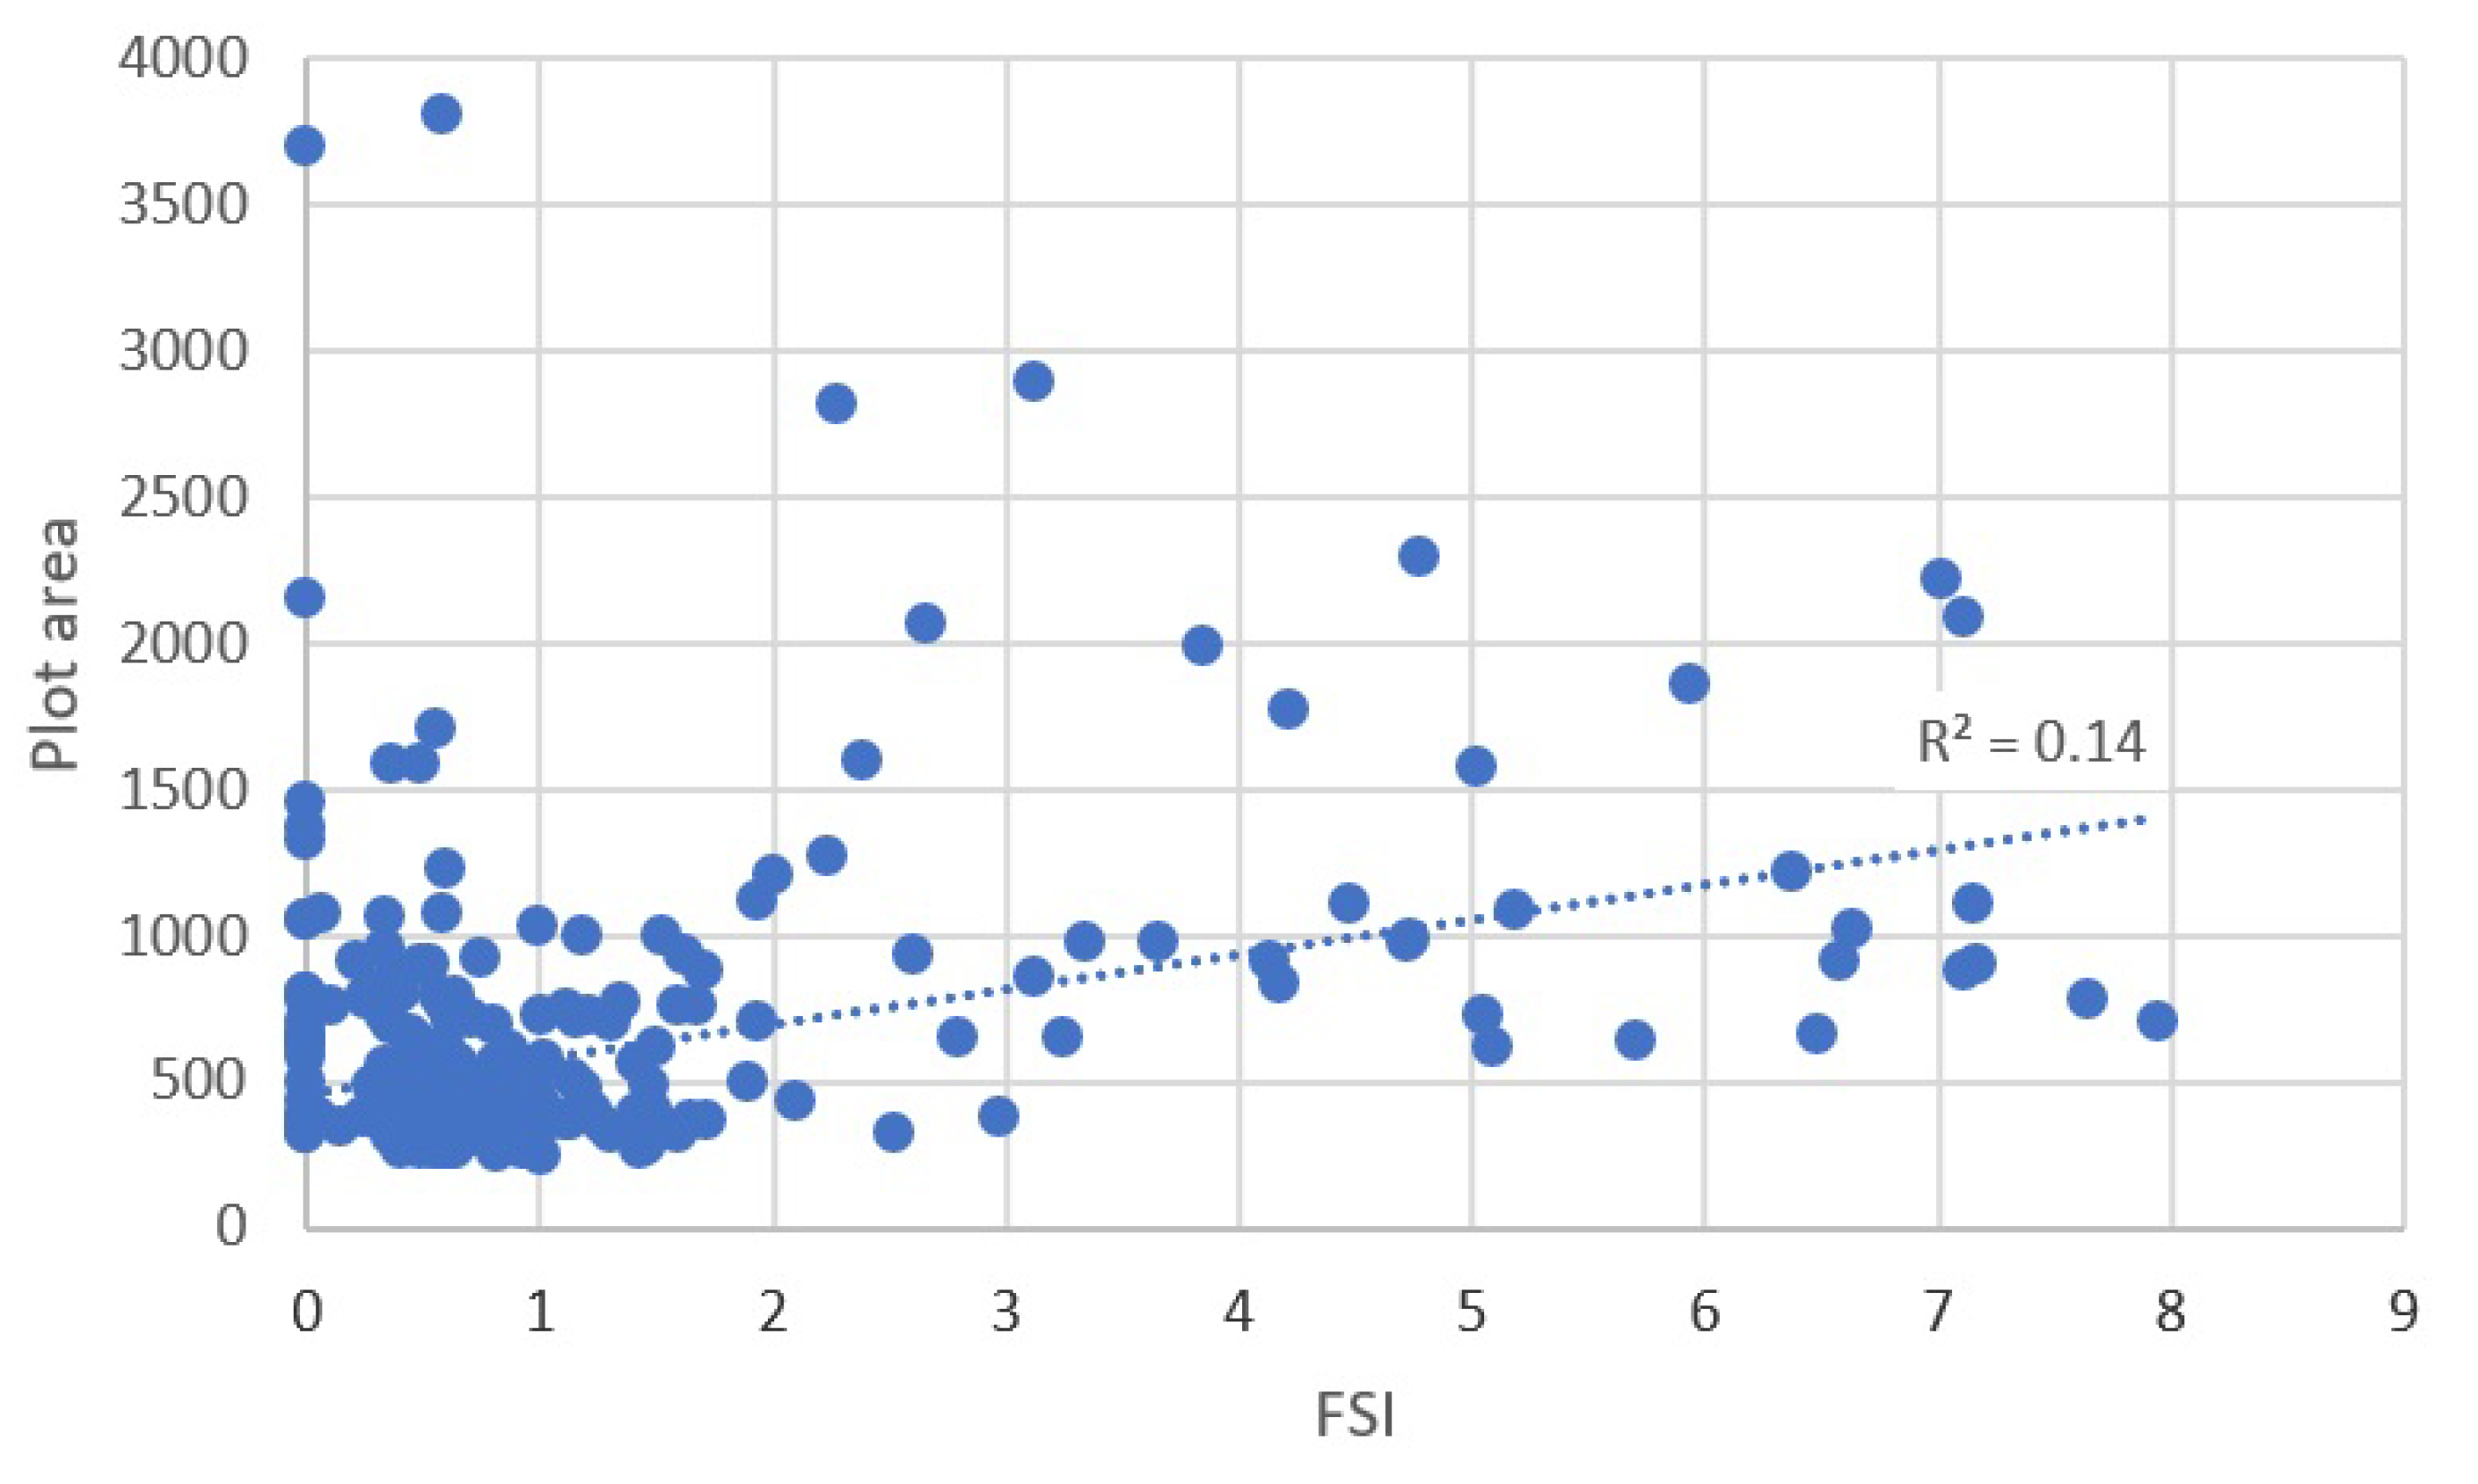
The moderate correlation between density and plot size (R2 = 0.14) shows that there are still many buildings with high FSI in relatively small or medium sized plots (see Figure 7). Therefore, the hypothesis that the verticalization type in focus brings about bigger plot sizes is not confirmed.
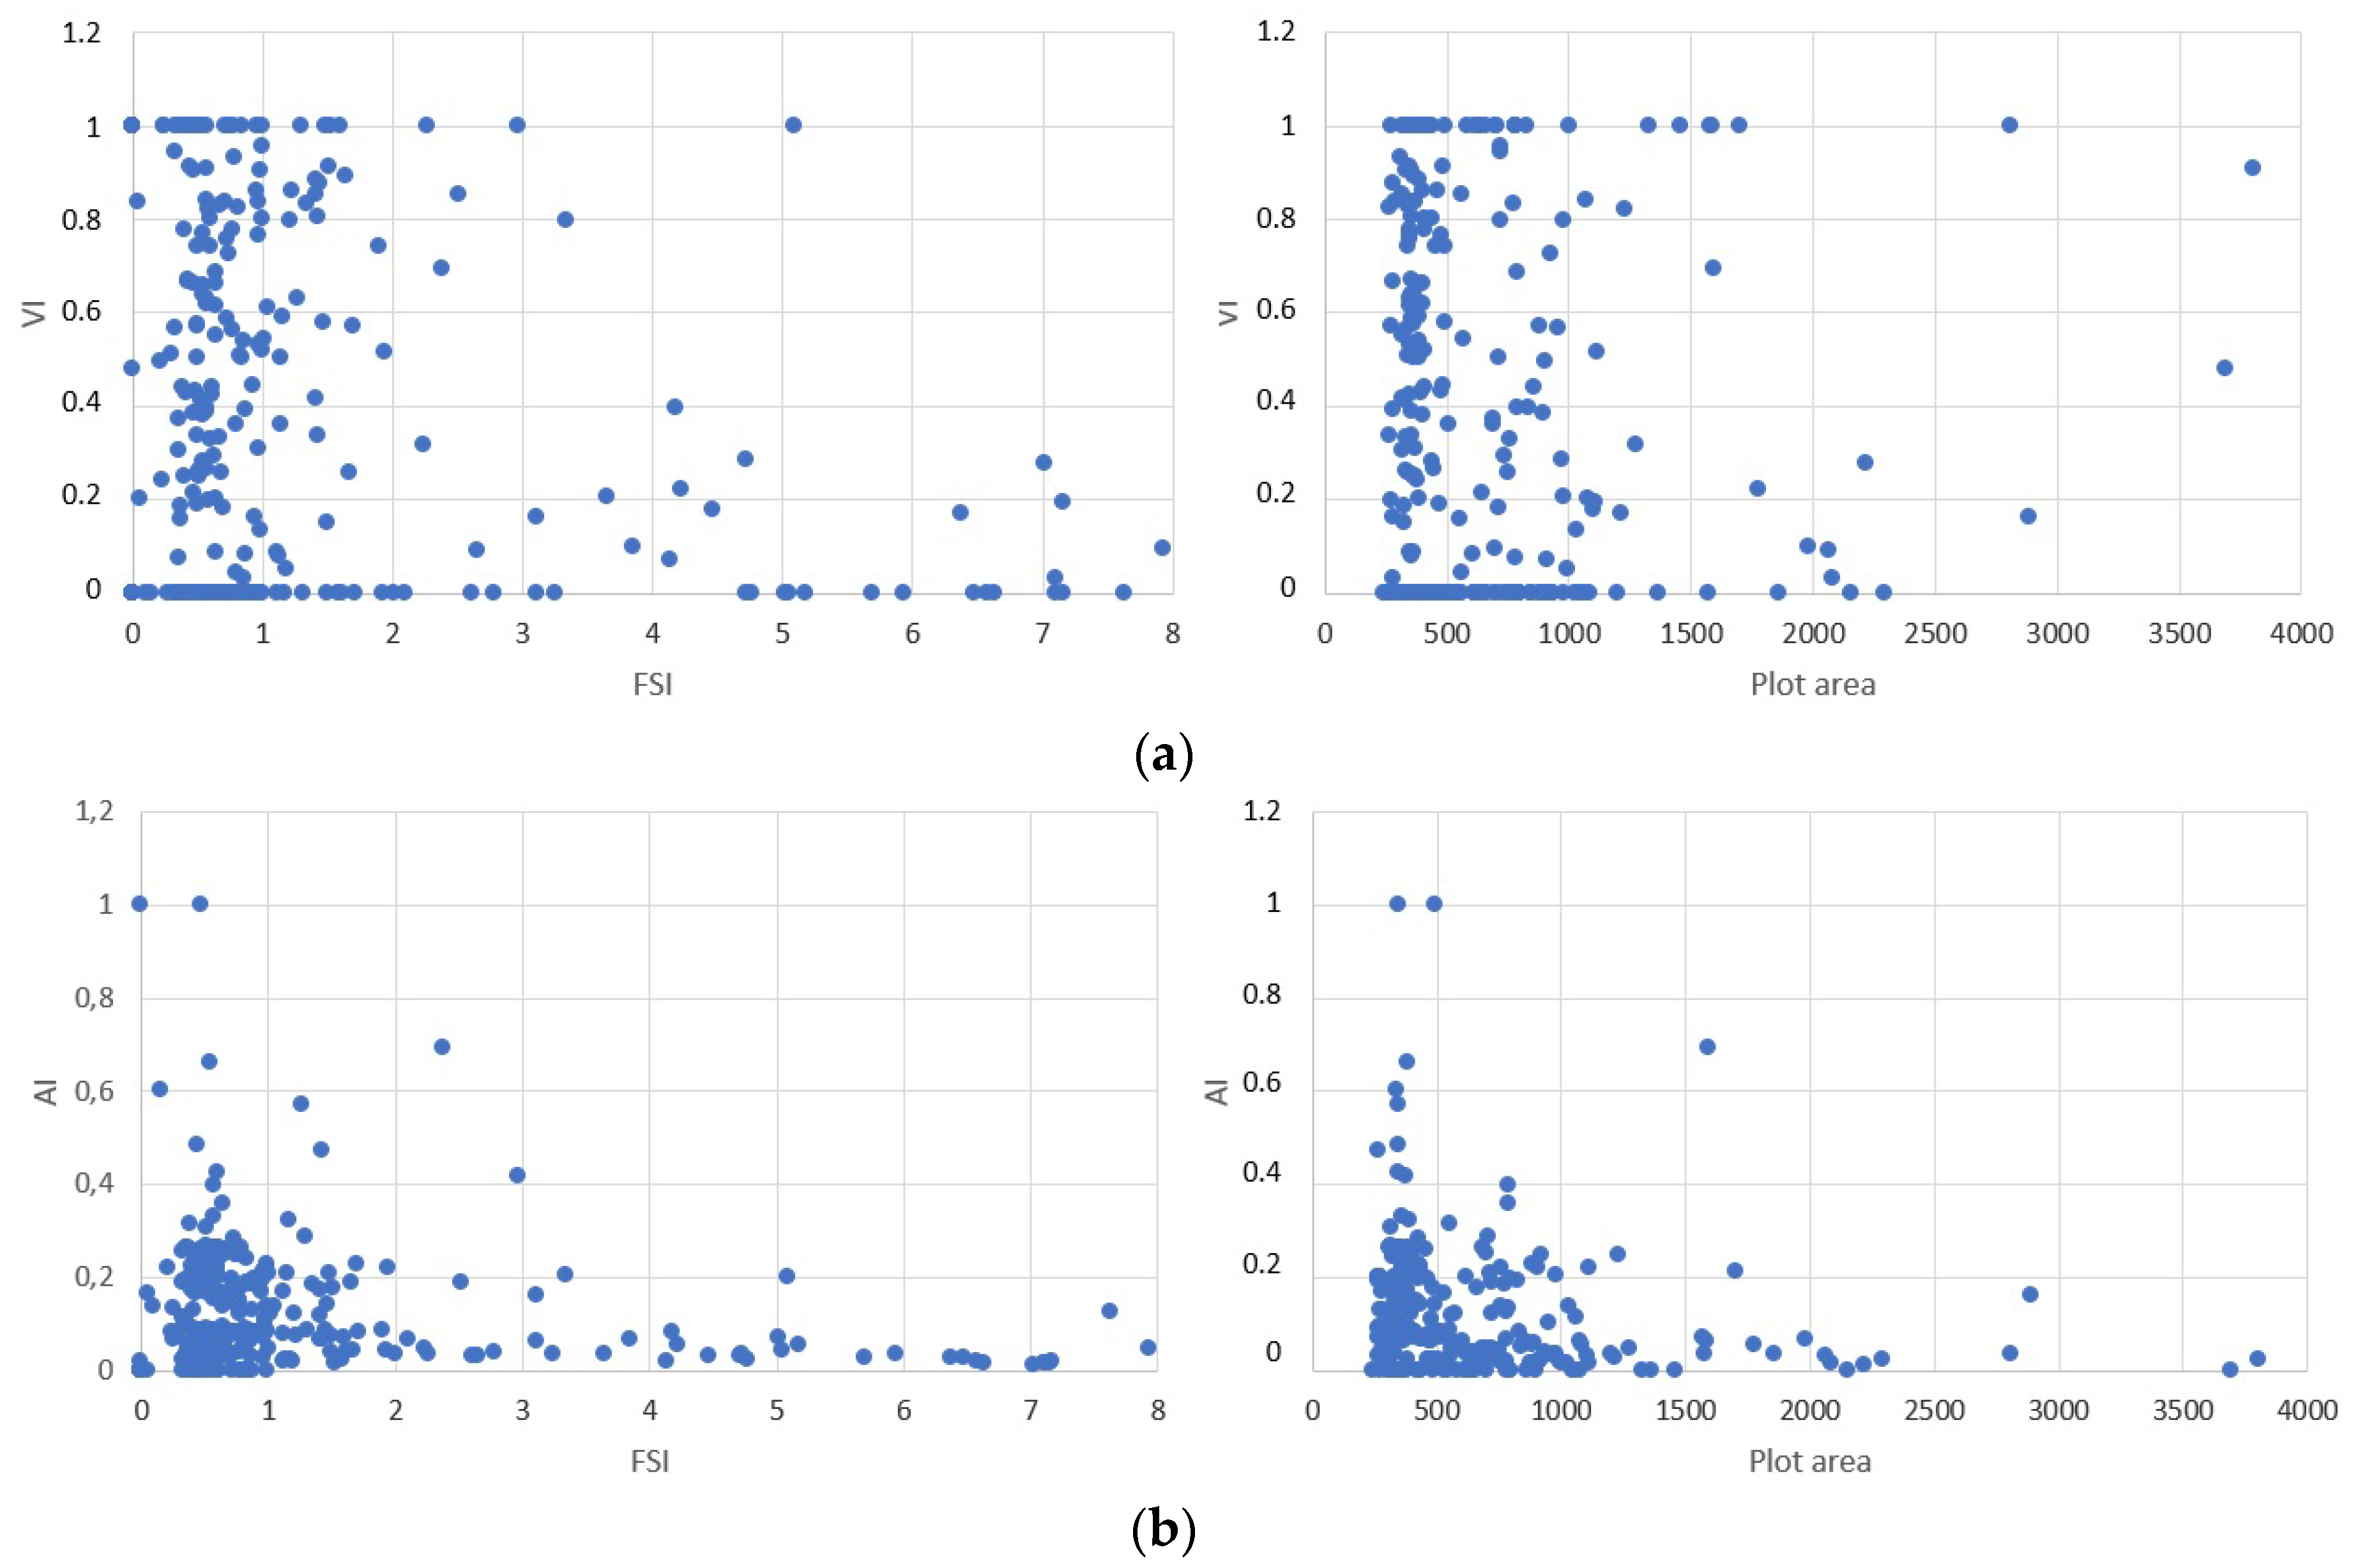
The graphs that relate the permeability indexes (VI and AI) to the FSI values of each plot do not demonstrate a strong statistical correlation between these variables. However, they show a clear pattern: in the low and medium densities (up to approximately FSI = 3), the entire range of VI and AI is present. At high densities (FSI above 3 to 8), however, both indexes remain low. This pattern is repeated in the analysis in relation to plot size (see Figure 8). It also occurs with the visibility and accessibility sub-indexes to (semi-)public spaces (VIpu and AIpu) and to both private and (semi-)public spaces (VIpri pu and AIpri pu). This pattern confirms the hypothesis that the high-rise residential building type with higher density (i.e., FSI) that is being implemented in the Brazilian cities shows a lower frontage permeability, both in terms of visibility and accessibility.
4. Conclusions and Discussion
The measure proposed for frontage permeability in this article contributes to the earlier developed “constitutedness rate” [11,12] that quantitatively described the interface between private and public spaces, but only recorded the presence of entrances, not classifying them and not considering the visibility aspect as is proposed in this article. Further, the measure proposed here can contribute to a method to evaluate the quality and performance of public space as was developed by the Project for Public Spaces organization (PPP) [26]. This PPP method is mainly qualitative, where this paper could add a quantitative method.
The proposed method of measuring frontage visibility and accessibility separately seems to be pertinent, as the results confirm that these variables do not necessarily go together. The results also indicate that verifying the land use to which there is permeability is relevant; the frontages of (semi-)public spaces (retail and services) are not always more permeable; although, when they present higher visibility, there is also higher accessibility, which does not necessarily happen in private space frontages.
Based on the pilot tests, it can be said that the method can be simplified concerning some points that did not appear to be significant. In the visibility variable, the “visibility to an empty space” category (v2) could be removed, because it is not frequent and when it occurs, it represents a small part of the plot frontage total length. In the accessibility variable, the “open access” category (a4) could also be removed, as the AIop (Accessibility Index for open access) always records very low values, demonstrating that open access is rare. About setbacks, results show that they are mostly used for parking, so they are not expected to contribute to social interactions. However, the effects of the setback variable can only be verified at a later stage when it will be related to the results of the pedestrian movement survey.
The article presents the hypothesis that the typical densification model in Brazilian cities with high-rise residential buildings results in large plots and low frontage permeability. The test results indicate the confirmation of the hypothesis that this verticalization model is found in combination with lower frontage permeability, but this trend is not found for plot size. We simply found high built density in larger plots, which are achieved by joining several plots, as well as in medium-sized plots, but the smallest plots are not represented.
As the results presented here are only based on a pilot test, more empirical studies need to be carried out in other districts and in other cities to obtain more complete and representative data, which may lead to more assertive conclusions. Nevertheless, the results give a clear indication that lower permeability and higher density seem to be combined in this verticalization model typical for many Brazilian cities.
The urban legislation of many Brazilian cities permits high densities that is actualized by real estate developers focused on profitability [27]. The possibility of multiplication of the built area increases the height of the buildings, the number of residential units to be sold, and, consequently, the profits. Because of policies that prioritize individual motorized transport, the high-rise residential buildings are in need of large parking areas that occupy a semi-underground floor and often also a ground floor, generating high and blind walls, and thus low permeability. Ordinarily, Brazilian municipalities’ legislation determines a minimum number of parking spaces per built square meter.
Figueiredo [27] further points out that when verticalization begins to occur in an area, the properties values increase and there is an incentive for new incorporations to occur. Especially when this model is repeated in adjacent plots, it creates continuous impermeable frontages, creating the risk of generating a poor, desolate, and unsafe urban environment, without diversity or the beneficial “eyes on the street” mentioned by Jacobs [2]. One should also consider the greater irreversibility of the vertical residential building type, as it is not easy to adapt them to other uses and even less likely that they will be replaced by new buildings in the coming decades.
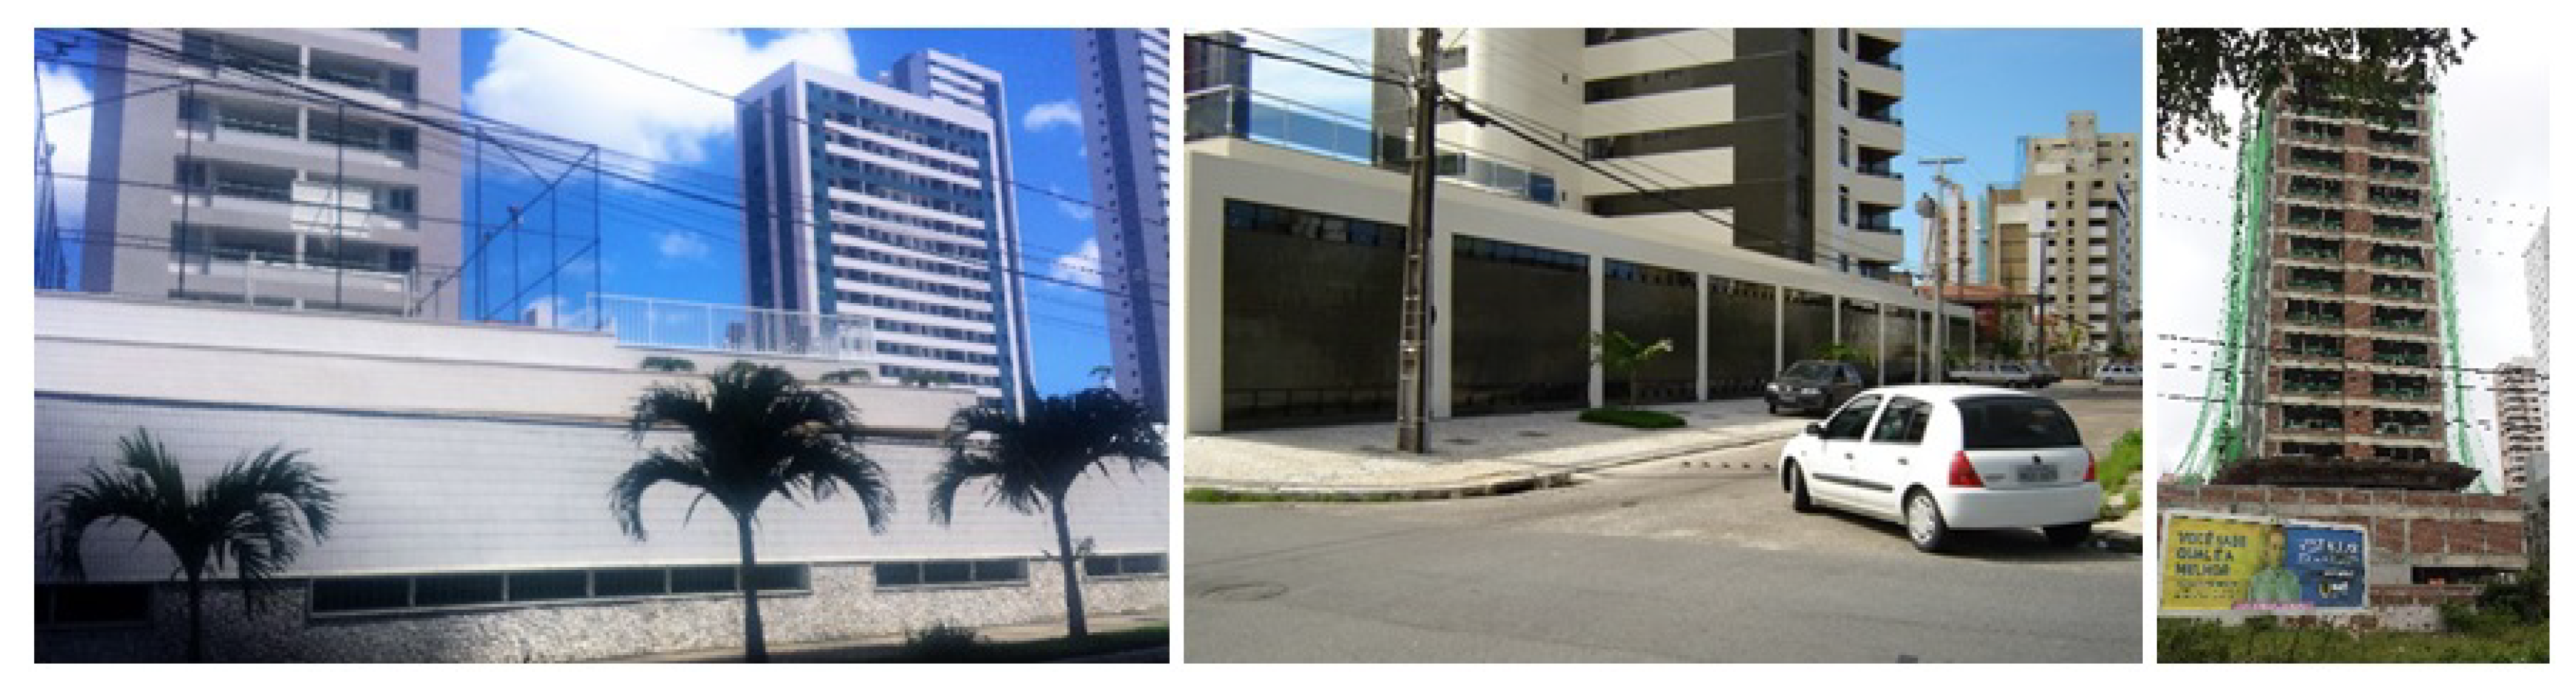
According to the results, there are also less dense building types that have low frontage permeability. However, these cases commonly have walls that can be easily modified or demolished to generate higher permeability. In high-rise residential buildings, most of the frontages are semi-underground garages walls that are more permanent structures and more difficult to modify (see Figure 9).
Brazilian cities development occurs in a context of extreme socioeconomic inequality, which is reflected in urban problems such as socio-spatial segregation and urban violence. These problems explain the presence of walls and, consequently, the low frontage permeability in different buildings types. However, the propagation of high residential buildings in Brazilian cities today is a strategy of urban space production that causes the loss of urban form diversity and adaptability in a more permanent way [27].
In the next stages of the research, the pilot study will be extended with additional areas including another district in the same city. Further, the morphological analysis will be related to the presence of people in public space based on a pedestrian survey. This survey will be used to verify the role of each variable, and the combination of variables, on the intensity of people co-present and urban vitality, as well as social processes related to that. If such a correlation is found, it is worth stressing the role of urban planning and management in controlling the current lack of frontages permeability. It would then be advisable that the urban legislation would establish minimum percentages of frontage permeability. It would also be pertinent to stimulate the mix and multiplicity of uses, guaranteeing the presence of public uses. However, it should be stressed that land uses are more volatile than the built environment, meaning that formal permeability is an important factor to promote an intense interaction between public and private realms.
It is worth emphasizing the pertinence of unfolding this research in the future by making a comparative data analysis through time—a longitudinal study where both spatial transformations are recorded and pedestrian survey conducted over time – that could help us better understand the effects of urban transformations on social processes.
Author Contributions
Conceptualization, P.A.d.A., M.B.P. and L.A.; Methodology, P.A.d.A., M.B.P. and L.A.; Software, P.A.d.A. and M.B.P.; Validation, P.A.d.A., M.B.P. and L.A.; Formal Analysis, P.A.d.A., M.B.P. and L.A.; Investigation, P.A.d.A., M.B.P. and L.A.; Writing—Original Draft Preparation, P.A.d.A. and M.B.P.; Writing—Review & Editing, P.A.d.A., M.B.P. and L.A.; Visualization, P.A.d.A., M.B.P. and L.A.; Supervision, M.B.P. and L.A.; Funding Acquisition, P.A.d.A.
Funding
This research was partially funded by Programa de Doutorado Sanduíche no Exterior—PDSE, from Coordenação de Aperfeiçoamento de Pessoal de Nível Superior (Capes), Ministério da Educação, Brasil, grant number 88881.132035/2016-01.
Acknowledgments
Spatial Morphology Group (SMoG) from Chalmers University f Technology.
Conflicts of Interest
The authors declare no conflict of interest. The founding sponsors had no role in the design of the study; in the collection, analyses, or interpretation of data; in the writing of the manuscript; and in the decision to publish the results.
References
- Hillier, B.; Penn, A.; Hanson, J.; Grajewski, T.; Xu, J. Natural movement: Or, configuration and attraction in urban pedestrian movement. Environ. Plan. B Plan. Des. 1993, 20, 29–66. [Google Scholar] [CrossRef]
- Jacobs, J. Morte e vida nas Grandes Cidades. Available online: https://edisciplinas.usp.br/pluginfile.php/3843818/course/section/923498/JACOBS-Jane-1961-Morte-e-Vida-de-Grandes-Cidades%20%281%29.pdf (accessed on 8 September 2018).
- Rogers, R. Cidades para um Pequeno Planeta; Gustavo Gili: Barcelona, España, 2014; ISBN 978-84-252-1889-7. [Google Scholar]
- Jenks, M.; Burgess, R. Compact Cities: Sustainable Urban Forms for Developing Countries; Taylor & Francis e-Library: London, UK, 2004; ISBN 0-203-78686-6. [Google Scholar]
- Haughley, R.M. Higher Development Density: Myth and Fact; ULI—Urban Land Institute: Washington, DC, USA, 2005. [Google Scholar]
- Conzen, M. Alnwick, Northumberland: A Study in Town-Plan Analysis; Institute of British Geographers: London, UK, 1960. [Google Scholar]
- Marcus, L. Spatial Capital: A Proposal for an Extension of Space Syntax into a More General Urban Morphology. J. Space Syntax 2010, 1, 30–40. [Google Scholar]
- Gehl, J. La Humanización del Espacio Urbano: La Vida Social Entre los Edificios; Reverté: Barcelona, España, 2006. [Google Scholar]
- Gehl, J. Cidades para Pessoas; Perspectiva: São Paulo, Brasil, 2013. [Google Scholar]
- Panerai, P.; Castex, J.; Depaule, J. Urban Form: The Death and Life of the Urban Block; Architectural Press: Oxford, UK, 2004; ISBN 0-7506 5607-7. [Google Scholar]
- Hillier, B.; Hanson, J. The Social Logic of Space; Cambridge University Press: London, UK, 1984. [Google Scholar]
- Hanson, J. Urban Transformations: A History of Design Ideas; Urban Design International: London, UK, 2000; Volume 5, pp. 97–122. [Google Scholar]
- Minoura, E. Uncommon Ground: Urban Form and Social Territory. Ph.D. Thesis, KTH Royal Institute of Technology, School of Architecture and the Built Environment, Stockholm, Sweden, 2016. [Google Scholar]
- Berghauser Pont, M.; Haupt, P. Space, Density and Urban Form; Technische Universiteit Delft: Delft, The Netherlands, 2009; ISBN 978-90-5269-375-0. [Google Scholar]
- Bobkova, E.; Marcus, L.; Berghauser Pont, M. Multivariable Measures of Plot Systems: Describing the potential link between urban diversity and spatial form based on the spatial capacity concept. In Proceedings of the 11th International Space Syntax Symposium, Lisboa, Portugal, 3–7 July 2017; Departamento de Engenharia Civil, Arquitetura e Georrecursos, Instituto Superior Técnico: Lisboa, Portugal, 2017. [Google Scholar]
- Berghauser Pont, M.; Marcus, L. Innovations in Measuring Density: From Area and Location Density to Accessible and Perceived Density. Nord. J. Arch. Res. 2014, 2, 11–30. [Google Scholar]
- Marcus, L.; Berghauser Pont, M.; Bobkova, E. Cities as Accessible Densities and Diversities: Adding attraction variables to configurational analysis. In Proceedings of the 11th International Space Syntax Symposium, Lisboa, Portugal, 3–7 July 2017; Departamento de Engenharia Civil, Arquitetura e Georrecursos, Instituto Superior Técnico: Lisboa, Portugal, 2017. [Google Scholar]
- Hillier, B. Space Is the Machine. A Configurational Theory of Architecture; Cambridge University Press: London, UK, 1996. [Google Scholar]
- Turner, A. Angular Analysis. In Proceedings of the 3rd International Space Syntax Symposium, Atlanta, GA, USA, 7–11 May 2001. [Google Scholar]
- Van Nes, A.; Stolk, E.H. Degrees of sustainable location of railway stations: Integrating Space Syntax and node place value model on railway stations in the province Noord-Holland’s strategic plan for 2010–2040. In Proceedings of the 8th International Space Syntax Symposium, Santiago, Chile, 3–6 January 2012; Available online: http://sss8.cl/8005.pdf (accessed on 21 August 2018).
- Van Nes, A.; Berghauser Pont, M.; Mashhoodi, B. Combination of Space Syntax with Spacematrix and the Mixed Use Index. The Rotterdam South test case. In Proceedings of the 8th International Space Syntax Symposium, Santiago, Chile, 3–6 January 2012; Available online: https://www.researchgate.net/publication/239844249_Combination_of_Space_syntax_with_spacematrix_and_the_mixed_use_index_The_Rotterdam_South_test_case (accessed on 21 August 2018).
- IBGE. Instituto Brasileiro de Geografia e Estatística. Cidades. Available online: https://cidades.ibge.gov.br/brasil/pb/joao-pessoa/panorama (accessed on 14 February 2018).
- Andrade, P.A.F.; Leite Ribeiro, E.; Silveira, J.A.R. Centralidade Urbana na Cidade de João Pessoa—PB. Uma Análise dos USOS Comerciais e de Serviços ENTRE o Centro Tradicional e o Centro Seletivo—1970/2006. Arquitextos Vitruvius, São Paulo, 106.06 ano 09, Mar. 2009. Available online: http://www.vitruvius.com.br/revistas/read/arquitextos/09.106/69 (accessed on 1 October 2016).
- Villaça, F. Espaço Intra-Urbano no Brasil; Studio Nobel: São Paulo, Brasil, 2001. [Google Scholar]
- João Pessoa. Base Geral de Dados Dos Lotes Urbanos; Prefeitura Municipal de João Pessoa: João Pessoa, Brazil, 2016.
- Project for Public Spaces. What Makes a Successful Place? Project for Public Spaces, 30 December 2009. Available online: https://www.pps.org/article/grplacefeat (accessed on 21 August 2018).
- Figueiredo, L. Urbanidades; Folio Digital: Rio de Janeiro, Brazil, 2012; ISBN 978-85-61012-09-0. Available online: https://www.academia.edu/6314921/URBANIDADES._Livro_completo_ (accessed on 21 August 2018).
Scheme 1.
Permeability measure scheme.

Figure 1.
Map of a section of Manaíra district (João Pessoa, Brazil), with testing areas marked, showing accessible Floor Space Index (FSI) within 500 m walking distance.
Figure 1.
Map of a section of Manaíra district (João Pessoa, Brazil), with testing areas marked, showing accessible Floor Space Index (FSI) within 500 m walking distance.

Figure 2.
(a) Maps of the four testing areas, showing frontages visibility; (b) maps of the four testing areas, showing frontages accessibility.
Figure 2.
(a) Maps of the four testing areas, showing frontages visibility; (b) maps of the four testing areas, showing frontages accessibility.

Figure 3.
Chart with relation, per plot, between Accessibility Index (AI) on the x-axis and Visibility Index (VI) on the y-axis.
Figure 3.
Chart with relation, per plot, between Accessibility Index (AI) on the x-axis and Visibility Index (VI) on the y-axis.

Figure 4.
(a) Chart with relation between Visibility Index and land uses ((semi-)public or non-public) per plot; and (b) chart with relation between Accessibility Index and land uses ((semi-)public or non-public) per plot.
Figure 4.
(a) Chart with relation between Visibility Index and land uses ((semi-)public or non-public) per plot; and (b) chart with relation between Accessibility Index and land uses ((semi-)public or non-public) per plot.

Figure 5.
Chart with correlation (R2 = 0.48) per plot between Accessibility Index to (semi-)public spaces (AIpu) on the x-axis and Visibility Index to (semi-)public spaces (VIpu) on the y-axis.
Figure 5.
Chart with correlation (R2 = 0.48) per plot between Accessibility Index to (semi-)public spaces (AIpu) on the x-axis and Visibility Index to (semi-)public spaces (VIpu) on the y-axis.

Figure 6.
Chart with relation per plot between Accessibility Index to private space (AIpri) on the x-axis and Visibility Index to private (VIpri) on the y-axis.
Figure 6.
Chart with relation per plot between Accessibility Index to private space (AIpri) on the x-axis and Visibility Index to private (VIpri) on the y-axis.

Figure 7.
Chart with relation between FSI and plot area per plot.

Figure 8.
(a) On the left, chart with relation, per plot, between FSI on the x-axis and Visibility Index (VI) on the y-axis. On the right, chart with relation, per plot, between plot size on the x-axis and Visibility Index (VI) on the y-axis; (b) On the left, chart with relation, per plot, between FSI on the x-axis and Accessibility Index (AI) on the y-axis. On the right, chart with relation, per plot, between plot size on the x-axis and Accessibility Index (AI) on the y-axis.

Figure 9.
Frontages of high-rise residential buildings in Manaíra; walls of semi-underground and ground floor garages.
Figure 9.
Frontages of high-rise residential buildings in Manaíra; walls of semi-underground and ground floor garages.

© 2018 by the authors. Licensee MDPI, Basel, Switzerland. This article is an open access article distributed under the terms and conditions of the Creative Commons Attribution (CC BY) license (http://creativecommons.org/licenses/by/4.0/).
Share and Cite
MDPI and ACS Style
Alonso de Andrade, P.; Berghauser Pont, M.; Amorim, L. Development of a Measure of Permeability between Private and Public Space. Urban Sci. 2018, 2, 87. https://0-doi-org.brum.beds.ac.uk/10.3390/urbansci2030087
AMA Style
Alonso de Andrade P, Berghauser Pont M, Amorim L. Development of a Measure of Permeability between Private and Public Space. Urban Science. 2018; 2(3):87. https://0-doi-org.brum.beds.ac.uk/10.3390/urbansci2030087
Chicago/Turabian StyleAlonso de Andrade, Patrícia, Meta Berghauser Pont, and Luiz Amorim. 2018. "Development of a Measure of Permeability between Private and Public Space" Urban Science 2, no. 3: 87. https://0-doi-org.brum.beds.ac.uk/10.3390/urbansci2030087