Locational Attractiveness Modelling of Retail in Santa Maria, Brazil


1
Graduate Program on Urban and Regional Planning—PROPUR, School of Architecture, Federal University of Rio Grande do Sul (UFRGS), Porto Alegre 90 050-170, Brazil
2
Department of Urbanism, Graduate Program on Urban and Regional Planning—PROPUR, School of Architecture, Federal University of Rio Grande do Sul (UFRGS), Porto Alegre 90 050-170, Brazil
*
Author to whom correspondence should be addressed.
Urban Sci. 2018, 2(4), 105; https://0-doi-org.brum.beds.ac.uk/10.3390/urbansci2040105
Submission received: 14 September 2018
/
Revised: 3 October 2018
/
Accepted: 10 October 2018
/
Published: 16 October 2018
(This article belongs to the Special Issue Formalizing Urban Methodologies)
Abstract
:A central topic in the retail analysis is store location, which is related to its attractiveness and even with its profitability. In order to determine the force of attraction of a given point of sale, methodologies based on gravitational models have been developed. More recently, classic models have been integrated with Geographic Information Systems (GIS). This paper explores a methodology for retail spatial analysis in a GIS environment, and it aims to: (a) model the degree of influence of different store location attributes on the consumer choice among a collection of retail options, and (b) develop an empirical application for the clothing retail business sector in the city of Santa Maria, RS, Brazil. The study selects three relevant location attributes of store choice: retail market clustering, local accessibility of the street network, and topographic slope of the terrain. These three location features were taken as inputs for the attractiveness evaluation of each store, using the Huff model. As a result, we were able to model the trading areas of each shop related to the selected attributes. The paper provides a methodology for modelling the performance of retail location attributes and building different scenarios of probabilities for consumer patronage, allowing a first measure of the influence of each selected store location attribute.
1. Introduction
Trading is one of the most primitive and fundamental social relations in human society. In the contemporary cities, retail is a fundamental activity, either from an economic, social, or spatial point of view. The spatial structure of cities is closely linked to the location and spatial pattern of retail establishments. The importance of this activity is highlighted in the literature as attracting movement, creating centralities, as well as reinforcing the revitalization of urban areas.
Retail location is a central topic in market geography. Once a retailer has decided on where to put a store, and how big to build it, he has well set at least the range of its future profits [1]. According to Clarke, the location decision is the most important one, because the retailer must live with it and handle it continually to ensure profitability [2]. Many studies seek to identify the logic of the spatial location and distribution of trade in cities. Among these approaches are the gravitational models, pioneered by William J. Reilly, whose work was published in 1931. This author associated Newton’s universal law of gravitation to what he called attraction force between two retail centers and their potential clients. Later, David Huff improved this idea, including in his equations the attractive potential of several establishments competing by customer preference. Over time, studies have been seeking to explore the importance of several attributes that hold influence in consumer’s choice [3]. Recently, classic models as Huff have been integrated to the computational environment through the Geographic Information Systems (GIS), associated with a greater availability of georeferenced urban data.
This paper adopts a retail gravitational approach (Huff model) exploring a methodology for retail spatial analysis in a GIS environment. The main objectives are: (a) discussing the influence of different store location attributes in consumer choice among a group of retail offers, and (b) developing an empirical application for the clothing retail business sector in the city of Santa Maria, RS, Brazil. In this study, we will emphasize urban location attributes rather than store attributes, focusing on three aspects of urban form: store clustering, accessibility, and topographic slope. The software ArcGIS® was used as the integrating environment for different analysis tools.
This paper is aiming to enrich the traditional modelling of retail attractiveness by introducing more qualitative descriptions of retail location: location is not only about the distance to the consumers, but also to some urban form attributes, such as street grid connectivity, relative position, terrain slope, spatial agglomeration, etc.
The remainder of this paper is organized as follows. First, the theoretical background of the paper is presented, focusing on the issue of retail location. Section 3 defines the methodology of the study, including the process of modelling, selected variables, and empirical data. Section 4 presents the results and discussion of the empirical application in Santa Maria. The final section concludes the main findings and the limitations and potentialities of the methodology, and possible future studies in this topic.
2. Retail Location
This section presents a brief review of the main topics on retail location theories, and also some new contributions from configurational studies. Gravitational models of retail location are discussed, focusing on the Huff model, which is adopted in this study.
2.1. Factors of Retail Localization
Numerous factors affect the performance of a retail business, which can be classified as spatial and non-spatial factors [4]. The focus of the present study lies under the spatial factors, studied by Christaller [5] and Berry [6] who analyzed the trend of retail activities and services to cluster in the same area, leading to different hierarchized centers. Central place theory calls attention to an important parameter of retail location: accessibility to the consumers. In general terms, accessibility may be taken as an indicator of local development, associated with land values, construction densities, land use competition, specialization, and spatial concentration [7]. The importance of accessibility in retail location is highlighted by Ikuno, who values this attribute by its convenience [8], and by Dawson [9], who moreover, classifies it as being probably the most important attribute in consumer choice, when associated with the quality of service and competition.
One aspect related to location is store spatial agglomeration. Several studies point out the significance of retail concentration as a factor of attraction for consumers and a strategy to minimize the negative effects of the competition. Konishi attributes the success of concentrated retail centers to: (a) the uncertainty of the client preference—store clustering outweighs the uncertainty associated with the consumer search, and (b) the expectation of low prices—a high concentration of stores would suggest lower prices [10]. The agglomeration of different types and sizes of stores seems to positively influence the consumer’s choice, not only in multiple-purpose trips, but also in single-purpose shopping trips [11].
Another research branch, configurational studies, has also been contributing in the discussion of the spatial patterns of retail. Urban configurational studies [12,13,14] have sought to analyze the spatial differentiation emerging from the street networks, identifying the relationship between the location of retail activities and some features of the urban street grid (connectivity, accessibility, centrality). Such studies have allowed for a more detailed analysis of the urban space, overcoming aggregated locational analysis based on zones and distances. Hillier states that living centralities always have distinctive spatial components, both on the global scale (high accessibility) and local scale (high connectivity to the neighbors) [15]. Van Nes suggests that a high connectivity and density of the streets are important conditions to the vitality of retail centers [16]. The relationship between different measures of the street network centrality and retail and services densities is analyzed by [13] in Bologna. In this study, data on the location of the retail establishments and the configurational measures of the street network were transformed into Kernel density gradients. The results show that the distribution of retail and service activities in Bologna correlates well with betweenness centrality (which captures the potential of a place to be traversed by shortest paths), and with closeness centrality (which captures how close a place is to all other places in the network). Chiaradia et al. analyze several commercial centers in London in order to identify how retail agglomeration patterns relate to street grid configuration [17]. The authors verified that retail centralities have specific configurational signatures, being spatially distinguishable from their context by higher values of Integration (closeness centrality) and Choice (betweenness centrality). In a study in Cambridge and Somerville (MA, USA), Sevtsuk analyzes whether and how the distribution of retailers is affected by the spatial configuration of the built environment—the physical pattern of urban infrastructure, the spacing and sizes of buildings, and the geometry of circulation routes [18]. The author verifies that the probability of a building accommodating retail increases with many features such as: agglomeration of similar retailers, the density of the built fabric around the store location, the proximity to employment density, the proximity to transit stations, the configurational metrics of betweenness, direct adjacency to more streets, and sidewalk width.
Some other features of urban form are more closely related to retail micro-localization, as the existence of land with suitable dimensions, good visibility, and flatter topography. Studies have shown that the streets with high slope tends to discourage pedestrians [19,20], and in general, they are not favorable for retail locations.
2.2. Analyzing Retail Location through Gravitational Models
As already mentioned, one of the pioneers in applying gravitational approaches to retail studies was Willian Reilly. For the author, given two cities that have a trade relationship with an intermediate city, the strength of this relationship will be proportional to the population of these two cities, and inversely proportional to the square of their distance to the intermediate city [21]. Despite its simplistic nature, Reilly’s theory became the basis for important market studies such as optimal locations for a new outlet, sales forecasting, market area estimation, impacts of new store openings, and so on [3]. In addition, a family of models derived from Reilly’s approach, associated with the areas of psychology, sociology, and human behavior, were developed, all in search of the understanding of the preference of the consumer for a certain commercial center [22].
Huff departs from Reilly’s work proposing an alternative model where the focus is the consumer rather than the firm [23]. He develops a probabilistic model of retail, considering the consumer’s choices between a set of alternative centers simultaneously, and determining the probability surfaces associated with each center. For the author, consumers choose between competing centers based on their “utility”, which in the model is defined as a relationship between attraction factors (size of center, e.g.,) and constraint factors (travel time). In other words, each center has a probability of being chosen, which is directly proportional to the size of the center and inversely proportional to the distance that separates the consumer from the center, this equation being inversely related to the relative utilities of all other competing centers. In this sense, market areas should not be conceived of as dividing into specific points (breaking points), but as overlapping and merging areas in a more realistic way.
According to the model, the probability () of a consumer at a given point of origin i travelling to a particular center j is calculated according to the formula:
where:
- Aj is a measure of the attractiveness of the center j, e.g., the size of selling area.
- Dij is a distance or travel time between i and j.
- α is a parameter of attractiveness.
- β is a distance constraint parameter.
- n is the total number of centers, including center j.
One of the main advantages of gravitational approaches is its empirical character. Huff states that few analysts, except for “gravitationalists”, were able to formulate their ideas in a way that was conducive to empirical verification. In the next item, the methodology for the empirical application of this work is presented.
3. Methods
GISis on the rise for its ability to cross data from different sources and reveal underlying spatial patterns. Fast and low-cost computers associated with the growing availability of urban data and information allow for the application of more detailed gravitational models, exploring the GIS functionalities to operate with data in different geographic scales [24]. Indeed, the advances in technology lead to an increase of functionalities that GIS can now perform, which allow new approaches in urban studies [25]. This paper proposes an application of the Huff model included in the ArcGIS® 10.3.1 package (ArcGIS Market Analysis Tools. ESRI—Environmental Systems Research Institute: Redlands, CA, USA. Version 10.3.1 released on 2015.), aiming to discuss the influence of different store location attributes on consumer choice among a collection of retail offers. As mentioned before, we will focus on the location attributes rather than the store attributes. We do not intend to dismiss the great relevance of store attributes (store size, parking spaces, variety of goods, etc.) in consumer choice, but to emphasize the urban form attributes of the location. To do this, we will take the hypothesis that all stores have a uniform retail profile, in other words, the attraction of each store will be weighted in the Huff model by its location attributes.
To run the empirical application, we selected three main features of urban form related to retail location and defined their respective attributes. The selected features were: the agglomeration pattern of the stores (level of spatial concentration), the accessibility (topological) and, as an environmental feature, the slope of the terrain. We took these parameters as measures of attractiveness in Huff model to estimate the patronage probabilities of each store (location), and then summarized how the total population would be shared between stores. The Huff model calculates this market share by applying probabilities to the population data for all origins.
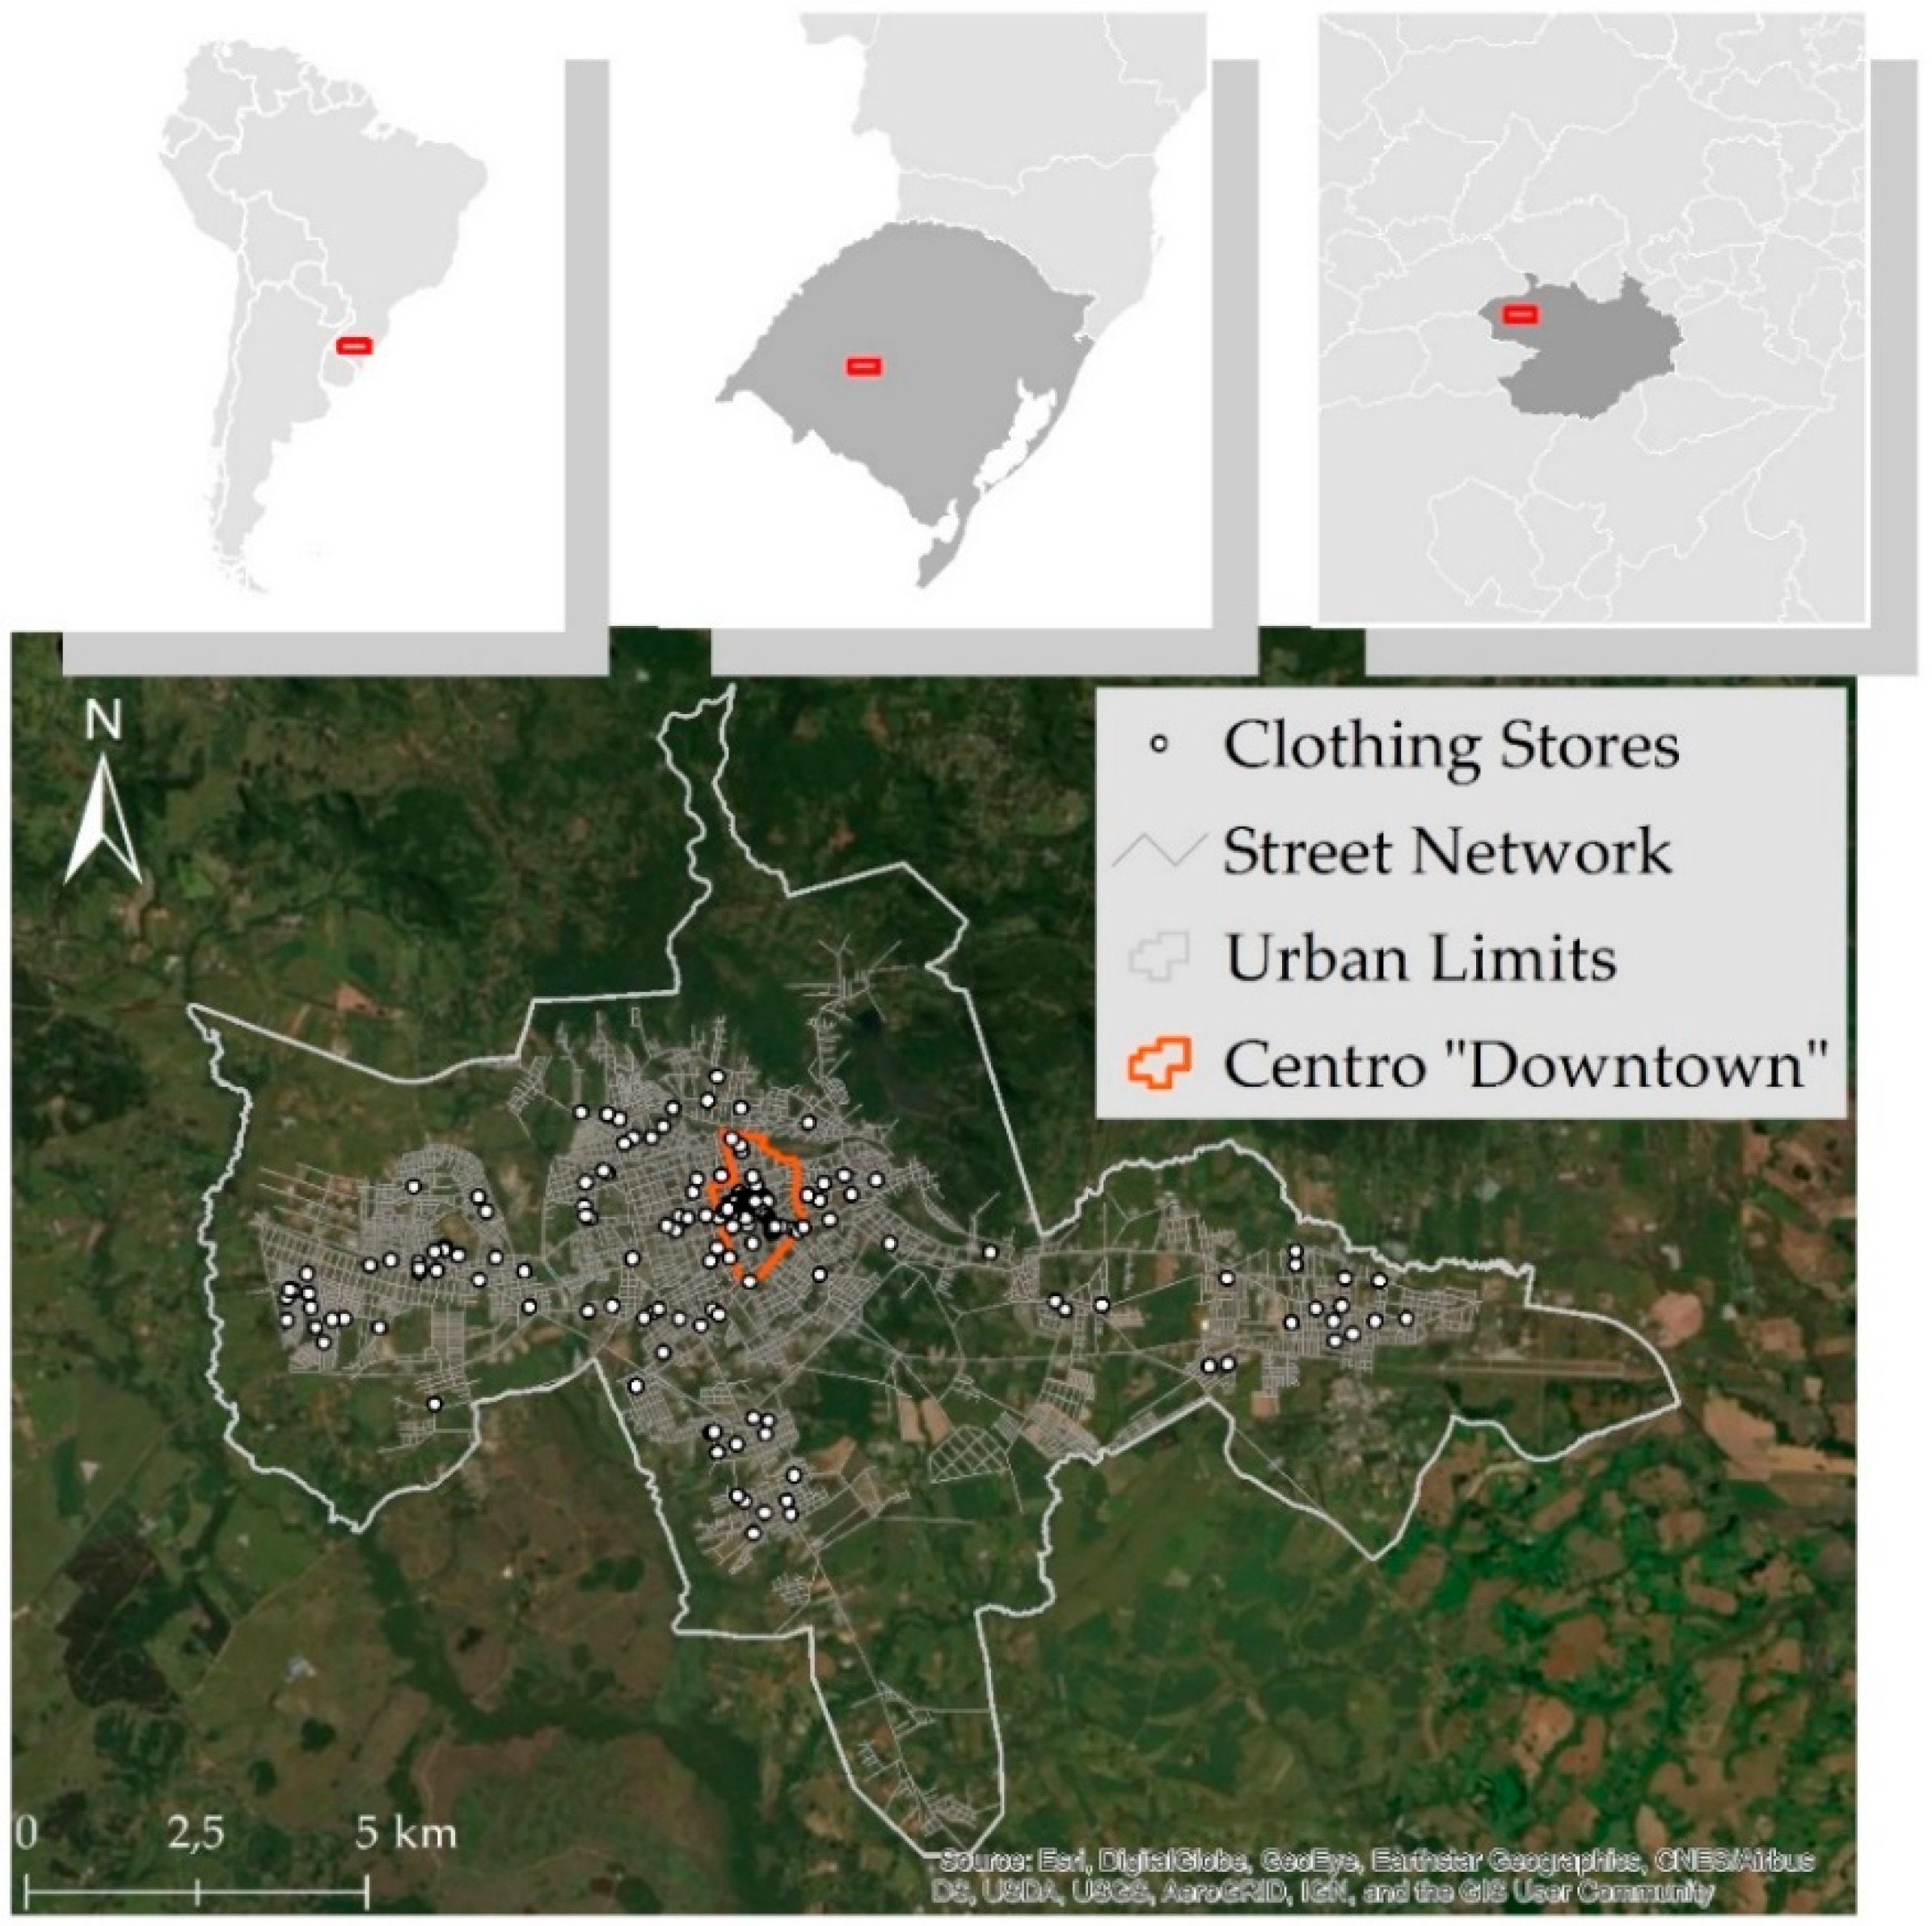
The empirical study area was Santa Maria, Brazil (Figure 1). The total urban population of Santa Maria, according to the Santa Maria Institute of Planning based on 2010 Census, was 248,347, 95.1% of the total. The figure emphasizes the location of the city in a national and regional context, and highlights the Downtown area, where 52.4% of the stores analyzed are located. The Downtown area of Santa Maria concentrates the most important commercial streets since 1885, when a railway was built in its vicinity, giving the city the title of “railway city”, and strengthening retail and local services.
Database for the retail stores was obtained from CNEFE (National Register of Addresses for Statistical Purposes) for the year of 2010, provided by IBGE (Brazilian Institute of Geography and Statistics). We adopted the method proposed by [26] to spatialize data from CNEFE in a GIS environment. According to this database, Santa Maria had, in 2010, a total of 291 clothing stores, but only 245 could be successfully geocoded (84.2%) due to address information problems. The dataset was corrected with Google Earth® (Google Earth Pro. Google: Mountain View, CA, USA. Version 7.3 released on 2017) images, with the addition of five stores, resulting in a total of 250 stores mapped.
The level of spatial concentration of stores was estimated through Kernel density, a method that creates a continuous field through discrete objects to analyze data concentration [27]. The terrain slope in degrees was processed in a Digital Elevation Model (SRTM) made available by NASA with a spatial resolution of 30 m.
The spatial representation of Santa Maria street grid was provided by the Department of Architecture and Urbanism of the Federal University of Santa Maria. We performed street grid corrections to fix small inaccuracies. The dataset was based on “street segments”, the geographic space located between two corners due to its high level of detail, considering the unequal distribution of retail shops along the streets. This spatial basis contained 7101 street segments, and this was entered as an input to calculate local accessibility in the software UrbanMetrics® (UrbanMetrics. Federal University of Pelotas: Pelotas, Brazil. Version 2.2 released on 2016.). Accessibility is a measure of relative distance (topological) from each space to all others in the same spatial system, and we calculated this measure in a local scale, radius 3, i.e., a distance considering three topological steps from each space [28,29]. All three parameters (Kernel density, terrain slope and local accessibility) were rescaled to present a range from 1 to 100, in order to allow comparisons. Table 1 summarizes the study methodology.
The ArcGIS software was the integrating environment for the different tools and data, and for the application of the Huff model. To run the Huff model, we took data on the total population by census tracts (centroids) as origins and all the 250 stores as destinations. Only the urban area of the municipality was included in the study. Using the centroid of the census tracks as an approximation of population location can be problematic, since these geographic areas have different sizes and shapes. Due to the lack of more detailed data on the population spatial distribution, many market area analyses adopt census tracts (or blockgroups) centroids to estimate the distances to stores. In this paper, we only considered the population of the urban area of the city, which represent 96.79% of the total population according to the 2010 Census. In the urban area of Santa Maria, 93.62% of the census tracts had a surface that was smaller than 2 km2. In this sense, this approximation is considered to be appropriate for this experiment.
The model was able to estimate the population share for each store (location), considering each selected attractive factor. According to the literature, model calibration should be based in actual shopping preferences for products, surveyed at the household level. Actual choice behavior (the variable to be predicted) must be obtained empirically from residents to geographic subareas located within a larger study area, and choices must be obtained for all alternatives considered by these residents [30]. Unfortunately, these data were not available for Santa Maria, being rare in the Brazilian context. According to the Huff model, the exponent for distance is assumed to be negative. Convenience products could be expected to have a larger exponent, while specialty goods would have a much smaller exponent [30]. Clothing products can be considered as comparison or specialty goods. After a few tests, we adopted the distance constraint parameter (β) as 1 and Euclidian distances. We performed three separated runs of the model, each run was loaded with one of the three location-attractive factors.
4. Results
4.1. Results for Locational Attributes
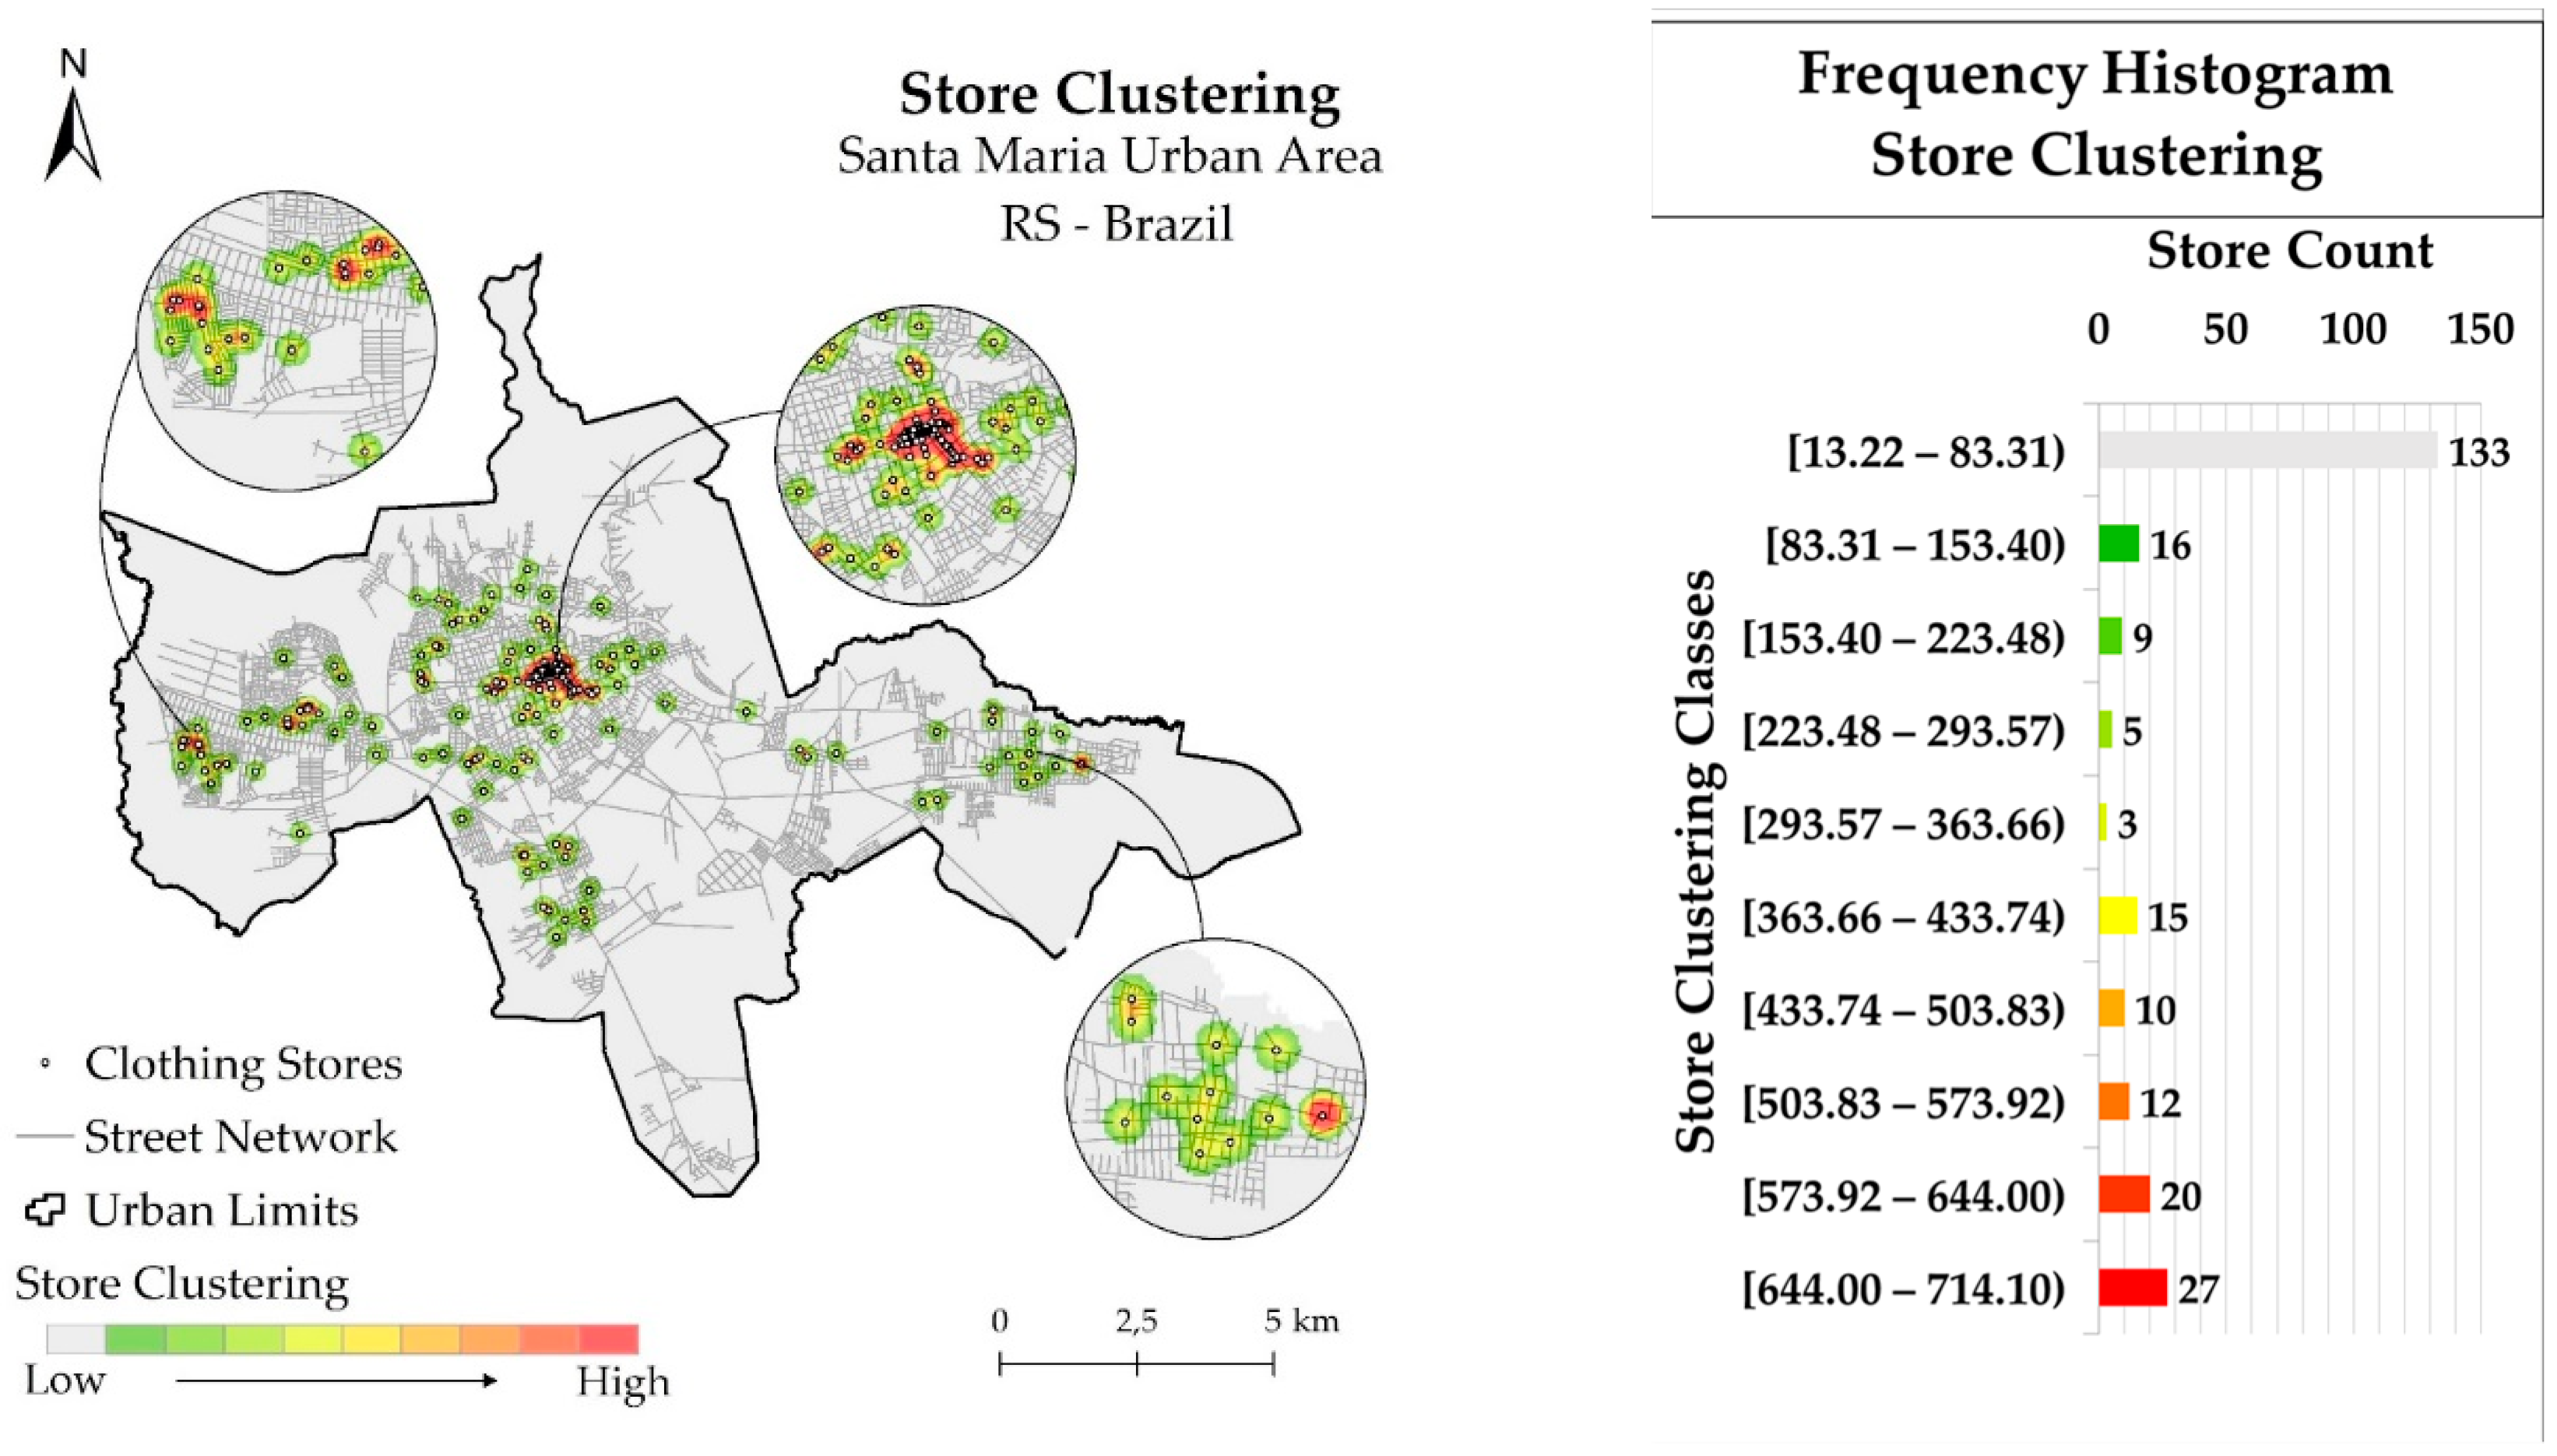
The map shown in Figure 2 revealed a strong concentration of clothing stores in the Downtown area, as expected. Two other concentrations were noticeable at the east and west sectors of the city. We noticed that the cluster of the eastern portion of the city seemed to not be as significant as the west portion, likely because of its late history of urbanization: while the city center and its surroundings exhibit urban expansion from 1902 to about 1933, the East portion began its development in the early 1980s, after the implantation of the largest university of the city in 1960, the inauguration of a base of the Brazilian Air Force in 1970, the incorporation of a district and its transformation into neighborhood in 1982, and finally with the consolidation of a major housing estate in the late 1980s. Meanwhile, in the 1970s, the west portion of the city was already densified, and it represented a consolidated core, enhanced also by the implantation of a housing estate in the late 1980s, and the occurrence of the largest irregular occupation process in the city in the year of 1992 [31].
The frequency histogram in Figure 2 reveals a “u” form, which is interesting because it demonstrates that a significant number of stores were in clusters, and another meaningful amount was isolated. For example, 53.2% of all stores were in the more dispersed classes of values, while 23.60% were in the three highest cluster areas.
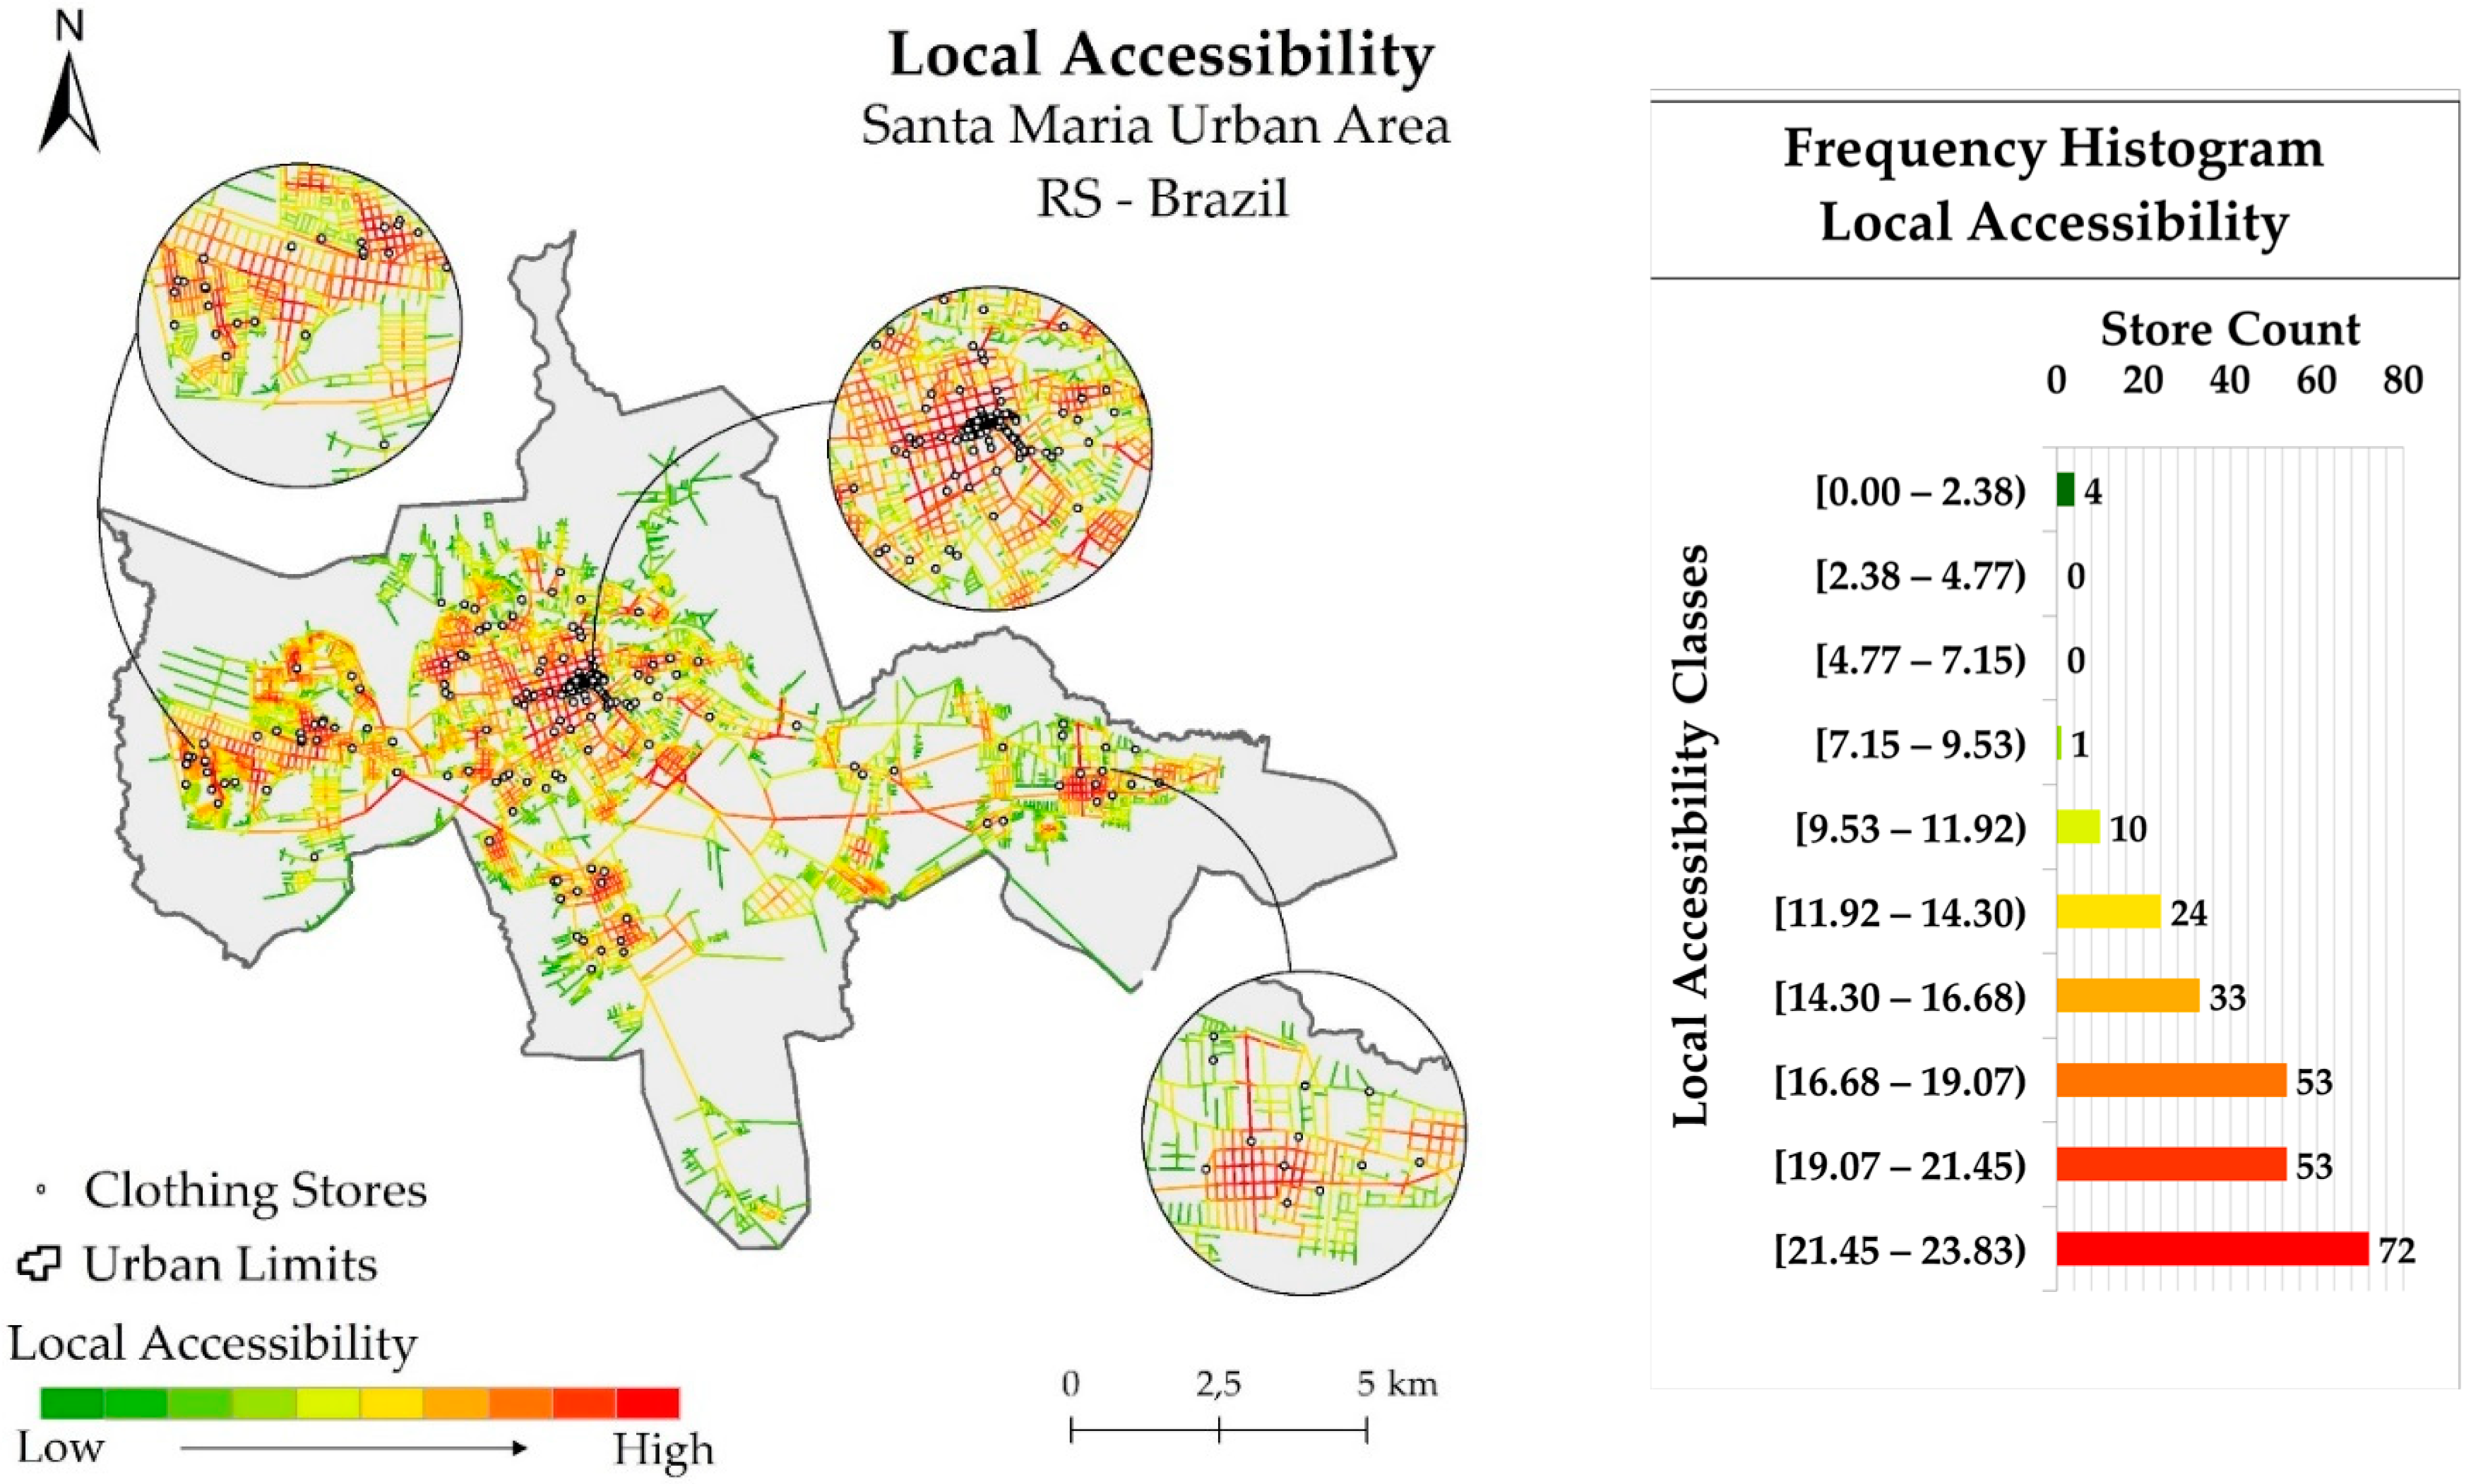
For local accessibility, Figure 3 indicates a strong correlation between the most accessible street segments and the retail locations. Of all stores, 71.2% were located on the most accessible routes in the system (above 16.68), while only 1.6% were in the lesser accessible paths. As mentioned in the Methods section, accessibility, or closeness centrality [13], is a network metric, referring to the relative distance of each node (segment) in the spatial system. In this sense, this property must be seen as an indicator of accessibility, and, according to the literature, related to retail location.
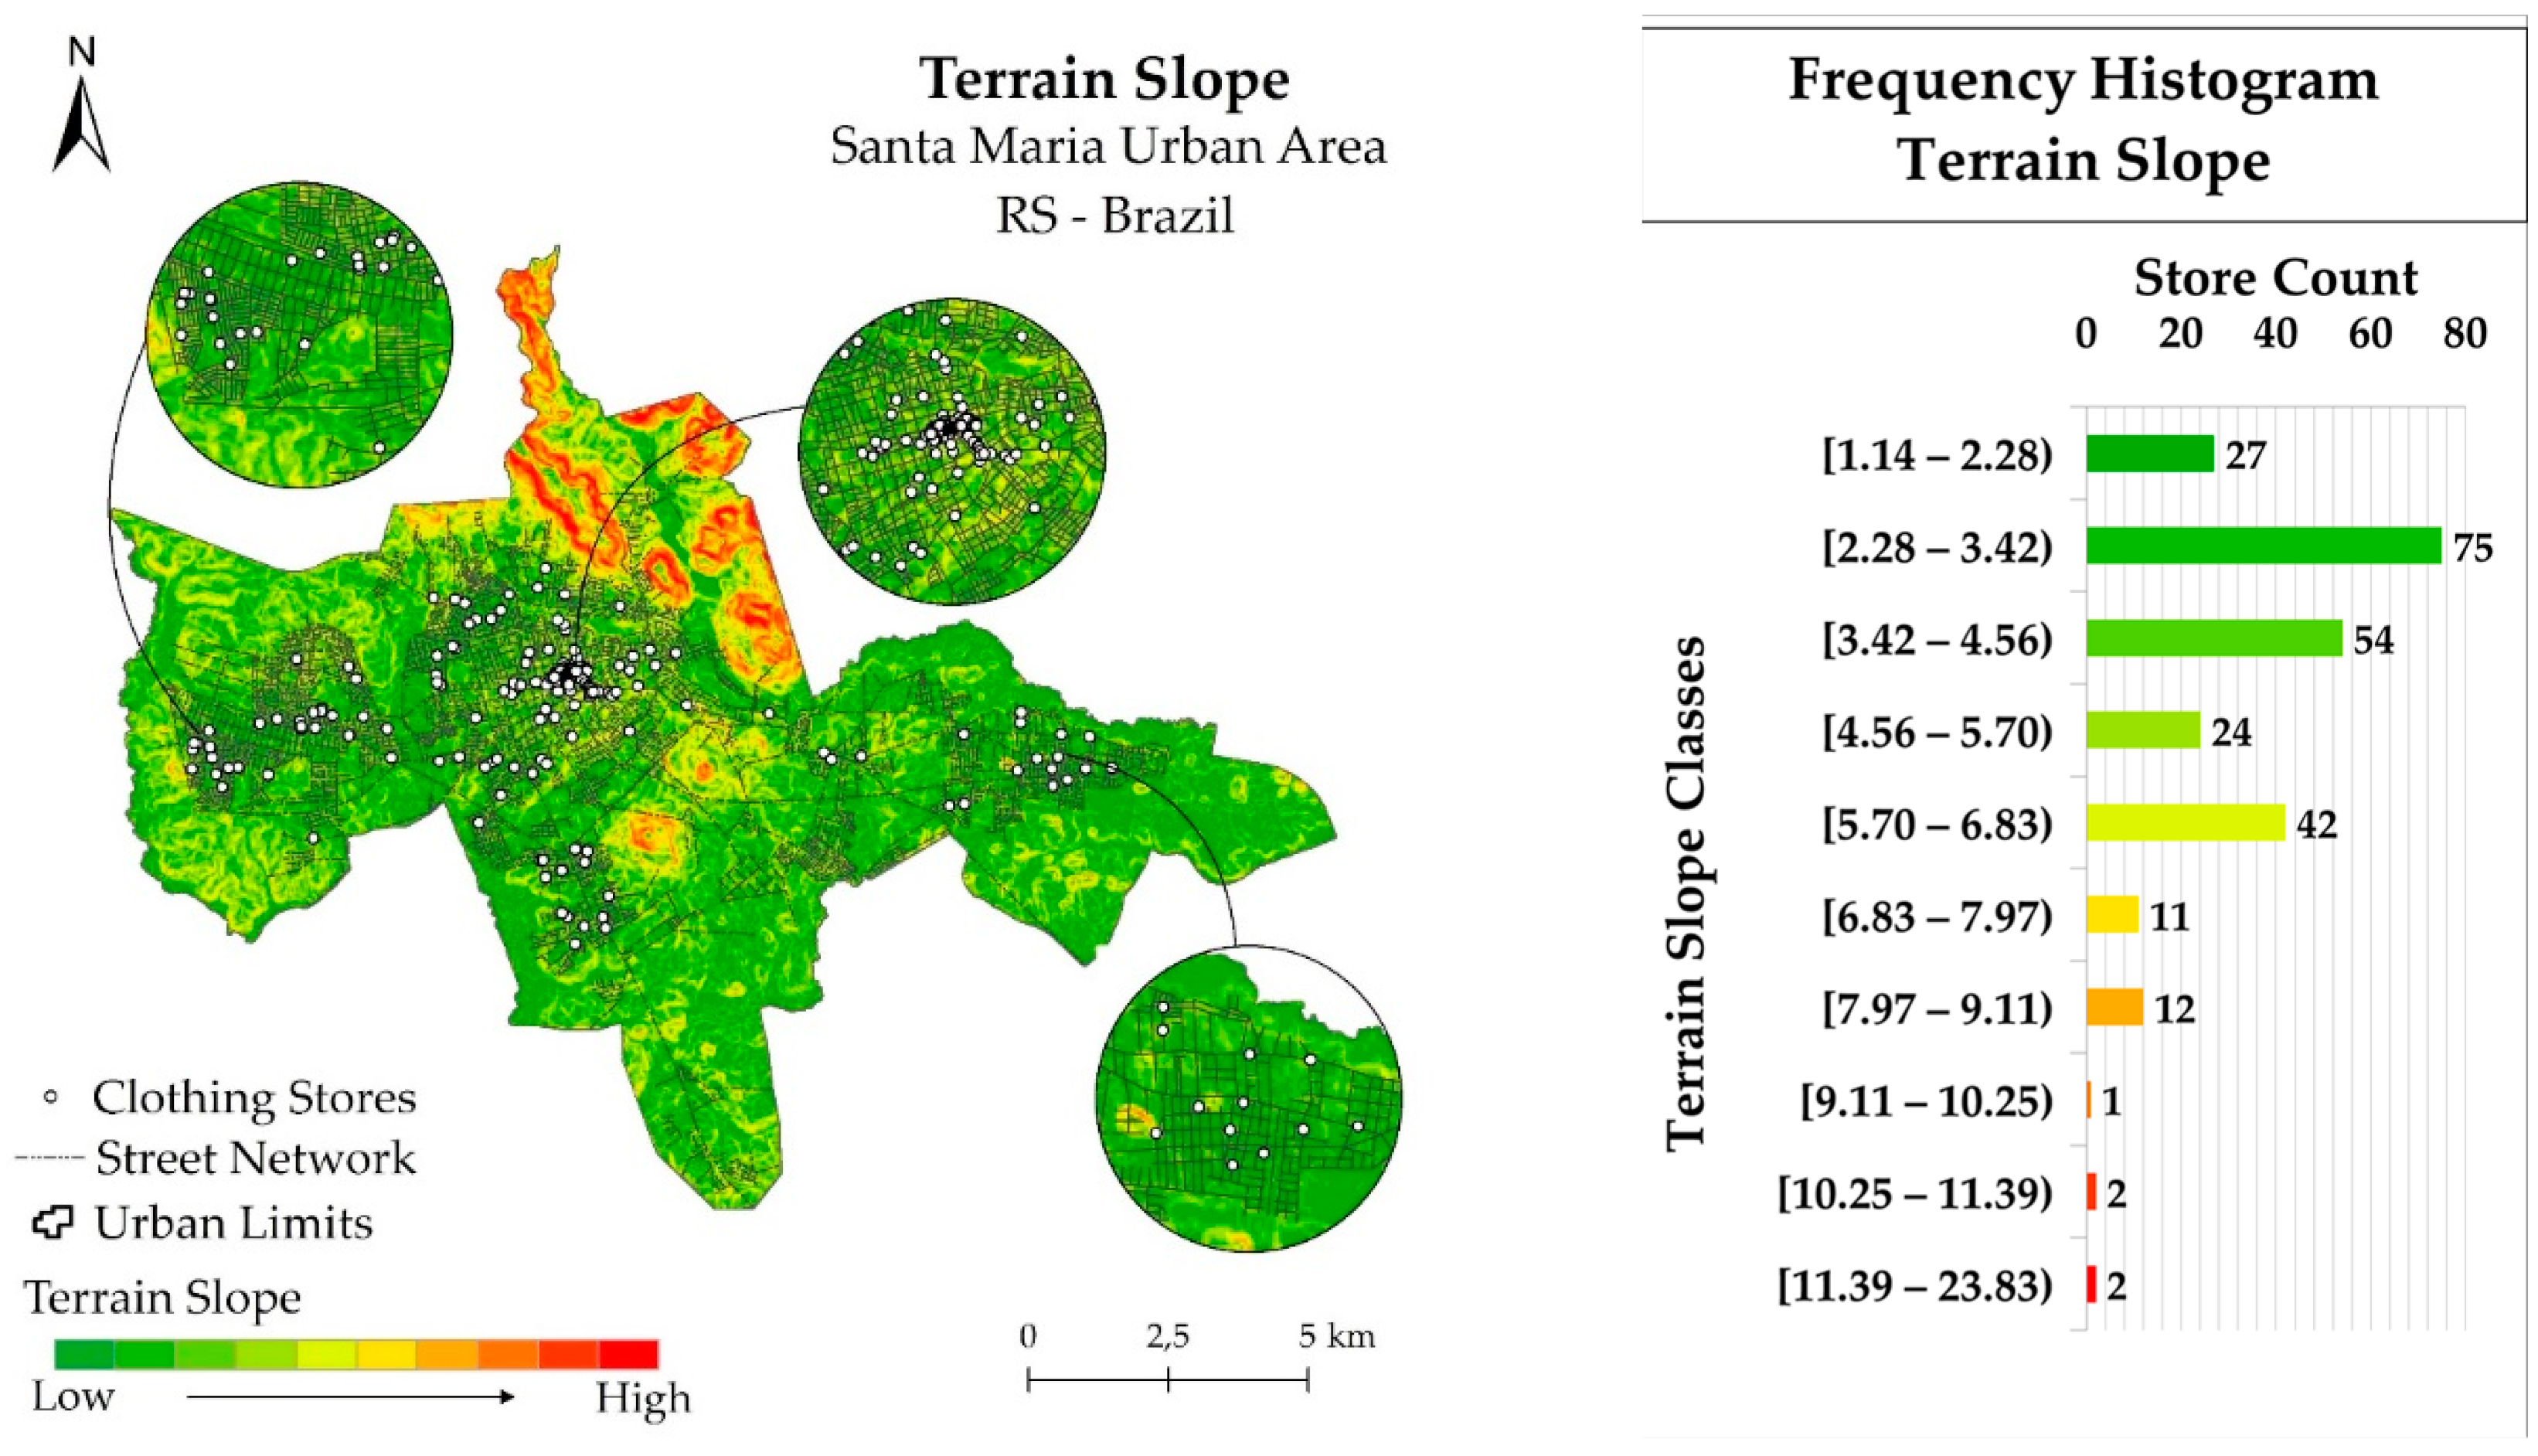
Finally, the terrain slope analysis (Figure 4) demonstrates the preference of stores to allocate in streets with lower slope degrees. 62.4% of all stores were in slopes that were smaller than 4.56 percent. In this dataset, only 2% of all stores were located in areas with a slope degree that was higher than 9.11 percent. With these results in hand, we set out to apply the Huff model.
4.2. The Huff Model
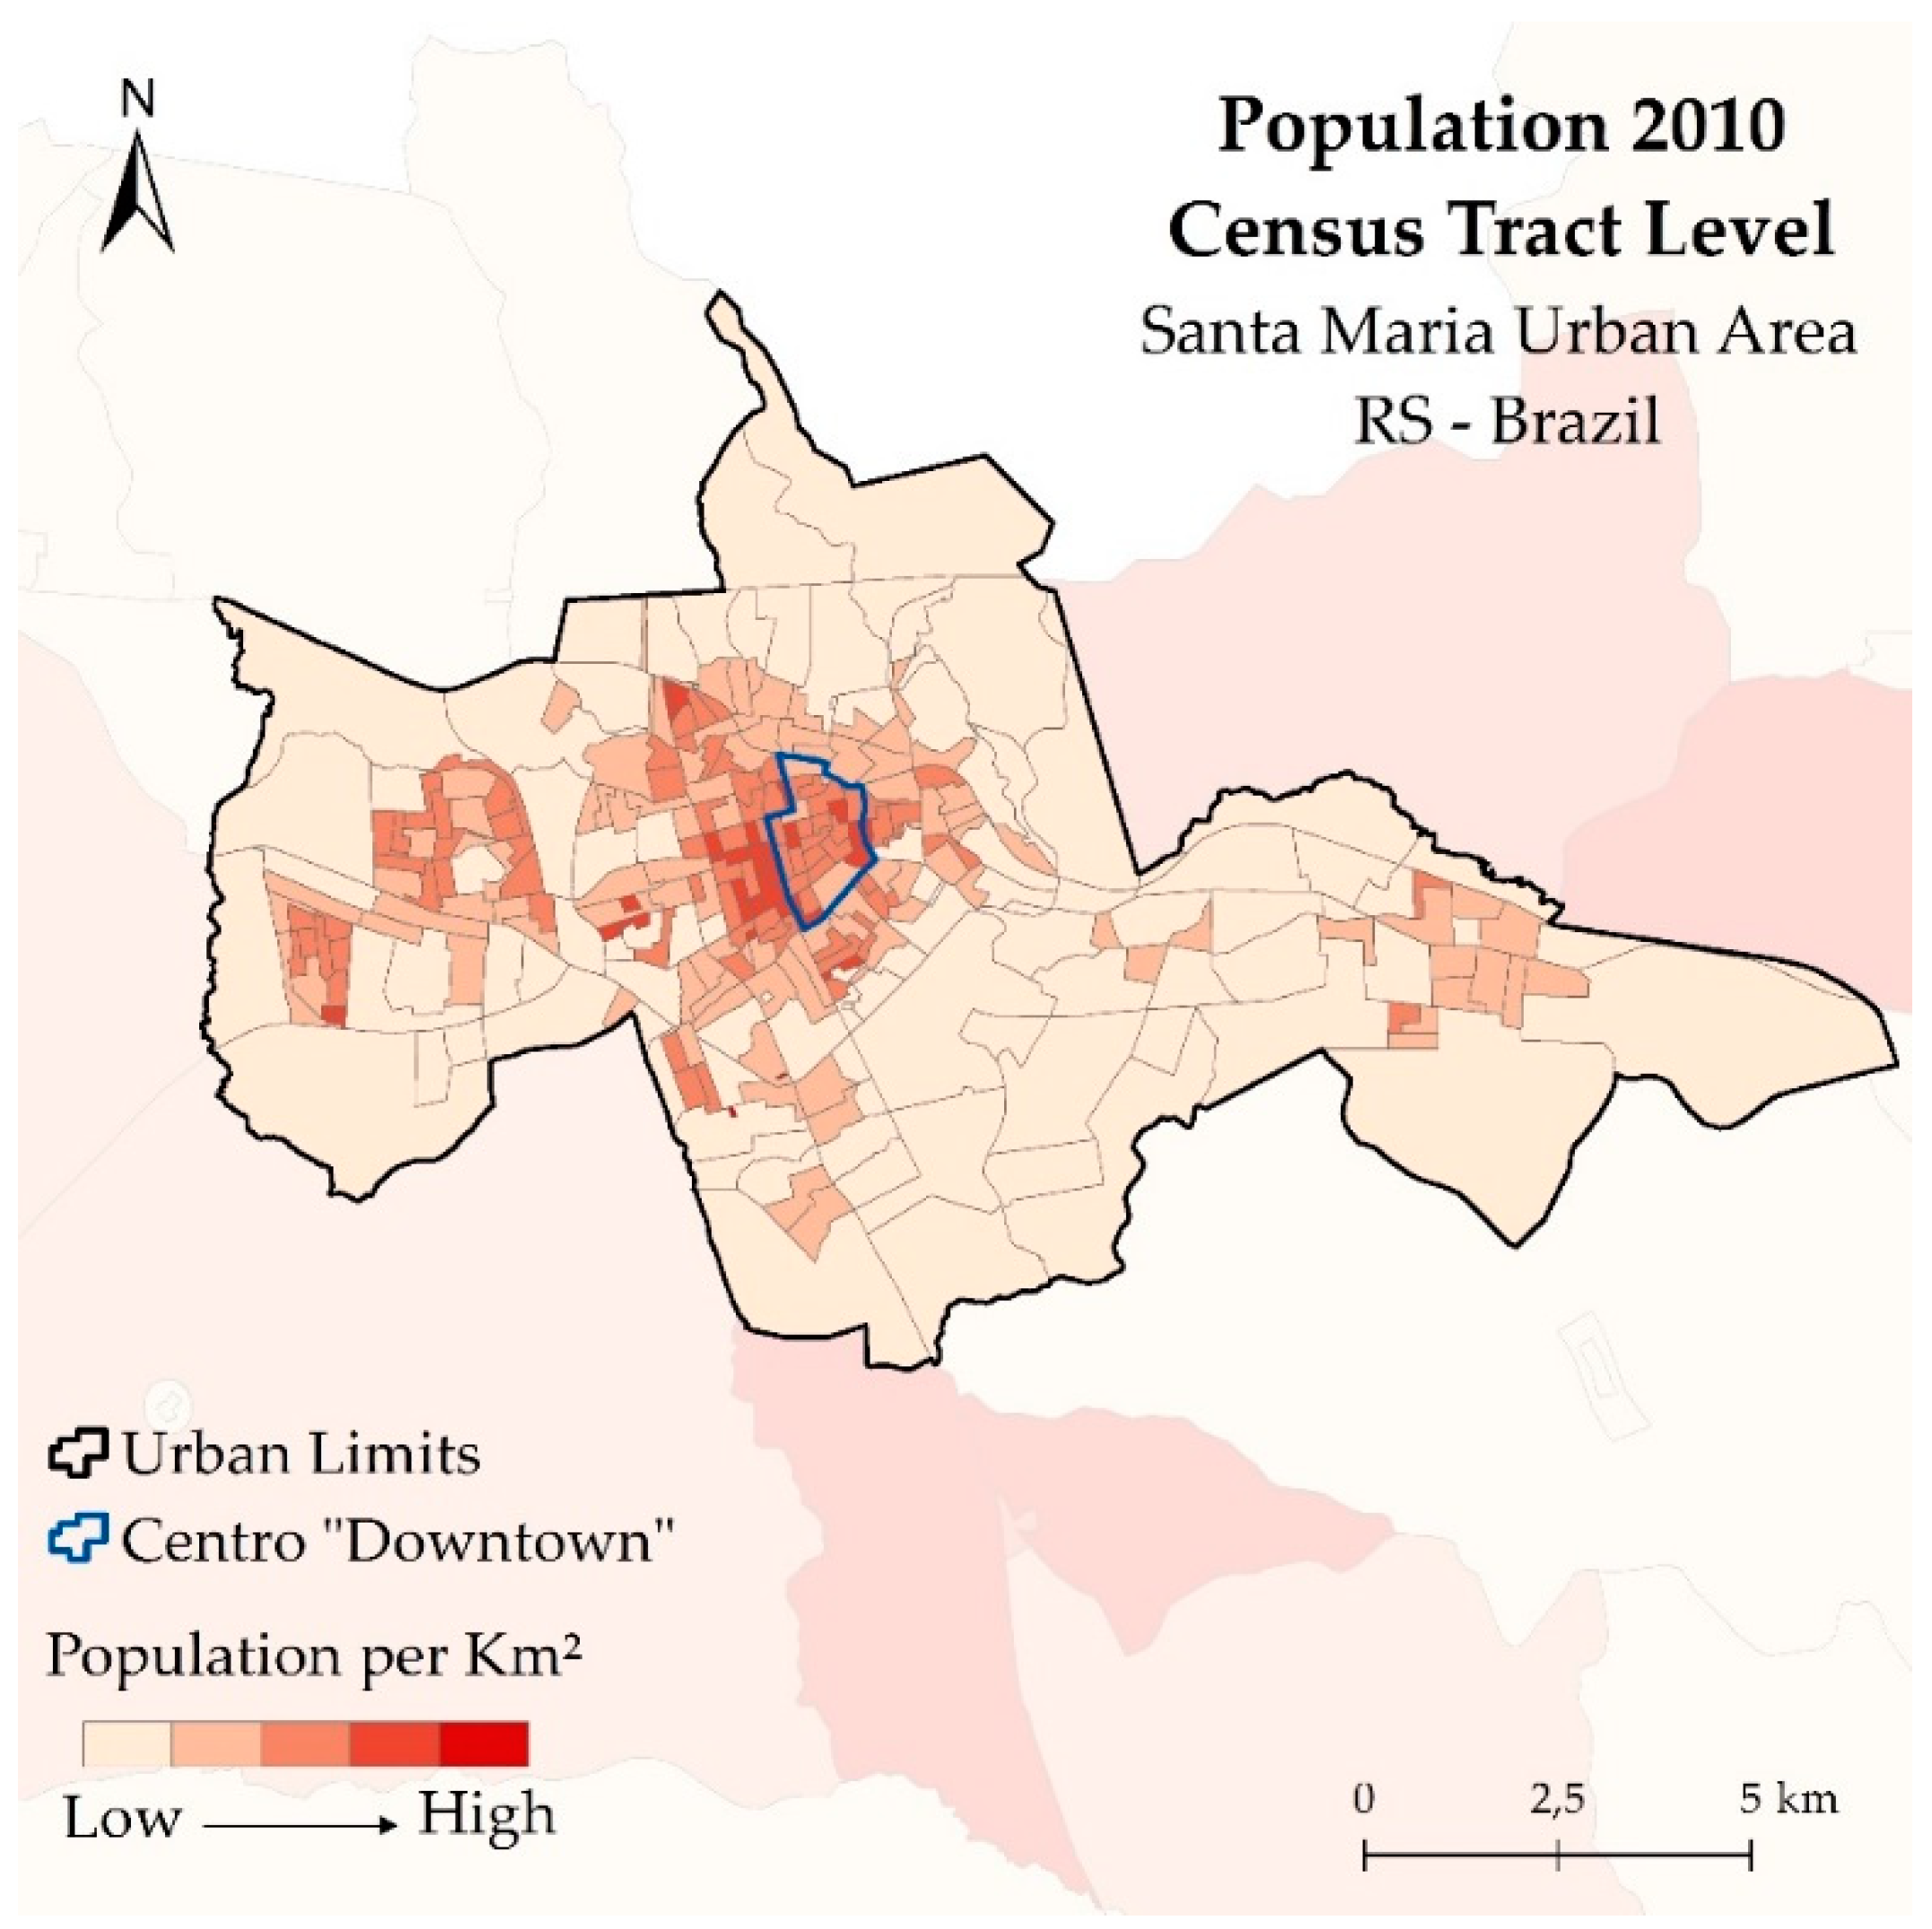
As mentioned before, we used the centroid of the census tracks as origins for the Huff model, considering data on total population. Figure 5 is a map of population by census track for elucidation reasons. The clipping of the urbanized area was provided by the Santa Maria Institute of Planning, and it may be important to highlight that it is slightly different from the Brazilian Institute of Geography and Statistics, which provided the Census data for this map.
The figure shows a high density of residential population in the Downtown area and surroundings, as well as two clusters in the east and west regions. We can also notice that a smaller concentration started to grow on the South area.
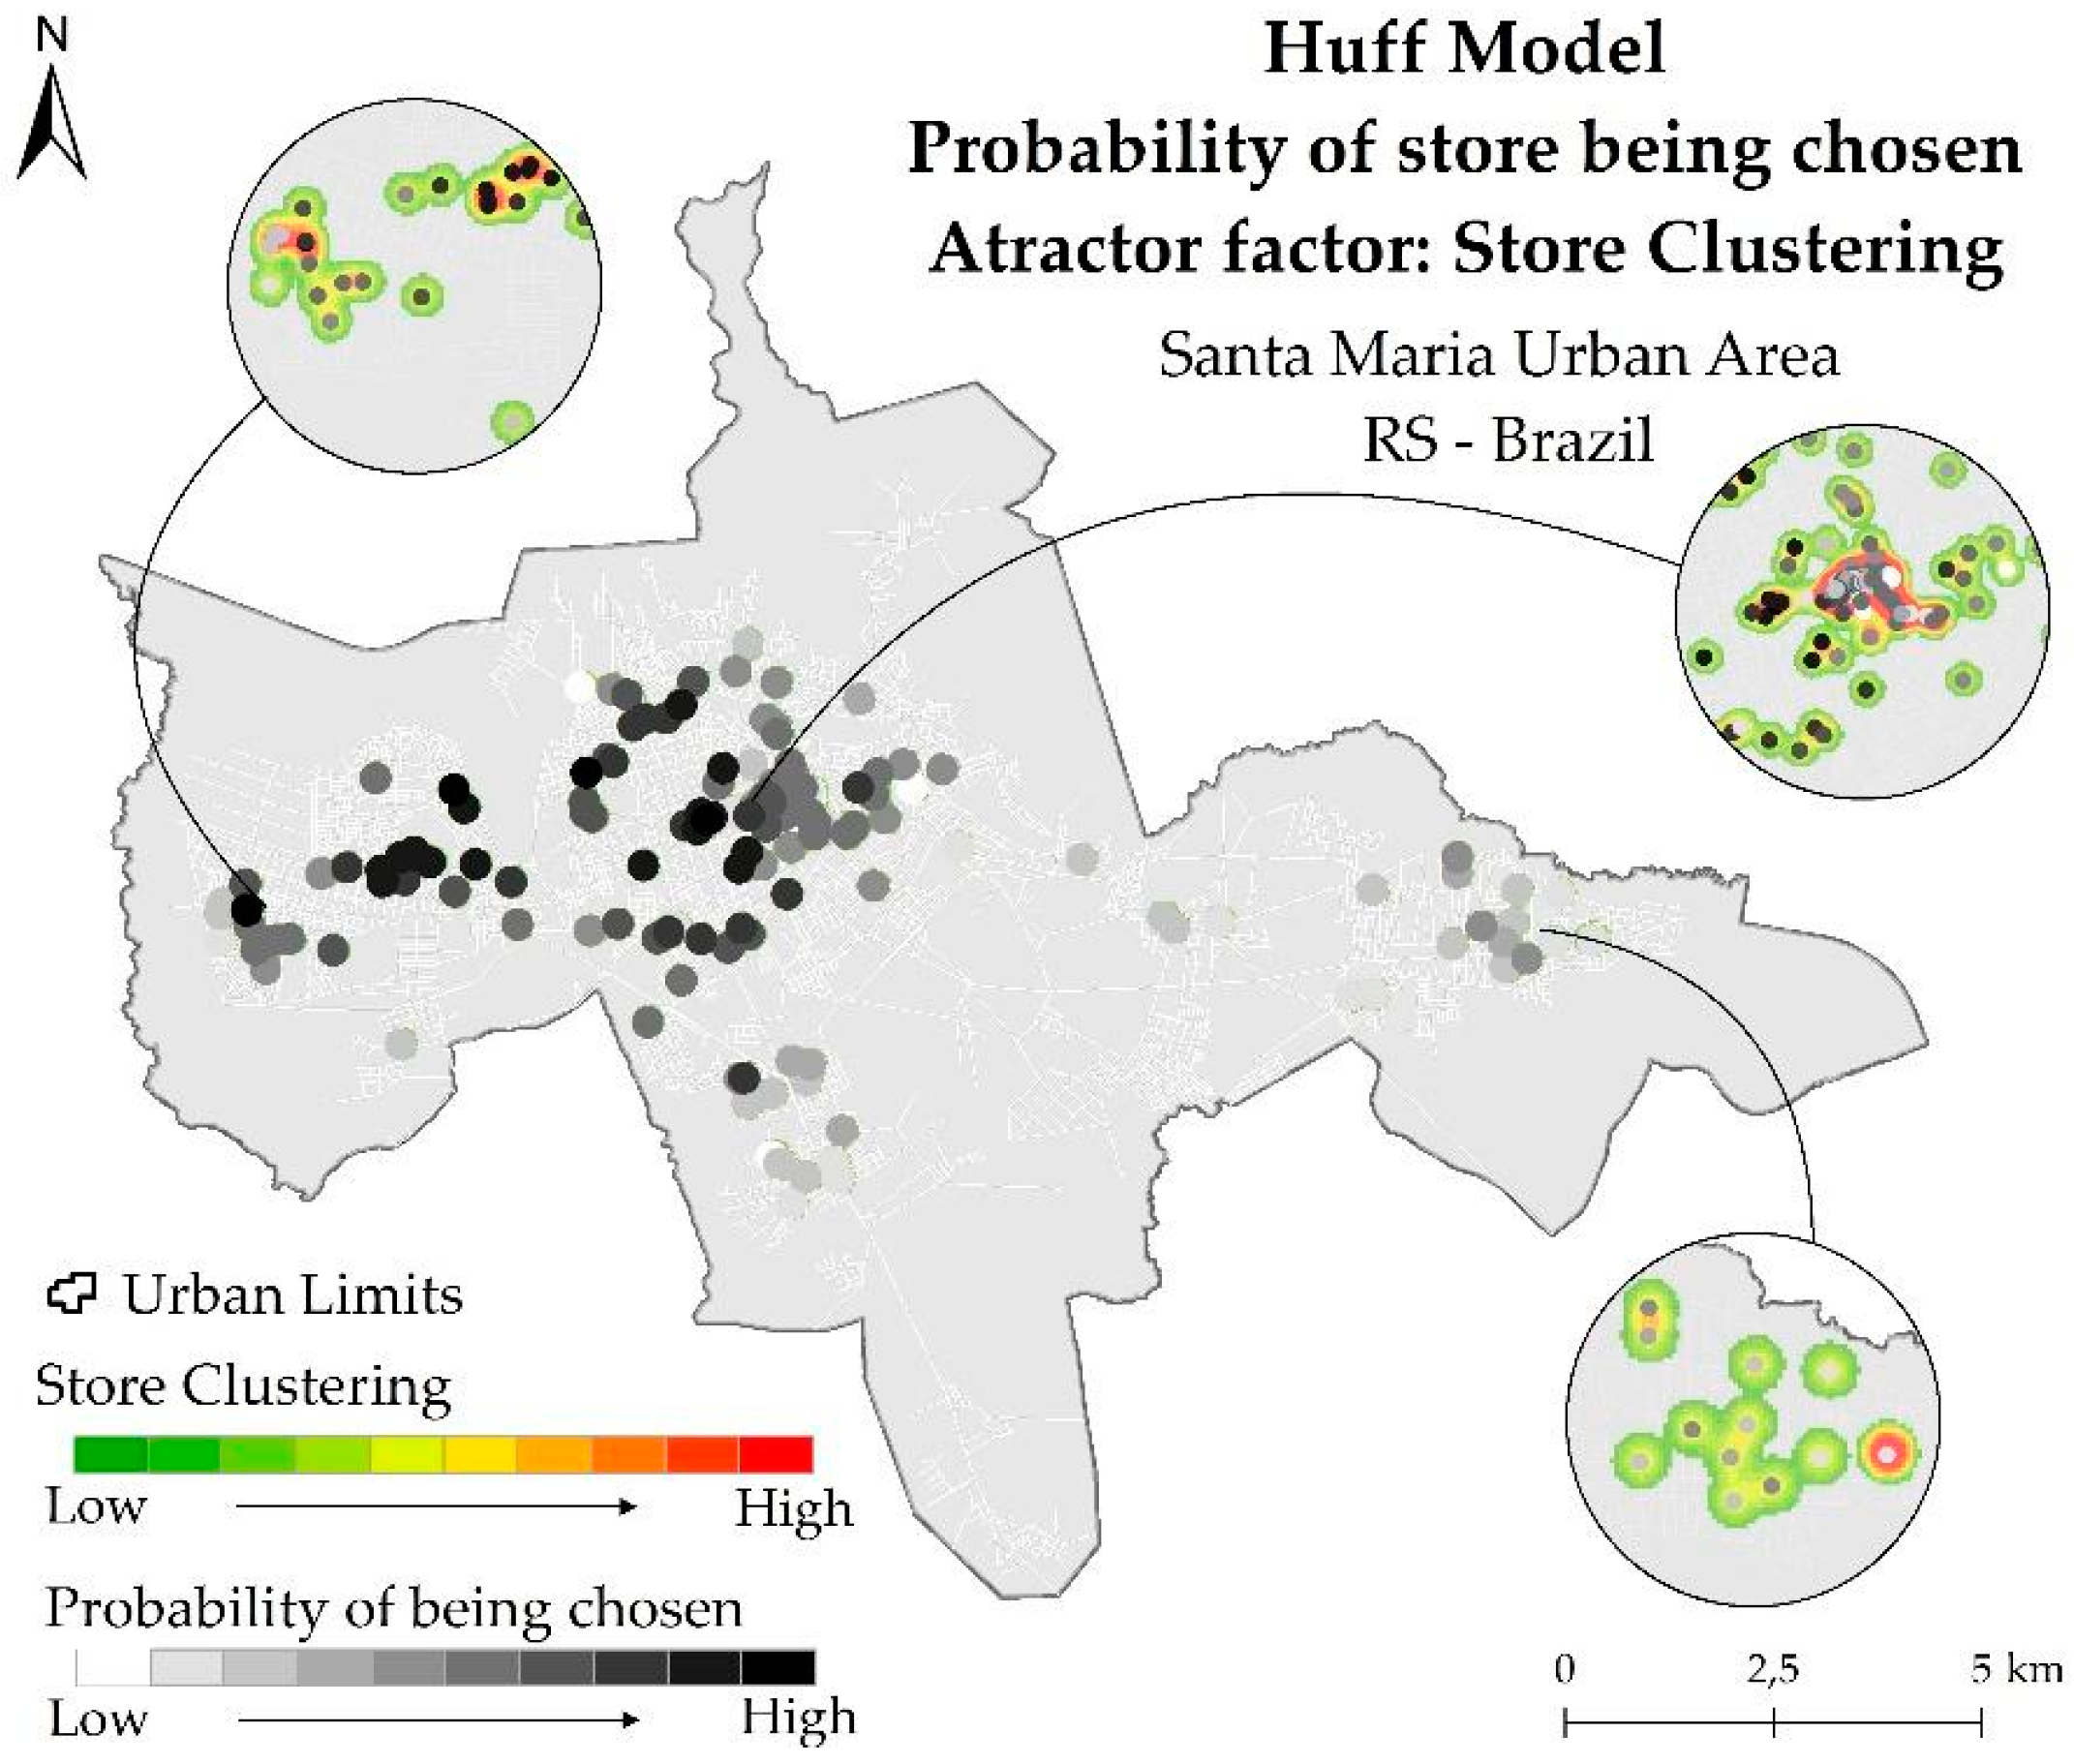
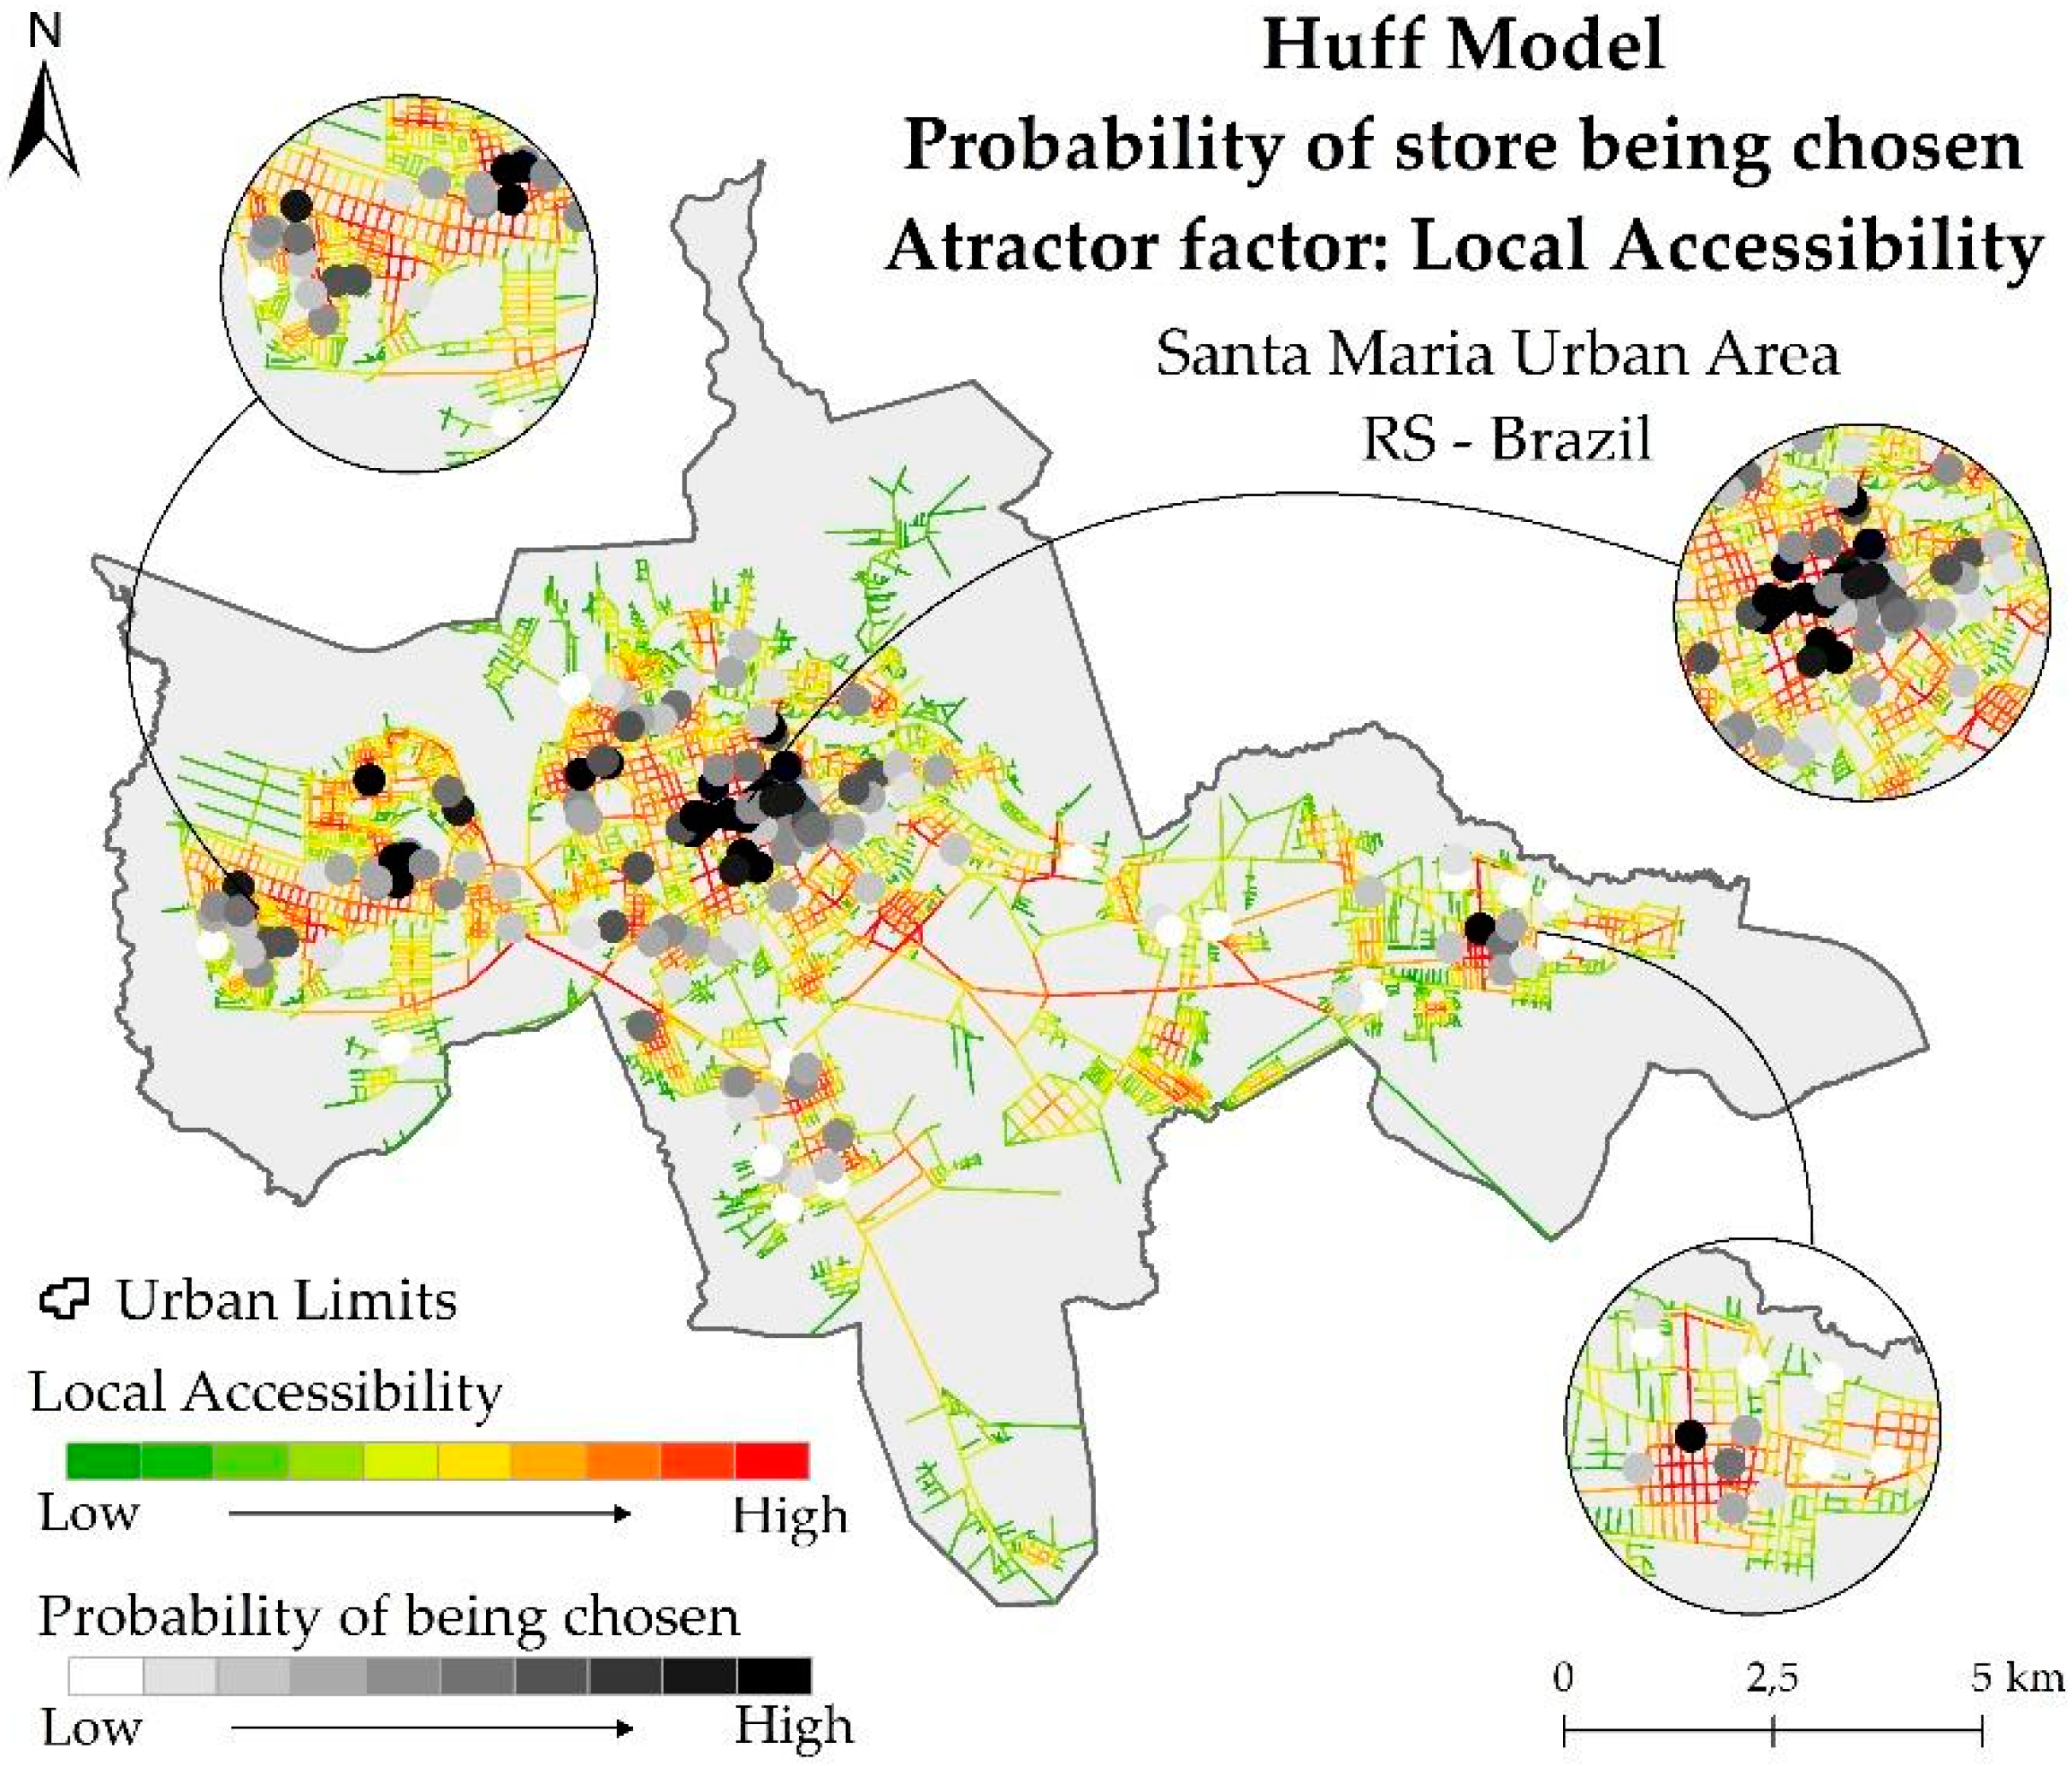
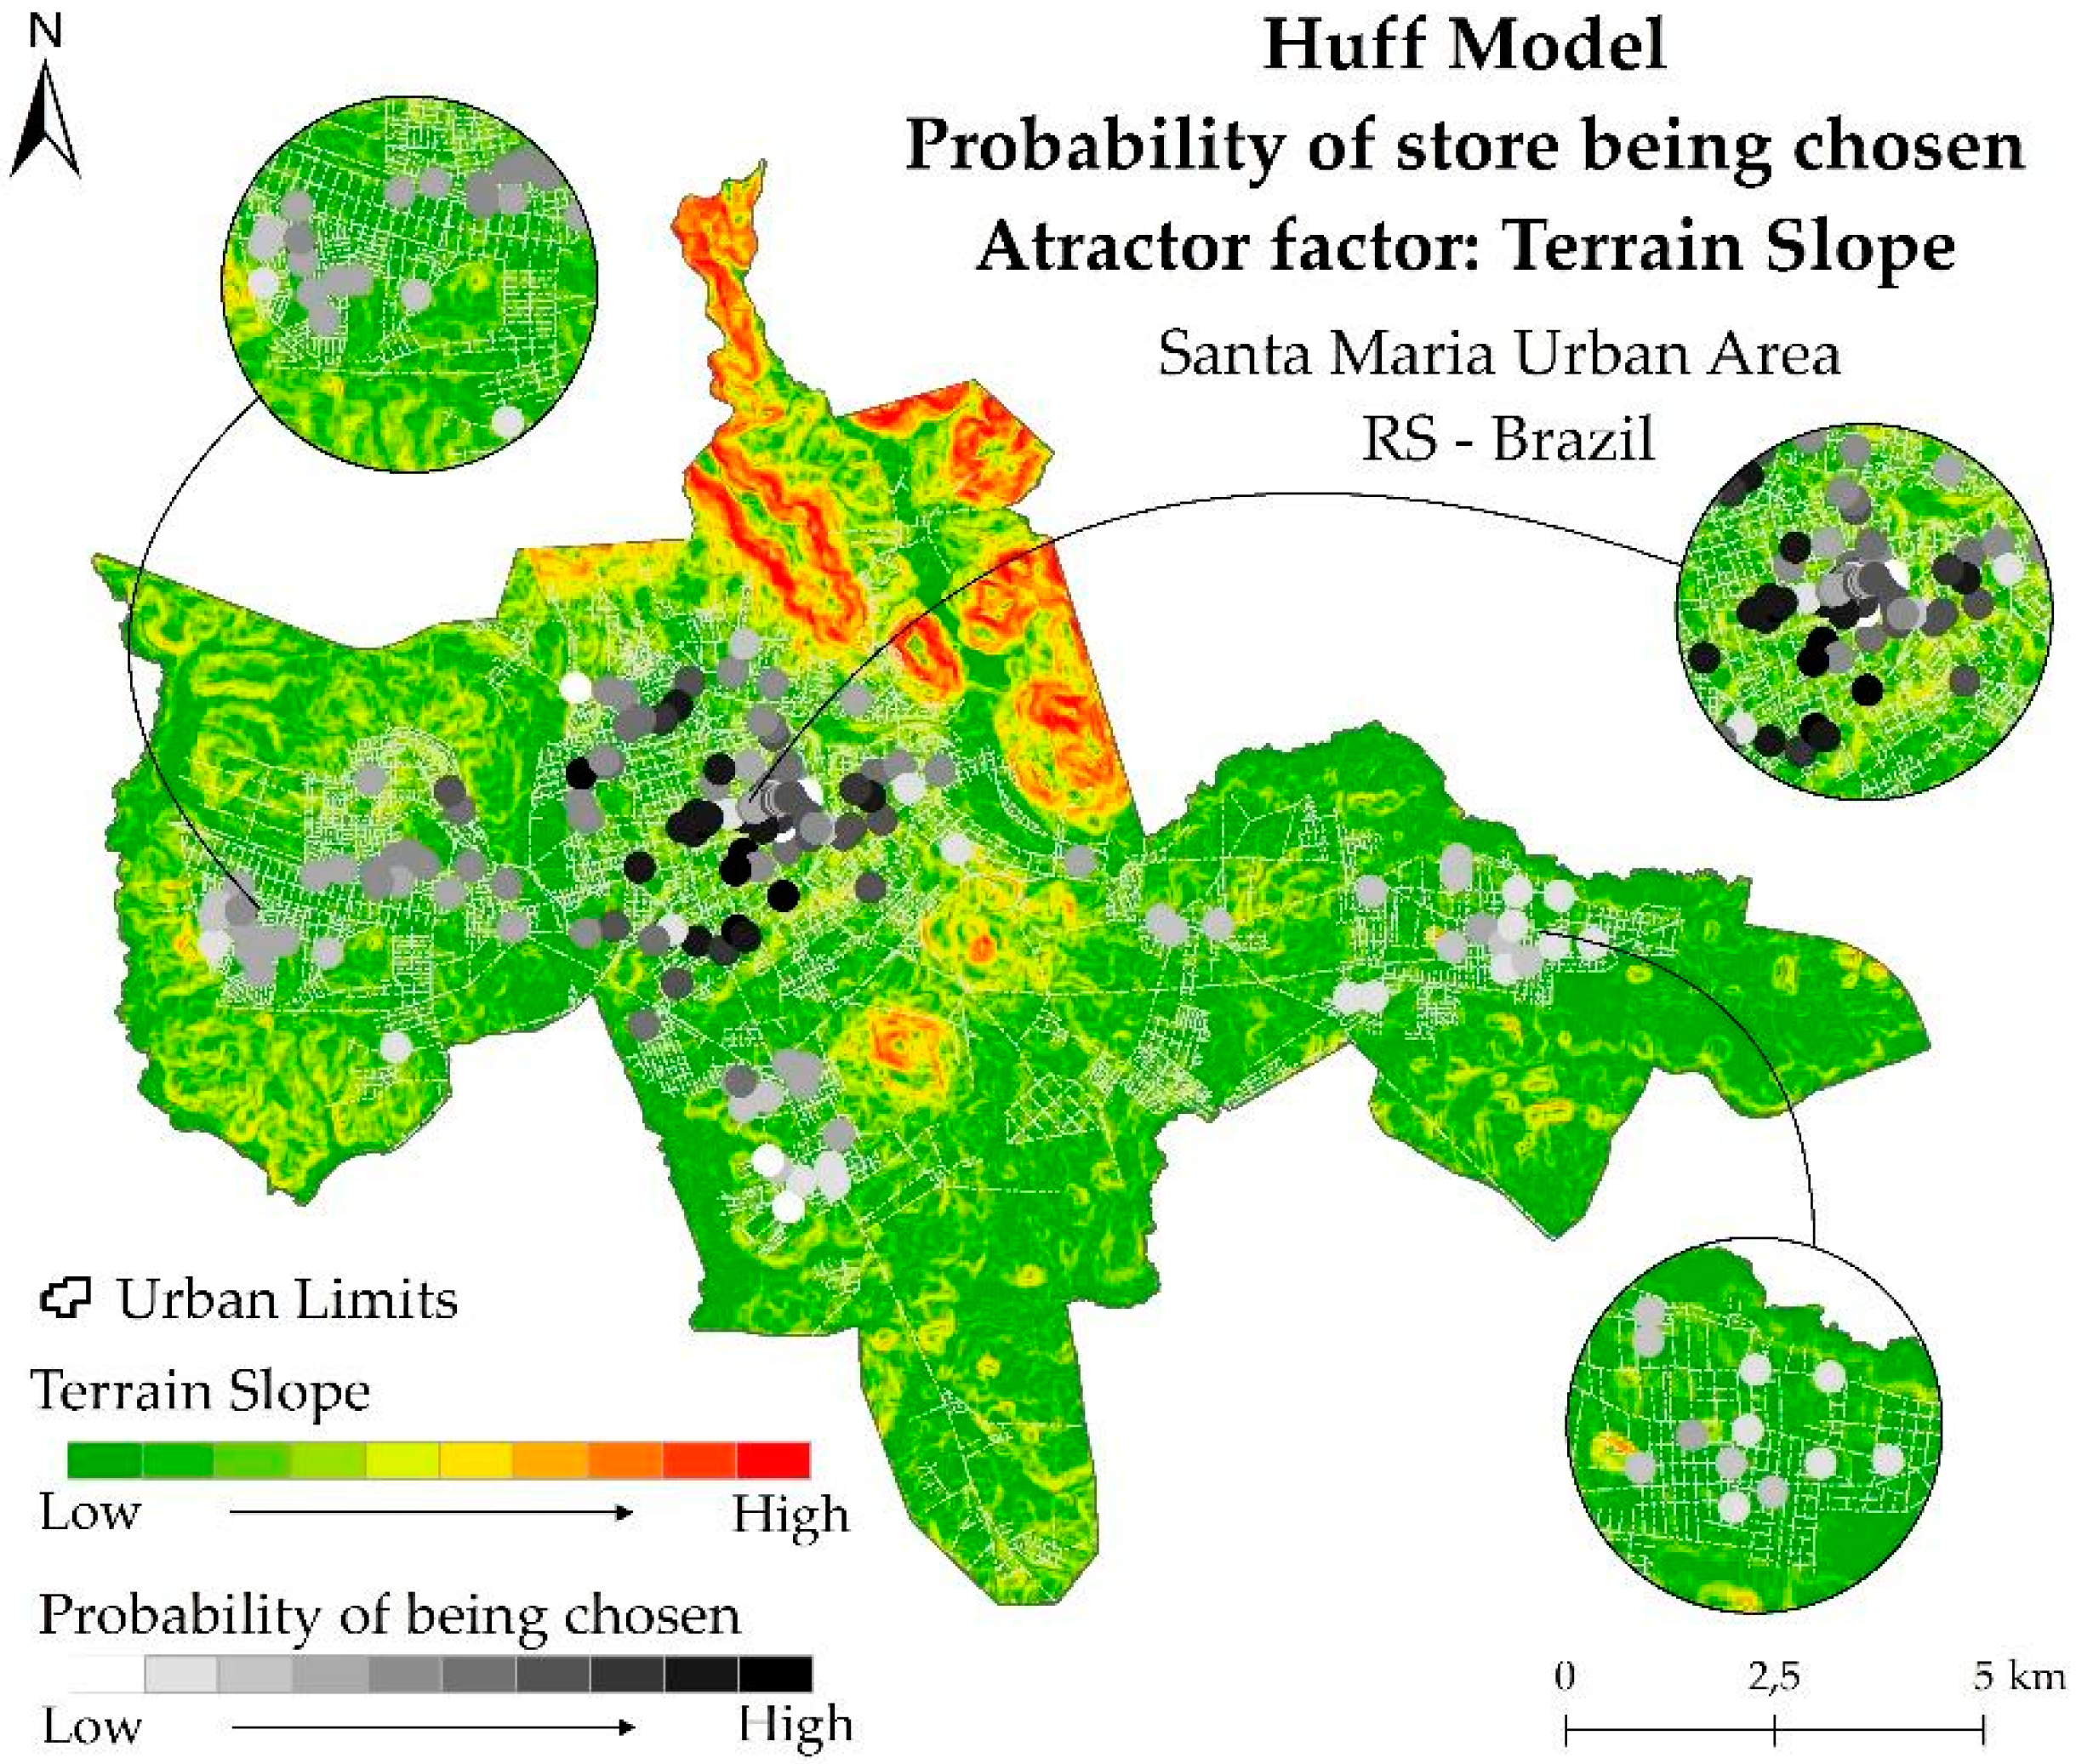
Figure 6, Figure 7 and Figure 8 shows the results of the probability of each store being chosen based on each of the selected parameters.
When analyzing the probability of choice for the store clustering as an attraction variable, we can clearly see that the East cluster lost strength, likely because of its detachment from the city core and the peculiar aspects of the region that we have discussed in Section 4.1. Meanwhile, the stores located in the center and west parts presented the highest probabilities of being chosen.
Meanwhile, the accessibility analysis for the Huff model had its own particularities. The results were influenced by the local nature of the phenomena. Nevertheless, the range of the probabilities was narrower, as we will discuss later.
Finally, the probability of choice for the terrain slope as an attraction variable showed interesting results. The whole sphere of probabilities seemed to have diminished throughout the city. As we already discussed, this variable was the one with a minimum range of original values, so we can say that it had the most homogeneous behavior among the selected parameters. The Huff model tries to divide the probabilities of choice, but since all units have similar values, the overall result is homogeneous as well.
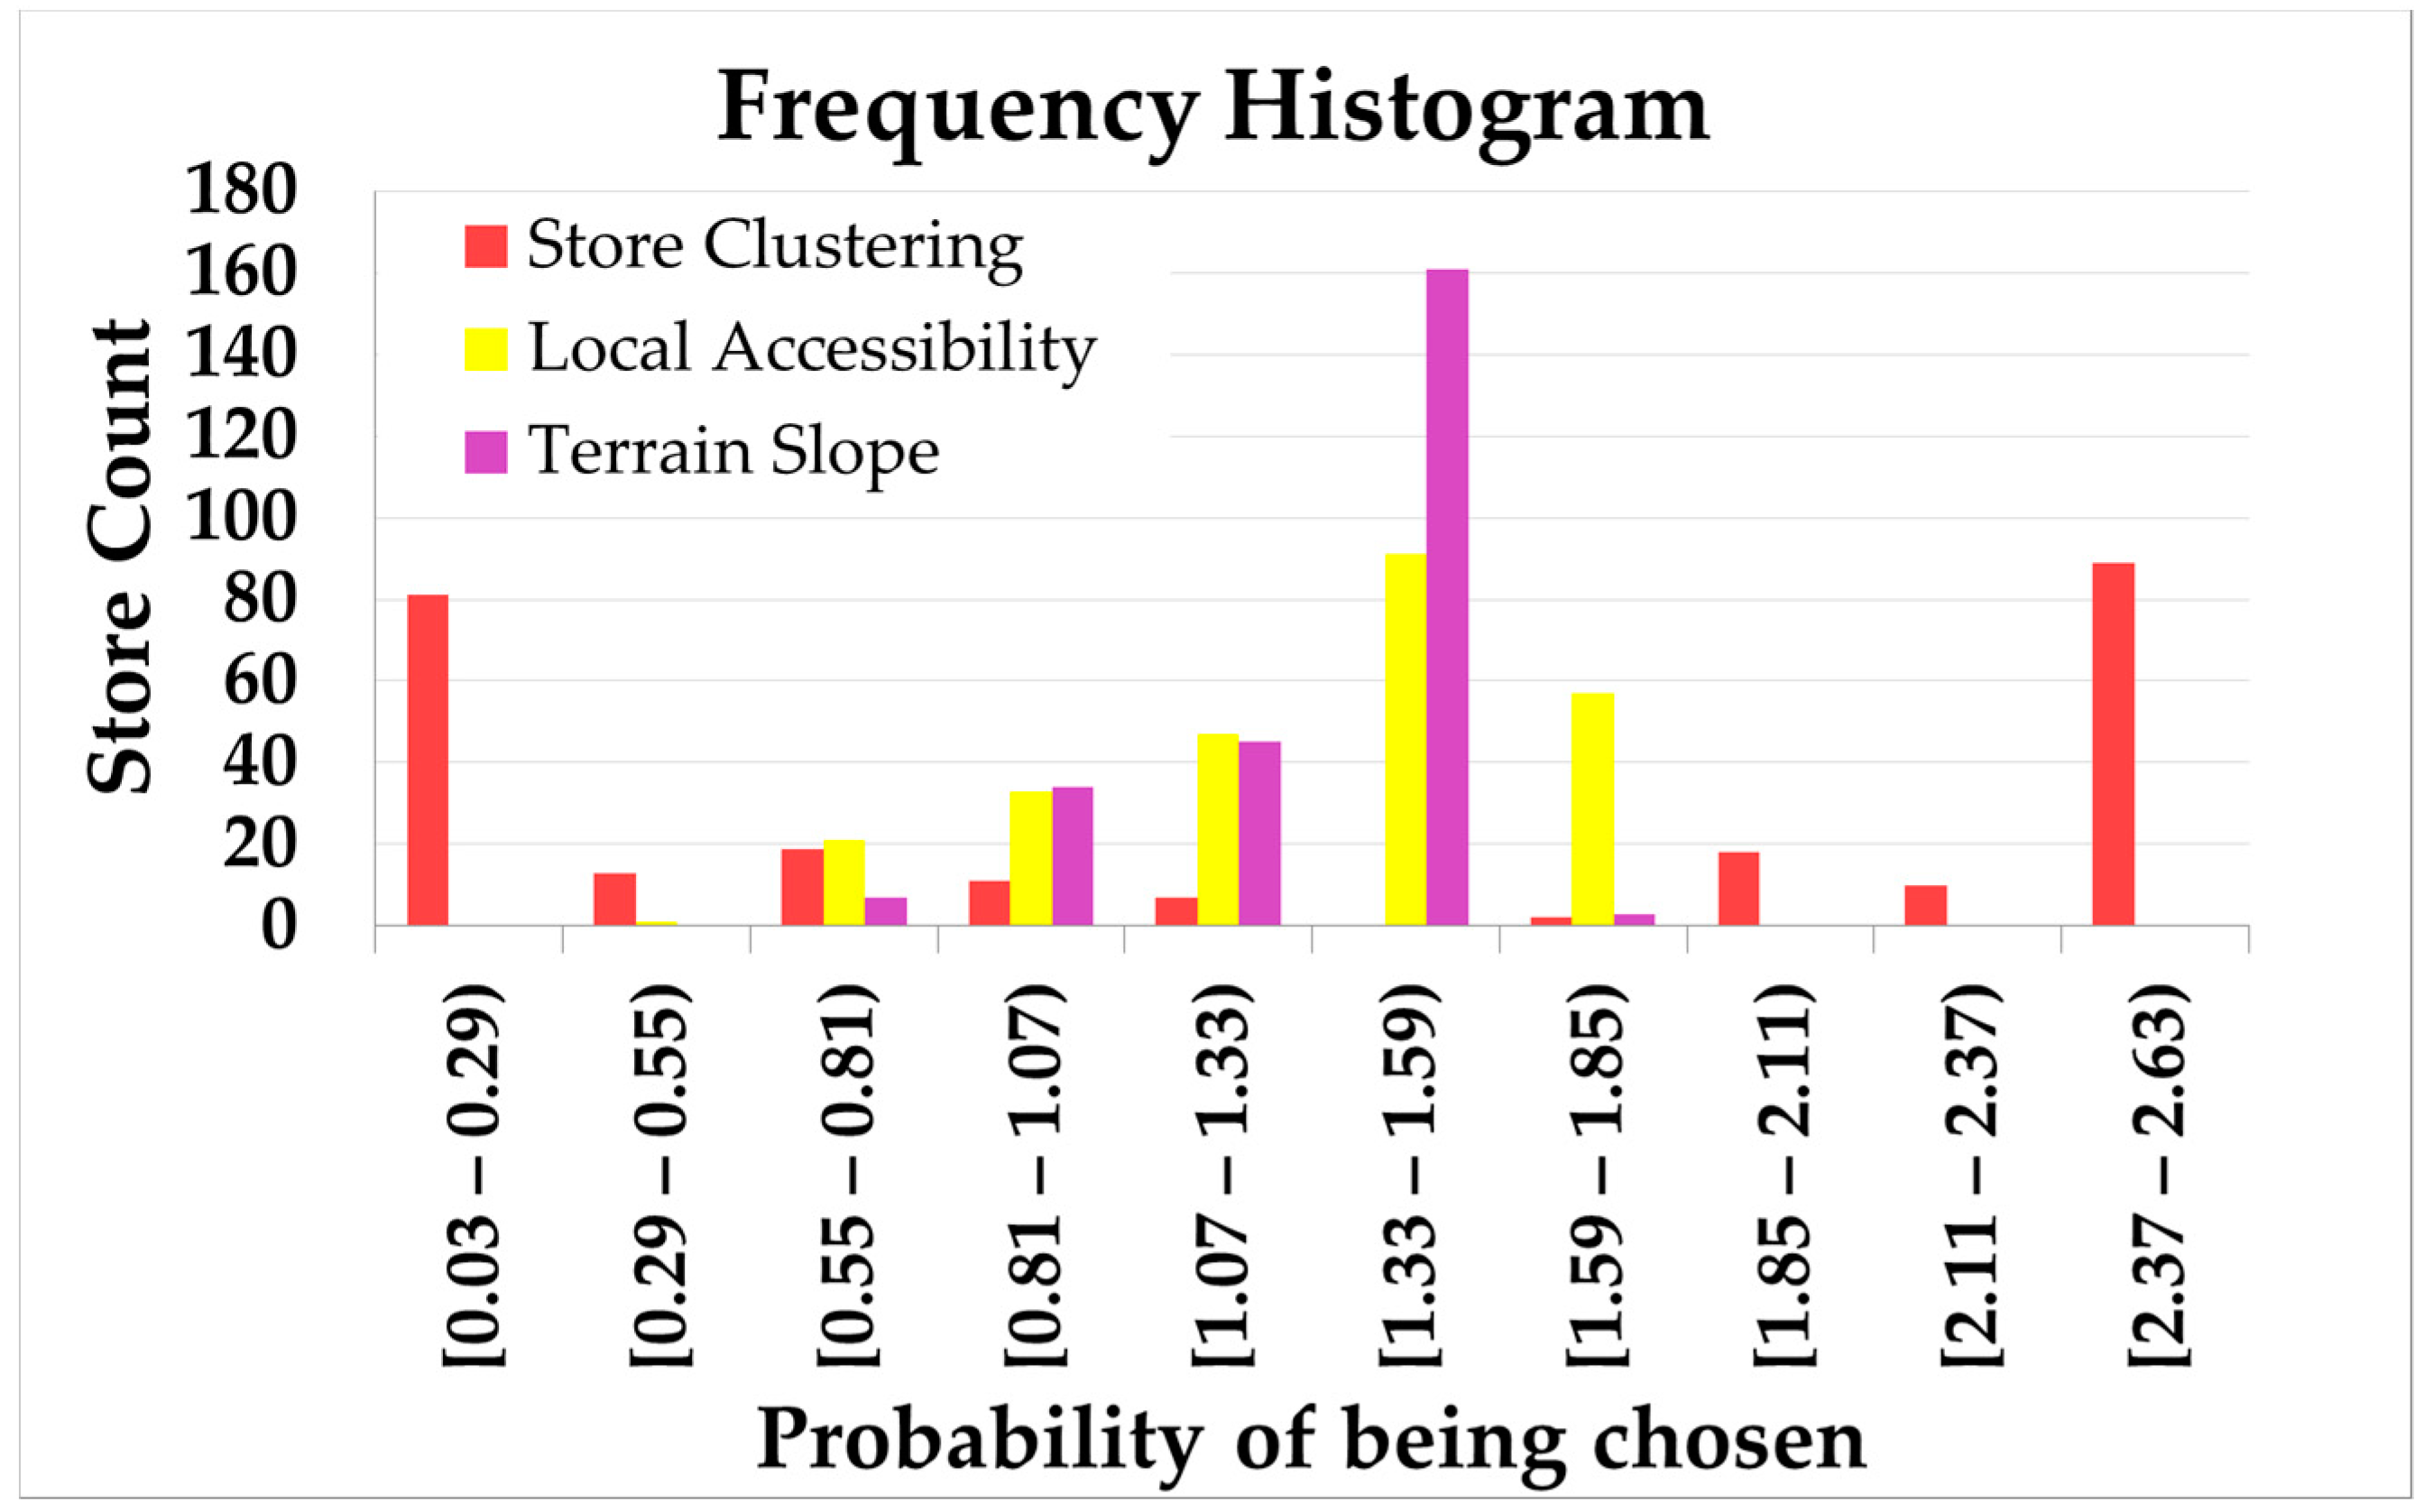
The impressions that we just discussed are endorsed by Figure 9, which shows the probability of each store being selected.
The Store Clustering variable had a high frequency at both ends of the graph, suggesting a strong tendency to influence consumer preference when it showed strong agglomeration (positive influence) or store dispersion (negative influence). This interpretation was supported by the analysis of the histograms of the values of each individual variable (Figure 2, Figure 3 and Figure 4), and of the dispersion measures (amplitude and standard deviation) illustrated in Table 2. Table 2 reveals, first, that the most homogenous result was that of terrain slope, which indicated a very consistent preference for less steep locations. The range of probability of a store being chosen when considering slope as an attractor variable was the smallest one for the set, followed by local accessibility and store clustering, in that order. The same occurred for standard deviation.
Finally, Table 3 shows the numeric results for the Huff model estimated population share.
We can observe that, while the parameters of local accessibility and terrain slope presented similar behaviors—with a difference of 8.47% for the best performance, and 7.21% for the worst—, we cannot say the same about store clustering. The top 10 stores with the best performances when considering only store clustering as an attraction variable couldattract 31.20% more people than when local accessibility was considered as the attraction variable, and 37.02% more than the terrain slope. The significance of this parameter was also suitable for the negative effects. The difference of the attracted population was of a negative degree of about 94%, when comparing with both the local accessibility and the terrain slope.
It is important to emphasize that the approach we adopted, due to the lack of actual consumer patronage data, represents purely a modelling output of potential attraction based on the selected urban criteria.
5. Final Remarks
This paper sought to discuss the influence of different store location attributes on the consumer choice. As methodological approach, we selected three location attributes—spatial agglomeration, local accessibility, and terrain slope—as measures of attractiveness in the Huff model to estimate the patronage probabilities of each store (location).
Regarding these location attributes, the study was able to show different behaviors of the clothing stores in Santa Maria. Our results reveal that most stores tend to choose locations with similar profiles, i.e., flatter and accessible to their neighborhoods, confirming literature on retail preferences [15,16]. We also identified only three significant retail clothing agglomerations in Santa Maria, and half the stores were relatively dispersed in the urban areas.
The model results on attractiveness allowed for the identification of the likely performances of each store location attribute and their spatial hierarchy. The stores could be ranked by their probabilities of being chosen, the amount of attracted population, and their statistical profiles, for each location attribute. Our results indicate that, for this dataset, the agglomeration attribute is by far the one that has more influence in the probability to attract customers. Locations with high values of clustering had an outstanding performance compared to the other studied attributes, while the ones with low values had the worst performance.
It is relevant to mention that unplanned retail agglomeration is a bottom-up urban attribute that emerges through decentralized decisions of many retailers taking location decisions to maximize their profits. Retail agglomeration tends to reduce consumer search costs, creating a critical mass of retail space for comparison shopping [32]. In areas of retail agglomeration, land prices tend to be higher, selecting for retailers that able to afford this cost. In this sense, store agglomeration tends to be a spare attribute, related to urban centralities and hierarchy.
In this paper we explored the Huff model to discuss urban form attributes of store locations. This application differs from the traditional use of the model, in which the attractiveness variable generally refers to the store itself, and the urban attributes appear as distance or travel time. The application allowed for different scenarios of probabilities for consumer patronage to be built, and discussion of the performance of selected urban form parameters.
In order to implement the application, some simplifications were adopted. We relied on a preliminary calibration of the Huff model based on theoretical assumptions, since no empirical research on consumer patronage was available. We must say that the variables used in this work were adequate, but future studies can enrich the methodology with the addition of other variables described in the literature as attractive factors.
Lastly, the task of urban planning in managing the relationship between retail and urban spaces is quite complex. Studies of the kind presented here can contribute to a better understanding of that relationship.
Author Contributions
Conceptualization, E.P.; Methodology, E.P., C.M.; Software, E.P.; Validation, E.P., C.M.; Formal Analysis, E.P., C.M.; Investigation, E.P., C.M.; Resources, E.P.; Writing—Original Draft Preparation, E.P., C.M.; Writing—Review & Editing, E.P., C.M.; Visualization, E.P.; Supervision, C.M.; Project Administration, E.P.
Funding
This study was financed in part by the Coordenação de Aperfeiçoamento de Pessoal de Nível Superior—Brasil (CAPES)—Finance Code 001.
Acknowledgments
For their support: Federal University of Rio Grande do Sul; Graduate Program in Urban and Regional Planning (PROPUR). We also thank an anonymous reviewer for valuable contributions on research method.
Conflicts of Interest
The authors declare no conflict of interest.
References
- McKinsey & Company. McKinsey-General Foods Study: The Economics of Food Distributors; General Foods Corporation: New York, NY, USA, 1964. [Google Scholar]
- Clarke, I. Deconstructing retail location decisions. In Proceedings of the 2nd Recent Advances in Retailing and Services Science Conference, Broadbeach, Australia, 11–14 July 1995; pp. 11–14. [Google Scholar]
- Brown, S. The wheel of retail gravitation. Environ. Plan. A 1992, 24, 1409–1429. [Google Scholar] [CrossRef]
- Mejia, L.; John, B. What do we know about the determinants of shopping center sales? Spatial vs. non-spatial factors. J. Real Estate Lit. 2002, 10, 1–26. [Google Scholar]
- Christaller, W. Central Places in Southern Germany; Prentice Hall: Upper Saddle River, NJ, USA, 1966; ISBN 978-0131226302. [Google Scholar]
- Berry, B.J. Geography of Market Centers and Retail Distribution; Prentice Hall: Upper Saddle River, NJ, USA, 1967; ISBN 9780133513042. [Google Scholar]
- Ikuno, S.H. Análise de Localização Varejista: Uma Base Urbana. Ph.D. Thesis, Fundação Getúlio Vargas, São Paulo, Brazil, 1987. [Google Scholar]
- Hansen, W.G. How accessibility shapes land use. J. Am. Inst. Plan. 1959, 25, 73–76. [Google Scholar] [CrossRef]
- Dawson, J. (Ed.) Retail Geography (RLE Retailing and Distribution); Routledge: New York, NY, USA, 2012; Volume 7, ISBN 9781136246104. [Google Scholar]
- Konishi, H. Concentration of competing retail stores. J. Urban Econ. 2005, 58, 488–512. [Google Scholar] [CrossRef] [Green Version]
- Arentze, T.A.; Oppewal, H.; Timmermans, H.J. A multipurpose shopping trip model to assess retail agglomeration effects. J. Mark. Res. 2005, 42, 109–115. [Google Scholar] [CrossRef]
- Hillier, B. Space is the Machine: A Configurational Theory of Architecture; Space Syntax: London, UK, 1996; ISBN 9780521560399. [Google Scholar]
- Porta, S.; Strano, E.; Iacoviello, V.; Messora, R.; Latora, V.; Cardillo, A.; Wang, F.; Scellato, S. Street centrality and densities of retail and services in Bologna, Italy. Environ. Plan. B Plan. Des. 2009, 36, 450–465. [Google Scholar] [CrossRef]
- Scoppa, M.D.; John, P. Distributed attraction: The effects of street network connectivity upon the distribution of retail frontage in the City of Buenos Aires. Environ. Plan. B Plan. Des. 2015, 42, 354–378. [Google Scholar] [CrossRef]
- Hillier, B. Centrality as a process: Accounting for attraction inequalities in deformed grids. Urban Des. Int. 1999, 4, 107–127. [Google Scholar] [CrossRef]
- Van Nes, A. Typology of shopping areas in Amsterdam. In Proceedings of the Space Syntax. 5th International Symposium, Amsterdam, The Netherlands, 15–17 June 2005; Techne Press: Amsterdam, The Netherlands, 2005. [Google Scholar]
- Chiaradia, A.; Hillier, B.; Schwander, C.; Wedderburn, M. Compositional and urban form effects on centres in Greater London. Urban Des. Plan. 2012, 165, 21–42. [Google Scholar] [CrossRef]
- Sevtsuk, A. Path and Place: A Study of Urban Geometry and Retail Activity in Cambridge and Somerville, MA. Ph.D. Thesis, MIT, Cambridge, MA, USA, 2010. Available online: http://dspace.mit.edU/handle/1721.1/62034 (accessed on 3 September 2018).
- Cervero, R.; Michael, D. Walking, bicycling, and urban landscapes: Evidence from the San Francisco Bay Area. Am. J. Public Health 2003, 93, 1478–1483. [Google Scholar] [CrossRef] [PubMed]
- Larrañaga, A.M.; Rizzi, L.I.; Arellana, J.; Strambi, O.; Cybis, H.B. The Influence of built environment and travel attitudes on walking: A case study of Porto Alegre, Brazil. Int. J. Sustain. Transp. 2016, 10, 332–342. [Google Scholar] [CrossRef]
- Reilly, W.J. The Law of Retail Gravitation; Knickerbocker Press: New York, NY, USA, 1931. [Google Scholar]
- Baker, R.G.V. An Introduction to Retail and Consumer Modelling. Dynamic Trip Modelling: From Shopping Centres to the Internet; Springer: Dordrecht, The Netherlands, 2006; pp. 21–76. [Google Scholar]
- Huff, D.L. Defining and estimating a trading area. J. Mark. 1964, 28, 34–38. [Google Scholar] [CrossRef]
- Dramowicz, E. Retail Trade Area Analysis Using the Huff Model. Directions Magazine, 3 July 2005. [Google Scholar]
- Vitalli, K.; Lena, H. The Value of Location: Spatial Analysis of Urban Morphology for Retail Development. In Proceedings of the IRES International Conference, Edinburgh, UK, 29 June 2016. [Google Scholar]
- Leite, H.L. Métodos de Modelagem e Análise Urbana Baseados em Dados Desagregados. Master’s Thesis, PROPUR-Federal University of Rio Grande do Sul-UFRGS, Porto Alegre, Brazil, 2015; p. 101. [Google Scholar]
- Longley, P.A.; Goodchild, M.F.; Maguire, D.J. Rhind. Sistemas e Ciência da Informação Geográfica; Bookman Editora: Porto Alegre, Brazil, 2009. [Google Scholar]
- Hillier, B.; Hanson, J. The Social Logic of Space; Cambridge University Press: New York, NY, USA, 1984. [Google Scholar]
- Krafta, R. Modelling intraurban configurational development. Environ. Plan. B Plan. Des. 1994, 21, 67–82. [Google Scholar] [CrossRef]
- Huff, D.L. Parameter Estimation in the Huff Model; Arc User-ESRI: Redlands, CA, USA, 2003; pp. 34–36. [Google Scholar]
- Do Nascimento, M.D.; Moura, N.S. Análise Espacial da Expansão Urbana de Santa Maria/RS e tendências atuais. Boletim Gaúcho de Geografia 2014, 41, 150–167. [Google Scholar]
- Eppli, M.J.; Shilling, J.D. How Critical Is a Good Location to a Regional Shopping Center? J. Real Estate Res. 1996, 12, 459–468. [Google Scholar]
Figure 1.
Location map of Santa Maria and the study area. Source: authors.

Figure 2.
Kernel density map of location of clothing stores in the study area and frequency histogram. Source: authors.
Figure 2.
Kernel density map of location of clothing stores in the study area and frequency histogram. Source: authors.

Figure 3.
Local accessibility of the street grid and frequency histogram. Source: authors based in software UrbanMetrics.
Figure 3.
Local accessibility of the street grid and frequency histogram. Source: authors based in software UrbanMetrics.

Figure 4.
Terrain slope and frequency histogram. Source: authors, based on STRM image.

Figure 5.
Population 2010, census tract level. Source: authors, based on IBGE data.

Figure 6.
Customer patronage probabilities for store clustering as an attraction variable. Source: authors, based on the Huff model (ArcGIS Market Analysis Tools).
Figure 6.
Customer patronage probabilities for store clustering as an attraction variable. Source: authors, based on the Huff model (ArcGIS Market Analysis Tools).

Figure 7.
Customer patronage probabilities for local accessibility as an attraction variable. Source: authors based in Huff model (ArcGIS Market Analysis Tools).
Figure 7.
Customer patronage probabilities for local accessibility as an attraction variable. Source: authors based in Huff model (ArcGIS Market Analysis Tools).

Figure 8.
Customer patronage probabilities for terrain slope (inverse) as an attraction variable. Source: authors based in Huff model (ArcGIS Market Analysis Tools).
Figure 8.
Customer patronage probabilities for terrain slope (inverse) as an attraction variable. Source: authors based in Huff model (ArcGIS Market Analysis Tools).

Figure 9.
Probability of a store being chosen based on selected parameters. Source: author.


Table 1.
Input location variables and methodology.
| Urban Form Aspects | Location Attribute | Input | Output |
|---|---|---|---|
| Store clustering | Level of spatial clustering of stores | Location of the stores | Kernel density of the stores |
| Accessibility | Topological accessibility | Street network | Local accessibility of the street segment |
| Environmental aspect | Terrain slope | Digital Elevation Model—SRTM | Slope (degree) of the area |
Source: authors.
Table 2.
Measures of dispersion.
| Parameters | Range | Standard Deviation | |
|---|---|---|---|
| Store clustering | 98,444 | 41,895 | |
| Values are normalized | Local Accessibility | 57,616 | 13,691 |
| Terrain slope | 61,684 | 11,326 | |
| Probability of being chosen with this variable as attractor | Store clustering | 2.598 | 1.078 |
| Local Accessibility | 1.381 | 0.311 | |
| Terrain slope | 1.112 | 0.213 |
Source: authors.
Table 3.
Estimated population share for top 10 stores, both with best and worst performances, according to selected attraction parameters (first line).
Table 3.
Estimated population share for top 10 stores, both with best and worst performances, according to selected attraction parameters (first line).
| Store Clustering | Topological Accessibility | Terrain Slope | ||||
|---|---|---|---|---|---|---|
| Stores | Attracted Popul. | Stores | Attracted Popul. | Stores | Attracted Popul. | |
| Best Performance | Store (41) | 1974 | Store (200) | 1501 | Store (200) | 1367 |
| Store (61) | 1973 | Store (212) | 1417 | Store (229) | 1269 | |
| Store (59) | 1967 | Store (224) | 1390 | Store (127) | 1257 | |
| Store (58) | 1966 | Store (101) | 1373 | Store (225) | 1247 | |
| Store (55) | 1965 | Store (127) | 1367 | Store (101) | 1216 | |
| Store (56) | 1965 | Store (129) | 1318 | Store (214) | 1213 | |
| Store (53) | 1962 | Store (102) | 1317 | Store (126) | 1208 | |
| Store (10) | 1960 | Store (211) | 1286 | Store (125) | 1203 | |
| Store (57) | 1958 | Store (49) | 1273 | Store (215) | 1197 | |
| Store (43) | 1957 | Store (130) | 1273 | Store (141) | 1194 | |
| Sum | 19,647 | 13,515 | 12,371 | |||
| Worst Performance | Store (180) | 26 | Store (169) | 402 | Store (70) | 409 |
| Store (174) | 27 | Store (173) | 500 | Store (48) | 437 | |
| Store (173) | 28 | Store (177) | 503 | Store (85) | 492 | |
| Store (147) | 28 | Store (170) | 507 | Store (187) | 503 | |
| Store (188) | 28 | Store (184) | 517 | Store (78) | 527 | |
| Store (159) | 28 | Store (182) | 527 | Store (153) | 608 | |
| Store (185) | 29 | Store (228) | 547 | Store (145) | 611 | |
| Store (160) | 29 | Store (226) | 553 | Store (38) | 664 | |
| Store (194) | 29 | Store (163) | 559 | Store (68) | 674 | |
| Store (133) | 29 | Store (164) | 579 | Store (63) | 675 | |
| Sum | 281 | 5194 | 5600 | |||
Source: authors based in Huff model (ArcGIS Market Analysis Tools).
© 2018 by the authors. Licensee MDPI, Basel, Switzerland. This article is an open access article distributed under the terms and conditions of the Creative Commons Attribution (CC BY) license (http://creativecommons.org/licenses/by/4.0/).
Share and Cite
MDPI and ACS Style
Paroli, E.; Maraschin, C. Locational Attractiveness Modelling of Retail in Santa Maria, Brazil. Urban Sci. 2018, 2, 105. https://0-doi-org.brum.beds.ac.uk/10.3390/urbansci2040105
AMA Style
Paroli E, Maraschin C. Locational Attractiveness Modelling of Retail in Santa Maria, Brazil. Urban Science. 2018; 2(4):105. https://0-doi-org.brum.beds.ac.uk/10.3390/urbansci2040105
Chicago/Turabian StyleParoli, Eliziéle, and Clarice Maraschin. 2018. "Locational Attractiveness Modelling of Retail in Santa Maria, Brazil" Urban Science 2, no. 4: 105. https://0-doi-org.brum.beds.ac.uk/10.3390/urbansci2040105