Sustainable Urban Transport Development by Applying a Fuzzy-AHP Model: A Case Study from Mersin, Turkey


Department of Transport Technology and Economics, Budapest University of Technology and Economics, Stoczek u. 2, H-1111 Budapest, Hungary
*
Author to whom correspondence should be addressed.
Urban Sci. 2019, 3(2), 55; https://0-doi-org.brum.beds.ac.uk/10.3390/urbansci3020055
Submission received: 20 April 2019
/
Revised: 14 May 2019
/
Accepted: 16 May 2019
/
Published: 20 May 2019
Abstract
:Sustainable development decisions generally require citizen participation in the decision process to avoid public resistance and objections in the long term. Because of the involvement of non-experts, the uncertainty of the decision is increased, and this must be considered in the decision-making process. This paper aims to introduce a sustainable urban transport development problem in which citizens are involved to allow them to express their preferences for improving certain elements of the public bus system. To mitigate the uncertainty of the non-expert evaluations, a fuzzy-analytic hierarchy process (AHP) model has been created and applied. Since the objective of the research is to provide a suitable framework for transport development tenders, only the criteria weights have to be determined; thus, an alternative level has not been applied. The model has been tested on the urban bus transport system of a large Turkish city: Mersin. Based on the application, citizen preference weights could be associated with certain elements of the supply quality; thus, government development source allocation decisions could be supported. The fuzzy-AHP model ensures that the final development implications will meet public demand for bus system improvement in the city.
1. Introduction
The image of public transportation is improving with the rapidly growing population of big cities, specifically in emerging countries. An enormous number of citizens have private cars; however, they may prefer using public transportation in place of using their own cars to avoid damage to the environment. A bus or tram can carry far more users than a single car, and even when electric cars become more common, public transport will always be the greener option. Also, public transportation is better than private cars at dealing with traffic problems. Furthermore, public transportation is a safer option and far less costly [1]. Improving the supply quality of public bus transportation systems is influential in the enhancement of passenger gratification. It is correlated with the assessment of various criteria related to transport quality, service quality and tractability [2,3,4,5,6,7]. In recent years, the majority of research has focused on passenger gratification in different transportation fields [8,9,10,11,12]. The studies overviewed the most critical issues in order to develop the transportation systems. Rubensson and Börjesson [13] presented a study that discussed the impact of crowded bus services in central Stockholm on passenger gratification. Surprisingly, they found that crowding does not seem to be notable for the passengers’ total satisfaction. Eboli and Mazzulla [14] proposed a model for enumerating gratification in public transport on the users’ side. They constructed a structural equation tool to examine the penetration of the relationship between global passenger gratification and service quality criteria. Duleba and Moslem [15] evaluated the public bus transport supply quality in Mersin from different evaluator groups’ standpoints (users, non-users and decision makers), and their study highlighted the most important attributes to increase the gratification of commuters and attract more potential users. Furthermore, they detected a significant gap between the different rater groups. To examine the service quality of the urban transportation in Granada (Spain), an artificial neural network (ANN) was applied, and the connection score approach resulted in the highest relative significance being speed, which is a critical issue [16]. A study in Thessaloniki city (Greece) presented an enumeration, from the commuters’ standpoint, of an advanced Bus Passenger Real-Time Information System based on 300 questionnaires [17]. Hassan et al. [18] proposed a multi-level framework to estimate urban transit service performance; a combination of subjective and objective measures was utilized to assess the service quality. The study allows for the opinions of the various evaluator groups of urban transit services (passengers, operators and service providers) to be incorporated in a multi-criteria evaluation process. Nandan [7] identified the intrinsic components of service quality for the efficient service of Indian railways at railway platforms. The work was exploratory in nature and employed attribute analysis to illustrate the most crucial factors of user pleasure with service quality. Diab and El-Geneidy [19] evaluated the impacts of implementing a combination of strategies, designed to improve the bus transit service, on running time and user pleasure. The service quality of urban transport was evaluated by performing a statistical and basic dynamic approach [14,20]. In the present study, we examine not only the tractability but also the transport quality and service quality, which are the main factors of the supply quality [7,21,22]. Furthermore, the employed application provides efficient and realistic results and avoids uncertainty. The present paper proposes to elevate the urban transportation usage rate in order to augment pleasure levels for commuters in Mersin city (Turkey), increasing the usage ratio of urban transport by attracting potential users; hence, the situation of urban transportation supply quality in Mersin was evaluated by using a pairwise comparison survey and applying the fuzzy-AHP approach as a methodology to make the evaluation process more realistic. One difference compared to other fuzzy-AHP methods is that the alternative level is missing in the hierarchy, because the main objective was to assign weights to supply quality criteria in order to gain an evaluation framework for future transport system development projects. By the application of the results, the local municipality gains a scoring map that can be used to evaluate development proposals directly, the scoring of which relies on citizens’ preferences. The result confirms the effectiveness of the recommended approach.
2. Materials and Methods
The analytical hierarchy process (AHP) is an effective decision-making methodology, which was situated by Saaty in the 1980s to expedite and decode complex decision problems [23]. The AHP method is based on an additive weighting process, in which several relevant criteria and alternatives are exhibited through their relative importance. The AHP approach has been extensively applied by academics and professionals in many fields and problems, mainly in engineering fields such as transport engineering [24,25,26,27,28], industrial engineering [29], civil engineering [30] and in many other engineering fields [31,32,33]. However, the AHP approach creates and deals with a very unbalanced scale of judgment, and it does not take into account the uncertainty associated with the mapping of human judgment to a number by natural language [34]; the ranking of the AHP method is rather imprecise, and subjective judgment by perception, evaluation, improvement and selection based on the preference of decision-makers has a great influence on the AHP results. To overcome these problems, several researchers have integrated fuzzy theory with AHP to improve its outcomes; furthermore, the fuzzy sets provide more efficient and real results because they mimic human reasoning [35,36,37,38,39,40].
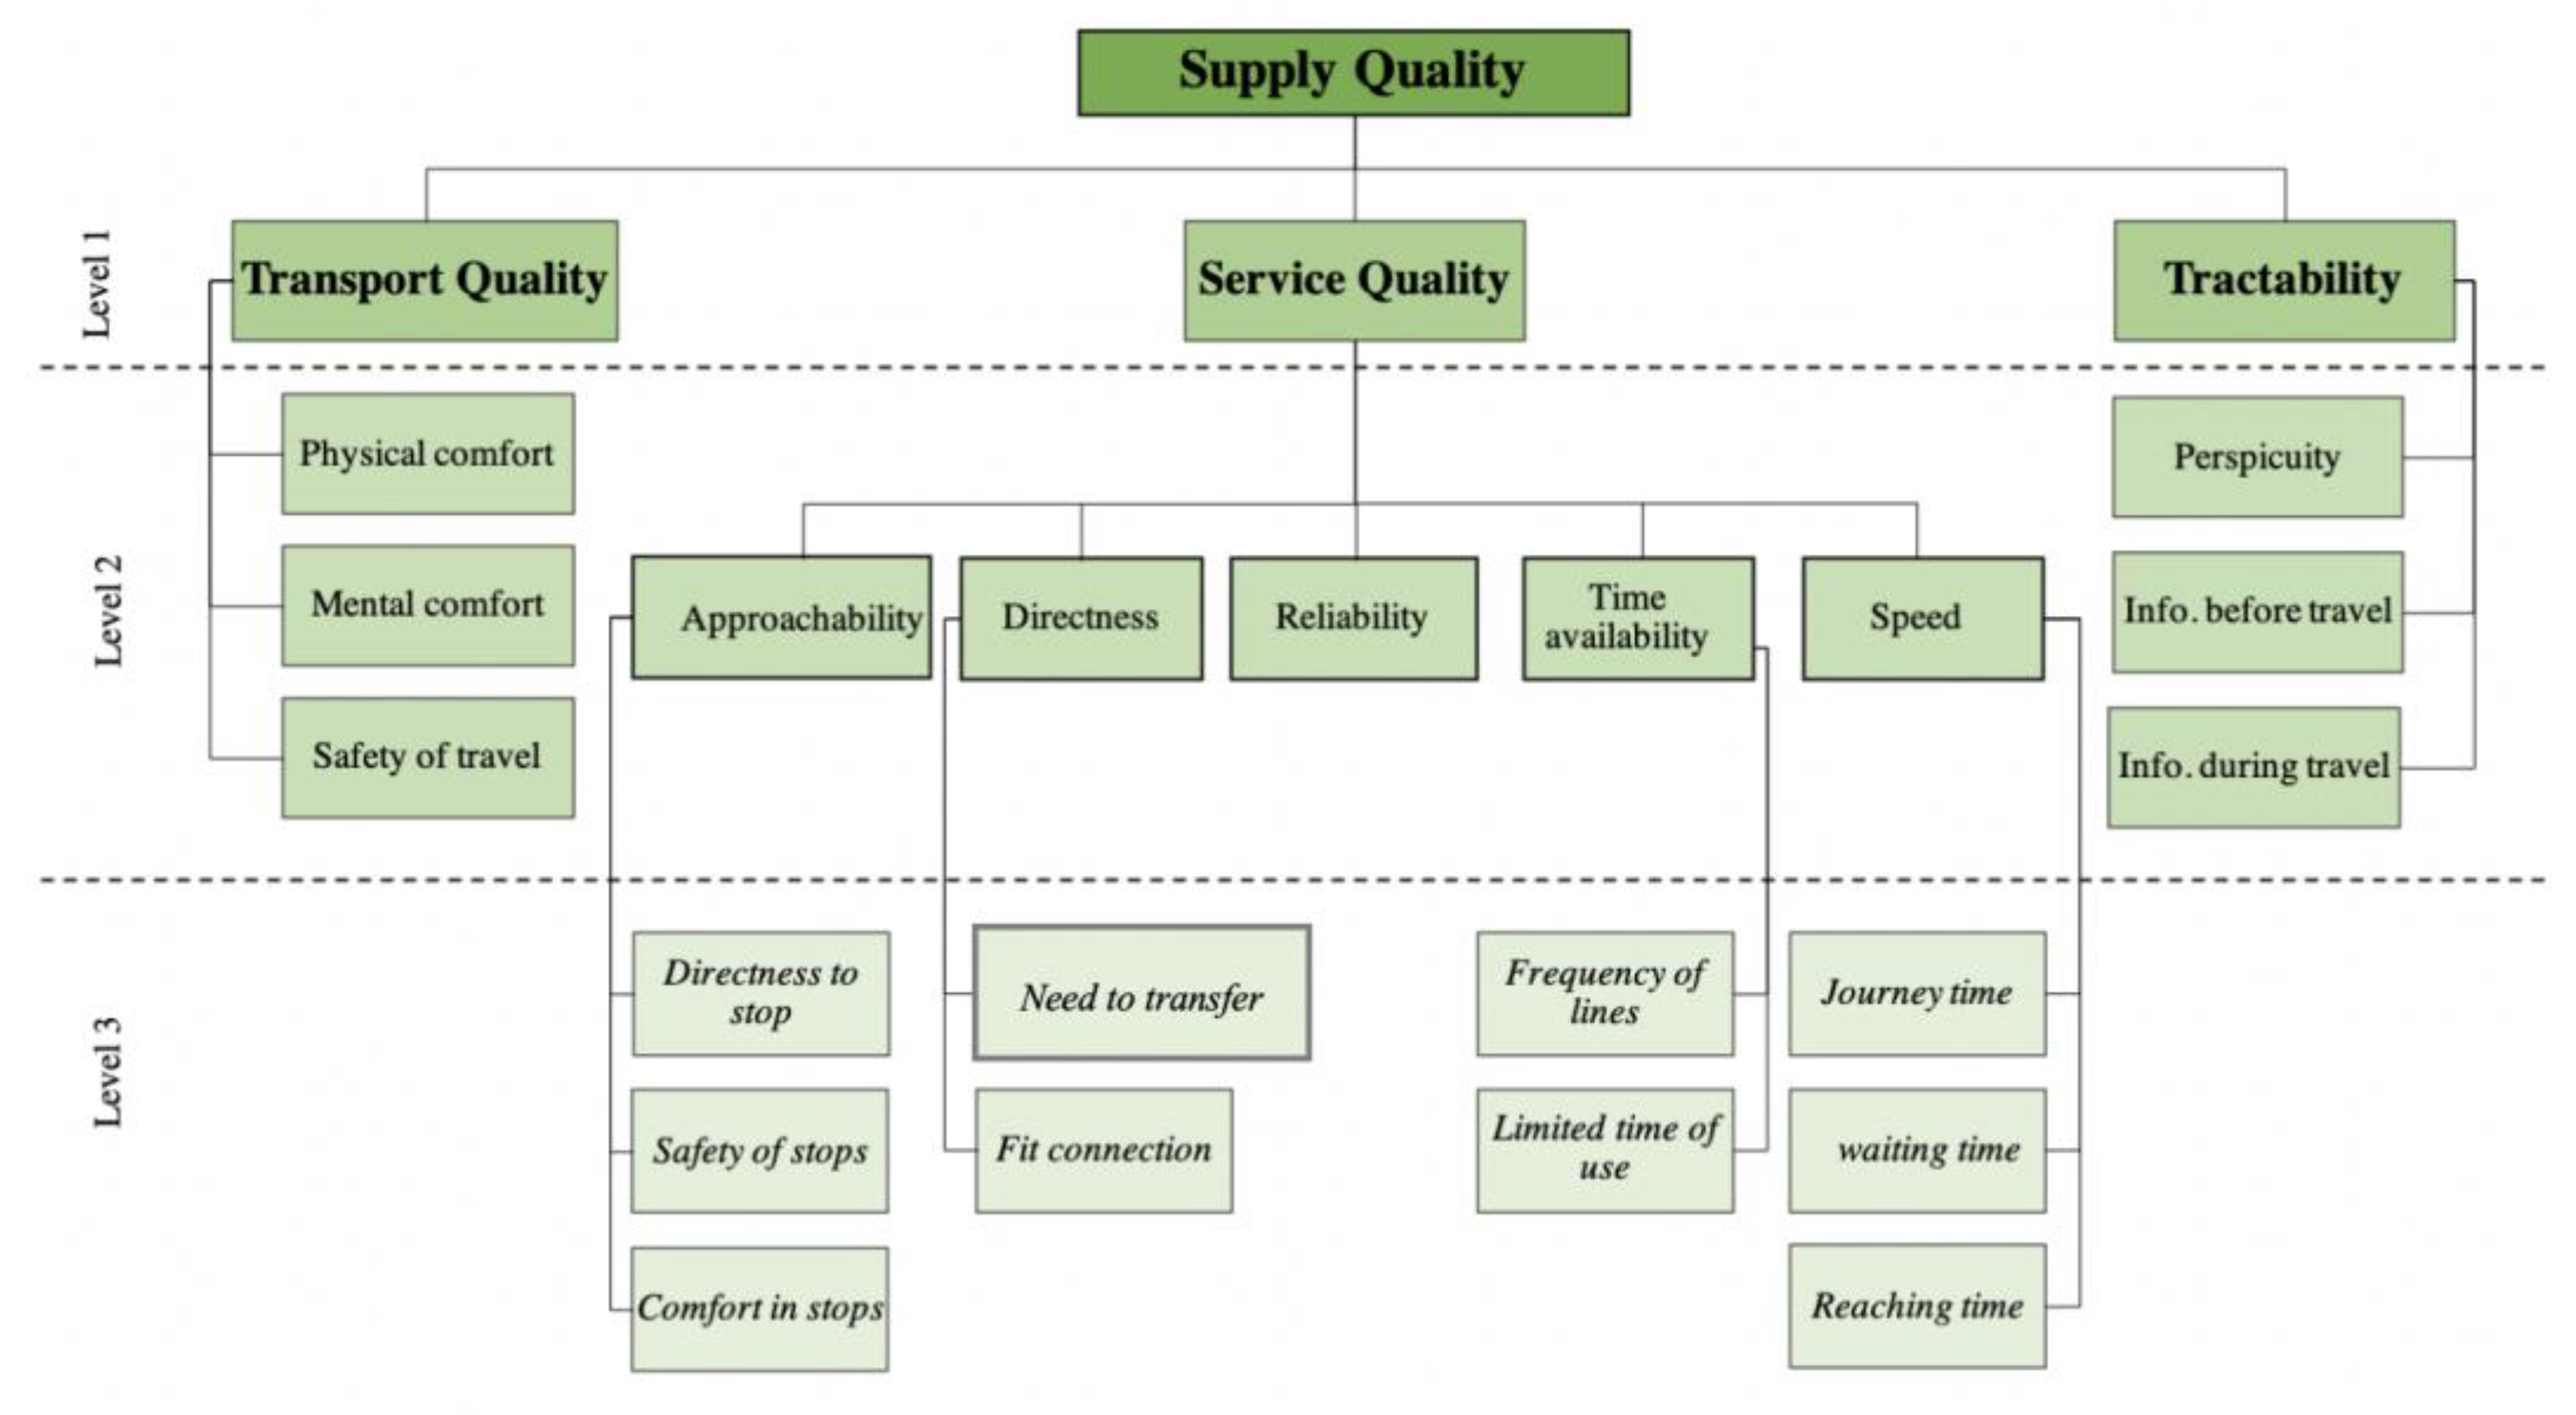
The purpose of this study is to highlight the most crucial urban transport supply quality criteria based on the fuzzy-AHP method; as a case study, Mersin city (Turkey) was selected. As a commencement study, the ensuing hierarchical structural model has been created and applied to elaborate upon the urban transport situation of a Japanese city, Yurihonjo, in 2012 [3].
This basic model of supply quality criteria was employed by the authors of the recent research for the case of Mersin city; however, in order to mitigate the uncertainty of the evaluations and make the evaluation process more flexible, a fuzzy (F)-AHP calculation technique was used. The main reason for fuzzification was not the insufficient options (a range from 1/9 to 9) for selecting any number of the Saaty-scale from AHP. Due to the participation of citizens, a real assumption of non-precise value selection arose. We assumed that the layman evaluator could give approximate scale numbers in the pairwise comparisons, but the difference among the scale values are so slight that, without proper expertise, the given preference could be untrustworthy. Thus, in the calculations, fuzzy numbers (FN) were allowed for the pairwise comparisons, and the final results were determined on this basis. Eighty citizens evaluated the AHP-based questionnaire, who were selected with respect to the social characteristics of the total population of the city. The survey was based on the hierarchy tree, and pairwise comparisons between the main criteria and sub-criteria were made. After the pairwise comparison evaluations, the final scores were calculated by the rules of F-AHP, and a consistency check was also performed. To better understand the features of F-AHP, in the following, the concepts for fuzzy hierarchical calculation are briefly reviewed in this section.
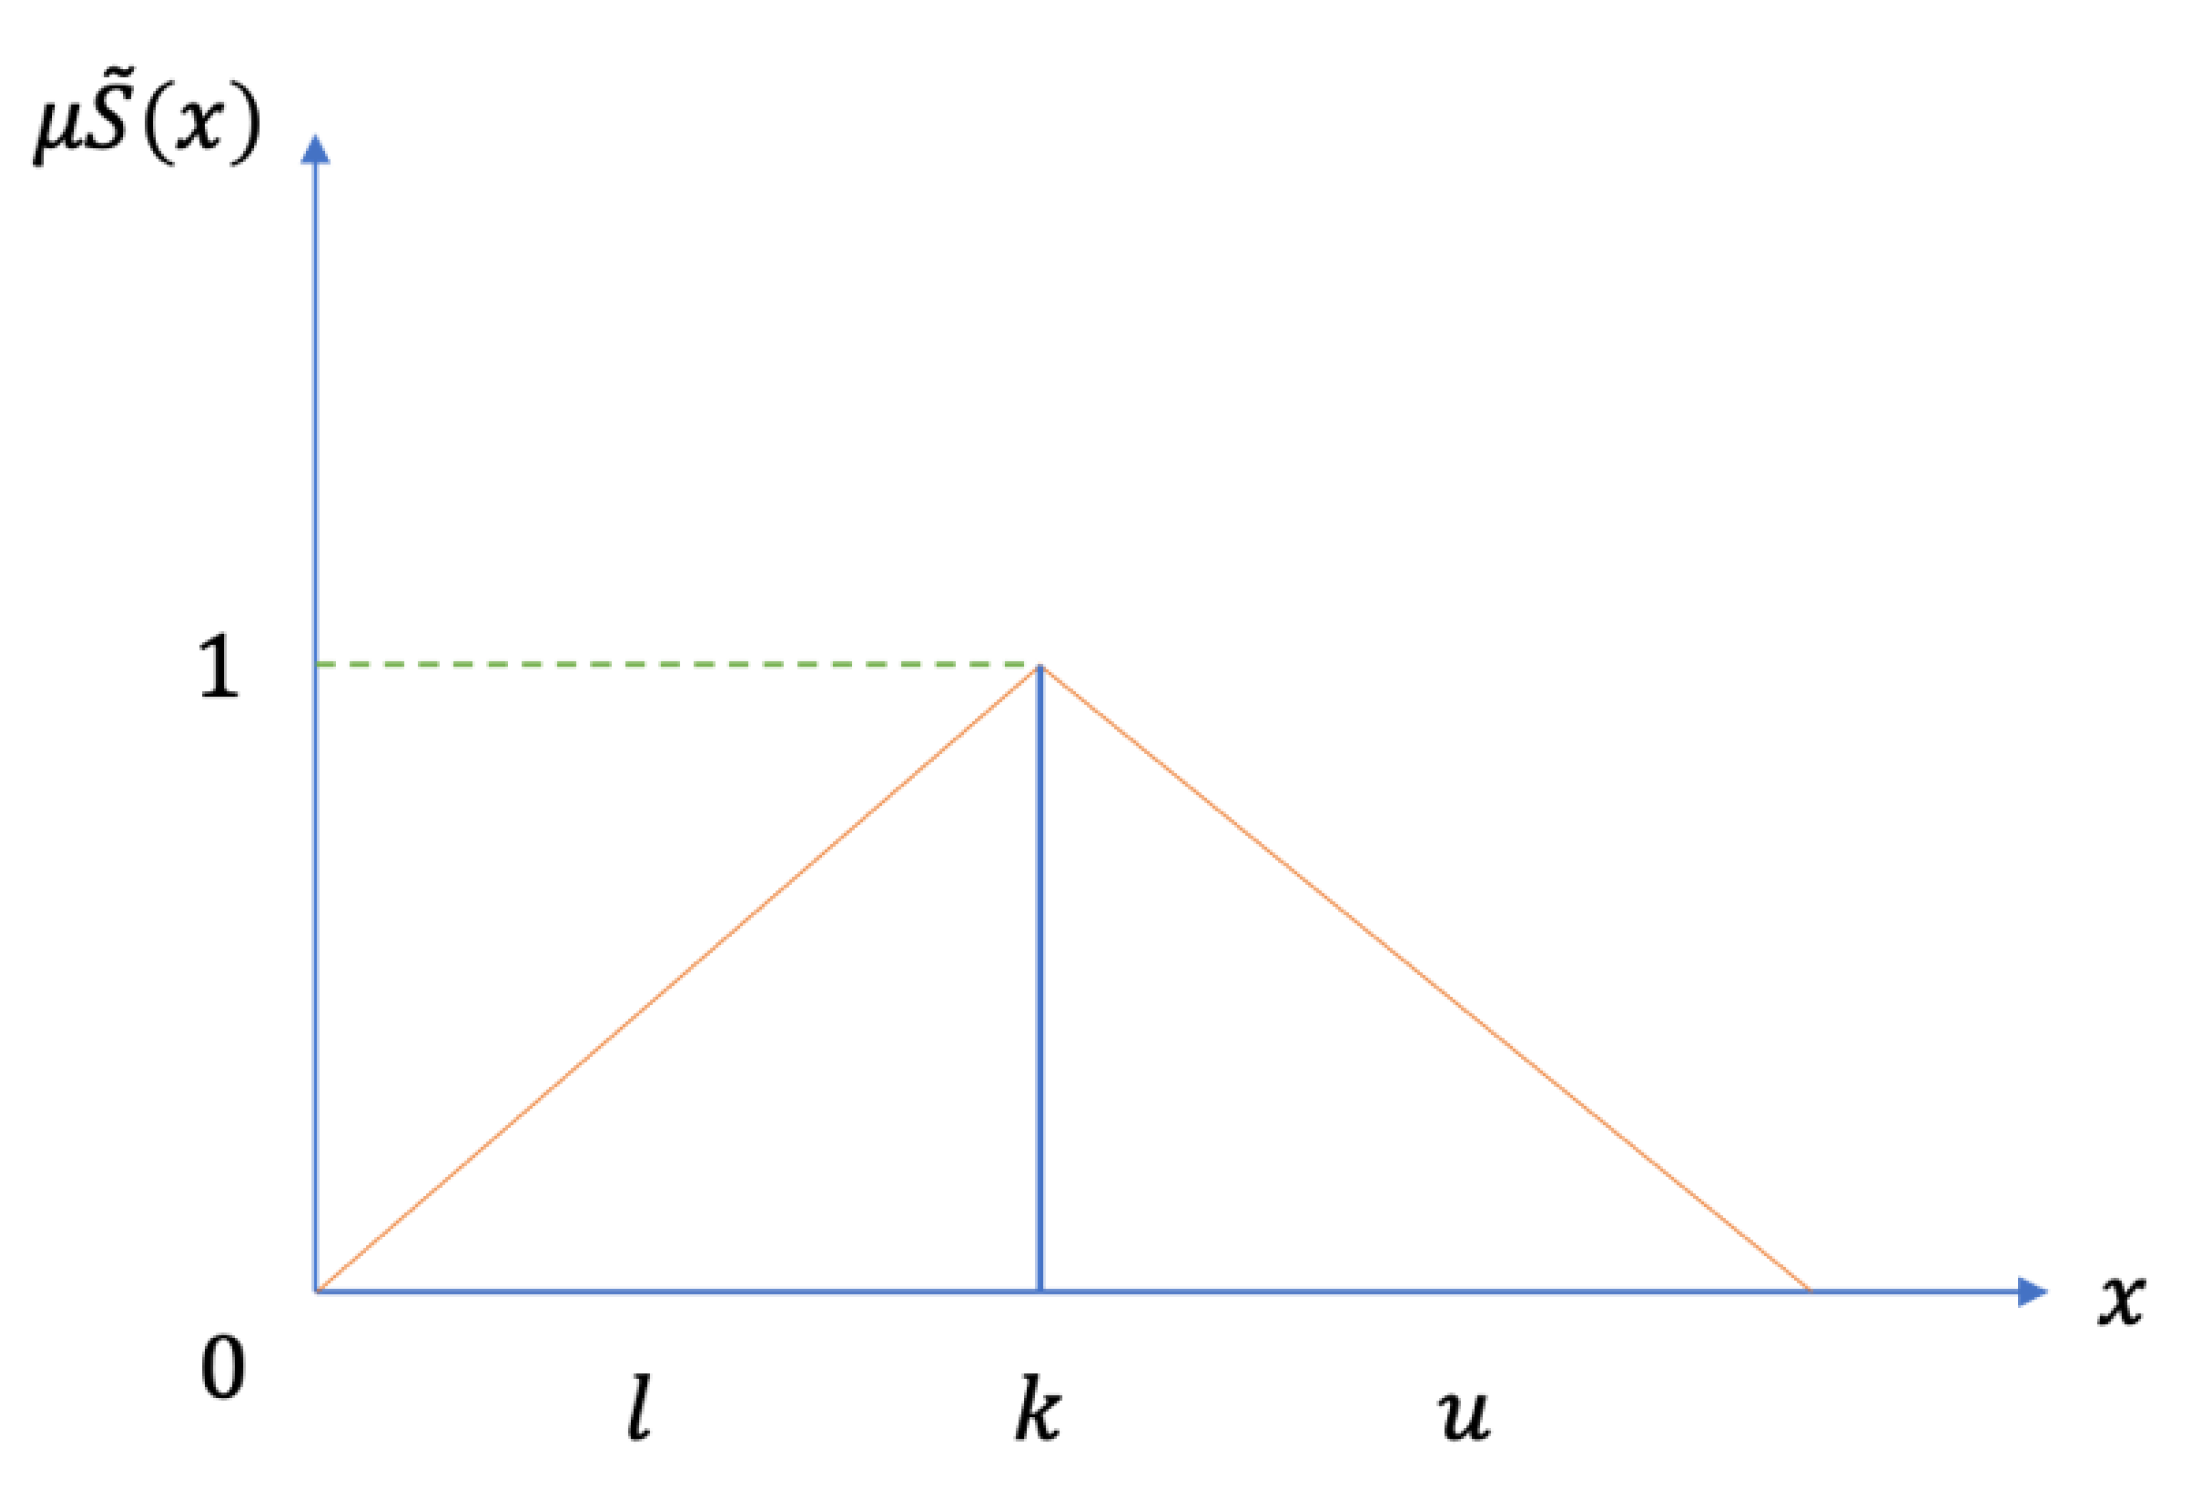
This mathematical concept has been employed by Sun [41] and Hsieh et al. [42]. For the decision problem of Mersin, the authors decided to use fuzzy logic by designing a survey questionnaire with triangular FN scales (Figure 1).
Suppose FN on R to be a triangle FN if its membership function (x): R → [0, 1] is equal to the following Equation (1):
From Equation (1), and mean the lower and upper bounds of the FN , and is the modal value for (like Figure 2). The triangular fuzzy numbers (TFN) can be denoted by . The operational laws of TFN and are displayed in Equations (2)–(6).
Addition of the FN :
Multiplication of the FN :
Subtraction of the FN :
Division of a fuzzy number :
Reciprocal of the FN:
In the current study, the computational technique is based on the following FNs that were defined by Gumus [41] and Sun [43] in Table 1.
The employed pairwise comparison matrices were constructed based on the hierarchical structure of the criteria (Figure 2). Linguistic terms were assigned to the pairwise comparisons by asking which criteria are more essential than others with respect to the main criterion, as is the bigger matrix () in the study:
where
To aggregate the fuzzy weights (FWs), the fuzzy geometric mean (GM) was used [42]:
where is the fuzzy comparison value of dimension to attribute ; thus, is a GM of the fuzzy comparison value of attribute to each criterion. is the FW of the -th attributes, and can be defined by a TFN, . The stand for the upper, middle, and lower values of the fuzzy score of the -th dimension.
3. Results
For the case of Mersin, an evaluation pattern of 80 citizens was selected. In the pattern, 40 people (they reflected the total population of the city in terms of age, gender and education) were actual users of the public bus system and another 40 people (also reflecting the total urban society) were inhabitants but non-users of the system. The 40 users were selected to detect their demand for improving public bus transportation in order to increase their satisfaction; however, the other group was selected to examine their demand for improving public bus transportation in order to attract them to use public transportation. Moreover, the ratio selection was based on the intention of the decision makers to consider equally the current and possible user preferences in the transport system development decisions when creating a sustainable solution, and the content of the pattern followed this requirement.
The pattern size could be considered as representative due to the phenomenon of “the wisdom of crowds” [44], where groups’ answer aggregation calculations represent their knowledge in an efficient way. Solomon argued that, when it comes to preference evaluations, even a relatively small group of people (over 20 members as a rule of thumb) can be representative because of the filtration of extreme opinions. The survey was conducted in 2017, and an instructor helped the participants to fill out the questionnaires; this might have been the cause of getting acceptably consistent answers in all cases, while Saaty’s consistency ratio was below 0.1. After the calculation, which was performed by employing Microsoft Excel software, a sensitivity analysis was also conducted and no significant sensitivity could be determined, so the results demonstrated in the following can be considered as a reliable basis for decision making in system development.
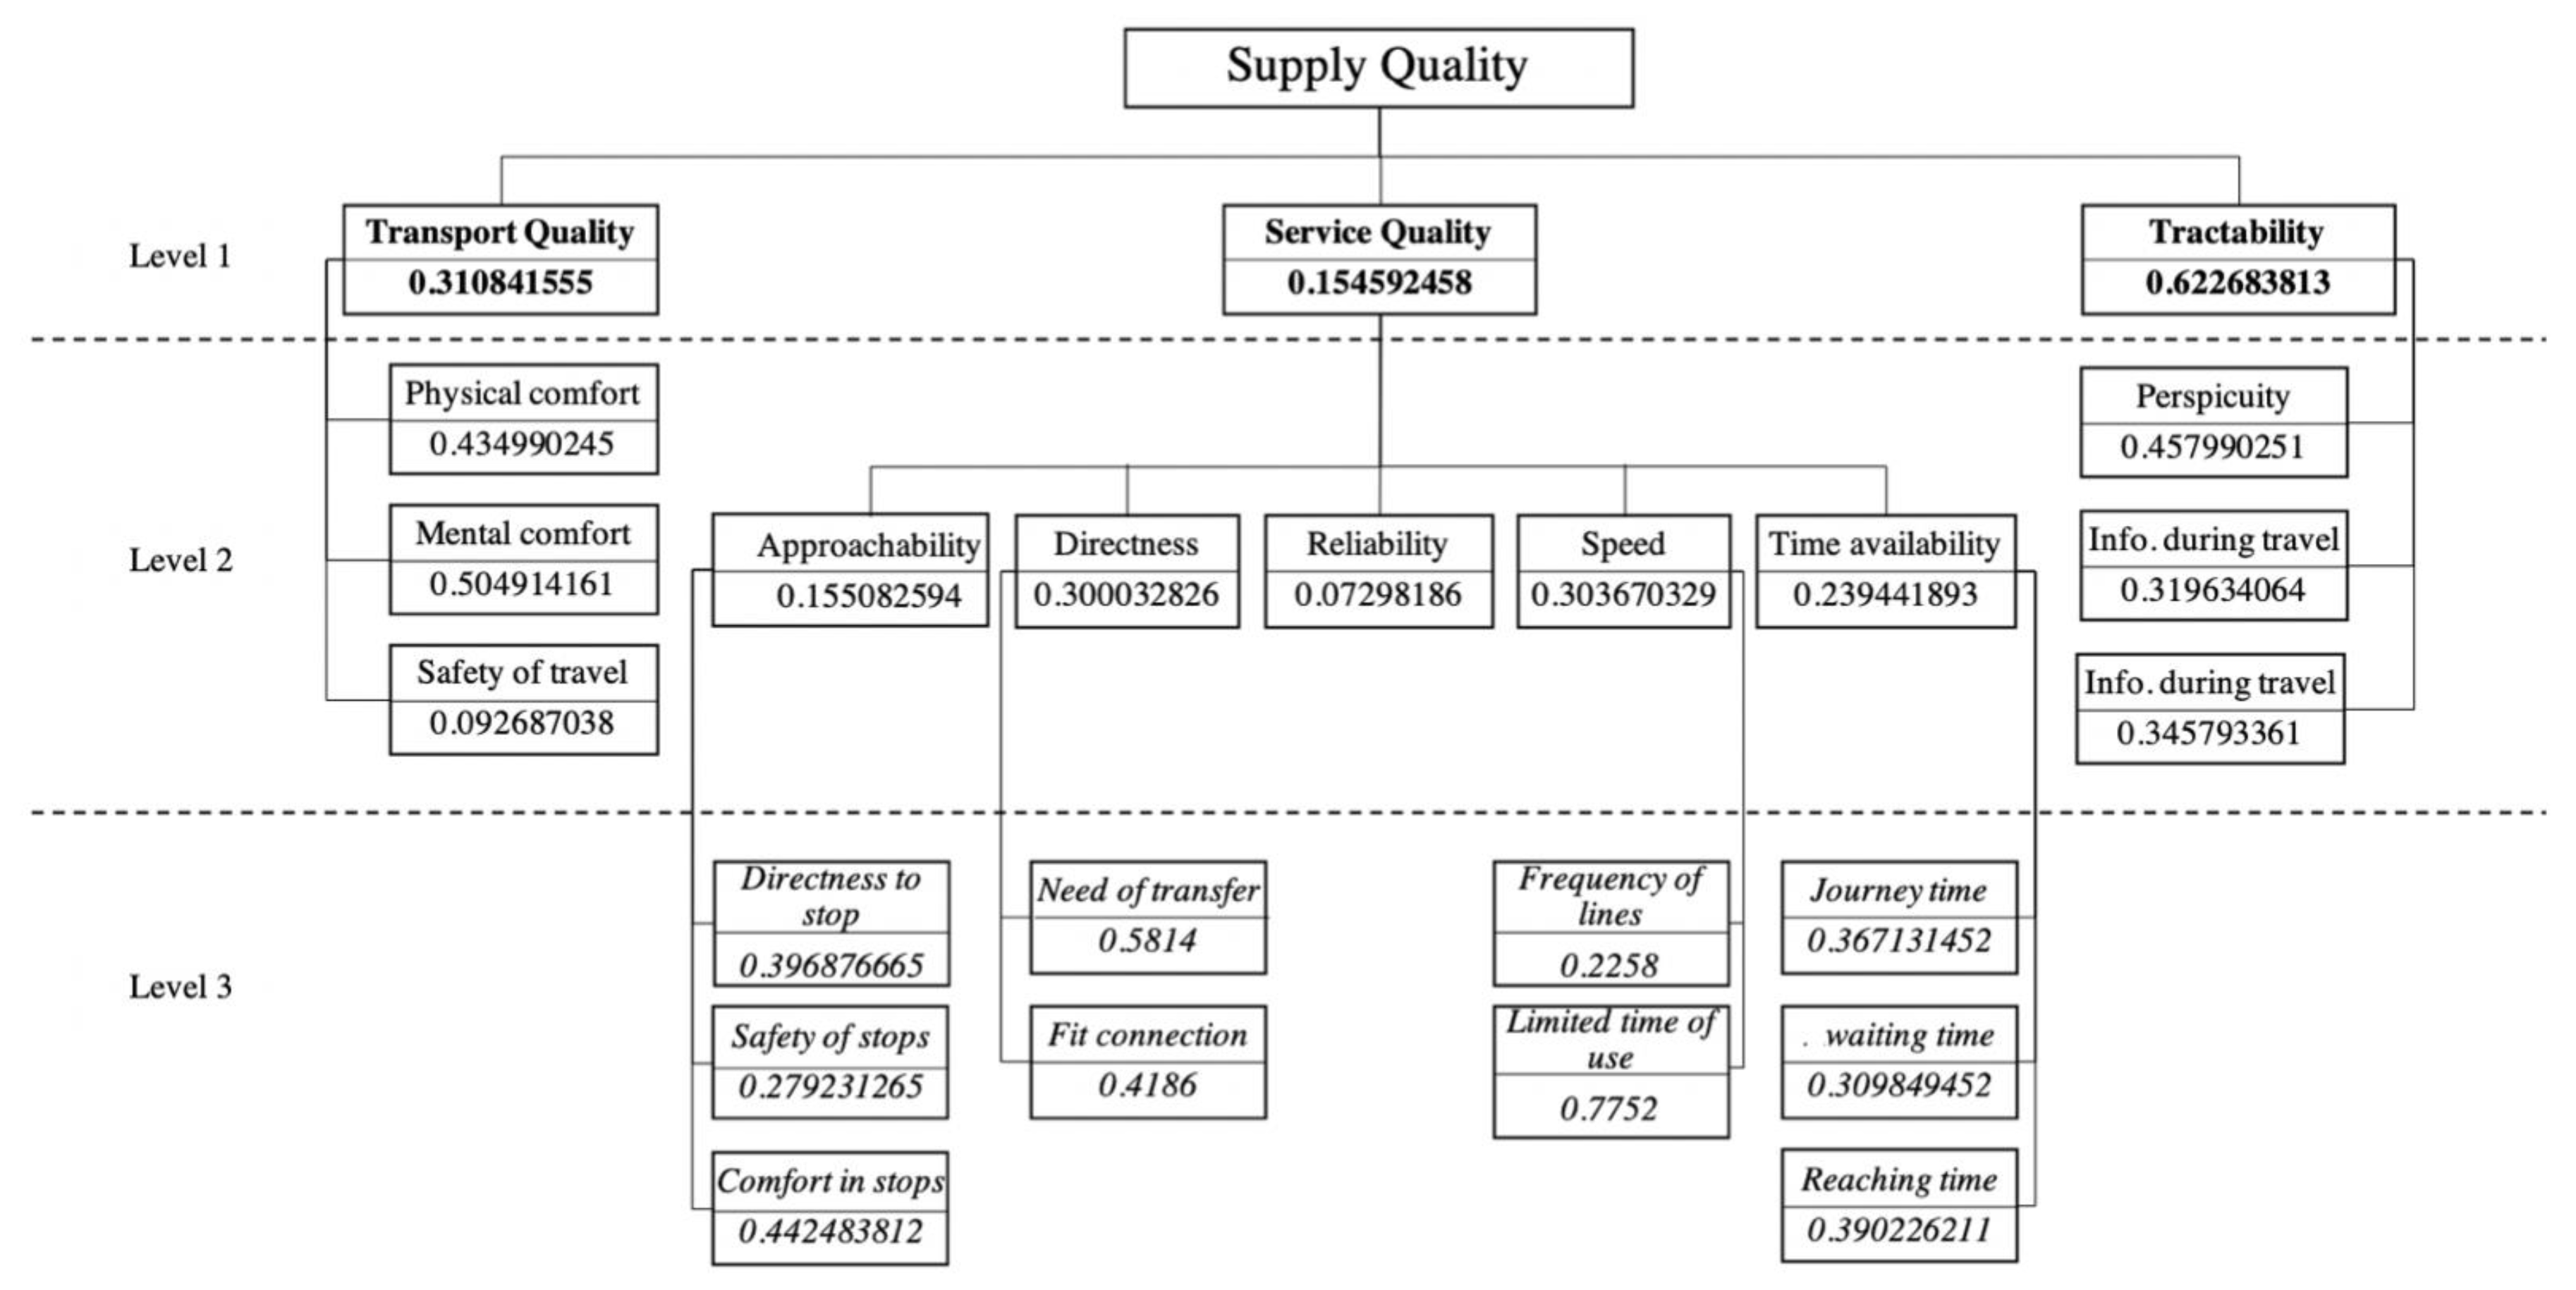
The determined FWs were slightly surprising for the municipality transport experts at all levels. As will be seen in the following, for sustainable development, the public preferred other issues than those that might have been expected. Figure 3 exhibits the final FWs for all elements of the supply quality structure. Even for the first level, the result is surprising; the public did not prefer common issues to be improved, such as transport quality or service quality, but the largest weight belonged to the tractability criterion (Table 2). Based on this, the municipality should not support those projects that endeavor to develop the traditional public system; e.g., purchasing new vehicles or changing routes of the lines. In the specific case of Mersin, providing information on the timetables in an efficient and understandable way would attract more people to use public transport.
Table 3 demonstrates the final fuzzy weights for elements in the second level of the supply quality hierarchy. It is visible that tractability issues dominate this level, just as they did in the previous level. Citizens clearly expressed that they do not find the timetables to be understandable and comprehensive, and this deters them from using public transport modes in the city. Through the pairwise comparisons, they also claimed to obtain sufficient information on the vehicle during travel and (with slightly less weight) before travel. Transport system development projects focusing on providing more and clearer information to the passengers and potential passengers can be recommended to support the decision makers of the local municipality.
The third level is a fairly specific one, with tactical/operational elements of the supply quality of the local public bus transport. In Table 4, it is visible that the element “limited time of use” had the highest importance. Consequently, it is recommended to modify the schedules of the lines by expanding the time intervals of the routes in the early and late hours of the day. Passengers and potential passengers (currently non-users) indicated that earlier lines in the mornings and later lines in the evenings might increase their satisfaction.
Direct travel is also required by citizens, which means that routes and timetables should be overviewed (possibly by origin–destination surveys in the city) in a development framework. Those projects that focus on improving these two issues are suggested to support the local government decision makers.
4. Conclusions and Future Works
The introduced case study demonstrates the applicability of the fuzzy-AHP model in sustainable decision-making processes for public transport development problems. By using the model, the involvement of citizens can be considered to be successful, and their derived preferences regarding the most worthwhile elements to be improved are a significant aid to municipality decision makers. Fuzzification helps to mitigate the uncertainty of the responses and provide more flexible facilities than the traditional AHP approach, which provides a clear and understandable system of the decision elements by its hierarchical logic. Moreover, the consistency check procedure of the method is especially beneficial in the case of layman evaluators.
As a limitation of the method, it has to be emphasized that the current model is not capable of dealing with possible non-hierarchical connections within the decision system. It has been proven by the introduced real data application that the hierarchical approach is dominant, but some interrelations can be detected; e.g., the logical connection between the frequency of lines and the physical comfort of the passengers (more frequent bus lines increase the space for passengers so increase their physical comfort). Therefore, applying a fuzzy-ANP model might be considered, which will likely be much more complicated for citizen evaluators and therefore might create a more difficult evaluation procedure. For public participants, a hybrid model combining the advantage of AHP and ANP techniques might be the most suitable, but this model is a subject of a future research. Moreover, the shape of the city should be added into the hierarchical model of transport systems as a main criterion because of its importance, with building density and street width evaluated as sub-criteria [45].
Author Contributions
S.M. conducted the survey and calculated the results, S.M. and S.D. conceptualized the research and created the suitable methodology. Both authors were involved in writing the manuscript.
Funding
This research received no external funding.
Conflicts of Interest
The authors declare no conflict of interest.
References
- American Public Transportation Association (APTA). Available online: https://www.apta.com/ (accessed on 10 November 2018).
- Güner, S. Measuring the quality of public transportation systems and ranking the bus transit routes using multi-criteria decision making techniques. Case Stud. Transp. Policy 2018, 6, 214–224. [Google Scholar] [CrossRef]
- Duleba, S.; Mishina, T.; Shimazaki, Y. A dynamic analysis on public bus transport’s supply quality by using AHP. Transport 2012, 27, 268–275. [Google Scholar] [CrossRef]
- Suman, H.K.; Bolia, N.B.; Tiwari, G. Comparing public bus transport service attributes in Delhi and Mumbai: Policy implications for improving bus services in Delhi. Transp. Policy 2017, 56, 63–74. [Google Scholar] [CrossRef]
- Borhan, M.; Ibrahim, A.N.H.; Syamsunur, D.; Rahmat, R.A. Why public bus is a less attractive mode of transport: A case study of Putrajaya, Malaysia. Period. Polytech. Transp. Eng. 2017, 47, 82–90. [Google Scholar] [CrossRef]
- Awasthi, A.; Chauhan, S.S.; Omrani, H.; Panahi, A. A hybrid approach based on SERVQUAL and fuzzy TOPSIS for evaluating transportation service quality. Comput. Ind. Eng. 2011, 61, 637–646. [Google Scholar] [CrossRef]
- Nandan, S. Determinants of customer satisfaction on service quality: A study of railway platforms in India. J. Public Transp. 2010, 13, 6. [Google Scholar]
- Hynes, M.; Bolbocean, O.; McNally, M.; Conroy, M.; Bednarczuk, D.; Hyland, F.; Coyne, E.; Marie, C. “Howya gettin’on?” Investigating public transport satisfaction levels in Galway, Ireland. Urban Sci. 2018, 2, 102. [Google Scholar] [CrossRef]
- Han, Y.; Li, W.; Wei, S.; Zhang, T. Research on passenger’s travel mode choice behavior waiting at bus station based on sem-logit integration model. Sustainability 2018, 10, 1996. [Google Scholar] [CrossRef]
- Zhen, F.; Cao, J.; Tang, J. Exploring correlates of passenger satisfaction and service improvement priorities of the Shanghai-Nanjing high speed rail. J. Transp. Land Use 2018, 11, 559–573. [Google Scholar] [CrossRef]
- Miranda, S.; Tavares, P.; Queiró, R. Perceived service quality and customer satisfaction: A fuzzy set QCA approach in the railway sector. J. Bus. Res. 2018, 89, 371–377. [Google Scholar] [CrossRef]
- Wagenaar, J.; Kroon, L.; Fragkos, I. Rolling stock rescheduling in passenger railway transportation using dead-heading trips and adjusted passenger demand. Transp. Res. Part B Methodol. 2017, 101, 140–161. [Google Scholar] [CrossRef]
- Rubensson, I.; Börjesson, M. Satisfaction with Crowding in Public Transport; (No. 2018: 6); CTS-Centre for Transport Studies Stockholm (KTH and VTI): Stockholm, Sweden, 2018. [Google Scholar]
- Eboli, L.; Mazzulla, G. Service quality attributes affecting customer satisfaction for bus transit. J. Public Transp. 2007, 10, 21–34. [Google Scholar] [CrossRef]
- Duleba, S.; Moslem, S. Sustainable urban transport development with stakeholder participation, an AHP-kendall model: A case study for mersin. Sustainability 2018, 10, 3647. [Google Scholar] [CrossRef]
- Garrido, C.; De Oña, R.; De Oña, J. Neural networks for analyzing service quality in public transportation. Expert Syst. Appl. 2014, 41, 6830–6838. [Google Scholar] [CrossRef]
- Politis, I.; Papaioannou, P.; Basbas, S.; Dimitriadis, N. Evaluation of a bus passenger information system from the users’ point of view in the city of Thessaloniki, Greece. Res. Transp. Econ. 2010, 29, 249–255. [Google Scholar] [CrossRef]
- Hassan, M.N.; Hawas, Y.E.; Ahmed, K. A multi-dimensional framework for evaluating the transit service performance. Transp. Res. Part A Policy Pract. 2013, 50, 47–61. [Google Scholar] [CrossRef]
- Diab, E.I.; El-Geneidy, A.M. Understanding the impacts of a combination of service improvement strategies on bus running time and passenger’s perception. Transp. Res. Part A Policy Pract. 2012, 46, 614–625. [Google Scholar] [CrossRef]
- Nosal, K.; Solecka, K. Application of AHP method for multi-criteria evaluation of variants of the integration of urban public transport. Transp. Res. Procedia 2014, 3, 269–278. [Google Scholar] [CrossRef]
- De Ona, J.; de Oña, R.; Eboli, L.; Mazzulla, G. Heterogeneity in perceptions of service quality among groups of railway passengers. Int. J. Sustain. Transp. 2015, 9, 612–626. [Google Scholar] [CrossRef]
- Chica-Olmo, J.; Gachs-Sánchez, H.; Lizarraga, C. Route effect on the perception of public transport services quality. Transp. Policy 2018, 67, 40–48. [Google Scholar] [CrossRef] [Green Version]
- Saaty, T.L. The Analytic Hierarchy Process; McGraw-Hill: New York, NY, USA, 1980. [Google Scholar]
- Saaty, T.L. Transport planning with multiple criteria: The analytic hierarchy process applications and progress review. J. Adv. Transp. 1995, 29, 81–126. [Google Scholar] [CrossRef]
- Duleba, S.; Moslem, S. Examining Pareto optimality in analytic hierarchy process on real Data: An application in public transport service development. Expert Syst. Appl. 2019, 116, 21–30. [Google Scholar] [CrossRef]
- Ghorbanzadeh, O.; Moslem, S.; Blaschke, T.; Duleba, S. Sustainable urban transport planning considering different stakeholder groups by an interval-ahp decision support model. Sustainability 2019, 11, 9. [Google Scholar] [CrossRef]
- Moslem, S.; Duleba, S. Application of AHP for evaluating passenger demand for public transport improvements in Mersin, Turkey. Pollack Periodica 2018, 13, 67–76. [Google Scholar] [CrossRef]
- Chowdhury, S.; Hadas, Y.; Gonzalez, V.A.; Schot, B. Public transport users’ and policy makers’ perceptions of integrated public transport systems. Transp. Policy 2018, 61, 75–83. [Google Scholar] [CrossRef]
- Seiti, H.; Tagipour, R.; Hafezalkotob, A.; Asgari, F. Maintenance strategy selection with risky evaluations using RAHP. J. Multi Criteria Decis. Anal. 2017, 24, 257–274. [Google Scholar] [CrossRef]
- Erdogan, S.A.; Šaparauskas, J.; Turskis, Z. Decision making in construction management: AHP and expert choice approach. Procedia Eng. 2017, 172, 270–276. [Google Scholar] [CrossRef]
- Gupta, V. Comparative performance of contradictory and non-contradictory judgement matrices in AHP under qualitative and quantitative metrics. Int. J. Decis. Support Syst. Technol. 2018, 10, 21–38. [Google Scholar] [CrossRef]
- Murat, Y.S.; Arslan, T.; Cakici, Z.; Akçam, C. Analytical hierarchy process (AHP) based decision support system for urban intersections in transportation planning. In Using Decision Support Systems for Transportation Planning Efficiency; IGI Global: Harrisburg, PA, USA, 2016; pp. 203–222. [Google Scholar]
- Triantaphyllou, E.; Mann, S.H. Using the analytic hierarchy process for decision making in engineering applications: Some challenges. Int. J. Ind. Eng. Appl. Pract. 1995, 2, 35–44. [Google Scholar]
- Toth, W.; Vacik, H. A comprehensive uncertainty analysis of the analytic hierarchy process methodology applied in the context of environmental decision making. J. Multi Criteria Decis. Anal. 2018, 25, 142–161. [Google Scholar] [CrossRef]
- Chen, Y.; Wang, S.; Yao, J.; Li, Y.; Yang, S. Socially responsible supplier selection and sustainable supply chain development: A combined approach of total interpretive structural modeling and fuzzy analytic network process. Bus. Strateg. Environ. 2018, 27, 1708–1719. [Google Scholar] [CrossRef]
- Grošelj, P.; Zadnik Stirn, L. Evaluation of several approaches for deriving weights in fuzzy group analytic hierarchy process. J. Decis. Syst. 2018, 27, 217–226. [Google Scholar] [CrossRef]
- Park, K.S.; Seo, Y.J.; Kim, A.; Ha, M.H. Ship acquisition of shipping companies by sale & purchase activities for sustainable growth: Exploratory fuzzy-AHP application. Sustainability 2018, 10, 1763. [Google Scholar]
- Moslem, S.; Ghorbanzadeh, O.; Blaschke, T.; Duleba, S. Analysing stakeholder consensus for a sustainable transport development decision by fuzzy AHP and interval AHP. Sustainability 2019. under review. [Google Scholar]
- Fan, G.; Zhong, D.; Yan, F.; Yue, P. A hybrid fuzzy evaluation method for curtain grouting efficiency assessment based on an AHP method extended by D numbers. Expert Syst. Appl. 2016, 44, 289–303. [Google Scholar] [CrossRef]
- Abdullah, L.K.; Zulkifli, N. Integration of fuzzy AHP and interval type-2 fuzzy DEMATEL: An application to human resource management. Expert Syst. Appl. 2015, 42, 4397–4409. [Google Scholar] [CrossRef]
- Sun, C.C. A performance evaluation model by integrating fuzzy AHP and fuzzy TOPSIS methods. Expert Syst. Appl. 2010, 37, 7745–7754. [Google Scholar] [CrossRef]
- Hsieh, T.Y.; Lu, S.T.; Tzeng, G.H. Fuzzy MCDM approach for planning and design tenders selection in public office buildings. Int. J. Proj. Manag. 2004, 22, 573–584. [Google Scholar] [CrossRef]
- Gumus, A.T. Evaluation of hazardous waste transportation firms by using a two step fuzzy-AHP and TOPSIS methodology. Expert Sys. Appl. 2009, 36, 4067–4074. [Google Scholar] [CrossRef]
- Solomon, M. Groupthink versus “The wisdom of the crowds”: The social epistemology deliberation and dissent. South. J. Philos. 2006, 44, 28–42. [Google Scholar] [CrossRef]
- Hermosilla, T.; Palomar-Vázquez, J.; Balaguer-Beser, Á.; Balsa-Barreiro, J.; Ruiz, L.A. Using street based metrics to characterize urban typologies. Comp. Environ. Urban Syst. 2014, 44, 68–79. [Google Scholar] [CrossRef] [Green Version]
Figure 1.
The membership functions of the triangular fuzzy numbers.

Figure 2.
The hierarchical model for the urban bus transport system.

Figure 3.
The fuzzy weights for public transport supply quality criteria.


Table 1.
Membership function of the linguistic scale.
| FNs | Linguistic | FN Scale |
|---|---|---|
| 9 | Perfect | (8, 9, 10) |
| 8 | Absolute | (7, 8, 9) |
| 7 | Very good | (6, 7, 8) |
| 6 | Fairly good | (5, 6, 7) |
| 5 | Good | (4, 5, 6) |
| 4 | Preferable | (3, 4, 5) |
| 3 | Not bad | (2, 3, 4) |
| 2 | Weak advantage | (1, 2, 3) |
| 1 | Equal | (1, 1, 1) |
Table 2.
Final fuzzy scores of the criteria for Level 1.
| Ranking | Criteria | Final Scores |
|---|---|---|
| 1 | Tractability | 0.622683813 |
| 2 | Transport Quality | 0.310841555 |
| 3 | Service Quality | 0.154592458 |
Table 3.
Final fuzzy scores of the criteria for Level 2 considering branch connections.
| Ranking | Criteria | Final Scores |
|---|---|---|
| 1 | Perspicuity | 0.285183 |
| 2 | Information during travel | 0.21532 |
| 3 | Information before travel | 0.199031 |
| 4 | Mental comfort | 0.156948 |
| 5 | Physical comfort | 0.135213 |
| 6 | Speed | 0.046945 |
| 7 | Directness | 0.046383 |
| 8 | Time availability | 0.037016 |
| 9 | Safety of travel | 0.028811 |
| 10 | Approachability | 0.023975 |
| 11 | Reliability | 0.011282 |
Table 4.
Final fuzzy scores of the criteria for Level 3 considering branch connections.
| Ranking | Criteria | Final Scores |
|---|---|---|
| 1 | Limited time of use | 0.02869473 |
| 2 | Need of transfer | 0.02696697 |
| 3 | Fit connection | 0.01941585 |
| 4 | Time to reach stops | 0.01831923 |
| 5 | Journey time | 0.01723504 |
| 6 | Awaiting time | 0.01454593 |
| 7 | Comfort in stops | 0.01060837 |
| 8 | Directness to stops | 0.00951496 |
| 9 | Frequency of lines | 0.00835819 |
| 10 | Safety of stops | 0.00669446 |
© 2019 by the authors. Licensee MDPI, Basel, Switzerland. This article is an open access article distributed under the terms and conditions of the Creative Commons Attribution (CC BY) license (http://creativecommons.org/licenses/by/4.0/).
Share and Cite
MDPI and ACS Style
Moslem, S.; Duleba, S. Sustainable Urban Transport Development by Applying a Fuzzy-AHP Model: A Case Study from Mersin, Turkey. Urban Sci. 2019, 3, 55. https://0-doi-org.brum.beds.ac.uk/10.3390/urbansci3020055
AMA Style
Moslem S, Duleba S. Sustainable Urban Transport Development by Applying a Fuzzy-AHP Model: A Case Study from Mersin, Turkey. Urban Science. 2019; 3(2):55. https://0-doi-org.brum.beds.ac.uk/10.3390/urbansci3020055
Chicago/Turabian StyleMoslem, Sarbast, and Szabolcs Duleba. 2019. "Sustainable Urban Transport Development by Applying a Fuzzy-AHP Model: A Case Study from Mersin, Turkey" Urban Science 3, no. 2: 55. https://0-doi-org.brum.beds.ac.uk/10.3390/urbansci3020055