Cities Exacerbate Climate Warming

1
Biospheric Sciences Laboratory, NASA Goddard Space Flight Center (NASA GSFC), Greenbelt, MD 20771, USA
2
Science Systems and Applications, Inc., Lanham, MD 20706, USA
*
Author to whom correspondence should be addressed.
Urban Sci. 2021, 5(1), 27; https://0-doi-org.brum.beds.ac.uk/10.3390/urbansci5010027
Submission received: 25 January 2021
/
Revised: 17 February 2021
/
Accepted: 23 February 2021
/
Published: 5 March 2021
Abstract
:Urbanization is a complex land transformation not explicitly resolved within large-scale climate models. Long-term timeseries of high-resolution satellite data are essential to characterize urbanization within land surface models and to assess its contribution to surface temperature changes. The potential for additional surface warming from urbanization-induced land use change is investigated and decoupled from that due to change in climate over the continental US using a decadal timescale. We show that, aggregated over the US, the summer mean urban-induced surface temperature increased by 0.15 °C, with a warming of 0.24 °C in cities built in vegetated areas and a cooling of 0.25 °C in cities built in non-vegetated arid areas. This temperature change is comparable in magnitude to the 0.13 °C/decade global warming trend observed over the last 50 years caused by increased CO2. We also show that the effect of urban-induced change on surface temperature is felt above and beyond that of the CO2 effect. Our results suggest that climate mitigation policies must consider urbanization feedback to put a limit on the worldwide mean temperature increase.
Keywords:
urbanization; surface temperature; land cover; NDVI; global warming; Landsat 8; MODIS; NLCD; NLDAS1. Introduction
The world population has grown large relative to the size of Earth, and our need for urban land conversion continues to increase. As a form of land use, urbanization occupies a relatively small area; however, its ecological impact is significant, permanent, and spatially uneven [1]. As urbanization expands, there is growing need to understand its implications for a broad set of environmental issues including food security, carbon uptake [2,3,4], biodiversity [5], and most importantly, urban surface climate which affects the largest proportion of humans [1,6,7,8]. Because urbanization has a small spatial footprint and changes slowly in time, it has been difficult to resolve its metabolism within large-scale atmospheric models and assess its contribution to changes in surface climate. Here we investigate the potential for additional surface warming over the continents from urbanization-induced land cover and land use change. This work models the decoupling of historical changes in surface (skin) temperature due to urbanization-induced land use change from those due to change in climate over the continental US (CONUS). The study uses decadal timescale satellite observations and assimilated data between 2001 and 2011. The results show a clear, spatially explicit continental impact of urban expansion on surface temperature.
The reasons such a study has not been attempted in the past is the complicated nature of the thermal feedbacks in an urban environment were not modeled previously and there was not a readily usable, high-quality, spatiotemporal surface temperature data set covering a long enough period. We show that data aggregated for the summer months (June–July–August), for CONUS urban centers built within vegetated areas showed warming by 0.24 °C with a maximum warming of 0.83 °C. Similar urban centers located in non-vegetated arid areas cooled by 0.25 °C with a maximum cooling of 0.66 °C. The urban-induced decadal warming within vegetated areas is comparable in magnitude to the 0.13 °C/decade linear global warming trend seen over the last 50 years caused by increased CO2 [9,10]. We show that the effect of urban-induced change on surface temperature is likewise linear and additive to that of the CO2 effect. The impacts of changes in climate are not spread evenly around our planet and are unlikely to be in the future. Temperatures increase at different rates, with warming higher over lands than oceans and exacerbated in urban areas more than rural areas. This study indicates that urban areas are warmer than their surroundings’ ambient temperature and suggests that climate mitigation policies must consider urbanization feedback.
Past work demonstrates that the impact of urbanization is that it (1) reduces vegetated surfaces and their carbon sequestration capacity [1,11], (2) alters the water cycle through reduction of plant’s evaporation and partitioning of surface water, (3) modifies surface roughness [12,13,14], and (4) modifies the surface energy partitioning through albedo change [1,15,16,17], all of which affect surface climate. Except for few large urban centers, global urbanization is often patchy and embedded within vegetated landscapes. Understanding feedbacks in such a complex environment requires studies at spatial and temporal scales capable of characterizing the urban build-up and its vegetated surrounding. Several studies have assessed the effect of urbanization on surface temperature and thoroughly described the urban heat island (UHI) phenomenon. The UHI was studied using both air temperature and surface temperature, observed and inferred from reanalysis. It was shown that the air temperature UHI is stronger during the night than during the day (Oke 1973 [18]; Souch and Grimmond 2006 [19] compared to the surface temperature defined UHI (SUHI), which is more intense during the daytime (Imhoff et al. 2010 [20]; Zhang et al. 2012 [21]; Zhao et al. 2014 [12]; Bounoua et al., 2015 [22]). Kalnay and Cai (2003) [23] estimated the impact of urbanization and other land-use changes on climate by comparing trends in surface temperature recorded by several meteorological stations with those assimilated by the National Center for Environmental Prediction and National Centre for Atmospheric Research -NCEP/NCAR reanalysis (Kistler et al., 2001 [24]). They estimated a mean surface temperature warming rate per century twice as high as that previously determined (Hansen et al., 2001 [25]; Gallo et al., 1999 [26]). This method assumes that the quality of the reanalysis surface air temperature is adequate (Zhou et al., 2004 [27]). Zhou et al. (2004) attempted a method, similar to that of Kalnay and Cai (2003) [23], to investigate the impact of urbanization and other land-use changes on climate in China and showed a significant urbanization effect. They estimate a mean surface temperature warming of 0.05 °C per decade in southeast China. On the other hand, Fu and Weng (2016) [28] used Landsat derived land surface temperature (LST) timeseries over the Atlanta metropolitan region to examine the impact of urbanization on the urban thermal environment. They indicated that high density urban land had the greatest LST, and a comparison of the trend component between urban and non-urban land covers showed a difference of 1.8 °C. The relationship between LST and spatial clustering of urban land was also examined by Wang et al. (2019) [29] for several cities in different climate zones in the United States. Their results indicated that in most climate regions, urban areas elevated LST for both daytime and nighttime. The cooling effect of clustered vegetation cover was only found in dry and warm summer regions. The work here combines data from the Landsat 8 Operational Land Imager (OLI) and the Moderate Resolution Imaging Spectroradiometer (MODIS) aboard the Terra platform to provide spatially fine and temporally continuous characterization of impervious surface area (ISA) and surrounding vegetation in urban centers. We use Landsat-based ISA from the National Land Cover Dataset (NLCD) [30] and MODIS-derived phenological products [22] within a biophysical land surface model (LSM) to untangle the impact of urbanization-induced land use change on surface temperature from that resulting from natural and GHG-induced change in climate.
2. Materials and Methods
We characterize the ISA at 30 m and the MODIS biophysical products at 500 m at an 8-day interval within a climate modeling grid (CMG) of 0.05° × 0.05° spatial resolution (~5 km × 5 km) and simulate the impact of change in land cover on the CONUS surface temperature between 2001 and 2011. MODIS land cover (LC) classes were aggregated from 500 m × 500 m to 5 km × 5 km and fractions were obtained in the CMG. Similarly, the co-registered NLCD Landsat-based ISA were aggregated to the CMG. This was accomplished by: (1) converting percent ISA to area (m2) for each 30 m (900 m2) pixel. For example, if a single 30 m pixel included 75% ISA, the impervious area of that pixel is 675 m2; (2) summing the impervious areas of all 30 m pixels located within each corresponding 0.05° grid cell; and (3) calculating the ISA fraction for each newly created 0.05° CMG grid cell by dividing the summed impervious area by the total area of the CMG grid cell. These Landsat-based ISA fractions were used to replace the build-up fractions from MODIS. Differences between Landsat ISA and MODIS build-up fractions were proportionally distributed over non-urban LC types co-existing in the CMG using fractions to weight the distribution [22]. A set of biophysical parameters for each LC class was generated at the same 5 km × 5 km spatial resolution using the MODIS 8-day composite normalized difference vegetation index (NDVI) [22,31]. These biophysical parameters along with vegetation physiological, optical, and morphological properties served as boundary conditions to the LSM. The Simple Biosphere (SiB2) model [32], as modified by Bounoua [16], is used in this study. SiB2 is a biophysically based LSM that computes the exchanges of energy, water, carbon, and momentum explicitly accounting for 12 LC classes, including an urban class. In SiB2, the urban fraction is characterized by an average heat capacity of a thin concrete slab modulated by the heat capacity of water and snow when existing on the ground. It is also characterized by rougher surface elements altering the heat convergence and transfer, lower reflectance, and a superficial soil layer completely impermeable to water with a maximum water holding capacity of 2 mm. Water infiltration is not allowed in urban soil, and intercepted water beyond this threshold is expelled as surface runoff.
The model was spun-up for 3 years forced by the North American Land Data Assimilation System NLDAS-2 meteorological data interpolated to half-hourly and to 0.05° × 0.05° spatial resolution [1]. The 1998–2000 forcing was used to spin-up the 2001 simulation and the 2008–2010 to spin-up the 2011. NLDAS-2 forcing from 2001 and 2011 was then used in the 2001 and 2011 simulations, respectively. We conducted four forward offline simulations in a stand-alone mode in which atmospheric forcing is fed to the LSM with no possible feedback and analyzed the surface temperature so to minimize the horizontal advection of heat and therefore highlight the land cover effects. The first simulation (referred to as 2001) uses the LC and meteorological drivers from 2001 and represents the control case for comparison. The second simulation (2011_LC) uses the 2011 LC and the 2001 meteorological drivers and, compared to 2001, is designed to isolate the exclusive impact of LC change on surface climate. The third simulation (2011_CL) uses the 2001 LC and the 2011 meteorological forcing to isolate the impact of change in climate on surface temperature; and the fourth simulation (2011) uses LC and meteorological drivers from 2011 and represents the total change due to both climate and land cover changes. In these simulations there was no model feedback to the climate drivers, and model outputs are directly attributable to changes in land cover characterization.
3. Results & Discussion
The effect on surface temperature caused by changes in urbanization results from the dependence of the partitioning of surface energy fluxes on the characteristics of the urban materials such as asphalt and concrete which have higher heat capacity and lower reflectivity than surrounding material, resulting in more solar energy absorption and storage. At the diurnal time scale, across all urban centers built within vegetated areas of the CONUS, change in LC alone (2011_LC) caused the surface temperature (hereafter referred to as temperature, for simplicity) to increase slightly more during nighttime than daytime. One of the urban areas studied is the city of Manchester, New Hampshire that is approximately 100 km northwest of Boston. Manchester, representative of northern cities built within vegetated lands, saw an urbanization increase of 4.1% during the decade. The summer nighttime-mean temperature increased 0.60 °C and the daytime-mean increased 0.54 °C. El Paso, Texas, on the other hand, is representative of southern arid regions where increases in urban area are at the expense of desert-type bare lands. El Paso had a 5.2% increase in urban area and experienced a daytime cooling of 0.31 °C with no significant change at night. The diurnal heating asymmetry in vegetated regions is due to vegetation physiological activity which cools temperature by transpiration during daytime and the daytime cooling in arid regions is due to transpiration from irrigated lawns and exotic vegetation introduced with urbanization. In Manchester, the climate simulation (2011_CL) resulted in daytime and nighttime warming, whereas in El Paso, it resulted in a nighttime cooling offset by daytime warming for an overall daily mean temperature change of 0.04 °C (Table 1).
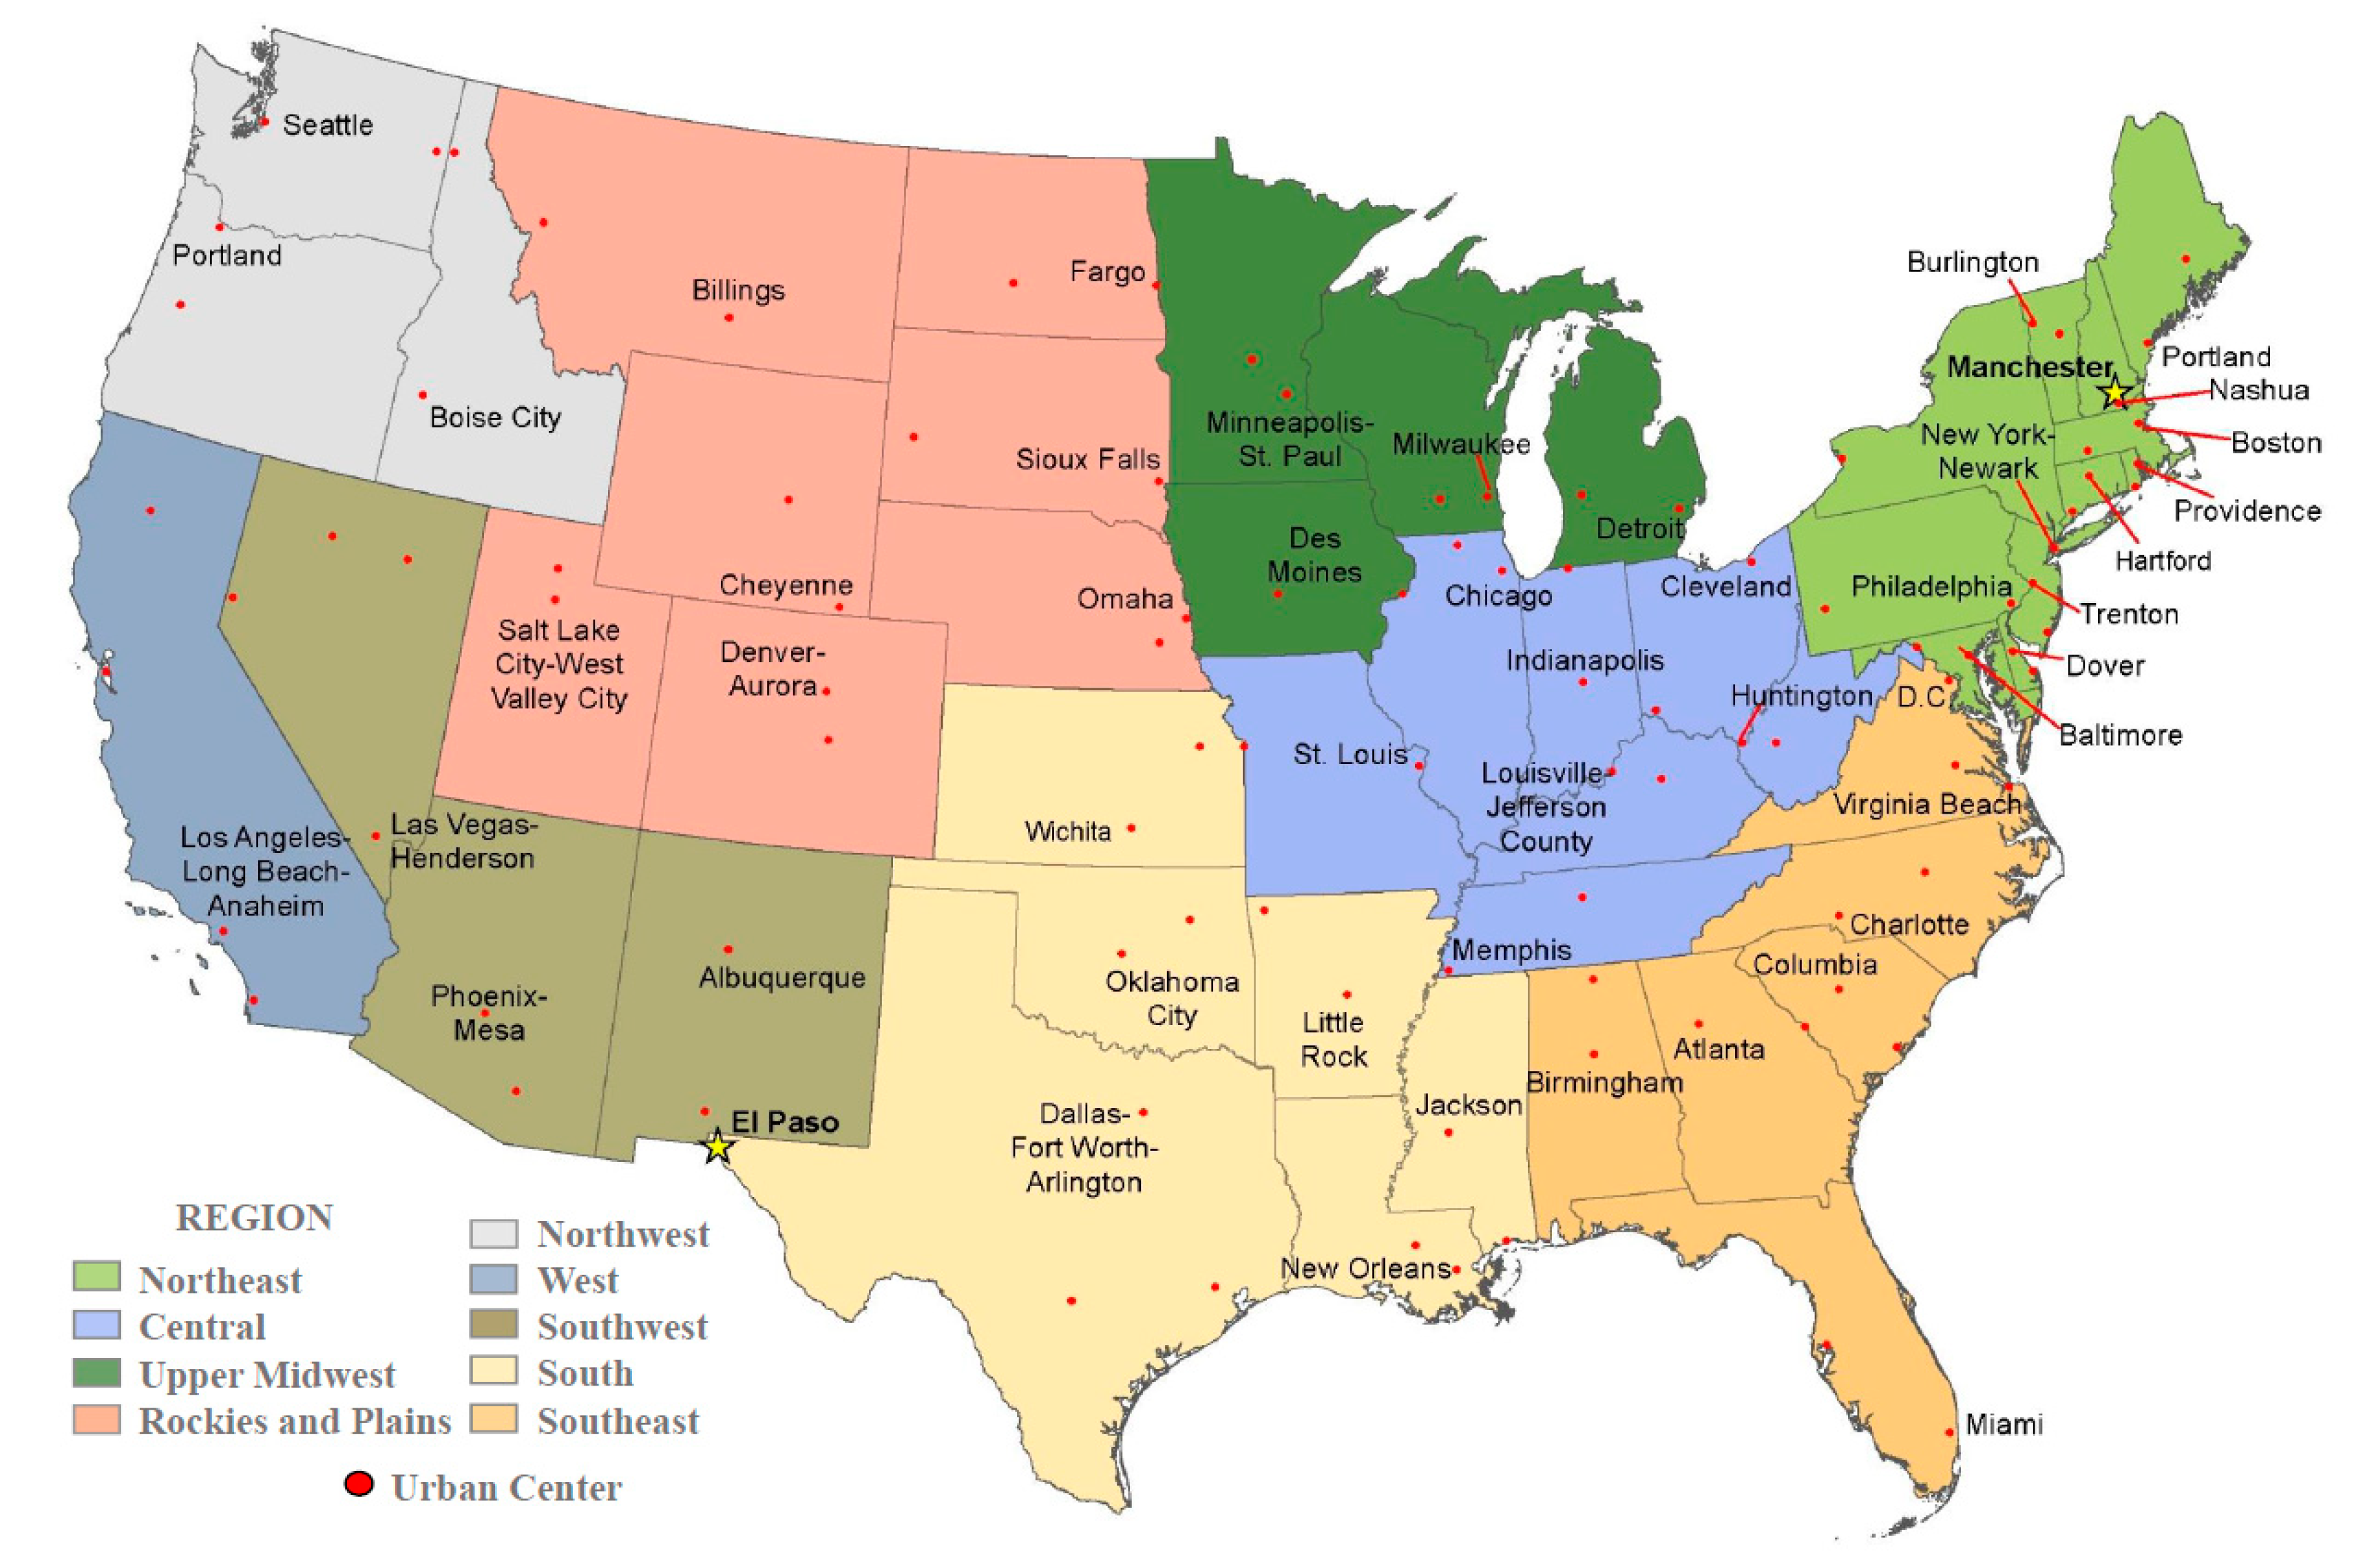
We compute the monthly mean temperature change for the three simulations between 2001 and 2011 over 103 urban centers selected from nine climatically different regions defined by the National Oceanic and Atmospheric Administration (NOAA) [33]. The selected urban centers represent the top two per state having the highest percent ISA in 2001, with additional urban centers selected in larger states (e.g., California, Texas) to ensure a better spatial representation over the CONUS (Appendix A Figure A1). Urban centers are delineated based on corresponding CMGs within ArcGIS using the administrative boundaries from the ESRI/U.S. Census Bureau 1:500k Urban Areas shapefile [34] and are defined as conurbations resulting from the coalescence of several cities or towns but usually retain their separate identities. For example, Baltimore and surrounding towns represent one urban center.
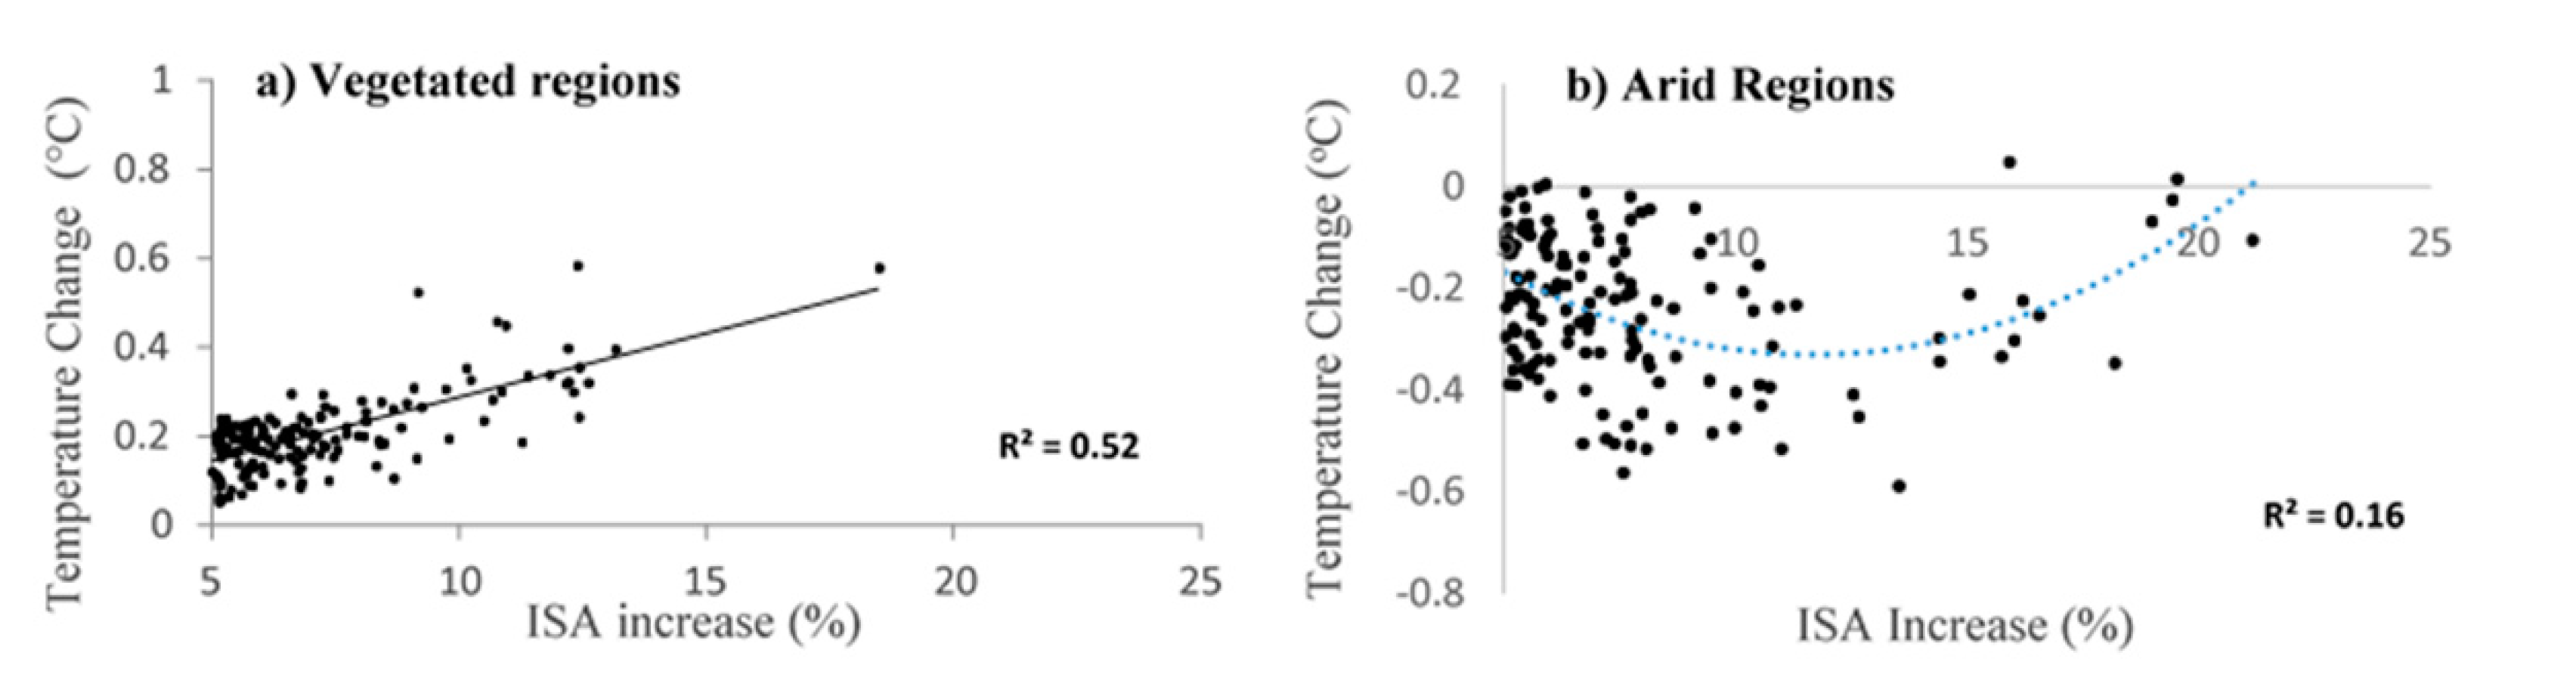
For all regions except the arid south and southwest, the 2011_LC simulation show urban centers’ summer surface temperatures increased from 0.14 °C in the West to 0.24 °C in the Northeast and Upper Midwest with an overall average increase of 0.20 °C +/− 0.04° (Table 2). The western regions (West and Northwest) experienced a slightly smaller warming compared to the central, northern, and eastern regions in which the average temperature increased more than 0.2 °C for the 2001–2011 decade. The urban expansion in southern arid regions, however, resulted in a mean cooling with 0.26 °C in the South and 0.10 °C in the Southwest with an overall average cooling for these arid regions of 0.18 °C +/− 0.11°. The relatively high standard deviation in the arid regions is indicative of a large variance and nonlinear temperature response to increases in ISA. This is well illustrated in Figure 1, which shows that in vegetated regions the decadal increase in surface temperature is quasi-linearly correlated to increase in ISA (Figure 1a). In the non-vegetated southern arid regions, however, contrary to what was previously thought, that introduction of irrigated exotic plants and lawns with urbanization monotonically reduces temperature [1,20], this study reveals that in these regions, urban temperature is nonlinearly related to increase in ISA. Indeed, the temperature decreases as ISA increases until an ISA threshold of about 15% is reached. After that, the temperature trend is reversed and the cooling is gradually reduced, eventually turn into warming. The reversal in temperature trend is triggered when the warming, due to increase in ISA, overwhelms the vegetation’s cooling effect. This is observed to occur in large urban centers where the peripheries are occupied by business districts with large industrial complexes and fewer green spaces (Figure 1b). Our results suggest that the amount and choice of tree species in urban centers play a commanding role in shaping the urban surface temperature.
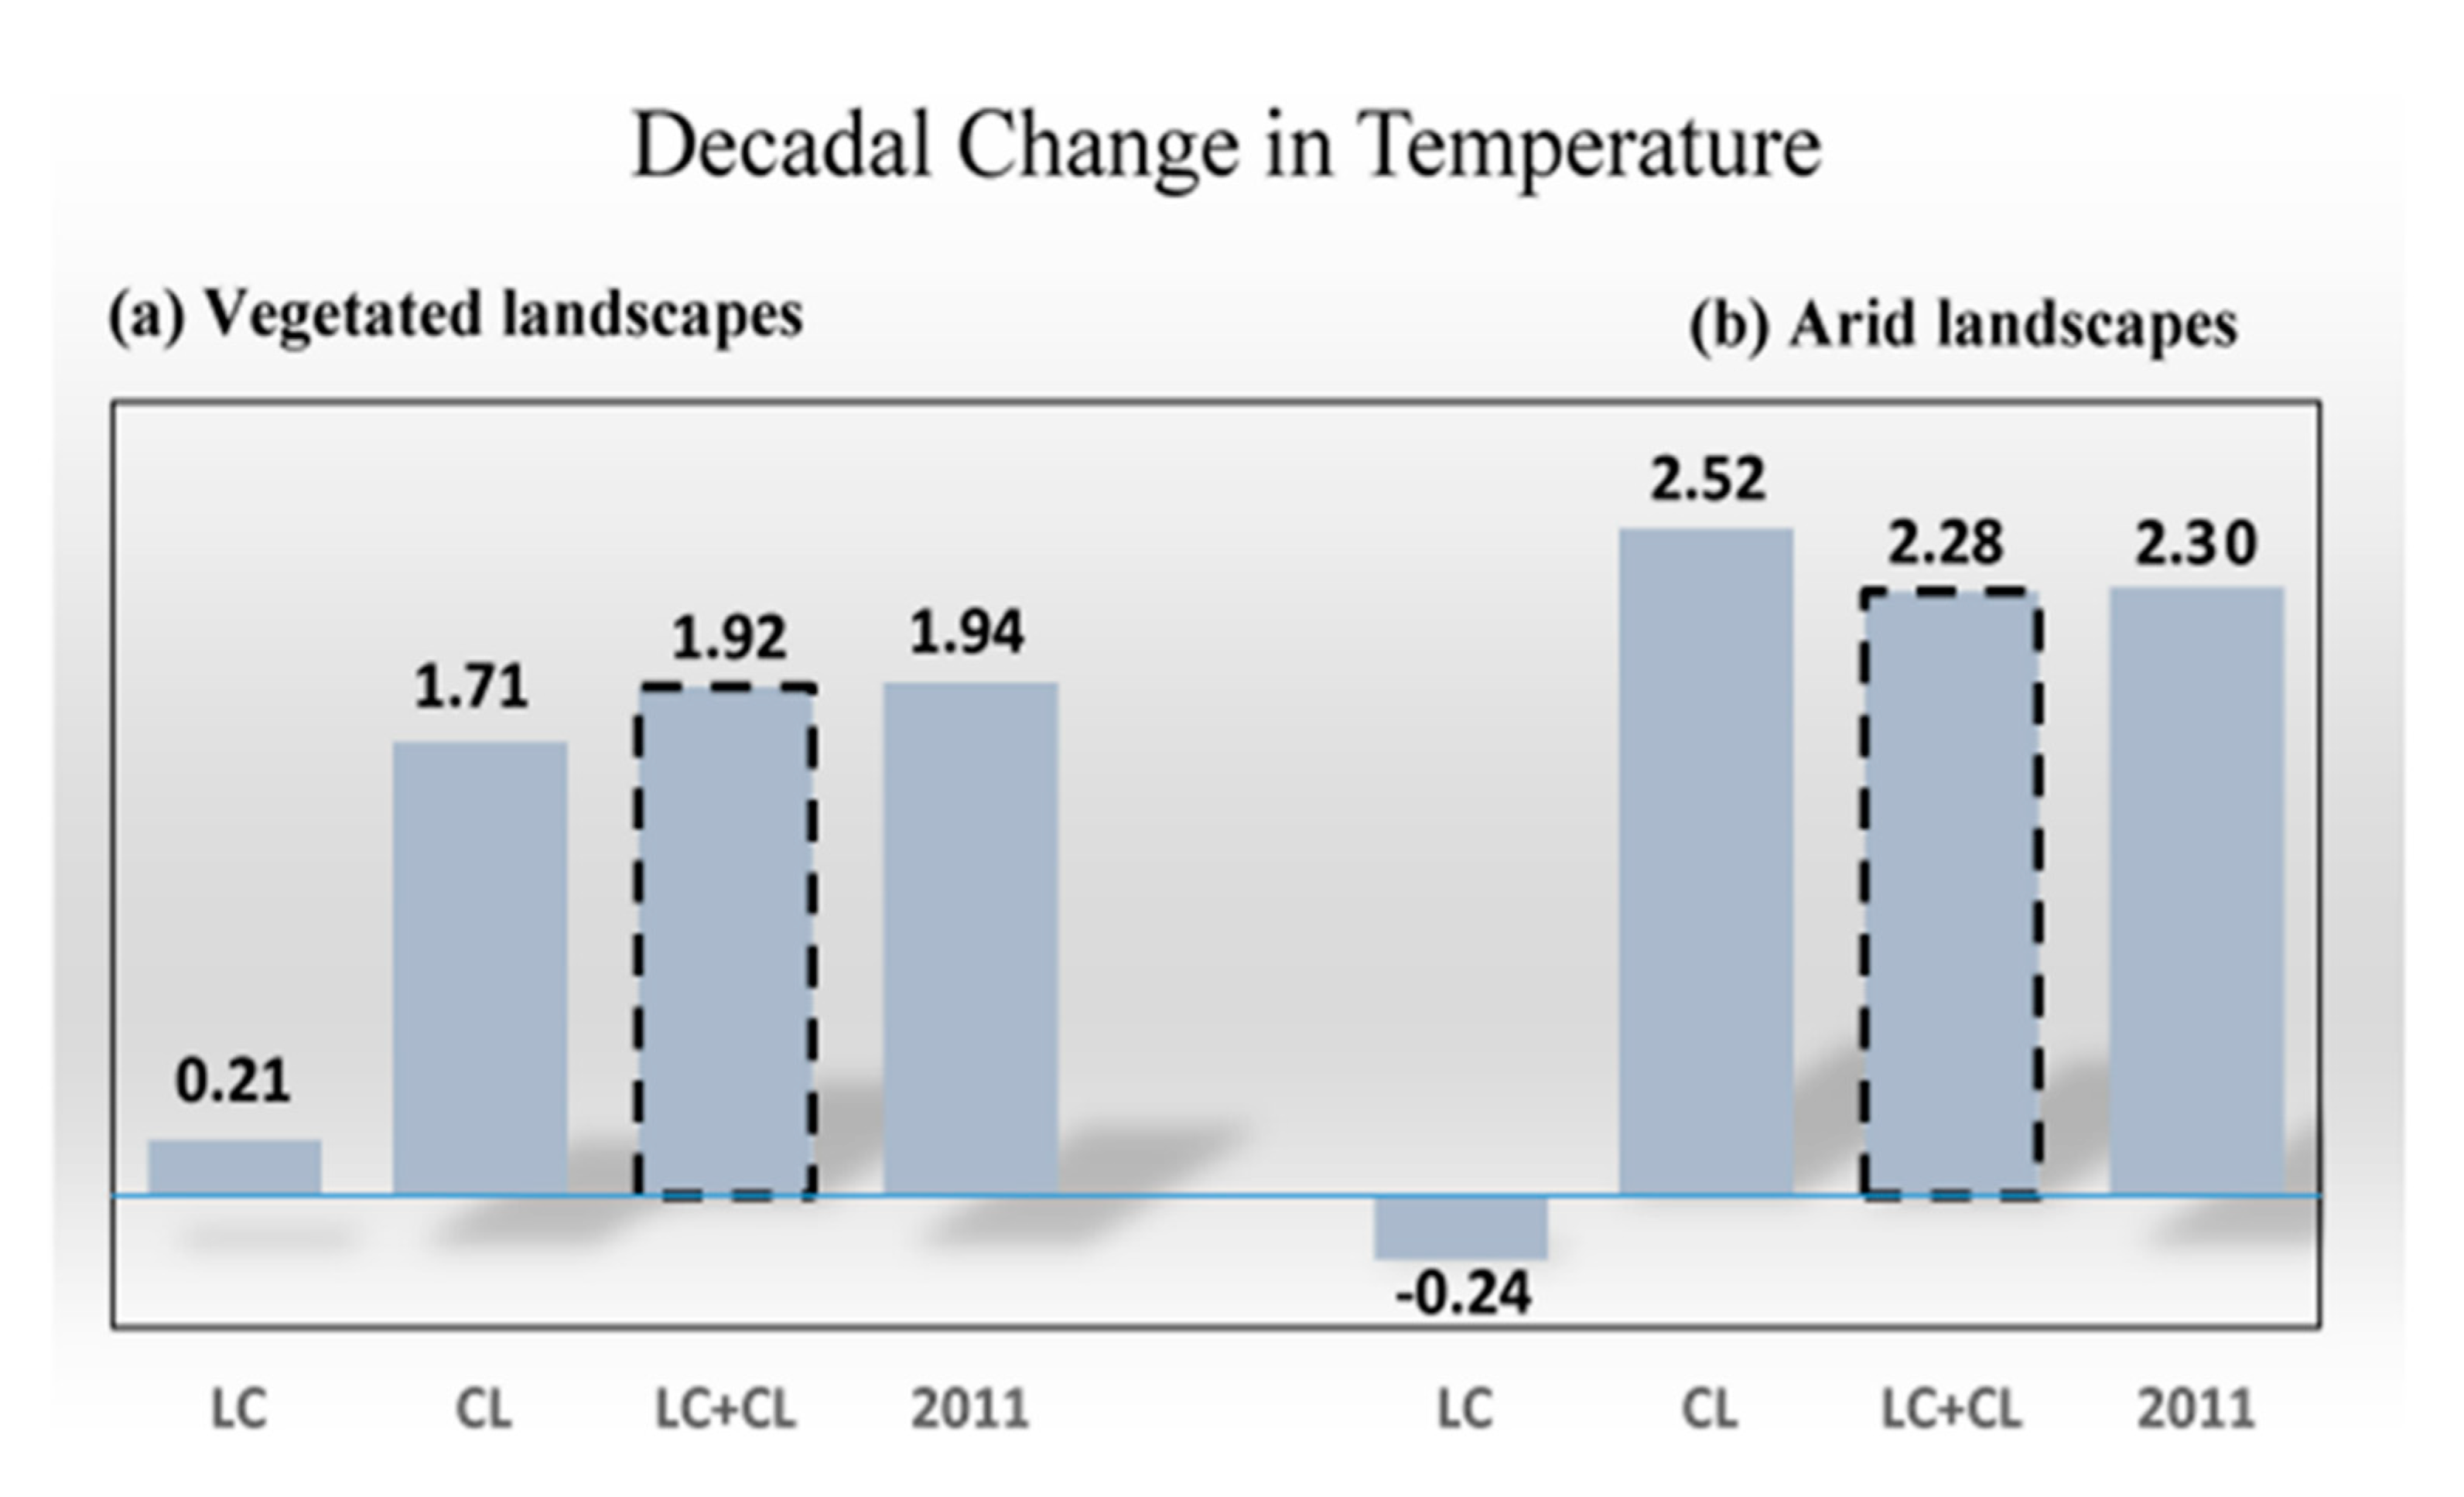
The climate-only run (2011_CL) simulates the 2011 surface temperature change if the LC remained invariant from 2001 and helps to untangle changes in surface temperature due exclusively to change in climate from those due to LC. In the western part of the CONUS (Southwest, West and Northwest), the climate-only simulation resulted in a decadal cooling of up to 1.65 °C in the West, while a warming, ranging from 0.86 °C in the Upper Midwest to 3.95 °C in the South, was simulated for the other regions (Table 2). An interesting pattern emerges when the climate-only (2011_CL) changes in temperature are compared to those resulting from the land cover only (2011_LC) simulation. Figure 2 compares the decadal temperature change resulting from the three simulations over vegetated and non-vegetated arid regions of the CONUS; the total temperature change simulated as a response to combined effects of LC and CL is represented by 2011. We have also constructed the analog to 2011 by adding the separate effects of LC and CL and have plotted it as (LC+CL) in dashed line in Figure 2. The close similarity between (LC+CL) and 2011 simulations indicates that the interactions between land cover (LC) and climate (CL) can be treated independently and are linearly additive, suggesting that changes in temperature due to LC processes are local and will add up to those resulting from climate. For the 2001–2011 decade we find that during summer in vegetated regions (Figure 2a), the urban-induced warming was felt above and beyond the warming due to climate alone, whereas in the arid regions (Figure 2b), the LC cooling was masked by the warming of the climate. During winter, when vegetation is not active, land cover change resulted in weaker warming (0.1 °C) in both vegetated and arid regions. This is an interesting result suggesting that in vegetation dominated regions, urbanization will increase temperature and may exacerbate the projected warming from anthropogenic emissions of CO2 whereas in arid regions it may counteract it if the impervious surface is less than about 15% of the urban center area. Previous work [1] demonstrated the specific influence of vegetation biophysical impact on the magnitude of the surface temperature difference between the buildup and its immediate surroundings. In this analysis, we describe the surface temperature response to urban-induced LC change in climatically distinct regions. Results from both studies point to the need for understanding what cities can offer in terms of mitigation to climate warming and to the relevance in identification of typology-dependent mitigation strategies.
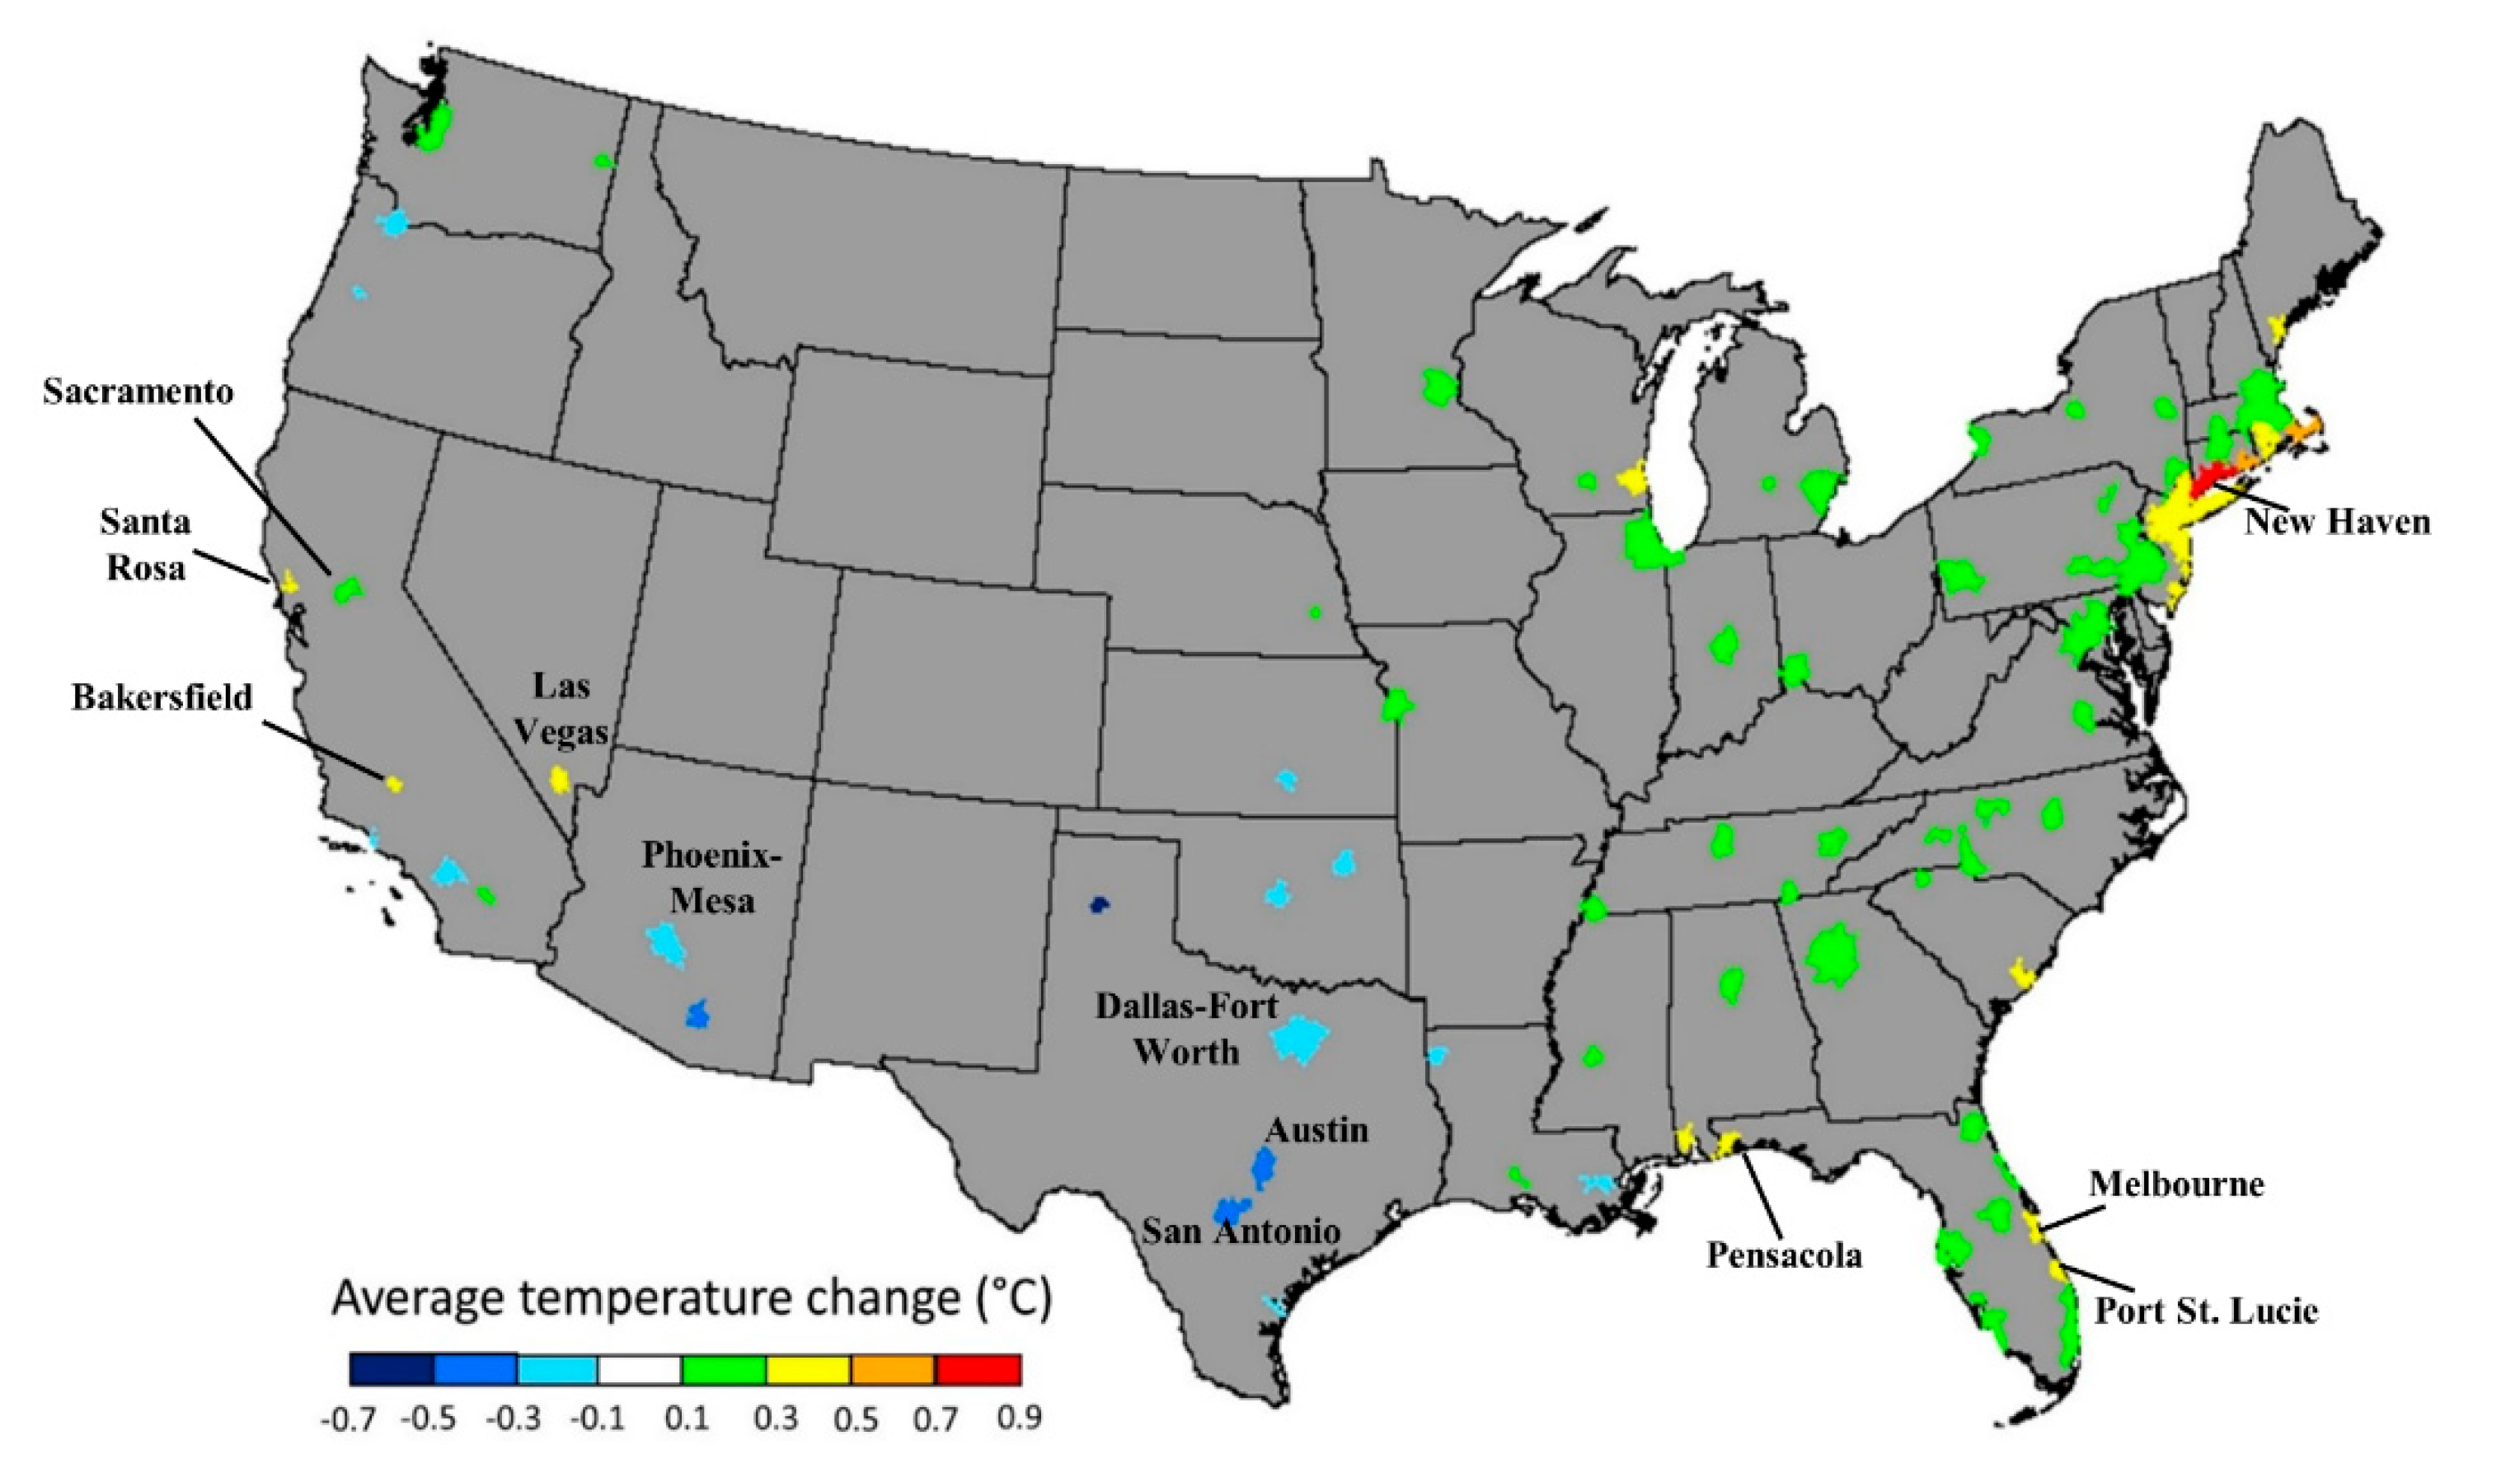
At continental scale, the urban-induced change in temperature presented large variance due to urban center’s size, percent ISA fraction and elevation, with several CMGs having differences less than 0.1 °C in magnitude. To simplify the representation of the surface temperature change, we computed temperature differences using only CMGs with ISA greater than 5% in urban centers larger than 5000 ha with a mean elevation less than 1000 m. The impact of urban-induced land cover change on temperature ranged from −0.66 °C to 0.83 °C depending on the prevailing surrounding landscape, urban center’s size, and percent ISA (Figure 3). Urbanization resulted in warming in most urban centers located within vegetated regions, with the largest warming happening in cities with higher ISA fraction, especially northeastern coastal cities from New Jersey to Maine with the highest warming of 0.83 °C occurring in the New Haven, Connecticut urban conglomerate. The temperature also increased more than 0.30 °C in most of the southeastern coastal cities of Florida with 0.33 °C in Port St Lucie, 0.35 °C in Melbourne and 0.37 °C in the Gulf city of Pensacola. In the west coast, the largest warming of 0.33 °C was simulated in Santa Rosa and 0.21 °C in Sacramento, California. Other cities, away from coastal areas such as Bakersfield, California and Las Vegas, Nevada also experienced a warming slightly more than 0.30 °C. In the arid urban centers of the south and southwest, urbanization resulted in cooling, up to 0.49 °C in Austin and 0.43 °C in San Antonio, Texas. The cooling was less in urban centers with larger ISA fractions such as the Dallas-Fort Worth, Texas and the Phoenix-Mesa, Arizona conurbations where it was only 0.26 °C and 0.25 °C, respectively. Aggregated over the CONUS, urbanization resulted in decadal warming of 0.24 °C +/− 0.13° in urban centers built within vegetated regions and cooling of 0.25 °C +/− 0.15° in cities built in arid non-vegetated regions.
4. Concluding Remarks
In this analysis, we did not explicitly consider the impact of population activity or the impact of increased atmospheric CO2 concentration on temperature. Both of these anthropogenic effects are expected to increase surface temperature in urban areas beyond that resulting from land use alone. The observed global average temperature has increased by 0.6–0.7 °C over the past century [35], and the IPCC Fourth Assessment Report [9] indicates that the linear warming trend for the last 50 years (0.13 °C/decade) is twice that for the last 100 years. In this study we used a fusion of satellite data as input into the Simple Biosphere model and dynamically simulated the effect of urbanization on surface climate. We separated the impact of urbanization from that of climate with a focus on surface temperature. Our results indicate that in large urban centers of the CONUS, decadal increase in surface temperature due to urban-induced land cover change alone is of the same order of magnitude as the linear temperature trend recorded over the last 50 years. Averaged over US cities, we find the mean urban-induced surface temperature warming over the decade to be 0.15 °C, with variations of about 0.1 °C in urban areas built in vegetated and non-vegetated settings. This result is in line with previous studies and confirms that adaptation to and mitigation of urban-induced change in surface climate are geographically dependent and require specific strategies (Georgescu et al., 2014) [36]. We also show that there is more warming in cities because of both urban-induced and climate warming, suggesting that the effect of urbanization is linearly additive to that of climate and that cities may exacerbate the warming of climate.
Populations’ activities impact on surface temperature are likely to be important but are difficult to predict. The potential additional increase in temperature resulting from these and other activities will only add to the warming in urban centers and increase the risk of diseases associated with urban life.
Author Contributions
L.B. and K.T. designed the study and the scenarios. L.B. staged the modeling and performed the simulations. L.B. and K.T. performed the main analysis with contributions from J.N. J.N. provided the land cover data and carried out the spatial analysis. L.B. led the writing of the paper with help from K.T. J.N. helped edit and format the paper, the figures, and the tables. All authors have read and agreed to the published version of the manuscript.
Funding
This research received no external funding.
Institutional Review Board Statement
Not applicable.
Informed Consent Statement
Not applicable.
Data Availability Statement
Data presented in this paper are available upon request.
Conflicts of Interest
The authors declare no conflict of interest.
Appendix A
Figure A1.
Climatic regions and selected urban centers.

References
- Bounoua, L.; Zhang, P.; Mostovoy, G.; Thome, K.; Masek, J.; Imhoff, M.; Shepherd, M.; Quattrochi, D.; Santanello, J.; Silva, J.; et al. Impact of urbanization on US surface climate. Environ. Res. Lett. 2015, 10, 08401. [Google Scholar] [CrossRef] [Green Version]
- Seto, K.C.; Ramankutty, N. Hidden linkages between urbanization and food systems. Science 2016, 352, 943–945. [Google Scholar] [CrossRef]
- Seto, K.C.; Golden, J.S.; Alberti, M.; Turner, B.L., II. Sustainability in an urbanizing planet. Proc. Natl. Acad. Sci. USA 2017, 114, 8935–8938. [Google Scholar] [CrossRef] [PubMed] [Green Version]
- Imhoff, M.; Bounoua, L.; Ricketts, T.; Loucks, C.; Harriss, R.; Lawrence, W.T. Global patterns in human consumption of net primary production. Nature 2004, 429, 870–873. [Google Scholar] [CrossRef] [Green Version]
- Ricketts, T.H. Disaggregating the evidence linking biodiversity and ecosystem services. Nat. Commun. 2016, 7, 13106. [Google Scholar] [CrossRef] [PubMed] [Green Version]
- Myint, S.W.; Zheng, B.; Talen, E.; Fan, C.; Kaplan, S.; Middel, A.; Smith, M.; Huang, H.; Brazel, A. Does the spatial arrangement of urban landscape matter? Examples of urban warming and cooling in Phoenix and Las Vegas. Ecosyst. Health Sustain. 2015, 1, 15. [Google Scholar] [CrossRef]
- Nguyen, L.; Henebry, G.M. Urban heat islands as viewed by microwave radiometers and thermal time indices. Remote Sens. 2016, 8, 831. [Google Scholar] [CrossRef] [Green Version]
- Seto, K.C. Global forecasts of urban expansion to 2030 and direct impacts on biodiversity and carbon pools. Proc. Natl. Acad. Sci. USA 2012, 109, 16083–16088. [Google Scholar] [CrossRef] [Green Version]
- IPCC. Climate Change 2007: Synthesis Report. Contribution of Working Groups I, II and III to the Fourth Assessment Report of the Intergovernmental Panel on Climate Change; Intergovernmental Panel on Climate Change: Geneva, Switzerland, 2007. [Google Scholar]
- IPCC. Climate Change 2014: Synthesis Report. Contribution of Working Groups I, II and III to the Fifth Assessment Report of the Intergovernmental Panel on Climate Change; Intergovernmental Panel on Climate Change: Geneva, Switzerland, 2014. [Google Scholar]
- Qureshi, S. The fast growing megacity Karachi as a frontier of environmental challenges: Urbanization and contemporary urbanism issues. J. Geography Reg. Plan. 2010, 3, 306–321. [Google Scholar]
- Zhao, L.; Lee, X.; Smith, R.B.; Oleson, K. Strong contributions of local background climate to urban heat islands. Nature 2014, 511, 216–219. [Google Scholar] [CrossRef]
- Shepherd, J.M. Urbanization and its effects on key atmospheric and surface water cycle. In Essay in Principles of Water Resources, 3rd ed.; Cech, T., Ed.; John Wiley and Sons, Inc.: Hoboken, NJ, USA, 2010; p. 546. [Google Scholar]
- Oke, T.R. The urban energy balance. Prog. Phys. Geogr. 1988, 12, 471–508. [Google Scholar] [CrossRef]
- Akbari, H. Shade trees reduce building energy use and CO2 emissions from power plants. Environ. Pollut. 2002, 116 (Suppl. 1), S119–S126. [Google Scholar] [CrossRef]
- Bounoua, L.; Safia, A.; Masek, J.; Peters-Lidard, C.; Imhoff, M.L. Impact of urban growth on surface climate: A case study in Oran, Algeria. J. Appl. Meteorol. Climatol. 2009, 48, 217–231. [Google Scholar] [CrossRef] [Green Version]
- Seto, K.C.; Shepherd, J.M. Global urban land-use trends and climate impacts. Curr. Opin. Environ. Sustain. 2009, 1, 89–95. [Google Scholar] [CrossRef]
- Oke, T.R. City Size and the Urban Heat Island. Atmos. Environ. 1973, 7, 769–779. [Google Scholar] [CrossRef]
- Souch, C.; Grimmond, S. Applied climatology: Urban climate. Prog. Phys. Geogr. 2006, 30, 270–279. [Google Scholar] [CrossRef]
- Imhoff, M.L.; Zhang, P.; Wolfe, R.E.; Bounoua, L. Remote Sensing of the Urban Heat Island Effect Across Biomes in the Continental USA. Remote Sens. Environ. 2010, 114, 504–513. [Google Scholar] [CrossRef] [Green Version]
- Zhang, P.; Imhoff, M.L.; Bounoua, L.; Wolfe, R.E. Exploring the influence of impervious surface density and shape on urban heat islands in the northeast United States using MODIS and Landsat. Can. J. Remote Sens. 2012, 38, 441–451. [Google Scholar]
- Bounoua, L.; Zhang, P.; Thome, K.; Masek, J.; Safia, A.; Imhoff, M.L.; Wolfe, R.E. Mapping biophysical parameters for land surface modeling over the continental US using MODIS and Landsat. Dataset Pap. Sci. 2015, 564279. [Google Scholar] [CrossRef]
- Kalnay, E.; Cai, M. Impact of urbanization and land-use change on climate. Nature 2003, 423, 528–531. [Google Scholar] [CrossRef]
- Kistler, R.; Kalnay, E.; Collins, W.; Saha, S.; White, G.; Woollen, J.; Chelliah, M.; Ebisuzaki, W.; Kanamitsu, M.; Kousky, V.; et al. The NCEP–NCAR 50-Year Reanalysis: Monthly Means CD-ROM and Documentation. Bull. Am. Meteorol. Soc. 2001, 82, 247–268. [Google Scholar] [CrossRef]
- Hansen, J.E.; Ruedy, R.; Sato, M.; Imhoff, M.; Lawrence, W.; Easterling, D.; Peterson, T.; Karl, T. A closer look at United States and global surface temperature change. J. Geophys. Res. 2001, 106, 23947–23963. [Google Scholar] [CrossRef] [Green Version]
- Gallo, K.P.; Owen, T.W.; Easterling, D.R.; Jamason, P.F. Temperature trends of the US historical climatology network based on satellite-designated land use/land cover. J. Clim. 1999, 12, 1344–1348. [Google Scholar] [CrossRef] [Green Version]
- Zhou, L.; Dickinson, R.E.; Tian, Y.; Fang, J.; Li, Q.; Kaufmann, R.K.; Tucker, C.J.; Myneni, R.B. Evidence for a significant urbanization effect on climate in China. Proc. Natl. Acad. Sci. USA 2004, 101, 9540–9544. [Google Scholar] [CrossRef] [Green Version]
- Fu, P.; Weng, Q. A time series analysis of urbanization induced land use and land cover change and its impact on land surface temperature with Landsat imagery. Remote Sens Environ. 2016, 175, 205–214. [Google Scholar] [CrossRef]
- Wang, C.; Li, Y.; Myint, S.W.; Zhao, Q.; Wentz, E.A. Impacts of Spatial Clustering of Urban Land Cover on Land Surface Temperature across Köppen Climate Zones in the Contiguous United States. Landscape Urban. Plan. 2019, 192, 103668. [Google Scholar] [CrossRef]
- Homer, C.; Huang, C.; Yang, L.; Wylie, B.K.; Coan, M. Development of a 2001 national land-cover database for the United States. Photogramm. Eng. Remote Sens. 2004, 70, 829–840. [Google Scholar] [CrossRef] [Green Version]
- Tan, B.; Morisette, J.T.; Wolfe, R.E.; Gao, F.; Ederer, G.A.; Nightingale, J.; Pedelty, J.A. An enhanced TIMESAT algorithm for estimating vegetation phenology metrics from MODIS data. IEEE J. Sel. Top. Appl. Earth Obs. Remote Sens. 2011, 4, 361–371. [Google Scholar] [CrossRef]
- Sellers, P.J.; Randall, D.A.; Collatz, G.J.; Berry, J.A.; Field, C.B.; Dazlich, D.A.; Zhang, C.; Collelo, G.D.; Bounoua, L. A revised land surface parameterization (SiB2) for atmospheric GCMs: I. Model Formulation. J. Clim. 1996, 9, 676–705. [Google Scholar] [CrossRef]
- National Center for Environmental Information. U.S. Climate Regions 2015. Available online: https://www.ncdc.noaa.gov/monitoring-references/maps/us-climate-regions.php (accessed on 24 January 2020).
- Esri Data & Maps & Tomtom. USA State Boundaries 2012. Available online: https://www.arcgis.com/home/item.html?id=540003aa59b047d7a1f465f7b1df1950 (accessed on 24 January 2020).
- IPCC. Climate Change 2001 Synthesis Report. In An Assessment of the Intergovernmental Panel on Climate Change; Intergovernmental Panel on Climate Change: Geneva, Switzerland, 2001. [Google Scholar]
- Georgescu, M.; Morefield, P.E.; Bierwagen, B.G.; Weaver, C.P. Urban adaptation can roll back warming of emerging megapolitan regions. Proc. Natl Acad. Sci. USA 2014, 111, 2909–2914. [Google Scholar] [CrossRef] [Green Version]
Figure 1.
Relationship between modeled surface temperature (°C) and Impervious Surface Area (ISA) in CONUS urban centers built within, (a) vegetated regions and (b) arid regions (see text for details). Only CMGs with ISA greater than 5% are used.
Figure 1.
Relationship between modeled surface temperature (°C) and Impervious Surface Area (ISA) in CONUS urban centers built within, (a) vegetated regions and (b) arid regions (see text for details). Only CMGs with ISA greater than 5% are used.

Figure 2.
Decadal change in surface temperature (°C) between 2001 and 2011 for the three model simulations. Land cover only (LC), climate only (CL) and combined climate and land cover (2011). The dashed bar is obtained by linearly adding the impact of land cover only (LC) to that of climate only (CL). The change is illustrated for urban centers built within (a) vegetated landscapes and (b) arid landscapes. In both regions the impact of urban-induced land cover change is linearly additive to that of climate.

Figure 3.
Summer surface temperature change (°C) between 2001 and 2011 due to urban-induced land cover change only. For plotting purposes, we represent urban centers with areas larger than 5000 ha and ISA greater than 5% (see text for details).
Figure 3.
Summer surface temperature change (°C) between 2001 and 2011 due to urban-induced land cover change only. For plotting purposes, we represent urban centers with areas larger than 5000 ha and ISA greater than 5% (see text for details).


Table 1.
Change from 2001 in surface temperature (°C) for the 3 simulations.
| 2011 | 2011_LC | 2011_CL | |
|---|---|---|---|
| Manchester NH | |||
| Nighttime mean | 0.96 | 0.60 | 0.42 |
| Daytime mean | 0.59 | 0.54 | 0.04 |
| Daily mean | 0.75 | 0.57 | 0.21 |
| El Paso TX | |||
| Nighttime mean | −0.43 | −0.03 | −0.33 |
| Daytime mean | 0.01 | −0.31 | 0.38 |
| Daily mean | −0.20 | −0.18 | 0.04 |
Table 2.
Regional summer (June–July–August) 2011 mean temperature change (°C) compared to 2001.
| Northeast | Upper Midwest | Central | Northern Rockies | Northwest | West | Southwest | South | Southeast | |
|---|---|---|---|---|---|---|---|---|---|
| 2011 | 1.80 | 1.14 | 2.29 | 1.29 | −0.77 | −1.55 | −0.29 | 3.75 | 3.13 |
| 2011_LC | 0.24 | 0.24 | 0.20 | 0.23 | 0.16 | 0.14 | −0.10 | −0.26 | 0.21 |
| 2011_CL | 1.55 | 0.86 | 2.09 | 1.08 | −0.98 | −1.65 | −0.21 | 3.95 | 2.89 |
Publisher’s Note: MDPI stays neutral with regard to jurisdictional claims in published maps and institutional affiliations. |
© 2021 by the authors. Licensee MDPI, Basel, Switzerland. This article is an open access article distributed under the terms and conditions of the Creative Commons Attribution (CC BY) license (http://creativecommons.org/licenses/by/4.0/).
Share and Cite
MDPI and ACS Style
Bounoua, L.; Thome, K.; Nigro, J. Cities Exacerbate Climate Warming. Urban Sci. 2021, 5, 27. https://0-doi-org.brum.beds.ac.uk/10.3390/urbansci5010027
AMA Style
Bounoua L, Thome K, Nigro J. Cities Exacerbate Climate Warming. Urban Science. 2021; 5(1):27. https://0-doi-org.brum.beds.ac.uk/10.3390/urbansci5010027
Chicago/Turabian StyleBounoua, Lahouari, Kurtis Thome, and Joseph Nigro. 2021. "Cities Exacerbate Climate Warming" Urban Science 5, no. 1: 27. https://0-doi-org.brum.beds.ac.uk/10.3390/urbansci5010027