Article

Smart City Thailand: Visioning and Design to Enhance Sustainability, Resiliency, and Community Wellbeing

by
K. N. Irvine
1,*,
Asan Suwanarit
1,
Fa Likitswat
1,
Hansa Srilertchaipanij
1,
Massimo Ingegno
1,
Peeradorn Kaewlai
1,
Pranisa Boonkam
1,
Nij Tontisirin
1,
Alisa Sahavacharin
1,
Jitiporn Wongwatcharapaiboon
1 and
Shusak Janpathompong
2
1
Rangsit Campus, Faculty of Architecture and Planning, Thammasat University, Khlong Luang, Pathum Thani 12121, Thailand
2
Faculty of Architecture, Chulalongkorn University, Pathumwan, Bangkok 10330, Thailand
*
Author to whom correspondence should be addressed.
Submission received: 13 January 2022 / Revised: 26 January 2022 / Accepted: 29 January 2022 / Published: 3 February 2022

Abstract

:
A “Smart City” framework was used to investigate and develop visions of alternative futures for a peri-urban superblock north of Bangkok, Thailand. The Smart City framework considers seven smart pillars: environment, economy, energy, mobility, people, living, and governance, with a focus on community wellbeing that is supported by information and communication technology (ICT). A mixed-method approach that included: community and industry surveys, both online and face-to-face (total n = 770); in depth, semi-structured, stakeholder interviews; passive participant observation; and photo-documentation was used to inform and organize the project visions and designs. Several themes emerged from the community surveys and key stakeholder interviews: (i) connected green space is highly valued and effectively links multiple smart pillars, enhancing community wellbeing and resiliency to flooding; (ii) superblock mobility, connectivity, and sustainable development could be achieved through a seamless, integrated public-transit system following the principles of transit-oriented development (TOD); (iii) the superblock should prepare for the implementation of Thailand 4.0 through the improved programmatic and physical integration of local industry, community, and universities, including plans for a Digital Village and co-work space. Example designs that address these considerations and vision alternative futures for the superblock are presented in this Smart City case study.

1. Introduction

The Smart City concept has been promoted as a new guiding philosophy of urbanism [1,2,3,4], although Cugurullo [5] suggested that the origins of “faith in technology” and “techno-urban development” (components of the Smart City movement) have lineage dating to 1627 and Francis Bacon’s New Atlantis. Soderstrom et al. [6] traced the Smart City evolution to approximately concurrent but parallel strands of urban planning discourse, the first strand being the ideas of Smart Growth and New Urbanism that emerged from the U.S. in the 1980’s and 1990’s [7,8] and the second being that of technology-based intelligent cities (or variations thereof, including the digital city, the ubiquitous city, or information city [9,10,11]). Interestingly, Soderstrom et al. [6] concluded that the popularization of the Smart City concept was associated with IBM’s decision to upscale its value chain by focusing on consultancy and software, rather than hardware, with a particular view towards smart urban technologies. The IBM pivot began with its 2008 launch of the smarter planet campaign [12] and subsequent trademarking of the term “smarter cities”.
While the Smart City concept was adopted by several Thai government agencies in 2003, it did not gain traction until it became linked with the Thailand 4.0 policy, introduced in May 2016 [11,13]. Thailand 4.0, in essence, is an economic development plan aimed at promoting creativity, innovation, and high-level services, with advanced digital technology being an important cornerstone. In this sense, there is a clear connection between Thailand 4.0 and interest in Smart City development that is now being advanced by the Thai Digital Economy Promotion Agency (DEPA) [14,15].
Thammasat University Faculty of Architecture and Planning (Thammasat Design School, TDS) undertook a project in 2020, collaboratively with private-sector partners, Nava Nakorn Public Co., Ltd. (NNCL) (Khlong Luang, Pathum Thani, Thailand), Ratch Group (Nonthaburi, Thailand), and ALT Telecom PLC (Nonthaburi, Thailand), to develop visions of alternative futures for the Thammasat-Nava Nakorn (TUNN) Smart District (superblock). The superblock includes one of the oldest industrial/residential/commercial estates in Thailand, three universities, a national science and technology research park, and mixed land use (but predominantly agriculture) in peri-urban Bangkok. The overarching objective of this paper is to provide a case study illustrating possible visions, master plan alternatives, and designs that could enhance sustainability, resiliency, and community wellbeing within the TUNN superblock. In support of this overarching objective, emphasis is placed on the importance of community familiarity, cultivated through surveys, in-depth stakeholder interviews, and passive observation techniques in guiding the planning and design work, particularly with respect to the themes of green space/public space, water sensitive urban design (WSUD), and transit-oriented development (TOD). In essence, this community familiarity idea forms the “bottom-up” component of the “top down/bottom-up” approach to Smart City planning and design [16].

1.1. Relevance and Novelty of the Research

Much of the Smart City literature has focused on theoretical characterization of what it means to be a Smart City, often emphasizing ICT applications. Our study takes a different approach by providing design visualizations of alternative Smart City futures for the superblock that were informed by extensive community consultation, illustrating the importance of integrating community familiarity to guide design whereby ICT provides a supporting role for these visions. In applying a case study methodology, we are able to highlight a transdisciplinary approach that provides rich insight to the community’s lived experience and facilitates the development of innovative urban designs related to public space, green space, mobility and TOD, and the transition to a knowledge-based economy that is consistent with the Thailand 4.0 policy, but still addresses community wellbeing. The recommended ways forward can specifically address Smart City planning and design issues within the superblock, but are also general enough that they could be applied to other cities of the region. Finally, we suggest that the Smart City literature is dominated by approaches and examples from the Global North and that this work provides an important example of efforts in a Global-South context, which has very different governance, transportation, economic, and environmental practices and considerations.
With our focus on the Global South and innovative urban design that can lead to a more resilient, sustainable, and livable community, this research directly relates to the theme of this special issue with respect to “...generation of knowledge through innovative transdisciplinary approaches and alternative solutions to enable good governance, policy, regulations, codes, design criteria and, most importantly, emancipated voices and debates among global stakeholders of development in the South.” This study also is consistent with the broader Urban Science journal themes of landscape and urban planning, digitalization and smart cities, urban transportation and mobility, urban systems and urban metabolism, and infrastructure, the built environment and architecture.

1.2. What Is a Smart City?

There appears to be no general consensus on the meaning of the term “Smart City” or its attributes [1,17,18,19,20,21,22,23,24], but generally there is a pervasive reference to the use of ICT [25,26,27,28]. Mora et al. [21] suggested that Smart City development has followed a number of differing conceptual threads, including a technology-led vs. holistic strategy, the double- or quadruple-helix model of collaboration, the top-down or bottom-up approach, and the mono-dimensional or integrated intervention logic. Neirotti et al. [29] succinctly and clearly summarized what we believe are the two essential differences to Smart City-planning approaches:
Approach 1: Follows Le Corbusier’s dictum that a “house is a machine for living in’’. Under this approach, the emphasis is on the production and distribution of community services, healthcare, energy, transportation and logistics, waste management and pollution control, and it looks at the way ICT can harness information processing in these fields. This would tend to be a more top-down approach.
Approach 2: Smart City development is based more on bottom-up approaches in which cities provide access to data and allow citizens to make their own decisions. This approach stresses the importance of investments in ‘‘soft’’ urban-living domains wherein ICT has a more limited supporting role and emphasis is placed on welfare and social inclusion policies, culture, and education.
Wan and Yin [30] suggested that the rapid implementation of data analytics in urban planning and design has resulted in a disconnect between the delivery of policy outcomes and technical outputs to the extent that Smart City technology has failed to deliver the expected policy benefits in many Chinese cities. Allam and Newman [22] expressed concern that the Smart City concept is heavily promoted by large, multi-national companies with data systems, software, and hardware interests, and that if governments pursue a purely corporate approach as part of their branding rather than taking a more inclusive, participatory approach to governance, then smart technology may simply be a wasted investment. A recent survey [31] that focused on the user ability of a more educated cohort (94% Ph.D. or Master’s degree; 6% Bachelor’s degree or undergraduate) in 28 countries worldwide showed that even this group had serious concerns regarding the utility, safety, accessibility, and efficiency of “smart” services. The digital divide, particularly in the Global South and for the elderly, is of concern [32,33,34,35,36] and must be considered using an inclusionary and participatory approach [37,38,39]. It seems, then, that community consultation (or participatory planning, or what we term here “familiarity” with community) should be incorporated as an important element of Smart City planning (or the bottom-up approach, as noted above), with Allahar [24] concluding that “The success of building smart cities has been traced by some scholars to depth of community engagement and level of citizen participation”. Certainly, there is a history of participatory planning in water and community-based natural-resources management, landscape architecture, and urban planning [40,41,42,43,44,45], although Swapan [46] identified a number of barriers to community participation in the planning process, particularly for cities of the Global South. Simonofski et al. [47] also observed that while the technological aspects of the Smart City have been thoroughly explored, the civil-community role has often been neglected in the literature.
The Thai Smart Cities initiative [48] established by DEPA characterizes a Smart City as:
A city that takes advantage of modern technology and innovation to increase the efficiency of the city service and management, reducing the cost and resource usage of the target city and citizens. It focuses on good design and participation of business and public sectors in urban development, under the concept of modern and livable city development, for people in the city to have a good quality of life and sustainable happiness.
The DEPA definition strikes a good balance between technology and community and is the approach taken by the project reported herein, although perhaps we place a greater emphasis on community wellbeing [49], as supported by technology. This characterization of a Smart City is certainly consistent with Figueiredo et al.’s [4] call “...for technologists and designers to combine their expertise to devise a fuller understanding of the world”. We also might identify a number of concepts that are in some way related to the Smart City, including community quality of life, livable city, sustainable city, happy city, sustainable happiness, eco-city planning, biophilic city, resilient city, and future city [50,51,52,53,54,55,56,57,58]. While these concepts are related to our central theme of the Smart City and we will incorporate some aspects of sustainability, livability, and resiliency within our discussion, we remain focused on the Smart City framework.
Some type of Smart City Index is frequently employed to assess the strengths and shortcomings of Smart City policies [59,60,61,62]. Carli et al. [63] note that such indexes can assist decision makers in assessing their progress along the path to achieving a Smart City, to share this information with the community, and also to support deliberations about where to focus resources and time in a smarter way. These indexes are very much similar to the livability and community wellbeing indexes that have become popular both as a branding exercise and a research avenue [50,64,65,66]. Alternatives to the index approach exist but are less commonly applied, although these alternatives may provide a more informative platform for the design disciplines. Allahar [24] suggested a set of steps or building blocks and associated activities (e.g., Diagnosis—to identify city-specific challenges, including infrastructure connectivity and consultation with key stakeholders in this step; Action Plan—prepare a Smart City Action Plan based on benefit-cost analysis). Ivanova and Ganzha [66] included a Coefficient of Ecological Stability in their simple ternary diagram framework that considered the relationship between the Smart City, the Sustainable City, the Environmentally Friendly City and Smart Technology. Kim and Steenkamp [67] used a four-phase design process approach that considered: Phase I (Awareness), Phase II (Suggestion), Phase III (Development) and Phase IV (Evaluation). Mozuriunaite [68] suggested “...there is little information and research on urban design principles and tools in the smart city’s creation and contribution to its smartness...” but ultimately linked Maslow’s Hierarchy of Human Needs, general urban and landscape design principles, and Smart City design considerations to identify six key design areas: Vertical Green, Water Energy (e.g., water recycling, treatment, and solar energy), Water Savings, Energy Savings, Natural Ventilation, and Technology. Allam and Newman [22] proposed a Smart City framework with three important drivers: culture, metabolism (i.e., the concept that urban livability must be integrated with resource flows (metabolism), to simultaneously reduce a city’s metabolism and increase its livability), and governance.

1.3. The Role of Design and Landscape Architecture in Transforming Urban Landscapes

We employ a case study approach of the Smart City concept in this paper to illustrate visions for the sustainable transformation of a peri-urban area in Thailand. The scale of the case studies ranges from the larger superblock to the site scale in physical space, but also considers aspects of cyberspace and programmatic space. Lenzholzer et al. [42] reflected on the need for landscape architecture to formalize its research methods so that they are discipline specific and academically rigorous and, in particular, explored the “research through designing” concept. Research through designing considers four traditional epistemologies that may be adapted within landscape architecture as a means to generate new knowledge about landscape transformation: (post)positivist, constructivist, advocacy/participatory and pragmatic. Each of these epistemologies, when viewed through the landscape architecture lens, necessarily requires a transdisciplinary approach that integrates methods and knowledge from sciences, social sciences, and engineering within the design context. In using case studies, we take the pragmatic approach of research through designing to examine the potential transitioning of the peri-urban superblock area into a smart region.
The paper is structured such that this section introduces the objectives of the study and places them in the context of current Smart City philosophies and the role of integrating design and planning within Smart City development, specifically focusing on the importance of community participation (or as we call it, “familiarity”) in guiding such development. Section 2 presents the methods employed in the study by introducing the “smart pillar” framework used by the Thai government for Smart City designation, as well as the innovative approach to undertaking the project through the combined efforts of five classes across the Thammasat Design School (TDS) that included the administration of face-to-face and online surveys, in-depth key-stakeholder interviews, and passive community observation to inform the Smart City visioning and design process. Section 3 begins by presenting the results of the community surveys and in-depth key stakeholder interviews which then leads to the presentation and discussion of example designs illustrating the main themes that emerged from the community surveys and in-depth key stakeholder interviews. Section 4 concludes by summarizing the important findings of the case studies and discusses these findings in the context of the broader Smart City literature. We also identify shortcomings of the study and recommend lines of possible future research.

2. Methods

The DEPA Thai Smart City initiative defines seven “smart pillars” [48]:
  • Smart Environment—considers a city’s impact on the environment and implications for climate change that includes the use of technology to help manage water, waste, and air emissions, as well as enhancing disaster surveillance and increasing public participation in natural-resource conservation.
  • Smart Economy—refers to the use of digital technology to create additional value in the economy and effectively manage resources such as an “intelligent agricultural city”, “intelligent tourist city”, etc.
  • Smart Energy—means creating a balance between energy production and use through conservation and efficiency.
  • Smart Mobility—focuses on developing traffic systems and intelligent and diverse transportation options that are efficiently connected and environmentally friendly.
  • Smart People—accounts for the development of citizens’ skills and knowledge with a particular emphasis on lifelong learning opportunities to reduce social and economic disparity and encourage openness for creativity, innovation, and public participation.
  • Smart Living—is the characteristic of a city that relates to its developed facilities, taking into account Universal Design and providing people with a good quality of life to be safe and happy.
  • Smart Governance—reflects a city that develops a government service system to facilitate stakeholder access to government information by focusing on transparency and participation.
The DEPA initiative targets approximately 200 moderate-sized provincial cities, institutions (e.g., universities), and industrial zones to submit applications for Smart City designation whereby successful applications will be afforded technical and funding support to implement their Smart City plans.
We used DEPA’s seven smart pillars to guide our planning and design efforts, although components of the Smart City design frameworks outlined by Allam and Newman [22] and Mozuriunaite [68] are also clearly reflected in the designs presented herein. The study team employed an innovative approach to address the objective of visioning possible futures for the TUNN superblock by including the project as a main theme for authentic learning experiences across five TDS classes. The classes spanned years 2, 3, and 4 and represented five different programs: Architecture, Landscape Architecture, Urban Design, Urban Planning, and Design, Business, and Technology Management. While the overarching framework of the project was the seven smart pillars, each class had latitude to explore the pillars using different techniques. Students from different classes and years were able to interact through organized field investigations and an information-sharing day with project stakeholders, faculty and graduate students from the Harvard Graduate School of Design (who were in Thailand as part of their own studio course, re-imaging the Lower Chao Phraya River under a Letter of Agreement with Thammasat University [69]).
Of the five participating classes, three were upper-division studio classes (LN316, Landscape Architectural Design 4; UD327, Urban Design and Development Studio, Greenfield Development; and AR416, Integrated Architectural Design II) in which the assessment was based primarily on three reviews, while the assessment for a lower-division studio class (DBT244, Eco-design Innovation) was based on three reviews and several smaller, additional assignments. Students were organized into groups of 4–5 in the upper-division classes and 7–8 in the lower-division class (which had a considerably larger enrolment) and each group focused on a specific topic, keeping the seven pillars of the Smart City as a guiding principle. In general, the reviews progressed such that:
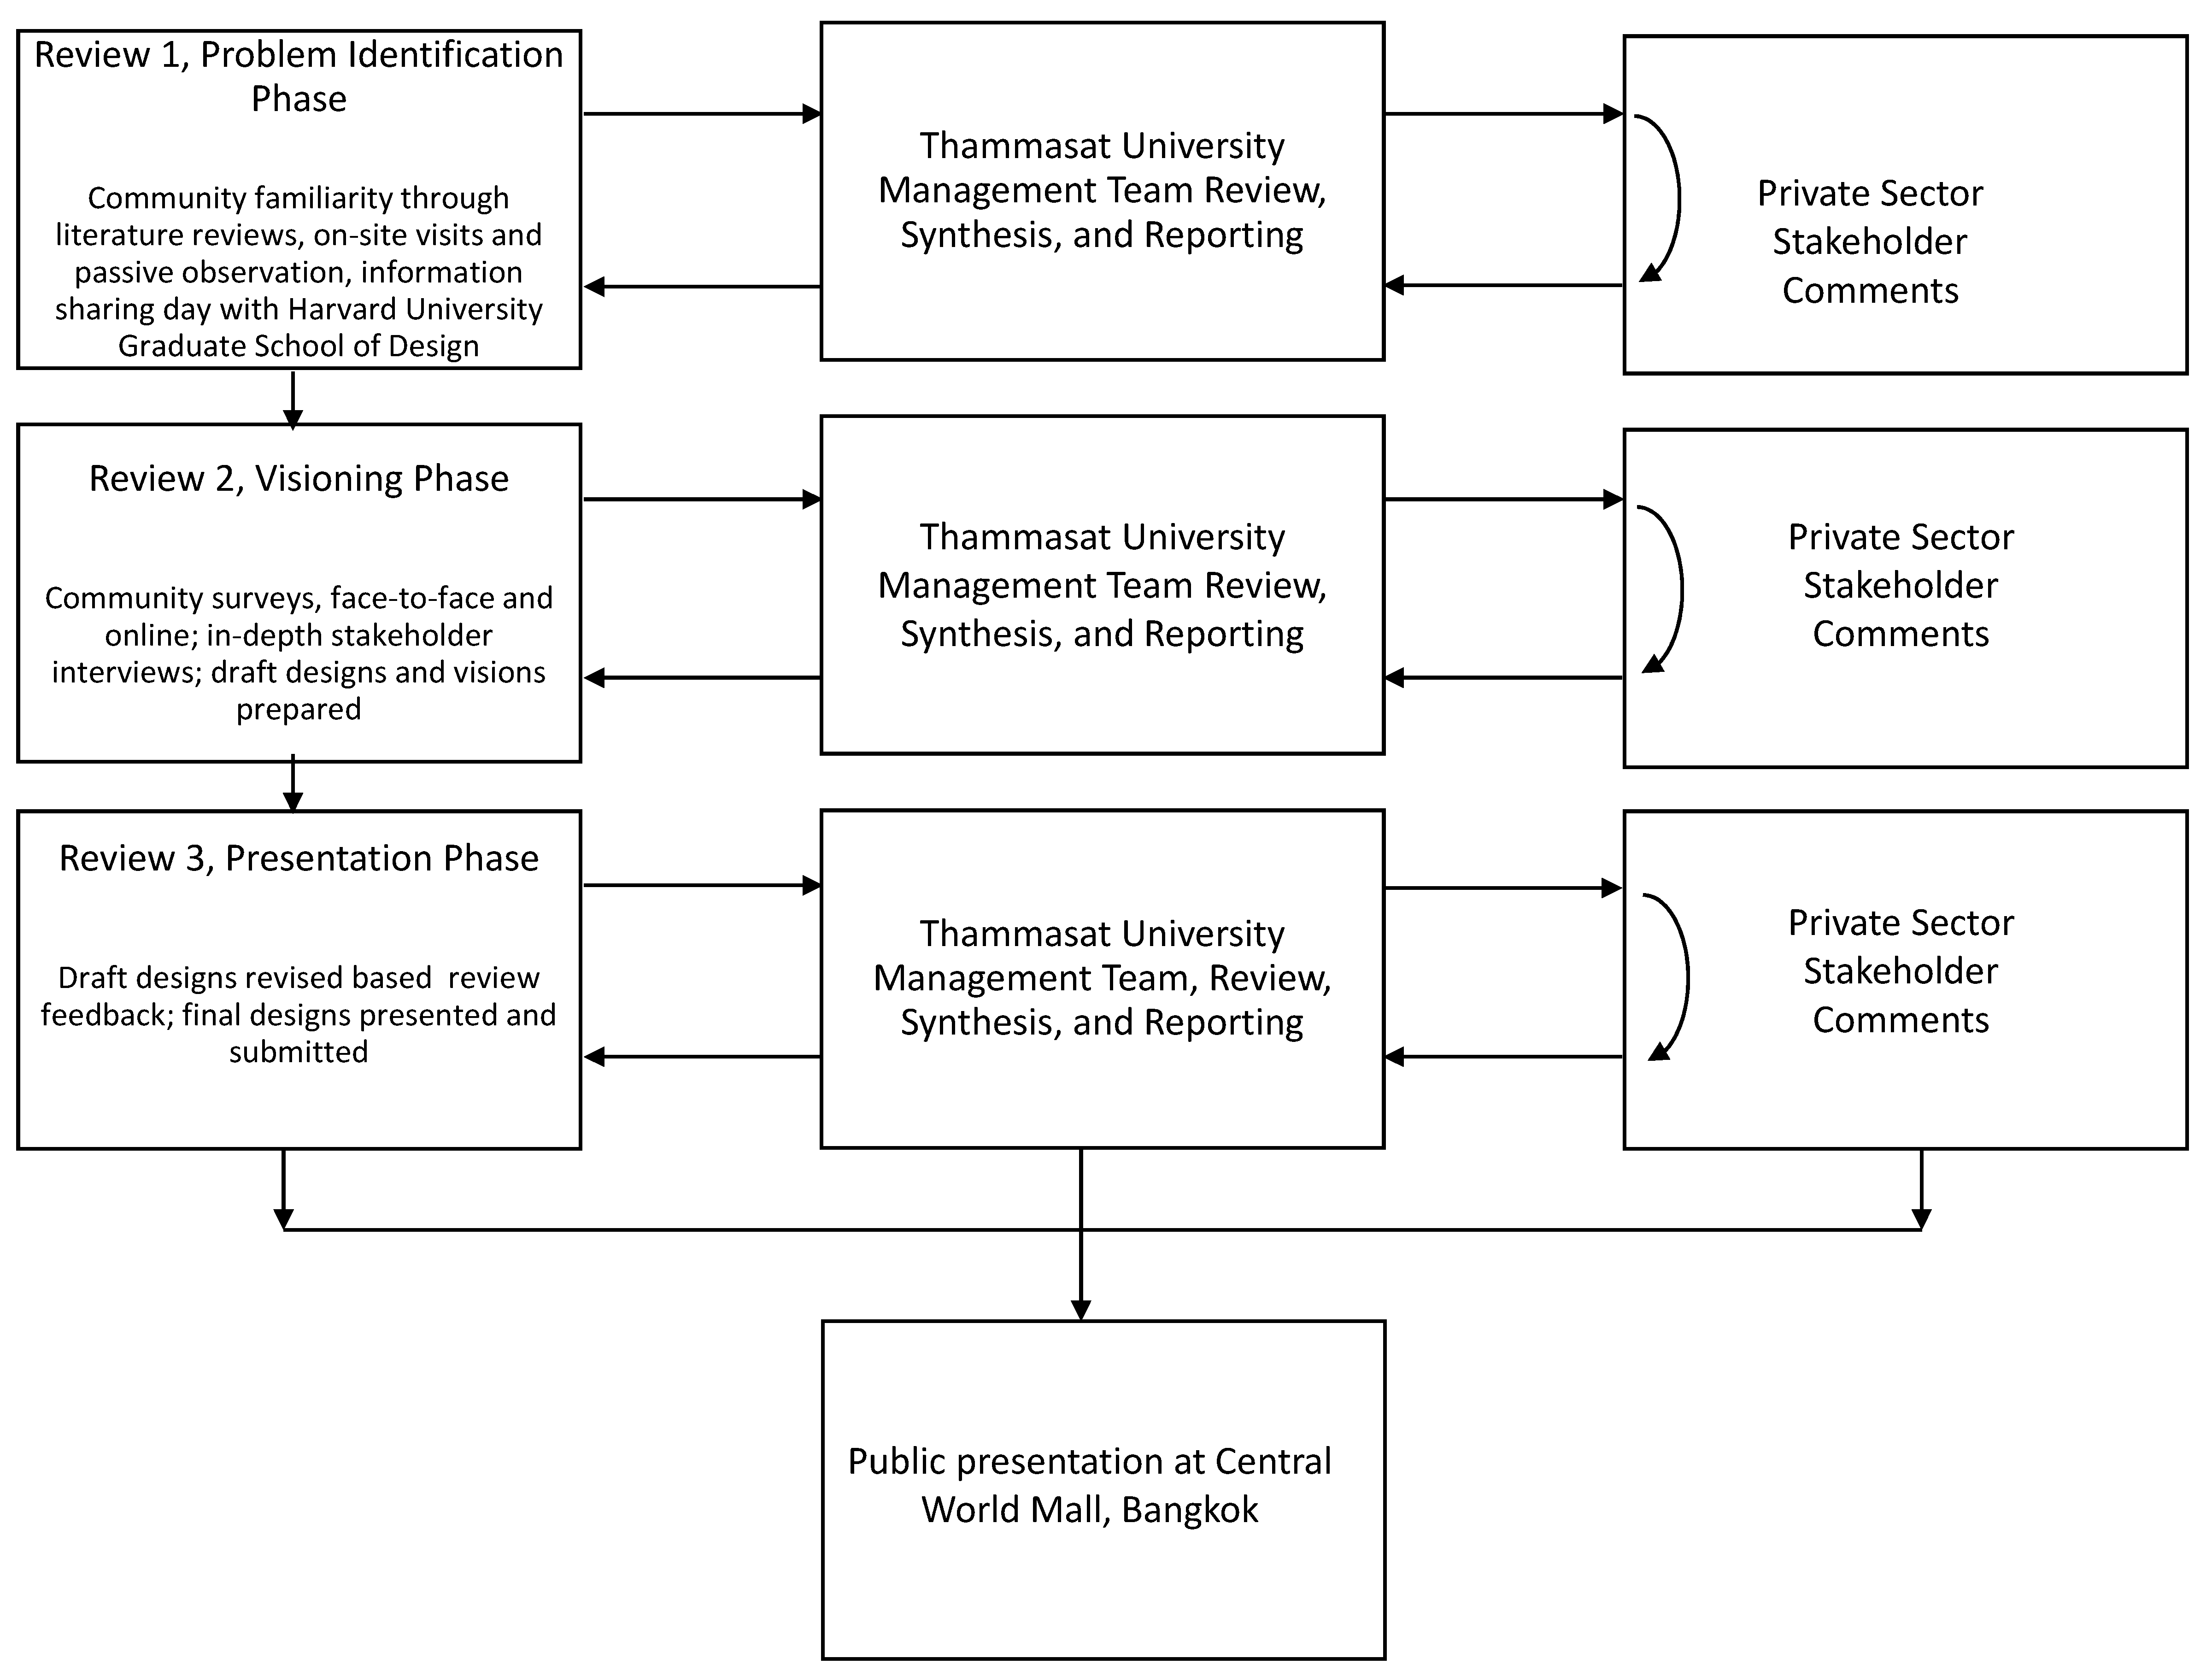
  • Review 1—scoped the questions and challenges associated with the group’s particular topic and provided background with respect to the study area. This was the problem-identification phase.
  • Review 2—provided an overview of the data collection methods that, in general, supported the group’s topic as well as initial and general ideas on addressing their planning and design questions. This was the visioning phase.
  • Review 3—the focus of each team or individual project was refined and specific plans and designs were developed to address aspects of the Smart City concept. This was the final presentation phase.
Each studio class had a course coordinator as well as several collaborating instructors and each instruction team conducted the reviews, with support from 3–4 invited guest professionals. All classes used a combination of primary and secondary data sources, but data collection methods differed from class to class depending on their study focus. Section 2.1 summarizes the data collection methodologies for each class, with a specific focus on community familiarity.
The three senior authors that formed the study management team from Thammasat University met with the private sector partners on a monthly basis. The role of the study management team was threefold: (i) review all designs and visions submitted by the students in each class and, in consultation with the course coordinators, synthesize the results of high quality and innovative designs and visions for presentation to the private sector partners as part of the regular monthly project meetings; (ii) consider the private sector partner comments on the draft designs and visions and escalate their suggestions to the course coordinators and classes; and (iii) provide additional review and synthesis of community surveys as part of the regular meetings with the private sector partners. The monthly private sector partner meetings were valuable to iteratively and interactively inform the final plans and designs. The general structure and flow of the research design is summarized in Figure 1. As noted in Section 1.3, the pragmatic research through designing approach was employed in this study, integrating aspects of (post)positivist, constructivist, and advocacy/participatory epistemologies. Lenzholzer et al. [42] noted that the pragmatic approach will typically consider “natural and cultural aspects as well as design procedures, often within a certain geographical context”, and may include… “a series of different studies that are carried out in parallel or in sequence”. This parallel or sequence of efforts must be meaningfully integrated into the overall study, as illustrated in Figure 1.
Each class had its own set of learning outcomes that will not be elucidated here for the sake of space and focus, but the overarching intent of the project structure was to provide students with an authentic learning and design experience that included meaningful exchanges with the community, private sector, and international (e.g., the Harvard Graduate School of Design) participants. Authentic design-based studios are an important component of landscape architecture and architecture programs [70,71] and in this sense, our project was pedagogically consistent with Caldwell et al. [72], who said that “The main goal of promoting the city as a place of learning through community consultation has been to develop students’ approach to urbanism and architectural design as reflective practitioners.”

2.1. Approaches to Community Familiarity—Primary Data Collection from the Bottom-Up

Three community surveys were conducted to better understand resident and industry concerns, lived experiences, and community visions, with the results subsequently used to guide development of the designs that were produced for the project by the different classes. The first survey was performed face-to-face in Nava Nakorn and was administered to 241 Nava Nakorn community members by the UD327 class. This survey provided general demographic data, information on housing stock, public space, mobility and public transportation, and natural-disaster resiliency. The second survey was conducted online by the DBT244 class. The online survey approach was necessary due to increasing restrictions on public activity resulting from COVID-19, and included participants from Nava Nakorn and Thammasat University. A total of 506 respondents completed the questionnaire, which covered general demographic data and specific issues regarding DEPA’s seven Smart City pillars, particularly focusing on the opinions related to green space, air quality and other environmental issues, leisure-time practice, mobility, and neighborhood society. The third survey was an online-survey of Nava Nakorn industries conducted by the UD327 class with assistance from NNCL. A total of 23 industries responded, which represents a 13% response rate. The questionnaire structure for all three surveys included both closed and open-ended questions. All surveys were anonymous, participation was entirely voluntary, and the methods followed approved university ethics practices for undergraduate research projects. The questions associated with each survey can be obtained from the corresponding author, but in the interest of space are not included here.
NNCL conducts community meetings on a bi-monthly basis. Student representatives observed the community meeting on 8 March 2020. After the formal meeting, the students were afforded in-depth interviews with community representatives and senior administrators from NNCL. By the end of March 2020 (approximately 60% through the university semester), COVID-19 restrictions had limited community visitation.
Passive participant observation was conducted by all TDS classes prior to the COVID-19 restrictions. According to LeCompte et al. [73] passive participant observation can support the effective mapping of social spaces and venues within the community. Extensive photo-documentation of the physical and social landscapes within the study area was also conducted. Büscher [74] noted that the observation of landscape character or “sense of place” is an essential tool for landscape architects and urban designers, and as such this “directed seeing” was practiced by all classes. Several on-site visits and activities, as well as an information-sharing day were organized with students and faculty from the Harvard Graduate School of Design during the week of 10 February 2020.

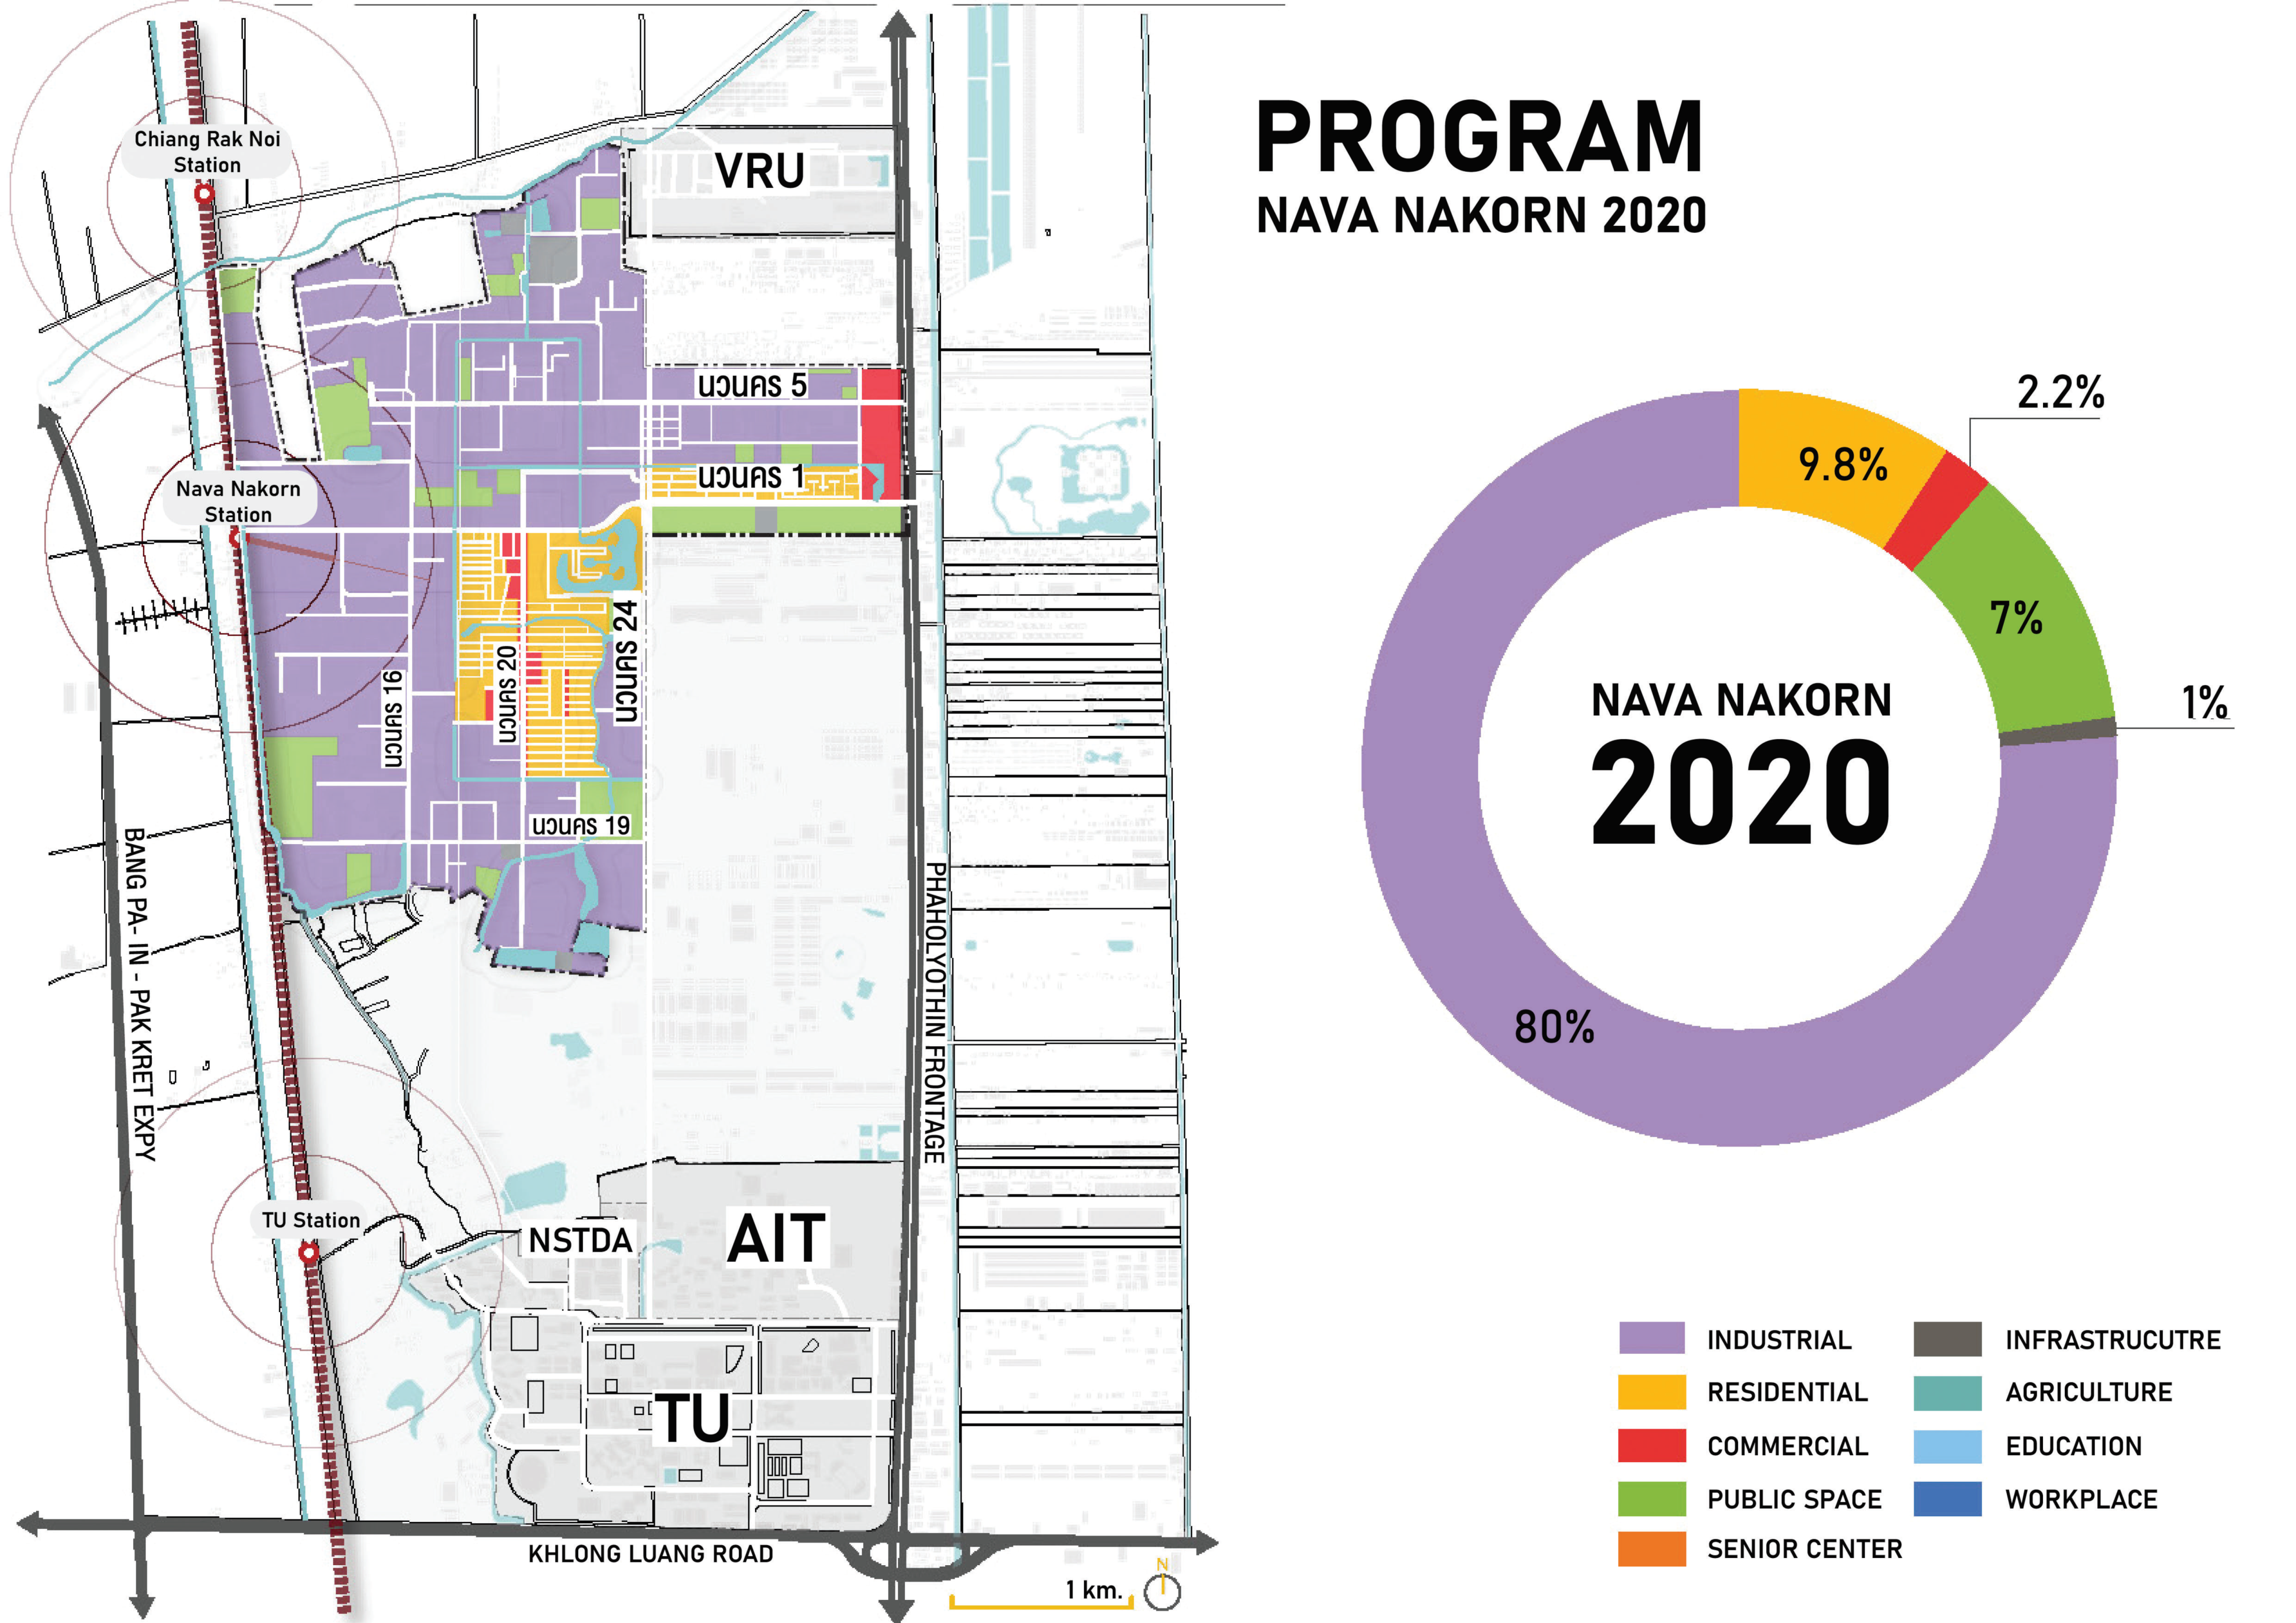
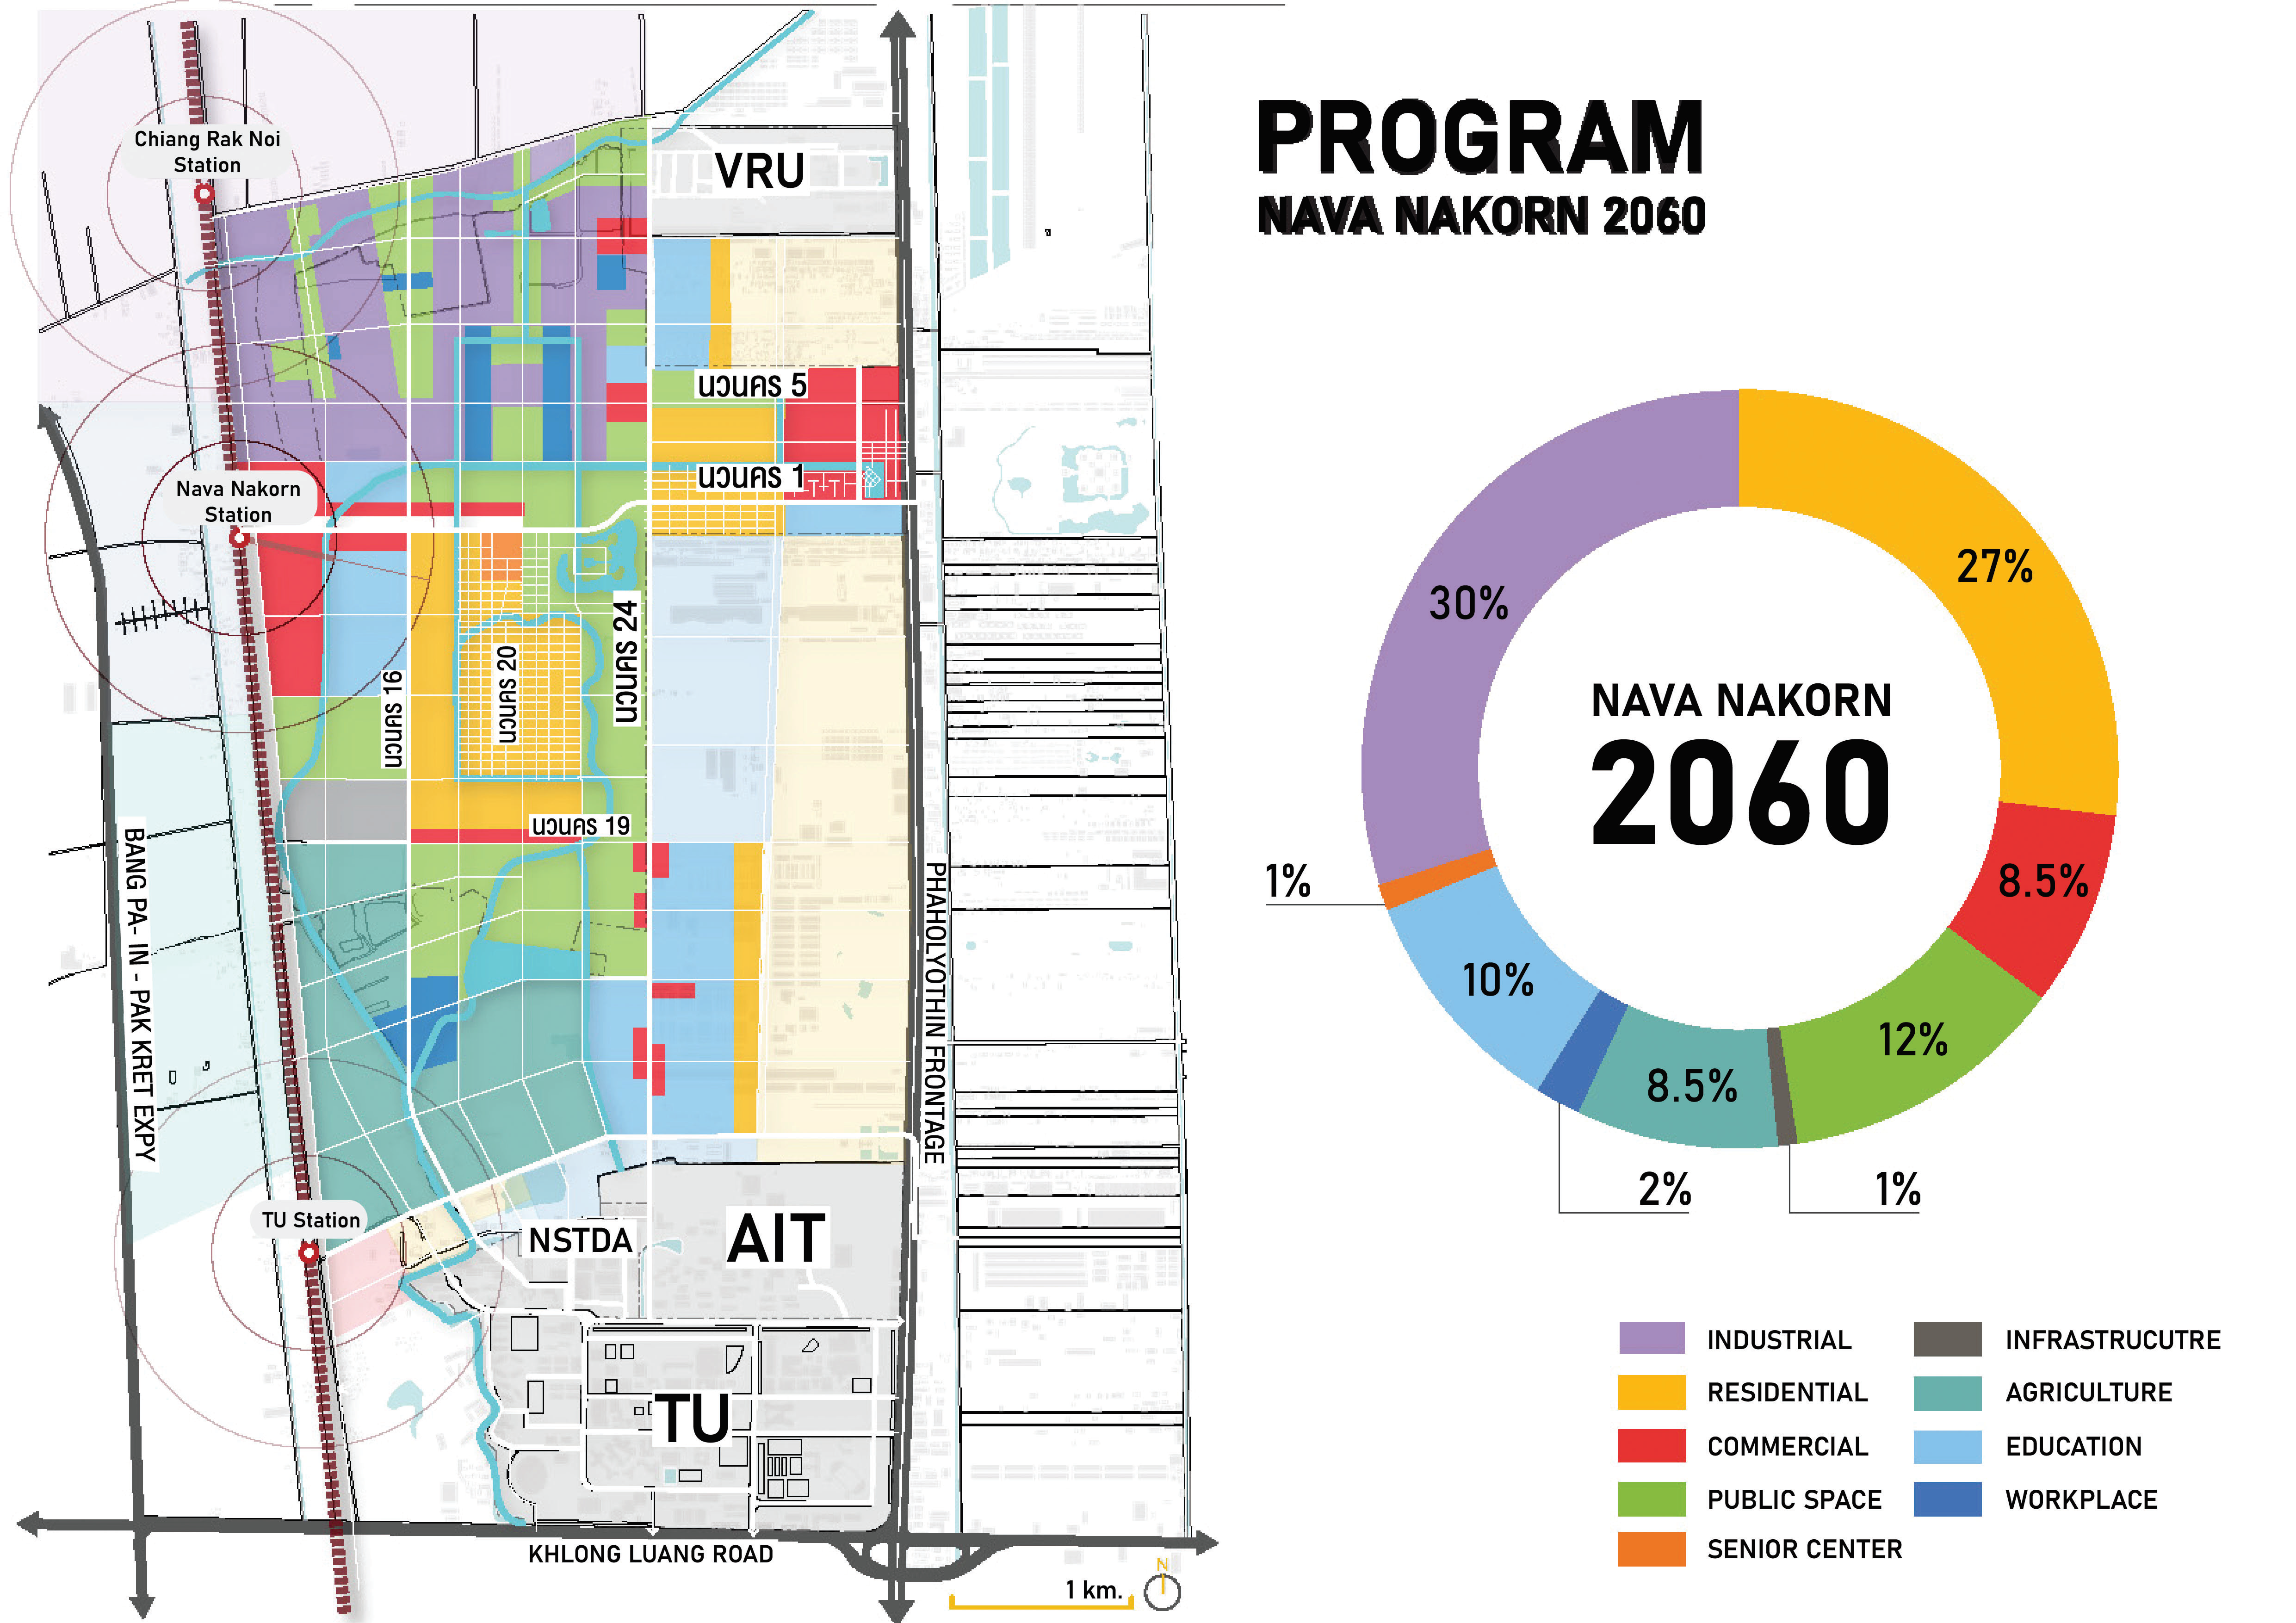
2.2. The Superblock Study Area

The TUNN superblock study area is shown in Figure 2. Located approximately 53 km north of downtown Bangkok, the district includes the Nava Nakorn industrial estate, Thammasat University, Asian Institute of Technology (AIT), and Valaya Alongkorn Rajabhat University (VRU) campuses, the Thailand Science Park, and rural areas of both Pathum Thani and Phra Nakhon Si Ayutthaya provinces. Sintusingha [51] notes that “superblocks” are large tracts of land in the peri-urban Bangkok Metropolitan Region that are bounded by a network of major roads with an internal mix of soi (lanes), khlong (canals), idle land held on speculation, and rural/agricultural land. Historically, Pathum Thani was a rural, agriculturally based province that grew in importance during the late 19th century with the construction of the Prem Prachakorn Canal in 1869. This canal provided a transportation connection between Ayutthaya and Bangkok and subsequently, the Tung Rangsit project (1890–1900) added a grid of 43 regularly-spaced canals. Bangkok and its peri-urban catchment simultaneously began to experience rapid industrialization and urbanization in the 1960’s, as traditional agricultural activity concomitantly declined. Industrial estates became part of the fabric of Pathum Thani and Phra Nakhon Si Ayutthaya provinces, with access to deep water ports, airports, and highways accommodating the movement of goods to both large local (Bangkok) and international markets [51,75]. Gated-community development has become a more recent trend [76]. The climate of the region based on the Koppen climate classification system is a Tropical Savanna (Aw) with hot and humid summers, wet rainy periods, and warm winters. The mean annual temperature (30 year climate norms, 1982–2012) [77] is 28.1 °C and the annual precipitation is 1470 mm.
Nava Nakorn Public Co. Ltd. (NNCL) was established on 26 March 1971 and Nava Nakorn Pathum Thani became the first estate developed by the company. Nava Nakorn Pathum Thani currently is 6,485 rai (1038 ha) in area, with approximately 203 rai (32.5 ha) of land as yet unsold. As such, NNCL now obtains its principal revenue sources by essentially acting as a “super utility”, by managing the Pathum Thani site and providing or overseeing traditional municipal services including water, wastewater treatment, electricity, telecommunication services (e.g., fiber optics), security, solid-waste management, and urban infrastructure. NNCL also acts as a community development and wellbeing leader, organizing bi-monthly town hall meetings of elected representatives to address community issues and introducing a mobile app that enables residents to report faults (e.g., water leaks, road disrepair, lighting and electrical problems). Industry, commercial, and residential areas are located within Nava Nakorn Pathum Thani, with the mix of 200 industries being diverse but generally considered light, high value industries. The residential population peaked at over 200,000 prior to the historic 2011 flood in Thailand. However, as the estate was inundated for more than 6 weeks in 2011, resulting in extensive property damage and the temporary (and in some cases permanent) closing of industry, population did not fully recover and is currently estimated at 150,000. Nava Nakorn’s population is diverse and includes citizens of Thailand, Cambodia, Myanmar, Vietnam, and Laos, with smaller proportions of other nationalities.
Thammasat University is the second oldest university in Thailand, founded in 1934. The Rangsit Campus of Thammasat University, which is located within the superblock, was opened in 1985 and is 1757 rai (281 ha) in area, enrolling approximately 25,000 undergraduate students. Founded in 1959, the Asian Institute of Technology (AIT) focuses on engineering, environment, and management studies, enrolling approximately 1600 graduate students from 40 countries around the world. The Thailand Science Park was established in 2002 to promote research and development in the science, technology, and engineering fields through collaboration between the private sector and the National Science and Technology Development Agency (NSTDA). The park is home to more than 100 private companies involved in auto parts, food and agriculture, medical devices and pharmaceuticals, material science and chemicals, electronics, robotics, and automation research and development.

3. Results and Discussion

3.1. Community Surveys

We do not provide a detailed analysis of survey results here, but rather, summarize the key points organized around the seven smart pillars that informed the subsequent smart district planning and design.
Environment—Both the face-to-face survey and online community surveys reported a general perception of inadequate green space and public space. Public space certainly can enhance a sense of community, happiness, and affection for place, but effective strategic visioning is essential for its successful implementation [78,79,80]. When considering desirable attributes of a public park, the top three features noted by the online respondents were big trees, benches, and lawn areas. The face-to-face survey focused heavily on the impacts and community resiliency in relation to fluvial and pluvial flooding (including property damage estimates, frequency, and spatial extent of flooding), while the online industry survey examined the business community response to the record flood of 2011. The majority of respondents had experienced both fluvial and pluvial flooding, and it appears that while flood assistance was available in different forms, individuals generally absorbed a large proportion of the flood damage. Green space and WSUD could be an effective pluvial flood management measure, while at the same time providing a more livable urban environment [81,82,83,84,85,86]. As such, increased green space and WSUD features underpinned many of the designs for this project. Air quality and solid-waste management also were identified in the online and face-to-face community surveys as being of concern.
Mobility—Both the face-to-face and online community surveys explored the costs and methods of commuting. Both surveys were consistent in their cost estimates, with the online survey indicating an average cost of 995–1700 THB ($31.90–54.51 USD) per person per month, while the face-to-face survey had a range of 1000 to 6000 THB ($32.07–$192.40 USD). However, 76% of the respondents in the face-to-face survey incurred commuting costs of 1000–2000 THB ($32.07–$64.14) per month. Both surveys indicated a high level of personal automobile use for commuting and a low level of public bus or van use (15% reported by the online survey and 6% for the face-to-face survey). Given the high level of automobile usage, as well as industrial truck traffic, it is not surprising that respondents in both surveys identified traffic congestion as a concern.
Economy—Reported monthly incomes were relatively consistent across both surveys and also fairly robust compared to the national average income. Almost half of the respondents (49.6%) in the online survey had an income of 10,000–20,000 THB/month ($320.38–640.76 USD), 27.9% had an income less than 10,000 THB/month ($320.38 USD), 27.9% had an income of 20,001–30,000 THB/month ($640.7–961.24 USD), and 5.3% and 6.3% had incomes of 30,001–40,000 THB/month ($961.27–1281.65 USD) and more than 40,000 THB/month ($1,281.65 USD), respectively. For the face-to-face survey, nearly half of the respondents (49%) had an individual monthly income in the range of 15,001–30,000 THB ($480.74–961.24 USD), while 28.9% had a monthly income of ≤15,000 THB ($480.71 USD). The average wage in Bangkok for December 2019 was 21,445 THB ($687.26 USD) [87], while the average monthly wage for Thailand in the fourth quarter of 2019 was 14,238 THB ($456.29 USD) [88]. The higher salary in Bangkok is commensurate with a higher cost of living and a concentration of skilled labor. The face-to-face survey found that 69.3% of respondents believed their household income was sufficient and both surveys were consistent with respect to the proportion of respondents who were able to maintain a savings (online survey, 60% of the respondents; face-to-face survey, 54.5% of the respondents). A gender/income disparity was identified in the face-to-face survey, as women represented the greater proportion in the lowest earning category of ≤15,000 THB ($480.71 USD) per month (81.7%), but the smaller proportion (42.9%) of the top paying jobs (>100,000 THB; or $3204.37 USD) per month.
People—The online survey noted that a large majority of respondents were unaware of any training programs such as short courses, re-skilling, and up-skilling courses provided by local universities. Given the face-to-face survey finding that savings (and by extension, income) were related to education level and that 18% of the Nava Nakorn respondents had primary level education or less, a well-designed future-skills initiative could become an important programmatic link between local universities and Nava Nakorn. Future-skills training might include financial literacy, digital literacy, and entrepreneurial/small business courses. Such training should help improve individual and community resiliency and wellbeing [89].
Living—Both surveys noted that shopping was an important pass time, but the face-to-face survey indicated more than half of the respondents regularly shopped for groceries at an internationally branded convenience store, which is not cost effective and would have a comparatively larger impact on lower wage earners. However, one quarter of the respondents in the face-to-face survey also shopped online. Given the challenges presented by the COVID-19 situation, shopping behavior and new opportunities should be explored. The online survey found that 70% of respondents had used public areas in Thammasat University and Nava Nakorn, but as noted above, respondents were generally not satisfied with the currently available public space.
Governance—The most frequently cited government services used by the online survey respondents were: (1) to issue identification card (51.2%), (2) to issue driving license (42.7%), and (3) to pay utility bills (31.1%), with approximately 50% of respondents rating their satisfaction of government services between 5 and 8 points on a scale of 10. The face-to-face survey indicated that one of the more frequently identified community problems was “rundown buildings and environment and a lack of maintenance” which is a governance issue. As noted above, NNCL introduced a mobile app, Traffy Fondue [90], on the popular (in Thailand) social-media platform LINE that enables residents to report faults in an effort to more efficiently respond to community maintenance and safety problems. The app represents an important step forward in implementing ICT approaches to support Smart City development in Thailand [91,92].
Energy—The online survey showed that 40% of the survey respondents spend 500–1000 THB/month ($16.02–32.04 USD) on their electricity bill, while approximately 25% and 23% spend 1001–2000 THB/month ($32.07–$64.08 USD) and less than 500 THB/month ($16.02 USD), respectively. In particular, more than half of the factory workers (51.1%) spend less than 500 THB/month on their electricity bill, while approximately 36% spend 500–1000 THB/month. This demographic would generally rent a single room with potentially lower energy use, although rental practice in Thailand typically sees the landlord generating income by charging a higher electricity rate than the government supply for the rental units. Almost every respondent (91.2%) had an electric fan at home, while 81.3%, and 76.3% had refrigerators and air conditioners, respectively. The relatively high use of air conditioning would increase electrical demand and this consideration guided some of the proposed designs for new residential development to follow energy-efficient building practices. Both NNCL and Thammasat University have implemented pilot rooftop photovoltaic systems for renewable energy generation.

3.2. The Themes That Guided the Design

While the project used the seven smart pillars as a conceptual framework, several themes emerged from the community surveys, a review of the literature, and the iterative consultation process between project partners, as outlined in Figure 1, that helped to frame planning and design efforts. First, it became very clear that green space is a highly valued aspect of a Smart City (i.e., the Smart Environment, Smart Living, Smart People themes) that enhances community wellbeing and livability while also increasing resiliency to flooding. Second, traffic congestion and concerns about roadway safety were linked to the overwhelming use of private vehicle transportation (i.e., Smart Mobility and Smart Living themes). Third, the limited physical and programmatic interaction between project stakeholders (and particularly local universities and the Nava Nakorn community) was well noted (Smart Mobility, Smart People, Smart Economy themes).
Through our regularly scheduled project meetings, the private sector stakeholders outlined four additional themes that they considered important:
(i).
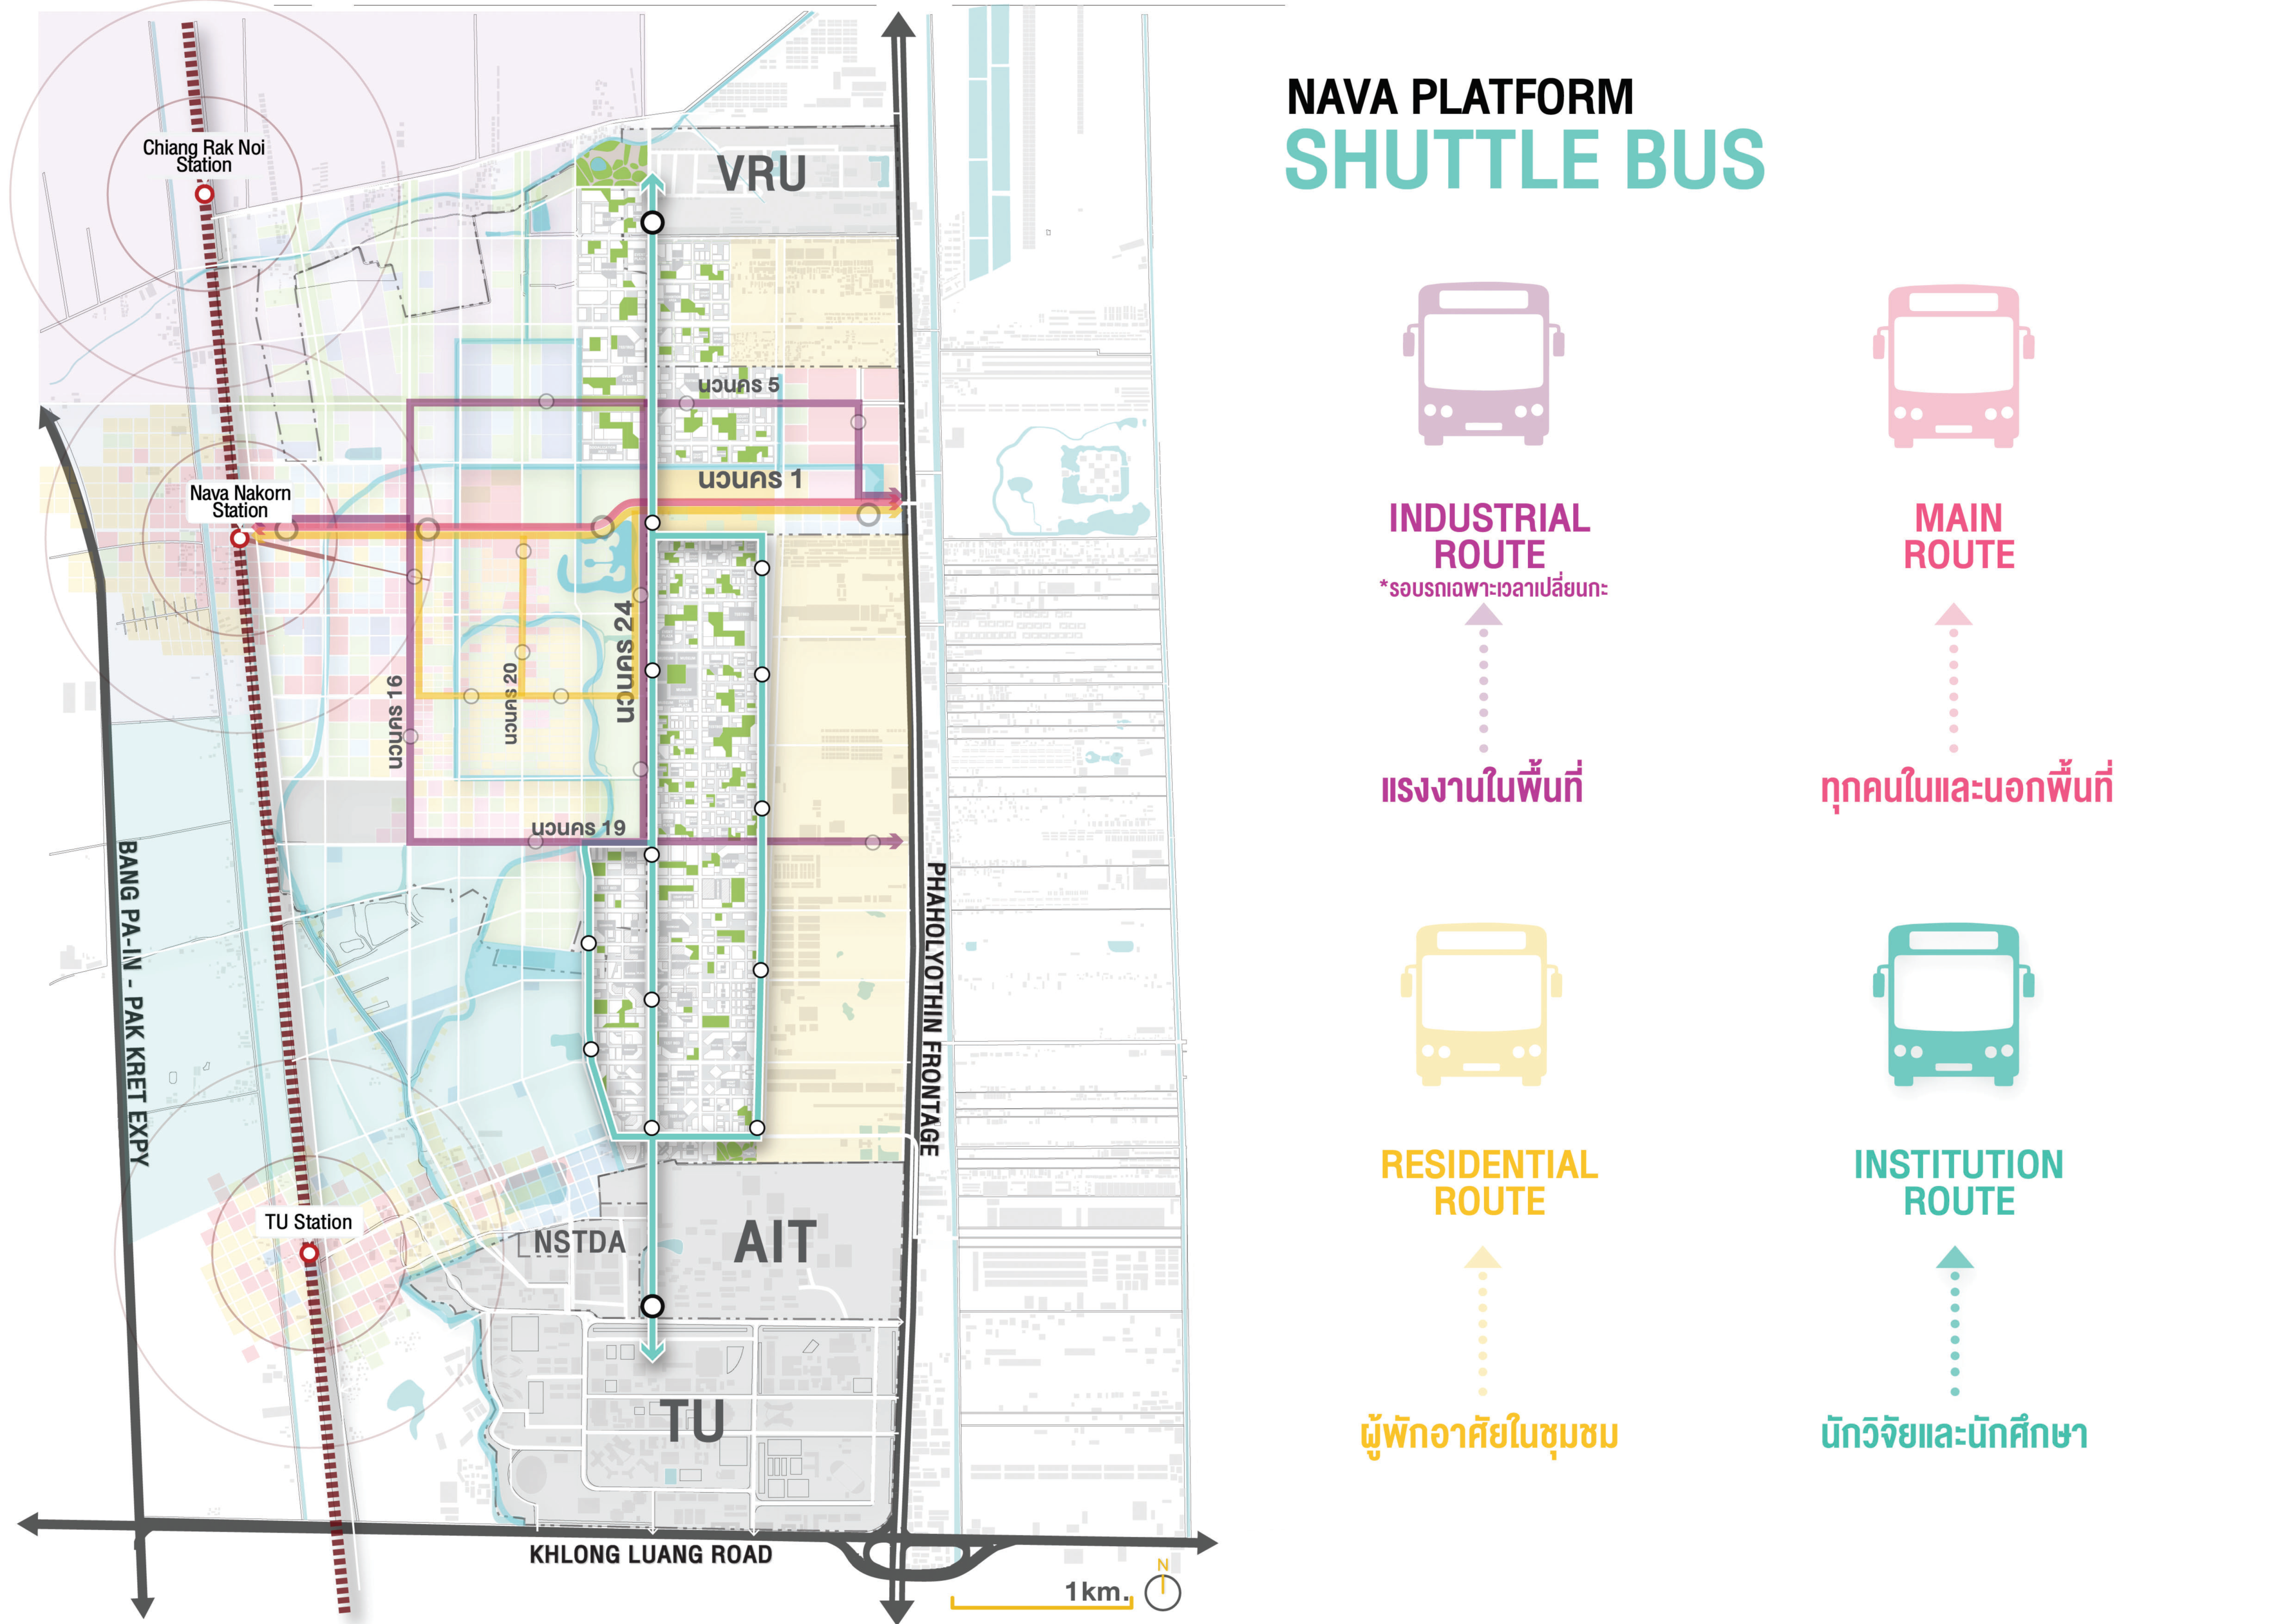
Seamless public transport (Smart Mobility, Smart Living, Smart Environment themes).
(ii).
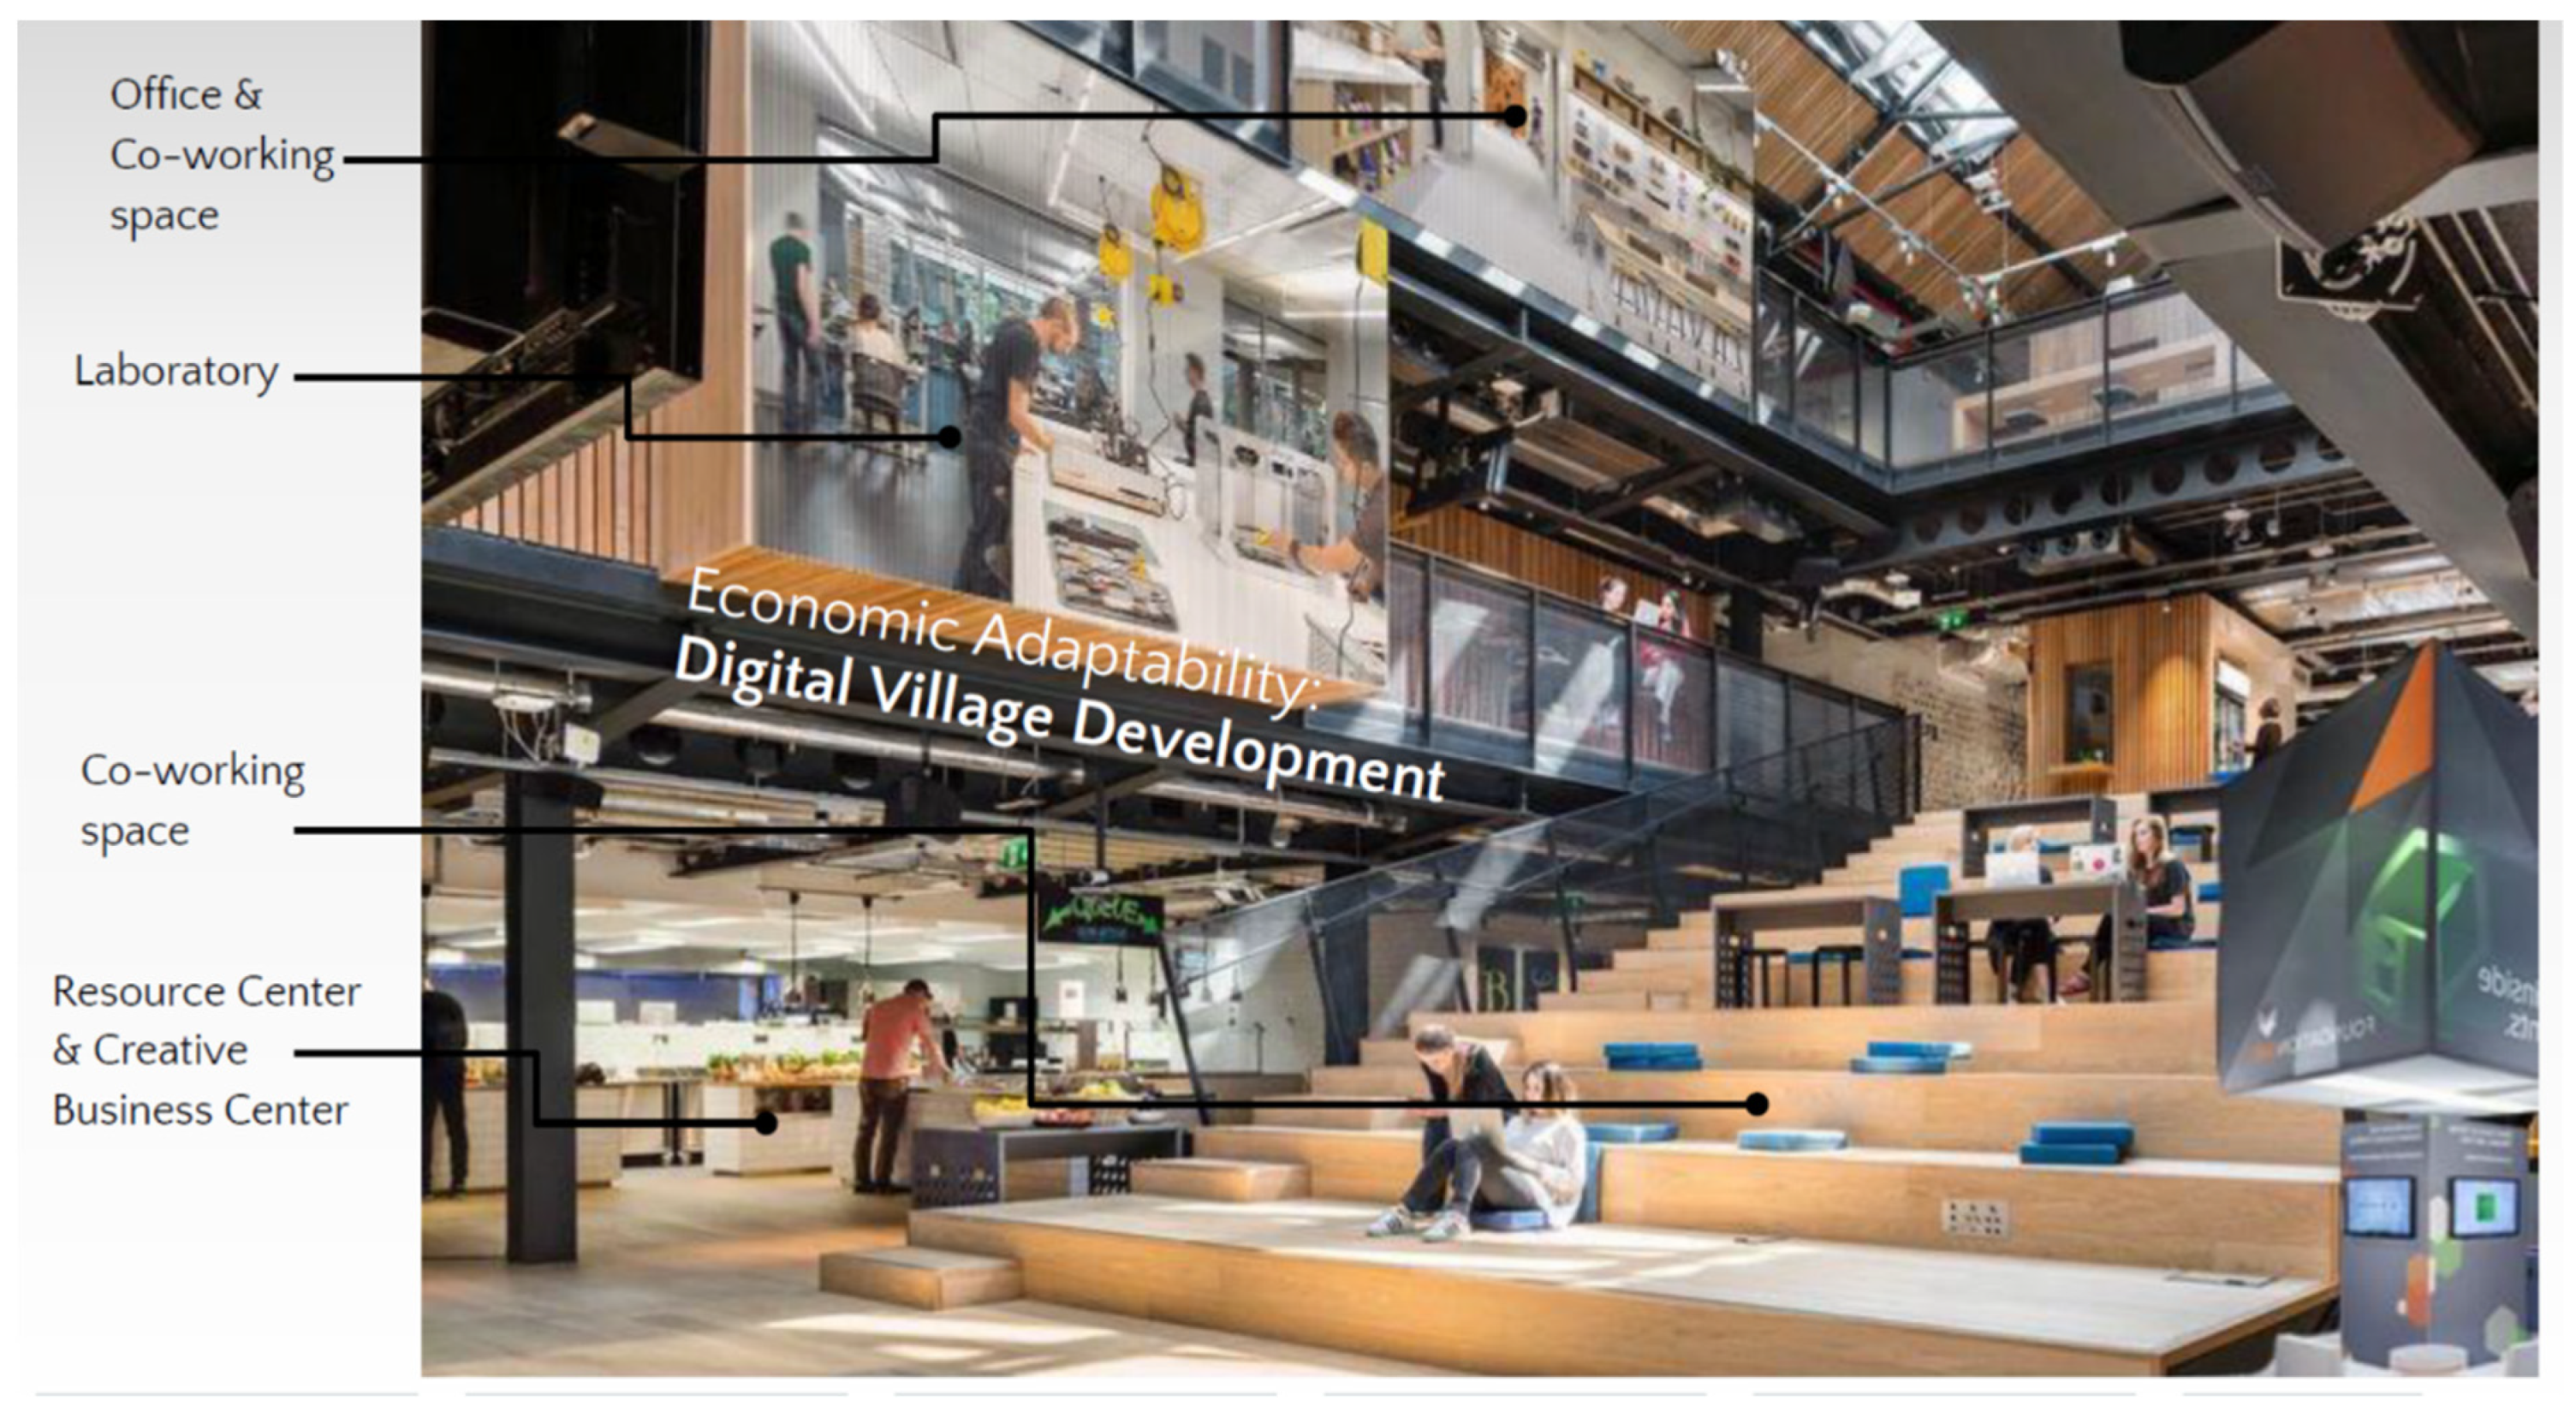
Development of a Digital Village within Nava Nakorn (Smart Economy, Smart People, Smart Living themes).
(iii).
Preparing Nava Nakorn for Thailand 4.0 (Smart Economy, Smart People, Smart Living, Smart Governance, Smart Energy themes).
(iv).
Supporting a sense of community within the ethnic and socio-economic diversity of Nava Nakorn (Smart Environment, Smart Living, Smart People, Smart Governance themes).

3.3. Smart-City Planning and Designs

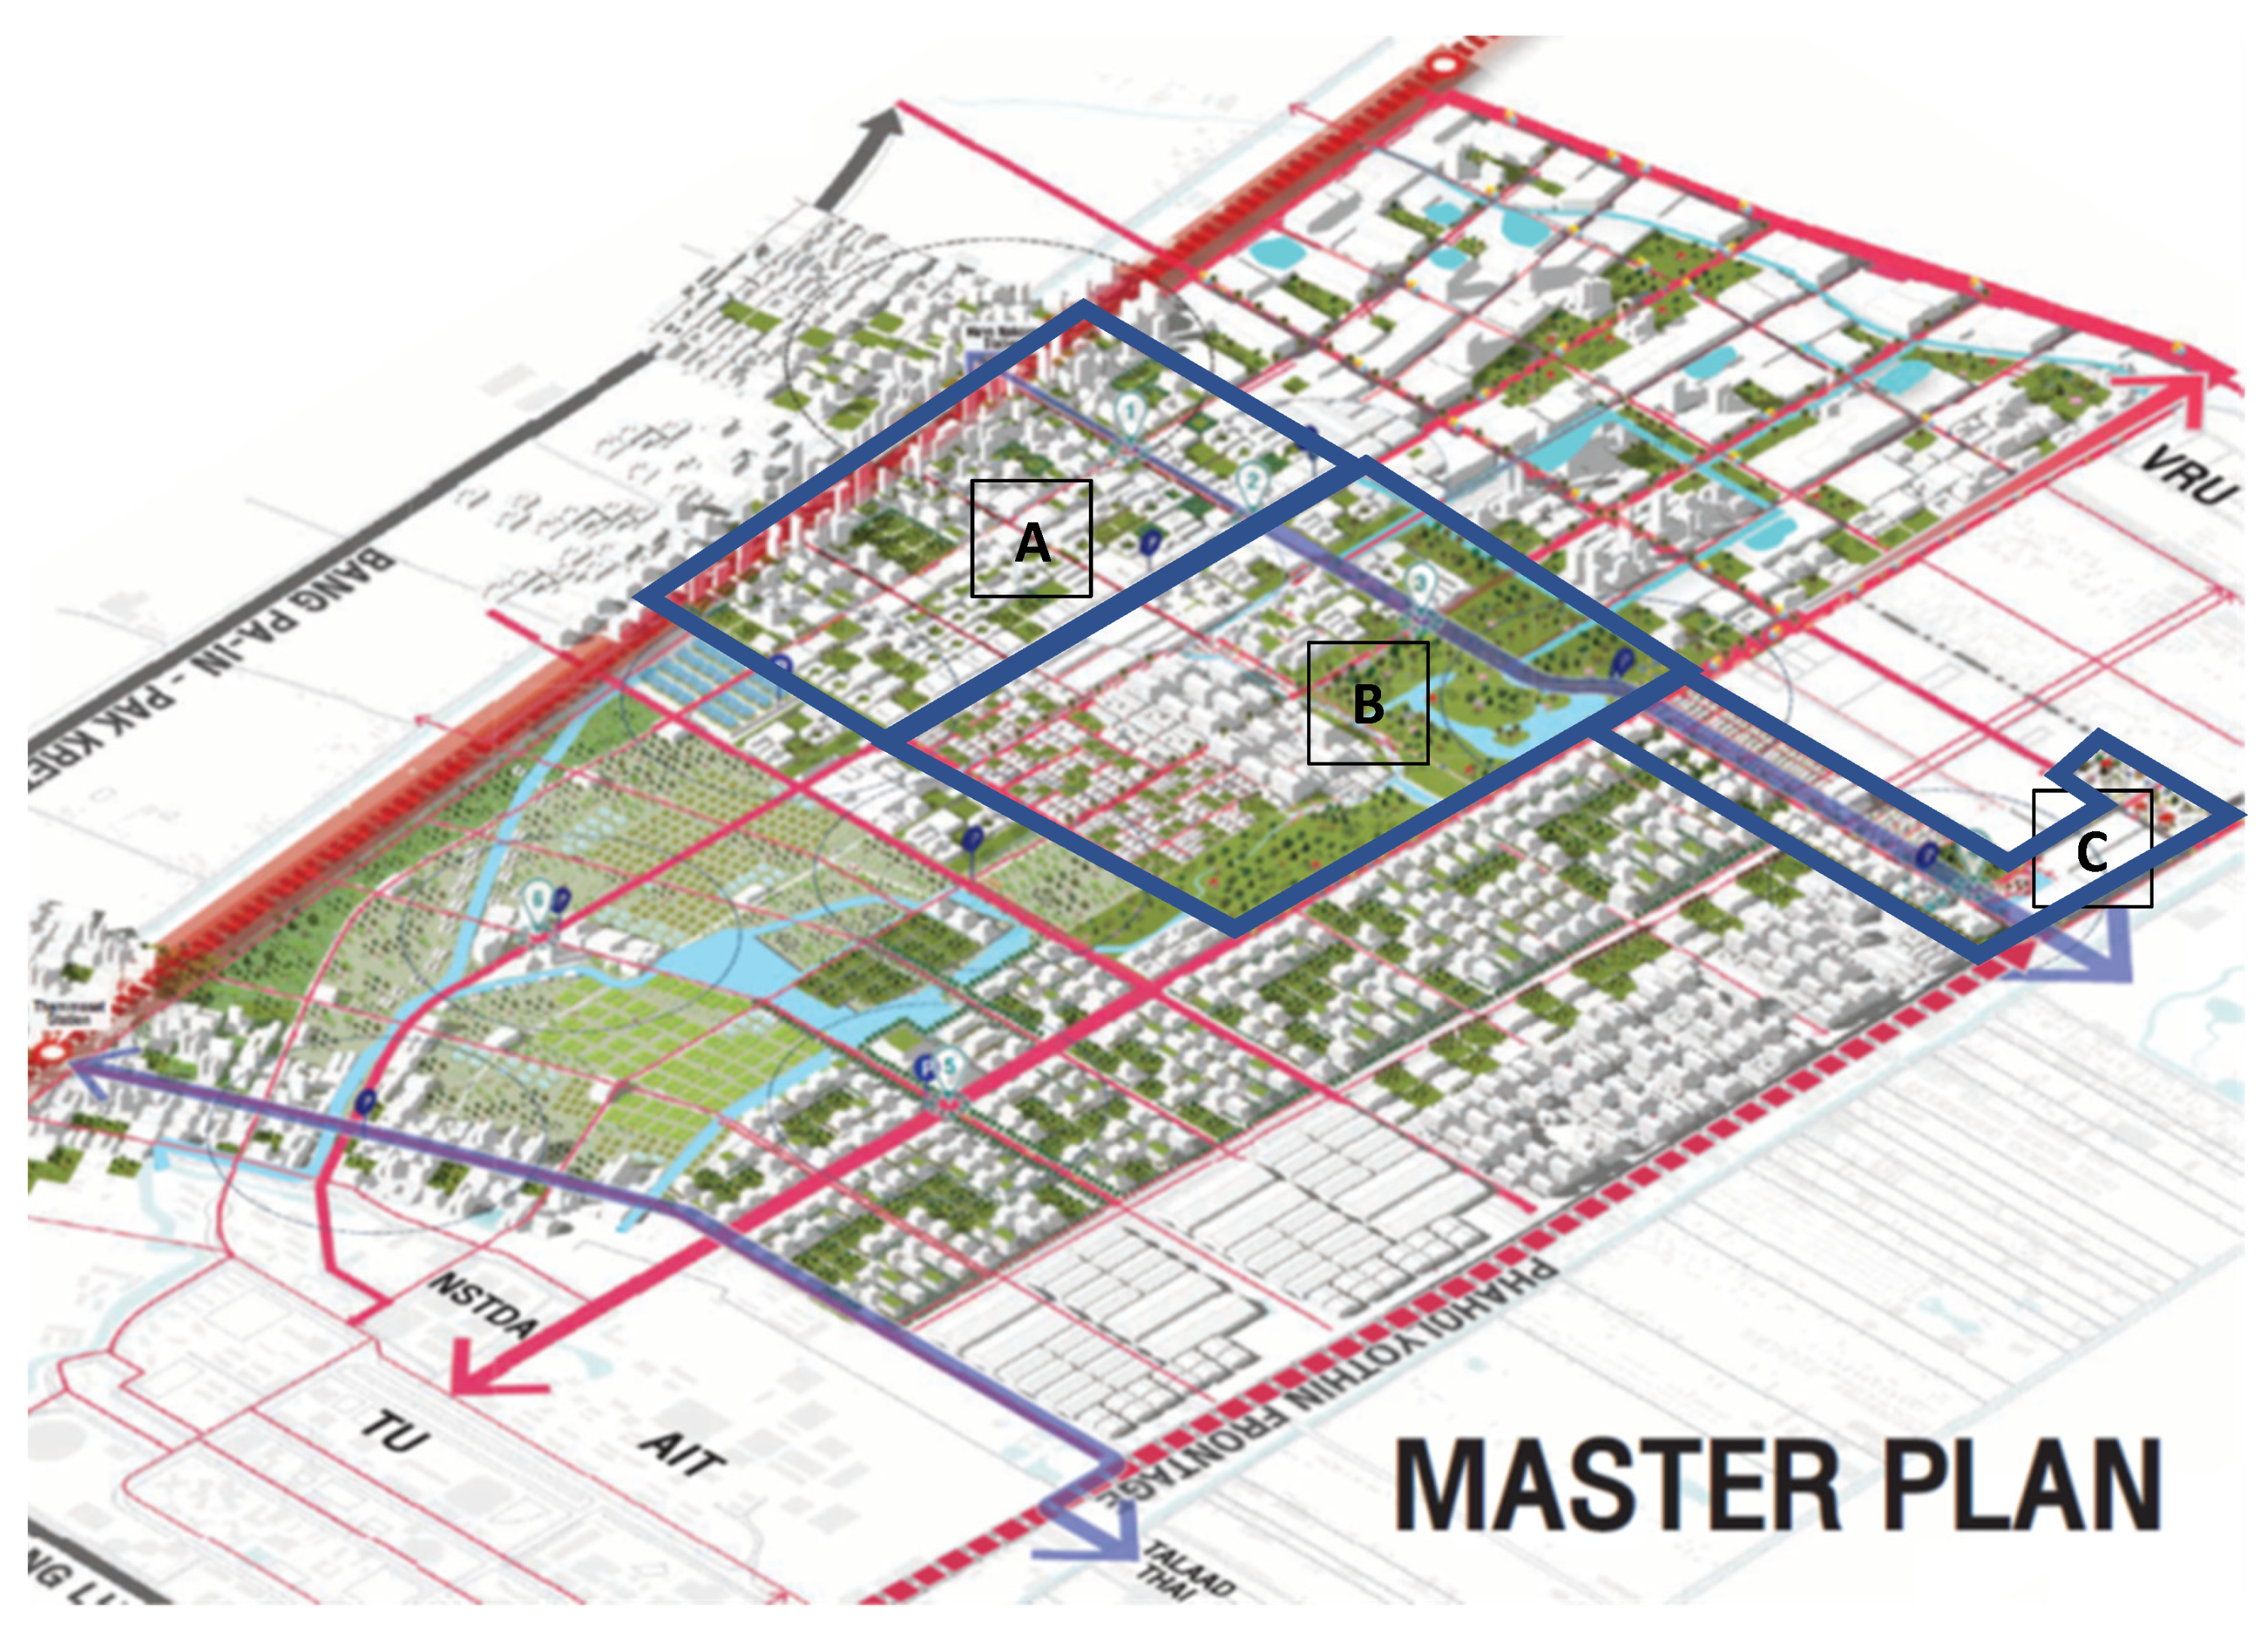
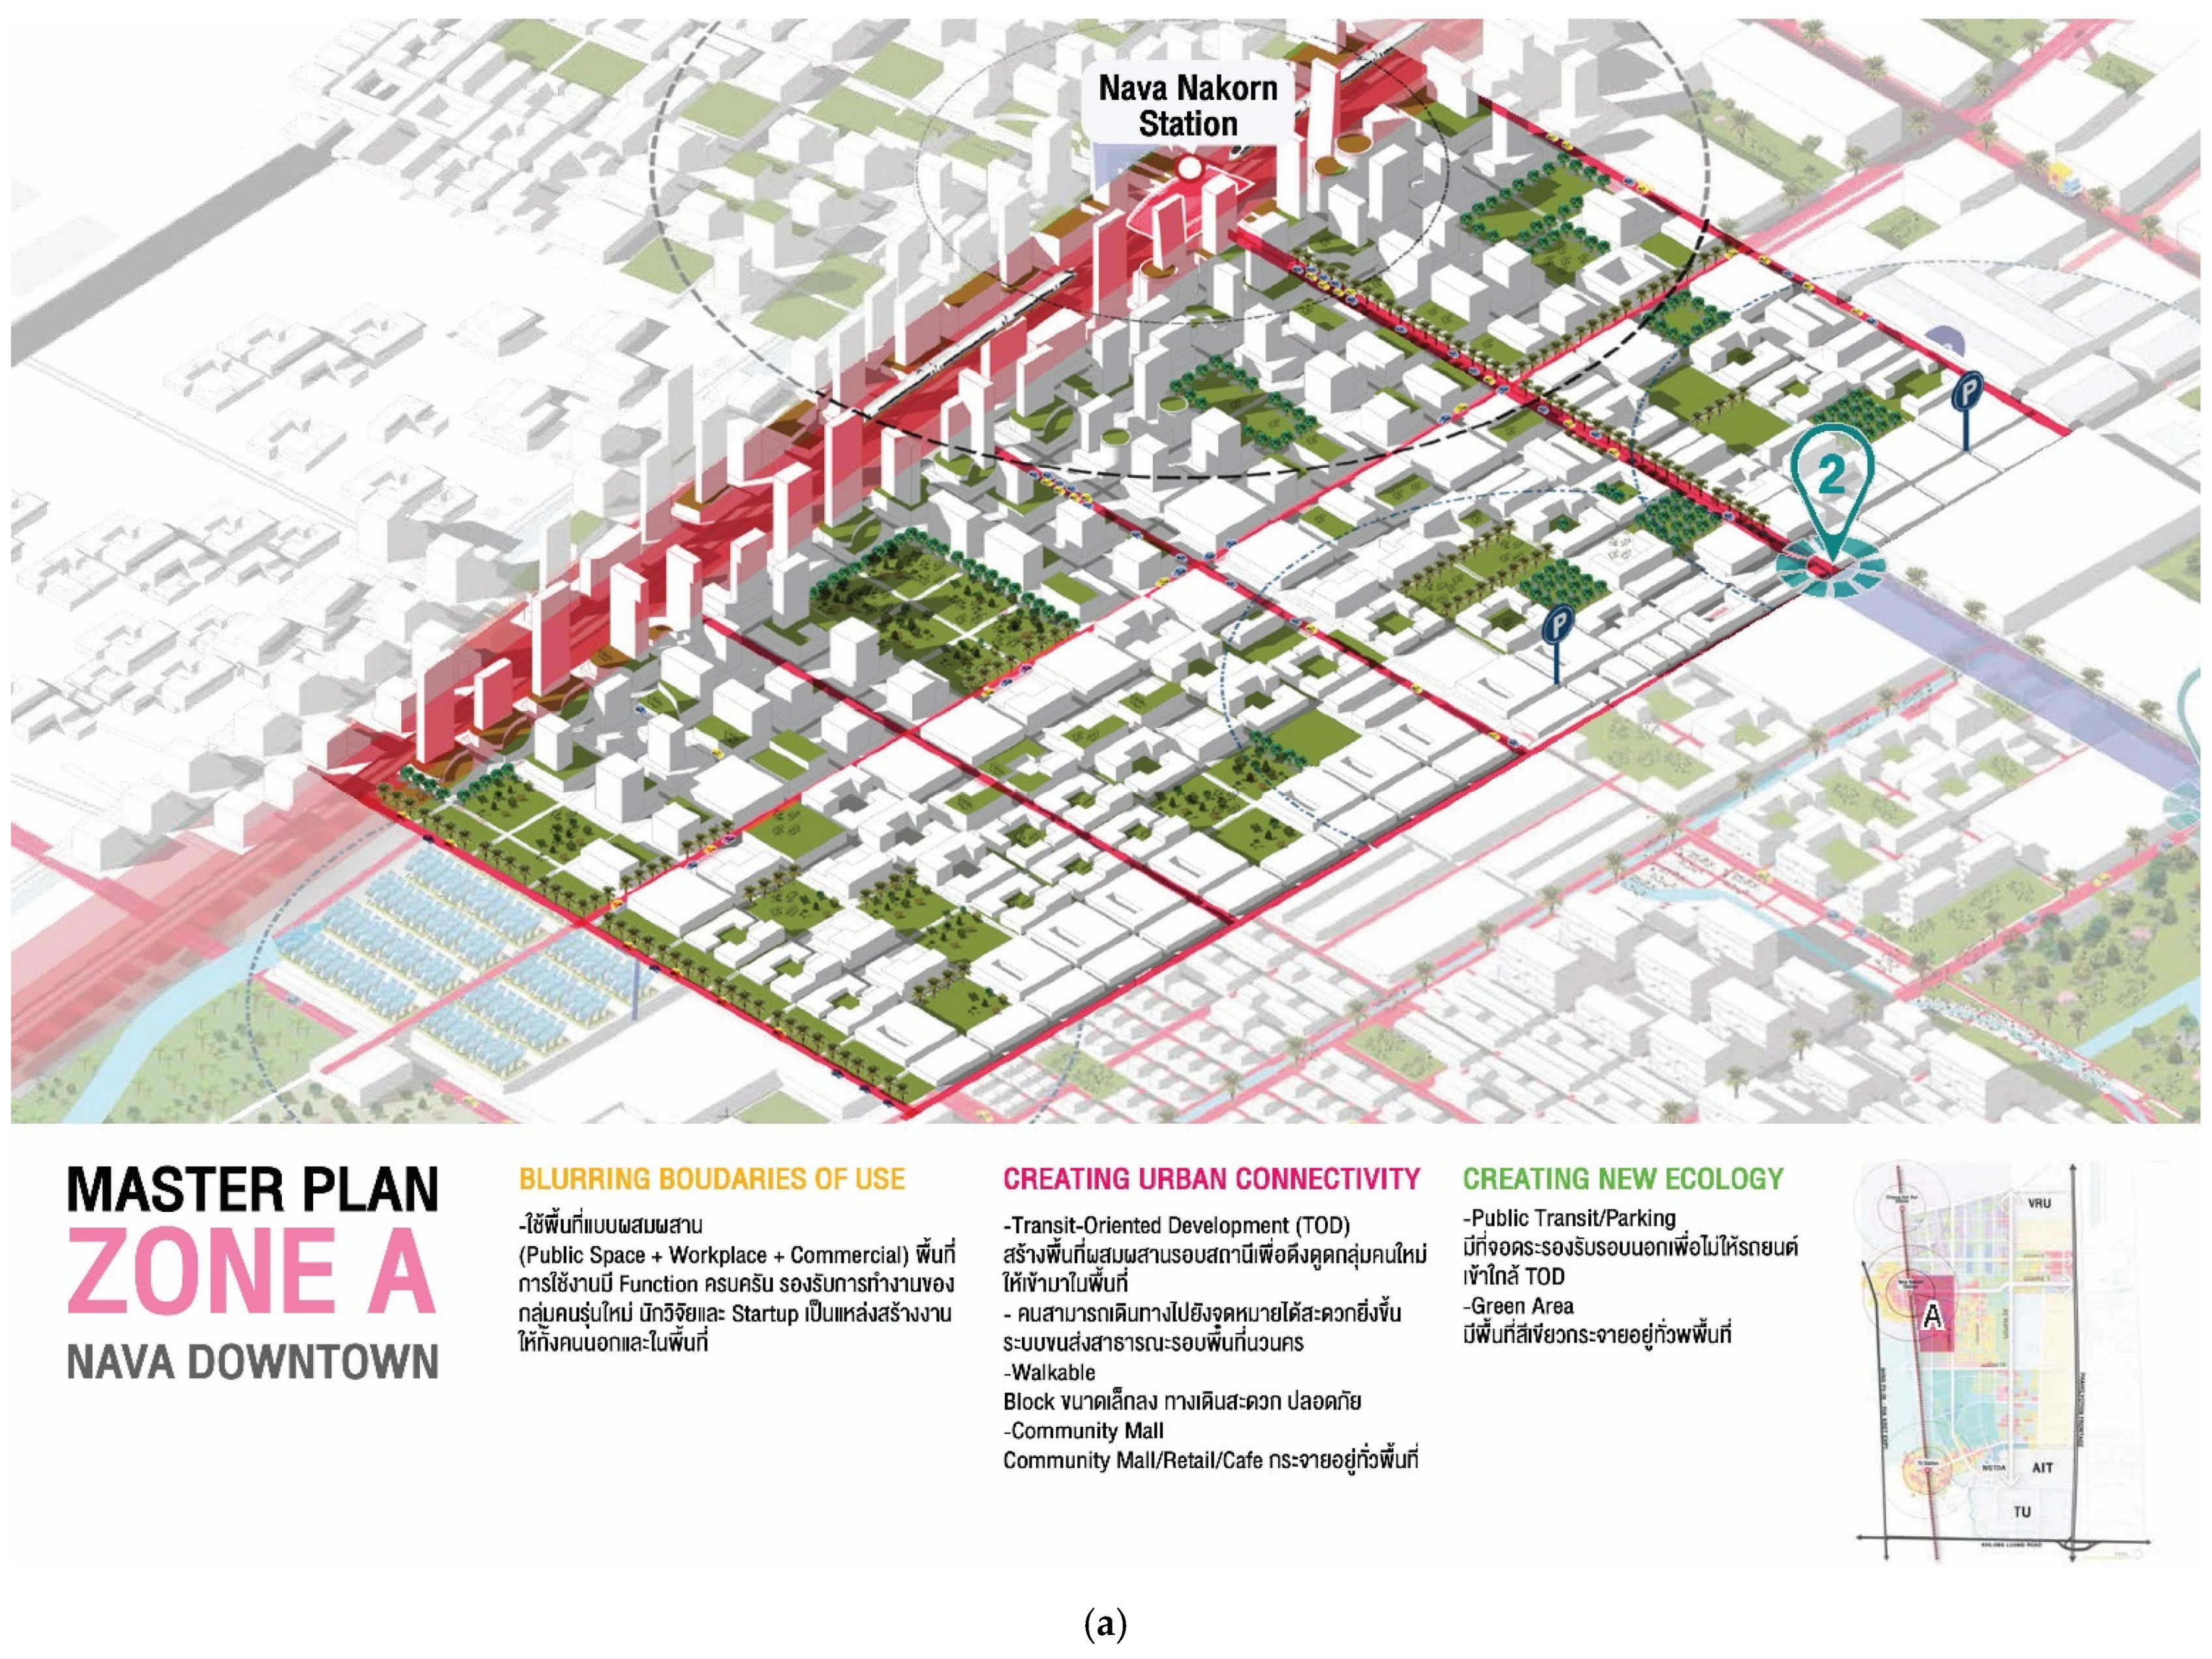
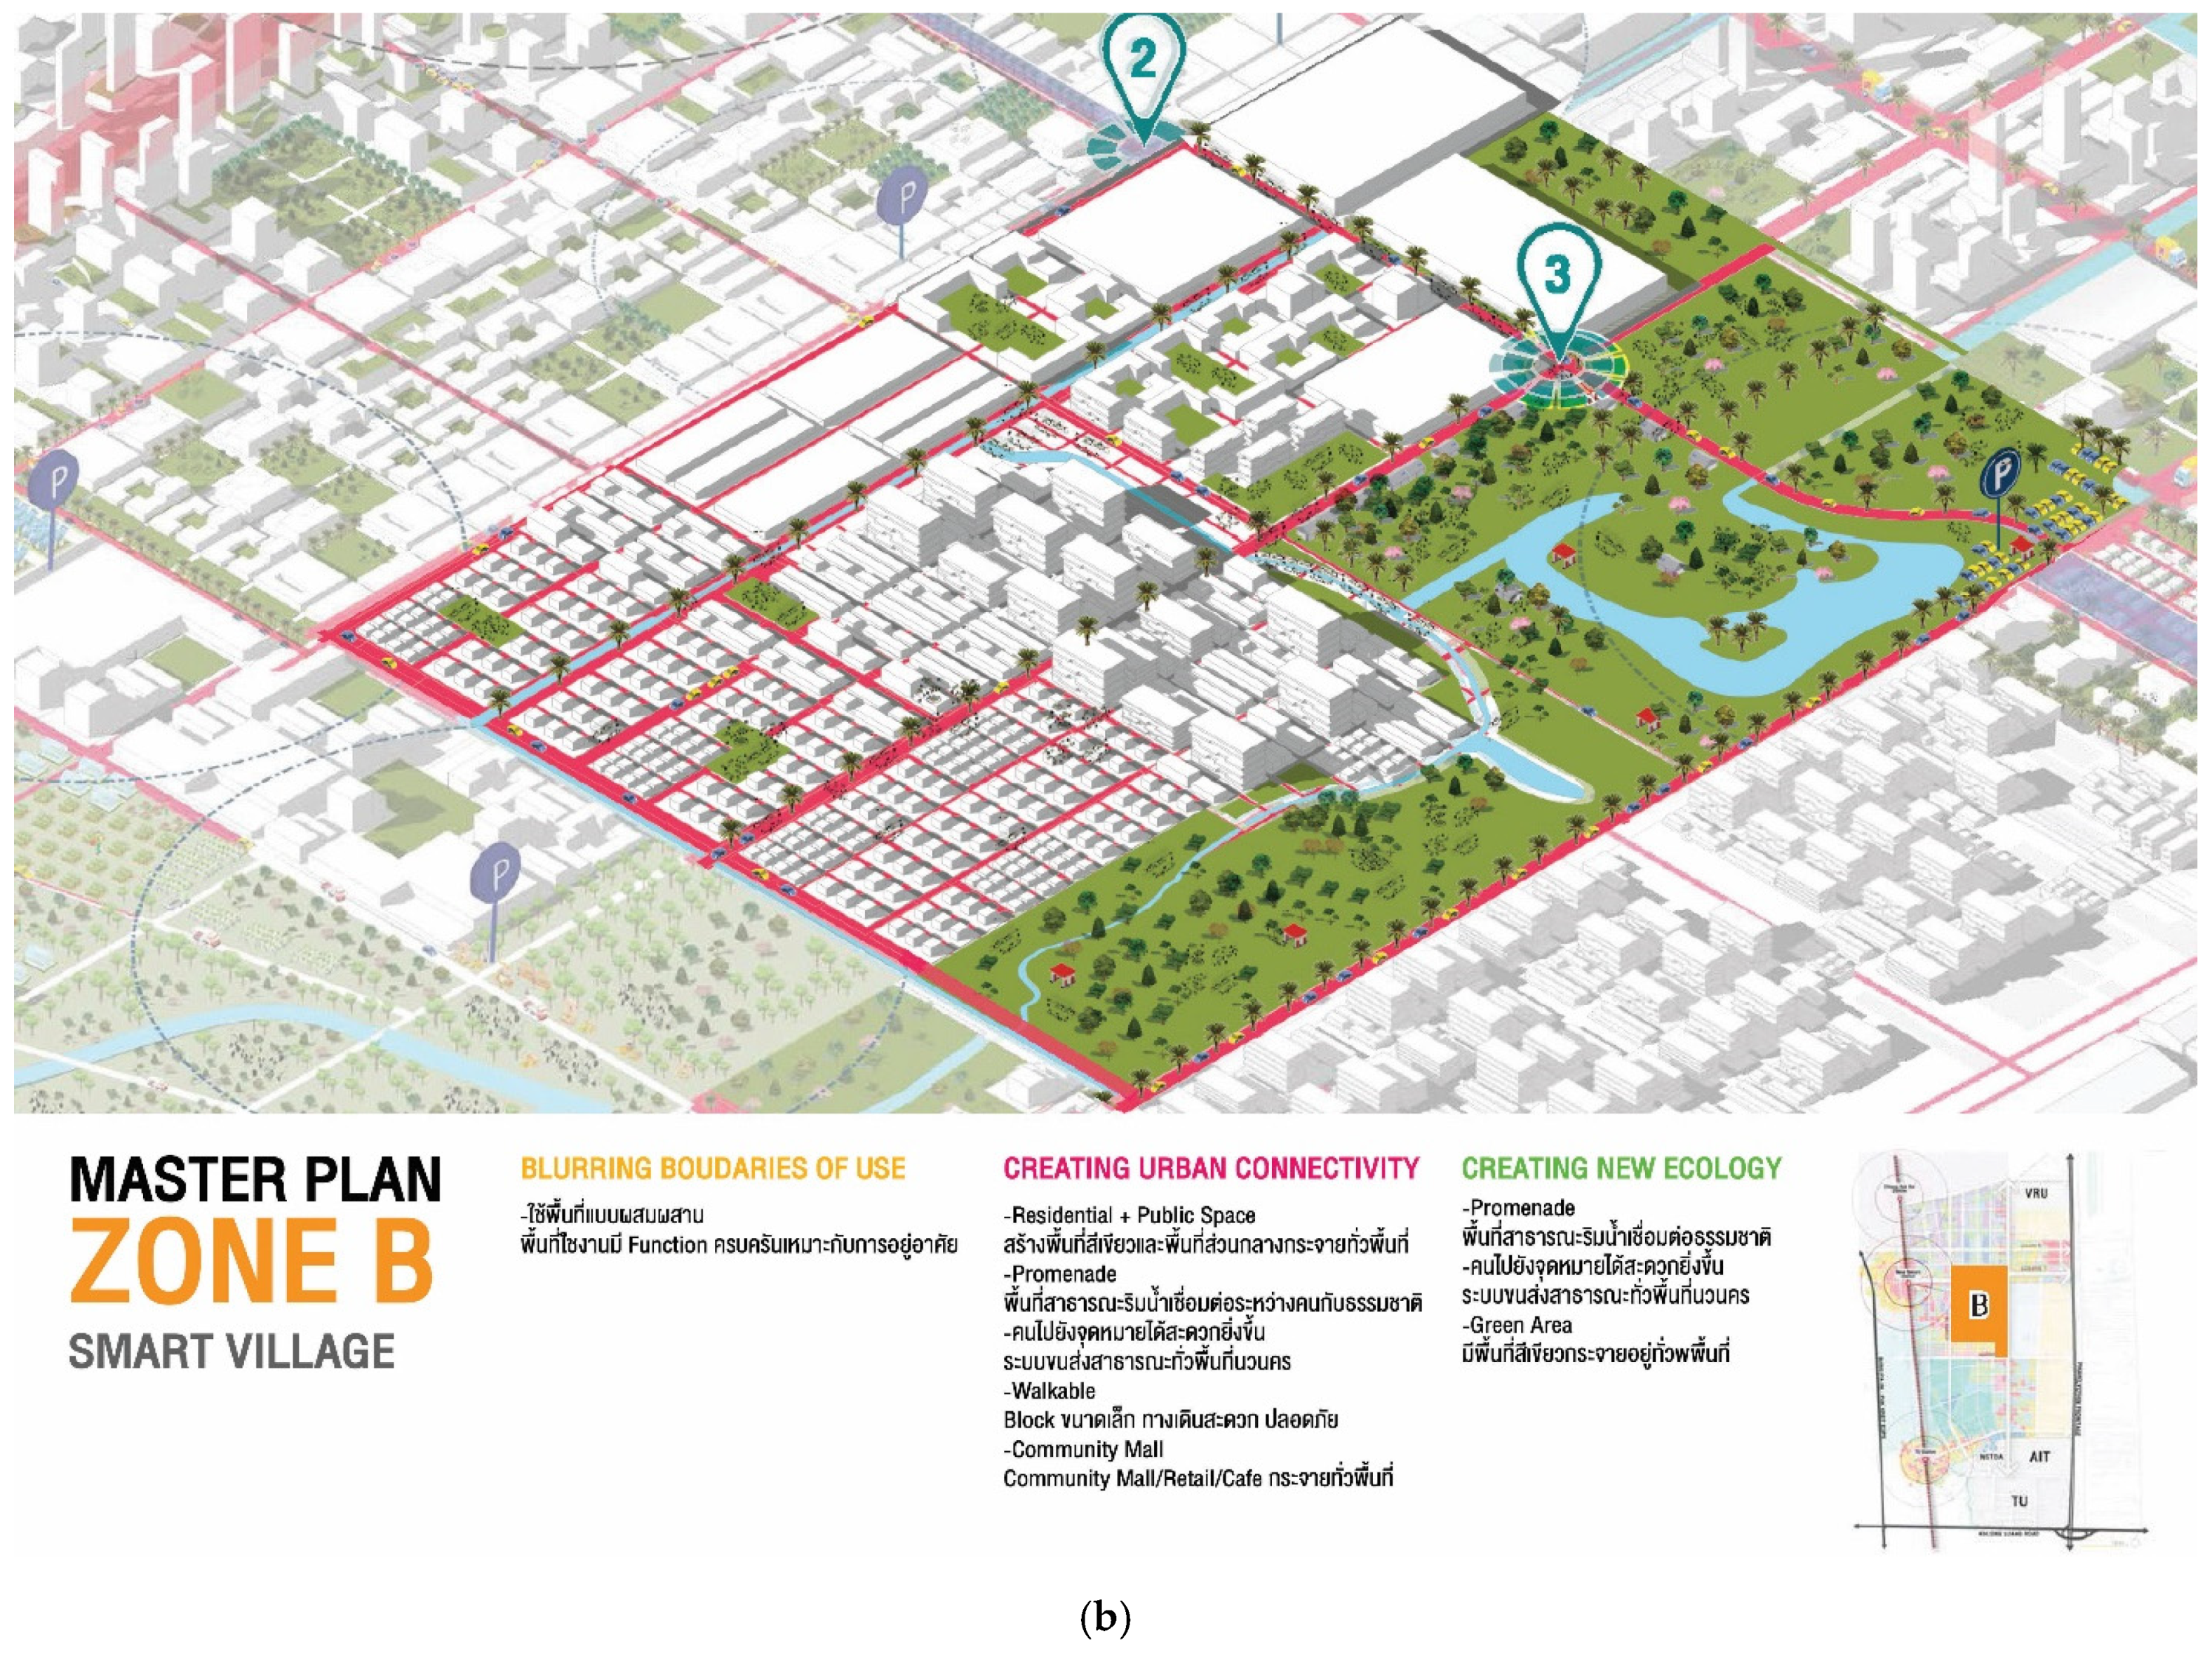
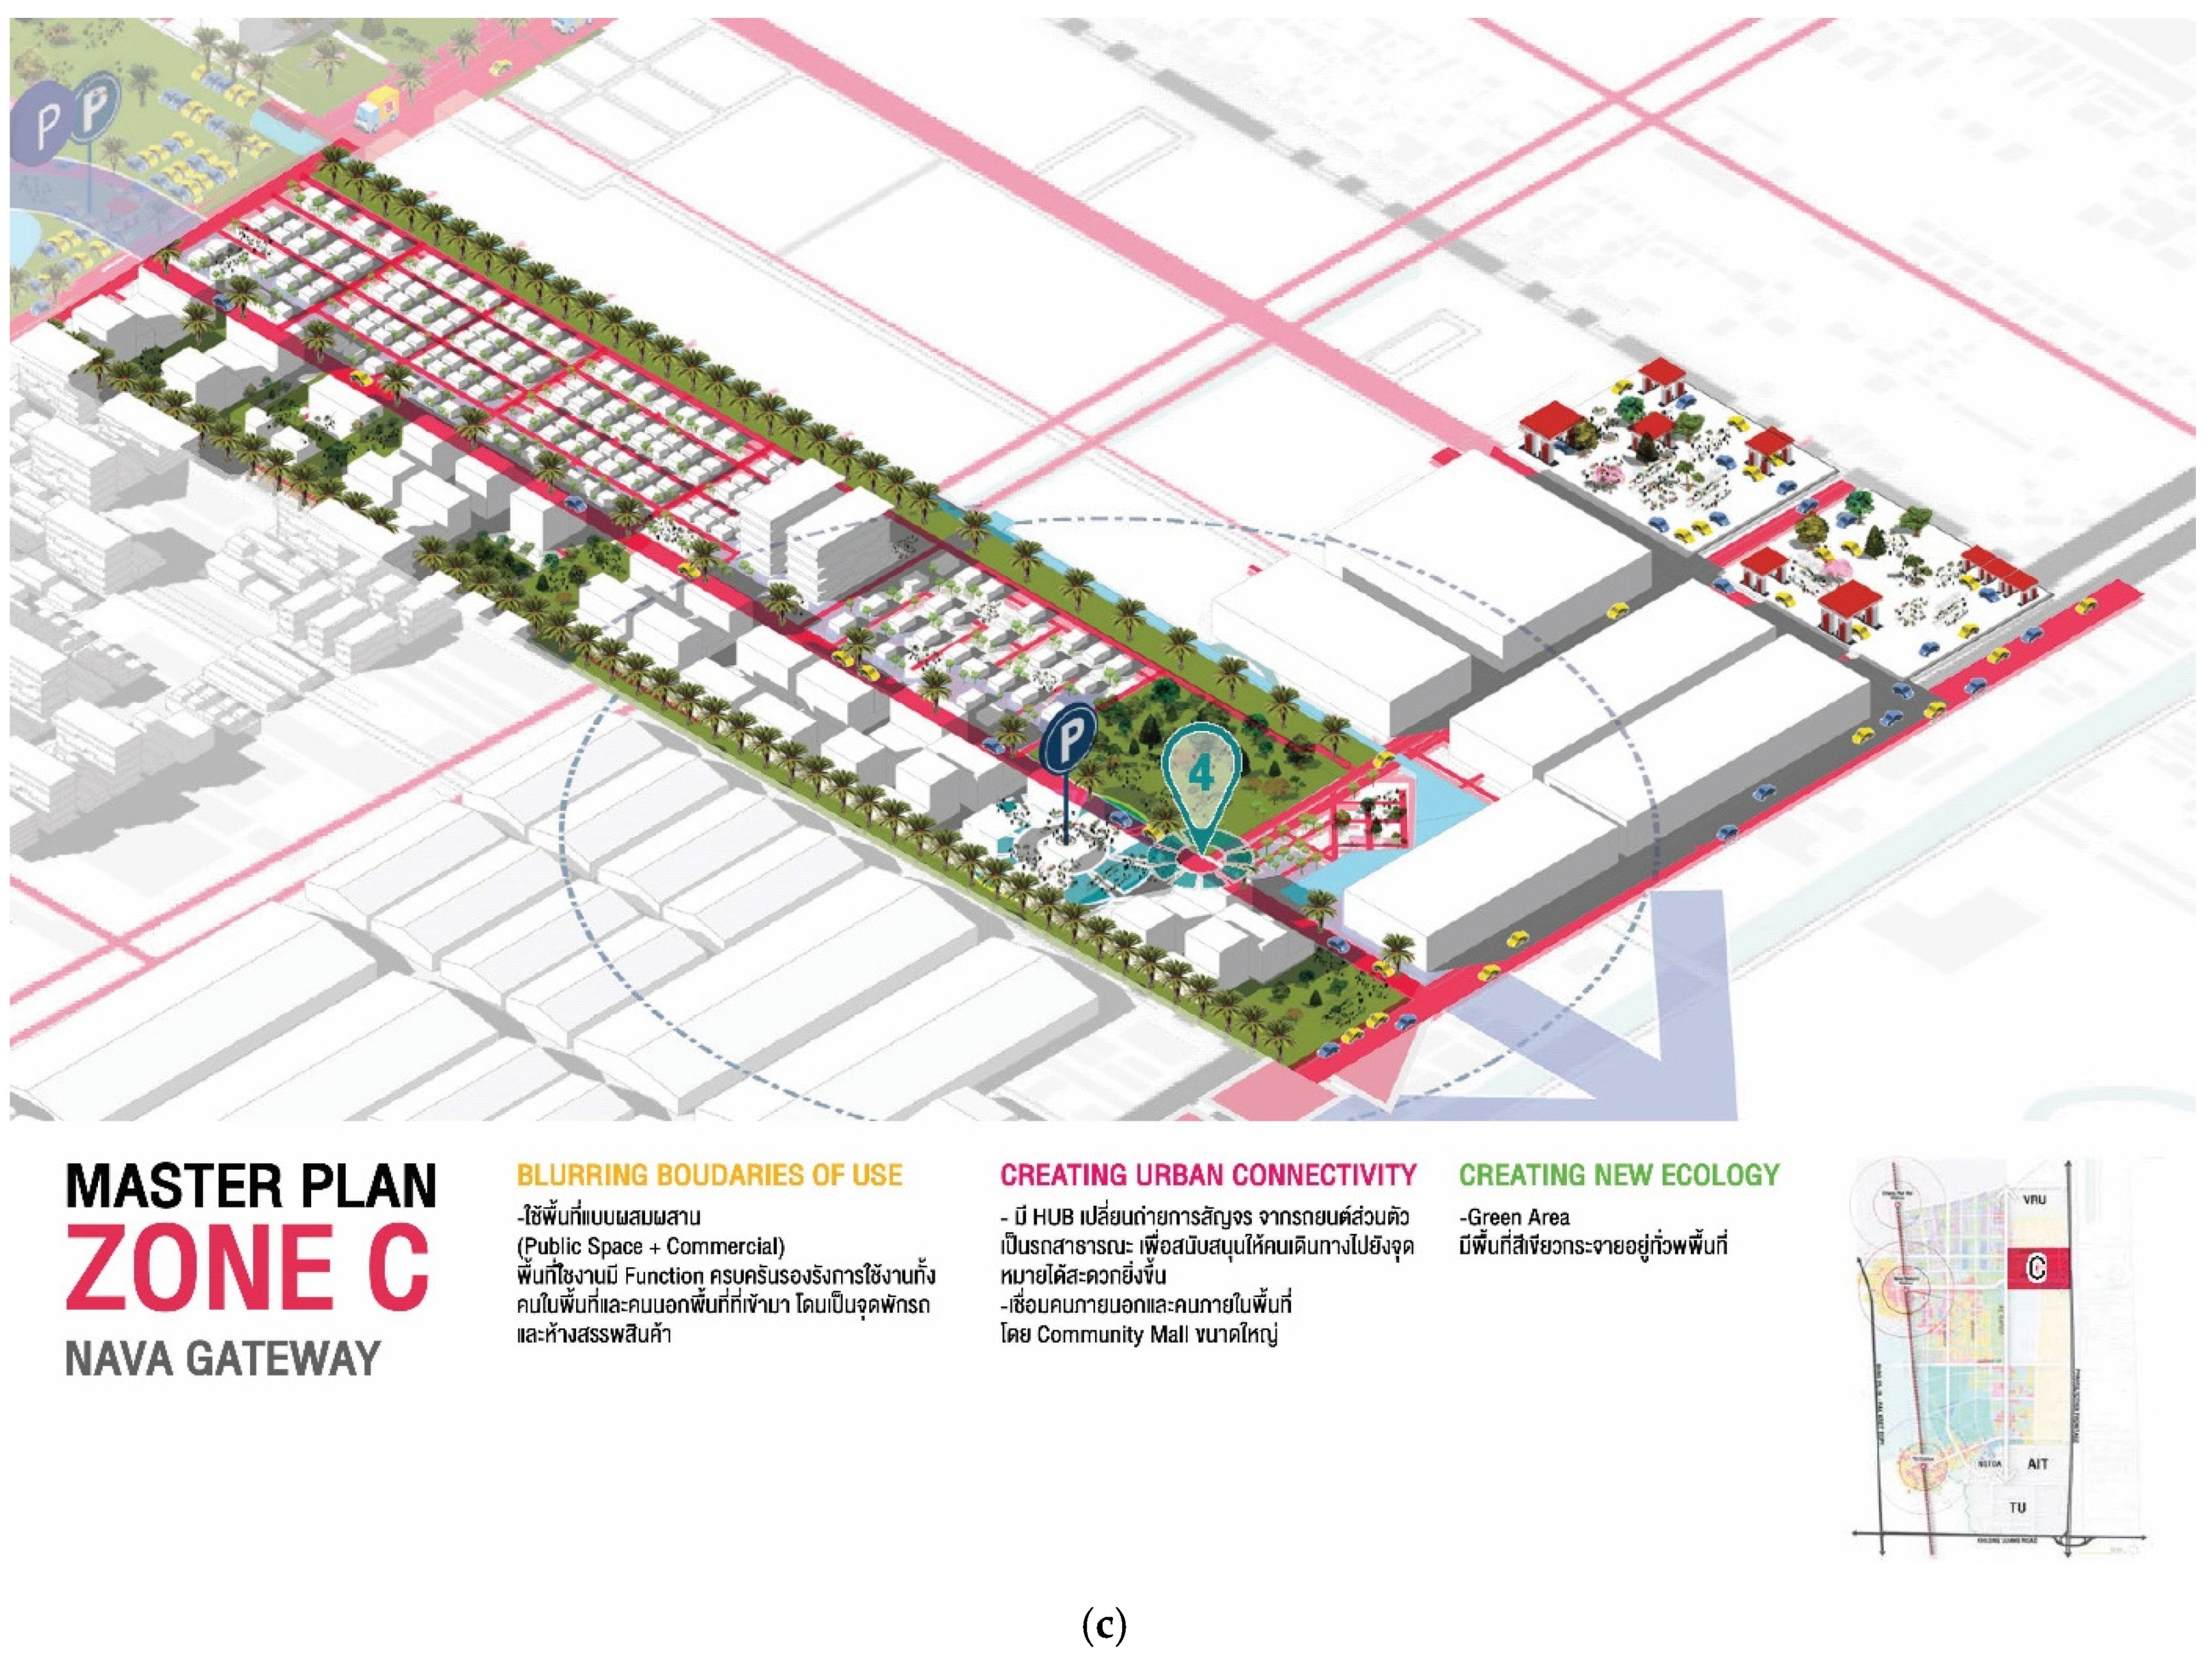
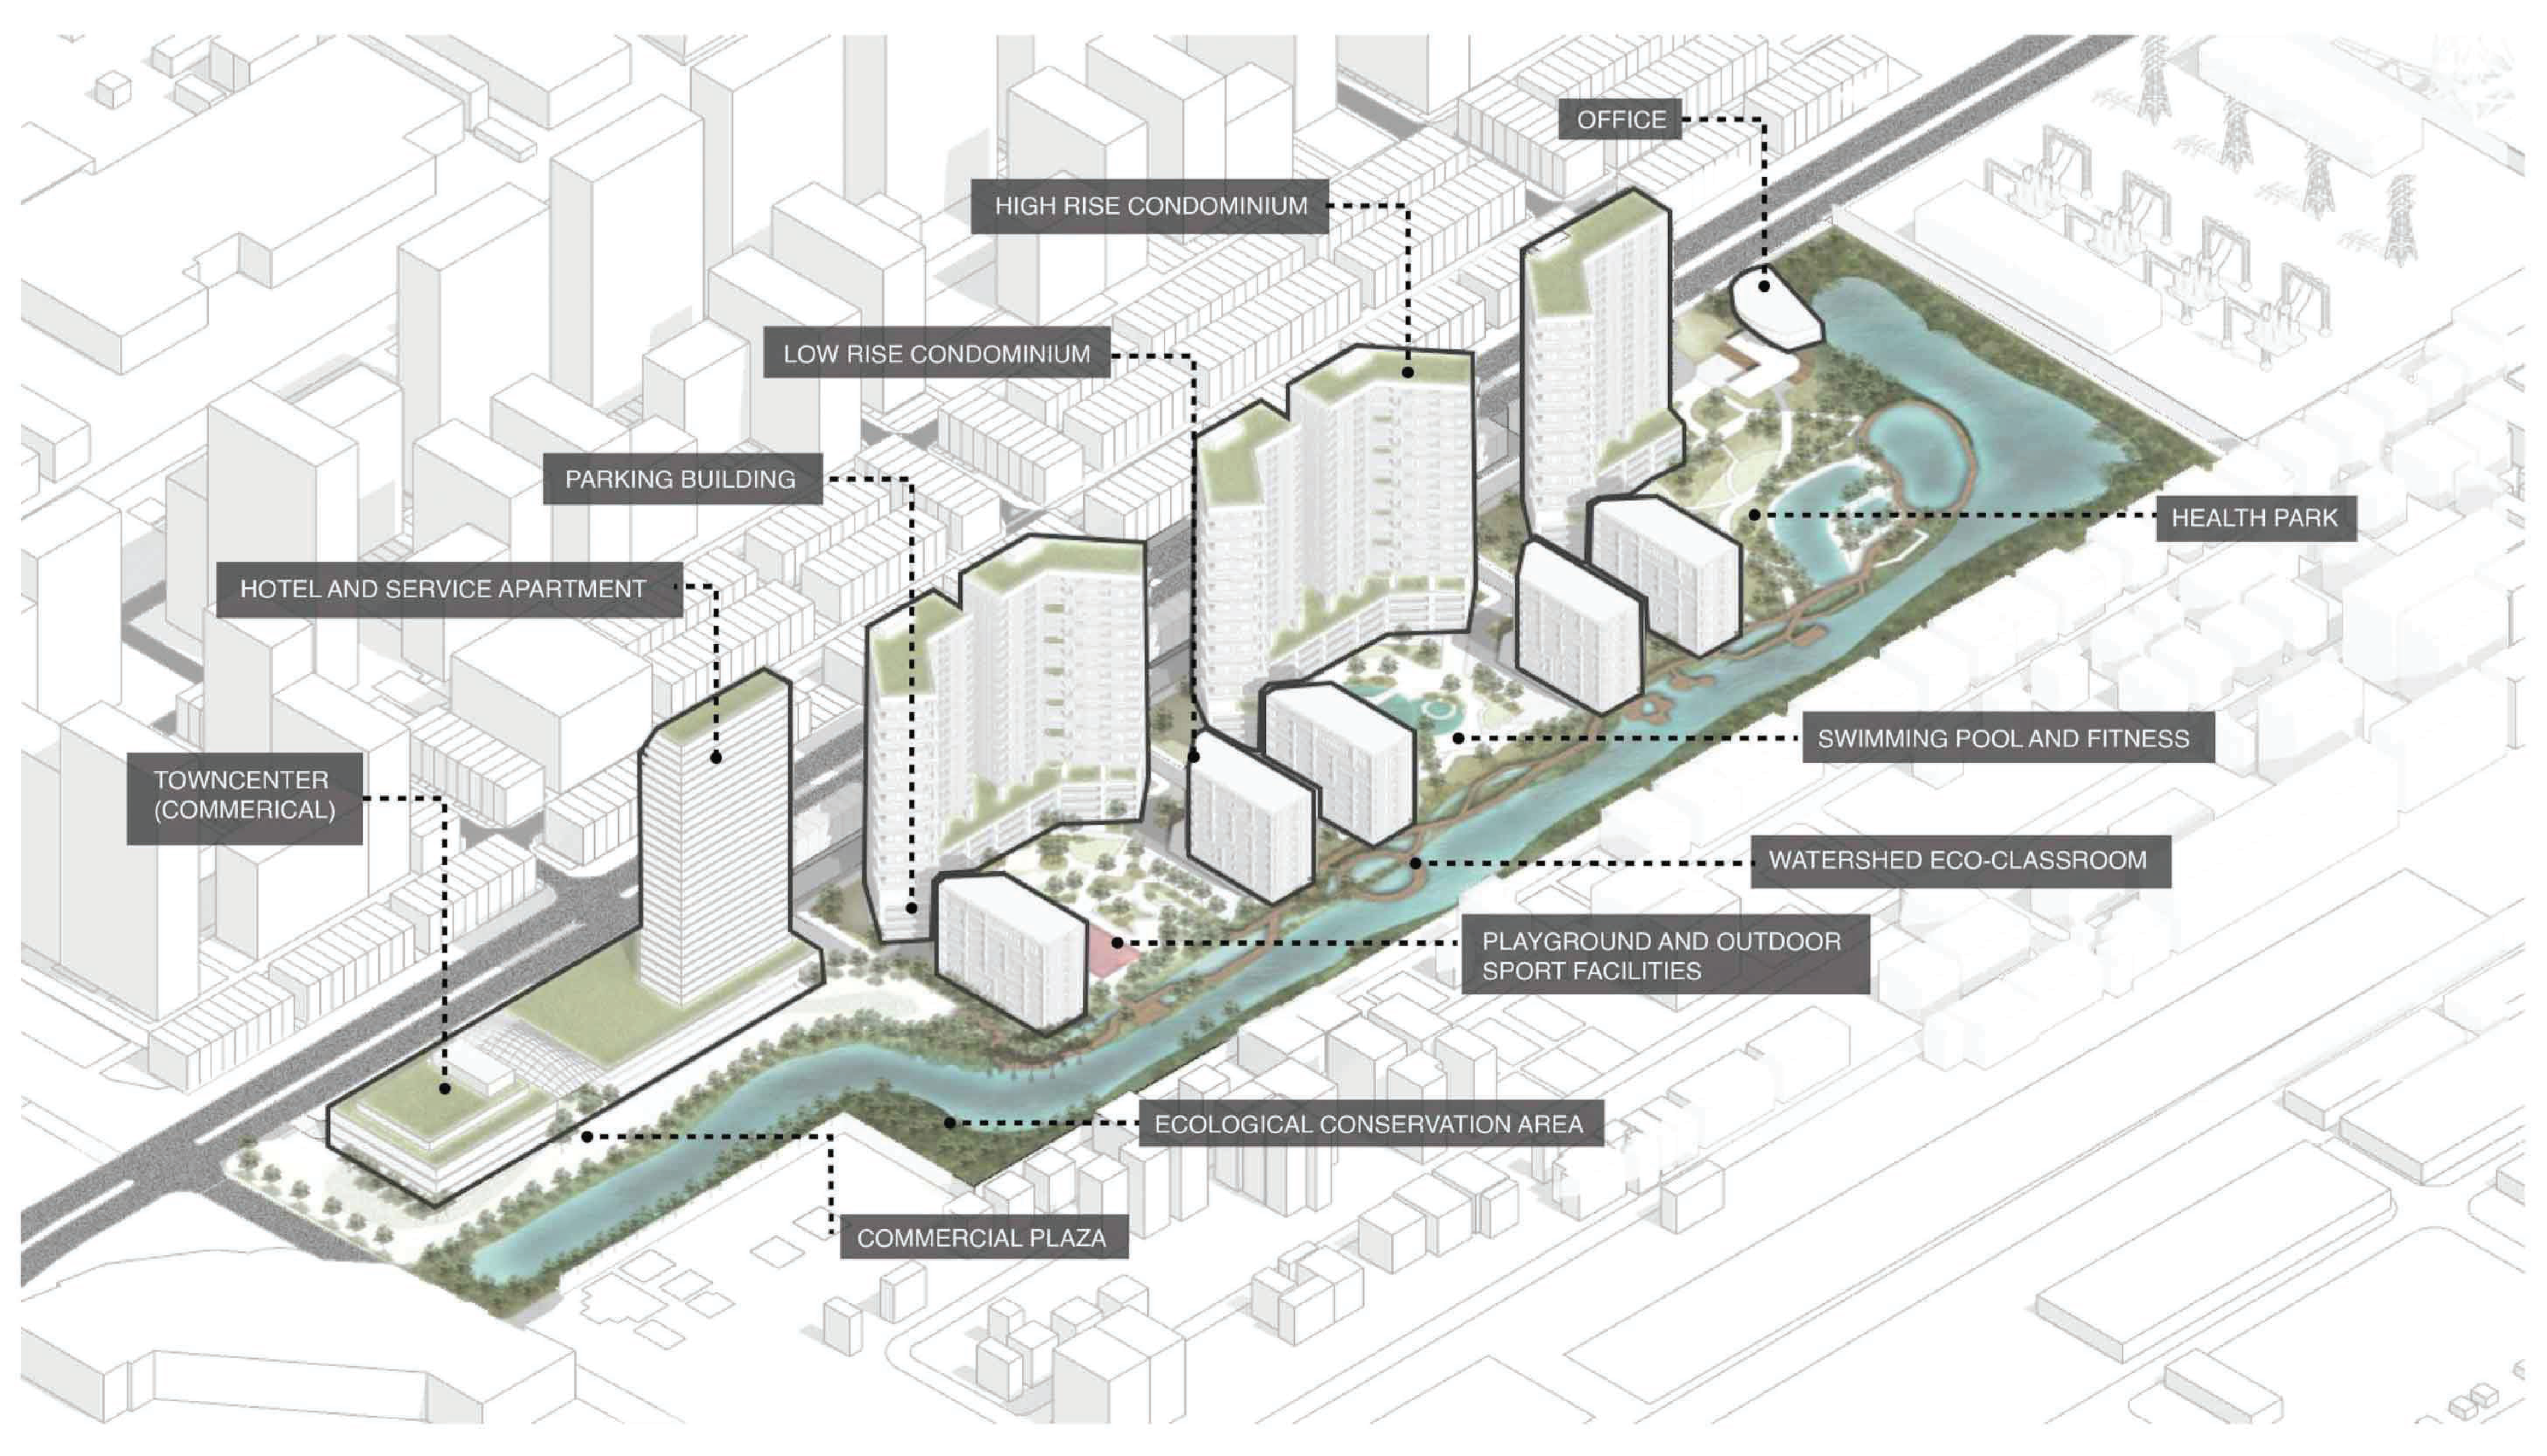
3.3.1. Master Planning and Site-Specific Plans

A total of 41 student planning and design projects were submitted for assessment. Most classes focused on physical planning and design with some programmatic elements, although the Design, Business and Technology Management class also included non-structural design for apps, based on gamification and customer journey theory, to manage the Nava Nakorn environment and to encourage public bus ridership. The plans and designs frequently integrated multiple Smart City pillars. It is not possible to present all submitted visions herein and instead we review plans and designs that reflect the broader, superblock scale, those that provide a more detailed view within Nava Nakorn, and finally, an example of non-structural design.
Figure 3 and Figure 4 summarize the current land use and a vision of possible land use by 2060, focusing on the VRU/Nava Nakorn/Thammasat University corridor. Greater green space/public space is represented throughout the superblock, as guided by the findings of the community surveys. Emphasis on green space is a trend that is also consistent with New Urbanism and has gained some focus in Southeast Asia [85,93,94]. A number of Smart City indexes have included a measure of green space as being a positive indicator of “smartness” [61,95,96,97]. The role of green space planning in accommodating the new normal of COVID-19 is also an emerging theme, particularly with respect to green space form, distribution, connectivity, and resilience [98,99,100]. Interestingly, Ciupa and Suligowski [101] found that those counties with a higher number of green-blue spaces in Poland had a significantly lower total number of COVID-19 infections and deaths.
The community surveys identified a general perception of inadequate green space and public space. Figure 5 summarizes one vision of green space/community space for the heartland of Nava Nakorn. This design emphasizes the enhanced opportunity for a variety of community activities at an outdoor community-events center that would be inclusive of the diverse ethnic and socio-economic demographics, which is an issue of concern identified by Rigolon et al. [102]. Community activities may include cultural festivals, food fairs, holiday events, and concerts. The eco-park and community park areas would provide healthy recreational and social space as well as enhancing biodiversity. The collection of green spaces in Figure 5 provides flexibility and resiliency within the new normal COVID-19 era, as some areas are smaller, calming nature areas, while the larger outdoor community-events center would have sufficient capacity to accommodate larger crowds under non-restricted times, but also the opportunity for social distancing of smaller groups should such measures be re-enacted. The theme of connectivity is emphasized in Figure 5; connectivity of WSUD features and drainage through the heartland of Nava Nakorn for sustainable water management, but also connectivity with respect to nature trails, walking, and bicycle paths that will facilitate the flow of people to and from nearby residential and commercial areas (including a transportation hub for local bus service). In a user survey of public spaces in Tokyo, Neto et al. [79] found that tree-coverage density was the best predictor of desirability, but greenery and street furniture were also important. These results from Tokyo are consistent with the findings from our community survey and were incorporated into the physical designs presented in this paper.
The idle land in Figure 3 and Figure 4 would be returned to agricultural productivity that in some way represents a new Agropolis [94], a move towards buying local, and the so-called Pathum Thani Market 4.0 [103]. It is possible that some of these new agricultural opportunities could be integrated with housing developments as a form of community gardens [104,105] to enhance community resiliency through greater food security and diversified economic opportunities, but also to increase sustainability of the peri-urban mosaic.
Figure 3 and Figure 4 underscore the industrial transition from Thailand 2.0 to Thailand 4.0, with greater automation and higher value-added products requiring higher skilled labor, a concept that was reflected in the ideas shared by the private sector partners in this project. Jones and Pimdee [106] characterized earlier development phases as Thailand 1.0, which focused on increased agricultural productivity through mechanization and best-farming practices, Thailand 2.0, which was light industry using inexpensive labor to turn raw materials into finished goods, specifically in the textile and garment sectors, and Thailand 3.0, which was advanced industry that included the assembly and production of higher-value products such as computer disk drives and automobiles. Thailand 4.0 is expected to transition the labor force into “knowledge workers”. Jones and Pimdee [106] note that the Thai government will continue to develop some traditional economic sectors, but will also expand its attention to robotics, aviation, biofuels, and biochemical and digital technologies, thereby encouraging economic resiliency. To support the Thailand 4.0 future, the Thai government must encourage entrepreneurialism, as well as focusing on ICT (including the Internet of Things (IoT), big data, and artificial intelligence (AI)). The education sector will be essential in providing the physical and digital infrastructure and human capital needed to support the transformation [106,107,108]. It is the goal of the Thai government to build social security through the equitable distribution of income, opportunity, and wealth, operating under a principle of “moving forward together without leaving anyone behind”, and creating sustainability through environmentally friendly development (i.e., the so-called Green Growth Engine). Despite these sound development goals, Chiengkul [109] noted that Thailand 4.0 will face significant barriers to implementation, including the persistence of structural hierarchy and uneven development in the global political economy, a social and environmental agenda that is not well developed within the industrial-strategy framework, the ongoing concentration of political and economic power in the country, and an unequal access to the policymaking process that has led to socio-environmental problems. We believe that this project with the private sector partners is a good demonstration of developing strong social and environmental agendas within industry, which addresses one of Chiengkul’s [109] concerns.
Entrepreneurial activities, including ICT-oriented start-ups, would have an increased representation in the land use mix (Figure 3 and Figure 4), consistent with the Thailand 4.0 vision. With three universities and the Thailand Science Park in the superblock, Nava Nakorn is well-positioned to host these types of new economic activities. However, smart mobility and connectivity are essential to underpin the economic transition. As shown in Figure 6, the extension of the Bangkok Mass Transit System/Subregional Train System (SRT) Dark Red Line to Nava Nakorn is a key element of the smart development vision for the superblock. The terminal station under the currently planned extension is located at Thammasat University. A northward extension of 5.3 km would reach Nava Nakorn and provide seamless commuting opportunities for high skilled workers who may prefer to reside in urban Bangkok. Figure 6 begins to focus the importance of the SRT stop at Nava Nakorn as opening new development space, particularly along the main east–west corridor through Nava Nakorn, and might be considered an example of transit-oriented development (TOD). Figure 6 also emphasizes connections between Nava Nakorn and Thammasat University, AIT, and the Thai Science Park to the south and VRU to the north. These connections may be transportation routes (e.g., shuttle-bus), but also may be virtual or programmatic connections.
Ibraeva et al. [110] noted that TOD integrates concepts from transport engineering and planning, land use planning, and urban design to develop sustainable, convenient, and desirable transportation networks that maximize the efficiency of services by concentrating urban development around transit stations. TOD plans have been successfully implemented in China as an approach to reduce personal automobile dependence for commuting [111], while Kidokoro [112] noted aspects of TOD have been applied in Tokyo, Kuala Lumpur, and Jakarta, and should be an important way forward for other Asian cities. Figure 7 represents an example of a physical master plan for Nava Nakorn and a design vision that emphasizes TOD, while Figure 8a–c show greater detail of the master plan along the main east–west corridor, extending from the proposed SRT terminus. Commercial and residential development within Zone A, attached and adjacent to the SRT station (Figure 8a), is reminiscent of planning in Singapore that includes shopping malls and high-rise apartments, but also open public and green space at many of its mass transit stations [113], linking the CBD with the local town hubs. The Singapore MRT (rail) stations are also linked with a dense bus network to provide seamless transition from home to CBD to home. This concept is captured in Figure 6, but in this case the travel would be from residential areas in the Bangkok core to the workplace in Nava Nakorn. Kidokoro [112] noted that an effective transit network must include multimodal connection planning, which is represented here by the designated bicycle lanes and local/shuttle-buses (Figure 9). The face-to-face community survey showed that 22% of respondents within Nava Nakorn own a bicycle, while 47% own a motorcycle and 49% own a car. Parker et al. [114] found that dedicated bicycle lanes significantly increased the ridership rate in New Orleans, and the same was true for a new town in Singapore [115]. However, Yamamoto and Talvitie [116] noted that most Asian cities do not have a significant length of dedicated bicycle lanes or pathways, although there has been some experience with this approach in China, Singapore, Malaysia, and the resort town of Cha am in Thailand [117,118].
It is hoped that enhanced safety due to dedicated bike lanes (Figure 9) would lead to greater ridership, but it seems that bicycle ownership within Nava Nakorn would need to increase for the positive environmental benefits to be realized. Thammasat University recently introduced a public bicycle sharing program, while AIT has long provided bicycles for its students to traverse the campus. Such practices may promote an increase in non-motorized vehicle traffic, although Mateo-Babiano et al. [119] noted that except in China, the uptake of bicycle sharing within the Asian market has been relatively limited and had essentially completely failed in Singapore by 2019, despite early fanfare [120]. Thorough physical, economic, and policy planning are needed to make bicycle sharing a success.

3.3.2. The Digital Village—Smart Environment, Smart Living, Smart People, Smart Economy, Smart Energy, Smart Mobility—Smart Village

The “Digital Village” area of Nava Nakorn aligns along the main east–west corridor in planning zone C of Figure 7 and Figure 8c. The Digital Village was a concept proposed by the private sector partners as an opportunity for the development of currently vacant land near the main entrance to Nava Nakorn. The private sector partners envisioned that this area could be developed into a meeting and work place where companies operating in Nava Nakorn and students from the local universities could collaborate on ICT, high-tech research, and entrepreneurial initiatives in a form of private–public partnership. The space might be both a physical space and a virtual meeting space, a vision consistent with the Thailand 4.0 policy.
Figure 10a–d illustrate one design vision that integrates business and commercial opportunities with housing, health facilities, and public transport nodes in the Digital Village. Collectively, this design includes aspects of DEPA’s Smart Economy, Smart Mobility, Smart Living, and Smart Environment pillars that would enhance community wellbeing and resiliency to natural and economic disruptions. This design vision explicitly embraced the concept of co-working office space (Figure 11). Co-working offices are generally building locations that offer desk space for a fee, but they also hope to attract those looking for a comfortable and aesthetic work environment that provides valuable social contacts and collaboration with other professionals [121,122]. This type of arrangement may be of particular interest to self-employed creative professionals, freelancers, start-ups, and knowledge workers [123], and is increasingly popular in North America, Europe, Australia, and parts of Asia [124,125,126]. However, uptake has been slow in Thailand, with most co-working spaces occurring informally at coffee shops and cafes [125].
Figure 11 envisions different types of co-working spaces, including formal offices, open studios, and more informal spaces akin to a coffee shop or university student center. The co-working space (Figure 11) could be used by entrepreneurs and start-ups, but also would facilitate collaborative meetings between the companies of Nava Nakorn and local university students in the above noted private–public partnership initiatives. Certainly, the physical design and architecture of the co-working space is an important consideration for its successful implementation. In their survey, Brown [127] noted that co-working was seen as a more productive and alternative work environment to home, providing a structured yet flexible work day, as well as a more business-like setting in which to meet potential clients and business partners. Brown [127] also noted some survey participants poorly rated self-contained studios that did not provide opportunities for interaction with others, concluding, “…the configuration of physical space is an important element in facilitating interactions.” Bouncken et al. [128] underscored the importance of the physical design and architecture of the co-working space:
The ambiance describes the ethereal features of an environment (e.g., lighting, walls color, furniture, and general look and feel… In coworking spaces, spatial architecture and amenities are key factors that set the ambiance. To provide a creative work environment for users, coworking spaces use unique spatial layouts, saturated color, stylized furniture, and multifaceted seating orientation.
Bouncken et al. [128] also emphasized the importance of connectivity in the co-working space, both with respect to the physical layout that facilitates face-to-face interactions and in the digital connectivity to the outside world.
A second vision for the Digital Village (Figure 12) offers a greater focus on the Smart Living and Smart Environment pillars through its residential areas that are integrated with green spaces and a health park. The design would provide WSUD opportunities (raingardens, rainwater planters, grassed swales, constructed wetlands, retention ponds, green space, and canals) to manage localized flooding as well as lifelong learning opportunities at the Watershed Eco-classroom (Figure 13a,b). The Fora Estuary residential complex emphasizes energy-efficient buildings (Smart Energy pillar) following the Thai Green Building Institute’s (TGBI) certification program [129]. Furthermore, because high-rise apartments are included, the Floor Area Ratio (FAR) would increase from the existing 3 to 3.6. The Digital Village is situated close to Nava Nakorn’s main entrance. The residential area in this vision is up-scale. While Nava Nakorn is an industrial estate and must provide accommodations for the general labor force, the private sector partners would also like to offer new residential space for the knowledge workers that would be part of the Digital Village. Certainly, the SRT/TOD vision will facilitate the travel of knowledge workers who prefer living in urban Bangkok, but some segment of this cohort may be attracted to Nava Nakorn by the lower cost of living and the natural amenities of a peri-urban area. Non-motorized travel to work would be possible for those living locally, consistent with the concepts of the New Urbanism, but also with Ebenezer Howard’s earlier Garden City design [130].
Finally, Carmona [80] notes that public space ranges “from informal street corners to grand civic set pieces”, emphasizing that there should not be a one-size-fits-all vision in their planning and design. Outlining seven principles for good public space design, Carmona [80] indicates that the spaces should provide engaging, active uses, incorporate notable features and amenities, include corridors or “desire lines” that simultaneously allow mobility, connectivity, and active space, and balance between traffic and pedestrian activity. The design visions outlined in Figure 10, Figure 11, Figure 12 and Figure 13 effectively address these guidelines and will help to enhance community connectivity with a diversity of physical and cultural opportunities.

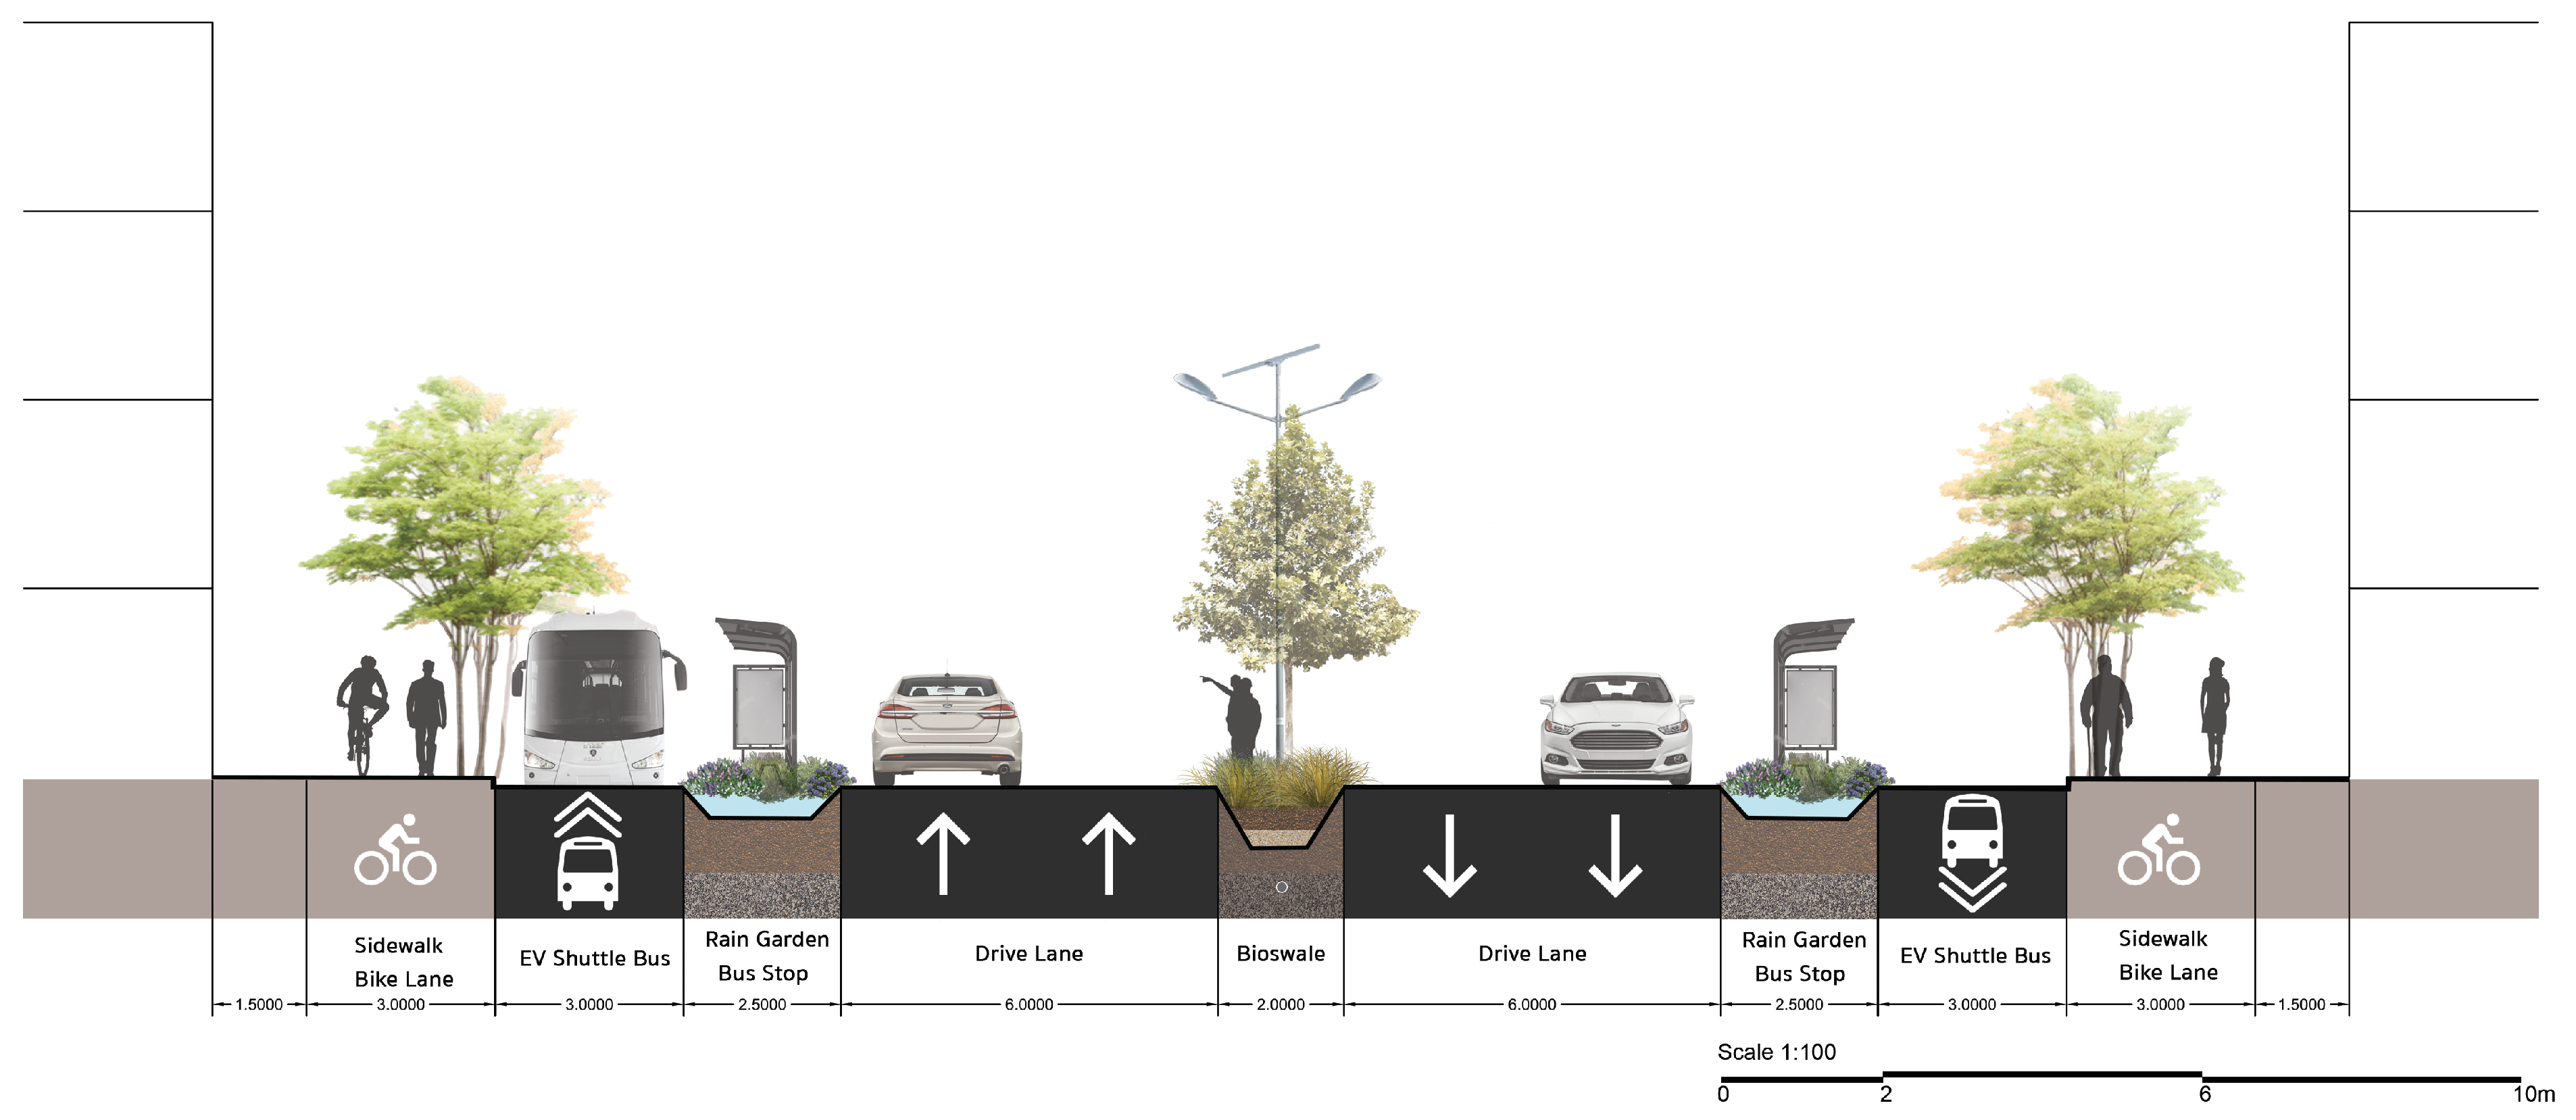
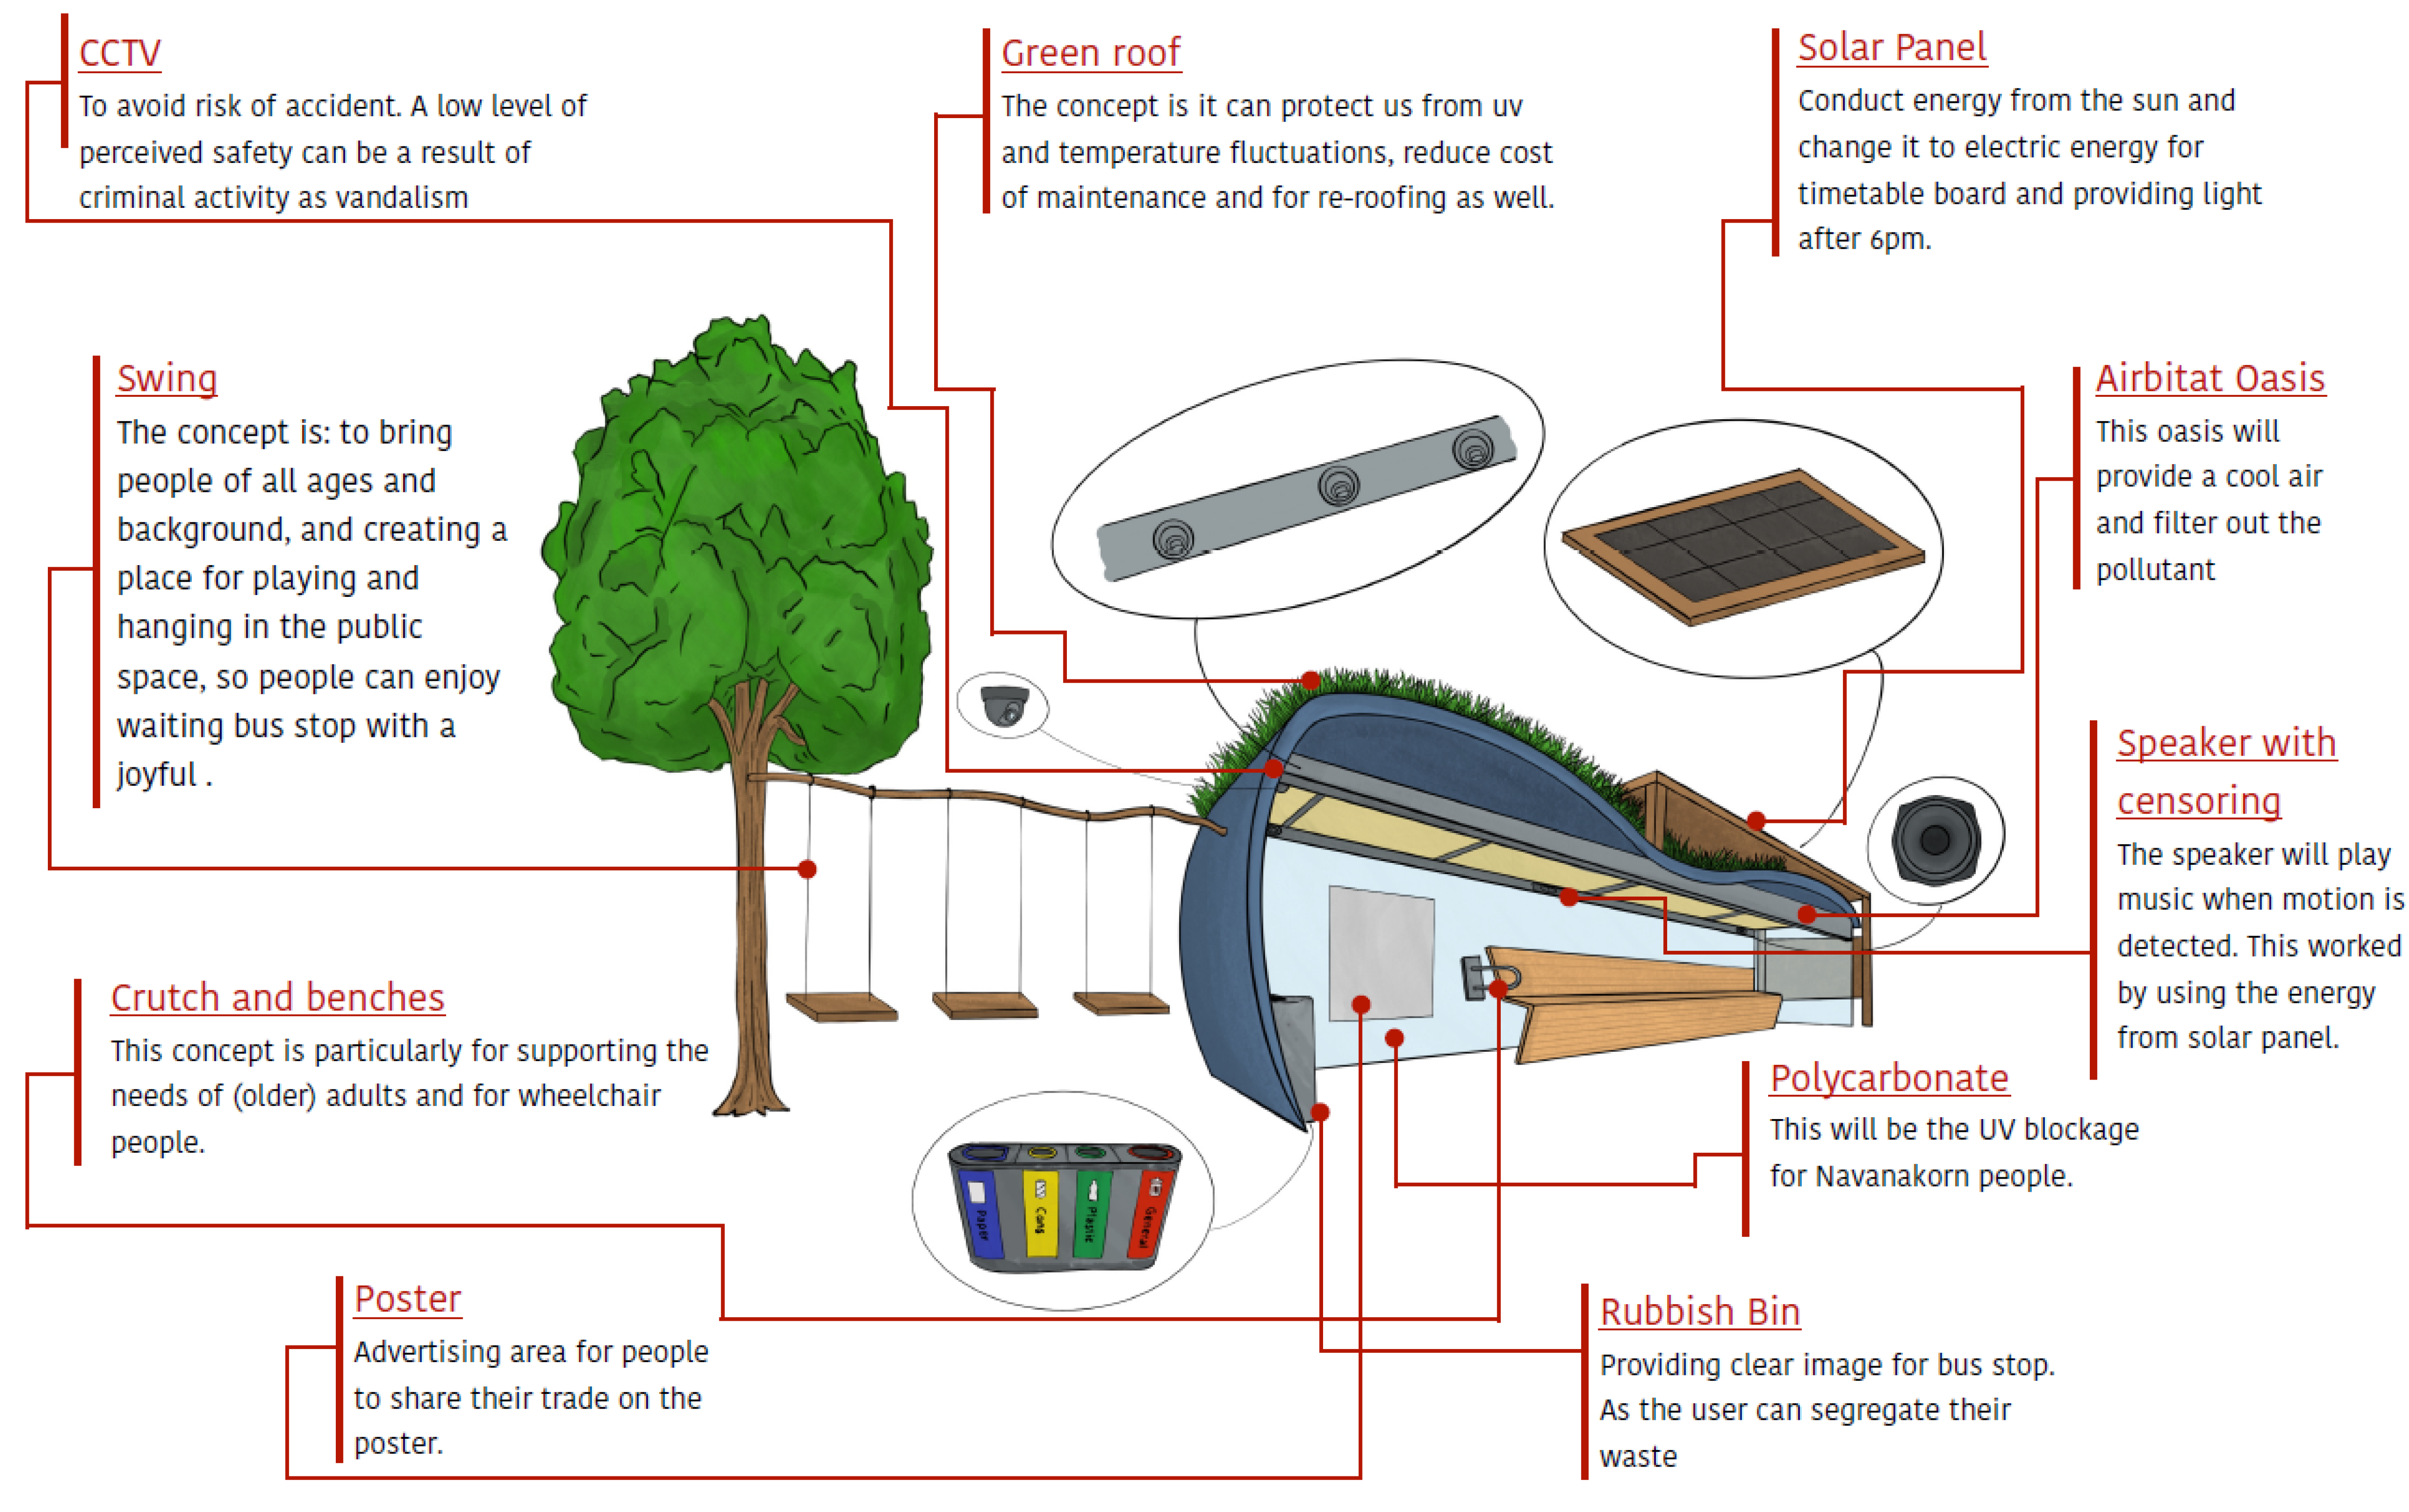
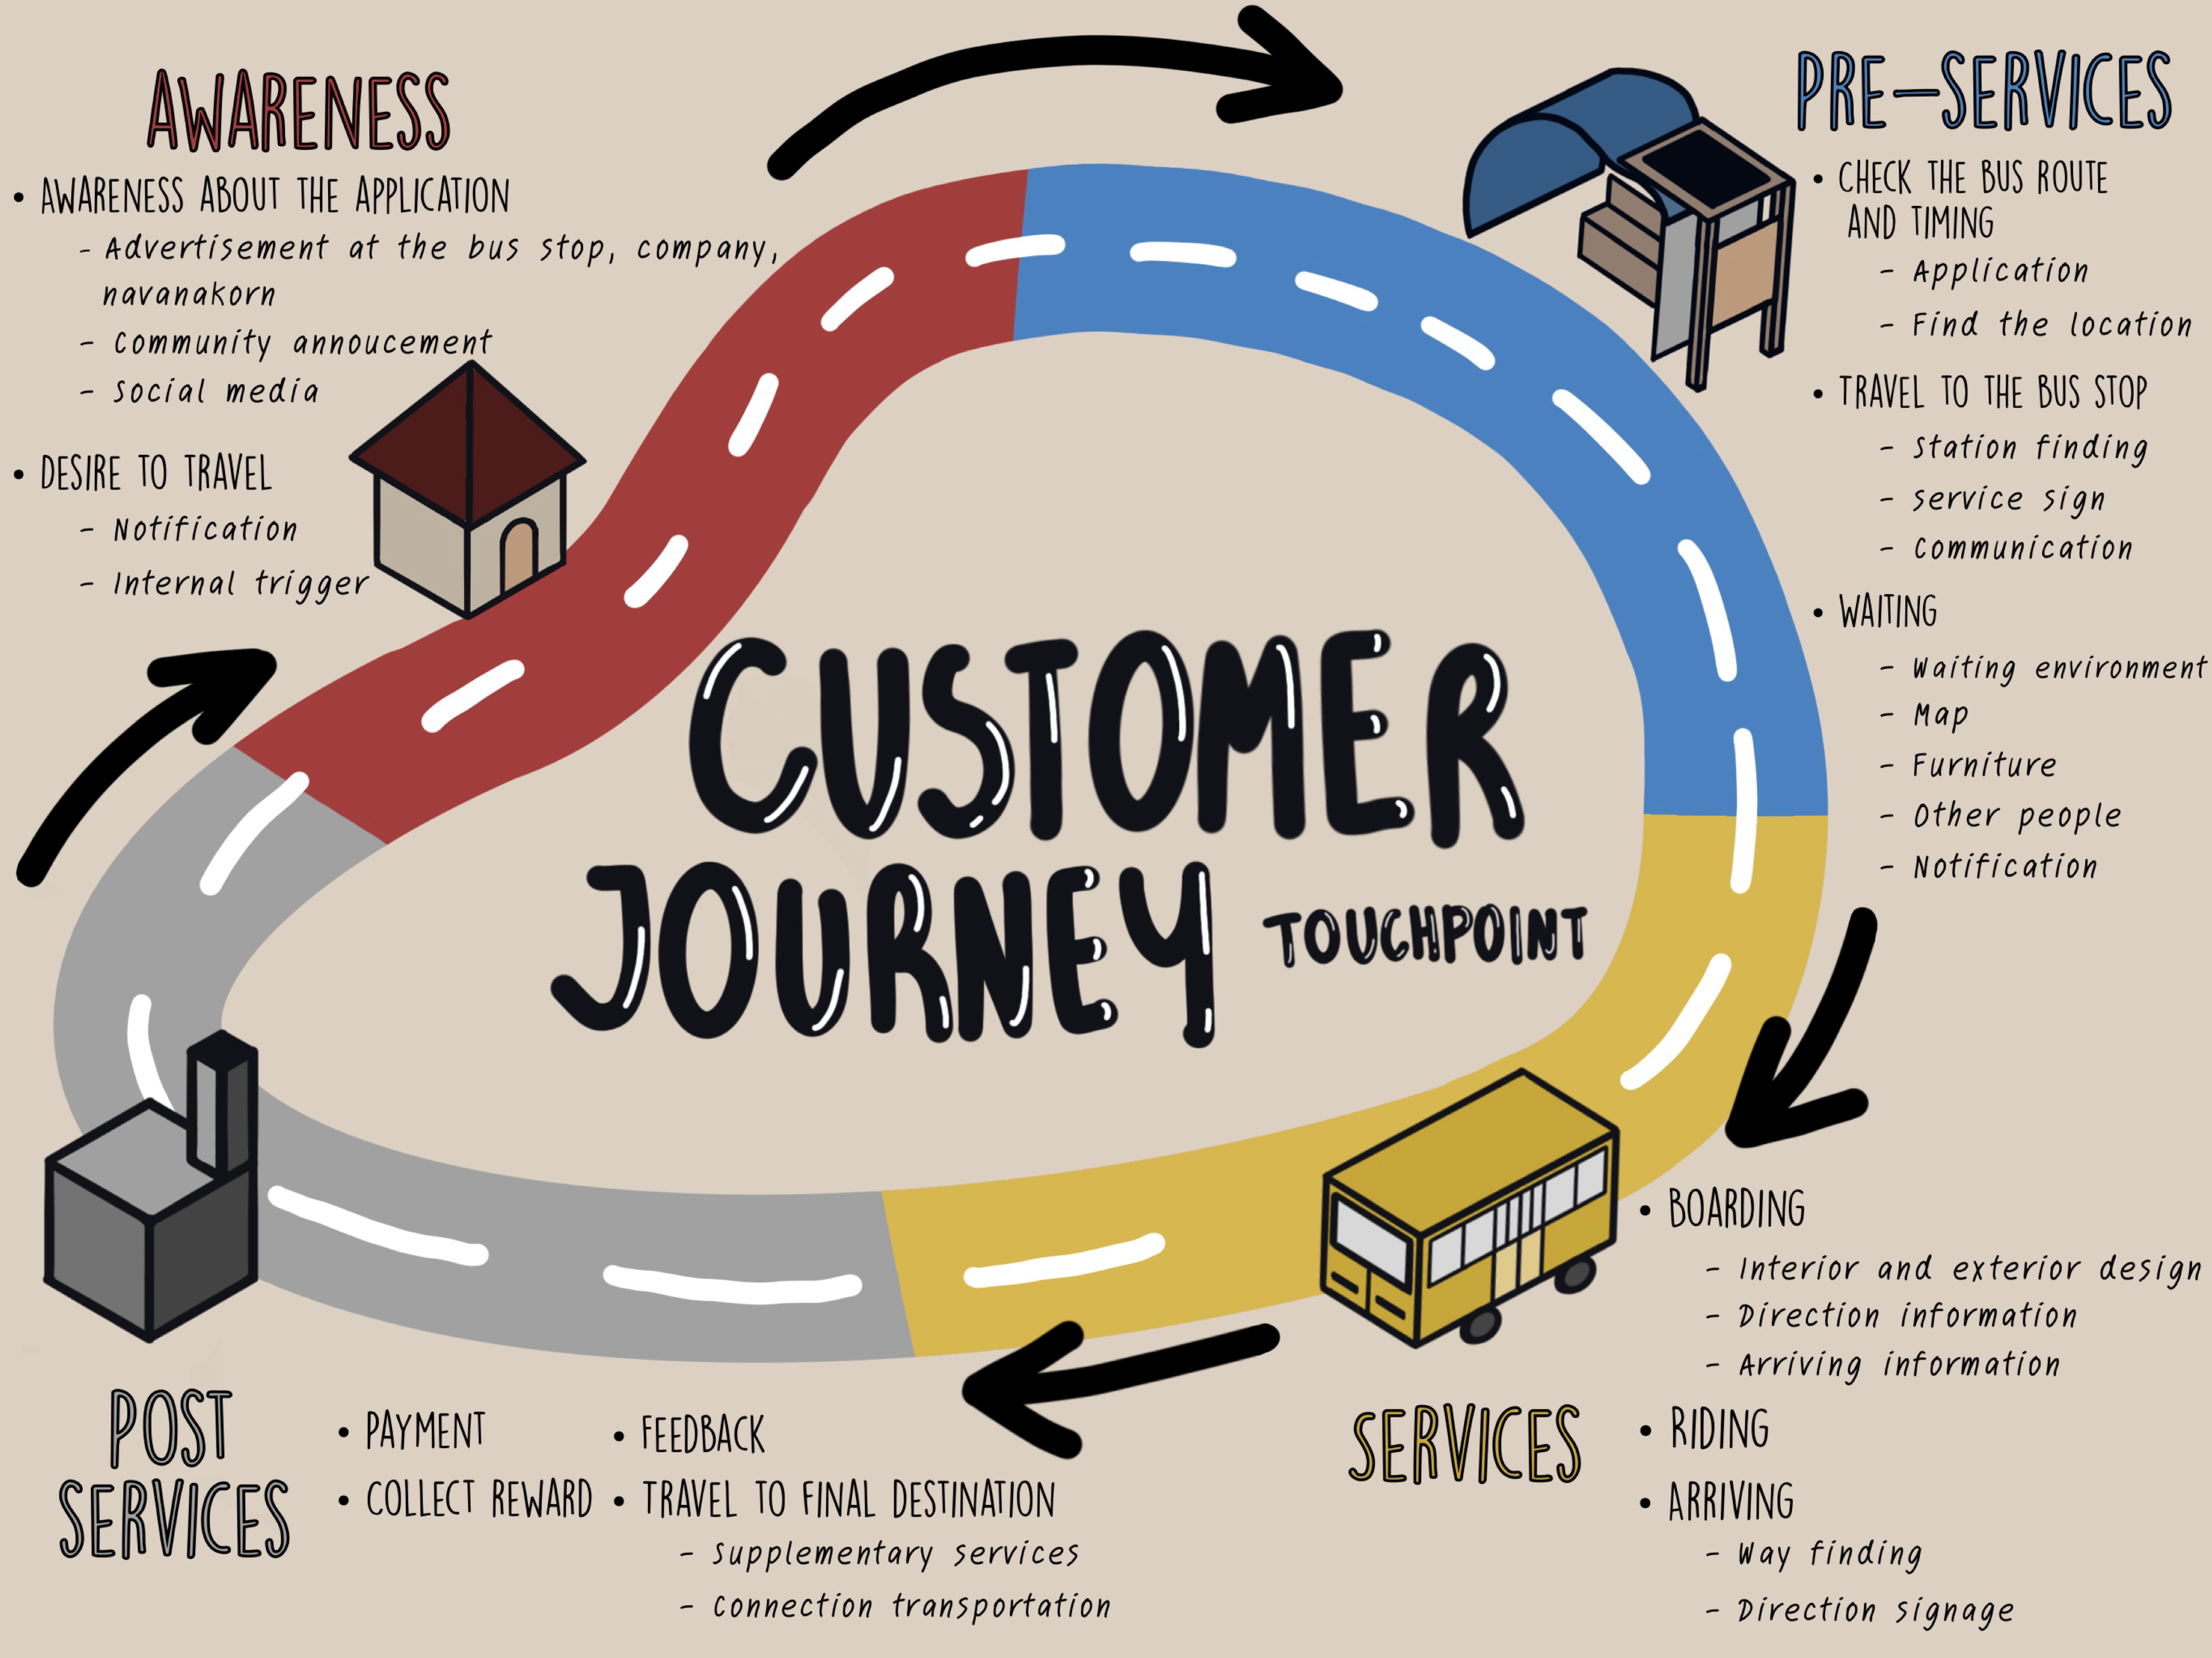
3.3.3. Smart Mobility—Physical and Non-Physical Design

Connectivity is an important component of the Smart Mobility pillar and enhanced connectivity between the Nava Nakorn community and the Thammasat/AIT/Thailand Science Park cluster to the south and VRU to the north is central to the future vision. Figure 14 shows one plan of improved connectivity through an enhanced shuttle-bus/public-bus network. The east–west connectivity would service the Nava Nakorn SRT station–Digital Village corridor. The improved roadway along the main east–west corridor as well as the new north–south bus routes would include dedicated bus lanes, bicycle lanes, and WSUD features such as trees, bioswales, and rainwater planters (e.g., Figure 15). The Smart Mobility and TOD plans, as represented in Figure 6, Figure 14 and Figure 15, would address traffic congestion through reduced private automobile use, a problem identified by the community surveys. In addition, the improved public transit connectivity would reduce greenhouse gas emissions and fossil fuel consumption as well as reduce noise pollution and improve air quality.
A number of physical designs to enhance the availability and participation in public transportation were developed. As noted above, Singapore has established a highly successful, interlinked rail and bus system. Singapore used multiple complementary strategies to promote bus use that included improved bus designs, improved intermediate and end-point facilities (e.g., shelters, linkways, bus interchange developments, intermodal connections) and fare systems, and provision of a variety of bus service types (including express and night bus service) [131]. Public perception and factors impacting user satisfaction of public transportation have been extensively examined [132]. Goh et al. [133] used the Theory of Planned Behavior and structural equation modeling to explore university student bus ridership perceptions in Phnom Penh, Cambodia. They found that attitudes towards ridership were impacted by the factors of general safety and comfort (including bus and bus stop cleanliness) and speed of service (including wait times and duration of trip), but also reported that personal norms (self-based moral obligation) and positive anticipated emotion were significant factors in predicting bus ridership. It was concluded that a number of policy interventions could be enacted to improve bus ridership in relation to the physical design of the system, but other non-physical design options, such as enhanced mobile apps, could also be helpful.
An integrated physical and non-physical design to attract ridership for the proposed new bus circuit in the Thammasat/Nava Nakorn/VRU corridor was developed. A “Spin Bus” app would be coupled with new physical bus stop designs (Figure 16) to enhance user experience before, during, and after the trip (Figure 17). Development of the app was based on customer journey design principles (Figure 17), which evaluate all aspects of the customer experience, particularly identifying and characterizing points of contact (or touch points) between the customer, products, and services [134]. The effort to optimize app utility and thereby increase rider satisfaction is consistent with the Theory of Planned Behavior as it seeks to enhance favorable attitudes towards ridership [133].

3.4. Reflections on the Case Studies

The case studies discussed in the previous sections addressed issues of public/green space and water management, TOD, a Digital Village, and an ICT approach to enhance participation in public transit. The designs integrated multiple smart pillars, consistent with a transdisciplinary approach. Given the length limitations for this paper we are unable to adequately present all design material. For example, one student’s design project explicitly addressed Universal Design and inclusion within the superblock, while another addressed age-friendly design to enhance social connectedness. Both of these themes are explicitly noted in the Smart Living pillar. All six of Mozuriunaite’s [68] key design areas that connect urban and landscape design principles and Smart City design were addressed in the different case studies: Vertical Green, Water Energy (e.g., water recycling, treatment, and solar energy), Water Savings, Energy Savings, Natural Ventilation, and Technology. The solar energy, natural ventilation, and technology aspects, in fact, have already been addressed to some extent by the different superblock entities. Thammasat University and Nava Nakorn have existing solar projects, most university and government research buildings exhibit natural ventilation, and NNCL has implemented its community LINE app, Traffy Fondue. Considering the three important drivers in Allam and Newman’s [22] Smart City framework, culture, metabolism, and governance, we note that the primary focus of the case study designs was on culture and metabolism. Certainly, there was an important emphasis on connectivity and the flow of people, water, and environmental systems to enhance livability. The performance, cost, and benefits of the designs must be further evaluated through conceptual, deterministic modeling (e.g., hydrologic/hydraulic/water quality modeling) and ecosystem service valuations of both individual features and the system as a whole [84,86,135] to optimize design. The models can be calibrated through expanded IoT data collection, consistent with technology and governance aspects of a Smart City. Furthermore, it has been our experience that WSUD designs, for example, are frequently implemented with little or no post-project monitoring of water quantity or quality, particularly in tropical climates, but this could be addressed using IoT and big data approaches to confirm their benefits [85,136].
The project took a pragmatic approach to Lenzholder et al.’s [42] research through designing, which means aspects of (post)positivist, constructivist, and advocacy/participatory epistemologies were adapted, but reviewing the case studies in the context of these epistemologies can, in some way, illuminate the performance of our project. As noted in Section 2, the quality assessment of the study projects was conducted by an iterative review process that included course instructors, external experts attached to the classes, the Thammasat University project management team, and the private sector stakeholders. Lenzholder et al. [42] noted that the (post)positivist epistemology seeks to determine the performance of the project, with typical questions being: “How does a design have to function to fit natural processes (e.g., climate, hydrology, ecology)? How does a large-scale design intervention work within a landscape system?”. The case studies addressed such questions, with some of the groups who focused on WSUD and green space, for example, using a simple Rational Method calculation to estimate the reduction of peak runoff, while others who considered natural and constructed wetlands in their designs enumerated current plant and animal species and the possible enhancement of biodiversity. As noted above, these approaches could be strengthened through the use of conceptual, deterministic models and ecosystem service valuations. The constructivist epistemology is generally qualitative and is concerned with suggesting new constructs, or considerations of the type of landscape that the designer can create. This approach may include classic ideation and creative reflection-in-action techniques that might address questions such as “Can the design bring about a shift in people’s sensing, thinking or behavior?” [42]. The case studies presented here clearly reflect components of the constructivist epistemology. The green space/public space, TOD, and app designs all reflect elements that seek to improve the community’s urban experience, but also shift their behavior, for example, with respect to public transit. Under the advocacy/participatory epistemology, the researcher facilitates the research through designing process whereby the community becomes directly involved with problem identification and data collection [42]. This epistemology was a focal point of the design process for the project under the concept that we term “familiarity”. However, we note that Lenzholder et al. [42] also suggested this advocacy/participatory approach should “… empower[s] the community, so that people act for a better environment on their own account”. This post-design community empowerment has not yet been assessed, due to COVID-related community restrictions and the schedule to complete the designs. Ultimately, our pragmatic approach has enabled us to integrate elements from the other epistemologies to address bigger questions, such as What would the superblock, or Nava Nakorn, look like as it transitions to a Smart City landscape?

4. Conclusions

4.1. Proposed Model and Academic Implications

This paper provides a case study that applied the Thailand Smart City seven pillar framework [48] in developing planning and design visions for the TUNN superblock. The designs were informed by community interaction or “familiarity” obtained through a series of surveys, regularly scheduled key stakeholder (private sector partner) meetings, passive observation, and photo-documentation. While the Thailand Smart City seven pillar framework was the primary formative organizational model for the research, we have demonstrated that our methodological model was also well-related to other proposed Smart City design frameworks [22,68]. Furthermore, in comparing our methodology with the epistemological approaches in design and landscape architecture, as outlined by Lenzholder et al. [42], we show that the case studies provide verification of our methodology in applying a landscape architecture and landscape studies lens to vision the transformation of a peri-urban area into a smart district. While the case studies were geographically local, the approaches used in this paper could be adapted to other cities of the region.
Taweesaengsakulthai et al. [11] reviewed early Smart City demonstration efforts in Thailand (Nakhon Nayok in 2013; Phuket in 2017; Chiang Mai in 2017) and concluded that these projects were not successful for a number of reasons, including no clear policy statement articulating the goals of the project, lack of knowledge and understanding on the part of government agency staff (both central government and local government), insufficient allocated budget, and lack of consideration for local community benefits (Phuket and Chiang Mai, for example, focused primarily on international tourism development). Taweesaengsakulthai et al. [11] further suggested that a pilot light rail construction project in Khon Kaen was successfully implemented because it was locally driven (politically and financially) with local community development in mind and had strong private–public-university collaboration (i.e., the so-called triple-helix approach). Krueathep [137] also noted barriers to Smart City implementation included challenges for local government to take initiative and responsibility in leading such innovative programs, concluding Thailand was not Smart City ready yet.
This TUNN superblock case study echoes some of the elements for successful Smart City implementation in Thailand as summarized by Taweesaengsakulthai et al. [11]. The project was locally driven with local community development in mind and had a strong private-university collaboration. One of the advantages that we see for this particular effort addresses the concern registered by Krueathep [137] regarding challenges for local government to lead innovative programs. NNCL is a private sector stakeholder that is less fettered by policies restricting local government mandates, yet it acts in a management capacity, which allows it to implement Smart City policies effectively and efficiently. In fact, the theme of its 2019 annual report was Going Towards a Sustainable Smart City [138]. As is the case with many successful planning and development projects, a local champion is needed. NNCL, as the local policy and management institution, provides active and innovative interaction from the top, having established a community representatives group that meet bi-monthly to discuss community needs and recommend new community initiatives. In this sense, a bottom-up component to planning also exists, but our project provided an additional element to elucidate the community interests and visions for NNCL. A recent survey by Popescu and Popescu [139] showed that good governance, environmental protection, sustainable productivity, and eco-efficiency were highly ranked characteristics of good corporate social responsibility. As a community leader, NNCL has demonstrated such characteristics within a Smart City vision that should enhance community resiliency, sustainability, and wellbeing.
Sintusingha [51] reviewed existing development trends and future opportunities for a superblock that (now) is much closer to downtown Bangkok than the superblock examined in our study. In the intervening 20 years of Sintusingha’s study, some development issues in the Bangkok Metropolitan Region have changed and some remain the same, but the Smart City emphasis on Smart Environment, Smart Living, and Smart Mobility give us some hope of progress towards a more sustainable development. Certainly, some of the key elements of a “mediated-change” scenario (rather than business as usual) that were outlined by Sintusingha [51], including: (i) mixed-use urban corridors serviced by rapid mass transit; (ii) local community centers that combine public and commercial space such as open markets; and (iii) green/blue corridors that provide flood management opportunities, enhanced biodiversity, and recreational opportunities, also figured prominently in the student designs for this case study. We believe that in today’s planning climate the superblock can be adaptimistic, per the branding identified in the design vision of Figure 10d.

4.2. Proposed Model and Managerial Implications—Specific Recommendations for the Superblock

Based on the Smart City model, we provide the following specific priority recommendations for pursuing development within the TUNN superblock:
(i).
Focus on the Smart Mobility pillar—this would include the extension of the SRT Dark Red Line to the Nava Nakorn station and the development of a seamless link with an enhanced local public transit system that would follow TOD principles.
(ii).
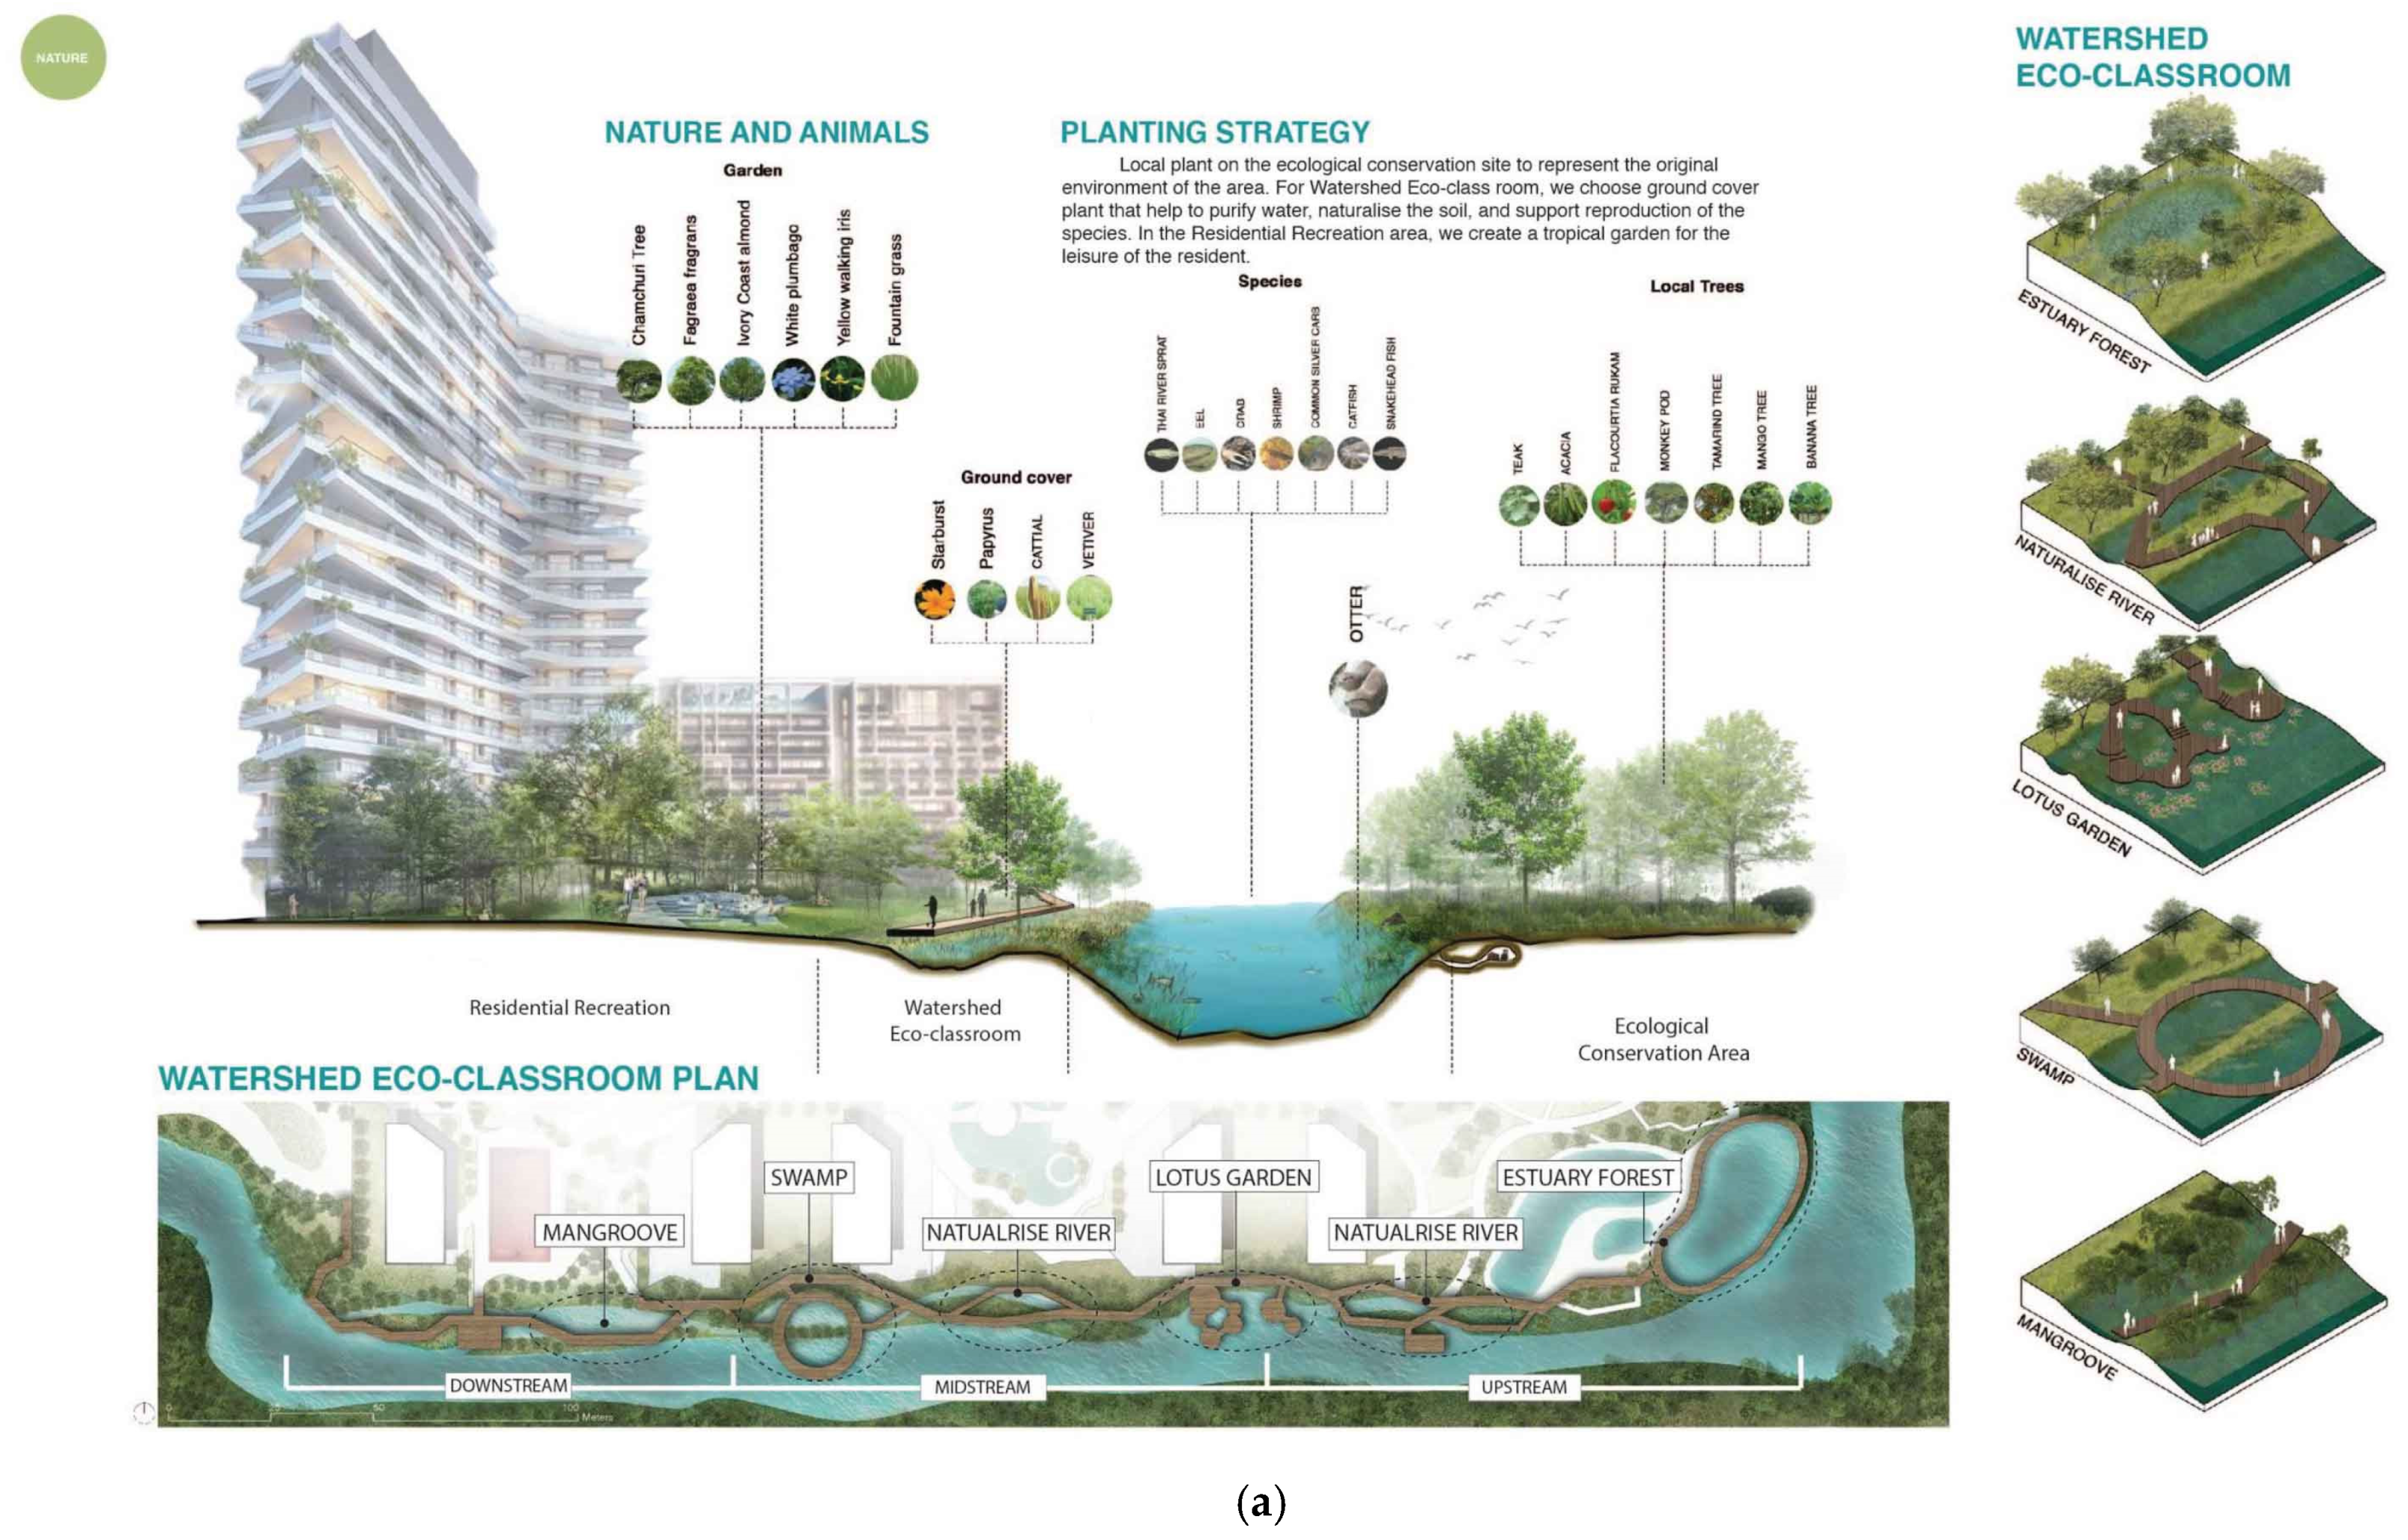
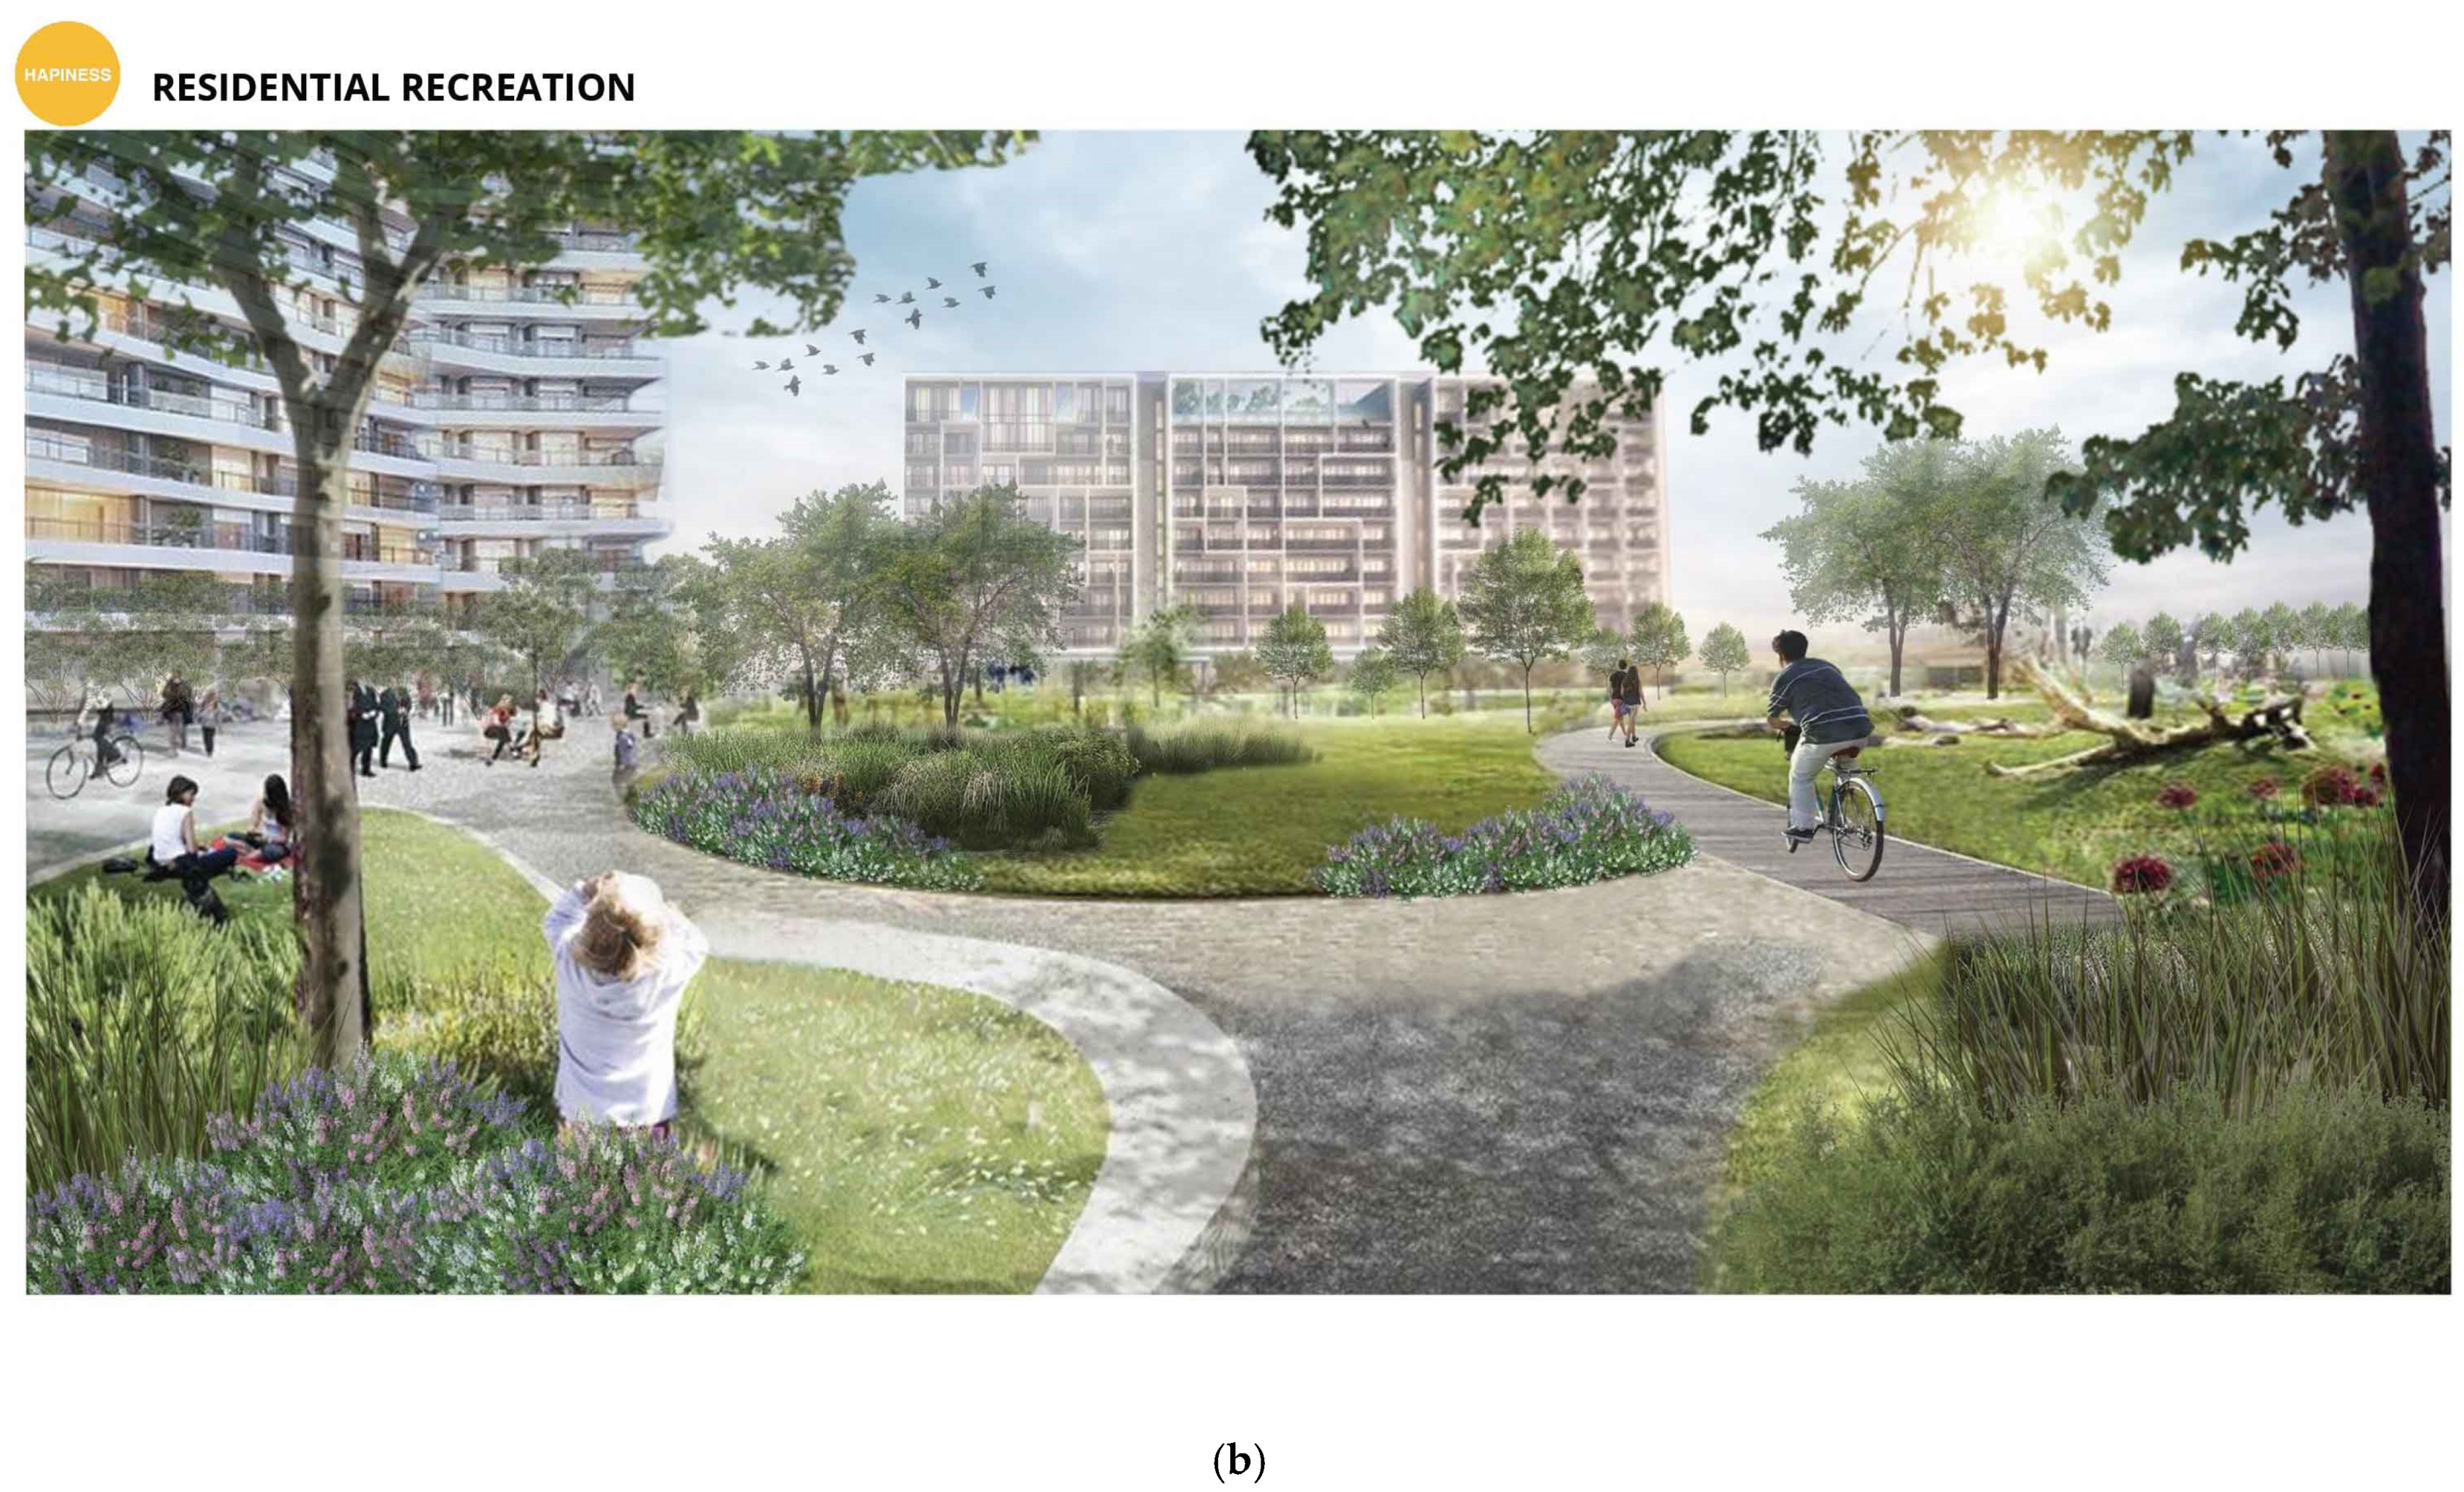
A greater amount of connected green space should be designed and constructed as part of the Smart Environment pillar. Not only would this space improve community wellbeing, connectivity, and public health, it would serve to increase community resiliency to flooding, improve water quality, and mitigate air quality, noise, and the urban heat island [86], which are issues of community concern that were generally noted through the surveys. It is important that the performance of the green space is assessed so that the superblock can serve as an incubator or prototype of sorts for the effective implementation of the Smart Environment ideals throughout Thailand. A second focus for Smart Environment would be to explore improved methods of solid-waste management, including the up-cycling of waste within Nava Nakorn.
(iii).
Enhance Smart Governance and Service—ICT is an essential component of this theme. Community service platforms already piloted in Nava Nakorn should be expanded and streamlined to facilitate community interaction and management. This theme would be data driven and include components of the IoT for smart monitoring and AI to support timely and smart decision making. This theme would link the previous two themes, for example, by using cashless access to the SRT and local public transit system, synchronizing traffic signals and public transit vehicles through IoT and AI assessment, infrastructure maintenance scheduling, or monitoring of water quality and quantity to provide timely environmental warnings and tracking of the progress towards an improved environment.

4.3. Project Strengths, Limitations, and Further Study

The visions and designs presented herein reflect possible futures for the TUNN superblock that would enhance community resiliency, sustainability, and wellbeing in various ways under the seven smart pillar framework. Certainly, there are other possible visions and moving forward, these visions would need to be evaluated in greater detail, considering feasibility, costs and benefits, and community aspirations. The two primary challenges and limitations for this research were related to the number of submitted designs through the different classes and the final community interaction. As noted, a total of 41 student planning and design projects were submitted for assessment, which provided a wealth of vision diversity to share with the private sector stakeholders. However, it also was a challenge for the Thammasat University study management team to assess (collaboratively with the course coordinators) this large number of projects and effectively synthesize the best and most innovative ideas to represent a cohesive and meaningful set of visions for the private sector stakeholders. The project was presented publicly at Central World Mall in downtown Bangkok, an event that was covered by Thai news outlets. Professor Chatchart Sitthiphan, former Prime Minister of Thailand candidate for the Pheu Thai Party and formerly in the Department of Civil Engineering, Chulalongkorn University, and Mr. Nipit Arunvongse Na Ayudhaya, CEO of NNCL were invited discussants for the presentation. Professor Chatchart Sitthiphan concluded “…the Navanakorn solution by Thammasat University and Harvard University is the answer for Bangkok in the future as a model for urban development.” [91]. In emphasizing community familiarity, Mr. Nipit Arunvongse Na Ayudhaya noted “We [NNCL} succeed because we know the real problems of the population” [91]. As discussed above, our project helped to additionally elucidate community issues and provide design solutions to address these issues. The final step of this visioning effort should be to re-engage with the local community to review and receive feedback on the alternative design visions. Unfortunately, due to COVID-19 restrictions, this has not yet been possible. Once this final step of the project is completed, the quality of the community participation should be assessed using the framework proposed by Simonofski et al. [47] based on the categories of “Citizens as Democratic Participants”, “Citizens as Co-creators”, and “Citizens as ICT Users”. This assessment should also include a deeper consideration of the power relations that influence community engagement and principles that might facilitate greater community involvement in the planning and design process [46,140]. Ultimately, the designs developed through this study could serve as a basis for the superblock partners to apply for DEPA’s Smart City designation, which would provide tax incentives and funding to help implement specific visions.
Although community surveys and in-depth interviews were employed in this project to inform the designs, we do not consider this a truly data-driven design approach. Future work could consider additional surveys that take more of a Theory of Planned-Behavior/structural equation modeling approach to refine the understanding of community preferences and iteratively fine-tune designs as part of the NNCL’s bi-monthly community meetings. Similarly, deterministic, conceptual modeling should be employed to optimize the performance of designed WSUD features, transportation systems, and energy-efficient buildings. The surveys indicated that the community was poorly aware of up-skill training or lifelong learning opportunities offered by the local universities. The designs developed for the project, while noting possible lifelong learning opportunities (e.g., Figure 13a), focused more on the physical space of such opportunities rather than the programmatic space. The development of lifelong learning programs such as financial literacy, small-business development and entrepreneurialism, should be explored as a means to better connect the community within the Nava Nakorn industrial estate and the local university and government research communities.
Finally, as we noted, COVID-19 impacted the performance of this study and the pandemic has certainly initiated new conversations with respect to the physical and social aspects of design and their role in creating a more resilient community [99,100]. Such conversations are nascent in the literature and are evolving, just as the COVID-19 virus and public health management continue to evolve. We suggest that the Smart City model provides a relevant platform with which to consider urban development, resiliency, sustainability, and wellbeing in the context of the more recent COVID-19 influence. For example, a seamless mass transit plan was an important component of this study, but appropriate measures to minimize the COVID-19 exposure risk must now be considered. Our findings also emphasized the importance of a diverse, connected green space that included both smaller and larger areas to accommodate sustainable water management and community wellbeing. Connected green space could have a positive impact on community wellbeing and resiliency under the recent COVID-19 conditions, although some may perceive the risk of exposure in public spaces exceeds the benefits. Questions regarding the optimum size and amenities of green spaces to most effectively address COVID-19 considerations also remain and such uncertainties have important implications for the directions in urban design. It was beyond the scope of this research to assess the design implications for COVID-19, but such evaluations would be a valuable focus for future studies.

Author Contributions

K.N.I. was Project Coordinator, conceived, and was lead in writing the manuscript; A.S. (Asan Suwanarit) initiated the project, was co-instructor for the DBT class, co-developed and analyzed the online surveys, co-conceived the manuscript, assisted in writing and editing the manuscript; F.L. was the Project Leader, co-conceived the manuscript, assisted in writing and editing the manuscript, and was coordinator for the Landscape Architecture class; H.S. was course coordinator for the Urban Design class, oversaw development, application, and analysis of the face-to-face surveys, and reviewed the manuscript; M.I. was the course coordinator for the DBT class, assisted with the development of the online surveys, co-supervised student projects, particularly the Spin Bus app development, and reviewed the manuscript; P.K. was the course coordinator for the Architecture design studio, supervised student design projects, and reviewed the manuscript; P.B. was the course coordinator for the Landscape Architecture class, co-supervised student design projects, and reviewed the manuscript; N.T. was course coordinator for the urban planning class, supervised student projects, assisted with data analysis, and reviewed the manuscript; A.S. (Alisa Sahavacharin) co-supervised Landscape Architecture design studio student projects, provided support in field surveys, and reviewed the manuscript; J.W. assisted with supervision of the DBT class student projects, provided support in field surveys, and reviewed the manuscript; S.J. co-supervised student projects in the Urban Design studio class and reviewed the manuscript. All authors have read and agreed to the published version of the manuscript.

Funding

Partial funding for the project was provided by the private sector consortium of Nava Nakorn Public Co., Ltd., Ratch Group, and ALT Telecom PLC.

Institutional Review Board Statement

All surveys were anonymous, participation was entirely voluntary, and the methods followed approved university ethics practices for undergraduate research projects. The methods were reviewed at the faculty level to ensure compliance.

Informed Consent Statement

Informed consent was obtained from all subjects involved in the study.

Data Availability Statement

Data related to the surveys can be obtained directly from the corresponding author, upon written request.

Acknowledgments

We would like to thank all of the TDS students who participated in developing designs and visions for this project, as well as the superblock community, particularly in Nava Nakorn and Thammasat University, who freely gave of their time in responding to surveys and interviews. KNI was a Bualuang ASEAN Fellow at Thammasat University during this study. Finally, we would like to thank the anonymous reviewers of this manuscript for their constructive comments.

Conflicts of Interest

The authors declare no conflict of interest. While the private sector funding partners provided insights and suggestions for the project, final project designs and visions were solely the result of free academic discourse.

References

  1. Hollands, R.G. Will the real smart city please stand up? Intelligent, progressive or entrepreneurial? City 2008, 12, 303–320. [Google Scholar] [CrossRef]
  2. Yigitcanlar, T.; Foth, M.; Kamruzzaman, M. Towards Post-Anthropocentric Cities: Reconceptualizing Smart Cities to Evade Urban Ecocide. J. Urban Technol. 2019, 26, 147–152. [Google Scholar] [CrossRef] [Green Version]
  3. Yigitcanlar, T.; Han, H.; Kamruzzaman; Ioppolo, G.; Sabatini-Marques, J. The making of smart cities: Are Songdo, Masdar, Amsterdam, San Francisco and Brisbane the best we could build? Land Use Policy 2019, 88, 104187. [Google Scholar] [CrossRef]
  4. Figueiredo, S.M.; Krishnamurthy, S.; Schroeder, T. What about smartness? Archit. Cult. 2019, 7, 335–349. [Google Scholar] [CrossRef] [Green Version]
  5. Cugurullo, F. Exposing smart cities and eco-cities: Frankenstein urbanism and the sustainability challenges of the experimental city. Environ. Plan. A Econ. Space 2018, 50, 73–92. [Google Scholar] [CrossRef]
  6. Söderström, O.; Paasche, T.; Klauser, F. Smart cities as corporate storytelling. City 2014, 18, 307–320. [Google Scholar] [CrossRef]
  7. Knaap, G.; Talen, E. New urbanism and smart growth: A few words from the academy. Int. Reg. Sci. Rev. 2005, 28, 107–118. [Google Scholar] [CrossRef]
  8. Grant, J.L. Theory and practice in planning the suburbs: Challenges to implementing new urbanism, smart growth, and sustainability principles. Plan. Theory Pract. 2009, 10, 11–33. [Google Scholar] [CrossRef]
  9. Lee, S.H.; Han, J.H.; Leem, Y.T.; Yigitcanlar, T. Towards ubiquitous city: Concept, planning, and experiences in the Republic of Korea. In Knowledge-Based Urban Development: Planning and Applications in the Information Era; IGI Global: Hershey, PA, USA, 2008; pp. 148–170. [Google Scholar]
  10. Cocchia, A. Smart and digital city: A systematic literature review. In Smart City; Dameri, R.P., Rosenthal-Sabroux, C., Eds.; Springer: Cham, Switzerland, 2014; pp. 13–43. [Google Scholar]
  11. Taweesaengsakulthai, S.; Laochankham, S.; Kamnuansilpa, P.; Wongthanavasu, S. Thailand Smart Cities: What is the Path to Success? Asian Polit. Policy 2019, 11, 144–156. [Google Scholar] [CrossRef] [Green Version]
  12. IBM. Builds a Smarter Planet. Available online: https://www.ibm.com/smarterplanet/us/en/ (accessed on 9 August 2021).
  13. Thailand 4.0: In Sight But Not in Reach. Available online: https://country.eiu.com/article.aspx?articleid=1746126758&Country=Thailand&topic=Economy (accessed on 9 August 2021).
  14. Naprathansuk, N. A national pilot project on Smart City Policy in Thailand: A case study on Phuket Khon Kaen Chiangmai Province. Eur. J. Multidiscip. Stud. 2017, 2, 337–346. [Google Scholar] [CrossRef] [Green Version]
  15. Iamtrakul, P.; Klaylee, J. Lesson learns of success factors from 10 Smart Cities development: Thailand context. In Proceedings of the 2019 First International Conference on Smart Technology & Urban Development (STUD), Chiang Mai, Thailand, 13–14 December 2019; pp. 1–6. [Google Scholar]
  16. Goel, R.K.; Yadav, C.S.; Vishnoi, S. Self-sustainable smart cities: Socio-spatial society using participative bottom-up and cognitive top-down approach. Cities 2021, 118, 103370. [Google Scholar] [CrossRef]
  17. Zygiaris, S. Smart city reference model: Assisting planners to conceptualize the building of smart city innovation ecosystems. J. Knowl. Econ. 2013, 4, 217–231. [Google Scholar] [CrossRef]
  18. Albino, V.; Berardi, U.; Dangelico, R.M. Smart Cities: Definitions, Dimensions, Performance, and Initiatives. J. Urban Technol. 2015, 22, 3–21. [Google Scholar] [CrossRef]
  19. Kummitha, R.K.R.; Crutzen, N. How do we understand smart cities? An evolutionary perspective. Cities 2017, 67, 43–52. [Google Scholar] [CrossRef]
  20. Caird, S.P.; Hallett, S.H. Towards evaluation design for smart city development. J. Urban Des. 2019, 24, 188–209. [Google Scholar] [CrossRef]
  21. Mora, L.; Deakin, M.; Reid, A. Strategic principles for smart city development: A multiple case study analysis of European best practices. Technol. Forecast. Soc. Chang. 2019, 142, 70–97. [Google Scholar] [CrossRef]
  22. Allam, Z.; Newman, P. Redefining the smart city: Culture, metabolism and governance. Smart Cities 2018, 1, 4–25. [Google Scholar] [CrossRef] [Green Version]
  23. Joss, S.; Sengers, F.; Schraven, D.; Caprotti, F.; Dayot, Y. The Smart City as Global Discourse: Storylines and Critical Junctures across 27 Cities. J. Urban Technol. 2019, 26, 3–34. [Google Scholar] [CrossRef] [Green Version]
  24. Allahar, H. What are the Challenges of Building a Smart City? Technol. Innov. Manag. Rev. 2020, 10, 38–48. [Google Scholar] [CrossRef]
  25. Cretu, L.G. Smart cities design using event-driven paradigm and semantic web. Inform. Econ. 2012, 16, 57. [Google Scholar]
  26. Bifulco, F.; Tregua, M.; Amitrano, C.C.; D’Auria, A. ICT and sustainability in smart cities management. Int. J. Public Sect. Manag. 2016, 29, 132–147. [Google Scholar] [CrossRef]
  27. Sriburi, T. Bangkok—A Smart City? Unisearch J. 2018, 5, 43–46. [Google Scholar]
  28. Bibri, S.E.; Krogstie, J. The emerging data-driven Smart City and its innovative applied solutions for sustainability: The cases of London and Barcelona. Energy Inform. 2020, 3, 1–42. [Google Scholar] [CrossRef]
  29. Neirotti, P.; De Marco, A.; Cagliano, A.C.; Mangano, G.; Scorrano, F. Current trends in Smart City initiatives: Some stylised facts. Cities 2014, 38, 25–36. [Google Scholar] [CrossRef] [Green Version]
  30. Wan, L.; Yin, L. Confusion of goals—Rethinking the implication of data analytics and modelling for urban planning and design industry. Landsc. Archit. Front. 2020, 7, 38–49. [Google Scholar] [CrossRef]
  31. Lytras, M.D.; Visvizi, A. Who uses smart city services and what to make of it: Toward interdisciplinary smart cities research. Sustainability 2018, 10, 1998. [Google Scholar] [CrossRef] [Green Version]
  32. Malisuwan, S.; Kaewphanuekrungsi, W.; Milindavanij, D. Digital divide in Thailand: Analysis and recommendations. Int. J. Adv. Res. Eng. Technol. 2016, 7, 41–46. [Google Scholar]
  33. Ayanso, A.; Cho, D.I.; Lertwachara, K. Information and communications technology development and the digital divide: A global and regional assessment. Inf. Technol. Dev. 2014, 20, 60–77. [Google Scholar] [CrossRef]
  34. Lembani, R.; Gunter, A.; Breines, M.; Dalu, M.T.B. The same course, different access: The digital divide between urban and rural distance education students in South Africa. J. Geogr. High. Educ. 2020, 44, 70–84. [Google Scholar] [CrossRef]
  35. Van Jaarsveld, G.M. The Effects of COVID-19 Among the Elderly Population: A Case for Closing the Digital Divide. Front. Psychiatry 2020, 11, 577427. [Google Scholar] [CrossRef]
  36. Liu, L.; Wu, F.; Tong, H.; Hao, C.; Xie, T. The Digital Divide and Active Aging in China. Int. J. Environ. Res. Public Health 2021, 18, 12675. [Google Scholar] [CrossRef] [PubMed]
  37. Rahman, M.H.; Naz, R. Digital Divide within Society: An Account of Poverty, Community and E-Governance in Fiji. E-Learning Digit. Media 2006, 3, 325–343. [Google Scholar] [CrossRef]
  38. Were, G. Digital heritage in a Melanesian context: Authenticity, integrity and ancestrality from the other side of the digital divide. Int. J. Herit. Stud. 2015, 21, 153–165. [Google Scholar] [CrossRef]
  39. Shah, M.K.; Gibbs, A.C.; Ali, M.K.; Narayan, K.V.; Islam, N. Overcoming the digital divide in the post–covid-19 “reset”: Enhancing group virtual visits with community health workers. J. Med. Internet Res. 2021, 23, e27682. [Google Scholar] [CrossRef] [PubMed]
  40. Irvine, K.N.; Taylor, S.W.; Leonard, M. Impacts of alternative Great Lakes regulation plans on hydropower production. Energy Stud. Rev. 1996, 8, 1–15. [Google Scholar] [CrossRef] [Green Version]
  41. Cox, M.; Arnold, G.; Tomás, S.V. A review of design principles for community-based natural resource management. Ecol. Soc. 2010, 15, 38. [Google Scholar] [CrossRef] [Green Version]
  42. Lenzholzer, S.; Duchhart, I.; Koh, J. ‘Research through designing’ in landscape architecture. Landsc. Urban Plan. 2013, 113, 120–127. [Google Scholar] [CrossRef]
  43. Cilliers, E.J.; Timmermans, W. The importance of creative participatory planning in the public place-making process. Environ. Plan. B Plan. Des. 2014, 41, 413–429. [Google Scholar] [CrossRef]
  44. Makhzoumi, J.; Al-Sabbagh, S. Landscape and urban governance: Participatory planning of the public realm in Saida, Lebanon. Land 2018, 7, 48. [Google Scholar] [CrossRef] [Green Version]
  45. Raaphorst, K.; Van Der Knaap, W.; Brink, A.V.D.; Roeleveld, G. Visualization, participation and rhetoric: The discursive power of landscape design representations in participatory processes. J. Landsc. Arch. 2019, 14, 42–53. [Google Scholar] [CrossRef] [Green Version]
  46. Swapan, M.S.H. Who participates and who doesn’t? Adapting community participation model for developing countries. Cities 2016, 53, 70–77. [Google Scholar] [CrossRef]
  47. Simonofski, A.; Asensio, E.S.; De Smedt, J.; Snoeck, M. Hearing the Voice of Citizens in Smart City Design: The Citivoice Framework. Bus. Inf. Syst. Eng. 2019, 61, 665–678. [Google Scholar] [CrossRef] [Green Version]
  48. Smart City Thailand. Available online: https://www.depa.or.th/th/smart-city-plan (accessed on 9 August 2021).
  49. Atkinson, S.; Bagnall, A.M.; Corcoran, R.; South, J.; Curtis, S. Being well together: Individual subjective and community wellbeing. J. Happiness Stud. 2020, 21, 1903–1921. [Google Scholar] [CrossRef] [Green Version]
  50. Balsas, C.J. Measuring the livability of an urban centre: An exploratory study of key performance indicators. Plan. Pract. Res. 2004, 19, 101–110. [Google Scholar] [CrossRef]
  51. Sintusingha, S. Sustainability and urban sprawl: Alternative scenarios for a Bangkok superblock. Urban Des. Int. 2006, 11, 151–172. [Google Scholar] [CrossRef]
  52. O’Brien, C. Sustainable happiness: How happiness studies can contribute to a more sustainable future. Can. Psychol. Can. 2008, 49, 289–295. [Google Scholar] [CrossRef] [Green Version]
  53. Ballas, D. What makes a ‘happy city’? Cities 2013, 32, S39–S50. [Google Scholar] [CrossRef] [Green Version]
  54. Wakefield, S.; Braun, B. Governing the resilient city. Environ. Plan. D Soc. Space 2014, 32, 4–11. [Google Scholar] [CrossRef]
  55. Hassan, A.M.; Lee, H. The paradox of the sustainable city: Definitions and examples. Environ. Dev. Sustain. 2015, 17, 1267–1285. [Google Scholar] [CrossRef]
  56. Beatley, T. Biophilic Cities and Healthy Societies. Urban Plan. 2017, 2, 1–4. [Google Scholar] [CrossRef] [Green Version]
  57. Wu, C.-L.; Chiang, Y.-C. A geodesign framework procedure for developing flood resilient city. Habitat Int. 2018, 75, 78–89. [Google Scholar] [CrossRef]
  58. Khan, S.; Zaman, A.U. Future cities: Conceptualizing the future based on a critical examination of existing notions of cities. Cities 2018, 72, 217–225. [Google Scholar] [CrossRef]
  59. Purnomo, F.; Prabowo, H. Smart city indicators: A systematic literature review. J. Telecommun. Electron. Comput. Eng. (JTEC) 2016, 8, 161–164. [Google Scholar]
  60. Ahvenniemi, H.; Huovila, A.; Pinto-Seppä, I.; Airaksinen, M. What are the differences between sustainable and smart cities? Cities 2017, 60, 234–245. [Google Scholar] [CrossRef]
  61. Shen, L.; Huang, Z.; Wong, I.S.; Liao, S.; Lou, Y. A holistic evaluation of smart city performance in the context of China. J. Clean. Prod. 2018, 200, 667–679. [Google Scholar] [CrossRef]
  62. Shi, H.; Tsai, S.-B.; Lin, X.; Zhang, T. How to Evaluate Smart Cities’ Construction? A Comparison of Chinese Smart City Evaluation Methods Based on PSF. Sustainability 2018, 10, 37. [Google Scholar] [CrossRef] [Green Version]
  63. Carli, R.; Dotoli, M.; Pellegrino, R.; Ranieri, L. Measuring and managing the smartness of cities: A framework for classifying performance indicators. In Proceedings of the 2013 IEEE International Conference on Systems, Man, and Cybernetics, Manchester, UK, 13–16 October 2013; pp. 1288–1293. [Google Scholar]
  64. Tan, K.G.; Woo, W.T.; Tan, B.S. A new instrument to promote knowledge-led growth: The Global Liveable Cities Index. Int. J. Bus. Compet. Growth 2014, 3, 174–188. [Google Scholar] [CrossRef] [Green Version]
  65. Paul, A.; Sen, J. A critical review of liveability approaches and their dimensions. Geoforum 2020, 117, 90–92. [Google Scholar] [CrossRef]
  66. Ivanova, N.; Ganzha, O. The methodological aspect of the landscape and ecological forming of a comfortable environment for the Smart City. In Proceedings of the MATEC Web of Conferences, St. Petersburg, Russia, 15–17 November 2016; Volume 106, p. 01002. [Google Scholar]
  67. Kim, J.; Steenkamp, A.L. Analysis of smart city models and the four-foci taxonomy for smart city design. In Proceedings of the ARCC Conference Repository, Charlotte, NC, USA, 27–30 March 2013. [Google Scholar]
  68. Mozuriunaite, S. The role of landscape design in Smart Cities. Landsc. Arch. Art 2018, 13, 49–55. [Google Scholar] [CrossRef]
  69. Thammasat, Harvard to Create Thai Smart City. Available online: https://www.bangkokpost.com/thailand/general/1831489/thammasat-harvard-to-create-thai-smart-city (accessed on 10 August 2021).
  70. Neuman, M. Teaching collaborative and interdisciplinary service-based urban design and planning studios. J. Urban Des. 2016, 21, 596–615. [Google Scholar] [CrossRef]
  71. Soliman, A.M. Appropriate teaching and learning strategies for the architectural design process in pedagogic design studios. Front. Arch. Res. 2017, 6, 204–217. [Google Scholar] [CrossRef]
  72. Caldwell, G.; Foth, M.; Guaralda, M. An urban informatics approach to smart city learning in architecture and urban design education. Interact. Des. Archit. 2013, 17, 7–28. [Google Scholar]
  73. LeCompte, M.D.; Schensul, J.J.; Singer, M.; Trotter, R.T.; Cromley, E.K. Mapping Social Networks, Spatial Data, and Hidden Populations; Rowman Altamira: Lanham, MD, USA, 1999. [Google Scholar]
  74. Büscher, M. Vision in motion. Environ. Plan. A 2006, 38, 281–299. [Google Scholar] [CrossRef]
  75. Supatn, N. Industrial estates, ports, airports and city transport in the Greater Bangkok Area for promoting connectivity in the Mekong Region. In Intra-and Inter-City Connectivity in the Mekong Region; Ishida, M., Ed.; BRC Research Report No. 6; Bangkok Research Center; IDE-JETRO: Bangkok, Thailand, 2011. [Google Scholar]
  76. Klinmalai, S.; Kanki, K. Neighborhood relationship measurement between newcomer and former inhabitants in sprawl areas of Bangkok Metropolitan Region: The case of Nonthaburi and Pathumthani province, Thailand. In Proceedings of the 49th ISOCARP Congress, Brisbane, Australia, 1–4 October 2013; Available online: http://www.isocarp.net/Data/case_studies/2285.pdf (accessed on 10 August 2021).
  77. Climate Rangsit (Thailand). Available online: https://en.climate-data.org/asia/thailand/pathum-thani-province/rangsit-715034/#climate-table (accessed on 10 August 2021).
  78. Nam, J.; Kim, H. The correlation between spatial characteristics and utilization of city parks: A focus on neighborhood parks in Seoul, Korea. J. Asian Archit. Build. Eng. 2014, 13, 515–522. [Google Scholar] [CrossRef] [Green Version]
  79. Neto, O.A.; Jeong, S.; Munakata, J.; Yoshida, Y.; Ogawa, T.; Yamamura, S. Physical element effects in public space attendance. J. Asian Archit. Build. Eng. 2016, 15, 479–485. [Google Scholar] [CrossRef] [Green Version]
  80. Carmona, M. Principles for public space design, planning to do better. Urban Des. Int. 2019, 24, 47–59. [Google Scholar] [CrossRef] [Green Version]
  81. Swapan MS, H.; Iftekhar, M.S.; Li, X. Contextual variations in perceived social values of ecosystem services of urban parks: A comparative study of China and Australia. Cities 2017, 61, 17–26. [Google Scholar] [CrossRef]
  82. Syafiqah, A.N.; Rahim, A.A.; Hanani, A.F.; Fatihah, S.N. A hedonic valuation in Putrajaya Wetlands. J. Tour. Hosp. Environ. Manag. 2017, 2, 33–43. [Google Scholar]
  83. Jones, K.R. ‘The lungs of the city’: Green space, public health and bodily metaphor in the landscape of urban park history. Environ. Hist. 2018, 24, 39–58. [Google Scholar] [CrossRef]
  84. Irvine, K.; Choy, B.H.; Chua, L.H.; Gaut, J.; Ho, H.L.; Tontisirin, N. A hedonic pricing approach to value Ecosystem Services provided by Water Sensitive Urban Design: Comparison of Geelong, Australia and Singapore. Nakhara J. Environ. Des. Plan. 2020, 19, 59–78. [Google Scholar] [CrossRef]
  85. Hamel, P.; Tan, L. Blue–Green infrastructure for flood and water quality management in Southeast Asia: Evidence and knowledge gaps. Environ. Manag. 2021, 1–20. [Google Scholar] [CrossRef] [PubMed]
  86. Irvine, K.; Loc, H.H.; Sovann, C.; Suwanarit, A.; Likitswat, F.; Jindal, R.; Koottatep, T.; Gaut, J.; Chua, L.; Qi, L.W.; et al. Bridging the form and function gap in urban green space design through environmental systems modeling. J. Water Manag. Model. 2021, 29, C476. [Google Scholar] [CrossRef]
  87. Bank of Thailand Average Wage. Available online: https://www.bot.or.th/App/BTWS_STAT/statistics/BOTWEBSTAT.aspx?reportID=738&language=ENG (accessed on 11 June 2020).
  88. Thailand Average Monthly Wages. Available online: https://tradingeconomics.com/thailand/wages (accessed on 11 June 2020).
  89. Tim, Y.; Cui, L.; Sheng, Z. Digital resilience: How rural communities leapfrogged into sustainable development. Inf. Syst. J. 2021, 31, 323–345. [Google Scholar] [CrossRef]
  90. Traffy* Fondue, Problem Management Platform by Thai Researchers. Available online: https://www.traffy.in.th/?page_id=1660 (accessed on 1 December 2021).
  91. Chatchart Pointed out That ‘Nava Nakorn’ Is a Model of ‘Smart City’. Available online: https://www.matichon.co.th/local/news_2245357 (accessed on 1 December 2021).
  92. ‘Interior’ Is Addicted to Digital, Increasing Efficiency in Taking Care of the City. Available online: https://www.bangkokbiznews.com/news/detail/847359 (accessed on 1 December 2021).
  93. Alias, A.; Ali, A.S.; Wai, C.K. New urbanism and township developments in Malaysia. Urban Des. Int. 2011, 16, 76–93. [Google Scholar] [CrossRef] [Green Version]
  94. Loc, H.H.; Irvine, K.N.; Suwanarit, A.; Vallikul, P.; Likitswat, F.; Sahavacharin, A.; Sovann, C. Mainstreaming ecosystem services as public policy in South East Asia, from theory to practice. In Sustainability and Law; Mauerhofer, V., Rupo, D., Tarquinio, L., Eds.; Springer: Cham, Switzerland, 2020; pp. 631–665. [Google Scholar]
  95. Lazaroiu, G.C.; Roscia, M. Definition methodology for the smart cities model. Energy 2012, 47, 326–332. [Google Scholar] [CrossRef]
  96. Lombardi, P.; Giordano, S.; Farouh, H.; Yousef, W. Modelling the smart city performance. Innov. Eur. J. Soc. Sci. Res. 2012, 25, 137–149. [Google Scholar] [CrossRef]
  97. Lu, D.; Tian, Y.; Liu, V.Y.; Zhang, Y. The performance of the smart cities in China—A comparative study by means of self-organizing maps and social networks analysis. Sustainability 2015, 7, 7604–7621. [Google Scholar] [CrossRef] [Green Version]
  98. Lennon, M. Green space and the compact city: Planning issues for a ‘new normal’. In Cities & Health; Taylor & Francis: Oxfordshire, UK, 2020; pp. 1–4. [Google Scholar]
  99. Bereitschaft, B.; Scheller, D. How might the COVID-19 pandemic affect 21st century urban design, planning, and development? Urban Sci. 2020, 4, 56. [Google Scholar] [CrossRef]
  100. Sharifi, A.; Khavarian-Garmsir, A.R. The COVID-19 pandemic: Impacts on cities and major lessons for urban planning, design, and management. Sci. Total Environ. 2020, 749, 142391. [Google Scholar] [CrossRef]
  101. Ciupa, T.; Suligowski, R. Green-blue spaces and population density versus COVID-19 cases and deaths in Poland. Int. J. Environ. Res. Public Health 2021, 18, 6636. [Google Scholar] [CrossRef]
  102. Rigolon, A.; Browning, M.H.; Lee, K.; Shin, S. Access to urban green space in cities of the Global South: A systematic literature review. Urban Sci. 2018, 2, 67. [Google Scholar] [CrossRef] [Green Version]
  103. Pathum Thani to Grow into ‘Market City of Thailand’. Available online: https://www.nationthailand.com/Economy/30352064 (accessed on 23 December 2021).
  104. Chakraborty, S.; Avtar, R.; Raj, R.; Minh, H.V.T. Village Level Provisioning Ecosystem Services and Their Values to Local Communities in the Peri-Urban Areas of Manila, The Philippines. Land 2019, 8, 177. [Google Scholar] [CrossRef] [Green Version]
  105. Likitswat, F. Urban Farming: Opportunities and Challenges of Developing Greenhouse Business in Bangkok Metropolitan Region. Futur. Cities Environ. 2021, 7, 8. [Google Scholar] [CrossRef]
  106. Jones, C.; Pimdee, P. Innovative ideas: Thailand 4.0 and the fourth industrial revolution. Asian Int. J. Soc. Sci. 2017, 17, 4–35. [Google Scholar] [CrossRef]
  107. Buasuwan, P. Rethinking Thai higher education for Thailand 4.0. Asian Educ. Dev. Stud. 2018, 27, 157–173. [Google Scholar] [CrossRef] [Green Version]
  108. Wongwuttiwat, J.; Lawanna, A. The digital Thailand strategy and the ASEAN community. Electron. J. Inf. Syst. Dev. Ctries. 2018, 84, e12024. [Google Scholar] [CrossRef] [Green Version]
  109. Chiengkul, P. Uneven development, inequality and concentration of power: A critique of Thailand 4.0. Third World Q. 2019, 40, 1689–1707. [Google Scholar] [CrossRef]
  110. Ibraeva, A.; Correia, G.H.D.A.; Silva, C.; Antunes, A.P. Transit-oriented development: A review of research achievements and challenges. Transp. Res. Part A Policy Pract. 2020, 132, 110–130. [Google Scholar] [CrossRef]
  111. Cervero, R.; Day, J. Suburbanization and transit-oriented development in China. Transp. Policy 2008, 15, 315–323. [Google Scholar] [CrossRef]
  112. Kidokoro, T. Transit oriented development (TOD) policies and station area development in Asian cities. In IOP Conference Series: Earth and Environmental Science; IOP Publishing: Bristol, UK, 2020; Volume 532, p. 012001. [Google Scholar]
  113. Niu, S.; Hu, A.; Shen, Z.; Lau, S.S.Y.; Gan, X. Study on land use characteristics of rail transit TOD sites in new towns—Taking Singapore as an example. J. Asian Arch. Build. Eng. 2019, 18, 16–27. [Google Scholar] [CrossRef] [Green Version]
  114. Parker, K.M.; Gustat, J.; Rice, J.C. Installation of Bicycle Lanes and Increased Ridership in an Urban, Mixed-Income Setting in New Orleans, Louisiana. J. Phys. Act. Health 2011, 8 (Suppl. S1), S98–S102. [Google Scholar] [CrossRef] [PubMed]
  115. Nguyen, P.N.; Koh, P.P.; Wong, Y.D. Impacts of bicycle infrastructure: A case study in Singapore. In Proceedings of the Institution of Civil Engineers-Municipal Engineer; Thomas Telford Ltd.: London, UK, 2015; Volume 168, pp. 186–198. [Google Scholar]
  116. Yamamoto, T.; Talvitie, A. Transport infrastructure and services: An Asia and developing world. Transportation 2011, 38, 715–717. [Google Scholar] [CrossRef] [Green Version]
  117. Wang, J.; Heng, W. Traffic segregation on spatial and temporal bases: The experience of bicycle traffic operations in China. Transp. Res. Rec. 1992, 1396, 11. [Google Scholar]
  118. Sultan, Z.; Tini, N.H.; Moeinaddini, M. Exploring the implementation and success of green urban mobility in Asian cities. Plan. Malays. 2016, 14, 295–314. [Google Scholar]
  119. Mateo-Babiano, I.; Kumar, S.; Mejia, A. Bicycle sharing in Asia: A stakeholder perception and possible futures. Transp. Res. Procedia 2017, 25, 4966–4978. [Google Scholar] [CrossRef]
  120. Wheel Woes: The Rise and Fall of Singapore’s Bike-Sharing Industry. Available online: https://www.channelnewsasia.com/singapore/wheel-woes-rise-and-fall-singapores-bike-sharing-industry-892931 (accessed on 13 August 2020).
  121. Amir, M.T. How coworking space impacts innovation: A literature review. In Digital Economy for Customer Benefit and Business Fairness; Routledge: London, UK, 2020; pp. 126–130. [Google Scholar]
  122. Ansio, H.; Käpykangas, S.; Houni, P. Community and Collaboration in a Shared Multi-space Office. Nord. J. Work. Life Stud. 2020, 10, 63–83. [Google Scholar] [CrossRef]
  123. Waters-Lynch, J.; Potts, J. The social economy of coworking spaces: A focal point model of coordination. Rev. Soc. Econ. 2017, 75, 417–433. [Google Scholar] [CrossRef]
  124. Tintiangko, J.; Soriano, C.R. Coworking Spaces in the Global South: Local Articulations and Imaginaries. J. Urban Technol. 2020, 27, 67–85. [Google Scholar] [CrossRef]
  125. Srisuwon, S. The emerging of coworking space in developed countries and developing countries. In Proceedings of the 12th Built Environment Research Associates Conference, BERAC2021, Bangkok, Thailand, 28 June 2021; pp. 468–480. Available online: https://www.berac.tds.tu.ac.th/proceedings_files/berac2021/BERAC2021_Proceeding.pdf (accessed on 25 January 2022).
  126. Berbegal-Mirabent, J. What Do We Know about Co-Working Spaces? Trends and Challenges Ahead. Sustainability 2021, 13, 1416. [Google Scholar] [CrossRef]
  127. Brown, J. Curating the “Third Place”? Coworking and the mediation of creativity. Geoforum 2017, 82, 112–126. [Google Scholar] [CrossRef] [Green Version]
  128. Bouncken, R.B.; Aslam, M.M.; Qiu, Y. Coworking spaces: Understanding, using, and managing sociomateriality. Bus. Horizons 2021, 64, 119–130. [Google Scholar] [CrossRef]
  129. Thai Green Building Institute. Available online: https://tgbi.or.th/ (accessed on 16 August 2021).
  130. Howard, E. Garden Cities of To-Morrow; Swan, Sonnenschein & Co. Ltd.: London, UK, 1902. [Google Scholar]
  131. Ibrahim, M.F. Improvements and integration of a public transport system: The case of Singapore. Cities 2003, 20, 205–216. [Google Scholar] [CrossRef]
  132. Van Lierop, D.; Badami, M.G.; El-Geneidy, A.M. What influences satisfaction and loyalty in public transport? A review of the literature. Transp. Rev. 2018, 38, 52–72. [Google Scholar] [CrossRef]
  133. Goh, M.M.; Irvine, K.N.; Ung, M. To bus or not to bus: Structural equation modelling of ridership perceptions, Phnom Penh, Cambodia. J. Archit./Plan. Res. Stud. 2022, (in press). [Google Scholar]
  134. Kuehnl, C.; Jozic, D.; Homburg, C. Effective customer journey design: Consumers’ conception, measurement, and consequences. J. Acad. Mark. Sci. 2019, 47, 551–568. [Google Scholar] [CrossRef]
  135. Teang, L.; Wongwatcharapaiboon, J.; Irvine, K.N.; Jamieson, I.; Rinchumphu, D. Modelling the impact of water sensitive urban design on pluvial flood management in a tropical climate. In Proceedings of the 12th Built Environment Research Associates Conference, BERAC2021, Bangkok, Thailand, 28 June 2021; pp. 350–359. Available online: https://www.berac.tds.tu.ac.th/proceedings_files/berac2021/BERAC2021_Proceeding.pdf (accessed on 25 January 2022).
  136. Loc, H.H.; Do, Q.H.; Cokro, A.; Irvine, K.N. Deep neural network analyses of water quality time series associated with water sensitive urban design (WSUD) features. J. Appl. Water Eng. Res. 2020, 8, 313–332. [Google Scholar] [CrossRef]
  137. Krueathep, W. Thai local administration’s readiness for Smart City initiatives. Unisearch J. 2018, 5, 38–42. [Google Scholar]
  138. Nava Nakkorn Public Company Limited Annual Report. 2019. Available online: http://nncl.listedcompany.com/misc/ar/20200429-nncl-ar2019-en.pdf (accessed on 16 August 2021).
  139. Popescu CR, G.; Popescu, G.N. An exploratory study based on a questionnaire concerning green and sustainable finance, corporate social responsibility, and performance: Evidence from the Romanian business environment. J. Risk Financ. Manag. 2019, 12, 162. [Google Scholar] [CrossRef] [Green Version]
  140. Everett, G.; Adekola, O.; Lamond, J. Developing a blue-green infrastructure (BGI) community engagement framework template. Urban Des. Int. 2021, 1–17. [Google Scholar] [CrossRef]
Figure 1. Research workflow for the project.
Urbansci 06 00007 g001
Figure 2. Study area, with Phra Nakhon Si Ayutthaya province shaded green and Pathum Thani province shaded gold. Graphics credits to Chaowat Chamnangit, Natthatida Suwanyothin, Chadchaya Wongsiri, Soichiro Sugimoto, UD327 class.
Urbansci 06 00007 g002
Figure 3. Land use in the VRU/Nava Nakorn/Thammasat University corridor of the superblock, 2020. The white area between Nava Nakorn and AIT is idle land. Graphics credits to Thanakit Singduang, Thanyamon Traimittaparp, Areerat Joemkor, Kotchakorn Chaiyatum, Apicha Promnao, Thannicha Charoenwan, Thanawit Likhitworasak, Phatharamon Panon, Nanthicha Jiwatjanarodom, AR416 class.
Urbansci 06 00007 g003
Figure 4. Envisioned land use in the VRU/Nava Nakorn/Thammasat University corridor of the superblock, 2060. Graphics credits to Thanakit Singduang, Thanyamon Traimittaparp, Areerat Joemkor, Kotchakorn Chaiyatum, Apicha Promnao, Thannicha Charoenwan, Thanawit Likhitworasak, Phatharamon Panon, Nanthicha Jiwatjanarodom, AR416 class.
Urbansci 06 00007 g004
Figure 5. Visioning of green space and community space in the Nava Nakorn heartland with area A including a stormwater retention pond, a green-roof exhibit hall, an eco-park, and an outdoor community-events center. Area B represents a community park and community center. Graphics credits to Kanokwan Srisamer, Manus Janthik, Panyawat Terdkeat, Wipawee Khantikittikul, UD327 class.
Urbansci 06 00007 g005
Figure 6. VRU/Nava Nakorn/Thammasat University corridor development vision, with the themes of blurring boundaries in land use, creating urban connectivity within the smart district, and creating a new ecology through enhanced green space planning and connectivity. The extension of the SRT Dark Red Line to Nava Nakorn is visioned to the west, with enhanced internal connectivity of shuttle-bus service represented by the red arrows. Graphics credits to Thanakit Singduang, Thanyamon Traimittaparp, Areerat Joemkor, Kotchakorn Chaiyatum, Apicha Promnao, Thannicha Charoenwan, Thanawit Likhitworasak, Phatharamon Panon, Nanthicha Jiwatjanarodom, AR416 class.
Urbansci 06 00007 g006
Figure 7. Master-plan overview of Smart City development within the VRU/Nava Nakorn/Thammasat University corridor. Planning zones A, B, and C are outlined with blue lines and are shown in more detail in Figure 8a–c.
Urbansci 06 00007 g007
Figure 8. (a) Master-plan overview of zone A (from Figure 6), emphasizing development opportunities in the immediate area of the Nava Nakorn BTS station. Graphics credits in Figure 6 and Figure 7 to Thanakit Singduang, Thanyamon Traimittaparp, Areerat Joemkor, Kotchakorn Chaiyatum, Apicha Promnao, Thannicha Charoenwan, Thanawit Likhitworasak, Phatharamon Panon, Nanthicha Jiwatjanarodom, AR416 class. (b) Master-plan overview of zone B (from Figure 6), smartvillage development with ample connected green space/public space to enhance livability and manage localized flooding. (c) Master-plan overview of zone C (from Figure 6), Nava Nakorn gateway, including potential Digital Village and residential development.
Urbansci 06 00007 g008aUrbansci 06 00007 g008bUrbansci 06 00007 g008c
Figure 9. Shuttle-bus network and dedicated bike paths connecting the SRT red line extension terminus with the heartland of Nava Nakorn. Graphics credits to Thanakit Singduang, Thanyamon Traimittaparp, Areerat Joemkor, Kotchakorn Chaiyatum, Apicha Promnao, Thannicha Charoenwan, Thanawit Likhitworasak, Phatharamon Panon, Nanthicha Jiwatjanarodom, AR416 class.
Urbansci 06 00007 g009
Figure 10. (a) Neighborhood scale master plan for the Digital-Village area (outlined in red). Graphics credits to Chaowat Chamnangit, Natthatida Suwanyothin, Chadchaya Wongsiri, Soichiro Sugimoto, UD327 class. (b) Digital Village Business Hub (1/D1, Figure 10a). Graphics credits to Tanavara Chawanid, Paveena Kusaranukun, Manita Intarachaisri, Yuto Motani, UD327 class. (c) Digital Village Creative Design and Innovation Center (D2 in Figure 10a). Graphics credits to Tanavara Chawanid, Paveena Kusaranukun, Manita Intarachaisri, Yuto Motani, UD327 class. (d) Intergenerational apartment complex, transportation node, hotel and commercial complex (H in Figure 10a). “Adaptimistic” here represents the branding concept of being both adaptable in design and function and optimistic about future development. Graphics credits to Tanavara Chawanid, Paveena Kusaranukun, Manita Intarachaisri, Yuto Motani, UD327 class.
Urbansci 06 00007 g010aUrbansci 06 00007 g010b
Figure 11. Collage of Digital-Village workspace, with an emphasis on co-working space. Graphics credits to Tanavara Chawanid, Paveena Kusaranukun, Manita Intarachaisri, Yuto Motani, UD327 class.
Urbansci 06 00007 g011
Figure 12. Integrated residential, commercial, and educational opportunities, with diverse green space/public space in the Digital Village Fora Estuary concept. Graphics credits to Kanokwan Srisamer, Manus Janthik, Panyawat Terdkeat, Wipawee Khantikittikul, UD327 class.
Urbansci 06 00007 g012
Figure 13. (a) Fora Estuary focus on integrated but diverse green space/public space, water-sensitive urban design, and smart living. Graphics credits to Kanokwan Srisamer, Manus Janthik, Panyawat Terdkeat, Wipawee Khantikittikul, UD327 class. (b) Design collage of the Fora Estuary, showing the integration of green space/public space and residential areas. Graphics credits to Kanokwan Srisamer, Manus Janthik, Panyawat Terdkeat, Wipawee Khantikittikul, UD327 class.
Urbansci 06 00007 g013aUrbansci 06 00007 g013b
Figure 14. Vision for expanded public-transit/shuttle-bus routes to connect the Nava Nakorn community with the local university clusters to the north and south. Graphics credits to Apicha Promnao, Kotchakorn Chaiyatum, Phatharamon Panon, Thanakit Singduang, Thannicha Charoenwan, AR416 class.
Urbansci 06 00007 g014
Figure 15. Smart Mobility vision for the main east–west corridor of Nava Nakorn with public transit, private automobile roads, sidewalks, bicycle paths, and bioswales for stormwater drainage. Graphics credits to Chaowat Chamnangit, Natthatida Suwanyothin, Chadchaya Wongsiri, and Soichiro Sugimoto, UD327 class.
Urbansci 06 00007 g015
Figure 16. Spin Bus app with multiple windows (above, left) and integration of app with bus stop designs (above, right, and bottom). Graphics credits to Theerawan Junditthawong, Sajin Vimolpitayarat, Sakdithat Sopon, Parin Prakitsuwan, Satakamol Patcharatsathien, DBT244 class.
Urbansci 06 00007 g016aUrbansci 06 00007 g016b
Figure 17. Theoretical development of Spin Bus app using the customer journey design principles that identify and assess each touch point to optimize the trip experience. Graphics credits to Theerawan Junditthawong, Sajin Vimolpitayarat, Sakdithat Sopon, DBT244 class.
Urbansci 06 00007 g017
Publisher’s Note: MDPI stays neutral with regard to jurisdictional claims in published maps and institutional affiliations.

