Article

Gray (Oreochromis niloticus x O. aureus) and Red (Oreochromis spp.) Tilapia Show Equal Susceptibility and Proinflammatory Cytokine Responses to Experimental Tilapia Lake Virus Infection

1
Department of Basic Sciences and Aquatic Medicine, Faculty of Veterinary Medicine, Norwegian University of Life Sciences, P.O. Box 369, Dep NO-0102, 1430 Ås Oslo, Norway
2
Department of Biotechnical and Diagnostic Sciences, College of Veterinary Medicine Animal Resources and Biosecurity, Makerere University, P.O. Box 7062, Kampala, Uganda
3
Phibro Animal Health Corporation, R&D Vaccines, Ha’melacha St. 3, POB 489, West Industrial Zone, Beit-Shemesh 99100, Israel
*
Author to whom correspondence should be addressed.
Submission received: 13 August 2019 / Revised: 18 September 2019 / Accepted: 19 September 2019 / Published: 24 September 2019
(This article belongs to the Section Animal Viruses)

Abstract

:
Tilapia is the second most farmed fish species after carp in the world. However, the production has come under threat due to emerging diseases such as tilapia lake virus (TiLV) that causes massive mortalities with high economic losses. It is largely unknown whether different tilapia strains are equally susceptible to TiLV infection. In the present study we compared the susceptibility of gray (Oreochromis niloticus x O. aureus) and red tilapia (Oreochromis spp.) to experimental TiLV infection. Virus was injected intraperitoneally at a concentration of 104 TCID50/mL. Our findings show that gray tilapia had a lower mortality, 86.44%, but statistically not significantly different (p = 0.068) from red tilapia (100%). The duration of the mortality period from onset to cessation was similar for the two species, starting at 2–3 days post challenge (dpc) with a median at 10–11 dpi and ending on 20–22 dpi. In addition, there was no difference between species in mean viral loads in brain, liver and headkidney from fish collected soon after death. As for host response, expression levels of IL-1β and TNFα were equally high in brain and headkidney samples while levels in liver samples were low for both red and gray tilapia, which coincides with lower viral loads in liver compared to brain and headkidney for both species. We find that red and gray tilapia were equally susceptible to TiLV infection with similar post challenge mortality levels, equal virus concentration in target organs and similar proinflammatory cytokine responses in target and lymphoid organs at time of death. Nonetheless, we advocate that the search for less susceptible tilapia strains should continue with the view to reduce losses from TiLV infection in aquaculture.

1. Introduction

Tilapia is a common name for a group of cichlid fish that consist of close to 100 species. In the last decade tilapia has become the second most farmed fish species after carp worldwide [1]. Of the cultured tilapia, Nile tilapia (Oreochromis niloticus) accounts for the largest proportion (69.33%), followed by Tilapia nei (21.94%), Blue-Nile hybrid tilapia (Oreochromis aureus x O. niloticus) (7.80%), Mozambique tilapia (Oreochromis mossambicus) (0.01%) while the rest account for <0.01% [1]. However, the expansion of tilapia production has come under threat due to emerging diseases [2] with the most recent being tilapia lake virus (TiLV) having the potential to cause high economic losses [3,4]. TiLV is a negative sense single stranded RNA (−ssRNA) virus with 10 segments [3,5]. It is the only member in the genus Tilapinevirus in the Amnoonviridae family [6]. Since its first report in Israel in 2014, TiLV has been reported in various countries in Africa, Asia and South America where it has been associated with high mortalities [5,7,8,9,10,11]. However, there are reports of subclinical infections based on detection of TiLV nucleic acids while high mortalities associated with high replication of virus occur during the hot summer months [10,12,13].
Reports from TiLV affected farms show varying degrees of susceptibility among tilapiines [3,14,15,16]. Surachetpong et al. [9] reported TiLV massive outbreaks leading to varying mortality between 20–70% from 32 farms that involved Nile tilapia and red hybrid tilapia (Oreochromis spp.) in Thailand. They observed that mortalities were highest soon after transfer from hatcheries at grow-out stage in ponds and cages in the rivers. Similar outbreaks with varying mortality involving different tilapia strains have been reported in hot summer months in Israel [3]. Ferguson et al. [4] reported high mortality (80%) in a local on-farm genetically bred strain of Nile tilapia called “Chitralada” in Ecuador. On the contrary, another strain of Nile tilapia comprising of genetically bred males brought in from another producer remained uninfected. Similar to observations made by Surachetpong et al. [9], they noted that mortalities were highest soon after transfer from hatcheries to cages at the beginning of the grow-out stage. Tattiyapong et al. [14] reported lower mortality of 66% in red tilapia (Oreochromis spp.) compared to Nile tilapia (86%) experimentally injected by TiLV. Mugimba et al. [13] detected subclinical TiLV infections in farmed and wild Nile tilapia in Lake Victoria in Eastern Africa. Put together, these observations point to differences in susceptibility among tilapia strains. It still remains unknown whether there are underlying biological factors linked to differences in susceptibility among tilapia strains. A good understanding of differences in susceptibility among tilapia strains is vital for selective breeding of TiLV resistant strains for use in aquaculture.
The objective of this study was to determine whether gray and red tilapia are equally susceptible to TiLV based on post challenge mortality. In addition, we wanted to determine whether gray and red tilapia succumb to the same level of viral loads at the point of death as well as to determine whether they mount the same level of host responses based on proinflammatory cytokine responses. Hence, we compared the susceptibility of gray (O. niloticus x O. aureus) and red (Oreochromis spp.) hybrid tilapia to TiLV infection by comparing their post challenge survival proportions (PCSP) after intraperitoneal injection of the virus. We also examined if virus concentration in targets (liver and brain) and lymphoid (headkidney) organs was linked to mortality and compared findings in gray and red tilapia. Further, we compared the expression levels of the proinflammatory cytokines IL-1β and TNFα in the target and lymphoid organs of the two species as measures of host response to TiLV infection. Overall, we anticipate that data presented herein will contribute to understanding the differences to TiLV susceptibility among tilapiines.

2. Materials and Methods

2.1. Experimental Design

A total of 139 red tilapia hybrid (Oreochromis spp.) [4] and 142 gray tilapia hybrid (O. niloticus x O. aureus) weighing approximately 30 g, were used for the study. Six fish from each group (gray and red tilapia) were randomly selected and used for clinical examination followed by screening of various pathogens to ensure that fish used in the study were free of infections. The pathogens screened included TiLV, Streptococcus agalactiae, S. iniae and Aeromonas hydrophila. The remaining 133 red hybrid were divided into Tanks 1A and 1B with 43 and 30 fish for the TiLV challenge experiment, respectively, while the control red tilapia were divided into tanks 2A and 2B with each tank having 30 fish. Similarly, the remaining 136 gray tilapia for TiLV experimental challenge were divided into tanks 3A and 3B with 44 and 32 fish, respectively, while the control gray tilapia put in Tanks 4A and 4B were allocated 30 fish per tank. All fish used were obtained from Nir David Hatchery in Israel. All experiments were approved by the Norwegian Food Safety Authority (Mattilsynet FOTS ID: 18037 Date: 12 June 2019) After acclimatization for seven days in a re-circulation airflow system (RAS) at 28 °C, all used for experimental TiLV infection were intraperitoneally injected with 0.1 mL of virus at a concentration of 104 TCID50/mL while all control fish were intraperitoneally injected with 0.1 mL phosphate buffered saline (PBS). The choice of challenge dose was based on a preliminary comparative study in which we found that the challenge dose of 104 and 105 TCID50/mL produced similar high mortality (>80%) while a challenge dose of 103 TCID50/mL produced significantly low mortality (<60%). Therefore, 104 TCID50/mL was chosen given its ability to produce high mortality (>80%) similar to ≥105-TCID50/mL. Fish were fed ad libitum daily using commercial feed (Raanan fish feed, Israel). Fish were monitored daily for clinical signs and mortalities after TiLV challenge. All moribund fish were closely monitored, and all dying fish were collected soon after death. Liver, brain and headkidney samples were collected and stored in RNA later® until use and no sample was collected for histopathology. Mortality was recorded daily for the determination of post-challenge survival proportions (PCSPs) using the Kaplan Meyer’s survival analysis.

2.2. RNA Extraction and cDNA Synthesis

Approximately 30 mg of liver, brain and headkidney tissues were homogenized in 1 mL Trizol reagent by bead beating with intermittent cooling on ice as previously described [17,18]. Homogenates were then centrifuged at 12,000× g for 10 min at 4 °C. Thereafter, the supernatant was transferred to new Eppendorf tubes and 0.2 mL chloroform was added followed by vortexing for 15 s. The mixture was incubated at room temperature for 5 min followed by centrifugation at 12,000× g for 15 min. Thereafter, the aqueous phase was transferred to new Eppendorf tubes followed by adding equal volume of freshly prepared 70% ethanol. After vortexing, the mixture was transferred to RNeasy spin columns. Thereafter, the Qiagen protocol was used based on the manufacturer’s guidelines (Qiagen, Hilden, Germany). RNA quality and quantification were measured using a Gen 5 3.0 microplate reader (BioTek Instrument Inc., Highland Park, Peabody, MA, USA) and gel electrophoresis analysis.
cDNA synthesis was carried out in 20 μL reaction volume using the Transcriptor First Strand cDNA Synthesis Kit (Roche diagnostics, Risch-Rotkreuz, Switzerland), which has a DNase treatment step, in two steps. Step one involved mixing 1 µg of template RNA with 2.5 µM Ancored-oligo (dT)18 primer and 60 µM random hexamer in a total volume of 13 µL. This mixture was treated with a denaturation step by heating at 65 °C for 10 min to remove secondary RNA structures followed by immediate cooling at 4 °C. The second step involved adding 8 nM MgCl2, 20 U of protector RNase inhibitor, 1 mM dNTPs and 10 U of transcriptor reverse transcriptase to each tube making final reaction volumes of 20 µL. The run profile in the second step was 25 °C for 10 min, 50 °C for 60 min and final reverse transcriptase inactivation step at 85 °C for 5 min. Reverse transcriptase has RNase H activity that removes RNA remnants improving downstream applications of the cDNA. This kit was selected because it uses Oligo-dT primers that have been reported to provide a reliable representation of the mRNA pool in the original RNA extract [19]. The final cDNA was stored at −20 °C until use for qRT-PCR assay.

2.3. Quantification of TiLV by Quantitative Real Time PCR in Tissue Samples

Virus quantification was carried out using cDNA synthesized from brain, liver and headkidney samples as described above. Primers targeting TiLV segment 3 (NCBI Genbank Acc No. KU552132) were designed using CLC workbench (Table 1). The LightCycler qPCR protocol composed of 95 °C denaturing step for 5 min, followed by 30 cycles of 95 °C for 10 s, 58 °C for 20 s and 72 °C for 10 s. This was followed by melting curve analysis as previously described [20]. Virus quantification was carried out by generating a linear standard curve using supernatants from TiLV infected TFC#10 cells whose concentration varied from 106 TCID50/mL to 100 TCID50/mL as previously described in our studies [21].

2.4. Gene Expression Analysis

Quantitative Real time PCR (qRT-PCR) was carried out using the SYBR® green (Roche Applied BioSciences, Penzberg, Germany) detection method as previously described [17] to determine IL-1β and TNFα expression levels in the liver, brain and headkidney tissues from fish collected at 5, 9, 12 and 18 days soon after death during the mortality period. Primers for IL-1β and TNFα including the β-actin internal control genes were designed in the CLC workbench version 6 [22] (Table 1). qRT-PCR amplification cycles were carried out in a 96 Light-Cycler® machine (Roche Applied BioSciences) while reactions were performed as described above using the following cycling conditions: 95 °C for 10 min initial denaturation; 95 °C for 3 s, annealing temperatures for 10 s, 72 °C for 30 s at 45 cycles. Melting curve analysis was done at 95 °C for 5 s followed by 65 °C for 1 min. Transcription levels for the target genes were quantified relative to the β-actin internal control genes using the delta–delta method as previously described [19].

2.5. Statistical Analysis

The Kaplan Meyer’s survival analysis was used to compute the proportion of fish that survived the TiLV challenge using mortality data recorded on a daily basis in GraphPad Prism® versions 5.0, while the Cox hazard risk analysis was used to compare the risk of TiLV infected gray and red tilapia relative to the uninfected control fish. The Cq mean values obtained from qRT-PCR described above were used to calculate log2 fold change of IL-1β and TNFα as previously described using β-actin as the internal control housekeeping gene [23]. Data analysis was performed in Prism version 5.0.

3. Results

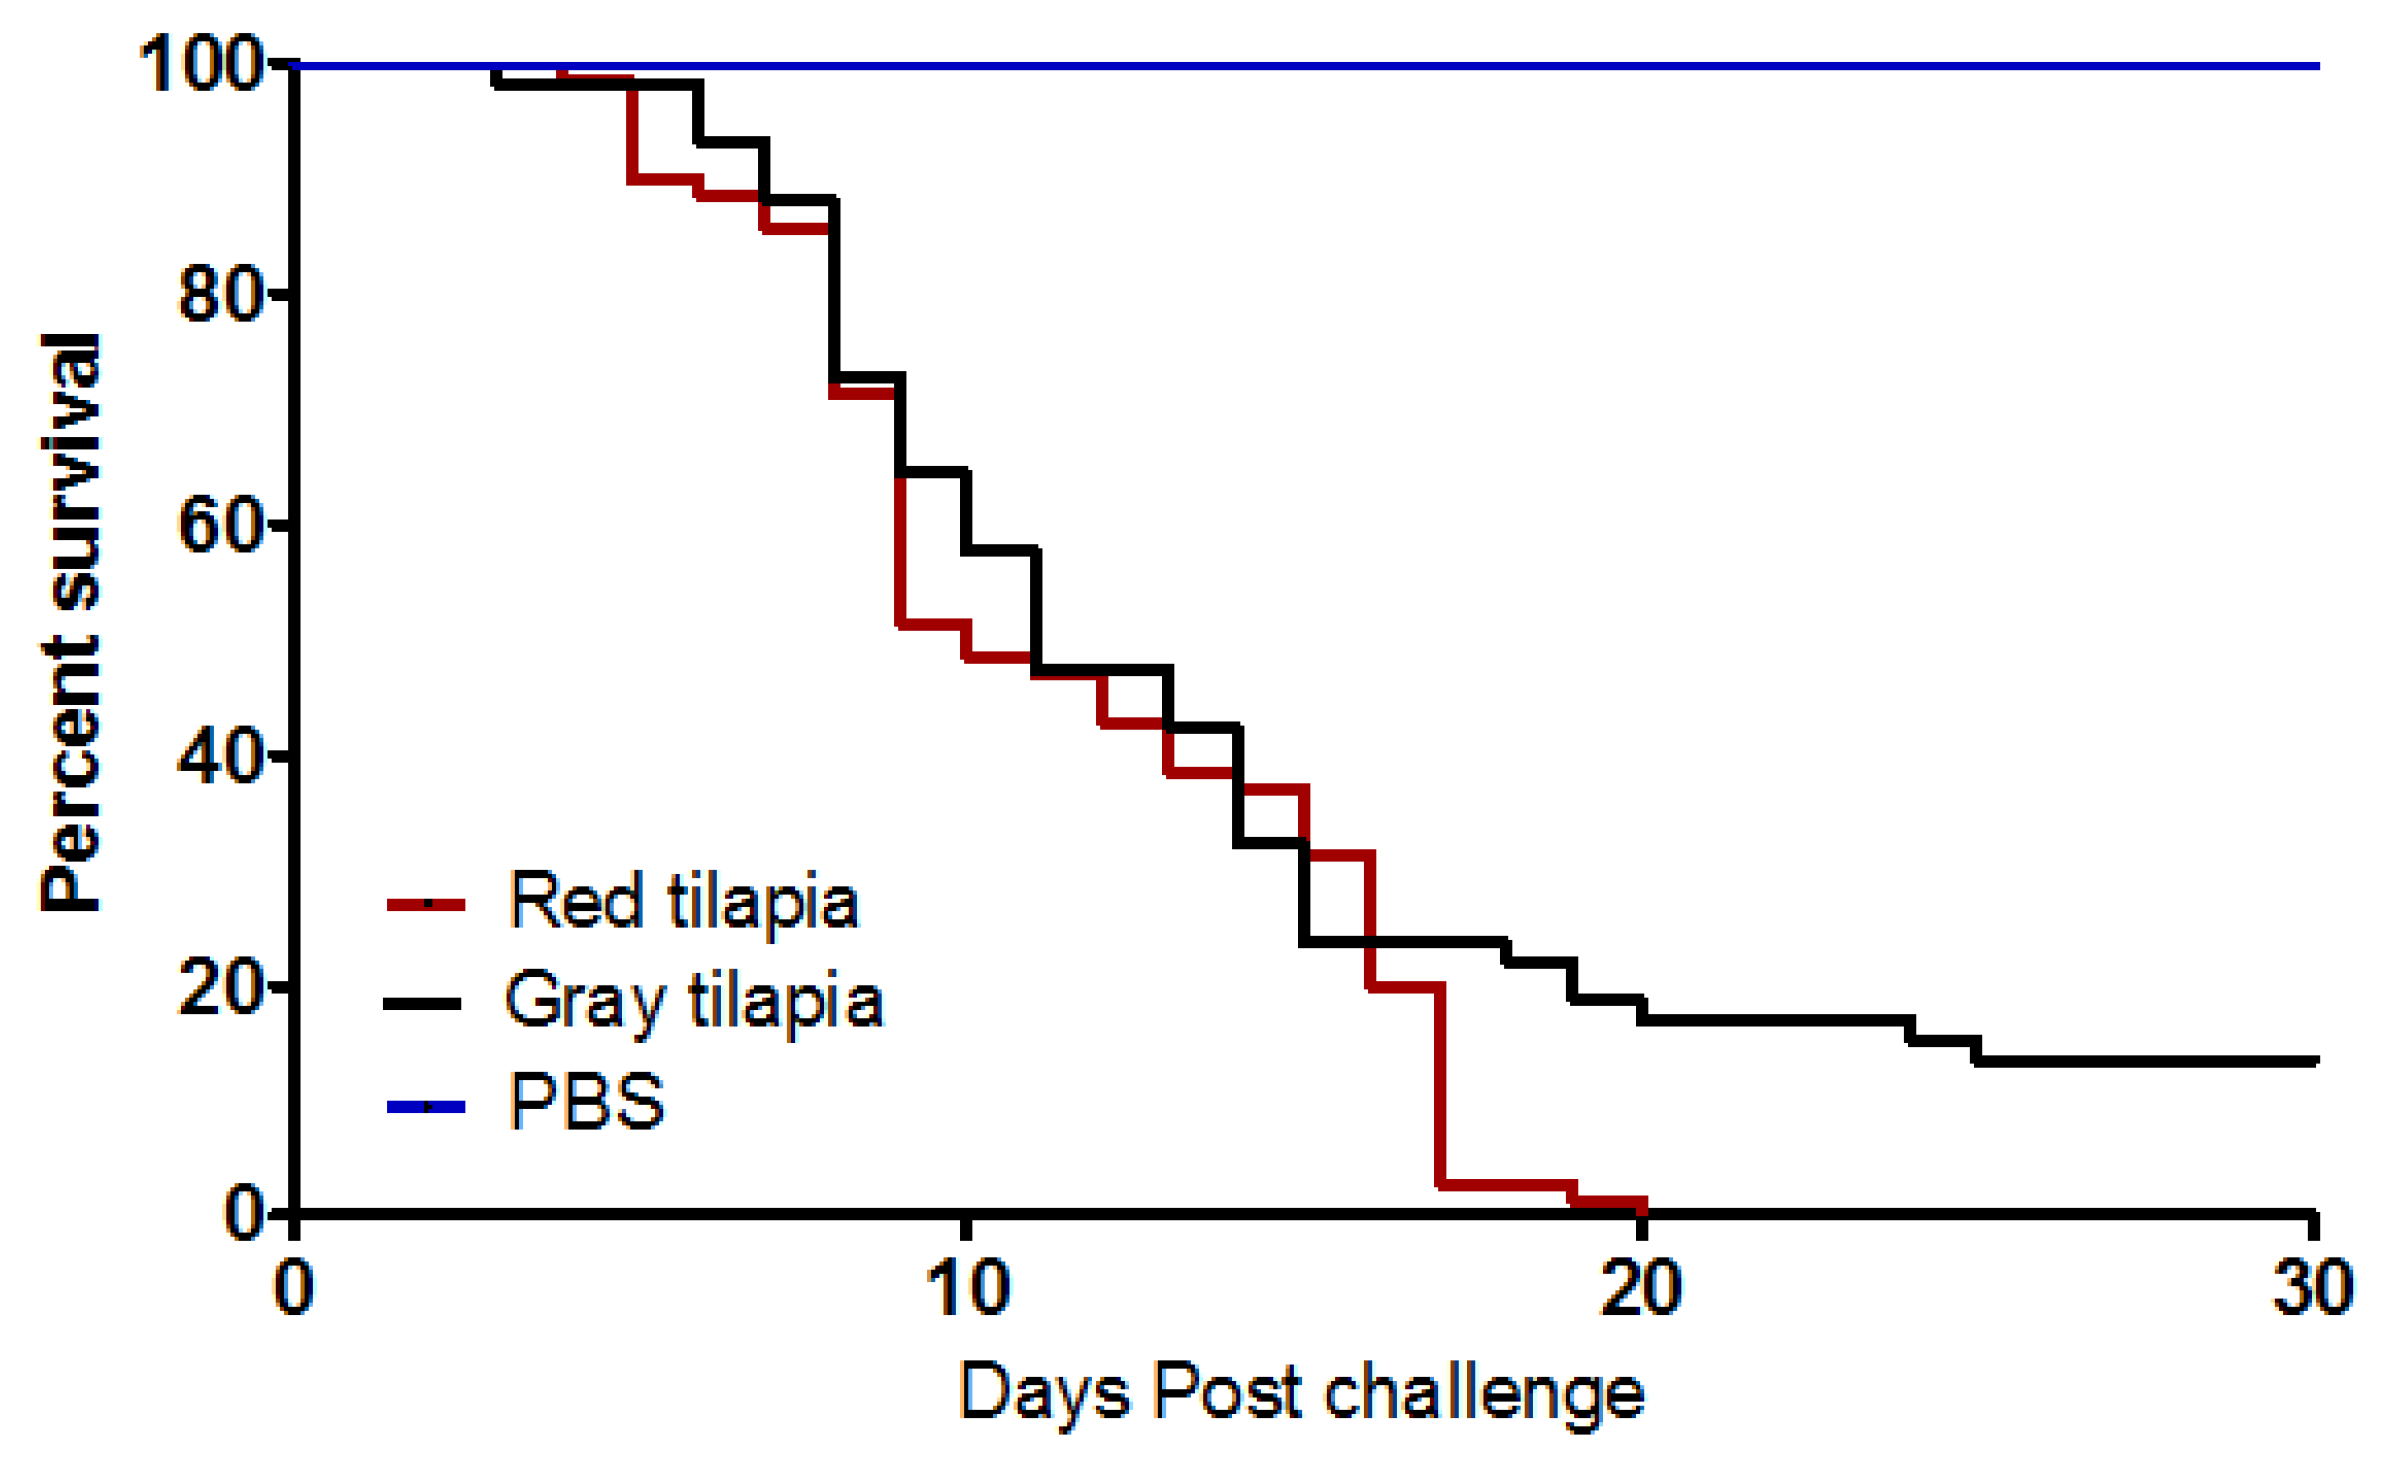
3.1. Clinical Observations and Kaplan Meyer’s Survival Analysis

Post challenge clinical observations mainly comprised of irregular swimming behavior starting at 2 days post challenge (dpc). Gross pathological changes were characterized by hemorrhages on skin surfaces especially around the gill operculum and basal fin area. Some fish showed signs of exophthalmia. Survival analysis showed end-point survival of 13.56% and 0% for grey and red tilapia, respectively. The onset of mortality for gray and red tilapia started at 2 and 3 dpc (Figure 1), respectively. The median of 50% mortality for gray and red tilapia was at 10 and 11 dpi (Table 2), respectively, and mortality continued up to 20 dpi. Red and gray tilapia had the same duration of mortality from onset (2–3 dpi), through median mortality (11–12 dpi) ending at 20–22 dpi (Figure 1). There was no significant difference (p = 0.068) in mortality between red and gray tilapia. Table 2 shows that the risk of red tilapia (19.51) dying due to TiLV was slightly higher than gray tilapia (16.98).

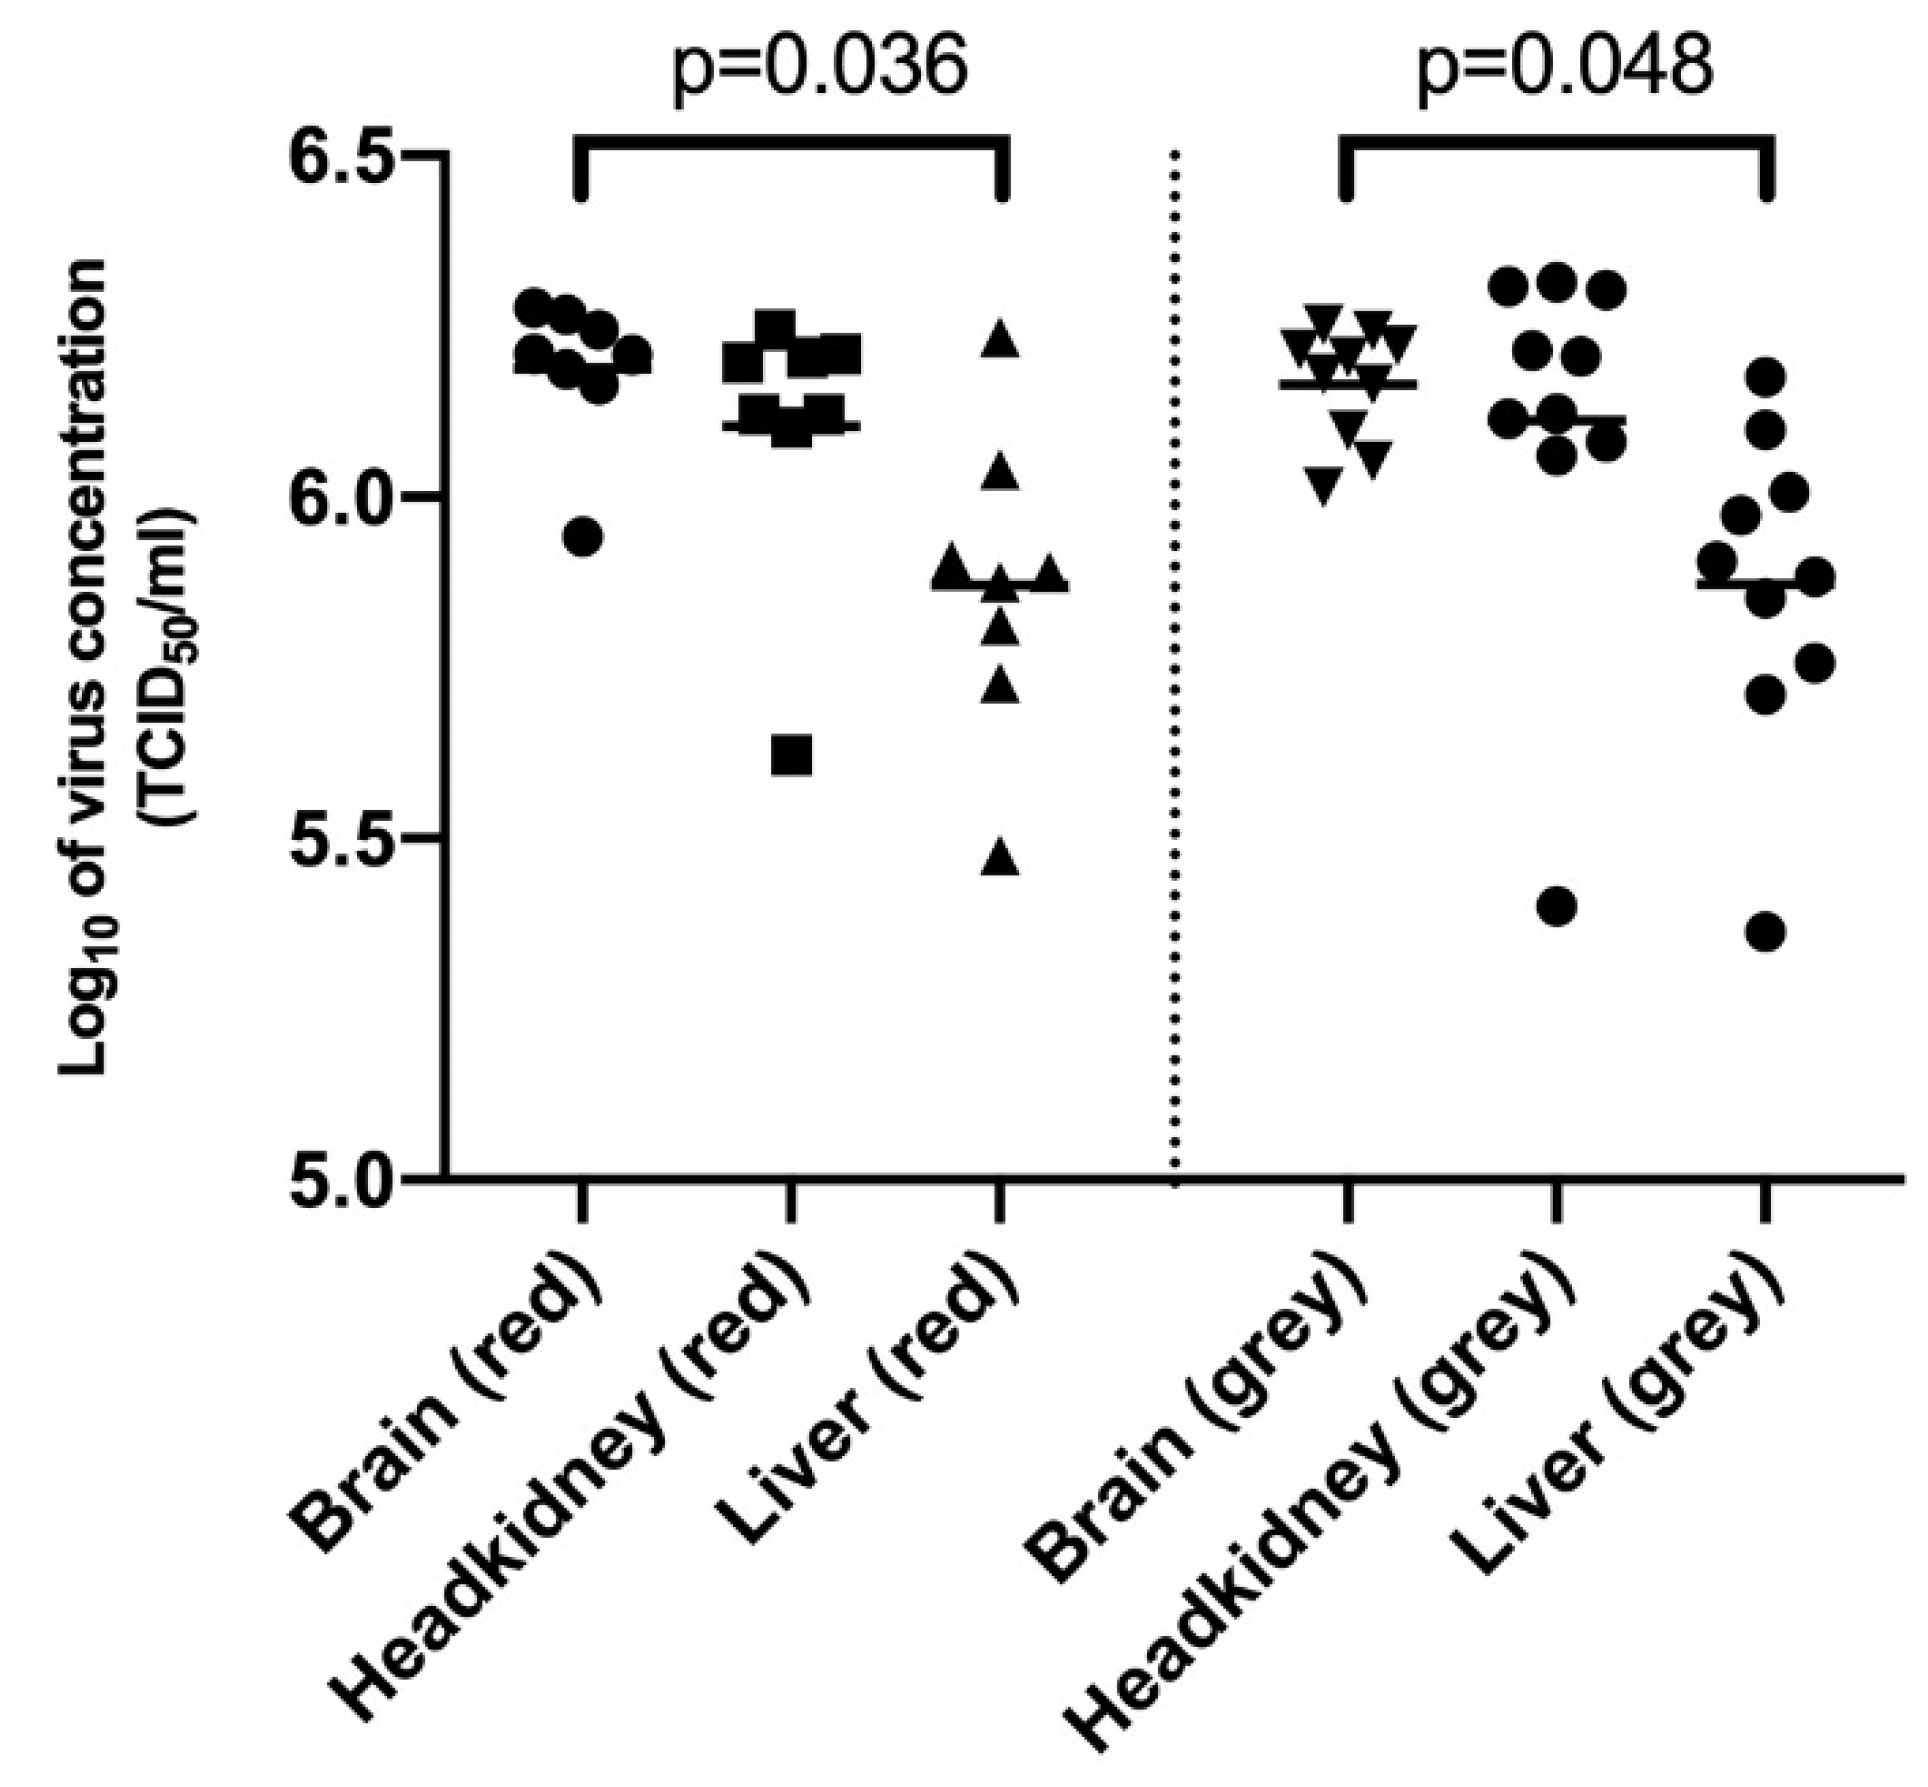
3.2. Comparison of Virus Concentration in Brain, Headkidney and Liver Samples

Figure 2 shows quantification of TiLV in brain, headkidney and liver tissues of gray and red tilapia collected at four different time-points over the course of the challenge period. The mean virus concentration for the brain, headkidney and liver samples was estimated at 6.188, 6.103 and 5.871 log10 TCID50/mL for red tilapia, respectively. The mean virus concentration for the liver was significantly lower (p = 0.0361) than the mean virus quantity for brain samples for red tilapia. However, there was no significant difference (p > 0.9999) in the mean virus concentration between brain and headkidney, as well as between headkidney and liver samples (p = 0.6536) for red tilapia. The mean virus concentration for the brain, headkidney and liver samples for gray tilapia was estimated at 6.164, 6.112 and 5.872 log10 TCID50/mL, respectively. The mean virus concentration (over the course of the challenge period) for the liver was significantly lower (p = 0.048) than in brain samples, but there was no significant difference (p > 0.9999) between the brain and headkidney as well as between the liver and headkidney samples (p = 0.0565) for gray tilapia.

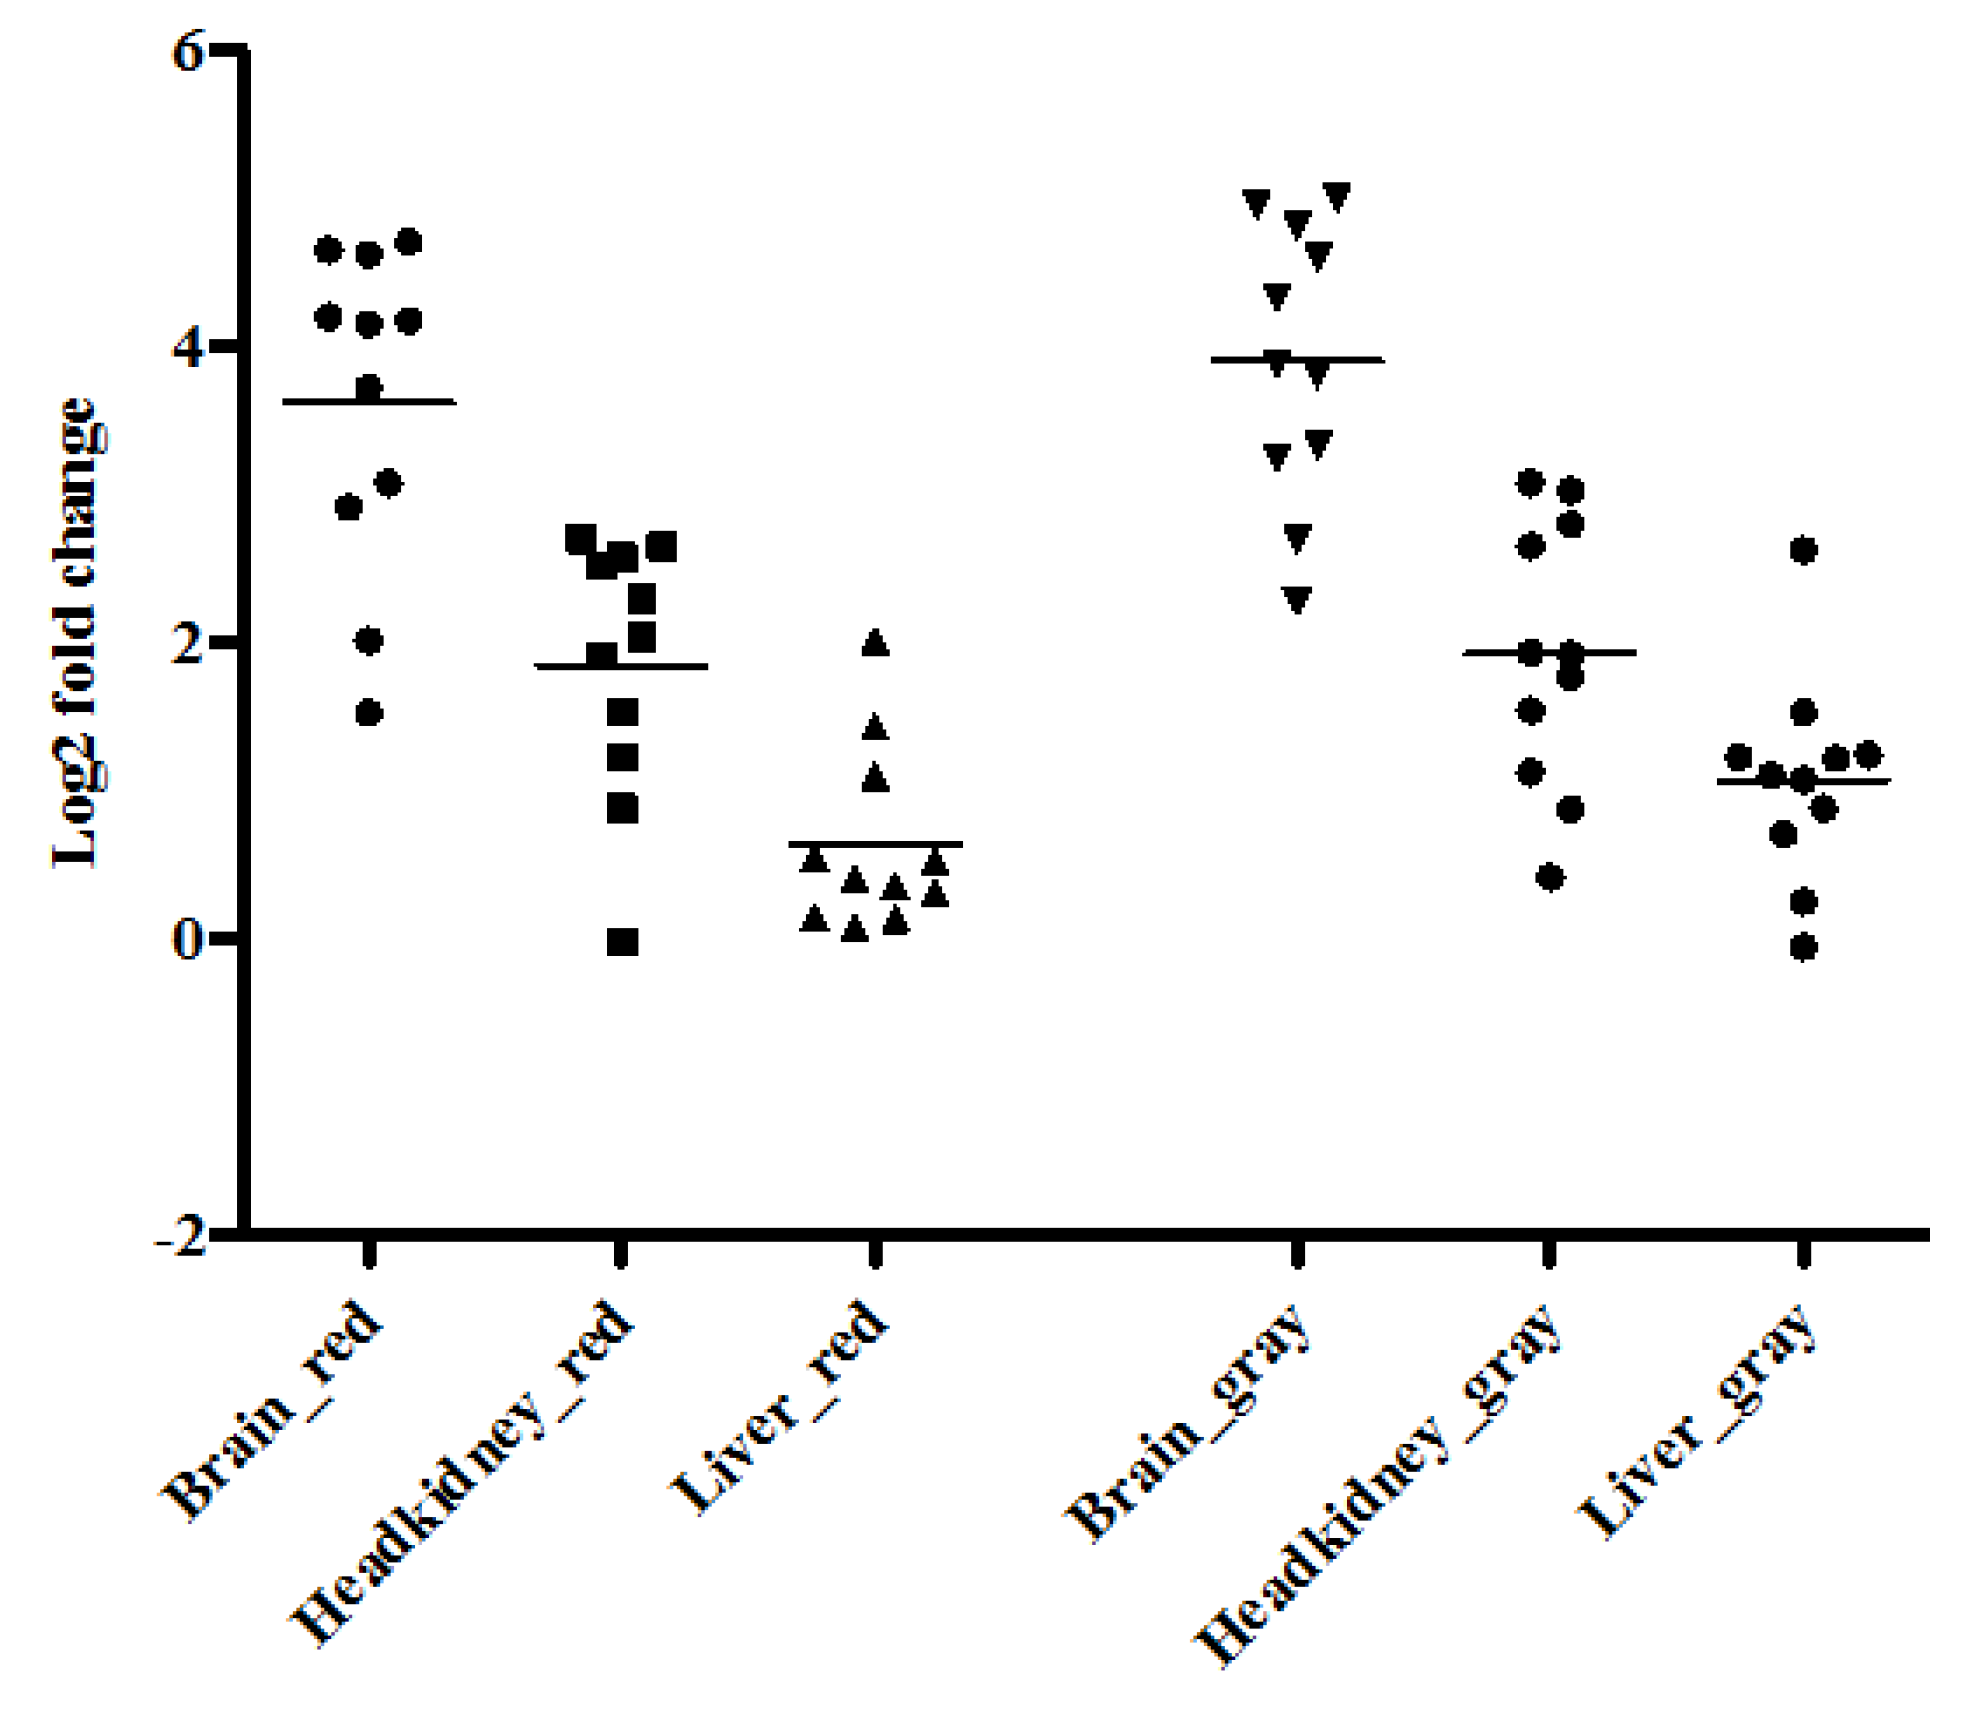
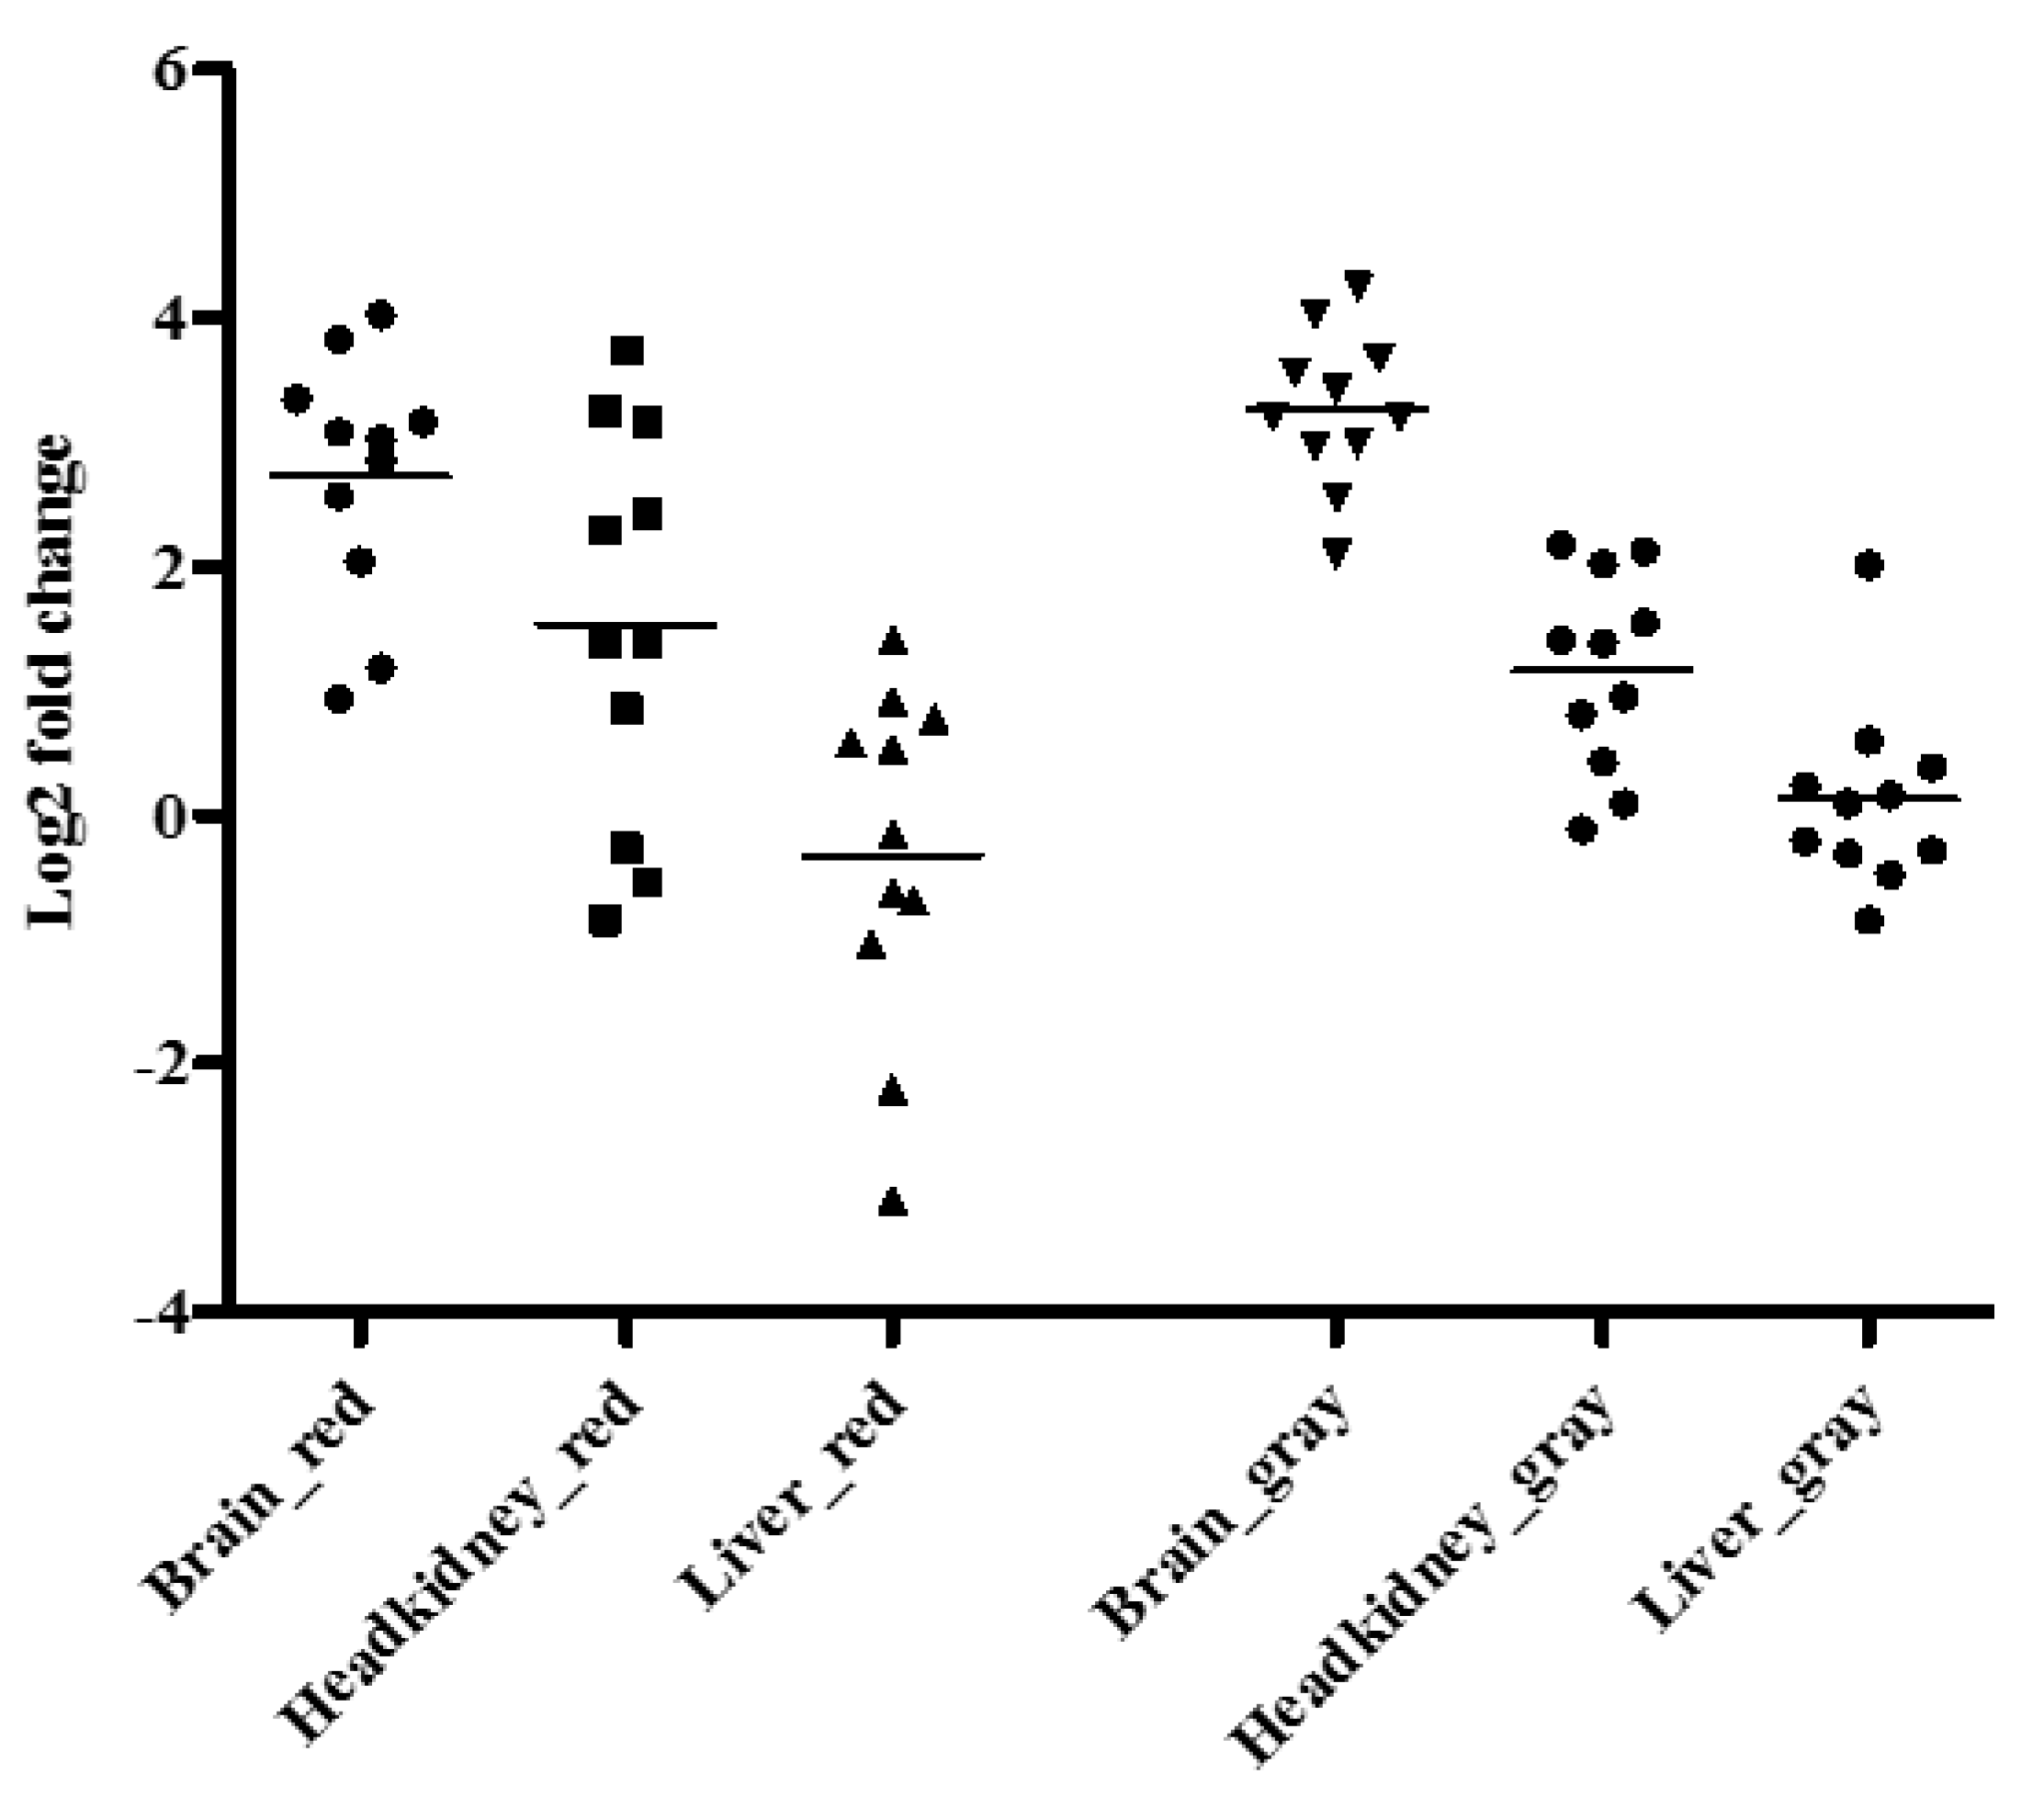
3.3. Gene Expression

Figure 3 shows a comparison of IL-1β expression levels in brain, headkidney and liver samples collected from red and gray tilapia at four different time-points over the challenge period. Generally, highest expression levels were in the brain followed by the headkidney. However, IL-1β expression levels were significantly lower in the liver than in the brain and headkidney samples for both red and gray tilapia. The mean Log2 fold change for IL-1β for red tilapia was estimated at 3.615, 1.844, and 0.642 for brain, headkidney and liver samples, respectively, while the mean Log2 fold change for IL-1β for gray tilapia was estimated at 3.903, 1.921 and 1.072, for the brain, headkidney and liver for gray tilapia, respectively. As for comparison between red and gray tilapia, there was no significant difference (p = 0.513) in levels of IL-1β observed in brain samples between red and gray tilapia and no difference was observed in headkidney samples (p = 0.840) as well as in liver samples (p = 0.140) between the two tilapia strains.
Figure 4 shows expression levels of TNFα for brain, headkidney and liver for red and gray tilapia. The mean log2 fold change in levels of TNFα in the brain, headkidney and liver samples for red tilapia were 2.729, 1.529 and −0.326, respectively, while the mean Log2 fold change for TNFα for gray tilapia was estimated at 3.265, 1.164 and 0.122 for the brain, headkidney and liver, respectively. There was no significant difference observed in expression levels of TNFα in brain (p = 0.143), headkidney (p = 0.507) or liver samples (p = 0.358) between red and gray tilapia.

4. Discussion

The main conclusion to be drawn from this study is that red and gray tilapia are equally susceptible to experimental TiLV infection. This aligns with similar viral titers in target organs and aligned cytokine responses post challenge. There was a higher end-point mortality in red tilapia but not statistically different from grey tilapia. Moreover, the dynamics of the mortality curve was similar for the two species with mortality starting at 2–3 dpi with a median of 10–11 dpi and cessation at 20–22 dpi. Cox hazard risk analysis showed no difference in risk of gray and red tilapia dying due to TiLV infection. These findings are in line with observations made for Nile tilapia, which is the most commercially used tilapia strain [1], in which high mortality (>80%) has been widely reported from various countries such as Peru, Ecuador and Thailand [4,9,11].
The brain and liver are considered the target organs for TiLV and liver damage has been linked to syncytial formation in hepatocytes, while brain pathology has been linked to irregular swimming seen in infected fish, consistent with clinical observations in this study [13,24]. As for comparison between red and gray tilapia, our findings show that there was no significance difference (p > 0.9999) in the mean virus concentration from brain samples obtained from the two tilapia strains as shown from 6.188 and 6.164 log10 TCID50/mL mean viral loads for red and gray tilapia, respectively. Similarly, there was no significance difference (p > 0.9999) in the mean virus concentration from headkidney samples as shown from the 6.103 and 6.112 log10 TCID50/mL mean viral loads for red and gray tilapia, respectively. This trend was also consistent for liver tissues (p > 0.9999) in which red and gray tilapia had mean viral loads of 5.871 and 5.872 log10 TCID50/mL, respectively. Put together, these findings point to equal permissiveness of TiLV replication in these organs. For some diseases, it has been shown that 107 TCID50/mL viral loads in target organs correspond with establishment of pathology and high mortality [25,26]. Although we did not assess pathology in target organs, it is likely that the high viral loads of 6.188, 6.103 and 5.871 log10 TCID50/mL for red tilapia and 6.164, 6.112 and 5.872 log10 for gray tilapia detected in brain, headkidney and liver samples could be linked to pathology. Further studies should be carried out to link viral load with pathology, as well as linking viral loads with mortality.
The viral loads in headkidney of both species are high, 106 TCID50/mL of tissue, and if this constitute a primary replication site for TiLV or drainage into lymphoid organs need to be better understood. There are also few studies addressing the pathology in headkidney during TiLV infection and additional studies would be required to better understand the role that headkidney play in the propagation of the infection. These observations imply that both red and gray tilapia succumb to similar viral loads in target and lymphoid organs at the point of death, consolidating our view that they are equally susceptible to TiLV infection.
Host responses play a role in protection and propagation of the infection/tissue damage as part of the infection. IL-1β and TNFα expression levels can be used to better understand the host response to infection and expression of IL-1β and TNFα in response to various infections has been reported previously in tilapia [27,28]. We found that the brain had the highest levels of IL-1β and TNFα expression followed by the headkidney while levels in the liver were low for both species. Both red and gray tilapia had comparable IL-1β and TNFα levels in the brain and headkidney and expression levels were similar at different points, which corresponded with equal viral loads across time points post challenge. The number of cytokines sequenced for tilapia is limited and other markers of viral infection, like interferon alpha and possibly gamma with down-stream effectors (Mx), would likely provide additional insight into the host responses to viral infection. However, up until now, these sequences are not available and future studies should include more detailed assessment of viral response genes when they become available, with an aim to better understand elements of host responses that fail to prevent viral progression.
In summary, we have shown that gray and red tilapia are equally susceptible to TiLV based on PCSP and virus quantification in target and lymphoid organs. In addition, the host response to TiLV infection, TNF-α and IL1-β mRNA expression was also similar. We advocate that the search for less susceptible tilapia strains to TiLV infection should continue with the view to finding resistant strains against this highly pathogenic virus.

Author Contributions

Conceptualization, K.K.M., S.T., S.M., A.D., Ø.E. and H.M.M.; formal analysis, K.K.M., Ø.E. and H.M.M.; funding acquisition, S.M., A.D., Ø.E. and H.M.M.; investigation, S.T., S.D., A.D., Ø.E. and H.M.M.; methodology, K.K.M., S.T., A.D., Ø.E. and H.M.M.; project administration, A.D., Ø.E. and H.M.M.; resources, A.D., Ø.E. and H.M.M.; supervision, Ø.E. and H.M.M.; validation, K.K.M. and S.D.; visualization, Ø.E. and H.M.M.; writing—original draft, K.K.M., Ø.E. and H.M.M.; Writing—review and editing, K.K.M., A.D., Ø.E. and H.M.M.

Funding

This work was in part funded by NORHED through capacity building project TRAHESA, project no. TAN/13/0027 and the BIOAQUA project no. 283566, funded by the Research Council of Norway.

Conflicts of Interest

The authors declare no conflict of interest.

References

  1. Food and Agriculture Organization of the United Nations. F.a.A.O. State of the World Fisheries and Aquaculture; Food and Agriculture Organization, United Nations: Rome, Italy, 2018. [Google Scholar]
  2. Machimbirike, V.I.; Jansen, M.D.; Senapin, S.; Khunrae, P.; Rattanarojpong, T.; Dong, H.T. Viral infections in tilapines: More than just tilapia lake virus. Aquaculture 2019, 503, 508–518. [Google Scholar] [CrossRef]
  3. Eyngor, M.; Zamostiano, R.; Tsofack, J.E.K.; Berkowitz, A.; Bercovier, H.; Tinman, S.; Lev, M.; Hurvitz, A.; Galeotti, M.; Bacharach, E. Identification of a novel rna virus lethal to tilapia. J. Clin. Microbiol. 2014, 52, 4137–4146. [Google Scholar] [CrossRef] [PubMed]
  4. Ferguson, H.; Kabuusu, R.; Beltran, S.; Reyes, E.; Lince, J.; del Pozo, J. Syncytial hepatitis of farmed tilapia, o reochromis niloticus (l.): A case report. J. Fish Dis. 2014, 37, 583–589. [Google Scholar] [CrossRef] [PubMed]
  5. Bacharach, E.; Mishra, N.; Briese, T.; Zody, M.C.; Tsofack, J.E.K.; Zamostiano, R.; Berkowitz, A.; Ng, J.; Nitido, A.; Corvelo, A. Characterization of a novel orthomyxo-like virus causing mass die-offs of tilapia. MBio 2016, 7, e00431-16. [Google Scholar] [CrossRef]
  6. Adams, M.J.; Lefkowitz, E.J.; King, A.M.Q.; Harrach, B.; Harrison, R.L.; Knowles, N.J.; Kropinski, A.M.; Krupovic, M.; Kuhn, J.H.; Mushegian, A.R.; et al. Changes to taxonomy and the international code of virus classification and nomenclature ratified by the international committee on taxonomy of viruses (2017). Arch. Virol. 2017, 162, 2505–2538. [Google Scholar] [CrossRef] [PubMed]
  7. Behera, B.; Pradhan, P.; Swaminathan, T.; Sood, N.; Paria, P.; Das, A.; Verma, D.; Kumar, R.; Yadav, M.; Dev, A. Emergence of tilapia lake virus associated with mortalities of farmed nile tilapia oreochromis niloticus (linnaeus 1758) in India. Aquaculture 2018, 484, 168–174. [Google Scholar] [CrossRef]
  8. Dong, H.; Ataguba, G.; Khunrae, P.; Rattanarojpong, T.; Senapin, S. Evidence of tilv infection in tilapia hatcheries from 2012 to 2017 reveals probable global spread of the disease. Aquaculture 2017, 479, 579–583. [Google Scholar] [CrossRef]
  9. Surachetpong, W.; Janetanakit, T.; Nonthabenjawan, N.; Tattiyapong, P.; Sirikanchana, K.; Amonsin, A. Outbreaks of tilapia lake virus infection, Thailand, 2015–2016. Emerg. Infect. Dis. 2017, 23, 1031. [Google Scholar] [CrossRef]
  10. Pulido, L.L.H.; Chìo, M.M.; Chaparro, A.L.H.; Dong, H.T.; Senapin, S. Tilapia lake virus (tilv) from peru is genetically close to the israeli isolates. Aquaculture 2019, 510, 61–65. [Google Scholar] [CrossRef]
  11. Fathi, M.; Dickson, C.; Dickson, M.; Leschen, W.; Baily, J.; Muir, F.; Ulrich, K.; Weidmann, M. Identification of tilapia lake virus in Egypt in nile tilapia affected by ‘summer mortality’ syndrome. Aquaculture 2017, 473, 430–432. [Google Scholar] [CrossRef]
  12. Senapin, S.; Shyam, K.; Meemetta, W.; Rattanarojpong, T.; Dong, H.T. Inapparent infection cases of tilapia lake virus (tilv) in farmed tilapia. Aquaculture 2018, 487, 51–55. [Google Scholar] [CrossRef]
  13. Mugimba, K.; Chengula, A.; Wamala, S.; Mwega, E.; Kasanga, C.; Byarugaba, D.; Mdegela, R.; Tal, S.; Bornstein, B.; Dishon, A. Detection of tilapia lake virus (ti lv) infection by pcr in farmed and wild nile tilapia (Oreochromis niloticus) from lake Victoria. J. Fish Dis. 2018. [Google Scholar] [CrossRef]
  14. Tattiyapong, P.; Dachavichitlead, W.; Surachetpong, W. Experimental infection of tilapia lake virus (tilv) in nile tilapia (oreochromis niloticus) and red tilapia (Oreochromis spp.). Vet. Microbiol. 2017, 207, 170–177. [Google Scholar] [CrossRef]
  15. Jaemwimol, P.; Rawiwan, P.; Tattiyapong, P.; Saengnual, P.; Kamlangdee, A.; Surachetpong, W. Susceptibility of important warm water fish species to tilapia lake virus (tilv) infection. Aquaculture 2018, 497, 462–468. [Google Scholar] [CrossRef]
  16. Abdullah, A.; Ramly, R.; Ridzwan, M.S.M.; Sudirwan, F.; Abas, A.; Ahmad, K.; Murni, M.; Kua, B.C. First detection of tilapia lake virus (tilv) in wild river carp (barbonymus schwanenfeldii) at Timah Tasoh lake, Malaysia. J. Fish Dis. 2018, 41, 1459–1462. [Google Scholar] [CrossRef]
  17. Munang’andu, H.M.; Fredriksen, B.N.; Mutoloki, S.; Dalmo, R.A.; Evensen, O. The kinetics of cd4+ and cd8+ t-cell gene expression correlate with protection in atlantic salmon (Salmo salar L.) vaccinated against infectious pancreatic necrosis. Vaccine 2013, 31, 1956–1963. [Google Scholar] [CrossRef] [PubMed]
  18. Munang’andu, H.M.; Sandtro, A.; Mutoloki, S.; Brudeseth, B.E.; Santi, N.; Evensen, O. Immunogenicity and cross protective ability of the central vp2 amino acids of infectious pancreatic necrosis virus in atlantic salmon (Salmo salar L.). PLoS ONE 2013, 8, e54263. [Google Scholar] [CrossRef]
  19. Bustin, S.; Benes, V.; Nolan, T.; Pfaffl, M.W. Quantitative real-time RT-PCR—A perspective. J. Mol. Endocrinol. 2005, 34, 597–601. [Google Scholar] [CrossRef]
  20. Gadan, K.; Sandtro, A.; Marjara, I.S.; Santi, N.; Munang’andu, H.M.; Evensen, O. Stress-induced reversion to virulence of infectious pancreatic necrosis virus in naive fry of atlantic salmon (Salmo salar L.). PLoS ONE 2013, 8, e54656. [Google Scholar] [CrossRef]
  21. Chengula, A.A.; Mugimba, K.K.; Shlomit, T.S.; Dubey, D.; Mutoloki, S.; Dishon, A.; Evensen, Ø.; Munang’andu, H.M. Comparison of efficiency and sensitivity for primers targeting all segments of tilapia lake virus (TiLV) using quantitative real-time PCR. J. Fish. Dis. 2019. (Submitted). [Google Scholar]
  22. CLC Workbench Version 6. Available online: https://www.qiagenbioinformatics.com/products/clc-genomics-workbench/ (accessed on 9 February 2019).
  23. Pfaffl, M.W. A new mathematical model for relative quantification in real-time RT–PCR. Nucleic Acids Res. 2001, 29, e45. [Google Scholar] [CrossRef] [PubMed]
  24. Kembou, J.T.; Zamostiano, R.; Watted, S.; Berkowitz, A.; Rosenbluth, E.; Mishra, N.; Briese, T.; Lipkin, W.; Kabuusu, R.; Ferguson, H. Detection of tilapia lake virus in clinical samples by culturing and nested reverse transcription-pcr. J. Clin. Microbiol. 2017, 55, 759–767. [Google Scholar] [CrossRef] [PubMed]
  25. Munang’andu, H.M.; Fredriksen, B.N.; Mutoloki, S.; Dalmo, R.A.; Evensen, O. Antigen dose and humoral immune response correspond with protection for inactivated infectious pancreatic necrosis virus vaccines in atlantic salmon (Salmo salar L.). Vet. Res. 2013, 44, 7. [Google Scholar] [CrossRef] [PubMed]
  26. Munang’andu, H.M.; Mutoloki, S.; Evensen, O. Acquired immunity and vaccination against infectious pancreatic necrosis virus of salmon. Dev. Comp. Immunol. 2014, 43, 184–196. [Google Scholar] [CrossRef]
  27. Zhi, T.; Xu, X.; Chen, J.; Zheng, Y.; Zhang, S.; Peng, J.; Brown, C.L.; Yang, T. Expression of immune-related genes of nile tilapia oreochromis niloticus after gyrodactylus cichlidarum and cichlidogyrus sclerosus infections demonstrating immunosupression in coinfection. Fish Shellfish Immunol. 2018, 80, 397–404. [Google Scholar] [CrossRef] [PubMed]
  28. Jantrakajorn, S.; Wongtavatchai, J. Francisella infection in cultured tilapia in Thailand and the inflammatory cytokine response. J. Aquat. Anim. Health 2016, 28, 97–106. [Google Scholar] [CrossRef] [PubMed]
Figure 1. Kaplan Meyer’s survival analysis comparing the post challenge survival proportions of gray and red tilapia injected by 1 × 10⁴ TCID50/mL of tilapia lake virus (TiLV) intraperitoneally.
Viruses 11 00893 g001
Figure 2. Comparison of virus concentration in the liver, brain and headkidney samples of gray tilapia (right panel) and red tilapia (left panel) compiled over the mortality period.
Viruses 11 00893 g002
Figure 3. Expression levels of IL1-β in brain, headkidney and liver samples of red and gray tilapia compiled over the mortality period.
Viruses 11 00893 g003
Figure 4. TNFα expression in the brain, headkidney and liver of gray and red tilapia compiled over the mortality period.
Viruses 11 00893 g004
Table 1. Primer sequences used for virus quantifications and gene expression.
Primer IDNCBI Primer SequenceBp LengthTm (°C)
IL-1βKF747686.1FTGGAGGAGGTGACGGATAAA86 bp62 °C
RGGTGTCGCGTTTGTAGAAGA
TNFαNM_001115056FGGCTAGATTTCCTCTGCTGTATC79 bp62 °C
RGCTATGACAGCACCTCTGTATC
β-actinKJ126772.1FGTGGGTATGGGTCAGAAAGAC111 bp62 °C
RGTCATCCCAGTTGGTCACAATA
TiLV Seg 3KU751816FTCCAGATCACCCTTCCTACTT109 bp62 °C
RATCCCAAGCAATCGGCTAAT
Table 2. Cox hazard proportion risk analysis.
ParametersFish breed/Strain
Gray TilapiaRed Tilapia
Controls6060
Number of fish tested7673
Number of tanks22
Post challenge Mortality %80.4%100.0%
Hazard risk ratio16.9819.51
95% Conf Interv Hazard risk09.40–30.6811.62–32.96
Media survival1011

