The Major Capsid Protein, VP1, of the Mouse Polyomavirus Stimulates the Activity of Tubulin Acetyltransferase 1 by Microtubule Stabilization

 , , and
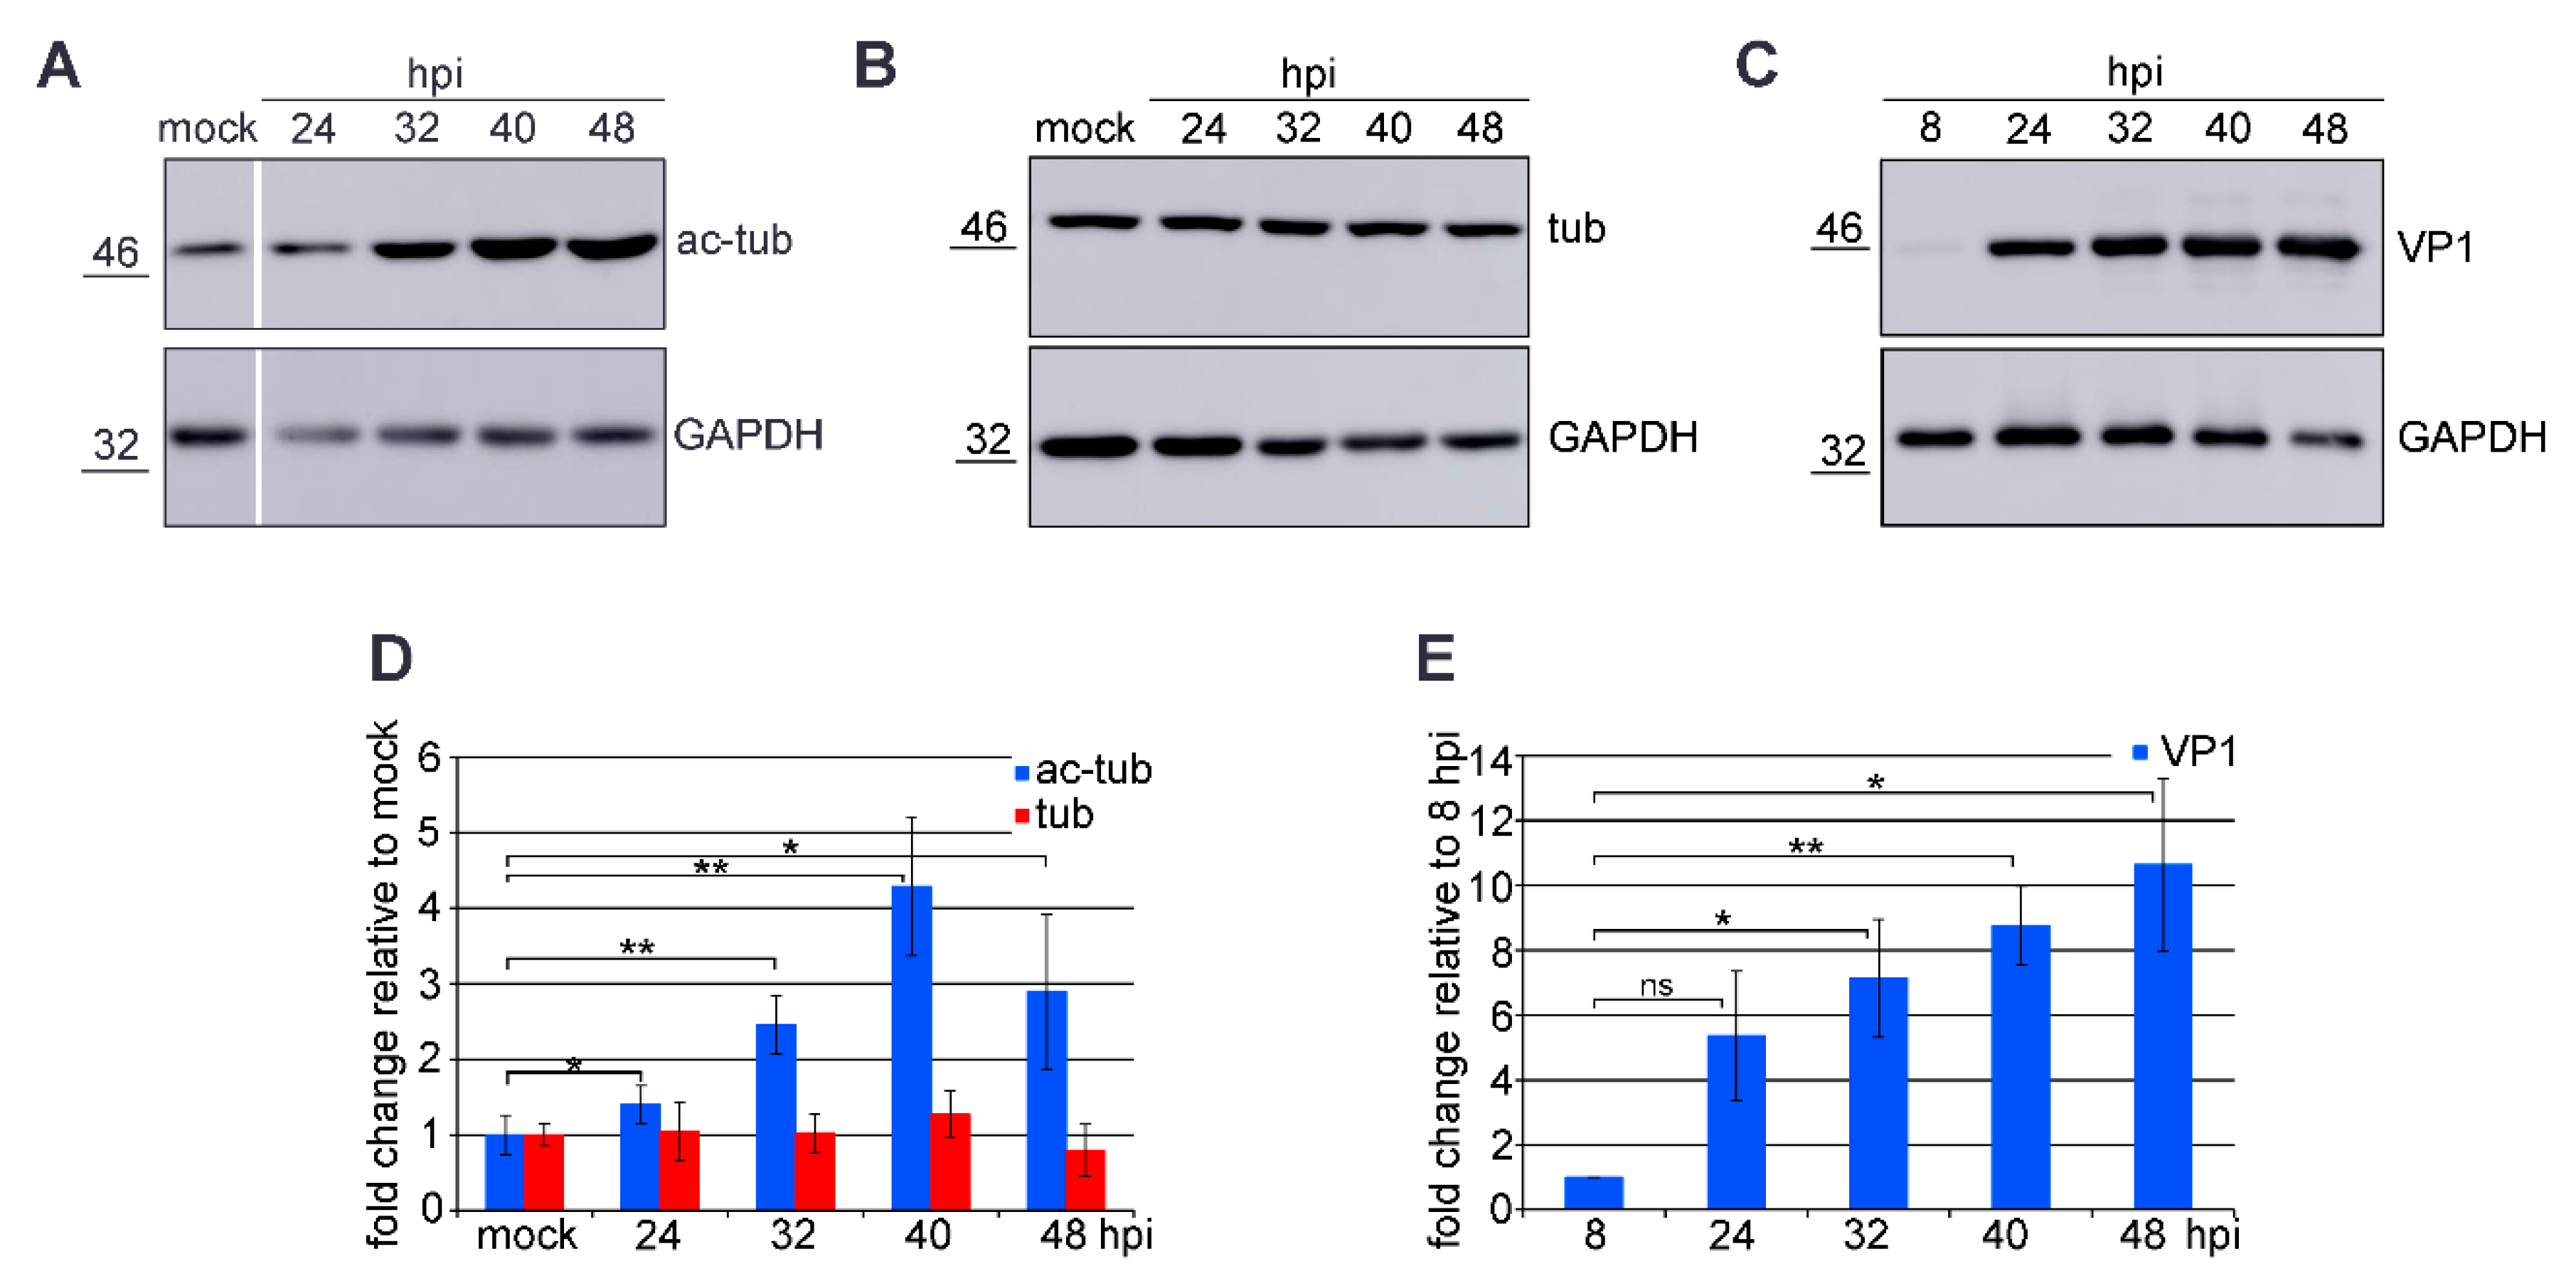
Abstract
:1. Introduction
2. Materials and Methods
2.1. Cells and Viruses
2.2. Plasmids
2.3. Antibodies
2.4. Transfection of Cells
2.5. Quantitative Real-Time Polymerase Chain Reaction (qPCR)
2.6. In Situ Fractionation
2.7. Immunofluorescence Staining
2.8. Western Blot Analysis
2.9. Microtubule Pelleting Assay
2.10. VP1/EGFP-tVP3 Pentamer Isolation
2.11. Direct Immunoelectron Microscopy
2.12. Microtubule Preparations
2.13. Total Internal Reflection Fluorescence (TIRF) Microscopy
2.14. Tubulin-VP1 Co-Sedimentation Assay
2.15. Nocodazole Sensitivity Assay
2.16. Impact of HDAC6 Inhibition on Viral Protein Levels and Virus Production
2.17. Significance of Acetylated Microtubules for Viral Proteins and Virus Production
2.18. Statistical Analysis
3. Results
3.1. Microtubule Acetylation Gradually Increases during the Late Phase of Infection
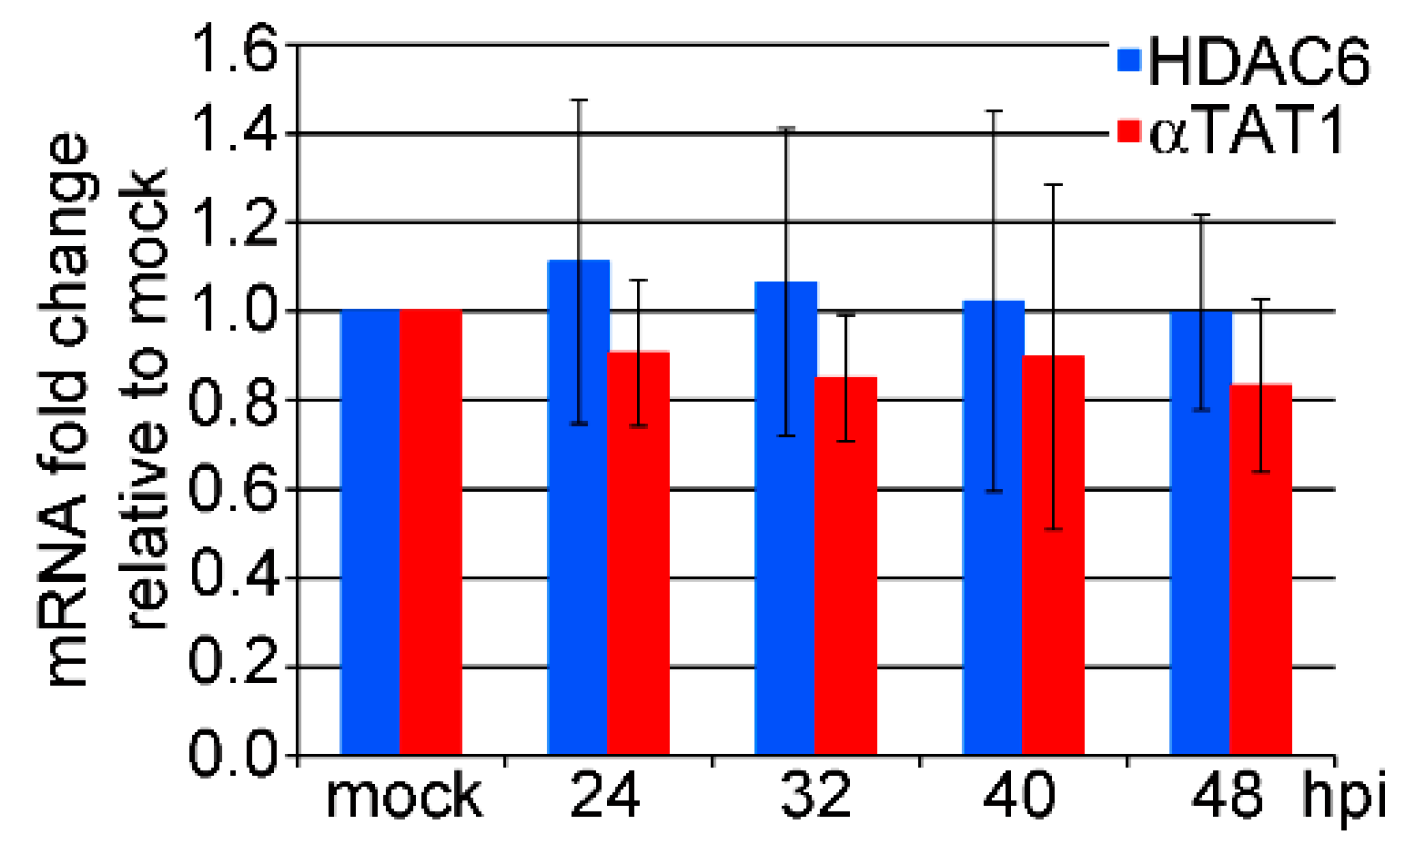
3.2. mRNA Levels of HDAC6 and αTAT1 Are Not Affected in the Late Phase of MPyV Infection
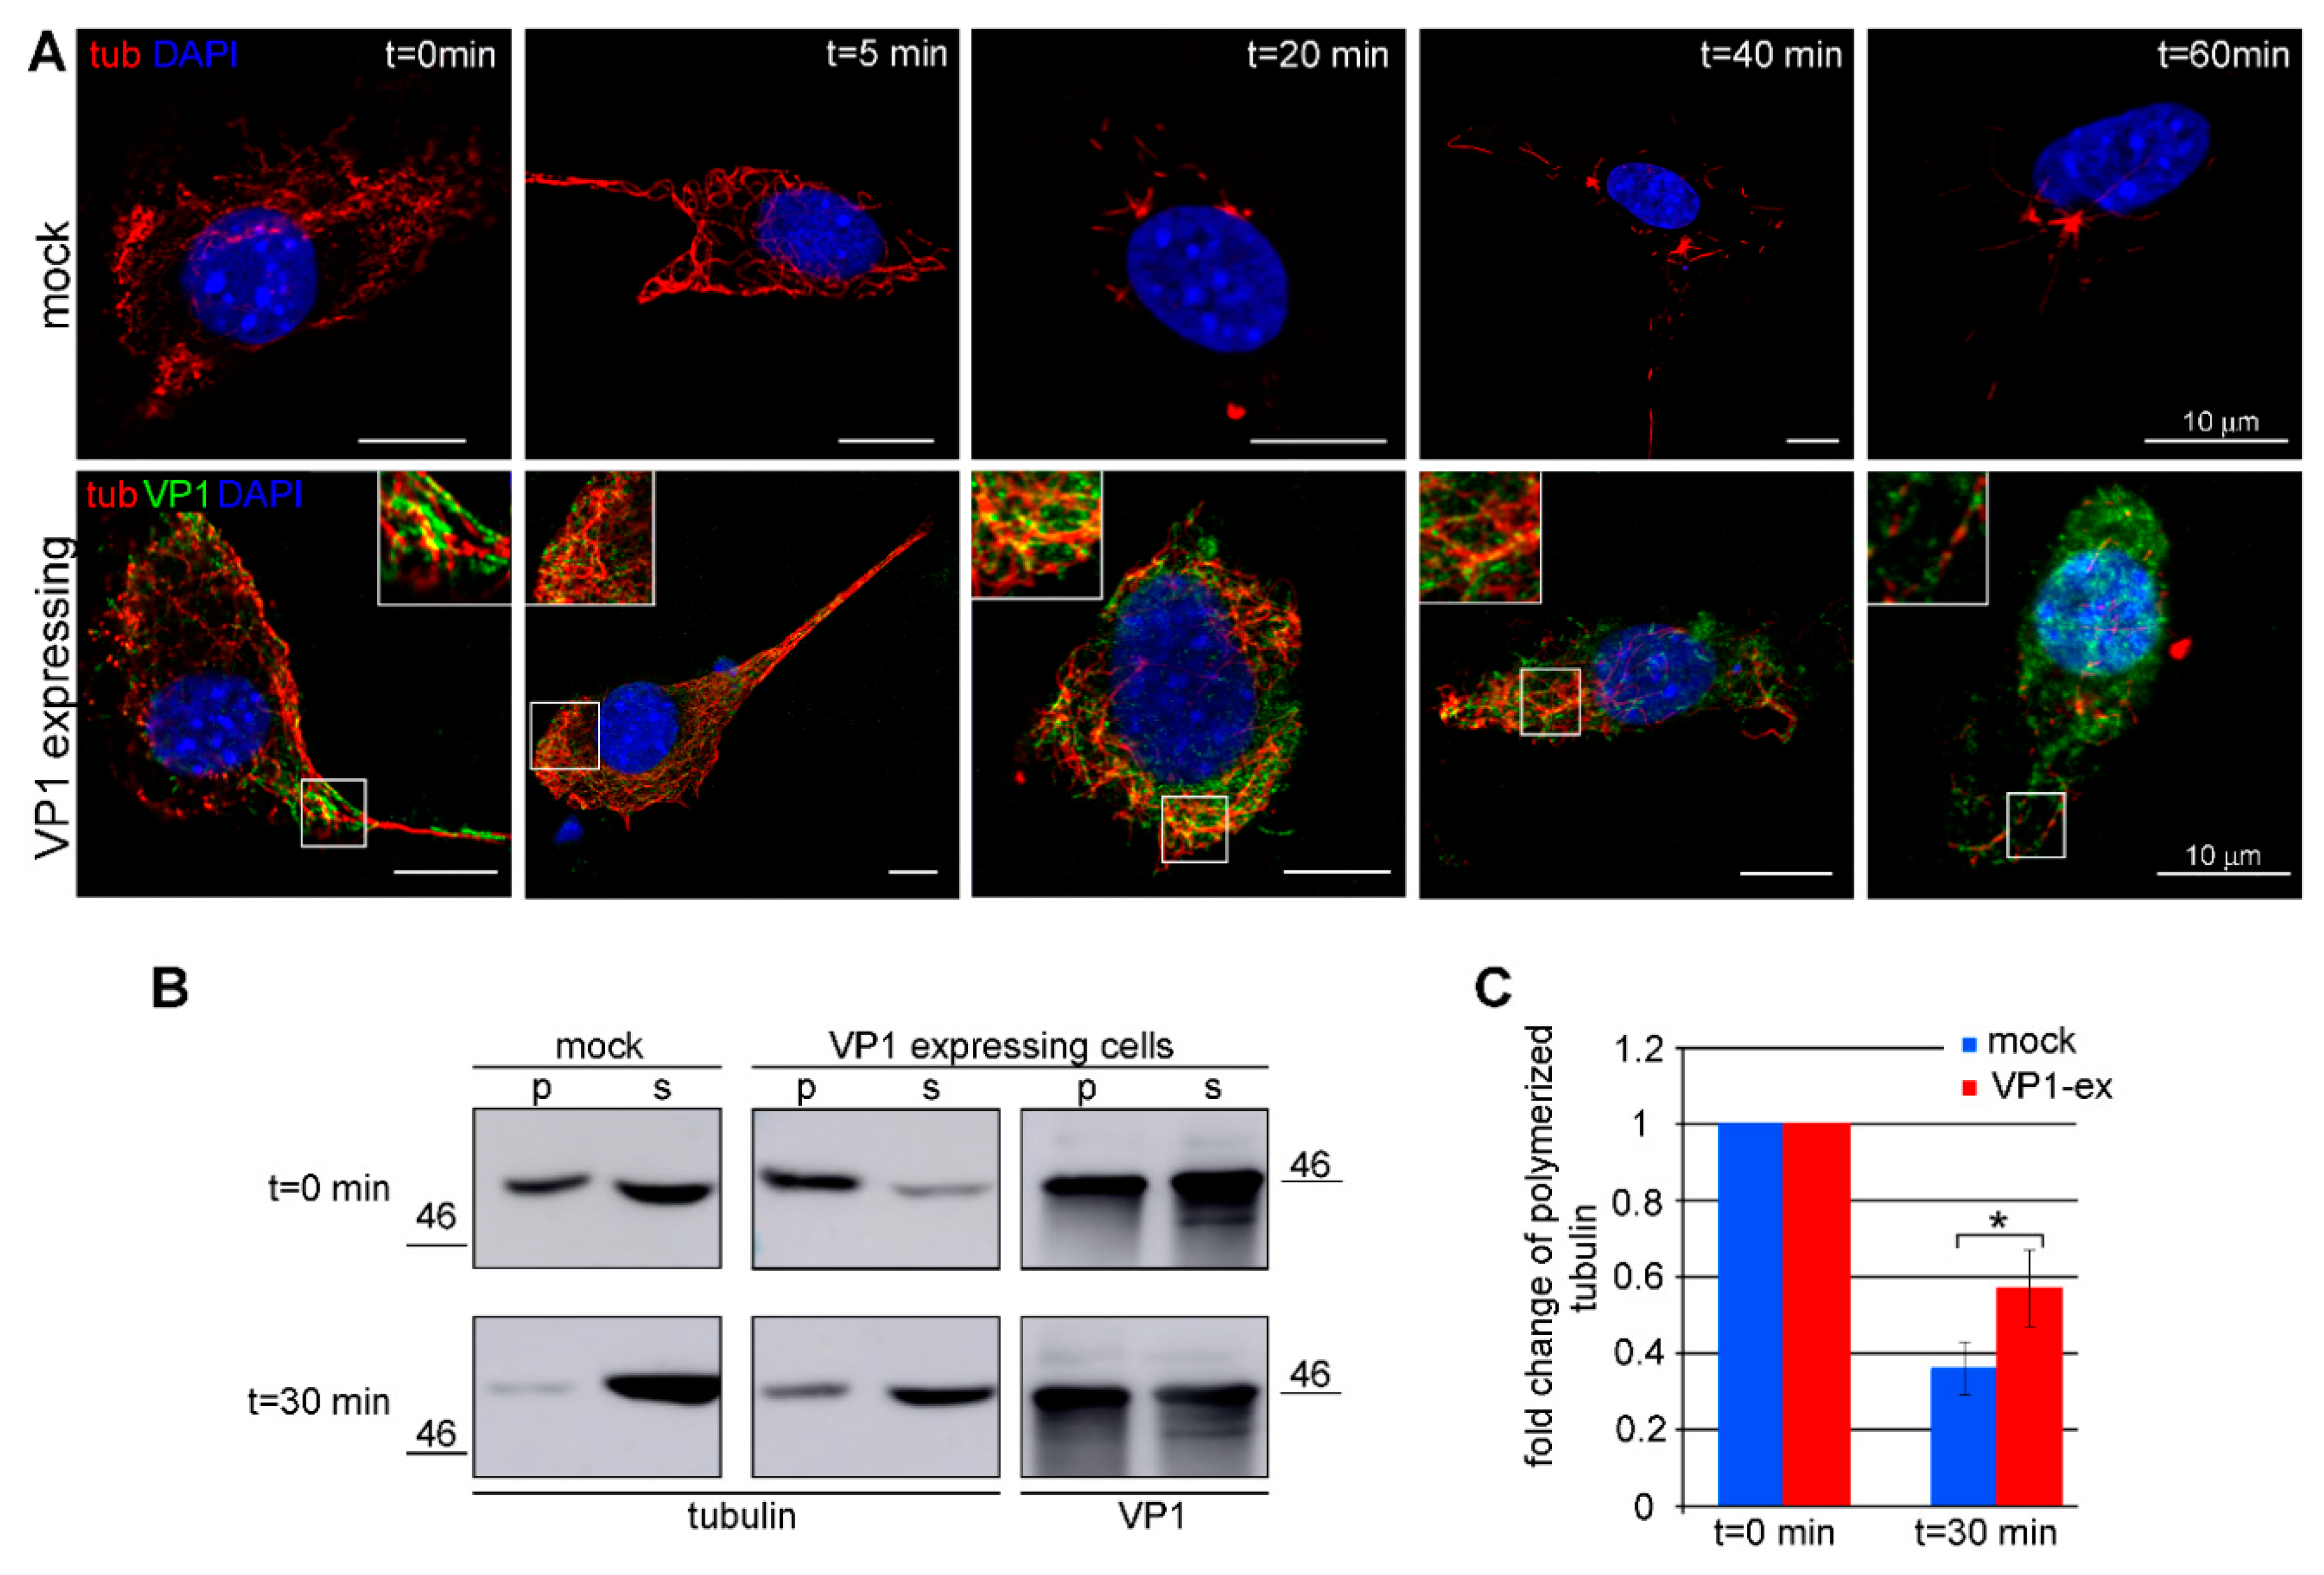
3.3. Amount of Microtubules is Increased in Cells Expressing VP1
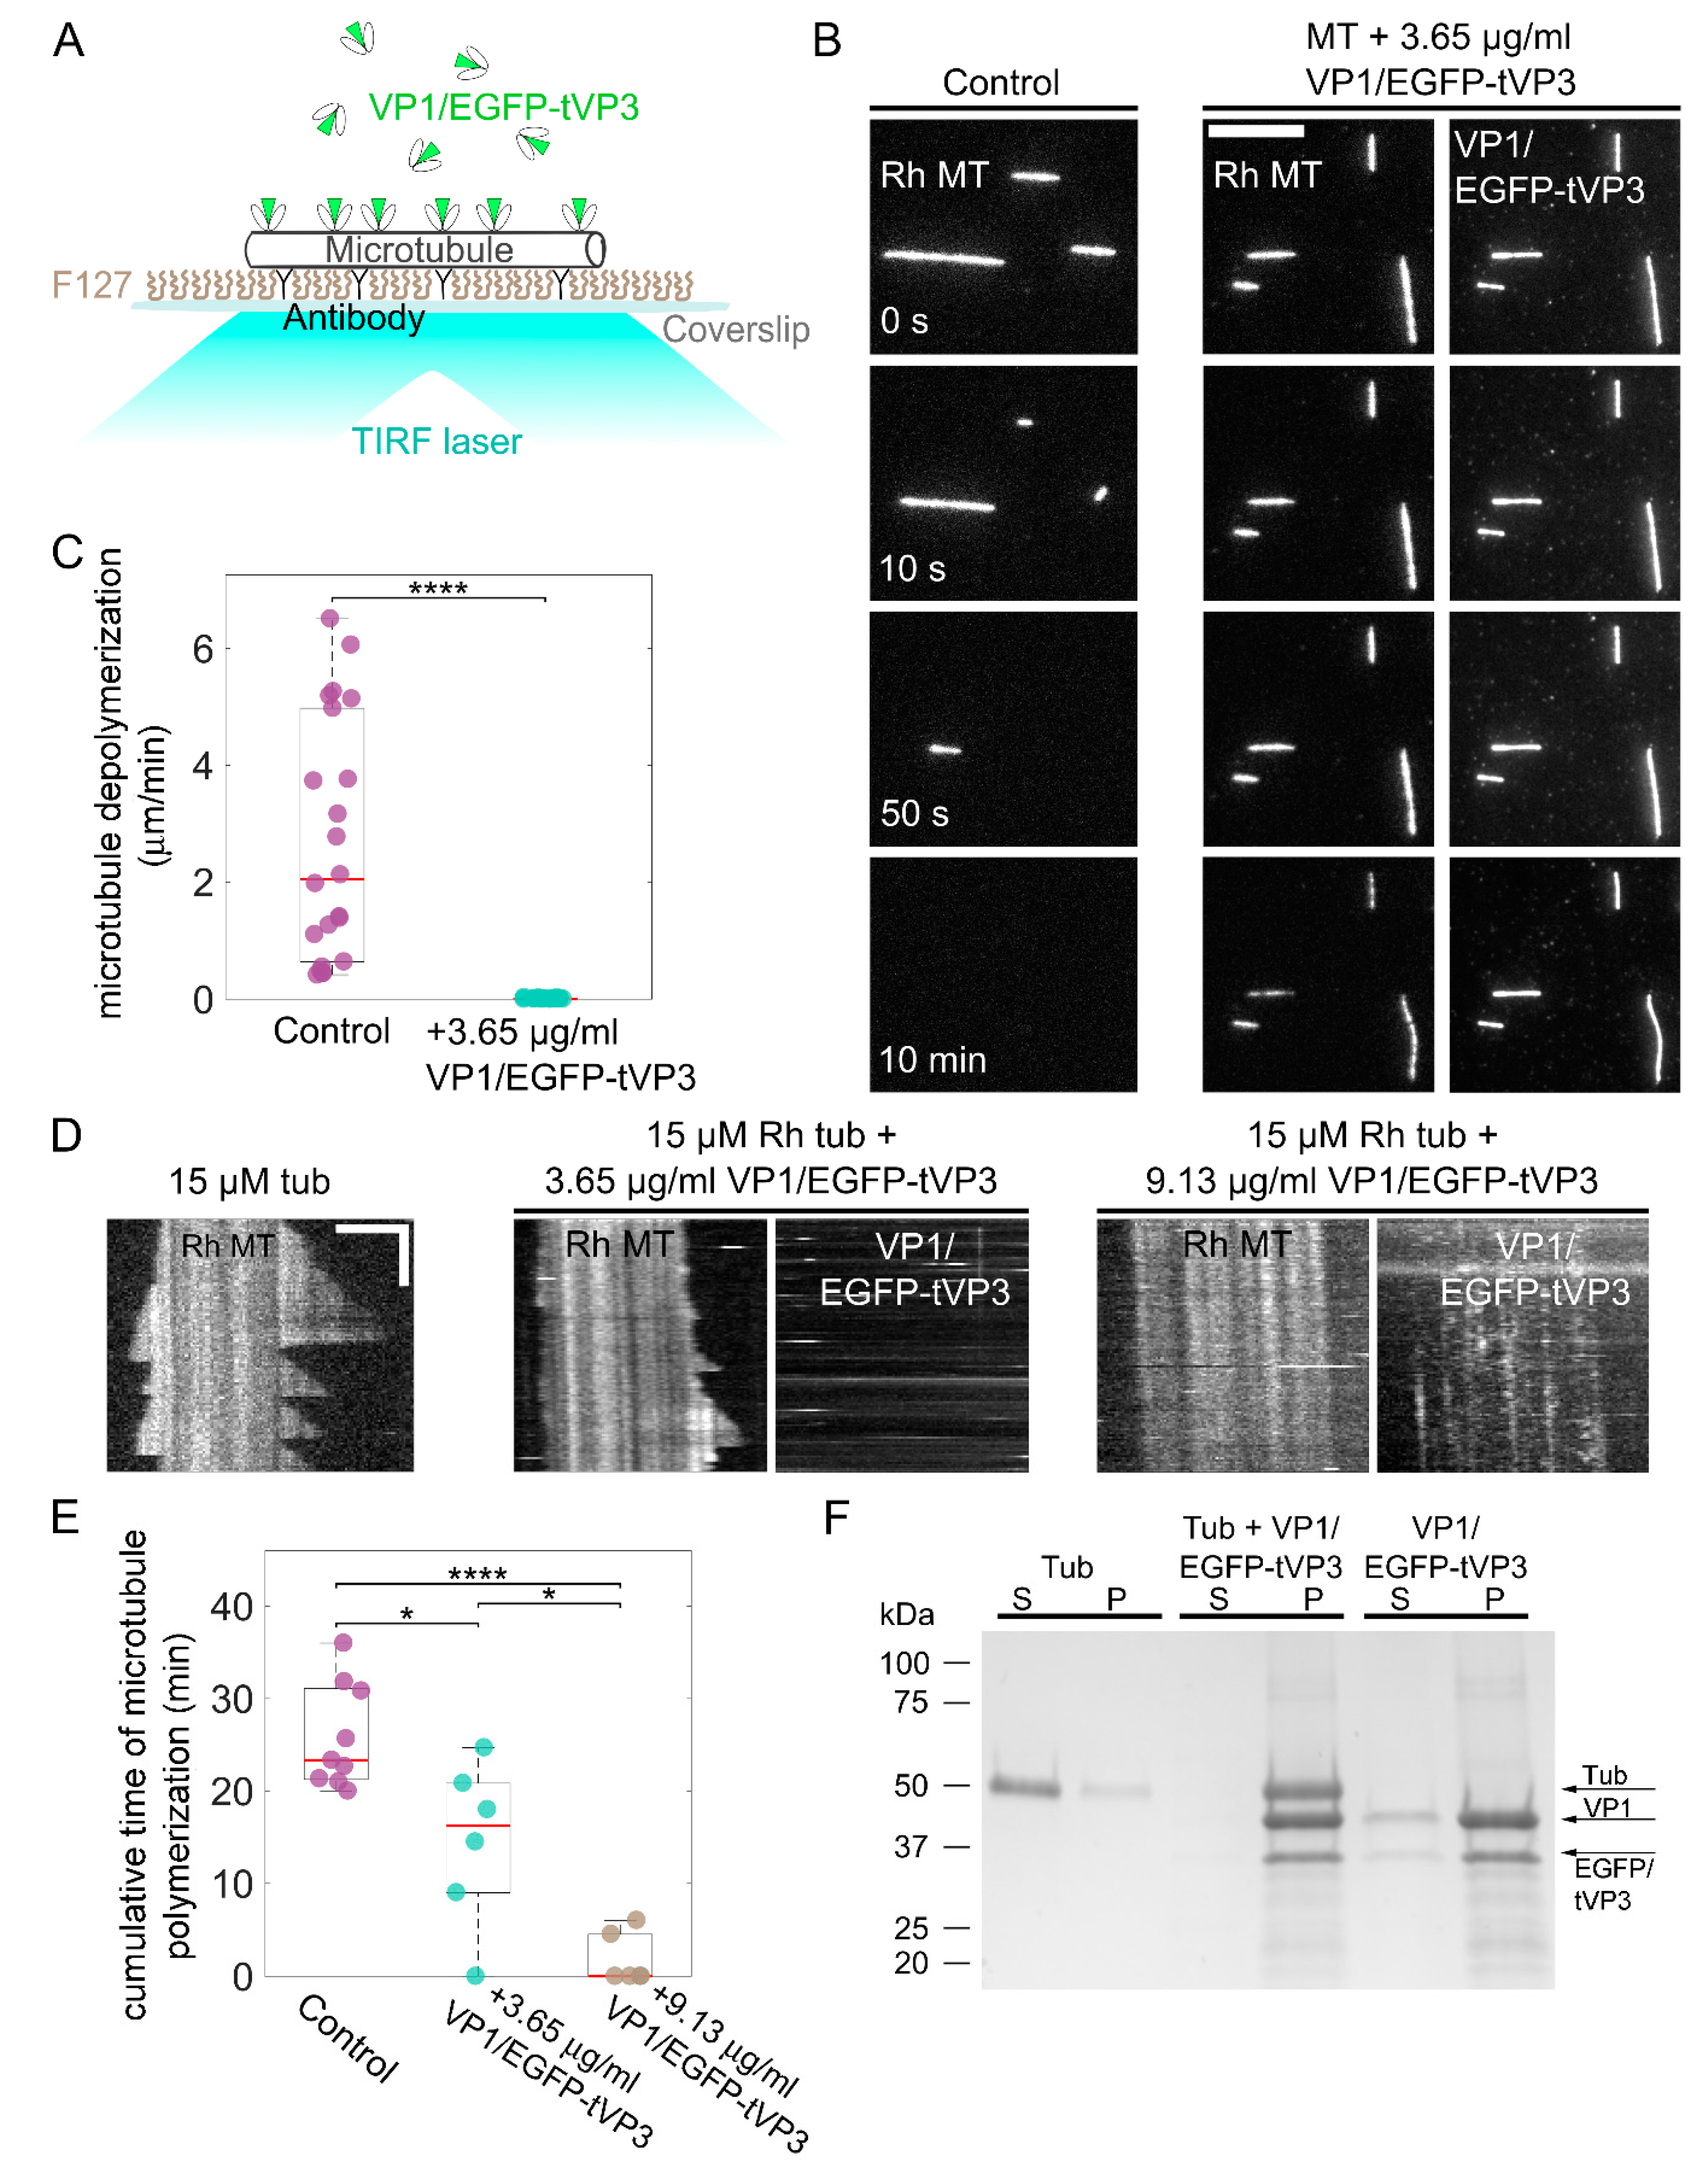
3.4. VP1 Binds Microtubules Directly and Stabilizes Them
3.5. VP1 Stimulates Hyperacetylation of Microtubules
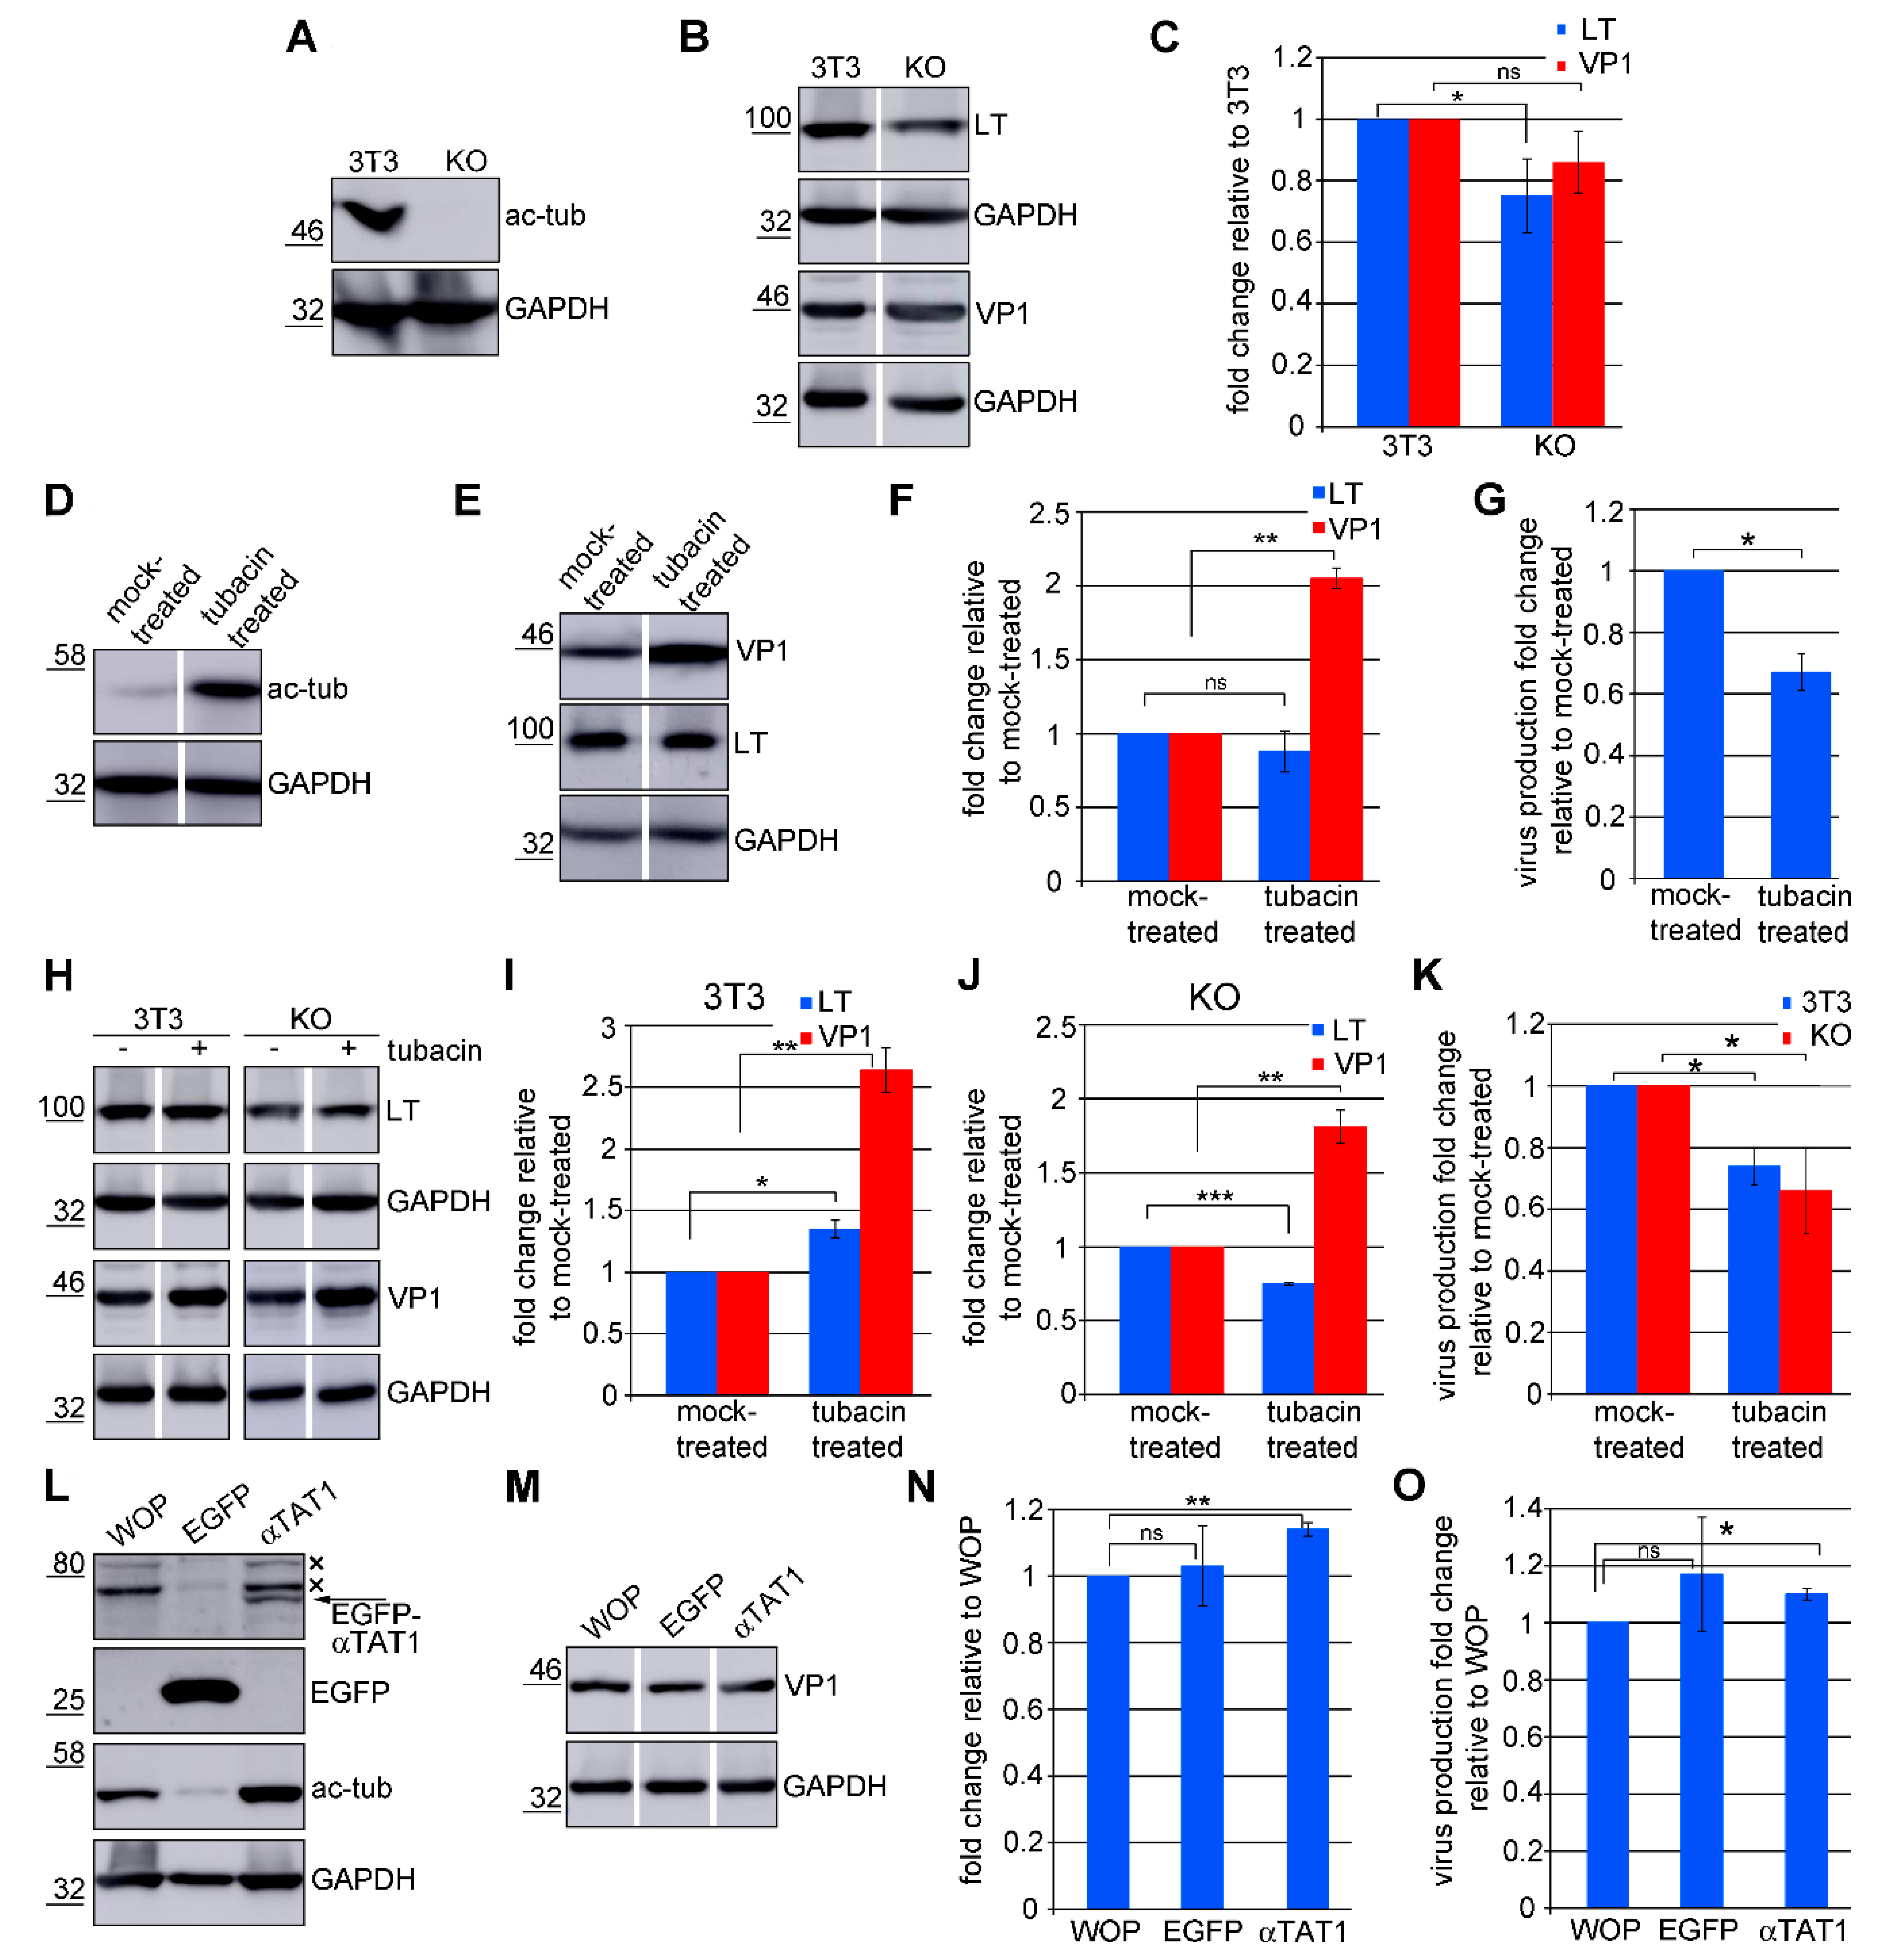
3.6. Acetylated Microtubules Are Not Necessary for Viral Infection
4. Discussion
Supplementary Materials
Author Contributions
Funding
Acknowledgments
Conflicts of Interest
References
- Barouch, D.H.; Harrison, S.C. Interactions among the major and minor coat proteins of polyomavirus. J. Virol. 1994, 68, 3982–3989. [Google Scholar] [CrossRef] [PubMed] [Green Version]
- Soldatova, I.; Prilepskaja, T.; Abrahamyan, L.; Forstová, J.; Huerfano, S. Interaction of the Mouse Polyomavirus Capsid Proteins with Importins Is Required for Efficient Import of Viral DNA into the Cell Nucleus. Viruses 2018, 10, 165. [Google Scholar] [CrossRef] [PubMed] [Green Version]
- Horníková, L.; Fraiberk, M.; Man, P.; Janovec, V.; Forstová, J. VP 1, the major capsid protein of the mouse polyomavirus, binds microtubules, promotes their acetylation and blocks the host cell cycle. FEBS J. 2017, 284, 301–323. [Google Scholar] [CrossRef] [PubMed] [Green Version]
- Salunke, D.M.; Caspar, D.L.; Garcea, R.L. Self-assembly of purified polyomavirus capsid protein VP1. Cell 1986, 46, 895–904. [Google Scholar] [CrossRef]
- O’Hara, S.D.; Stehle, T.; Garcea, R.L. Glycan receptors of the Polyomaviridae: Structure, function, and pathogenesis. Curr. Opin. Virol. 2014, 7, 73–78. [Google Scholar] [CrossRef]
- Bird, G.; O’Donnell, M.; Moroianu, J.; Garcea, R.L. Possible Role for Cellular Karyopherins in Regulating Polyomavirus and Papillomavirus Capsid Assembly. J. Virol. 2008, 82, 9848–9857. [Google Scholar] [CrossRef] [Green Version]
- Palková, Z.; Španielová, H.; Gottifredi, V.; Hollanderová, D.; Forstová, J.; Amati, P. The polyomavirus major capsid protein VP1 interacts with the nuclear matrix regulatory protein YY1. FEBS Lett. 2000, 467, 359–364. [Google Scholar] [CrossRef] [Green Version]
- Carbone, M.; Reale, A.; Di Sauro, A.; Sthandier, O.; Garcia, M.-I.; Maione, R.; Caiafa, P.; Amati, P. PARP-1 Interaction with VP1 Capsid Protein Regulates Polyomavirus Early Gene Expression. J. Mol. Boil. 2006, 363, 773–785. [Google Scholar] [CrossRef]
- Garcia, M.-I.; Perez, M.; Caruso, M.; Sthandier, O.; Ferreira, R.; Cermola, M.; Macchia, C.; Amati, P. A Mutation in the DE Loop of the VP1 Protein That Prevents Polyomavirus Transcription and Replication. Virology 2000, 272, 293–301. [Google Scholar] [CrossRef]
- Chromy, L.R.; Pipas, J.M.; Garcea, R.L. Chaperone-mediated in vitro assembly of Polyomavirus capsids. Proc. Natl. Acad. Sci. USA 2003, 100, 10477–10482. [Google Scholar] [CrossRef] [Green Version]
- Soppina, V.; Herbstman, J.F.; Skiniotis, G.; Verhey, K.J. Luminal Localization of α-tubulin K40 Acetylation by Cryo-EM Analysis of Fab-Labeled Microtubules. PLoS ONE 2012, 7, e48204. [Google Scholar] [CrossRef] [PubMed] [Green Version]
- Xu, Z.; Schaedel, L.; Portran, D.; Aguilar, A.; Gaillard, J.; Marinkovich, M.P.; Thery, M.; Nachury, M.V. Microtubules acquire resistance from mechanical breakage through intralumenal acetylation. Science 2017, 356, 328–332. [Google Scholar] [CrossRef] [PubMed] [Green Version]
- Portran, D.; Schaedel, L.; Xu, Z.; Théry, M.; Nachury, M.V. Tubulin acetylation protects long-lived microtubules against mechanical ageing. Nat. Cell Biol. 2017, 19, 391–398. [Google Scholar] [CrossRef] [PubMed] [Green Version]
- Eshun-Wilson, L.; Zhang, R.; Portran, D.; Nachury, M.V.; Toso, D.B.; Löhr, T.; Vendruscolo, M.; Bonomi, M.; Fraser, J.S.; Nogales, E. Effects of α-tubulin acetylation on microtubule structure and stability. Proc. Natl. Acad. Sci. USA 2019, 116, 10366–10371. [Google Scholar] [CrossRef] [PubMed] [Green Version]
- Akella, J.S.; Wloga, D.; Kim, J.; Starostina, N.G.; Lyons-Abbott, S.; Morrissette, N.S.; Dougan, S.T.; Kipreos, E.T.; Gaertig, J. MEC-17 is an alpha-tubulin acetyltransferase. Nature 2010, 467, 218–222. [Google Scholar] [CrossRef] [PubMed] [Green Version]
- Kalebic, N.; Sorrentino, S.; Perlas, E.; Bolasco, G.; Martinez, C.; Heppenstall, P.A. αTAT1 is the major α-tubulin acetyltransferase in mice. Nat. Commun. 2013, 4, 1962. [Google Scholar] [CrossRef] [Green Version]
- Shida, T.; Cueva, J.G.; Xu, Z.; Goodman, M.B.; Nachury, M.V. The major alpha-tubulin K40 acetyltransferase alphaTAT1 promotes rapid ciliogenesis and efficient mechanosensation. Proc. Natl. Acad. Sci. USA 2010, 107, 21517–21522. [Google Scholar] [CrossRef] [Green Version]
- Hubbert, C.; Guardiola, A.; Shao, R.; Kawaguchi, Y.; Ito, A.; Nixon, A.; Yoshida, M.; Wang, X.-F.; Yao, T.-P. HDAC6 is a microtubule-associated deacetylase. Nature 2002, 417, 455–458. [Google Scholar] [CrossRef]
- Miyake, Y.; Keusch, J.J.; Wang, L.; Saito, M.; Hess, D.; Wang, X.; Melancon, B.J.; Helquist, P.; Gut, H.; Matthias, P. Structural insights into HDAC6 tubulin deacetylation and its selective inhibition. Nat. Methods 2016, 12, 748–754. [Google Scholar] [CrossRef]
- Chen, L.; Fluck, M.M. Kinetic Analysis of the Steps of the Polyomavirus Lytic Cycle. J. Virol. 2001, 75, 8368–8379. [Google Scholar] [CrossRef] [Green Version]
- Dahl, J.; You, J.; Benjamin, T. Induction and Utilization of an ATM Signaling Pathway by Polyomavirus. J. Virol. 2005, 79, 13007–13017. [Google Scholar] [CrossRef] [PubMed] [Green Version]
- Dailey, L.; Basilico, C. Sequences in the polyomavirus DNA regulatory region involved in viral DNA replication and early gene expression. J. Virol. 1985, 54, 739–749. [Google Scholar] [CrossRef] [PubMed] [Green Version]
- Aguilar, A.; Becker, L.; Tedeschi, T.; Heller, S.; Iomini, C.; Nachury, M.V. α-Tubulin K40 acetylation is required for contact inhibition of proliferation and cell–substrate adhesion. Mol. Boil. Cell 2014, 25, 1854–1866. [Google Scholar] [CrossRef] [PubMed]
- Horníková, L.; Zila, V.; Španielová, H.; Forstová, J. Mouse Polyomavirus: Propagation, Purification, Quantification, and Storage. Curr. Protoc. Microbiol. 2015, 38. [Google Scholar] [CrossRef]
- Boura, E.; Liebl, D.; Špíšek, R.; Fric, J.; Marek, M.; Štokrová, J.; Holan, V.; Forstová, J. Polyomavirus EGFP-pseudocapsids: Analysis of model particles for introduction of proteins and peptides into mammalian cells. FEBS Lett. 2005, 579, 6549–6558. [Google Scholar] [CrossRef] [PubMed] [Green Version]
- Tolstov, Y.L.; Pastrana, D.V.; Feng, H.; Becker, J.C.; Jenkins, F.J.; Moschos, S.; Chang, Y.; Buck, C.B.; Moore, P.S. Human Merkel cell polyomavirus infection II. MCV is a common human infection that can be detected by conformational capsid epitope immunoassays. Int. J. Cancer 2009, 125, 1250–1256. [Google Scholar] [CrossRef] [Green Version]
- Horníková, L.; Man, P.; Forstová, J. Blue native protein electrophoresis for studies of mouse polyomavirus morphogenesis and interactions between the major capsid protein VP1 and cellular proteins. J. Virol. Methods 2011, 178, 229–234. [Google Scholar] [CrossRef]
- Forstová, J.; Krauzewicz, N.; Wallace, S.; Street, A.J.; Dilworth, S.M.; Beard, S.; Griffin, E.B. Cooperation of structural proteins during late events in the life cycle of polyomavirus. J. Virol. 1993, 67, 1405–1413. [Google Scholar] [CrossRef] [Green Version]
- Dilworth, S.M.; Griffin, B.E. Monoclonal antibodies against polyoma virus tumor antigens. Proc. Natl. Acad. Sci. USA 1982, 79, 1059–1063. [Google Scholar] [CrossRef] [Green Version]
- Staufenbiel, M.; Deppert, W. Preparation of nuclear matrices from cultured cells: Subfractionation of nuclei in situ. J. Cell Boil. 1984, 98, 1886–1894. [Google Scholar] [CrossRef]
- Sennepin, A.D.; Charpentier, S.; Normand, T.; Sarré, C.; Legrand, A.; Mollet, L.M. Multiple reprobing of Western blots after inactivation of peroxidase activity by its substrate, hydrogen peroxide. Anal. Biochem. 2009, 393, 129–131. [Google Scholar] [CrossRef] [PubMed]
- Minotti, A.M.; Barlow, S.B.; Cabral, F. Resistance to antimitotic drugs in Chinese hamster ovary cells correlates with changes in the level of polymerized tubulin. J. Boil. Chem. 1991, 266, 3987–3994. [Google Scholar]
- Gell, C.; Friel, C.T.; Borgonovo, B.; Drechsel, D.N.; Hyman, A.A.; Howard, J. Purification of Tubulin from Porcine Brain. Adv. Struct. Saf. Stud. 2011, 777, 15–28. [Google Scholar]
- Castoldi, M.; Popov, A.V. Purification of brain tubulin through two cycles of polymerization–depolymerization in a high-molarity buffer. Protein Expr. Purif. 2003, 32, 83–88. [Google Scholar] [CrossRef]
- Hyman, A.; Drechsel, D.; Kellogg, U.; Salser, S.; Sawin, K.; Steffen, P.; Wordeman, L.; Mitchison, T. Preparation of modified tubulins. Methods Enzym. 1991, 196, 478–485. [Google Scholar]
- Nitzsche, B.; Bormuth, V.; Bräuer, C.; Howard, J.; Ionov, L.; Kerssemakers, J.; Korten, T.; LeDuc, C.; Ruhnow, F.; Diez, S. Studying Kinesin Motors by Optical 3D-Nanometry in Gliding Motility Assays. Methods Cell Biol. 2010, 95, 247–271. [Google Scholar]
- Braun, M.; Lansky, Z.; Fink, G.; Ruhnow, F.; Diez, S.; Janson, M.E. Adaptive braking by Ase1 prevents overlapping microtubules from sliding completely apart. Nature 2011, 13, 1259–1264. [Google Scholar] [CrossRef]
- Coombes, C.; Yamamoto, A.; McClellan, M.; Reid, T.A.; Plooster, M.; Luxton, G.G.; Alper, J.; Howard, J.; Gardner, M.K. Mechanism of microtubule lumen entry for the α-tubulin acetyltransferase enzyme αTAT1. Proc. Natl. Acad. Sci. USA 2016, 113, E7176–E7184. [Google Scholar] [CrossRef] [Green Version]
- Lin, W.; Hata, T.; Kasamatsu, H. Subcellular distribution of viral structural proteins during simian virus 40 infection. J. Virol. 1984, 50, 363–371. [Google Scholar] [CrossRef] [Green Version]
- Erickson, K.D.; Bouchet-Marquis, C.; Heiser, K.; Szomolanyi-Tsuda, E.; Mishra, R.; Lamothe, B.; Hoenger, A.; Garcea, R.L. Virion Assembly Factories in the Nucleus of Polyomavirus-Infected Cells. PLOS Pathog. 2012, 8. [Google Scholar] [CrossRef]
- Montross, L.; Watkins, S.; Moreland, R.B.; Mamon, H.; Caspar, D.L.; Garcea, R.L. Nuclear assembly of polyomavirus capsids in insect cells expressing the major capsid protein VP1. J. Virol. 1991, 65, 4991–4998. [Google Scholar] [CrossRef] [PubMed] [Green Version]
- Zhernov, I. Results Show That EGFP Does Not Bind to Microtubules; Institute of Biotechnology of the Czech Academy of Sciences, BIOCEV, Vestec, Czech Republic; Faculty of Mathematics and Physics, Charles University: Prague, Czech Republic, 2020. [Google Scholar]
- Garcea, R.L.; Ballmer-Hofer, K.; Benjamin, T.L. Virion assembly defect of polyomavirus hr-t mutants: Underphosphorylation of major capsid protein VP1 before viral DNA encapsidation. J. Virol. 1985, 54, 311–316. [Google Scholar] [CrossRef] [PubMed] [Green Version]
- Haggarty, S.J.; Koeller, K.M.; Wong, J.C.; Grozinger, C.M.; Schreiber, S.L. Domain-selective small-molecule inhibitor of histone deacetylase 6 (HDAC6)-mediated tubulin deacetylation. Proc. Natl. Acad. Sci. USA 2003, 100, 4389–4394. [Google Scholar] [CrossRef] [Green Version]
- Seigneurin-Berny, D.; Verdel, A.; Curtet, S.; Lemercier, C.; Garin, J.; Rousseaux, S.; Khochbin, S. Identification of Components of the Murine Histone Deacetylase 6 Complex: Link between Acetylation and Ubiquitination Signaling Pathways. Mol. Cell. Boil. 2001, 21, 8035–8044. [Google Scholar] [CrossRef] [PubMed] [Green Version]
- Kovacs, J.J.; Murphy, P.J.; Gaillard, S.; Zhao, X.; Wu, J.-T.; Nicchitta, C.V.; Yoshida, M.; Toft, D.O.; Pratt, W.B.; Yao, T.-P. HDAC6 Regulates Hsp90 Acetylation and Chaperone-Dependent Activation of Glucocorticoid Receptor. Mol. Cell 2005, 18, 601–607. [Google Scholar] [CrossRef] [PubMed]
- Zhang, L.; Liu, S.; Liu, N.; Zhang, Y.; Liu, M.; Li, D.; Seto, E.; Yao, T.-P.; Shui, W.; Zhou, J. Proteomic identification and functional characterization of MYH9, Hsc70, and DNAJA1 as novel substrates of HDAC6 deacetylase activity. Protein Cell 2015, 6, 42–54. [Google Scholar] [CrossRef] [Green Version]
- Naghavi, M.H.; Walsh, D. Microtubule Regulation and Function during Virus Infection. J. Virol. 2017, 91. [Google Scholar] [CrossRef] [Green Version]
- Zila, V.; Difato, F.; Klimova, L.; Huerfano, S.; Forstová, J. Involvement of Microtubular Network and Its Motors in Productive Endocytic Trafficking of Mouse Polyomavirus. PLoS ONE 2014, 9. [Google Scholar] [CrossRef] [Green Version]
- Sanjuan, N.; Porrás, A.; Otero, J. Microtubule-dependent intracellular transport of murine polyomavirus. Virology 2003, 313, 105–116. [Google Scholar] [CrossRef] [Green Version]
- Eash, S.; Atwood, W.J. Involvement of Cytoskeletal Components in BK Virus Infectious Entry. J. Virol. 2005, 79, 11734–11741. [Google Scholar] [CrossRef] [Green Version]
- Zheng, K.; Jiang, Y.; He, Z.; Kitazato, K.; Wang, Y. Cellular defence or viral assist: The dilemma of HDAC6. J. Gen. Virol. 2017, 98, 322–337. [Google Scholar] [CrossRef] [PubMed]
- Wenzel, E.D.; Speidell, A.; Flowers, S.A.; Wu, C.; Avdoshina, V.; Mocchetti, I. Histone deacetylase 6 inhibition rescues axonal transport impairments and prevents the neurotoxicity of HIV-1 envelope protein gp120. Cell Death Dis. 2019, 10, 1–15. [Google Scholar] [CrossRef] [PubMed] [Green Version]
- Husain, M.; Harrod, K. Influenza A virus-induced caspase-3 cleaves the histone deacetylase 6 in infected epithelial cells. FEBS Lett. 2009, 583, 2517–2520. [Google Scholar] [CrossRef] [PubMed] [Green Version]
- Avdoshina, V.; Caragher, S.; Wenzel, E.D.; Taraballi, F.; Mocchetti, I.; Harry, G.J. The viral protein gp120 decreases the acetylation of neuronal tubulin: Potential mechanism of neurotoxicity. J. Neurochem. 2017, 141, 606–613. [Google Scholar] [CrossRef]
- Sabo, Y.; Walsh, D.; Barry, D.S.; Tinaztepe, S.; Santos, K.D.L.; Goff, S.P.; Gundersen, G.G.; Naghavi, M.H. HIV-1 induces the formation of stable microtubules to enhance early infection. Cell Host Microbe 2013, 14, 535–546. [Google Scholar] [CrossRef] [Green Version]
- Warren, J.C.; Rutkowski, A.; Cassimeris, L. Infection with Replication-deficient Adenovirus Induces Changes in the Dynamic Instability of Host Cell Microtubules. Mol. Boil. Cell 2006, 17, 3557–3568. [Google Scholar] [CrossRef] [Green Version]
- Hyde, J.L.; Gillespie, L.K.; MacKenzie, J. Mouse Norovirus 1 Utilizes the Cytoskeleton Network To Establish Localization of the Replication Complex Proximal to the Microtubule Organizing Center. J. Virol. 2012, 86, 4110–4122. [Google Scholar] [CrossRef] [Green Version]
- Rathje, L.-S.Z.; Nordgren, N.; Pettersson, T.; Rönnlund, D.; Widengren, J.; Aspenström, P.; Gad, A. Oncogenes induce a vimentin filament collapse mediated by HDAC6 that is linked to cell stiffness. Proc. Natl. Acad. Sci. USA 2014, 111, 1515–1520. [Google Scholar] [CrossRef] [Green Version]
- Knight, L.M.; Stakaityte, G.; Wood, J.J.; Abdul-Sada, H.; Griffiths, D.A.; Howell, G.J.; Wheat, R.; Blair, G.E.; Steven, N.M.; Macdonald, A.; et al. Merkel cell polyomavirus small T antigen mediates microtubule destabilization to promote cell motility and migration. J. Virol. 2015, 89, 35–47. [Google Scholar] [CrossRef] [Green Version]
- Dompierre, J.P.; Godin, J.D.; Charrin, B.C.; Cordelières, F.P.; King, S.J.; Humbert, S.; Saudou, F. Histone deacetylase 6 inhibition compensates for the transport deficit in Huntington’s disease by increasing tubulin acetylation. J. Neurosci. 2007, 27, 3571–3583. [Google Scholar] [CrossRef]
- Boyault, C.; Gilquin, B.; Zhang, Y.; Rybin, V.; Garman, E.F.; Meyer-Klaucke, W.; Matthias, P.; Müller, C.W.; Khochbin, S. HDAC6–p97/VCP controlled polyubiquitin chain turnover. EMBO J. 2006, 25, 3357–3366. [Google Scholar] [CrossRef] [PubMed] [Green Version]
- Li, Y.; Shin, D.; Kwon, S.H. Histone deacetylase 6 plays a role as a distinct regulator of diverse cellular processes. FEBS J. 2013, 280, 775–793. [Google Scholar] [CrossRef] [PubMed]
- Fiskus, W.; Ren, Y.; Mohapatra, A.; Bali, P.; Mandawat, A.; Rao, R.; Herger, B.; Yang, Y.; Atadja, P.; Wu, J.; et al. Hydroxamic acid analogue histone deacetylase inhibitors attenuate estrogen receptor-alpha levels and transcriptional activity: A result of hyperacetylation and inhibition of chaperone function of heat shock protein 90. Clin. Cancer Res. 2007, 13, 4882–4890. [Google Scholar] [CrossRef] [PubMed] [Green Version]
- Lu, C.-Y.; Chang, Y.-C.; Hua, C.-H.; Chuang, C.; Huang, S.-H.; Kung, S.-H.; Hour, M.-J.; Lin, C.-W. Tubacin, an HDAC6 Selective Inhibitor, Reduces the Replication of the Japanese Encephalitis Virus via the Decrease of Viral RNA Synthesis. Int. J. Mol. Sci. 2017, 18, 954. [Google Scholar] [CrossRef] [Green Version]
- Bolen, J.B.; Anders, D.G.; Trempy, J.; Consigli, A.R. Differences in the subpopulations of the structural proteins of polyoma virions and capsids: Biological functions of the multiple VP1 species. J. Virol. 1981, 37, 80–91. [Google Scholar] [CrossRef] [Green Version]


© 2020 by the authors. Licensee MDPI, Basel, Switzerland. This article is an open access article distributed under the terms and conditions of the Creative Commons Attribution (CC BY) license (http://creativecommons.org/licenses/by/4.0/).
Share and Cite
Horníková, L.; Bruštíková, K.; Ryabchenko, B.; Zhernov, I.; Fraiberk, M.; Mariničová, Z.; Lánský, Z.; Forstová, J. The Major Capsid Protein, VP1, of the Mouse Polyomavirus Stimulates the Activity of Tubulin Acetyltransferase 1 by Microtubule Stabilization. Viruses 2020, 12, 227. https://0-doi-org.brum.beds.ac.uk/10.3390/v12020227
Horníková L, Bruštíková K, Ryabchenko B, Zhernov I, Fraiberk M, Mariničová Z, Lánský Z, Forstová J. The Major Capsid Protein, VP1, of the Mouse Polyomavirus Stimulates the Activity of Tubulin Acetyltransferase 1 by Microtubule Stabilization. Viruses. 2020; 12(2):227. https://0-doi-org.brum.beds.ac.uk/10.3390/v12020227
Chicago/Turabian StyleHorníková, Lenka, Kateřina Bruštíková, Boris Ryabchenko, Ilia Zhernov, Martin Fraiberk, Zuzana Mariničová, Zdeněk Lánský, and Jitka Forstová. 2020. "The Major Capsid Protein, VP1, of the Mouse Polyomavirus Stimulates the Activity of Tubulin Acetyltransferase 1 by Microtubule Stabilization" Viruses 12, no. 2: 227. https://0-doi-org.brum.beds.ac.uk/10.3390/v12020227