Article

Small-Angle X-ray Scattering Models of APOBEC3B Catalytic Domain in a Complex with a Single-Stranded DNA Inhibitor

by
Fareeda M. Barzak
1,
Timothy M. Ryan
2,
Maksim V. Kvach
1,
Harikrishnan M. Kurup
1,
Hideki Aihara
3,
Reuben S. Harris
3,4,
Vyacheslav V. Filichev
1,5,*,
Elena Harjes
1,5,* and
Geoffrey B. Jameson
1,5,*
1
School of Fundamental Sciences, Massey University, Private Bag 11 222, New Zealand
2
SAXS/WAXS, Australian Synchrotron/ANSTO, 800 Blackburn Road, Clayton, VIC 3168, Australia
3
Department of Biochemistry, Molecular Biology, and Biophysics, University of Minnesota, Minneapolis, MN 55455, USA
4
Howard Hughes Medical Institute, University of Minnesota, Minneapolis, MN 55455, USA
5
Maurice Wilkins Centre for Molecular Biodiscovery, Auckland 1142, New Zealand
*
Authors to whom correspondence should be addressed.
Submission received: 13 December 2020 / Revised: 2 February 2021 / Accepted: 5 February 2021 / Published: 12 February 2021
(This article belongs to the Special Issue APOBECs and Virus Restriction)

Abstract

:
In normal cells APOBEC3 (A3A-A3H) enzymes as part of the innate immune system deaminate cytosine to uracil on single-stranded DNA (ssDNA) to scramble DNA in order to give protection against a range of exogenous retroviruses, DNA-based parasites, and endogenous retroelements. However, some viruses and cancer cells use these enzymes, especially A3A and A3B, to escape the adaptive immune response and thereby lead to the evolution of drug resistance. We have synthesized first-in-class inhibitors featuring modified ssDNA. We present models based on small-angle X-ray scattering (SAXS) data that (1) confirm that the mode of binding of inhibitor to an active A3B C-terminal domain construct in the solution state is the same as the mode of binding substrate to inactive mutants of A3A and A3B revealed in X-ray crystal structures and (2) give insight into the disulfide-linked inactive dimer formed under the oxidizing conditions of purification.

1. Introduction

The human APOBEC3 (A3) family of cytidine deaminases acts in various roles within the innate immune system, largely by deaminating single-stranded DNA (ssDNA, Scheme 1A) [1,2]. In humans there are seven A3 enzymes, APOBEC3A-APOBEC3H (A3A-A3H, excluding A3E), which have diverged and expanded from a single enzyme to provide protection against a range of exogenous retroviruses, DNA-based parasites, and endogenous retroelements [1,3,4]. However, misregulation of several A3 family members, in particular the mutagenic actions of A3A, A3B, and A3G, are exploited by viruses (including SARS-CoV-2) [5,6,7] and cancer cells to enhance their rate of evolution, leading to detrimental outcomes by their escaping adaptive immune responses and becoming drug resistant [8,9,10,11,12,13,14].
The A3 members exist as either single-domain enzymes (A3A, A3C, and A3H) or double-domain enzymes (A3B, A3G, A3D, and A3F) made up of two tandem homologous domains with a short flexible linker [15,16,17]. In double-domain A3 enzymes, the carboxy-terminal domain (CTD) encompasses the catalytic activity, whereas the amino-terminal domain (NTD) has little to no catalytic activity, but is reported to be important in binding ssDNA substrates, enhancing enzyme activity above that of the CTD domain alone [18,19,20,21,22,23,24]. The A3 enzyme domains show a similar conserved globular fold, consisting of a hydrophobic core formed by five β-strands flanked by six α-helices that are connected through flexible loops (Figure 1A) [25,26,27]. The active-site (Figure 1B) is highly conserved among the A3 (and single-nucleo(s/t)ide-accepting cytosine deaminases (CDAs)) [16,28,29,30], comprising a single zinc (Zn2+) ion and a hallmark zinc-dependent deaminase domain (ZDD) motif (His-x-Glu-x23–28-Pro-Cys-x2-Cys, where x is any amino acid residue), where the histidine and two cysteines (sometimes four cysteines in CDAs) of this motif coordinate the Zn2+ ion into the active-site; the catalytic glutamic acid, Glu72 in A3A and Glu255 in A3B, is an essential general acid/base to mediate the reaction [16,28,29,30].
Differences between the A3 catalytic domain structures are predominantly found in loops 1, 3, and 7, which surround the active site, reflecting differences in the intrinsic ssDNA sequence preference, physiological roles, and potential to oligomerize [31,32,33,34]. Several studies have suggested that oligomerization of some A3 proteins (A3B, A3D, A3F-H) [35,36,37,38,39,40,41,42,43,44,45,46,47] may be involved in regulating catalytic activity by forming inactive conformations [25,48,49,50,51,52]. Therefore, structural studies on how these enzymes associate will help in understanding the role, if any, of A3 oligomerization. Recently, crystal structures were reported for ssDNA-bound to catalytically inactive A3A-E72A (PDB: 5SWW, 5KEG), the E255A-inactivated A3BCTD-QM-∆L3-AL1swap chimera (hereafter termed A3BCTD*; PDB: 5TD5) and A3GCTD (PDB: 6BUX) [30,53,54]. Inactivation of the enzyme was necessary to prevent substrate deamination in those systems. The ssDNA has a pronounced kink at the target dC and preceding nucleobase, adopting a U-shaped conformation on binding, seen also in solution [55].
In the case of A3A-E72A (5SWW), association of a neighboring molecule with the 6-mer ssDNA is observed for two of the four crystallographically independent molecules in the crystal structure. For A3A-E72A (5KEG), which binds a 5-mer ssDNA, Cys64 on extended loop 3 forms an intermolecular disulfide link with its symmetry-related mate and in the ssDNA-free structure (4XXO) a pair symmetry-related His56 is bridged by Zn2+ to form a dimer. Zn2+ also features in linking pairs of molecules of a A3GCTD construct where Cys308 is bound to a quinone derivative (3V4J) [56] with Cys261 from one molecule linked via Zn2+-OH to His248 and His250 of a neighboring molecule. In the case of 9-mer ssDNA bound to inactive A3GCTD-E259A, both 5′- and 3′-ends form non-Watson-Crick base pairs with neighboring A3GCTD-ssDNA complexes to form a linear polymer in the crystal. The question is which, if any, of these intermolecular associations observed in the crystalline state are relevant in the solution state, let alone which of these associations, if any, might be physiologically relevant. Small-angle scattering, especially small-angle X-ray scattering (SAXS), can shed light on solution state associations.
So far there have not been any experimentally based models or structures of catalytically active A3 bound to ssDNA. Several studies have reported that ssDNA substrates bind weakly to inactivated A3 catalytic domains (medium-high µM range) [57,58,59,60] and reintroduction of the catalytic glutamate increased the strength of binding [59]. Therefore, to enhance the binding affinity and prevent deamination during experiments, we have studied the binding to active A3 enzymes of our recently characterized ssDNA-based A3 inhibitor containing 2′-deoxyzebularine (dZ, Scheme 1B). The sequence 5′-ATTT-dZ-ATTT (abbreviated as dZ-oligo) has a low (8–11) µM binding affinity for active A3 enzymes, including A3BCTD* and A3BCTD-DM [59,61]. The active A3BCTD*/dZ-oligo complex was analyzed using small-angle X-ray scattering (SAXS) to elucidate the changes in SAXS profiles upon ssDNA binding and subsequently to derive solution-state SAXS structural models to complement the solid-state X-ray structures. To facilitate comparison with X-ray single-crystal structural data and link with activity data, the A3BCTD* construct, rather than wild-type A3BCTD, was used in our SAXS study. This work provides a platform for further solution-state structural studies of full-length active A3 enzymes bound to ssDNA-based inhibitors.

2. Materials and Methods

2.1. Synthesis of 2′-Deoxyzebularine (dZ) Containing Oligodeoxynucleotide

The 2′-deoxyzebularine (dZ) containing oligodeoxynucleotide (5′-ATTT-dZ-ATTT, dZ-oligo) was prepared as described previously [59]. dZ oligo shows a low micromolar potency (Ki ~ 7.5 ± 1.7 µM) for A3BCTD-QM-ΔL3-AL1swap (abbreviated A3BCTD*) [59].

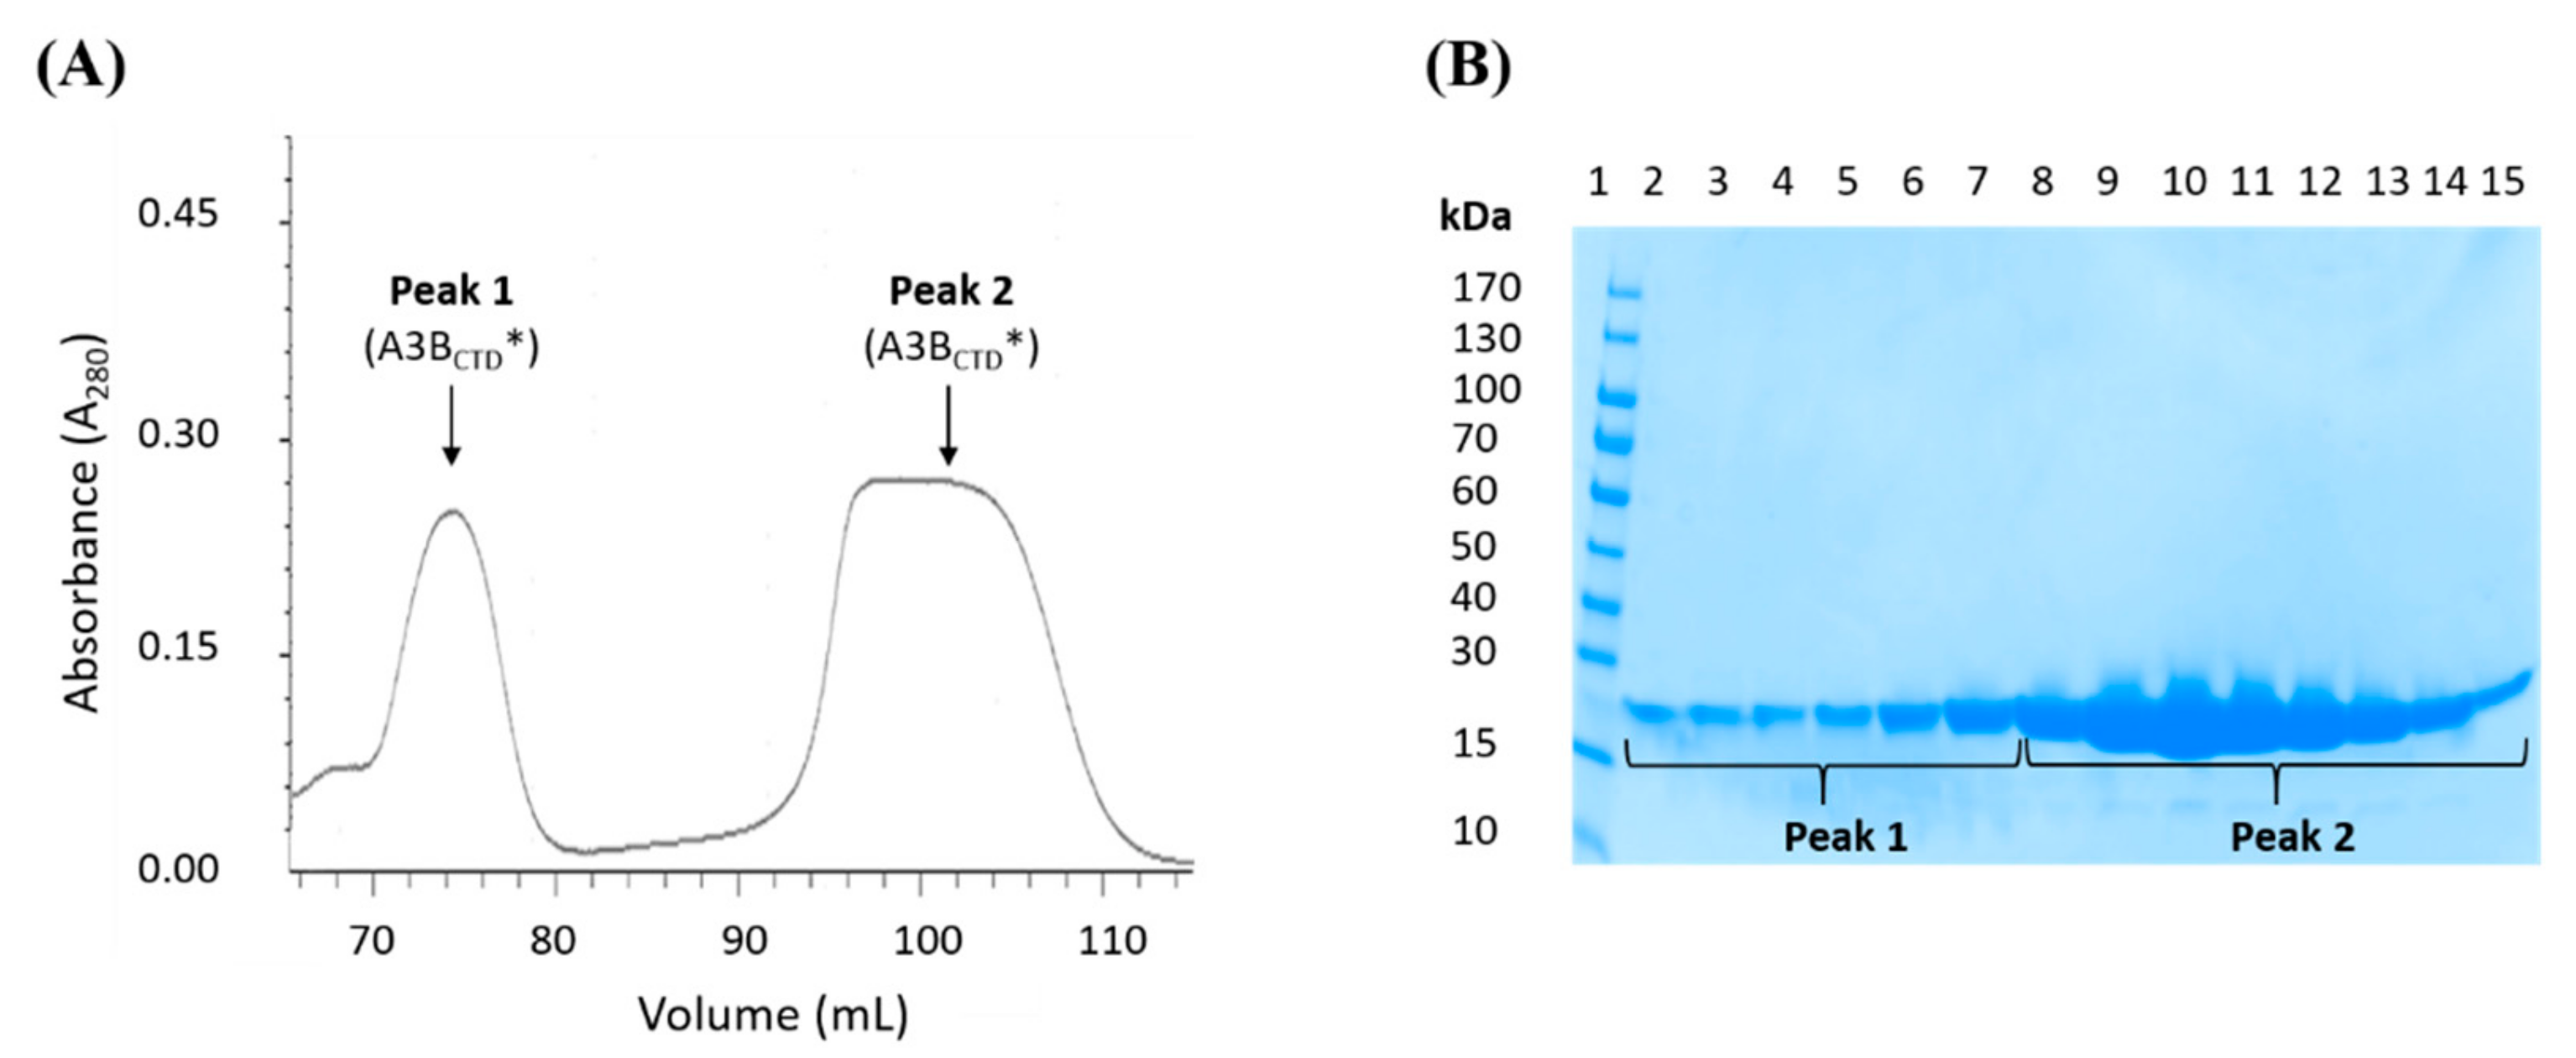
2.2. Protein Expression and Purification of A3BCTD* Protein

The catalytically active A3BCTD* was expressed and purified as described previously [59,61,62]. This variant contained four substitution mutations (F200S, W228S, L230K, F308K), the truncation of loop 3, and the transplant of loop 1 from A3A. Purification of the A3BCTD* variant resulted in two major peaks eluting off the size-exclusion chromatography (SEC) column in a 50 mM Tris-HCl pH 7.4, 0.5 M NaCl, and 2 mM β-mercaptoethanol (β-ME) buffer, which were collected and examined in this study.

2.3. Fluorescence-Based Deaminase in-Gel Activity Assay

A previously reported in vitro DNA deamination in-gel based assay [56,62] was used to assess the deamination activity of purified A3 proteins. Briefly, the fluorescently tagged oligonucleotide (TC-3′ 6-FAM-oligo, 5′-ATTATTATTATTCAAATGGAT TTATTTATTTATTTATTTATTT-fluorescein) and the purified proteins were buffer matched by diluting to the required concentrations using a 1× HEPES pH 7.4 buffer (10 mM HEPES-KOH, 50 mM NaCl at pH 7.4). In a PCR strip, reactions were setup using 5 µL of a 1.6 µM TC-3′ 6-FAM oligo mixed with 5 µL of 10 µM of the purified protein (final concentrations of 800 nM DNA to 5 µM protein). The reaction mixtures were then subjected to temperature cycling in a thermocycler (Eppendorf), first incubating for an hour at 37 °C, followed by incubation at 95 °C for 3 min, then cooling to 12 °C. The reaction mixtures were then treated with 1 µL of 120 nM uracil-DNA glycosylase (UDG), to cleave the uracil bases in the oligonucleotide) (New England Biolabs, Ipswich, MA USA) and incubated for a further 10 min at 37 °C. Following UDG treatment, 1.2 µL of a 1 M NaOH was added to the mixture and incubated for 5 min at 98 °C to stop the reaction and cleave DNA with an abasic site. To separate and resolve the ssDNA reaction products, denaturing Tris/Borate/EDTA (TBE)-Urea polyacrylamide gels for gel electrophoresis (PAGE), prepared by standard methods [63], were used.

2.4. Small Angle X-ray Scattering (SAXS) Setup

Small-angle X-ray scattering (SAXS) was used to provide structural information and low-resolution models of the active A3BCTD* protein and its complex with the dZ-oligo in solution. The use of a co-flow system coupled to a size-exclusion chromatography-SAXS system (SEC-coflow-SAXS) was used to resolve sample species, buffer match, and prevent sample degradation due to radiation damage, while additionally monitoring the elution profile by UV detection [64]. In co-flow, the sample flows into the center of the capillary cell while a matched buffer encases the sample preventing protein denaturation due to intense X-radiation depositing on the cell walls, which also enhances the signal to noise ratio [65].
Measurements were conducted at the Australian Synchrotron on the SAXS/WAXS beamline equipped with a Pilatus-2 1M detector. SAXS measurements were obtained at 25 °C, using a camera length of 1.6 m and frames were taken at one second intervals. Samples of A3BCTD* (0.5–10 mg/mL) in buffer (50 mM citrate-phosphate, pH 5.5, 200 mM NaCl, 2 mM β-ME, 200 μM sodium trimethyl-silyl-propane-sulfonate (DSS), 10% glycerol) with and without ssDNA at varying ratios were loaded in a 96-well plate (50 μL) and degassed for 30 min under mild vacuum in a degassing station chamber (TA Instruments). Scattering data were obtained using co-flow SEC-SAXS mode, samples were injected onto a pre-equilibrated SEC column (SEC column Superdex 75 Increase 3.2/300 GL) then run at a flow rate of 0.2 mL/min while near-simultaneously collecting SAXS data of the sample per frame. The sample’s elution profile was monitored by UV-visible spectroscopy at various wavelengths (280, 260, 220, and 480 nm), There was a slight lag of 1.05 s/frame between monitoring the elution profile by UV-visible spectroscopy and the recording of SAXS of the sample; this lag was accounted for during analysis.

2.5. Analysis of SAXS Data

The raw two-dimensional scattering data were processed through a number of steps. First, the raw SAXS data frames were reduced by intensity normalization (using scattering by water to place data on an absolute scale), background subtraction, and scattering vector calibration using SCATTERBRAIN 2.82 program (http://archive.synchrotron.org.au/aussyncbeamlines/saxswaxs/software-saxswaxs). A SAXS profile plot was then derived by plotting the normalized integrated intensity of the scattering signal against the frame number using CHROMIX (ATSAS 2.8.3 suite [66]) (see Scheme 2). If the profile indicated that the sample eluted as a homogeneous single species off the SEC column, then the scattering data were processed into a 1D-scattering curve. However, if the sample contained partially unresolved multiple species, then its scattering data was first deconvoluted before proceeding with further analysis. Simple deconvolution involved using SVD/EFA BioXTAS RAW [67], where the singular value decomposition (SVD) function defined the number of components in the sample (referred to as eigenvalues). Then the evolving factor analysis (EFA) method was utilized to define the boundaries and extract the scattering curves of each component.
The frames of interest were first averaged and subtracted from the buffer frames using CHROMIX. Then the processed scattering data were transformed into a 1D-scattering curve using the PRIMUSQT program from ATSAS 2.8.3 suite [66], where log of scattering intensity (log(I)) was plotted against the scattering vector q = 4πλ−1sinθ, in which 2θ represents the scattering angle, and λ defines the x-ray wavelength of 1.0332 Å) (Scheme 2).
Characteristic parameters can be retrieved from the scattering pattern of the samples that describe the homogeneity, fold, size, and overall shape of the sample (Scheme 3). Analysis was conducted using programs within the PRIMUSQT ATSAS 2.8.3 suite [66]. Initially, the 1D-scattering curve is converted into a double logarithmic plot to highlight that the low-q data has an artefact free profile, a plateau, consistent with a monodisperse protein sample. Plotting low q data using the Guinier distribution analysis (log(I) vs q2) through the AUTORG method allows estimation of the radius of gyration (Rg) and the extrapolated intensity at zero scattering angle I(0), describing the overall size of the molecule. The assumption of a globular shape for the Guinier plot is valid when qRg ≤ 1.3 (denoted q·Rg max) and the Guinier analysis is linear, which is also consistent with a profile of a monodisperse protein sample. Next, the data are converted into a Kratky plot (I·q2 vs q) to assess the shape and fold of the molecule. In addition, the Kratky plot provides information regarding the oligomeric state of the molecule [68]. An indirect inverse Fourier transformation of the scattering data performed using AUTOGNOM results in the pairwise distribution function P(r) curve, which represents the distribution of interatomic distances (r) within the molecule. The molecule’s maximum diameter (Dmax) can be determined from the P(r) curve as P(r) approaches zero at r >> 0 (Scheme 3).
Furthermore, the Rg and I(0) can be accurately calculated from the P(r) curve using all the experimental data, unlike the Guinier analysis, which uses only a small subset at low q. The excluded particle volume (also termed Porod volume, V) is calculated through the DATPOROD program using I(0) values attained from the P(r) plot (Scheme 3). The Porod volume (V) can then be used to directly estimate the molecular weight (MW in Daltons) of the solute (MW ≈ V (in Å3)·(average protein density ~1.1 g·cm−3NA(in mol−1)·1 × 10−24 Å3/cm3) ≈ V·0.6) [69] providing valuable information about the oligomeric state of the molecule (Scheme 3). Furthermore, the MW can also be calculated from I(0) if the concentration is accurately known using a previously described method [70].
Low-resolution 3D-models can then be computed through ab initio shape restoration using the DAMMIF program by applying restraints of biophysical parameters attained from the 1D scattering curve. The assumption that scattering by the oligonucleotide can with negligible error be treated as scattering by the protein is justified as follows. The 9-mer oligonucleotide (formula; C89H125N24O63P9) used has intrinsic scattering of X-rays, F000, of 1450 e-; the protein (formula C1102H1632N302O305S13Zn) has F000 of 13,036 e- (give or take a few electrons of water tightly associated with the protein, and to a lesser extent with the partly buried oligonucleotide). Now, assuming equal volumes per non-hydrogen atom and reconfiguring the oligonucleotide to have the protein composition of the A3BCTD, gives then a difference in scattering of just 256 e- more for the oligonucleotide than if it had been protein. This difference is insignificant in comparison to the total scattering of 14,486 e-. However, it is important to note that the total scattering of the oligonucleotide is highly significant at just over 1/10th that of the protein and thus is potentially observable. Thus, for calculation of molecular envelopes protein-only was assumed. The DAMMIF program first generates several models, which are then averaged (DAMAVER) and are further filtered by cut-off volume constraints based on derived SAXS analysis parameters (DAMFILT) to produce the dummy filled models. The normalized spatial discrepancy (NSD) score quantitatively measures the similarities between the generated set of 3D envelope models, where NSD ≤ 0.9 is an acceptable variance [71,72]. These envelope models can be superimposed with atomic models to assemble a high-resolution model. Lastly, rigid body modelling is conducted using FoXS [73,74] and CRYSOL [66] (corrected for standard error) by comparing the experimental scattering data to the back-calculated 1D-scattering profiles of atomic structures or model structures, to validate the model. From these programs a fitting parameter termed the Chi2 value (also called χ2) can be obtained. Chi2 gives a measure of the discrepancies between the experimental scattering data and the back-calculated 1D-scattering profiles of atomic structures; a Chi2 equal to one would indicate a perfect fit.

3. Results

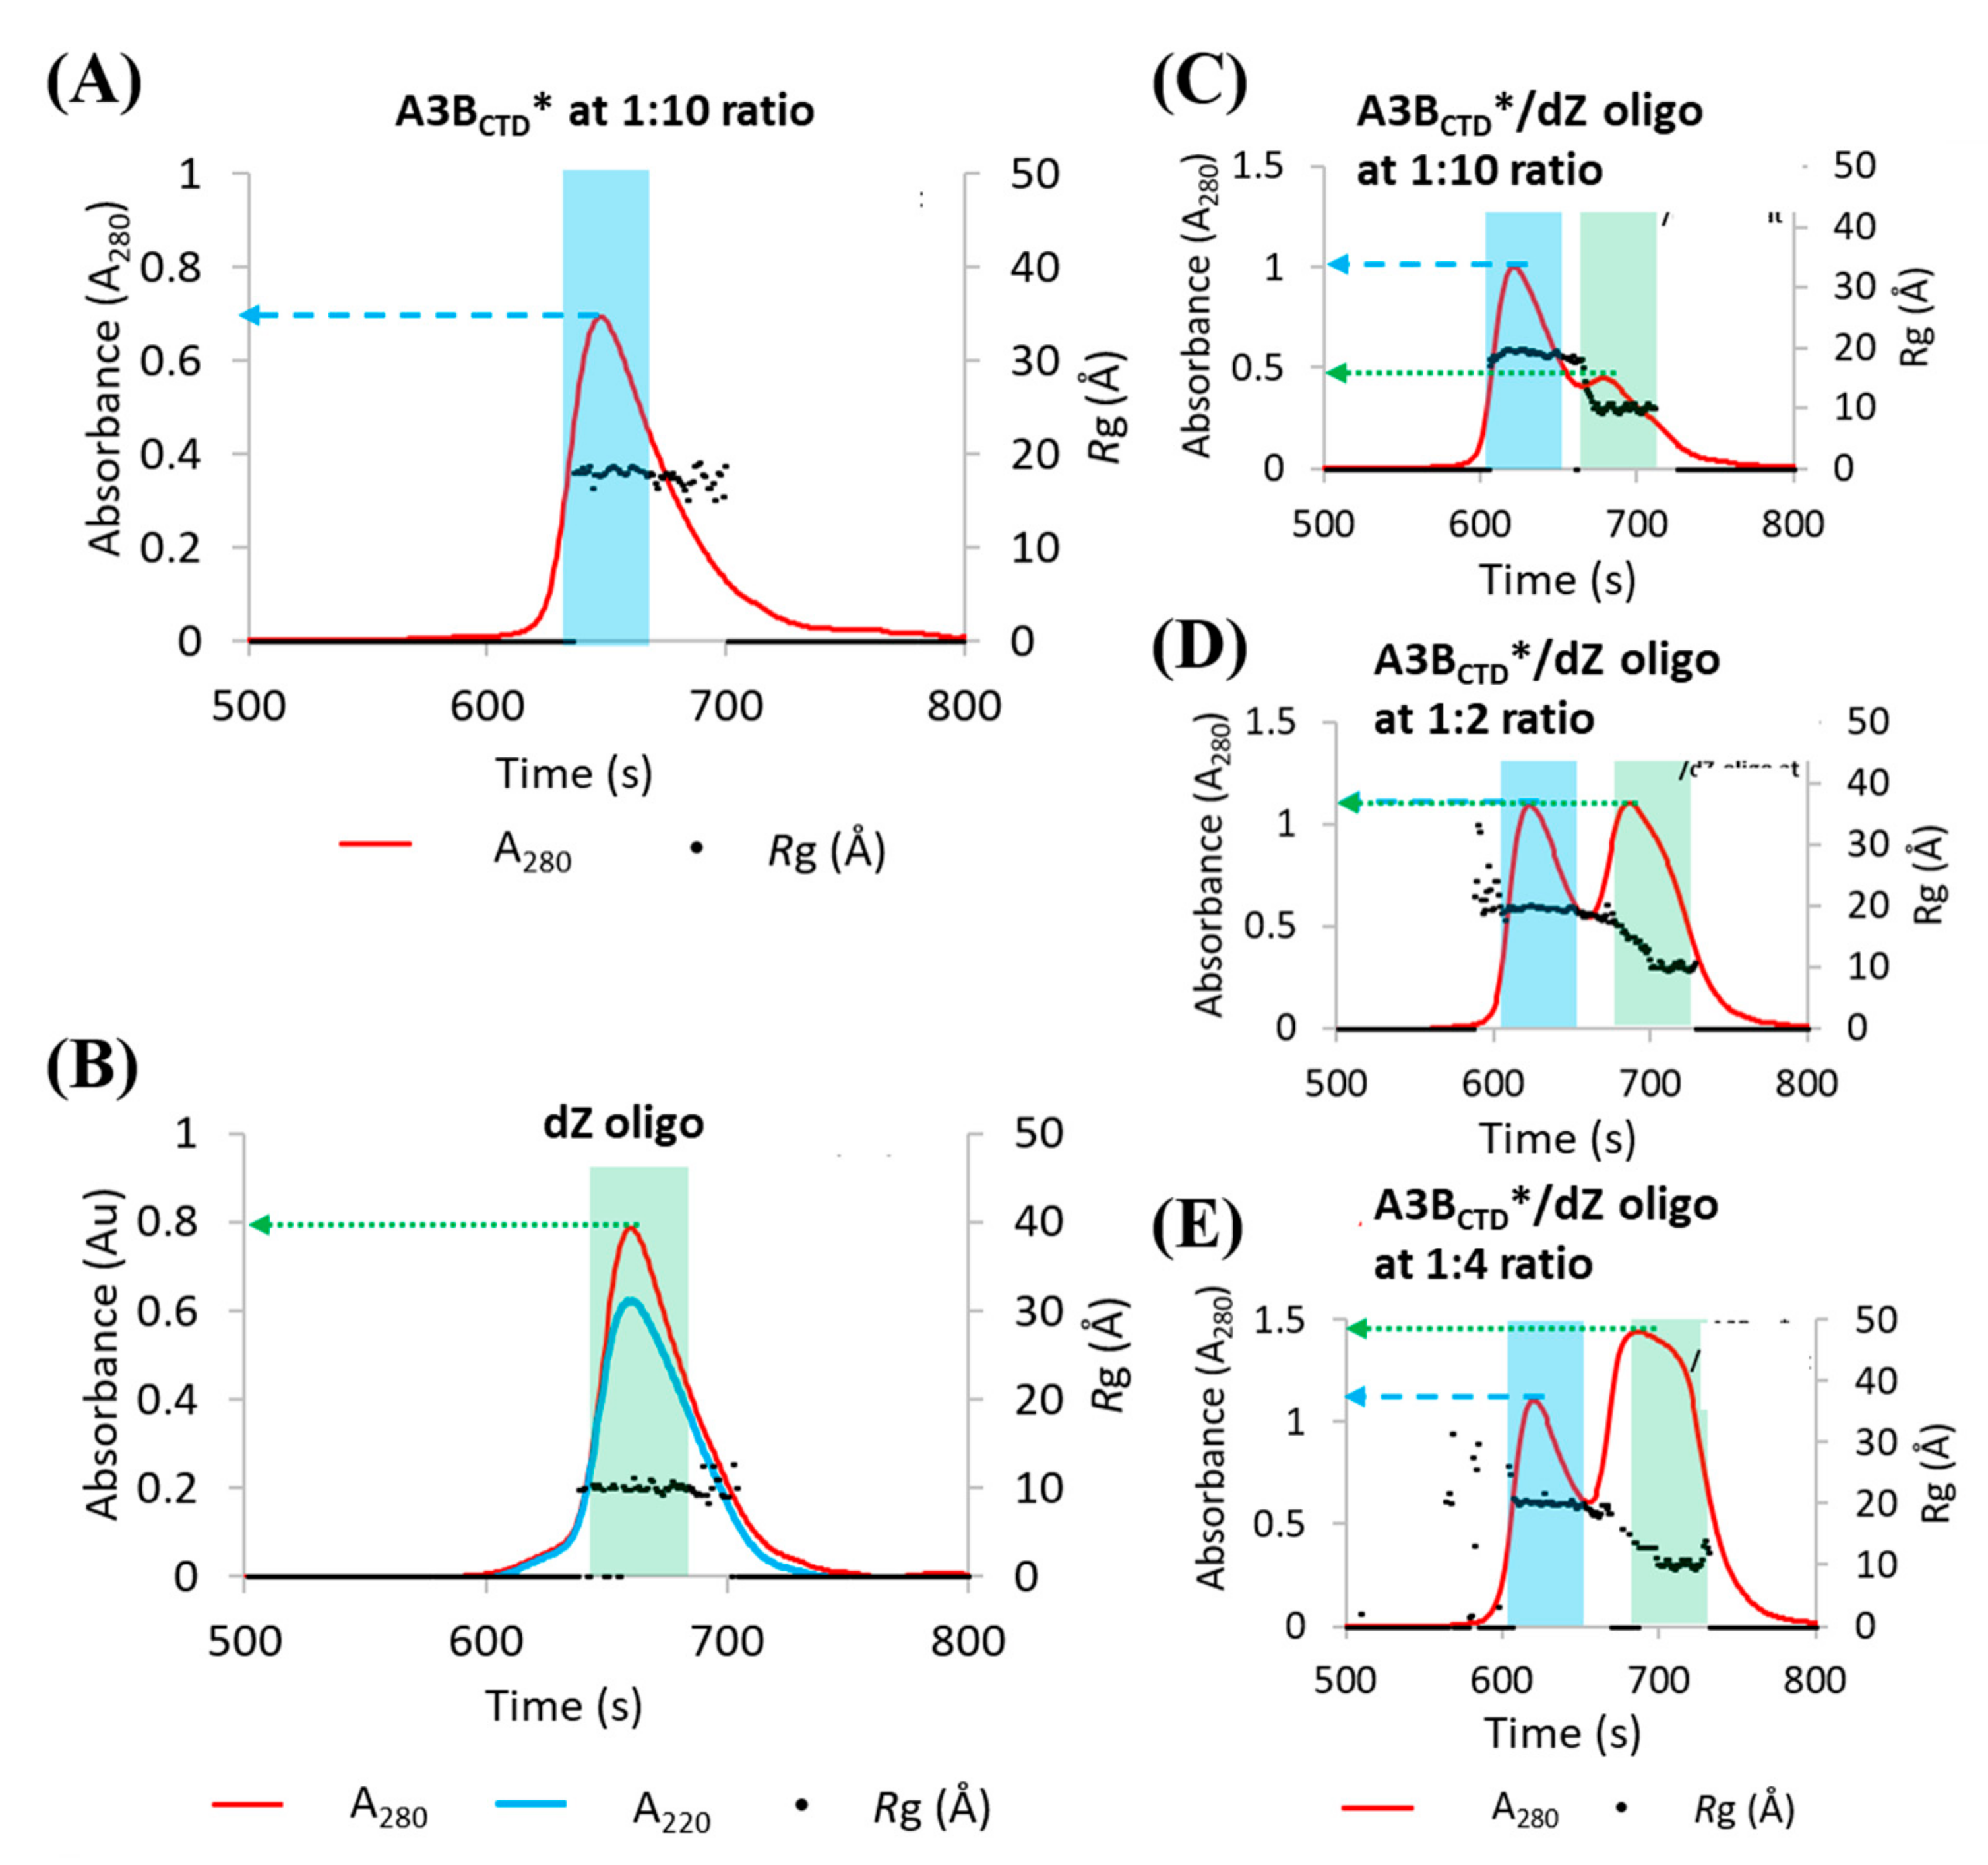
3.1. Methodology of Investigation: Using SAXS to Elucidate the Solution-State Structure of A3BCTD* in Complex with a ssDNA Inhibitor

Until recently, the structure of the A3BCTD-ssDNA complex was unknown. Structural studies conducted using an inactivated A3BCTD construct (A3BCTD*-E255A: A3BCTD-QM-ΔL3-AL1swap-E255A chimera), where E255A is an inactivating mutation of the ZDD motif, along with a ssDNA substrate yielded the first visualization of an inactivated A3BCTD-ssDNA complex (PDB: 5TD5) [30]. Unlike previous studies, our current study examines an active A3BCTD* bound to our dZ-containing oligodeoxynucleotide (dZ-oligo) [59] in which the target dC in the preferred A3B recognition motif was substituted with dZ, a known inhibitor of cytidine deaminase (CDA) [75,76,77]. The presence of glutamic acid in the active site of the protein is essential for activation of dZ through protonation of N3 atom of the nucleobase and concurrent nucleophilic addition of the zinc-bound OH-/H2O to the C4 atom of dZ, which converts dZ into a tetrahedral transition-state analogue of cytidine deamination. These dZ-oligos allow us to study complexes formed by active A3 enzymes with ssDNA. Using active protein, the previously described A3BCTD*, and the 9-mer dZ-oligo, we have obtained from SAXS data the first model of an active enzyme with ssDNA, allowing comparisons to the previously published crystal structure of inactivated A3BCTD*-E255A with a 5-mer ssDNA substrate (PDB: 5TD5) [30].
To ensure a homogeneous sample and to reduce background noise, measurements used size-exclusion chromatography (SEC) co-flow-SAXS to examine the samples in solution. A3BCTD* eluted from the column as a single peak producing a good scattering curve (Figure 2A and Figure S3 in Supplementary Materials). Therefore, this variant was selected to study its conformation in solution with and without dZ-oligo.

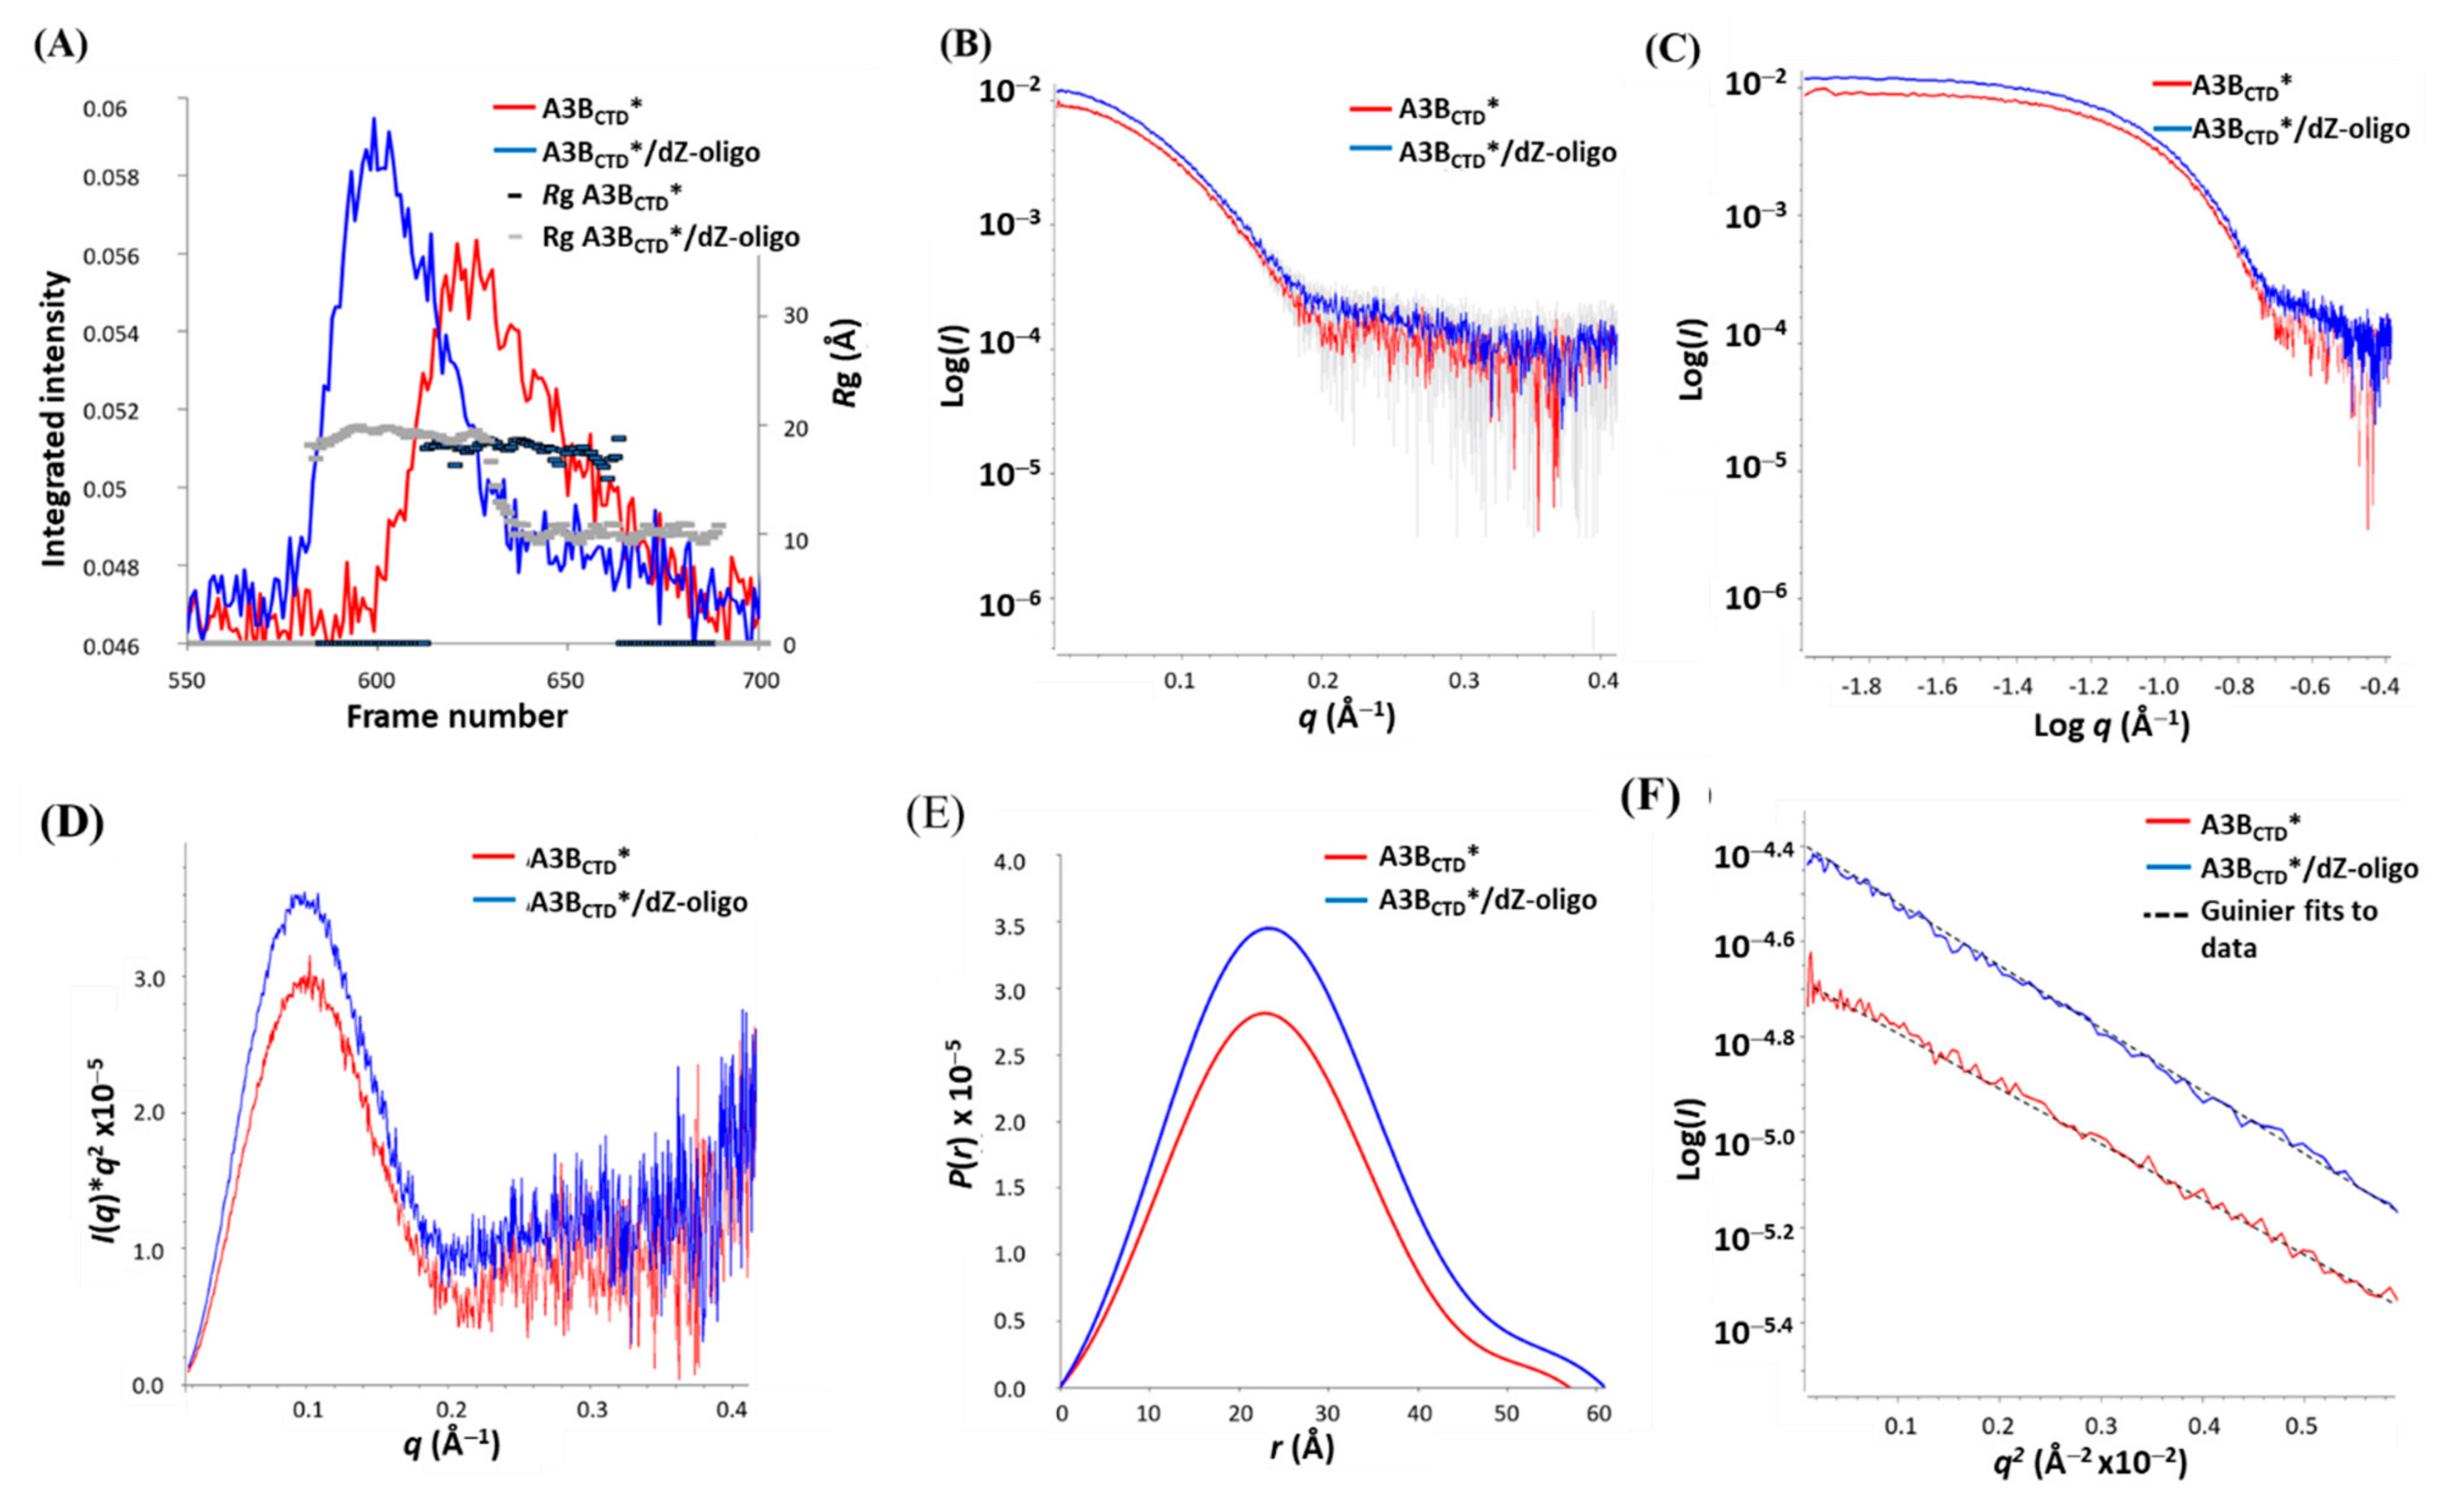
3.2. SAXS Profile Analysis of A3BCTD* Alone and in Complex with dZ-Oligo in Solution

Initial assessment of the SEC elution profiles showed that the A3BCTD* protein largely eluted as a single peak with a peak maximum at around 648 s (Figure 2A), whereas the dZ-oligo eluted at around 662 s (Figure 2B). Overlaying the Rg traces onto the elution profiles revealed that the protein had an average Rg of ~18.7 Å, whereas the dZ-oligo had an Rg of ~9.6 Å. Moreover, both samples were monodisperse as indicated by the constant plateau of Rg values across the elution peak, as seen in Figure 2A,B.
On adding the dZ-oligo to A3BCTD* (Figure 2A) at a ratio of one-to-one (protein to ssDNA) (highlighted with blue bar, Figure 2C), an increase of ~0.3 absorbance units (AU) in the protein peak maximum was observed (blue arrow, Figure 2C). This increase directly correlated with a decrease of ~0.3 AU of the dZ-oligo peak maxima (green arrow in Figure 2B,C). This change in absorbance implied that the dZ-oligo was bound to A3BCTD*. Consistent with these observations, the Rg of the protein increases from a value of ~18.7 Å (Figure 2A) to ~19.5 Å in the presence of the oligo (Figure 2C–E), which also causes the protein to elute from the SEC column earlier (after ~620 s, Figure 2C–E). At a ratio of one-to-two or one-to-four (protein to oligo), the protein peak maximum increased by ~0.4 Au (blue arrow, Figure 2D,E). This indicated that the A3BCTD* protein was saturated with the oligo at ratios of around one-to-two (protein to oligo) or higher. Therefore, a one-to-two ratio of protein to oligo was used to ensure near-complete occupation of the A3BCTD* binding sites by the dZ-oligo.
The raw scattering data of A3BCTD*, dZ-oligo, and A3BCTD*/dZ-oligo samples were processed and plotted as SAXS profile plots along with the Rg trace (see Figure 3A). The dZ-oligo resulted in an Rg ~ 9.5 Å (Figure 3A), consistent with having a sequence with nine nucleotides. However, due to its small size and limited resolution of SAXS (Rg > 10 Å), further analysis of dZ-oligo was not made. On the other hand, the scattering corresponding to the A3BCTD* protein had a steady value of Rg across the SAXS profile plots for both A3BCTD* (frames 610–660, Figure 3A) and A3BCTD*/dZ-oligo (frames 570–635, Figure 3A), indicating that both species were homogeneous. Therefore, these frames were averaged and transformed into 1D-scattering curves as described in Supplementary Materials. From the 1D-scattering curves, model-free biophysical structural parameters were extracted that describe the molecules’ configuration in solution (listed in Table 1 and displayed in Figure 3).
Assessment of SAXS data for A3BCTD* and the A3BCTD*/dZ-oligo complex using the Guinier distribution showed that both samples had a good fit to the linear regression of log I(q) versus q2 at low scattering angles, indicating that the sample profiles were not aggregated (Figure 3F). Moreover, at low q values the double logarithmic plot, log I(q) versus log q, plateaued, consistent with monodispersed samples (Figure 3C). Estimation of Rg and I(0) values from the Guinier plot (Figure 3F) agreed well with those derived over all data from the independent pair distribution function P(r) versus r for both samples (listed in Table 1), further confirming the quality and relative size of the solutes. The Kratky plot, q2·I(q) versus q, exhibited a bell-shaped peak at low q (peak maxima at q ~ 0.1 Å−1) that then converged to the scattering axis at the higher q range (Figure 3D), indicating that the molecules were well-folded and globular, with not much flexibility. As expected, the Rg, Dmax, and Porod volume increased slightly upon formation of the A3BCTD*/dZ-oligo complex in comparison to the ligand-free A3BCTD* (as displayed in Table 1). Furthermore, the P(r) plot displayed a symmetrical curve (Figure 3E), which implied that the molecule (both with and without dZ-oligo) forms a compact near-spherical shape, consistent with results observed using the Kratky plot. These parameters were then used to calculate the molecular weight (MW). From the Porod volume and I(0) MWs of ~23 and 21 kDa, respectively, were calculated for the A3BCTD*. These MW estimates are comparable to the known MW of A3BCTD* of ~22 kDa [30,62]. The A3BCTD*/dZ-oligo sample had slightly larger MWs and increase in the overall subunit ratio (summarized in Table 1), which further supports that a protein-ssDNA complex was formed.

3.3. SAXS Model Structures of A3BCTD* Alone and in Complex with dZ-oligo

Envelope models of the A3BCTD* and the A3BCTD*/dZ-oligo complex were generated from the experimental scattering curves (Figure 4A,B) using ab initio shape restoration. Parameter information derived from the scattering curves of ten ab initio models was generated for each sample assuming P1 symmetry, as these samples were determined to be monomeric. The envelope models were filtered into a single model using DAMAVER and DAMFILT and used for atomic modelling, as described in Supplementary Materials. A mean NSD score of 0.559 for the A3BCTD* envelope and of 0.826 for the A3BCTD*/dZ-oligo complex envelope indicated a very good to acceptable consistency [71,72], respectively, for the generated ensembles as summarized in Table 2.
The published X-ray crystal structures 5CQI [62] (inactive A3BCTD-QM) and 5TD5 [30]) (inactive A3BCTD*-E255A/5′-TTCAT complex) were manually docked into the experimentally derived SAXS envelope models (Figure 4). To match the size of our 9-mer oligo (dZ-oligo), four nucleotides were added using PyMol [78] onto the existing 5-mer oligo observed in the 5TD5 structure to give 5′-ATTTCATTT. The resulting structure is termed 5TD5* below. The A3BCTD* envelope model exhibited a globular shape with a slight concave groove (Figure 4C). On the other hand, the A3BCTD*/dZ-oligo envelope had an additional unoccupied electron density that resembled an arm near the groove, which was less prominent (Figure 4D). This empty electron density region was presumed to be part of the dZ-oligo indicating the location of the active site. Superimposing these low-resolution dummy models with the atomic structures (5CQI or 5TD5* [30,62]) resulted in a good visual fit, indicating that the derived SAXS envelope models corresponded well to the published atomic structures [30,62]. Based on the superimposed DNA bound A3BCTD atomic structure (5TD5* [30]) and the unoccupied electron density observed in the envelope model of the A3BCTD*/dZ-oligo sample, it can be concluded that the dZ-oligo bound to the A3BCTD* protein in a similar manner as reported for the substrate, where the ssDNA binds in a U-shaped conformation [30].
Interestingly, the 3′-end of the dZ-oligo bound to A3BCTD* appeared to be loosely attached and conformationally flexible, as indicated by the shape of its protrusion from the protein (Figure 4D), consistent with reports of A3-ssDNA structures [30,55]. Nevertheless, to validate the generated SAXS models, rigid body modelling was performed by comparing the back-calculated 1D scattering profiles of the atomic structure models (PDB; 5CQI and 5TD5*) to the experimentally derived scattering data using FoXS [73,74] and CRYSOL [66]. The scattering data from both samples showed a good fit to the corresponding X-ray models, as summarized in Table 2 and illustrated in Figure 4A and B. In contrast, when the ligand-free A3BCTD* SAXS data was cross-compared to the back-calculated profile of the ssDNA-bound A3BCTD* atomic structure (5TD5*) or the A3BCTD*/dZ-oligo SAXS data was cross-compared to the ligand-free A3BCTD-QM-E255A atomic structure (5CQI), poor fits were observed (see Figure S1 in the Supplementary Materials). This confirms that the X-ray crystal structures (PDB 5CQI and 5TD5 with extended ssDNA) describe well the structures of the ligand-free A3BCTD* and the A3BCTD*/dZ-oligo complex in solution, respectively. We can also conclude that the shape of the A3BCTD*/ssDNA complex did not change significantly when the inactivating mutation (E255A) was reversed.

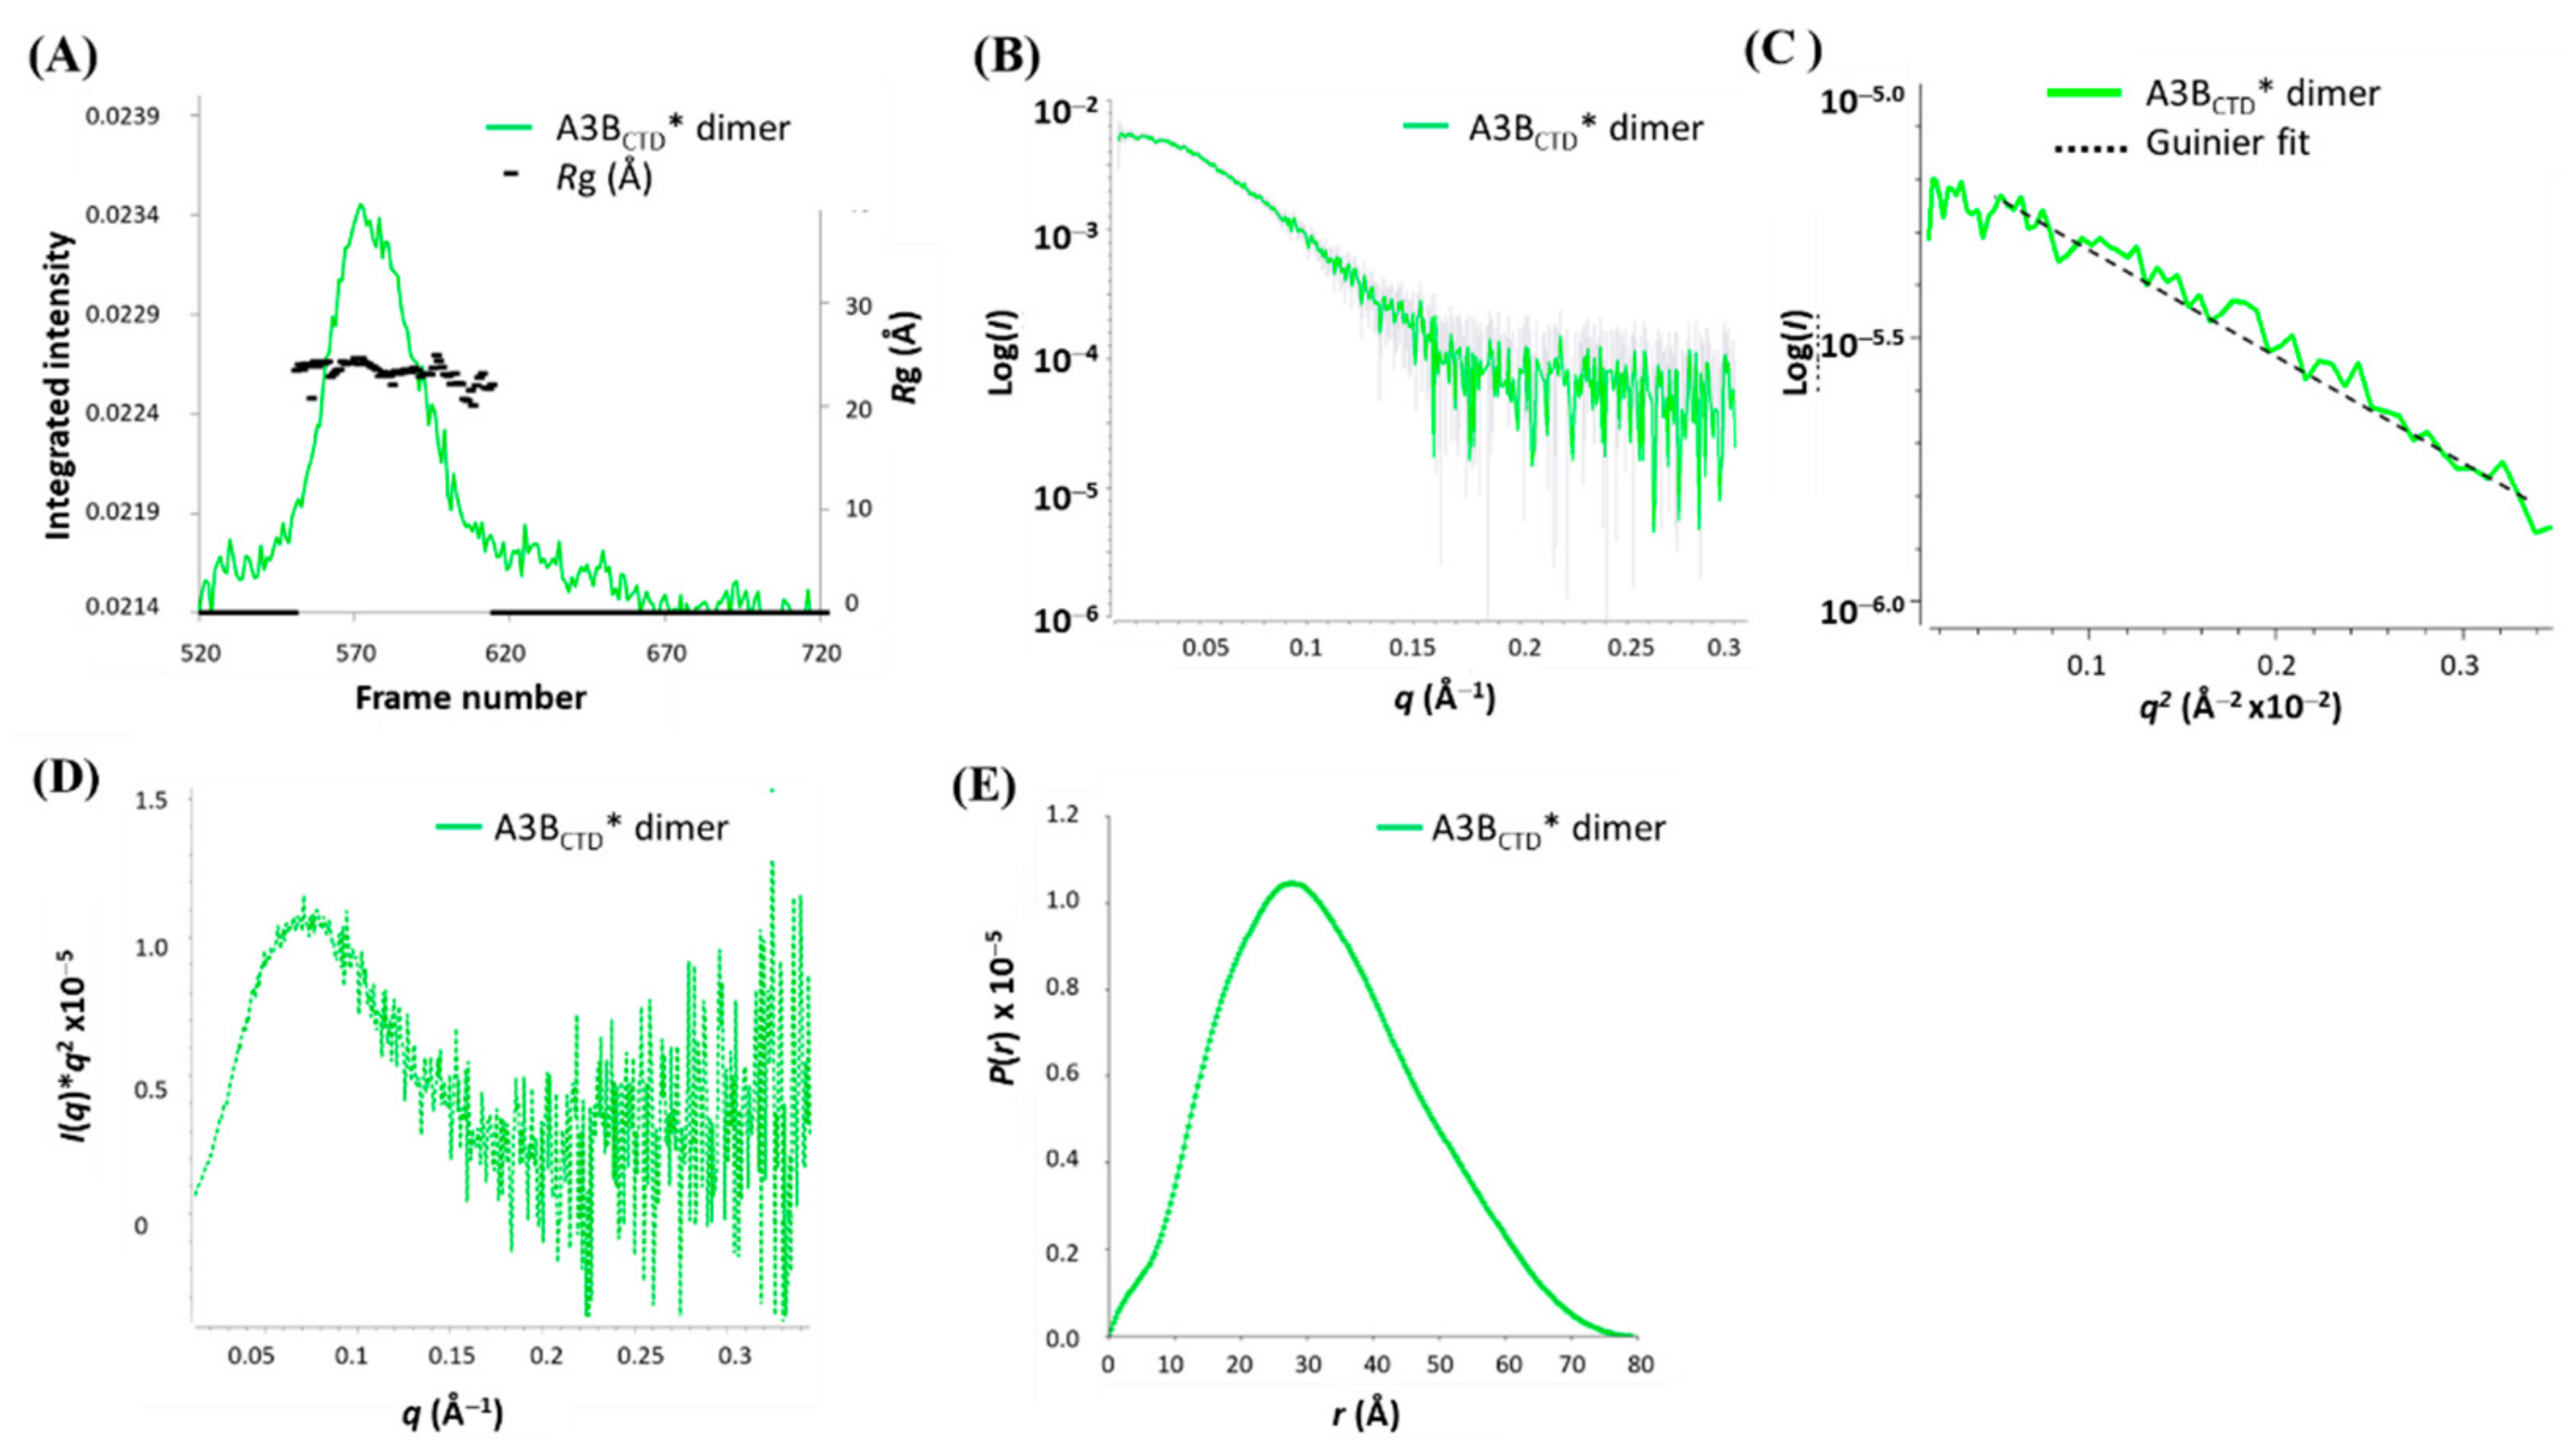
3.4. Multimerization of A3BCTD* in Solution

The multimerization of A3 proteins (A3A, A3B, A3D, A3F-H) has been reported to be mediated through surface interactions or through RNA interactions [47,51,52,79]. Several studies have indicated that higher oligomeric states may regulate the A3s’ catalytic activity by forming inactive conformations [25,48,49,50,51,52]. However, the biological significance of multimerization remains unclear, especially as higher concentrations of A3 favor oligomerization but contrarily, if this is the result of expression due to pathogenic attack, such oligomerization for which evidence for enhanced activity is scant, is scarcely conducive to countering the attack. During purification of the catalytically active A3BCTD* protein it was noted that two predominant peaks eluted off the SEC column, a peak eluting following ~90 mL of buffer, which corresponded to the monomeric A3BCTD* species (discussed earlier in Figure 2) and another larger species eluting off the SEC column earlier, following ~70 mL of buffer (peak 1, Figure 5A). Fractions from both peaks visualized on a reducing SDS-PAGE gel revealed that the eluants had the same molecular weight of ~22 kDa (Figure 5B) and both species corresponded to an A3BCTD protein (verified using mass spectrometry analysis).
In addition, both species were catalytically active (confirmed qualitatively by an in vitro DNA deamination in-gel assay [62], see Figure S2 in the Supplementary Materials). Based on the position of the SEC elution profile, we conclude that peak 1 corresponds to homo-dimeric A3BCTD* (with a molecular weight of ~44 kDa, referred to as ‘A3BCTD* dimer’). This contrasts with the other A3BCTD variants we reported in previous studies [59,61,80], A3BCTD-QM-ΔL3, A3BCTD-QM-ΔL3-E255A, and A3BCTD-DM, which eluted only as monomeric species. Previous reports have suggested that A3A exists as both a monomer and a dimer in vitro [52,53]. The observed multimerization of the A3BCTD* variant may be facilitated by the incorporation of loop 1 from A3A into the A3BCTD, consistent with the A3BCTD* adopting some characteristics of A3A [81]. Examination of the solution structure of the A3BCTD* dimer using SAXS may shed some light on its assembly and potential function.
The dissociation behaviour of the A3BCTD* dimer was examined to determine if there was an equilibrium between the two multimeric states (dimeric and monomeric forms) of A3BCTD*. First, the A3BCTD* dimer was concentrated to approximately 5 mg/mL, then re-examined using SEC-FPLC. To our surprise, the concentrated A3BCTD* dimer sample eluted off the SEC column as two peaks. The majority of the sample ~ 93% eluted off the column in the A3BCTD* dimeric form, whereas a minor peak (~7%,) corresponding to the monomeric A3BCTD* species was noted (peak 2, Figure 6A). In parallel, when the monomeric A3BCTD* sample (10 mg/mL) was concentrated we observed that the majority of the protein eluted as a monomer (~96%), while a small percentage ~ 4% eluted as the larger dimeric species (see Figure S3 in Supplementary Materials, small peak at 580 s). These findings suggested that a true equilibrium between the dimeric and monomeric A3BCTD* species was unlikely, and that both dimer and monomer species are mostly stable. To determine if the degree of dissociation of the dimer changes as a function of concentration, the A3BCTD* dimer was additionally studied under dilute concentrations (0.5, 1.25, and 2.5 mg/mL). Inspection of the elution profiles illustrated that for all the concentrations tested, the A3BCTD* dimer resulted in the same relative amount of monomeric A3BCTD* (7%–8%, observed at peak maximum around 710 s, Figure 6B), comparable with previous observations shown in Figure 6A.
The presence of surface-exposed cysteine residues, Cys239 and Cys354, in A3BCTD* (PDB: 5CQI) raised the possibility that a disulfide-bridged homo-dimeric species may have formed under oxidizing conditions (where the reducing SDS-PAGE showed that the dimer travelled in a similar manner as the monomeric A3BCTD* species). Initially, purification of the A3BCTD* dimer was attempted through SEC-FPLC in reducing conditions. However, this larger species remained intact, signifying that under non-denaturing conditions of SEC-FPLC (Figure 6A) (as contrasted with SDS-PAGE, Figure 5B) this conformation remained stable and the disulfide bridge (if involved in dimerization) must be buried and effectively inaccessible to the reducing agent. As the disassembly of the A3BCTD* dimer was not triggered by dilution, and this dimer’s stability was maintained in solution, self-association of the A3BCTD* monomeric subunits appears to be mediated by a disulfide linkage.

3.5. Interface Prediction of the A3BCTD* Dimer

Assessment of the potential binding interface region between two A3BCTD* subunits was investigated using PRISM 2.0 webserver [82,83], which uses a prediction-based algorithm with known interacting protein complexes as the template interface dataset and models the interface complex of the target proteins. The favorability of a given binding reaction is reported by the Gibbs free energy (ΔG), where the more negative ΔG, the more favourable is the formation of the dimer. Under the notion that loop 1 from A3A may influence dimerization of A3BCTD*, the dimerization potential of the A3BCTD* and A3BCTD-QM-ΔL3 variants were compared using PRISM 2.0 webserver [82,83] as they only differed by the swap of loop 1. The generated A3BCTD* interface models were found to have much lower ΔG values (ΔG ~ −38 and −18 kcal/mol, see Tables S3 and S4 in Supplementary Materials) in comparison to the interface models of the A3BCTD-QM-ΔL3 variant (ΔG ~ −13 and −3 kcal/mol, Tables S1 and S2 in Supplementary Materials), indicating that the A3BCTD* construct had a much greater dimerization potential than the A3BCTD-QM-ΔL3 construct. As A3BCTD* differed from the A3BCTD-QM-ΔL3 construct only by replacement of its loop 1 by the corresponding loop from A3A, the presence of this loop has directly influenced dimerization, consistent with experimental observations, where only the A3BCTD* variant resulted in the elution of a larger dimeric species (Figure 5).
Two potential dimerization models of A3BCTD* (termed model 1 and model 2) were predicted (Figure 7). The interface of each model was predicted to be largely formed through electrostatic interactions that accordingly stabilized the structural arrangement of a dimeric molecule (refer to Tables S3 and S4, respectively, in Supplementary Materials). The interface of model 2 was noticeably less favourable (ΔG ~ −18 kcal/mol) than that of model 1 (ΔG ~ −38 kcal/mol) and was predicted to associate primarily through loops 3 and 5, which form part of the active-site cavity. This model, which occludes the binding site, appears inconsistent with the apparent observed activity of A3BCTD* dimer. As the surface of the active site is highly positively charged due to a histidine and a stretch of arginines, the interactions between residues forming this interface maybe weaker and less stable due to electrostatic repulsion (Figure 7B,D). On the other hand, the interface of model 1 occurred through interactions slightly away from the active site (Figure 7A,C).
Self-association between residues in β1, α1, α2, and loop 1 of the two molecules places in close proximity a pair of cysteines (Cys239 on beta sheet 2, β2) that would further stabilize the interface by forming a disulfide bond (see Figure 7A,C). Assessment of these models using an alternate webserver PISA [84,85], which appears to account better for compensating interactions of protein side chains with water, indicated that both of these interfaces form through weak interactions such as hydrogen bonds and salt bridges (ΔG < 0) (see Tables S5 and S6, respectively for model 1 and model 2 in Supplementary Materials). Thus, the predicted disulfide bond of model 1 appears essential for structural stability of the A3BCTD* dimer. Further verification of this model through SAXS measurements was therefore sought.

3.6. SAXS Model Structure of the A3BCTD* Dimer

The A3BCTD* dimer was examined using SAXS (Figure 8) to confirm the hydrodynamic size and gain insight into the relative structure of the protein. The Rg trace was overlaid onto the SAXS profile plot, indicating that homogeneous species were largely present across the sample peak with a Rg of ~24 Å (frames 540–615, Figure 8A). The larger Rg reinforced that this A3BCTD* species was in fact bigger than the monomeric A3BCTD* species (Rg ~ 18 Å, Figure 3). The Guinier plot showed signs of slight sample aggregation at very low scattering angles (q < 0.0165 Å−1). Therefore, the first few points were removed to derive a linear dependency of the low q data in the Guinier plot (Figure 8C). The Kratky plot (Figure 8D) showed that the sample was a well-folded globular protein. This plot displayed a bell-shaped curve at low q, but at higher scattering angles (q > 0.2 Å−1) an upward turn of the curve indicated some flexibility in the dimeric structure.
In contrast to the Kratky plot for monomeric A3BCTD* having a peak maximum at around q ~ 0.10 Å (Figure 3D), the peak maximum of Kratky plot of the A3BCTD* dimer was around q ~ 0.07 Å, further indicating that the A3BCTD* dimer species were hydrodynamically larger in size. This observation was also consistent with the P(r) plot, which displayed a histogram curve that was slightly skewed (Figure 8E versus Figure 3E) consistent with standard compact dimers. Both the Guinier and P(r) calculations resulted in very similar Rg and I(0) values (Table 1). The Rg, Dmax, and Porod volumes of the A3BCTD* dimer were also indicative of a bigger molecule (1) as compared to the structural parameters derived for the monomeric A3BCTD* (Table 1 and Figure 3). Finally, calculation of the MW using the Porod volume generated a MW of ~44 kDa, similar to the MW derived from I(0) of ~46 kDa. The derived MW of this protein was roughly twice the size of the monomeric A3BCTD*, verifying that this species was consistent with the dimeric A3BCTD* form.
Space-filled envelope models were generated from the scattering profile (DAMMIF) of the A3BCTD* dimer using P2 symmetry, based on the dimeric state of the protein. These models were averaged resulting in a model with an acceptable NSD score of 0.816 [71,72]. The generated envelope model was first fitted with two A3BCTD-QM-E255A monomer crystal structures (PDB: 5CQI [62]). However, the relative orientations of the two A3BCTD molecules were difficult to determine. Therefore, the simulated interface models described earlier in Figure 7 were used. The interface models were compared to the A3BCTD* dimer scattering data using rigid body modelling (FoXS [73,74] and CRYSOL [66]) as described in Supplementary Materials. Model 1 resulted in very good visual fit to the data (see Figure 9A); in contrast, model 2 had slightly less optimal visual fits, especially in the mid-q region 0.1–0.2 Å−1 (Figure 9B). This SAXS fit confirmed that model 1 was the more plausible solution in accordance with the interface prediction analysis discussed above (ΔG ~ −38 kcal/mol, Figure 7A). Chi2 values for both models did not discriminate, as the Chi2 values are dominated by the exponentially more intense low q (< 0.1 Å−1) data (Figure 9A,B).
Interestingly, the model 1 interface was found to be organized in a similar manner to a previously reported crystal structure of an A3A crystallographic homodimer (PBD 4XXO [52]). In this structure a dimerization groove was formed through the N-terminus slightly away from the active-site, leading to association of the two A3A molecules [52] (10B) in a manner similar to that predicted for the model 1 interface of the dimeric A3BCTD*. The A3A dimerization interface was reported to occur through interactions between residues in loop 1, α1, α2, and β2 (Figure 10A). In particular, the interaction of a pair of His56 that were bridged by an exogenous Zn2+ ion was noted to be required for dimerization of A3A. Interestingly, Cys239 of A3BCTD* is isostructural to His56 of A3A. Superimposing the generated envelope model with the interface dimer model 1 resulted in a good visual fit (Figure 10B). This model provides a good starting point to look at the association of subunits, which may aid in understanding how various conformations may regulate the A3s’ catalytic activity as proposed in earlier studies [25,48,49,50,51,52].

3.7. Evaluation of A3BCTD* Dimer with dZ-Oligo

The A3BCTD* dimeric form was found by the fluorescence assay to be catalytically active, with intermediate deamination activity levels between the monomeric A3BCTD* and the weakly active A3BCTD-QM-ΔL3 variants (see Figure S2 in Supplementary Materials), consistent with a somewhat occluded substrate-binding site. SAXS of this dimer in complex with dZ-oligo (to prevent complications of activity) was examined to understand how the A3BCTD* dimer permits catalysis and binding to the ssDNA (Figure 11 and Figure 12). For the A3BCTD*/dZ-oligo sample, initial inspection of the UV elution profile (Figure 11C) and the SAXS profile plot (Figure 12A) showed that the Rg values were not constant across the profiles, signaling that the sample was not homogeneous. Only the peak corresponding to the dZ-oligo had a constant Rg value of ~10 Å, as expected (711–750 s, Figure 11B,C, frame numbers 668–698, Figure 12). In the presence of the dZ-oligo, the intensity of the peak corresponding to the A3BCTD* dimer decreased significantly (elution profile 550–640 sec, Figure 11C, SAXS profile frames 520–610, Figure 12A). Interestingly, a peak coinciding with the relative elution position and size (Rg ~ 18–19 Å) of the monomeric A3BCTD* species appeared upon the decrease of the A3BCTD* dimer peak (elution profile shoulder peak 650–700 s (insert Figure 11C), and SAXS profile frames ~ 613–653 in Figure 12A). The three peaks observed in Figure 11B reflected the fact that the A3BCTD*/dZ-oligo sample contained three scattering species, which we attribute to A3BCTD* dimer species, an A3BCTD* monomeric species, and the unbound dZ-oligo (termed species 1–3, respectively). From the UV elution profile, it was observed that the peak maximum associated with the unbound dZ-oligo slightly decreased (~5-fold, Figure 11C) when compared to the control oligonucleotide elution profile (Figure 11B). This decrease suggested that a protein-ssDNA complex may have formed, but it was unclear from the elution profiles which A3BCTD* species was forming a complex with the ssDNA (Figure 11C).
As components of each peak overlapped slightly, the boundaries of each scattering species were deconvoluted using SVD/EFA BioXTAS RAW [67]. The singular value decomposition (SVD) function defined that there were three distinct scattering species in the sample (see Figure S4 in Supplementary Materials), as previously presumed from the Rg pattern of the SAXS profiles (Figure 11C and Figure 12A). Using this information, the evolving factor analysis (EFA) method was used to define the boundaries of each species (Figure 12B) and extract their respective 1D-scattering curves (Figure 13). Due to the limitations of SAXS resolution (> 10 Å), the scattering of species 3, which corresponds to unbound dZ-oligo (~9 Å), was not further analyzed. So, focus was placed on the analysis of species 1 and 2. First, the double log plot of log I(q) vs log q indicated that both species were homogeneous as the data at low q plateaued (Figure 13B). The Kratky plots reinforced that species 1 was larger than species 2 (Figure 13D). Based on the positions of the peak maxima observed in Figure 13D, species 1 was indicative of a dimeric A3BCTD* species (q ~ 0.07 Å−1) as observed in Figure 8D, while species 2 was suggestive of an A3BCTD* monomeric species (q ~ 0.1 Å−1) as observed earlier in Figure 3D. The Guinier distribution analysis showed that the scattering profile of species 1 had a reasonably good linear fit, after eliminating the first several lowest q data points (Figure 13C), with estimated Rg and I(0) values being in good agreement with values calculated from the P(r) plot (Figure 13E, Table 1).
The scattering data of species 2 were particularly noisy (Figure 13A), due to its low presence (see Figure 12); therefore, calculation of its structural parameters was less precise than that for species 1. However, the obtained structural parameters of species 2 (Rg ~ 20 Å, Dmax ~ 60 Å, and MW ~ 23 kDa were comparable with the parameters noted for the monomeric A3BCTD* in complex with ssDNA (Table 1). On the other hand, the values of Rg, Dmax, and MW of species 1 were found to be similar to those obtained for the ligand-free A3BCTD* dimer (Table 1). This suggested that in the presence of the dZ-oligo the A3BCTD* dimer does not form a complex with ssDNA under the SEC conditions that led to a complex of dZ-oligo with monomeric A3BCTD*. To examine this notion, the A260/A280 ratio of the ligand A3BCTD* dimer was compared to the ratio of the A3BCTD* dimer/dZ-oligo sample to assess the presence of DNA in the eluted protein sample. It was observed that the ratio remained relatively unchanged in the region where species 1 eluted off the SEC column (see Figure 13F), implying that the A3BCTD* dimer (species 1) was in fact not bound to the oligo. However, in the region where species 2 eluted off the column, the A260/A280 ratio of the A3BCTD* dimer/dZ-oligo sample (1.335 at 680 s) was significantly larger than the ratio of the ligand-free A3BCTD* dimer sample (0.811 at 680 s), consistent with earlier observations that only the monomeric A3BCTD* formed a complex with the dZ-oligo. As the A3BCTD* dimer species (species 1) does not bind ssDNA in solution under conditions where the monomeric protein does, we conclude that the dimer species was not associated with the observed catalytic activity (see Figure S2 in Supplementary Materials). This conundrum is discussed below. Given the similarity of parameters derived from the SAXS data, and the limited resolution, we did not pursue envelope reconstruction or modelling of the deconvoluted data for the A3BCTD* plus dZ-oligo mixture.

4. Discussion

Here, we report the first SAXS models of a catalytically active A3BCTD in complex with its inhibitor, a dZ-containing ssDNA. Our envelope model indicates that dZ-containing ssDNA is bound to the A3BCTD*, while the 3′ end of the oligonucleotide remains rather flexible (Figure 4). This low-resolution model was found to be comparable to the previously reported crystal structure of substrate ssDNA bound to inactivated A3BCTD*-E255A mutant (PDB, 5TD5 [30]) (Figure 1 and Figure 4). This demonstrates that our dZ-containing inhibitor binds in the active site of A3BCTD in a similar manner to the dC substrate, supporting the proposed inhibition mechanism [59], where ssDNA forming a U-shape delivers dZ into the active site and in this way, as a competitive inhibitor, blocks the catalytic activity of A3BCTD.
Under our conditions, the ligand-free A3BCTD* was detected to elute from the SEC column as two species, one of which was the monomeric A3BCTD* and the other being of a larger size. Using SEC-SAXS, we were able to elucidate that this second eluting species was in fact an A3BCTD* homodimer in solution. A model dimeric structure generated by PRISM2.0 placed two cysteines in sufficiently close proximity to stabilize the otherwise weak interface by a covalent disulfide bond. Interestingly, this interface mimics a previously reported A3A crystallographic dimer (PDB, 4XXO [52]), which is not surprising as our A3BCTD* variant contained loop1 from A3A; loop 1 was involved in the formation of this interface. This model fit the SAXS data well, whereas an alternate model, which made much less chemical sense, did not. However, examination of our A3BCTD* dimer in the presence of the dZ-oligo revealed that, contrary to the observed weak catalytic activity of the protein, (see Figure S2 in Supplementary Materials) the dimer was in fact not bound to the dZ-oligo.
We always observed a small amount of monomeric A3BCTD* present in solution with the dimeric species, even after purification of the dimer species. Conversely, the monomer species always showed some dimer (see Figure S3 in Supplementary Materials). The observed catalytic activity is ascribed to this monomer species. After lysis and Ni2+-affinity purification, the protein was kept in buffers containing 2 mM β-ME. At biological standard conditions, β-mercapto-ethanol has a standard reduction potential of −220 mV. Cysteine disulfide bridges have potentials in the range −95 to −470 mV [86], depending on environment, with more negative potentials associated with hydrophobic burial. In addition to kinetic aspects associated with burial, the perplexing appearance of dimer in purified monomer and monomer in purified dimer suggests that here the two potentials are closely balanced, such that the change in ionic strength on addition of dZ-oligo tips the balance slightly towards reduction of the protein disulfide link, leading to observable quantities of the monomeric A3BCTD*/dZ-oligo species when the dimer is treated with dZ-oligo. Proteolysis and mass-spectrometry of fragments may yield definitive proof of our proposed disulfide link.
The dependence of the protein’s multimeric state on the presence of substrate and other conditions has been noted for A3G in the past [87]. Based on our observations, we propose that the catalytic activity of the enzyme could be regulated upon dimerization, as suggested by earlier studies [25,48,49,50,51,52], controlled possibly by redox stress in the cell, noting that in vivo reduction potential in cell can range from approximately −200 to −350 mV depending on environment and organelle.

Supplementary Materials

The following are available online at https://0-www-mdpi-com.brum.beds.ac.uk/1999-4915/13/2/290/s1: Figure S1: Fitting of A3BCTD* and A3BCTD*/dZ-oligo SAXS profiles to A3BCTD-ssDNA (5TD5*) and A3BCTD (5CQI) crystal structures, respectively, Figure S2: In vitro deaminase activity assay of the A3BCTD variants, Figure S3: Size exclusion chromatography elution profile of A3BCTD*, Table S1: Interface residue contacts of A3BCTD-QM-ΔL3 (5CQI, PDB) interface A (ΔG = −12.65 kcal/mol) (PRISM (83)), Table S2: Interface residue contacts of A3BCTD-QM-ΔL3 (5CQI, PDB) interface B (ΔG = −2.94 kcal/mol) (PRISM [83]), Table S3: Interface residue contacts of A3BCTD* interface model 1 (ΔG = −38.13 kcal/mol) (PRISM [83]), Table S4: Interface residue contacts of A3BCTD* interface model 2 (ΔG = −18.6 kcal/mol) (PRISM [83], Table S5: Model 1 dimer interface assessment using PISA [85] (ΔG = −2.00 kcal/mol, interface area = 1034.4 Å2), Table S6: Model 2 dimer interface assessment PISA [85] (ΔG = −4.00 kcal/mol, interface area = 725.8 Å2), Figure S4: Singular value decomposition (SVD) of A3BCTD* dimer with dZ-oligo.

Author Contributions

Conceptualization, F.M.B., H.A., R.S.H., V.V.F., E.H. and G.B.J.; Data curation, T.M.R.; Formal analysis, F.M.B. and T.M.R.; Funding acquisition, V.V.F., E.H. and G.B.J.; Investigation, F.M.B.; Methodology, G.B.J.; Project administration, V.V.F., E.H. and G.B.J.; Resources, M.V.K., H.M.K., H.A. and R.S.H.; Software, T.M.R.; Supervision, V.V.F., E.H. and G.B.J.; Writing—original draft, F.M.B.; Writing—review & editing, T.M.R., V.V.F., E.H. and G.B.J. All authors have read and agreed to the published version of the manuscript.

Funding

V.V.F., E.H., G.B.J., and M.V.K. are grateful for the financial support provided by the Worldwide Cancer Research (grant 16-1197), Palmerston North Medical Research Foundation, Massey University Research Fund (MURF 2015, 7003 and RM20734) and School of Fundamental Sciences, Massey University. F.M.B. was a recipient of Massey University graduate PhD scholarship. We gratefully acknowledge the support of the New Zealand Synchrotron Group Ltd. for facilitating access to the Australian Synchrotron. The labs of H.A. and R.S.H. are supported in part by NCI P01 CA234228. RH is the Margaret Harvey Schering Land Grant Chair for Cancer Research, a Distinguished McKnight University Professor, and an Investigator of the Howard Hughes Medical Institute. The funders had no role in study design, data collection and analysis, decision to publish, or preparation of the manuscript.

Institutional Review Board Statement

Not applicable.

Informed Consent Statement

Not applicable.

Data Availability Statement

Data are contained within the article or supplemental material.

Acknowledgments

N.M.R. and mass-spectrometry facilities at Massey University and the assistance of P.J.B. Edwards, T. Loo and D. Lun are gratefully acknowledged. F.M.B. thanks R.S.A. and H.A. for hosting her visit to the University of Minnesota during the course of her PhD. We also gratefully acknowledge the expertise and assistance of Nigel Kirby, SAX/WAXS beam line, Australian Synchrotron.

Conflicts of Interest

The authors declare the following competing financial interest(s): RSH is a co-founder, shareholder, and a consultant of ApoGen Biotechnologies, Inc.

References

  1. Harris, R.S.; Bishop, K.N.; Sheehy, A.M.; Craig, H.M.; Petersen-Mahrt, S.K.; Watt, I.N.; Neuberger, M.S.; Malim, M.H. DNA De-amination Mediates Innate Immunity to Retroviral Infection. Cell 2003, 113, 803–809. [Google Scholar] [CrossRef] [Green Version]
  2. Refsland, E.W.; Harris, R.S. The APOBEC3 Family of Retroelement Restriction Factors. In Intrinsic Immunity; Springer: Berlin/Heidelberg, Germany, 2013; pp. 1–27. [Google Scholar]
  3. Harris, R.S.; Dudley, J.P. APOBECs and virus restriction. Virology 2015, 479, 131–145. [Google Scholar] [CrossRef] [Green Version]
  4. Harris, R.S.; Liddament, M.T. Retroviral restriction by APOBEC proteins. Nat. Rev. Immunol. 2004, 4, 868–877. [Google Scholar] [CrossRef]
  5. De Maio, N.; Walker, C.R.; Turakhia, Y.; Lanfear, R.; Corbett-Detig, R.; Goldman, N. Mutation rates and selection on synonymous mutations in SARS-CoV-2. bioRxiv 2021. [Google Scholar] [CrossRef]
  6. Klimczak, L.J.; Randall, T.A.; Saini, N.; Li, J.L.; Gordenin, D.A. Similarity between mutation spectra in hypermutated ge-nomes of rubella virus and in SARS-CoV-2 genomes accumulated during the COVID-19 pandemic. PLoS ONE 2020, 15, e0237689. [Google Scholar] [CrossRef] [PubMed]
  7. Simmonds, P. Rampant C→U Hypermutation in the Genomes of SARS-CoV-2 and Other Coronaviruses: Causes and Consequences for Their Short- and Long-Term Evolutionary Trajectories. mSphere 2020, 5, e00408-20. [Google Scholar] [CrossRef] [PubMed]
  8. Burns, M.B.; Lackey, L.; Carpenter, M.A.; Rathore, A.; Land, A.M.; Leonard, B.; Refsland, E.W.; Kotandeniya, D.; Tretyakova, N.; Nikas, J.B.; et al. APOBEC3B is an enzymatic source of mutation in breast cancer. Nat. Cell Biol. 2013, 494, 366–370. [Google Scholar] [CrossRef]
  9. Burns, M.B.; Temiz, N.A.; Harris, R.S. Evidence for APOBEC3B mutagenesis in multiple human cancers. Nat. Genet. 2013, 45, 977–983. [Google Scholar] [CrossRef] [PubMed] [Green Version]
  10. Law, E.K.; Sieuwerts, A.M.; LaPara, K.; Leonard, B.; Starrett, G.J.; Molan, A.M.; Temiz, N.A.; Vogel, R.I.; Gelder, M.E.M.-V.; Sweep, F.C.G.J.; et al. The DNA cytosine deaminase APOBEC3B promotes tamoxifen resistance in ER-positive breast cancer. Sci. Adv. 2016, 2, e1601737. [Google Scholar] [CrossRef] [Green Version]
  11. Sieuwerts, A.M.; Willis, S.; Burns, M.B.; Look, M.P.; Gelder, M.E.M.-V.; Schlicker, A.; Heideman, M.R.; Jacobs, H.; Wessels, L.; Leyland-Jones, B.; et al. Elevated APOBEC3B Correlates with Poor Outcomes for Estrogen-Receptor-Positive Breast Cancers. Horm. Cancer 2014, 5, 405–413. [Google Scholar] [CrossRef] [Green Version]
  12. Ding, Q.; Chang, C.-J.; Xie, X.; Xia, W.; Yang, J.-Y.; Wang, S.-C.; Wang, Y.; Xia, J.; Chen, L.; Cai, C.; et al. APOBEC3G promotes liver metastasis in an orthotopic mouse model of colorectal cancer and predicts human hepatic metastasis. J. Clin. Investig. 2011, 121, 4526–4536. [Google Scholar] [CrossRef]
  13. Swanton, C.; McGranahan, N.; Starrett, G.J.; Harris, R.S. APOBEC Enzymes: Mutagenic Fuel for Cancer Evolution and Heterogeneity. Cancer Discov. 2015, 5, 704–712. [Google Scholar] [CrossRef] [PubMed] [Green Version]
  14. Harris, R.S. Cancer mutation signatures, DNA damage mechanisms, and potential clinical implications. Genome Med. 2013, 5, 87. [Google Scholar] [CrossRef] [PubMed] [Green Version]
  15. LaRue, R.S.; Jónsson, S.R.; Silverstein, K.A.; Lajoie, M.; Bertrand, D.; El-Mabrouk, N.; Hötzel, I.; Andrésdóttir, V.; Smith, T.P.; Harris, R.S. The artiodactyl APOBEC3 innate immune repertoire shows evidence for a multi-functional domain organization that existed in the ancestor of placental mammals. BMC Mol. Biol. 2008, 9, 104. [Google Scholar] [CrossRef] [Green Version]
  16. LaRue, R.S.; Andrésdóttir, V.; Blanchard, Y.; Conticello, S.G.; Derse, D.; Emerman, M.; Greene, W.C.; Jónsson, S.R.; Landau, N.R.; Löchelt, M.; et al. Guidelines for Naming Nonprimate APOBEC3 Genes and Proteins. J. Virol. 2008, 83, 494–497. [Google Scholar] [CrossRef] [Green Version]
  17. Conticello, S.G. The AID/APOBEC family of nucleic acid mutators. Genome Biol. 2009, 9, 229. [Google Scholar] [CrossRef] [Green Version]
  18. Siriwardena, S.U.; Guruge, T.A.; Bhagwat, A.S. Characterization of the Catalytic Domain of Human APOBEC3B and the Critical Structural Role for a Conserved Methionine. J. Mol. Biol. 2015, 427, 3042–3055. [Google Scholar] [CrossRef] [PubMed] [Green Version]
  19. Fu, Y.; Ito, F.; Zhang, G.; Fernandez, B.; Yang, H.; Chen, X.S. DNA cytosine and methylcytosine deamination by APOBEC3B: Enhancing methylcytosine deamination by engineering APOBEC3B. Biochem. J. 2015, 471, 25–35. [Google Scholar] [CrossRef] [Green Version]
  20. Bonvin, M.; Greeve, J.; Chang, Q.; McLinden, J.H.; Stapleton, J.T.; Sathar, M.A.; Xiang, J. Effects of point mutations in the cytidine deaminase domains of APOBEC3B on replication and hypermutation of hepatitis B virus in vitro. J. Gen. Virol. 2007, 88, 3270–3274. [Google Scholar] [CrossRef]
  21. Haché, G.; Liddament, M.T.; Harris, R.S. The Retroviral Hypermutation Specificity of APOBEC3F and APOBEC3G Is Governed by the C-terminal DNA Cytosine Deaminase Domain. J. Biol. Chem. 2005, 280, 10920–10924. [Google Scholar] [CrossRef] [Green Version]
  22. Hakata, Y.; Landau, N.R. Reversed functional organization of mouse and human APOBEC3 cytidine deaminase domains. J. Biol. Chem. 2006, 281, 36624–36631. [Google Scholar] [CrossRef] [Green Version]
  23. Navarro, F.; Bollman, B.; Chen, H.; König, R.; Yu, Q.; Chiles, K.; Landau, N.R. Complementary function of the two catalytic domains of APOBEC3G. Virology 2005, 333, 374–386. [Google Scholar] [CrossRef] [Green Version]
  24. Newman, E.N.; Holmes, R.K.; Craig, H.M.; Klein, K.C.; Lingappa, J.R.; Malim, M.H.; Sheehy, A.M. Antiviral function of APO-BEC3G can be dissociated from cytidine deaminase activity. Curr. Biol. 2005, 15, 166–170. [Google Scholar] [CrossRef] [Green Version]
  25. Bohn, M.-F.; Shandilya, S.M.; Albin, J.S.; Kouno, T.; Anderson, B.D.; McDougle, R.M.; Carpenter, M.A.; Rathore, A.; Evans, L.; Davis, A.N. Crystal structure of the DNA cytosine deaminase APOBEC3F: The catalytically active and HIV-1 Vif-binding do-main. Structure 2013, 21, 1042–1050. [Google Scholar] [CrossRef] [PubMed] [Green Version]
  26. Chen, K.-M.; Harjes, E.; Gross, P.J.; Fahmy, A.; Lu, Y.; Shindo, K.; Harris, R.S.; Matsuo, H. Structure of the DNA deaminase domain of the HIV-1 restriction factor APOBEC3G. Nature 2008, 452, 116–119. [Google Scholar] [CrossRef] [PubMed]
  27. Ko, T.-P.; Lin, J.-J.; Hu, C.-Y.; Hsu, Y.-H.; Wang, A.H.-J.; Liaw, S.-H. Crystal structure of yeast cytosine deaminase insights into enzyme mechanism and evolution. J. Biol. Chem. 2003, 278, 19111–19117. [Google Scholar] [CrossRef] [Green Version]
  28. Conticello, S.G.; Thomas, C.J.; Petersen-Mahrt, S.K.; Neuberger, M.S. Evolution of the AID/APOBEC family of polynucleotide (deoxy) cytidine deaminases. Mol. Biol. Evol. 2005, 22, 367–377. [Google Scholar] [CrossRef] [Green Version]
  29. Jarmuz, A.; Chester, A.; Bayliss, J.; Gisbourne, J.; Dunham, I.; Scott, J.; Navaratnam, N. An anthropoid-specific locus of orphan C to U RNA-editing enzymes on chromosome 22. Genomics 2002, 79, 285–296. [Google Scholar] [CrossRef] [PubMed]
  30. Shi, K.; Carpenter, M.A.; Banerjee, S.; Shaban, N.M.; Kurahashi, K.; Salamango, D.J.; McCann, J.L.; Starrett, G.J.; Duffy, J.V.; Demir, Ö. Structural basis for targeted DNA cytosine deamination and mutagenesis by APOBEC3A and APOBEC3B. Nat. Struct. Mol. Biol. 2017, 24, 131. [Google Scholar] [CrossRef] [Green Version]
  31. Carpenter, M.A.; Rajagurubandara, E.; Wijesinghe, P.; Bhagwat, A.S. Determinants of sequence-specificity within human AID and APOBEC3G. DNA Repair 2010, 9, 579–587. [Google Scholar] [CrossRef] [Green Version]
  32. Kohli, R.M.; Abrams, S.R.; Gajula, K.S.; Maul, R.W.; Gearhart, P.J.; Stivers, J.T. A portable hot spot recognition loop transfers sequence preferences from APOBEC family members to activation-induced cytidine deaminase. J. Biol. Chem. 2009, 284, 22898–22904. [Google Scholar] [CrossRef] [PubMed] [Green Version]
  33. Kohli, R.M.; Maul, R.W.; Guminski, A.F.; McClure, R.L.; Gajula, K.S.; Saribasak, H.; McMahon, M.A.; Siliciano, R.F.; Gearhart, P.J.; Sti-vers, J.T. Local sequence targeting in the AID/APOBEC family differentially impacts retroviral restriction and anti-body diversification. J. Biol. Chem. 2010, 285, 40956–40964. [Google Scholar] [CrossRef] [Green Version]
  34. Wang, M.; Rada, C.; Neuberger, M.S. Altering the spectrum of immunoglobulin V gene somatic hypermutation by modifying the active site of AID. J. Exp. Med. 2010, 207, 141–153. [Google Scholar] [CrossRef] [PubMed]
  35. McDougall, W.M.; Okany, C.; Smith, H.C. Deaminase Activity on Single-stranded DNA (ssDNA) Occurs in Vitro when APOBEC3G Cytidine Deaminase Forms Homotetramers and Higher-order Complexes*. J. Biol. Chem. 2011, 286, 30655–30661. [Google Scholar] [CrossRef] [PubMed] [Green Version]
  36. Prohaska, K.M.; Bennett, R.P.; Salter, J.D.; Smith, H.C. The multifaceted roles of RNA binding in APOBEC cytidine de-aminase functions. Wiley Interdiscip. Rev. RNA 2014, 5, 493–508. [Google Scholar] [CrossRef] [Green Version]
  37. Salter, J.D.; Bennett, R.P.; Smith, H.C. The APOBEC Protein Family: United by Structure, Divergent in Function. Trends Biochem. Sci. 2016, 41, 578–594. [Google Scholar] [CrossRef] [Green Version]
  38. Smith, H.C. RNA binding to APOBEC deaminases; Not simply a substrate for C to U editing. RNA Biol. 2017, 14, 1153–1165. [Google Scholar] [CrossRef] [PubMed]
  39. Zhang, W.; Zhang, X.; Tian, C.; Wang, T.; Sarkis, P.T.N.; Fang, Y.; Zheng, S.; Yu, X.-F.; Xu, R. Cytidine deaminase APOBEC3B interacts with heterogeneous nuclear ribonucleoprotein K and suppresses hepatitis B virus expression. Cell. Microbiol. 2007, 10, 112–121. [Google Scholar] [CrossRef]
  40. Chelico, L.; Pham, P.; Calabrese, P.; Goodman, M.F. APOBEC3G DNA deaminase acts processively 3′→ 5′ on single-stranded DNA. Nat. Struct. Mol. Biol. 2006, 13, 392–399. [Google Scholar] [CrossRef] [PubMed]
  41. Holden, L.G.; Prochnow, C.; Chang, Y.P.; Bransteitter, R.; Chelico, L.; Sen, U.; Stevens, R.C.; Goodman, M.F.; Chen, X.S. Crystal structure of the anti-viral APOBEC3G catalytic domain and functional implications. Nat. Cell Biol. 2008, 456, 121–124. [Google Scholar] [CrossRef]
  42. Li, J.; Chen, Y.; Li, M.; Carpenter, M.A.; McDougle, R.M.; Luengas, E.M.; Macdonald, P.J.; Harris, R.S.; Mueller, J.D. APOBEC3 Multimerization Correlates with HIV-1 Packaging and Restriction Activity in Living Cells. J. Mol. Biol. 2014, 426, 1296–1307. [Google Scholar] [CrossRef] [Green Version]
  43. Gallois-Montbrun, S.; Holmes, R.K.; Swanson, C.M.; Fernández-Ocaña, M.; Byers, H.L.; Ward, M.A.; Malim, M.H. Comparison of cellular ribonucleoprotein complexes associated with the APOBEC3F and APOBEC3G antiviral proteins. J. Virol. 2008, 82, 5636–5642. [Google Scholar] [CrossRef] [Green Version]
  44. Cortez, L.M.; Brown, A.L.; Dennis, M.A.; Collins, C.D.; Brown, A.J.; Mitchell, D.; Mertz, T.M.; Roberts, S.A. APOBEC3A is a prominent cytidine deaminase in breast cancer. PLoS Genet. 2019, 15, e1008545. [Google Scholar] [CrossRef] [Green Version]
  45. Lau, P.P.; Zhu, H.-J.; Baldini, A.; Charnsangavej, C.; Chan, L. Dimeric structure of a human apolipoprotein B mRNA ed-iting protein and cloning and chromosomal localization of its gene. Proc. Natl. Acad. Sci. USA 1994, 91, 8522–8526. [Google Scholar] [CrossRef] [Green Version]
  46. Prochnow, C.; Bransteitter, R.; Klein, M.G.; Goodman, M.F.; Chen, X.S. The APOBEC-2 crystal structure and functional implications for the deaminase AID. Nat. Cell Biol. 2007, 445, 447–451. [Google Scholar] [CrossRef] [PubMed]
  47. Wedekind, J.E.; Gillilan, R.; Janda, A.; Krucinska, J.; Salter, J.D.; Bennett, R.P.; Raina, J.; Smith, H.C. Nanostructures of APO-BEC3G support a hierarchical assembly model of high molecular mass ribonucleoprotein particles from dimeric subunits. J. Biol. Chem. 2006, 281, 38122–38126. [Google Scholar] [CrossRef] [PubMed] [Green Version]
  48. Brar, S.S.; Sacho, E.J.; Tessmer, I.; Croteau, D.L.; Erie, D.A.; Diaz, M. Activation-induced deaminase, AID, is catalytically active as a monomer on single-stranded DNA. DNA Repair 2008, 7, 77–87. [Google Scholar] [CrossRef] [PubMed] [Green Version]
  49. Furukawa, A.; Nagata, T.; Matsugami, A.; Habu, Y.; Sugiyama, R.; Hayashi, F.; Kobayashi, N.; Yokoyama, S.; Takaku, H.; Katahira, M. Structure, interaction and real-time monitoring of the enzymatic reaction of wild-type APOBEC3G. EMBO J. 2009, 28, 440–451. [Google Scholar] [CrossRef] [PubMed] [Green Version]
  50. Kitamura, S.; Ode, H.; Nakashima, M.; Imahashi, M.; Naganawa, Y.; Kurosawa, T.; Yokomaku, Y.; Yamane, T.; Watanabe, N.; Suzuki, A.; et al. The APOBEC3C crystal structure and the interface for HIV-1 Vif binding. Nat. Struct. Mol. Biol. 2012, 19, 1005–1010. [Google Scholar] [CrossRef]
  51. Shandilya, S.M.D.; Nalam, M.N.L.; Nalivaika, E.A.; Gross, P.J.; Valesano, J.C.; Shindo, K.; Li, M.; Munson, M.; Royer, W.E.; Harjes, E.; et al. Crystal Structure of the APOBEC3G Catalytic Domain Reveals Potential Oligomerization Interfaces. Structure 2010, 18, 28–38. [Google Scholar] [CrossRef] [Green Version]
  52. Bohn, M.-F.; Shandilya, S.M.; Silvas, T.V.; Nalivaika, E.A.; Kouno, T.; Kelch, B.A.; Ryder, S.P.; Kurt-Yilmaz, N.; Somasundaran, M.; Schiffer, C.A. The ssDNA Mutator APOBEC3A Is Regulated by Cooperative Dimerization. Structure 2015, 23, 903–911. [Google Scholar] [CrossRef] [PubMed] [Green Version]
  53. Kouno, T.; Silvas, T.V.; Hilbert, B.J.; Shandilya, S.M.D.; Bohn, M.F.; Kelch, B.A.; Royer, W.E.; Somasundaran, M.; Yilmaz, N.K.; Matsuo, H.; et al. Crystal structure of APOBEC3A bound to single-stranded DNA reveals structural basis for cytidine deamination and specificity. Nat. Commun. 2017, 8, 15024. [Google Scholar] [CrossRef] [PubMed] [Green Version]
  54. Maiti, A.; Myint, W.; Kanai, T.; Delviks-Frankenberry, K.; Rodriguez, C.S.; Pathak, V.K.; Schiffer, C.A.; Matsuo, H. Crystal structure of the catalytic domain of HIV-1 restriction factor APOBEC3G in complex with ssDNA. Nat. Commun. 2018, 9, 1–11. [Google Scholar] [CrossRef] [Green Version]
  55. Harjes, S.; Jameson, G.B.; Filichev, V.V.; Edwards, P.J.B.; Harjes, E. NMR-based method of small changes reveals how DNA mutator APOBEC3A interacts with its single-stranded DNA substrate. Nucleic Acids Res. 2017, 45, 5602–5613. [Google Scholar] [CrossRef] [Green Version]
  56. Li, M.; Shandilya, S.M.D.; Carpenter, M.A.; Rathore, A.; Brown, W.L.; Perkins, A.L.; Harki, D.A.; Solberg, J.; Hook, D.J.; Pandey, K.K.; et al. First-In-Class Small Molecule Inhibitors of the Single-Strand DNA Cytosine Deaminase APOBEC3G. ACS Chem. Biol. 2012, 7, 506–517. [Google Scholar] [CrossRef] [Green Version]
  57. Byeon, I.-J.L.; Ahn, J.; Mitra, M.; Byeon, C.-H.; Herc, K.; Hritz, J.; Charlton, L.M.; Levin, J.G.; Gronenborn, A.M. NMR structure of human restriction factor APOBEC3A reveals substrate binding and enzyme specificity. Nat. Commun. 2013, 4, 1890. [Google Scholar] [CrossRef] [PubMed]
  58. Harjes, S.; Solomon, W.C.; Li, M.; Chen, K.-M.; Harjes, E.; Harris, R.S.; Matsuo, H. Impact of H216 on the DNA Binding and Catalytic Activities of the HIV Restriction Factor APOBEC3G. J. Virol. 2013, 87, 7008–7014. [Google Scholar] [CrossRef] [Green Version]
  59. Kvach, M.V.; Barzak, F.M.; Harjes, S.; Schares, H.A.; Jameson, G.B.; Ayoub, A.M.; Moorthy, R.; Aihara, H.; Harris, R.S.; Filichev, V.V. Inhibiting APOBEC3 activity with single-stranded DNA containing 2′-deoxyzebularine analogs. Biochemistry 2019, 58, 391–400. [Google Scholar] [CrossRef] [PubMed]
  60. Mitra, M.; Hercík, K.; Byeon, I.-J.L.; Ahn, J.; Hill, S.; Hinchee-Rodriguez, K.; Singer, D.; Byeon, C.-H.; Charlton, L.M.; Nam, G.; et al. Structural determinants of human APOBEC3A enzymatic and nucleic acid binding properties. Nucleic Acids Res. 2014, 42, 1095–1110. [Google Scholar] [CrossRef] [Green Version]
  61. Barzak, F.M.; Harjes, S.; Kvach, M.V.; Kurup, H.M.; Jameson, G.B.; Filichev, V.V.; Harjes, E. Selective inhibition of APOBEC3 enzymes by single-stranded DNAs containing 2′-deoxyzebularine. Org. Biomol. Chem. 2019, 17, 9435–9441. [Google Scholar] [CrossRef] [PubMed] [Green Version]
  62. Shi, K.; Carpenter, M.A.; Kurahashi, K.; Harris, R.S.; Aihara, H. Crystal structure of the DNA deaminase APOBEC3B catalytic domain. J. Biol. Chem. 2015, 290, 28120–28130. [Google Scholar] [CrossRef] [Green Version]
  63. Summer, H.; Grämer, R.; Dröge, P. Denaturing Urea Polyacrylamide Gel Electrophoresis (Urea PAGE). J. Vis. Exp. 2009, e1485. [Google Scholar] [CrossRef] [PubMed] [Green Version]
  64. Ryan, T.M.; Trewhella, J.; Murphy, J.M.; Keown, J.R.; Casey, L.; Pearce, F.G.; Goldstone, D.C.; Chen, K.; Luo, Z.; Kobe, B. An op-timized SEC-SAXS system enabling high X-ray dose for rapid SAXS assessment with correlated UV measurements for biomolecular structure analysis. J. Appl. Crystallogr. 2018, 51, 97–111. [Google Scholar] [CrossRef]
  65. Kirby, N.M.; Cowieson, N.P.; Hawley, A.M.; Mudie, S.T.; McGillivray, D.J.; Kusel, M.; Samardzic-Boban, V.; Ryan, T.M. Improved radiation dose efficiency in solution SAXS using a sheath flow sample environment. Acta Crystallogr. Sect. D Struct. Biol. 2016, 72, 1254–1266. [Google Scholar] [CrossRef] [PubMed]
  66. Franke, D.; Petoukhov, M.V.; Konarev, P.V.; Panjkovich, A.; Tuukkanen, A.; Mertens, H.D.T.; Kikhney, A.G.; Hajizadeh, N.R.; Franklin, J.M.; Jeffries, C.M.; et al. ATSAS 2.8: A comprehensive data analysis suite for small-angle scattering from macromolecular solutions. J. Appl. Crystallogr. 2017, 50, 1212–1225. [Google Scholar] [CrossRef] [Green Version]
  67. Hopkins, J.B.; Gillilan, R.E.; Skou, S. BioXTAS RAW: Improvements to a free open-source program for small-angle X-ray scattering data reduction and analysis. J. Appl. Crystallogr. 2017, 50, 1545–1553. [Google Scholar] [CrossRef] [Green Version]
  68. Trewhella, J.; Duff, A.P.; Durand, D.; Gabel, F.; Guss, J.M.; Hendrickson, W.A.; Hura, G.L.; Jacques, D.A.; Kirby, N.M.; Kwan, A.H.; et al. 2017 publication guidelines for structural modelling of small-angle scattering data from biomolecules in solution: An update. Acta Crystallogr. Sect. D Struct. Biol. 2017, 73, 710–728. [Google Scholar] [CrossRef] [PubMed] [Green Version]
  69. Rambo, R.P.; Tainer, J.A. Characterizing flexible and intrinsically unstructured biological macromolecules by SAS using the Porod-Debye law. Biopolymers 2011, 95, 559–571. [Google Scholar] [CrossRef] [Green Version]
  70. Mylonas, E.; Svergun, D.I. Accuracy of molecular mass determination of proteins in solution by small-angle X-ray scattering. J. Appl. Crystallogr. 2007, 40, s245–s249. [Google Scholar] [CrossRef] [Green Version]
  71. Burke, J.E.; Bothe, J.R. NMRFAM SAXS Data Processing and Modeling Manual; National Magnetic Resonance Facility at Madison: Madison, WI, USA, 2014. [Google Scholar]
  72. Kozin, M.B.; Svergun, D.I. Automated matching of high- and low-resolution structural models. J. Appl. Crystallogr. 2001, 34, 33–41. [Google Scholar] [CrossRef]
  73. Schneidman-Duhovny, D.; Hammel, M.; Tainer, J.A.S.; Andrej, S. FoXS, FoXSDock and MultiFoXS: Single-state and multi-state structural modeling of proteins and their complexes based on SAXS profiles. Nucleic Acids Res. 2016, 44, W424–W429. [Google Scholar] [CrossRef]
  74. Schneidman-Duhovny, D.; Hammel, M.; Tainer, J.A.; Sali, A. Accurate SAXS Profile Computation and its Assessment by Contrast Variation Experiments. Biophys. J. 2013, 105, 962–974. [Google Scholar] [CrossRef] [Green Version]
  75. Betts, L.; Xiang, S.; Short, S.A.; Wolfenden, R.; Carter, C.W. Cytidine Deaminase. The 2·3 Å Crystal Structure of an Enzyme: Transition-state Analog Complex. J. Mol. Biol. 1994, 235, 635–656. [Google Scholar] [CrossRef]
  76. Xiang, S.; Short, S.A.; Wolfenden, R.; Carter, C.W., Jr. Transition-state selectivity for a single hydroxyl group during catalysis by cytidine deaminase. Biochemistry 1995, 34, 4516–4523. [Google Scholar] [CrossRef]
  77. Chung, S.J.; Fromme, J.C.; Verdine, G.L. Structure of Human Cytidine Deaminase Bound to a Potent Inhibitor. J. Med. Chem. 2005, 48, 658–660. [Google Scholar] [CrossRef]
  78. Schrödinger, LLC. The PyMOL Molecular Graphics System, Version 2.1.1.; Schrödinger: New York, NY, USA, 2015. [Google Scholar]
  79. Bennett, R.P.; Salter, J.D.; Liu, X.; Wedekind, J.E.; Smith, H.C. APOBEC3G subunits self-associate via the C-terminal deaminase domain. J. Biol. Chem. 2008, 283, 33329–33336. [Google Scholar] [CrossRef] [Green Version]
  80. Kvach, M.V.; Barzak, F.M.; Harjes, S.; Schares, H.A.; Kurup, H.M.; Jones, K.F.; Sutton, L.; Donahue, J.; D’Aquila, R.T.; Jameson, G.B.; et al. Differential inhibition of APOBEC3 DNA-mutator isozymes by fluoro- and non-fluoro-substituted 2′-deoxyzebularine embedded in single-stranded DNA. ChemBioChem 2020, 21, 1028–1035. [Google Scholar] [CrossRef]
  81. Byeon, I.-J.L.; Byeon, C.-H.; Wu, T.; Mitra, M.; Singer, D.; Levin, J.G.; Gronenborn, A.M. Nuclear Magnetic Resonance Structure of the APOBEC3B Catalytic Domain: Structural Basis for Substrate Binding and DNA Deaminase Activity. Biochemistry 2016, 55, 2944–2959. [Google Scholar] [CrossRef] [Green Version]
  82. Tuncbag, N.; Gursoy, A.; Nussinov, R.; Keskin, O. Predicting protein-protein interactions on a proteome scale by matching evolutionary and structural similarities at interfaces using PRISM. Nat. Protoc. 2011, 6, 1341–1354. [Google Scholar] [CrossRef]
  83. Baspinar, A.; Cukuroglu, E.; Nussinov, R.; Keskin, O.; Gursoy, A. PRISM: A web server and repository for prediction of protein–protein interactions and modeling their 3D complexes. Nucleic Acids Res. 2014, 42, W285–W289. [Google Scholar] [CrossRef]
  84. Krissinel, E. Crystal contacts as nature’s docking solutions. J. Comput. Chem. 2010, 31, 133–143. [Google Scholar] [CrossRef]
  85. Krissinel, E.; Henrick, K. Protein interfaces, surfaces and assemblies service PISA at European Bioinformatics Institute. J. Mol. Biol. 2007, 372, 774–797. [Google Scholar] [CrossRef]
  86. Bechtel, T.J.; Weerapana, E. From structure to redox: The diverse functional roles of disulfides and implications in disease. Proteomics 2017, 17, 1600391. [Google Scholar] [CrossRef] [Green Version]
  87. Chelico, L.; Sacho, E.J.; Erie, D.A.; Goodman, M.F. A model for oligomeric regulation of APOBEC3G cytosine deaminase-dependent restriction of HIV. J. Biol. Chem. 2008, 283, 13780–13791. [Google Scholar] [CrossRef] [Green Version]
Scheme 1. (A) Deamination of dC in ssDNA by APOBEC3 enzymes. (B) 2′-Deoxyzebularine embedded in ssDNA (as 5′-ATTT-dZ-ATTT) is a low µM inhibitor of APOBEC3.
Viruses 13 00290 sch001
Figure 1. Structure of the catalytically competent C-terminal domain of A3BCTD with ssDNA (PDB code 5TD5). This construct differs from wild-type and is denoted A3BCTD* (vide subra). (A) Cartoon representation of the protein with active-site residues shown as colored sticks (red for oxygen, blue for nitrogen, yellow for sulfur and orange for phosphorus). Loops 1 (translated from A3A), 3 (truncated), 5, and 7 are shown respectively in blue, green, limon and red. The general acid-base Glu255 (Ala in structure 5TD5) has been modelled (carbon atoms in light grey) based on the substrate-free active enzyme (PDB code 5CQI). Zn is shown as a grey sphere and the nucleophilic H2O/OH- as a red sphere (Note: in crystal structure this is a Cl-). The ssDNA is shown in stick form with carbon atoms distinguished by cyan coloring. Key hydrogen-bonding and incipient nucleophilic attack are shown as dark-grey dashed lines. (B) Magnified view of the active site showing key interactions.
Viruses 13 00290 g001
Scheme 2. Schematic representation of a small-angle X-ray scattering (SAXS) experiment and data processing. The scattering vector q is defined as q = 4π λ−1sinθ, 2θ is the scattering angle, and λ is the wavelength of 1.0332 Å for collected data.
Viruses 13 00290 sch002
Scheme 3. Schematic of the analysis of SAXS data.
Viruses 13 00290 sch003
Figure 2. SEC elution profiles of A3BCTD* in varying molar ratios with dZ-oligonucleotide. SEC elution profiles of (A) A3BCTD* at 5.0 mg/mL (~230 μM). (B) dZ-oligo at 0.68 mg/mL (~230 μM). (C) A3BCTD* with dZ-oligo at a 1:1 ratio. (D) A3BCTD* with dZ-oligo at a 1:2 ratio. (E) A3BCTD* with dZ-oligo at a 1:4 ratio. Samples were run at 25 °C through a SEC column at a flow rate of 0.2 mL/min in the buffer containing 50 mM citrate-phosphate (pH 5.5), 0.2 M NaCl, 2 mM β-ME. Blue bar region and arrow represent A3BCTD* elution, green bar region and arrow represents dZ-oligo elution. Ratio represents molar ratio of protein mixed with ssDNA.
Viruses 13 00290 g002
Figure 3. SEC-SAXS analysis of A3BCTD* (red) and A3BCTD*/dZ-oligo complex (blue). (A) SAXS profile plots. (B) Scattering curves log I(q) versus q. (C) Double log plot of scattering. (D) Kratky plot. (E) P(r) distribution plot. (F) Guinier plots. Experiments conducted injecting into SEC-FPLC 5 mg/mL A3BCTD* and A3BCTD*/dZ-oligo at a 1 to 2 molar ratio in pH 5.5 buffer (see caption to Figure 2).
Viruses 13 00290 g003
Figure 4. Fitting of experimental (exptl) A3BCTD* SAXS profiles to known A3BCTD crystal structures. (A) Model fit of A3BCTD* to 5CQI crystal structure. (B) Model fit of A3BCTD*/ dZ-oligo complex (injected into SEC-FPLC in a 1:2 ratio) to 5TD5* crystal structure. (C) Envelope calculated from A3BCTD* SAXS data with 5CQI fitted into the envelope. (D) Envelope calculated from A3BCTD*/dZ-oligo SAXS data with 5TD5* fitted into the envelope.
Viruses 13 00290 g004
Figure 5. SEC-FPLC purification of the A3BCTD* multimers. (A) SEC-FPLC of A3BCTD* run through a SEC column at a flow rate of 0.5 mL/min at 25 °C, displaying the elution of two forms of A3BCTD*, peak 1 and peak 2. (B) 16% Tricine SDS-PAGE gel (reducing conditions) of the purified A3BCTD* fractions after SEC purification.
Viruses 13 00290 g005
Figure 6. Purification of the A3BCTD* dimer using SEC-FPLC. (A) SEC-FPLC elution profile of 5 mg/mL A3BCTD* dimer. (B) SEC-FPLC elution profiles of the A3BCTD* dimer at varying concentrations 0.5–2.5 mg/mL. SEC-FPLC was conducted at a flow rate of 0.5 mL/min through the SEC column at 25 °C.
Viruses 13 00290 g006
Figure 7. Models of the dimerization interface of A3BCTD*. Predicted interface models between two A3BCTD* molecules using the PRISM 2.0 webserver. A3BCTD* molecule A (green, dimerization interface in blue) and A3BCTD* molecule B (cyan, dimerization interface in red) with Zn2+ (yellow sphere) in active site. (A,C) Model 1 interface with a calculated ΔG ~ −38.12 kcal/mol. (B,D) Model 2 interface with a calculated ΔG ~ −18.6 kcal/mol. Models represented as cartoons in (A,B) have the chains and loops involved in the dimerization interface labelled, whereas in (C,D) residues involved in the dimerization interface are shown in stick format.
Viruses 13 00290 g007
Figure 8. SEC-SAXS analysis of A3BCTD* dimer. (A) SAXS profile plot. (B) scattering curve. (C) Guinier plot. (D) Kratky plot. (E) P(r) distribution plot. Experiments were conducted using 2.5 mg/mL of A3BCTD* dimer in pH 5.5 buffer (see caption to Figure 2).
Viruses 13 00290 g008
Figure 9. Fitting A3BCTD* dimer scattering data to the simulated atomic interface models. Rigid body modelling of the A3BCTD* dimer to (A) interface model 1 or (B) interface model 2 using FoXS and CRYSOL. (C) Model 1 interface structure fitted to the A3BCTD* dimer envelope. Averaged envelope model of A3BCTD* dimer derived using P2 symmetry (DAMMIF, DAMAVER and DAMFILT, ATSAS 2.8.3 suite [66]) superimposed with interface model 1.
Viruses 13 00290 g009
Figure 10. Dimerization interface of A3A-E72A-C171A and A3BCTD*. (A) A3A-E72A-C171A homodimer (PDB 4XXO [49]) (grey) labelled with residues that are important in forming the dimerization interface. A3A molecule A dimerization residues labelled in blue and A3A molecule B dimerization residues labelled in orange. (B) Comparison of the A3A-E72A-C171A homodimer (PDB 4XXO [3,49]) (grey) to our dimer interface model 1 of A3BCTD* (molecule A in green and molecule B in cyan). Zn2+ ions are represented as yellow spheres and chloride ions are shown as magenta spheres.
Viruses 13 00290 g010
Figure 11. Size-exclusion chromatography (SEC) elution profiles of A3BCTD* dimer and A3BCTD* dimer/dZ-oligo. SEC-FPLC performed using (A) 2.5 mg/mL (~ 56 µM) of A3BCTD* dimer, (B) 1.7 mg/mL (~566 µM) of dZ-oligo, and (C) A3BCTD* dimer with dZ-oligo at a 1 to 10 ratio, closeup shown in the insert. Samples were run at 25 °C through a SEC column at a flow rate of 0.2 mL/min in pH 5.5 buffer.
Viruses 13 00290 g011
Figure 12. Deconvolution of SAXS data of the A3BCTD* dimer/dZ-oligo. (A) Comparison of the SAXS profiles of the A3BCTD* dimer (green) and A3BCTD* dimer with dZ-oligo at a 1 to 10 ratio (orange) overlaid with Rg trace values. (B) Evolving factor analysis (EFA) analysis using BioXTAS RAW indicating the distinct scattering species 1–3.
Viruses 13 00290 g012
Figure 13. SAXS analysis of the A3BCTD* dimer/dZ-oligo deconvoluted species. (A) 1D-scattering curves of each species. (B) Double log plots. (C) Guinier plots. (D) Kratky plots. (E) P(r) distribution plots. (F) Plots of the absorbance ratio A280/A260 to assess presence of ssDNA during elution of the A3BCTD*/dZ-oligo sample. The red line is the elution profile of the A3BCTD*/dZ-oligo sample and the green crosses the A280/A260 ratio. The blue crosses are ligand-free A3BCTD* (vide supra). Experiments were conducted using 2.5 mg/mL of A3BCTD* dimer with dZ-oligo at a 1 to 10 ratio in pH 5.5 buffer (see caption to Figure 2).
Viruses 13 00290 g013
Table 1. SAXS structural parameters of the A3BCTD* and A3BCTD*/dZ-oligo complex.
Structural ParametersA3BCTD*A3BCTD*/dZ-OligoA3BCTD* DimerSpecies 1 a (A3BCTD* Dimer)Species 2 a (A3BCTD*/dZ-Oligo)
Guinier analysis
I(0) (cm−1)0.00940 (5)0.01031 (5)0.00480 (4)0.0036 (1)0.00110 (5)
Rg (Å)18.8 (2)19.8 ± 0.224.2 (8)24.8 (1.5)20.0 (1.5)
qmin−1)0.01060.01060.01650.017950.0231
q·Rg max 1.31.31.31.31.3
Coeff. correln (R2)0.980.990.960.980.86
P(r) analysis
I(0) (cm−1)0.00930 (4)0.01020 (5)0.00480 (1)0.00352 (7)0.00110 (5)
Rg (Å)18.7 (1)19.7 (1)24.5 (6)25.1 (5)20.1 (8)
Dmax (Å)576077.978.260.1
q range (Å−1)0.011–0.3540.011–0.3540.016–0.3450.0180–0.2760.023- 0.232
Quality estimate0.870.850.880.890.85
Porod vol (Å3)35,60036,70072,90074,00038,400
MW (kDa)21.4 (0.97) b22.0 (0.88) d43.7 (1.99) b44.4 (2.02) b23.0 (0.92) d
MW23.3 (1.06) c25.3 (1.01) e
a From deconvolution of SAXS data from A3BCTD* dimer + dZ-oligo. Note similarities in parameters to A3BCTD* dimer in absence of dZ-oligo and to A3BCTD*/dZ-oligo. b From Porod Volume*0.6 (Da) (ratio to expected size of A3BCTD* of 22,000 Da). c From I(0) (70)) (Da) (ratio to expected size of A3BCTD* of 22,000 Da). d From Porod Volume*0.6 (Da) (ratio to expected size of A3BCTD*/dZ-oligo subunit of 25,000 Da). e From I(0) (70)) (Da) (ratio to expected size of A3BCTD*/dZ-oligo*25,000 Da).
Table 2. SAXS fitting and modelling parameters of the A3BCTD* and A3BCTD*/dZ-oligo complex.
Modelling ParametersA3BCTD*A3BCTD*/dZ-OligoA3BCTD* Dimer
Ab initio restoration
DAMMIF a
q range (Å−1) for fitting0.011–0.3540.011–0.3540.0016–0.345
Symmetry1 (none)1 (none)P2
NSD (standard deviation) a0.559 (0.019)0.862 (0.037)0.816 (0.110)
Resoln (from SASRES) (Å)28 (2)29 (2)41 ± 3
Structure modelling
q range for modelling (Å−1)0.011–0.3020.011–0.302
PDB structure5CQI5TD5* bInterface model 1
FoXS, CRYSOL (Chi2)1.16, 1.991.51, 2.080.93, 1.49
Interface model 2
FoXS, CRYSOL (Chi2)----0.80, 1.53
a Default parameters, 10 calculations; NSD explained in main text. b Structure 5TD5* is the 5TD5 structure in which the length of ssDNA was increased from a 5- to a 9-mer.
Publisher’s Note: MDPI stays neutral with regard to jurisdictional claims in published maps and institutional affiliations.

