
Global Discrepancies between Numbers of Available SARS-CoV-2 Genomes and Human Development Indexes at Country Scales


1
IHU Méditerranée Infection, 19–21 Boulevard Jean Moulin, 13005 Marseille, France
2
Aix-Marseille University, Institut de Recherche pour le Développement (IRD), Assistance Publique-Hôpitaux de Marseille (AP-HM), MEPHI, 27 Boulevard Jean Moulin, 13005 Marseille, France
*
Author to whom correspondence should be addressed.
Viruses 2021, 13(5), 775; https://0-doi-org.brum.beds.ac.uk/10.3390/v13050775
Submission received: 8 March 2021
/
Revised: 22 April 2021
/
Accepted: 26 April 2021
/
Published: 28 April 2021
(This article belongs to the Special Issue Emerging Viruses 2021: Surveillance, Prevention, Evolution and Control)
Abstract
:It has now been over a year since SARS-CoV-2 first emerged in China, in December 2019, and it has spread rapidly around the world. Some variants are currently considered of great concern. We aimed to analyze the numbers of SARS-CoV-2 genome sequences obtained in different countries worldwide until January 2021. On 28 January 2021, we downloaded the deposited genome sequence origin from the GISAID database, and from the “Our world in data” website we downloaded numbers of SARS-CoV-2-diagnosed cases, numbers of SARS-CoV-2-associated deaths, population size, life expectancy, gross domestic product (GDP) per capita, and human development index per country. Files were merged and data were analyzed using Microsoft Excel software. A total of 450,968 SARS-CoV-2 genomes originating from 135 countries on the 5 continents were available. When considering the 19 countries for which the number of genomes per 100 deaths was >100, six were in Europe, while eight were in Asia, three were in Oceania and two were in Africa. Six (30%) of these countries are beyond rank 75, regarding the human development index and four (20%) are beyond rank 80 regarding GDP per capita. Moreover, the comparisons of the number of genomes sequenced per 100 deaths to the human development index by country show that some Western European countries have released similar or lower numbers of genomes than many African or Asian countries with a lower human development index. Previous data highlight great discrepancies between the numbers of available SARS-CoV-2 genomes per 100 cases and deaths and the ranking of countries regarding wealth and development.
1. Introduction
The SARS-CoV-2 pandemic, which has been spreading for almost a year, has generated considerable global efforts in the sequencing, collection, and analysis of viral genomes. Sequence databases and various tools for storing, downloading, classifying, and analyzing these genomes have quickly become available [1,2]. In particular, GISAID sequence database hosts a collection of SARS-CoV-2 genomic sequences obtained worldwide (https://www.gisaid.org/; accessed on 28 January 2021) [1]. Our team has produced a large number of genome sequences for SARS-CoV-2, in particular when the incidence of cases considerably re-increased during the summer [3,4,5,6,7]. This enabled us to point out the existence of variants very early (which are strains that differ from all others by a set of several mutations and have reached a detectable population size) during the summer of 2020 [4]; we named those identified in our institute Marseille-1 to Marseille-10. They have been responsible for successive or overlapping epidemics, before becoming established at our country’s scale.
Currently, the emergence and spread of SARS-CoV-2 genotypic features are in the spotlight. Firstly, different viral variants that have emerged appear to be associated with different epidemic dynamics and clinical severities. What we observed for the first SARS-CoV-2 variant that we had identified in July 2020, which originated from the African continent and was named “Marseille-1” [5], has reproduced with the Marseille-4 variant [7] (also known as clade 20A.EU2 [8]), and is currently observed with the UK (20I/501Y.V1), South African (20I/501Y.V1), and Brazilian (20I/501Y.V1) variants. Thus, some of these variants have either demonstrated or they are suspected to have greater transmissibilities and have become the predominant strains nationwide, and some were reported to cause diseases with different severities [5,7,9,10,11,12]. In addition, the majority of these viral variants harbor amino acid changes in the viral spike, the protein that enables virus entry into human cells through binding to the ACE2 receptor, which is also the main target of neutralizing antibodies elicited by natural infection or vaccine immunization [13,14,15]. Accordingly, changes in the spike amino acid sequence of these variants have been reported to increase viral binding to the ACE2 receptor and to allow virus escape from neutralizing antibodies induced by prior infection or vaccine immunization [15,16,17]. Moreover, therapies such as remdesivir, convalescent plasma or cocktails of anti-spike antibodies, particularly in immunocompromised patients, could increase the mutation rate of SARS-CoV-2 genomes and have been associated with the rapid occurrence of several amino acid changes within the spike [14,18,19,20]. Among these amino acid changes, some are present in the UK, South African, and Brazilian variants. Thus, it should have been necessary, in the cases of absence of viral clearance after administration of these treatments, to systematically sequence SARS-CoV-2 genomes and check for the occurrence of mutations. For example, this should have been performed in Hueso et al.’s study for the five patients who were not cleared of the virus after convalescent plasmatherapy in order to determine whether mutations located in the spike had not been selected by the transfused antibodies [21].In addition, cases are increasingly being reported of patients who experienced a second infection with SARS-CoV-2 several months after a first infection that was followed by viral clearance [22,23,24,25]. In our institute, two successive infections with different variants have been observed to date in nearly fifty patients [25]. Systematic sequencing of the genomes of the viruses involved in the two distinct infections is essential to understanding which viral strains can resist, through their mutation patterns, immune responses elicited by a first infection with a distinct strain. Finally, in the current setting of massive vaccine strategies that in Western countries are based on the spike protein, it is absolutely critical to analyze the viral genomes in all cases of vaccine failures in order to determine which viral mutants and variants are involved. In our country, for example, the majority of SARS-CoV-2 strains that are currently circulating have a spike protein whose amino acid sequence differs from that used in vaccines, which corresponds to strains that no longer exist or are in the minority [6,7] (https://nextstrain.org/groups/neherlab/ncov/france; accessed on 11 April 2021). Under these conditions, the question of the impact of some variants on the level of protection conferred by prior infection or vaccine immunization arises [17,26,27,28].
An earlier study analyzed the number of SARS-CoV-2 genomes per reported COVID-19 case nationwide, based on the sequences available in the GISAID database in early September 2020. It pointed out substantial differences between countries worldwide, including between those on the same continent as well as the good level of sequencing efforts of some low and middle-income countries [29]. Here, we wanted to analyze the numbers of genome sequences of SARS-CoV-2 obtained in the different countries worldwide by the end of January 2021, and to correlate them to the numbers of SARS-CoV-2 cases and SARS-CoV-2-associated deaths and to the wealth and investment in health of these countries.
2. Materials and Methods
On 28 January 2021, we downloaded the nextmeta file that contains the origin of deposited genome sequences from the GISAID database (https://www.gisaid.org/; accessed on 28 January 2021) [1]). On the same day, we also downloaded from the “Our world in data” website (https://ourworldindata.org/; accessed on 28 January 2021) the numbers of SARS-CoV-2-diagnosed cases and SARS-CoV-2-associated deaths per country as well as various epidemiological data, including population size, life expectancy, gross domestic product (GDP) per capita, and human development index (collected from URL: https://covid.ourworldindata.org/data/owid-covid-data.xlsx; accessed on 11 April 2021). According to the United Nations Development Programme (http://hdr.undp.org/en/content/human-development-index-hdi; accessed on 11 April 2021), the human development index is the geometric mean of normalized indices for the health dimension (assessed by life expectancy at birth), the education dimension (assessed by mean of years of schooling for adults ≥ 25 years of age, and expected years of schooling for children of school-entering age), and the standard of living dimension (assessed by gross national income per capita). This index was used as a measure of country development to figure out if this latter was related to the capacity and/or willingness to perform next-generation sequencing to assess SARS-CoV-2 genomic epidemiology. Files were merged and data were analyzed using Microsoft Excel software (https://www.microsoft.com; accessed on 11 April 2021). We standardized the numbers of genomes sequenced per 100 SARS-CoV-2-diagnosed cases and per 100 SARS-CoV-2-associated deaths. Data were plotted using Microsoft Excel and GraphPad Prism v.5 (https://www.graphpad.com; accessed on 11 April 2021) software. The numbers of genomes per country taken into account were those released by a given country regardless of whether sequencing was performed inside or outside this country, considering the origin of the clinical specimen. We also checked the numbers of SARS-CoV-2 genomes for some countries on other sequence databases including the National Center for Biotechnology Information (NCBI; https://0-www-ncbi-nlm-nih-gov.brum.beds.ac.uk/; accessed on 11 April 2021), the European Bioinformatics Institute (EMBL-EBI; https://covid-19.ensembl.org/index.html; accessed on 11 April 2021), and the China National Center for Bioinformation (CNCB; https://bigd.big.ac.cn/ncov/; accessed on 11 April 2021).
3. Results
A total of 450,968 SARS-CoV-2 genomes were available from the GISAID database on 28 January 2020. They originated from five continents, from 135 countries and 8919 laboratories. The mean (± standard deviation) number of genomes per country was 3340 ± 18,498 (range, 1–192,556) and the median number was 129. The mean number of genomes per 100 SARS-CoV-2-associated deaths per country was 270 ± 1422 (0.06–14,397) and the median was 6.2. Finally, the mean number of genomes per 100 SARS-CoV-2 diagnosed cases per country was 2198 ± 9105 (0.001–70) and the median number was 0.120.
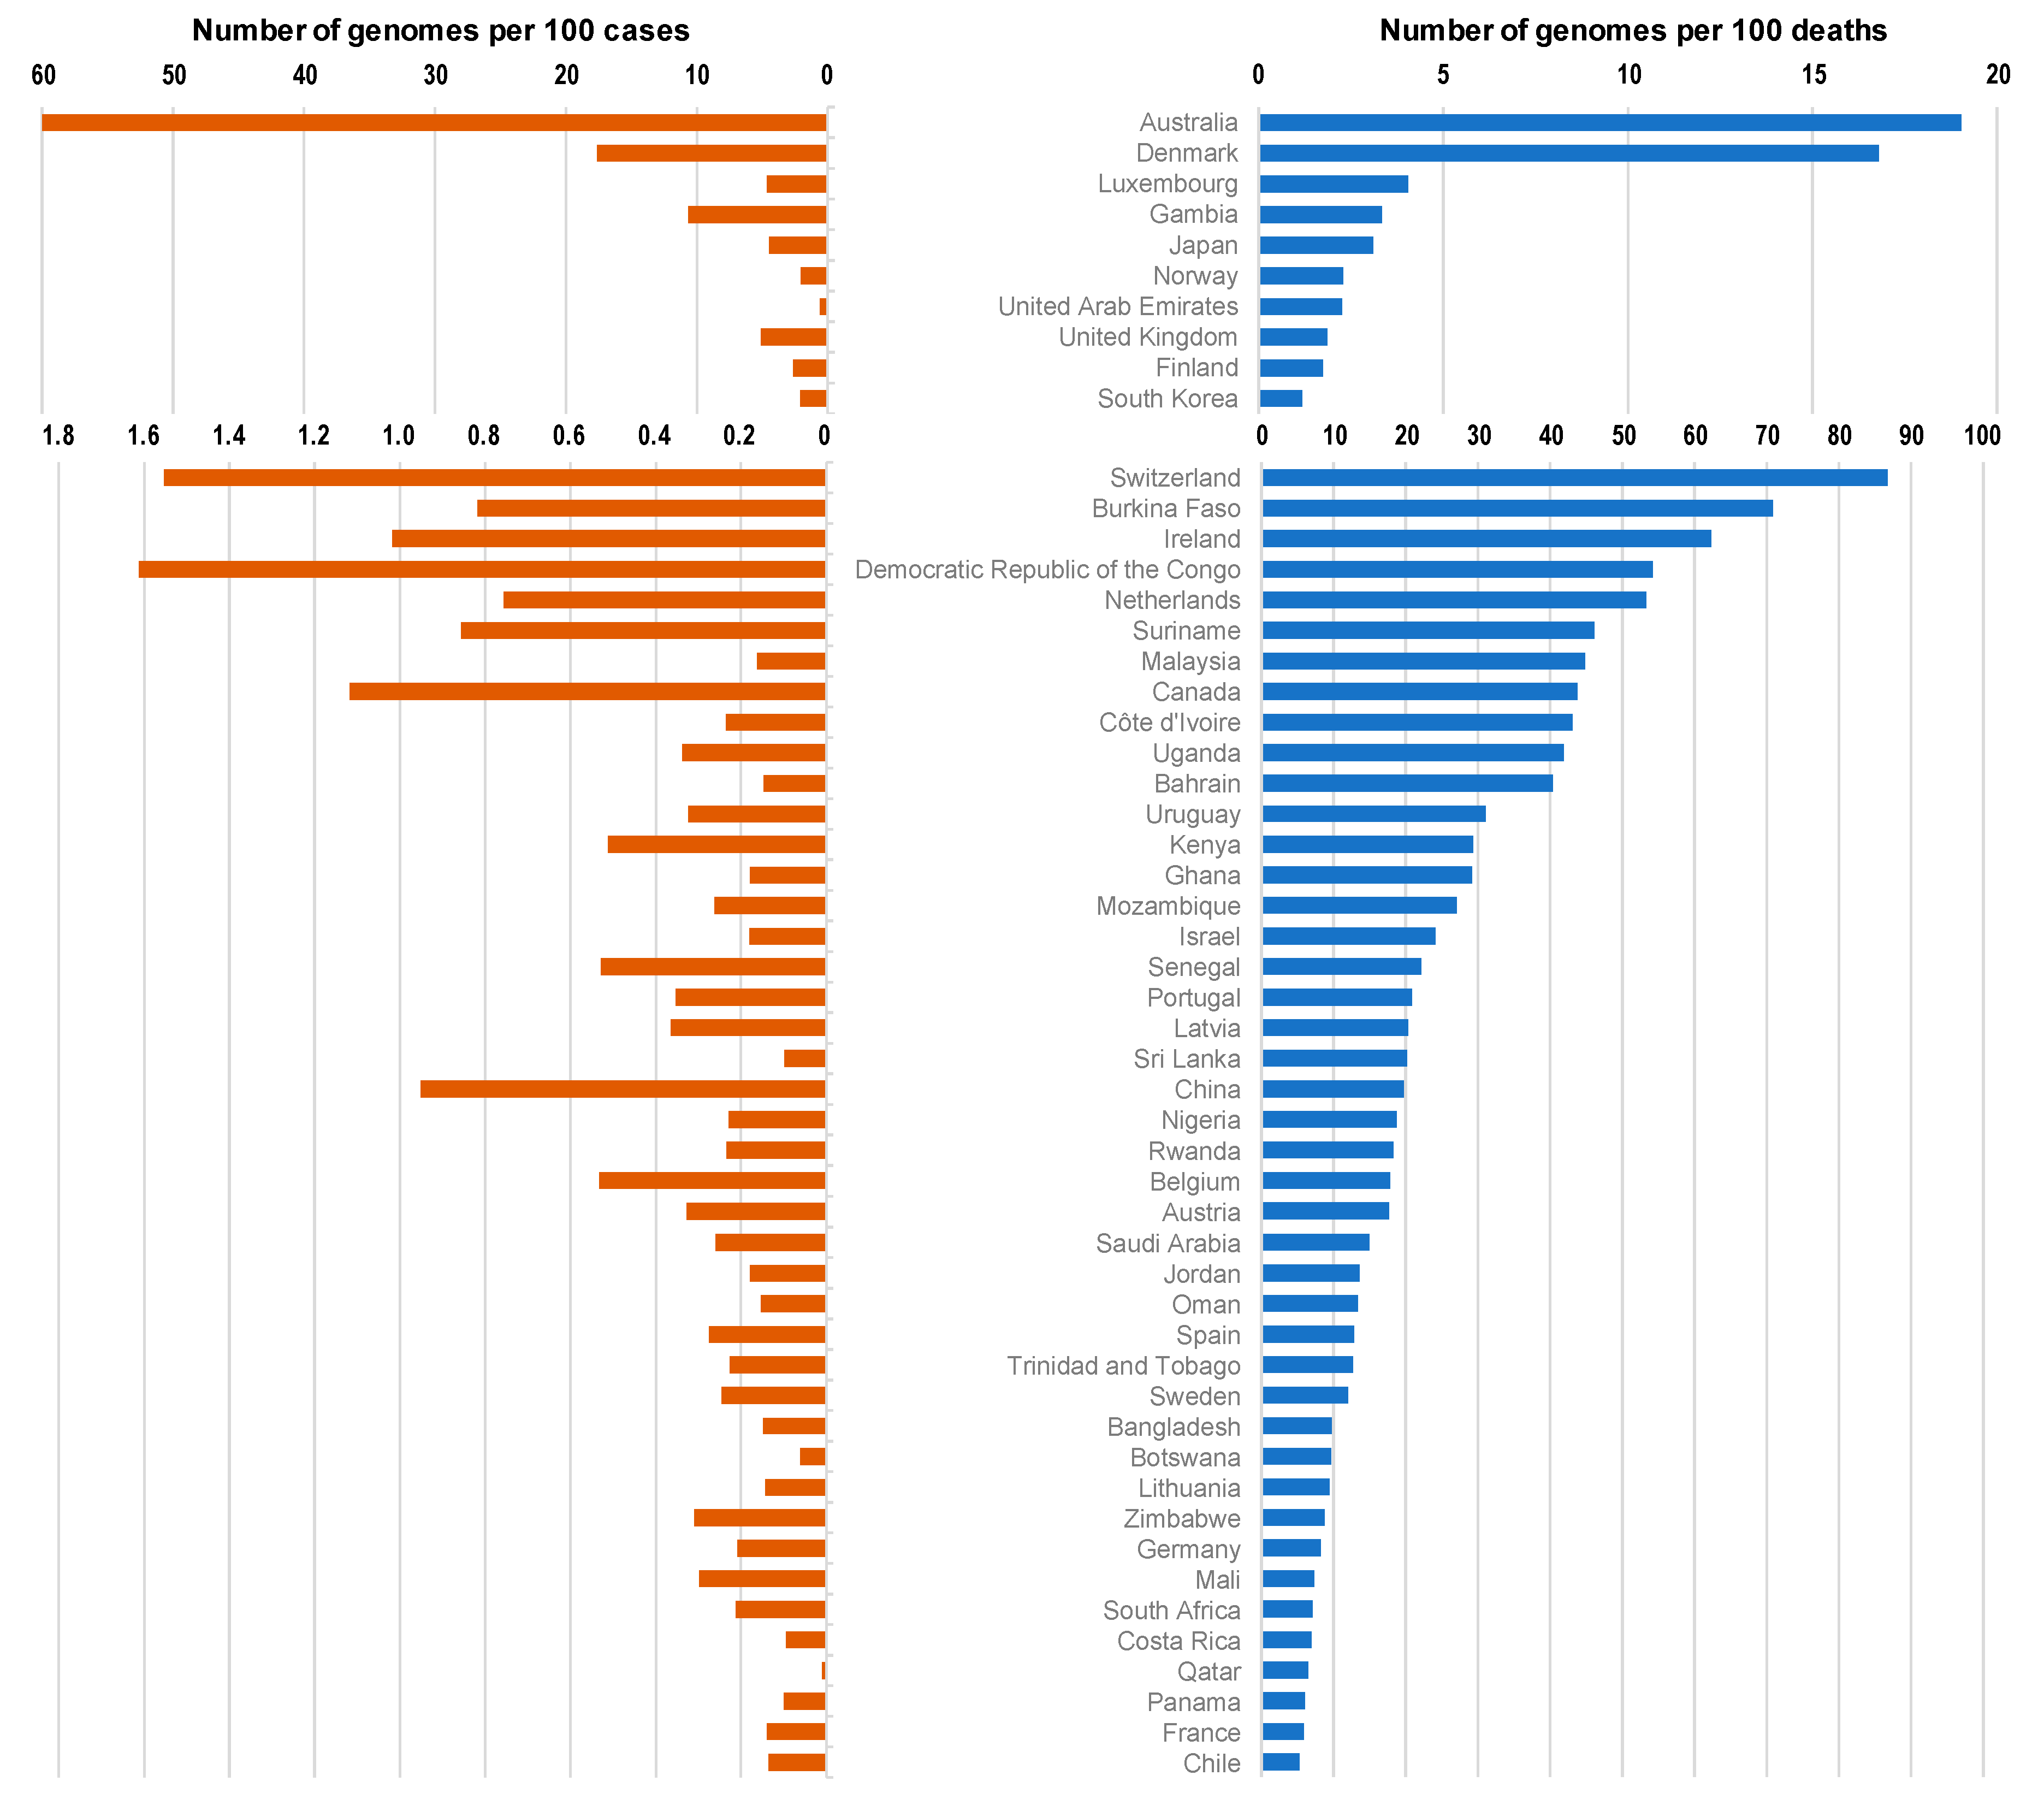
The top 100 source laboratories accounted for 72% (n = 324,837) of available genomes (Supplementary Table S1). They were mostly located in the USA (62%; n = 24), in England (21), in Denmark (11), and in the Netherlands (6). When considering the 19 countries for which the number of genomes per 100 deaths was > 100, 6 were in Europe (Iceland (number of genomes per 100 deaths = 14,397), Denmark (1680), Luxembourg (405), Norway (229), UK (186), and Finland (174)), while 8 were in Asia (Singapore (5969), Taiwan (2143), Thailand (653), Vietnam (406), Mongolia (350), Japan (310), Brunei (167), and South Korea (117)), 3 were in Oceania (New Zealand (4380), Australia (1902), and Papua New Guinea (144)) and 2 were in Africa (Gambia (344), and Equatorial Guinea (110)) (Figure 1 and Figure 2; Table 1).
In addition, six (30%) of these countries have a human development index below the mean value for the 135 countries studied here (0.756): Thailand (human development index = 0.755), Vietnam (0.694), Mongolia (0.741), Gambia (0.460), Papua New Guinea (0.544), and Equatorial Guinea (0.591). Moreover, all these six countries have a GDP per capita below the mean value for the 135 countries studied here (22,884 US dollars) (Table 1). Similarly, when considering the 24 countries for which the number of genomes per 100 diagnosed cases was ≥ 1, eight were in Asia (Taiwan, Vietnam, Japan, Thailand, Singapore, Brunei, South Korea, and China) and three were in Africa (Gambia, Equatorial Guinea, and Democratic Republic of Congo). In addition, seven (29%) of these countries have a human development index below the mean value for the 135 countries studied here (0.756): Gambia (human development index = 0.460), Vietnam (0.694), Thailand (0.755), Equatorial Guinea (0.591), Democratic Republic of Congo (0.457), Papua New Guinea (0.544), and China (0.752), and all these seven countries have a GDP per capita below the mean value for the 135 countries studied here (22,884 US dollars) (Table 1).
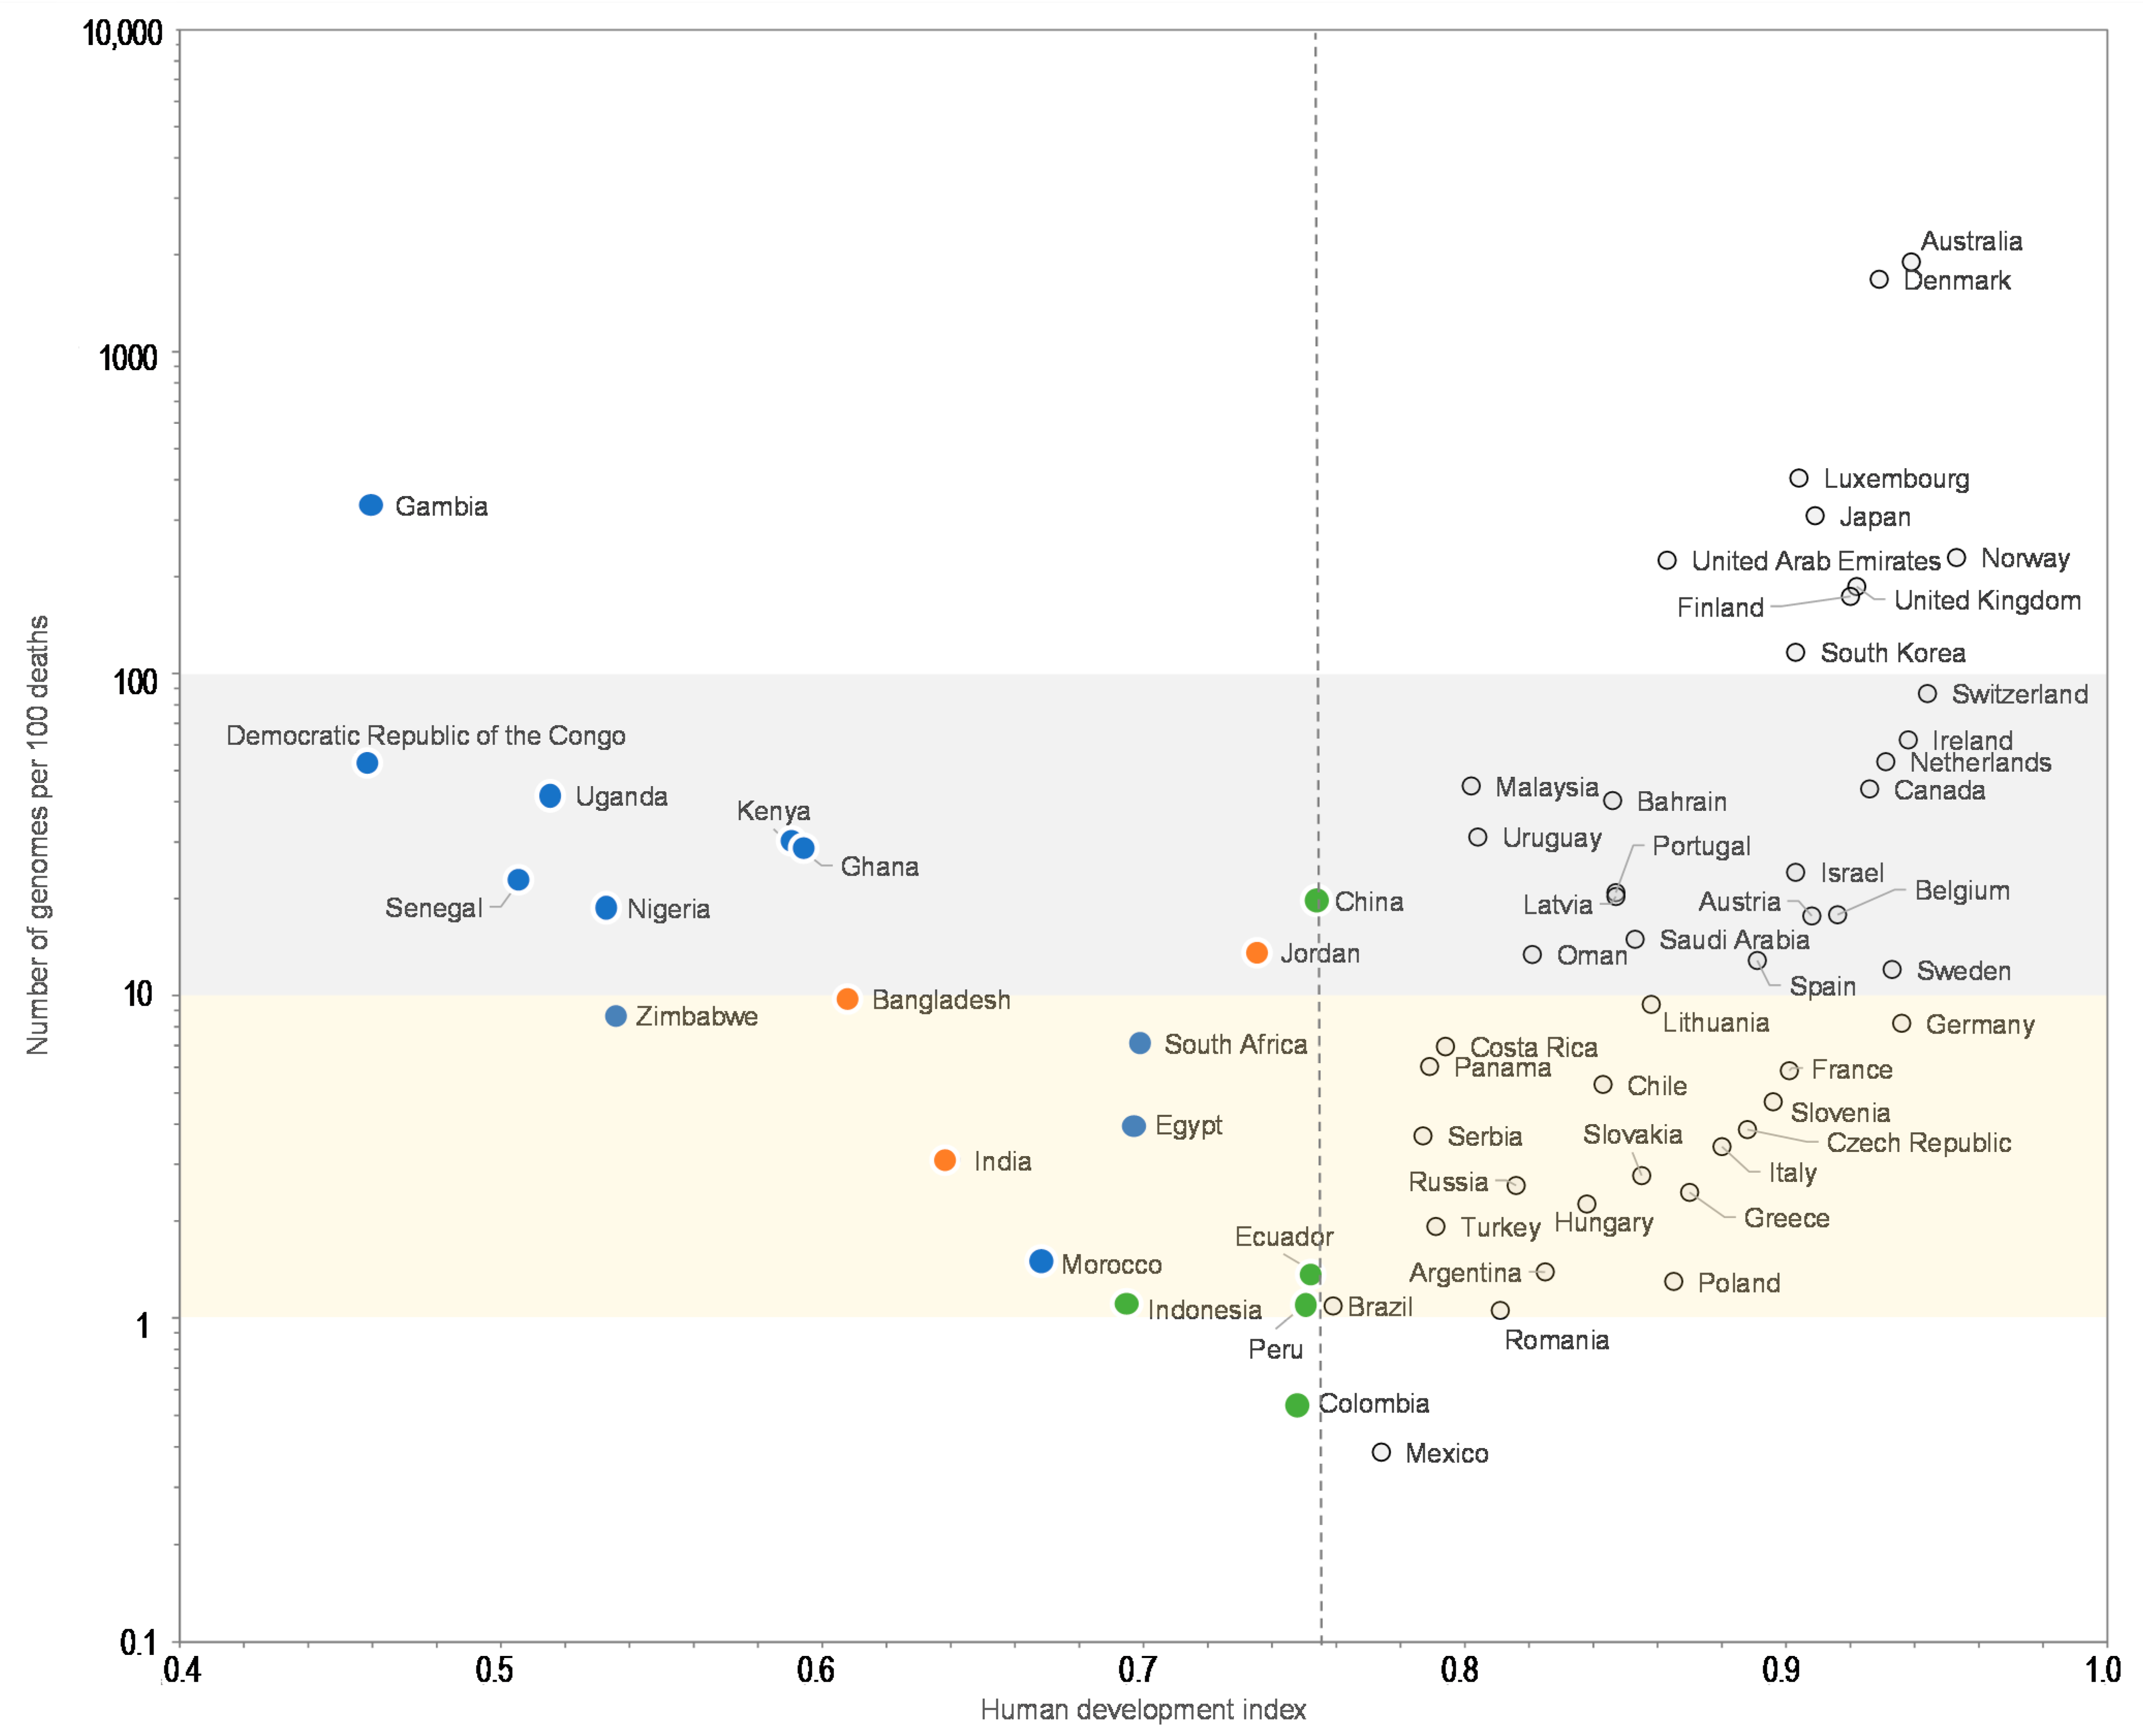
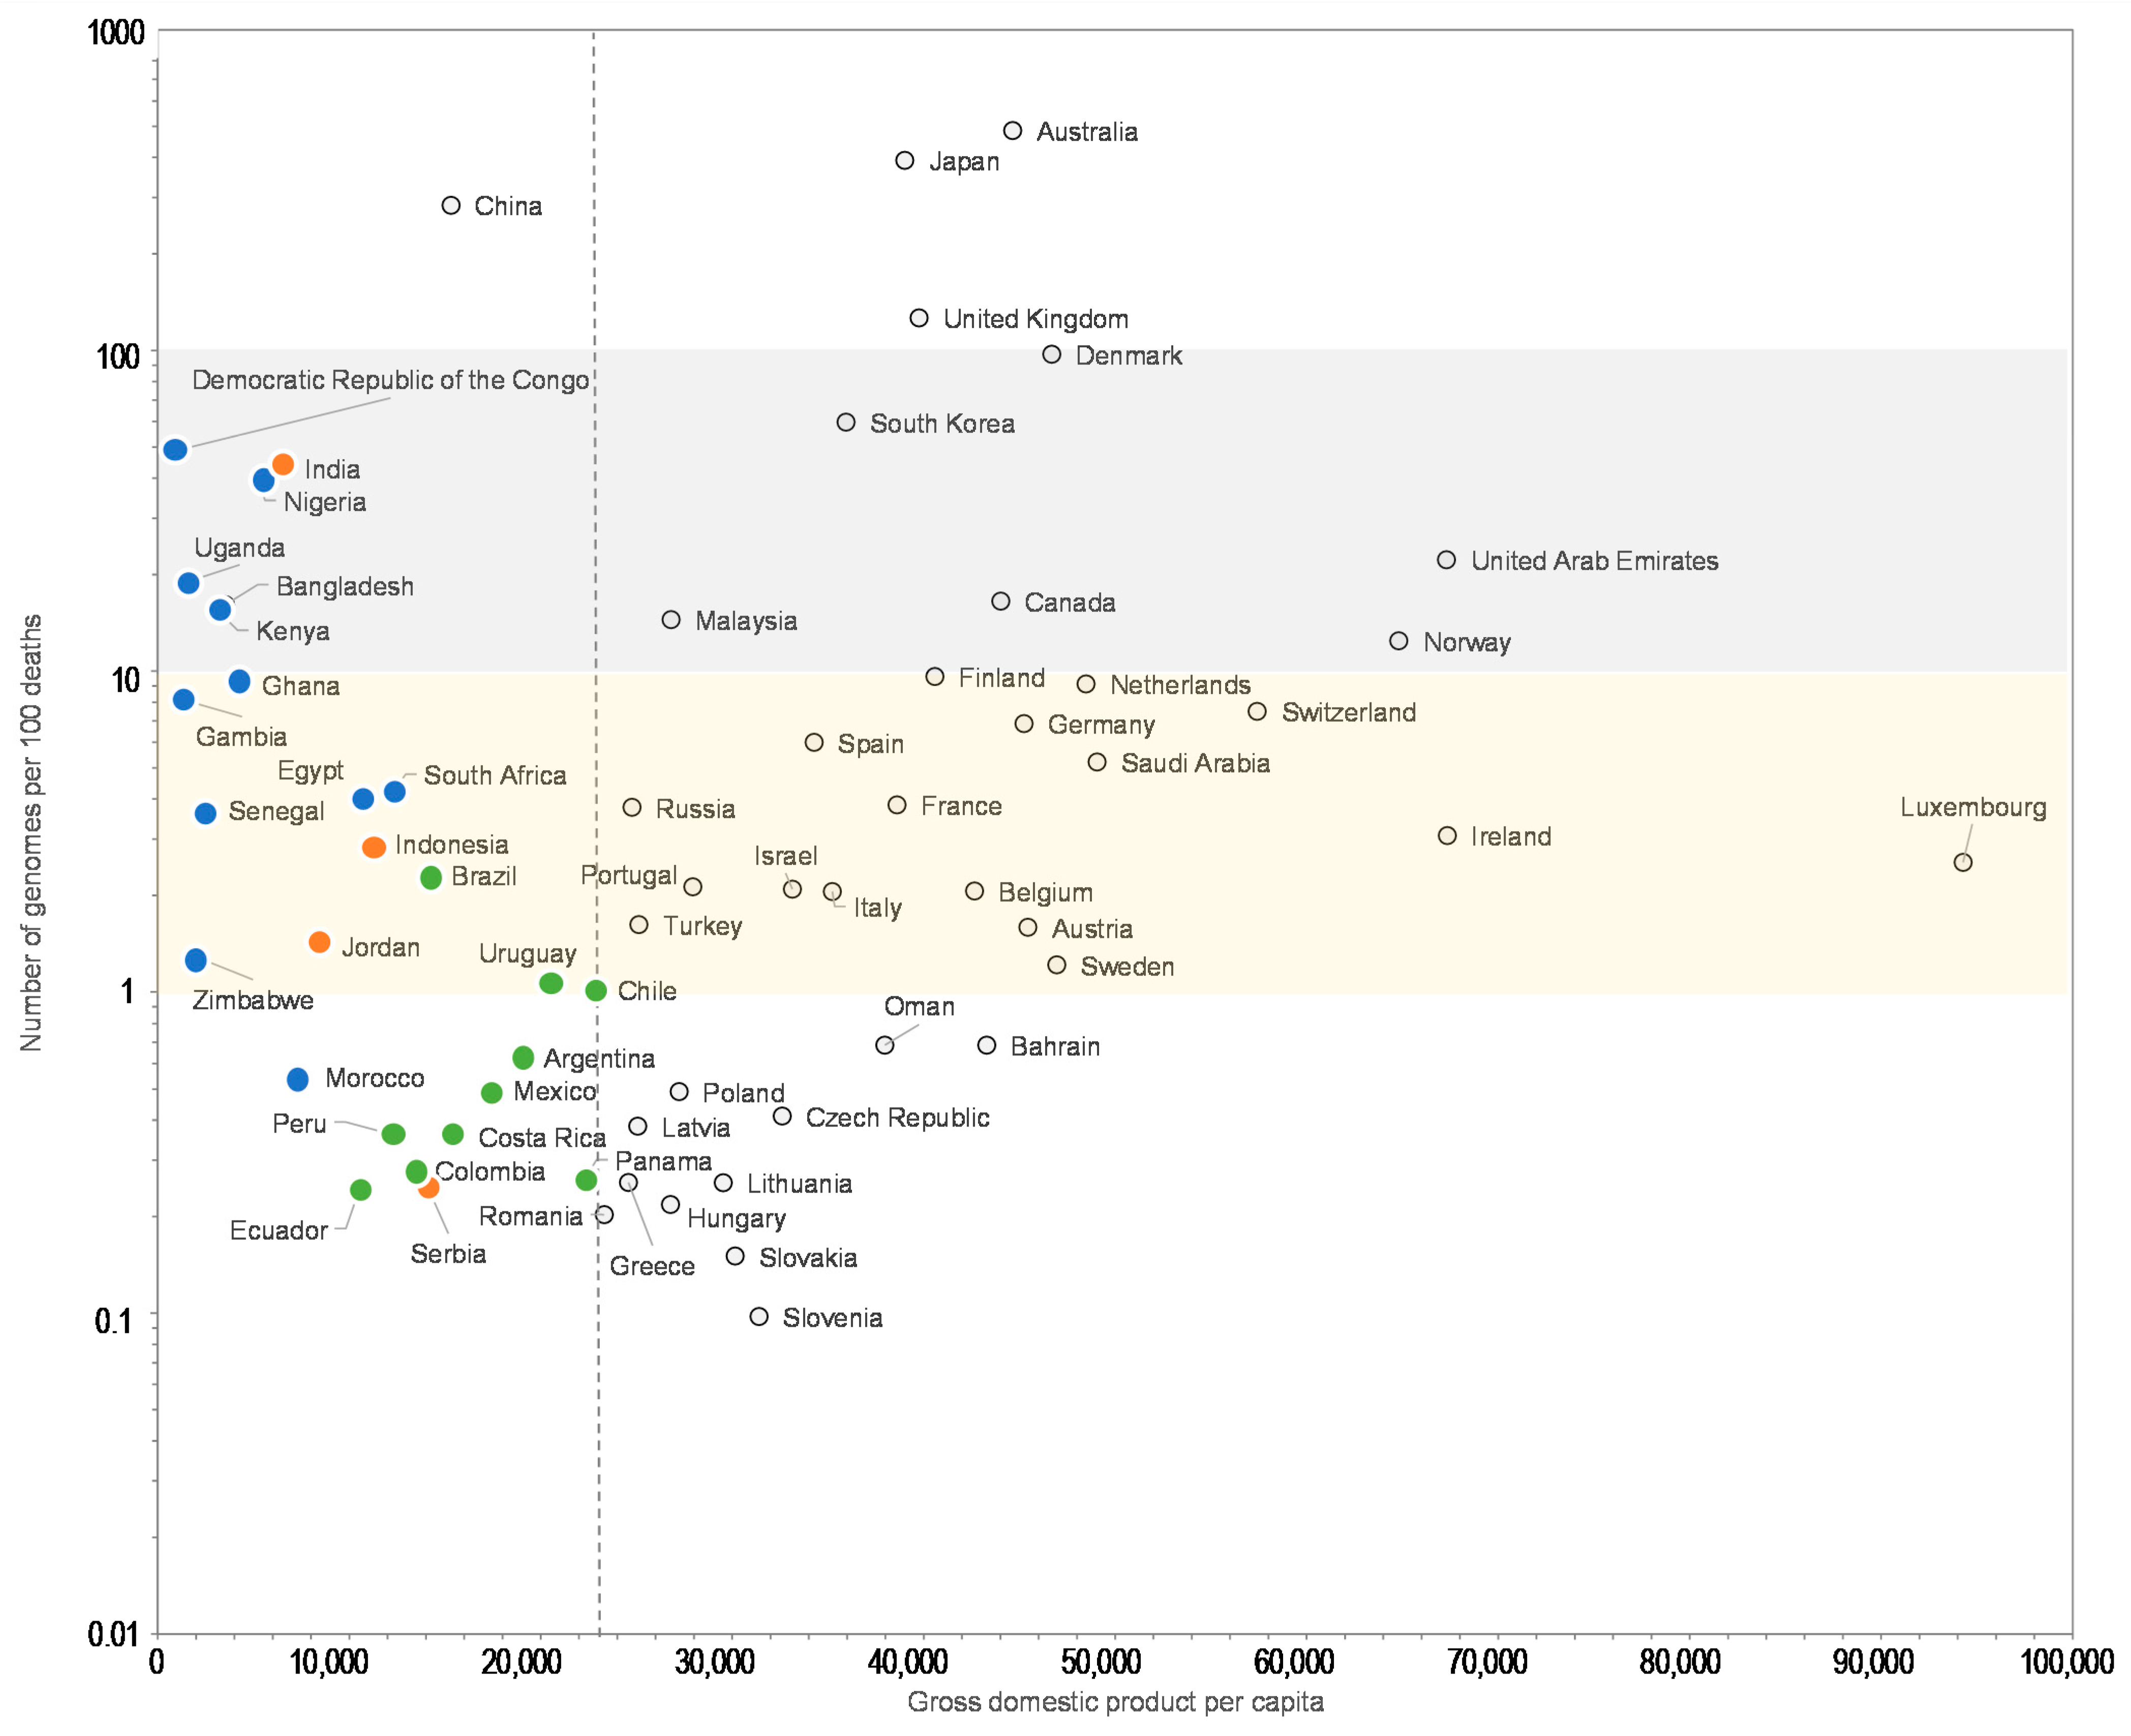
Moreover, the comparisons of the number of SARS-CoV-2 genomes sequenced per 100 SARS-CoV-2-associated deaths and the human development index by country show that some Western European countries such as Germany (8.2 genomes per 100 deaths; human development index = 0.936), France (5.9; 0.901), or Italy (3.4; 0.880) have released similar or lower numbers of genomes than many African or Asian countries with a lower human development index, among which Egypt (4.0 genomes per 100 deaths; human development index = 0.696), Zimbabwe (8.7; 0.535), Nigeria (19; 0.532), Senegal (22; 0.505), Democratic Republic of Congo (54; 0.457), Gambia (334; 0.460), Bangladesh (9.8; 0.608), and China (20; 0.752) (Figure 3). Similar observations can be made when comparing the number of genomes sequenced per 100 deaths and the GPD per capita (Figure 4) by country. Finally, we checked for several countries that they did not submit significant numbers of SARS-CoV-2 genome sequences to sequence databases other than GISAID and particularly found a similar number of genomes in the China NBI sequence database that compiles sequences from GISAID and GenBank in comparison with GISAID alone (Supplementary Table S2).
For a better legibility of the graph, only countries with more than 100 SARS-CoV-2 genomes are shown. Grey and yellow strips indicate countries with numbers of genomes per 100 deaths between 10 and 100, and between 1 and 10, respectively. Blue, green, and orange dots mark countries from Africa, America, and other regions, respectively, with a human development index below the mean value for all 135 countries studied here (0.756).
For a better legibility of the graph, only countries with more than 100 SARS-CoV-2 genomes are shown. Grey and yellow strips indicate countries with numbers of genomes per 100 deaths between 10 and 100, and between 1 and 10, respectively. Blue, green, and orange dots mark countries from Africa, America and other regions, respectively, with a GDP per capita below the mean value for all 135 countries studied here (22,884 US dollars). GDP is in US dollars.
4. Discussion
This analysis, conducted 10 months after WHO declared COVID-19 a pandemic (https://www.who.int/director-general/speeches/detail/who-director-general-s-opening-remarks-at-the-media-briefing-on-covid-19, accessed on 11 march 2020), shows great disparities according to the country in the numbers of SARS-CoV-2 genomes available per 100 cases and deaths, as well as substantial discrepancies between these numbers and the ranking of countries based on their wealth and development, although this was not a general pattern. Here, we considered SARS-CoV-2 genomes from a given country regardless of whether they were obtained inside or outside this country. Therefore, the present analysis shows that several developed countries had either a technological or organizational delay in terms of high throughput sequencing, and/or an insufficient purposefulness to monitor SARS-CoV-2 genetic and proteic diversity and variability. Thus, firstly, in some developed countries, the importance of detecting, characterizing, and surveying SARS-CoV-2 variants may have been initially overlooked. Secondly, the majority of laboratories may have been unable to produce a large number of SARS-CoV-2 genomic sequences because the necessary infrastructure was not in place at the start of the pandemic. This includes the fact that these laboratories did not possess or even did not have access to next-generation sequencing instruments for clinical diagnosis, but only possessed sequencers using Sanger technology. Another reason could have been the lack of organization in terms of human resources or pre-existing training, allowing a high capacity for high-throughput sequencing. Other obstacles could have been global supply chain issues for reagents and consumables. In contrast, several developing countries exhibited wills as well as capacities to sequence SARS-CoV-2 genomes and scaled up next-sequencing technologies [30,31,32]. This is another example that the SARS-CoV-2 pandemic is reshuffling the cards globally.
Limitations to the present study are that it may not comprehensively take into account all SARS-CoV-2 genome sequences obtained in each country. Thus, all genomes sequenced may not be submitted to a sequence database. They may also be submitted to other sequence databases than GISAID, but we did not observe by screening four different sequence databases that these results were biased by disparities between the proportions of sequences submitted to GISAID and other major sequence databases according to countries. Moreover, the human development index and GPD per capita analyzed here do not necessarily reflect the strength of medical research and technology at a country scale.
Such a worldwide distribution of the availability of SARS-CoV-2 genomes as observed here is very interesting. Indeed, several issues related to SARS-CoV-2 genotypic features which are of paramount importance are currently in the forefront of the SARS-CoV-2 pandemic. SARS-CoV-2 variants cause successive or overlapping epidemics with various kinetics, levels of contribution to the total burden of SARS-CoV-2 infections and durations [5,6,7]. In addition, they can be associated with differences regarding disease transmissibility and severity, and they can have the potential to evade immune responses elicited by prior infection or vaccine immunization [5,7,16,17,26,27,28].
Overall, in a new disease caused by viruses with a high mutation rate, as we have learned for a long time with human immunodeficiency virus and hepatitis C virus, it is absolutely necessary to survey and monitor viral genome sequences to detect mutants and variants in order to identify possible differences in terms of transmissibility, clinical severity, resistance to treatments, and escape from vaccine immunity as well as natural immunity. SARS-CoV-2 genome-based surveillance should optimally be continuous with weekly assessments and should be capable of detecting the emergence of the viral variants and monitoring the dynamic and outcome of their epidemics. Considering previous data, broad-scale SARS-CoV-2 genomic surveillance should have been a priority for all developed countries that had the means to perform it.
Supplementary Materials
The following are available online at https://0-www-mdpi-com.brum.beds.ac.uk/article/10.3390/v13050775/s1, Table S1: Top 100 laboratories that sequenced SARS-CoV-2 genomes, Table S2: Number of SARS-CoV-2 genomes in various sequence databases, and number of genomes per 100 SARS-CoV-2-diagnosed cases and per 100 SARS-CoV-2-associated deaths according to country.
Author Contributions
Conceived and designed the experiments: D.R. and P.C. Contributed for the materials/analysis tools: P.C. Analyzed the data: D.R. and P.C. Wrote the paper: D.R. and P.C. All authors have read and agreed to the published version of the manuscript.
Funding
This work was supported by the French Government under the “Investments for the Future” program managed by the National Agency for Research (ANR), Méditerranée-Infection 10-IAHU-03.
Institutional Review Board Statement
Not applicable.
Informed Consent Statement
Not applicable.
Data Availability Statement
Data are available from the GISAID database (https://www.gisaid.org/; accessed on 28 January 2021), from the “Our world in data” website (https://ourworldindata.org/; accessed on 28 January 2021), or from the corresponding author upon reasonable request.
Conflicts of Interest
The authors declare no conflict of interest. The funders had no role in the design of the study; in the collection, analyses, or interpretation of data; in the writing of the manuscript, or in the decision to publish the results.
References
- Shu, Y.; McCauley, J. GISAID: Global initiative on sharing all influenza data—from vision to reality. Euro Surveill 2017, 22, 30494. [Google Scholar] [CrossRef] [PubMed] [Green Version]
- Hadfield, J.; Megill, C.; Bell, S.M.; Huddleston, J.; Potter, B.; Callender, C.; Sagulenko, P.; Bedford, T.; Neher, R.A. Nextstrain: Real-time tracking of pathogen evolution. Bioinformatics 2018, 34, 4121–4123. [Google Scholar] [CrossRef]
- Levasseur, A.; Delerce, J.; Caputo, A.; Brechard, L.; Colson, P.; Lagier, J.C.; Fournier, P.E.; Raoult, D. Genomic diversity and evolution of coronavirus (SARS-CoV-2) in France from 309 COVID-19-infected patients. bioRxiv 2020. [Google Scholar] [CrossRef]
- Colson, P.; Levasseur, A.; Delerce, J.; Chaudet, H.; Bossi, V.; Ben Khedher, M.; Fournier, P.E.; Lagier, J.C.; Raoult, D. Dramatic increase in the SARS-CoV-2 mutation rate and low mortality rate during the second epidemic in summer in Marseille. IHU Pre-Prints 2020. [Google Scholar] [CrossRef]
- Colson, P.; Levasseur, A.; Gautret, P.; Fenollar, F.; Thuan, H.V.; Delerce, J.; Bitam, I.; Saile, R.; Maaloum, M.; Padane, A.; et al. Introduction into the Marseille geographical area of a mild SARS-CoV-2 variant originating from sub-Saharan Africa: An investigational study. Travel Med. Infect. Dis. 2021, 40, 101980. [Google Scholar] [CrossRef]
- Fournier, P.E.; Colson, P.; Levasseur, A.; Gautret, P.; Luciani, L.; Bedotto, M.; Delerce, J.; Brechard, L.; Lagier, J.C.; Chaudet, H.; et al. Genome sequence analysis enabled deciphering the atypical evolution of COVID-19 in Marseille, France. medRxiv 2021. [Google Scholar] [CrossRef]
- Fournier, P.E.; Colson, P.; Levasseur, A.; Devaux, C.; Gautret, P.; Bedotto, M. Emergence and outcome of the SARS-CoV-2 "Marseille-4" variant. Int. J. Infect. Dis. 2021. online ahead of print. [Google Scholar] [CrossRef]
- Hodcroft, E.B.; Zuber, M.; Nadeau, S.; Crawford, K.H.D.; Bloom, J.D.; Veesler, D.; Vaughan, T.G.; Comas, I.Ã.; Candelas, F.G.l.; Stadler, T.; et al. Emergence and spread of a SARS-CoV-2 variant through Europe in the summer of 2020. medRxiv 2020. [Google Scholar] [CrossRef]
- Leung, K.; Shum, M.H.; Leung, G.M.; Lam, T.T.; Wu, J.T. Early transmissibility assessment of the N501Y mutant strains of SARS-CoV-2 in the United Kingdom, October to November 2020. Euro Surveill 2021, 26, 2002106. [Google Scholar] [CrossRef]
- Tegally, H.; Wilkinson, E.; Giovanetti, M.; Iranzadeh, A.; Fonseca, V.; Giandhari, J.; Doolabh, D.; Pillay, S.; San, E.J.; Msomi, N.; et al. Emergence and rapid spread of a new severe acute respiratory syndrome-related coronavirus 2 (SARS-CoV-2) lineage with multiple spike mutations in South Africa. medRxiv 2021. [Google Scholar] [CrossRef]
- Faria, N.R.; Claro, I.M.; Candido, D.; Moyses Franco, L.A.; Andrade, P.S.; Coletti, T.M.; Silva, C.A.M.; Sales, F.C.; Manuli, E.R.; Aguiar, R.S.; et al. Genomic Characterisation of an Emergent SARS-CoV-2 Lineage in Manaus: Preliminary Findings. Virological.org, 2021. Available online: https://virological.org/t/genomic-characterisation-of-an-emergent-sars-cov-2-lineage-in-manaus-preliminary-findings/586 (accessed on 11 April 2021).
- Ecdc. Risk of Spread of New SARS-CoV-2 Variants of Concern in the EU/EEA—First Update. Ecdc Risk Assessment 21 A.D. Available online: https://www.ecdc.europa.eu/en/publications-data/covid-19-risk-assessment-spread-new-variants-concern-eueea-first-update#no-link (accessed on 11 April 2021).
- Lan, J.; Ge, J.; Yu, J.; Shan, S.; Zhou, H.; Fan, S.; Zhang, Q.; Shi, X.; Wang, Q.; Zhang, L.; et al. Structure of the SARS-CoV-2 spike receptor-binding domain bound to the ACE2 receptor. Nature 2020, 581, 215–220. [Google Scholar] [CrossRef] [Green Version]
- Kemp, S.A.; Collier, D.A.; Datir, R.; Ferreira, I.; Gayed, S.; Jahun, A.; Hosmillo, M.; Rees-Spear, C.; Mlcochova, P.; Lumb, I.U.; et al. Neutralising antibodies in Spike mediated SARS-CoV-2 adaptation. medRxiv 2020. [Google Scholar] [CrossRef]
- Greaney, A.J.; Loes, A.N.; Crawford, K.H.D.; Starr, T.N.; Malone, K.D.; Chu, H.Y.; Bloom, J.D. Comprehensive mapping of mutations to the SARS-CoV-2 receptor-binding domain that affect recognition by polyclonal human serum antibodies. Cell Host Microbe 2021, 29, 463–476. [Google Scholar] [CrossRef] [PubMed]
- Liu, Z.; VanBlargan, L.A.; Bloyet, L.M.; Rothlauf, P.W.; Chen, R.E.; Stumpf, S.; Zhao, H.; Errico, J.M.; Theel, E.S.; Liebeskind, M.J.; et al. Landscape analysis of escape variants identifies SARS-CoV-2 spike mutations that attenuate monoclonal and serum antibody neutralization. Cell Host Microbe 2021, 29, 477–488. [Google Scholar] [CrossRef]
- Ho, D.; Wang, P.; Nair, M.; Liu, L.; Iketani, S.; Luo, Y.; Guo, Y.; Wang, M.; Yu, J.; Zhang, B.; et al. Antibody resistance of SARS-CoV-2 variants B.1.351 and B.1.1.7. Nature 2021. epub ahead of print. [Google Scholar] [CrossRef]
- Choi, B.; Choudhary, M.C.; Regan, J.; Sparks, J.A.; Padera, R.F.; Qiu, X.; Solomon, I.H.; Kuo, H.H.; Boucau, J.; Bowman, K.; et al. Persistence and Evolution of SARS-CoV-2 in an Immunocompromised Host. N. Engl. J. Med. 2020, 383, 2291–2293. [Google Scholar] [CrossRef]
- Hensley, M.K.; Bain, W.G.; Jacobs, J.; Nambulli, S.; Parikh, U.; Cillo, A.; Staines, B.; Heaps, A.; Sobolewski, M.D.; Rennick, L.J.; et al. Intractable COVID-19 and Prolonged SARS-CoV-2 Replication in a CAR-T-cell Therapy Recipient: A Case Study. Clin. Infect. Dis. 2021. [Google Scholar] [CrossRef]
- Khatamzas, E.; Rehn, A.; Muenchhoff, M.; Hellmuth, J.; Gaitzsch, E.; Weiglein, T.; Georgi, E.; Scherer, C.; Stecher, S.; Weigert, O.; et al. Emergence of multiple SARS-CoV-2 mutations in an immunocompromised host. medRxiv 2021. [Google Scholar] [CrossRef]
- Hueso, T.; Pouderoux, C.; Péré, H.; Beaumont, A.L.; Raillon, L.A.; Ader, F.; Chatenoud, L.; Eshagh, D.; Szwebel, T.A.; Martinot, M.; et al. Convalescent plasma therapy for B-cell-depleted patients with protracted COVID-19. Blood 2020, 136, 2290–2295. [Google Scholar] [CrossRef]
- To, K.K.; Hung, I.F.; Ip, J.D.; Chu, A.W.; Chan, W.M.; Tam, A.R.; Fong, C.H.; Yuan, S.; Tsoi, H.W.; Ng, A.C.; et al. COVID-19 re-infection by a phylogenetically distinct SARS-coronavirus-2 strain confirmed by whole genome sequencing. Clin. Infect. Dis. 2020. online ahead of print. [Google Scholar] [CrossRef]
- Colson, P.; Finaud, M.; Levy, N.; Lagier, J.C.; Raoult, D. Evidence of SARS-CoV-2 re-infection with a different genotype. J. Infect. 2020. online ahead of print. [Google Scholar] [CrossRef]
- Cohen, J.I.; Burbelo, P.D. Reinfection with SARS-CoV-2: Implications for Vaccines. Clin. Infect. Dis 2020. online ahead of print. [Google Scholar] [CrossRef]
- Brouqui, P.; Colson, P.; Melenotte, C.; Houhamdi, L.; Bedotto, M.; Devaux, C.; Gautret, P.; Million, M.; Parola, P.; Stoupan, D.; et al. COVID re-infection. Eur. J. Clin. Invest. 2021. online ahead of print. [Google Scholar] [CrossRef] [PubMed]
- Planas, D.; Bruel, T.; Grzelak, L.; Guivel-Benhassine, F.; Staropoli, I.; Porrot, F.; Planchais, C.; Buchrieser, J.; Rajah, M.M.; Bishop, E.; et al. Sensitivity of infectious SARS-CoV-2 B.1.1.7 and B.1.351 variants to neutralizing antibodies. Nat. Med. 2021. epub ahead of print. [Google Scholar] [CrossRef] [PubMed]
- Wang, P.; Wang, M.; Yu, J.; Cerutti, G.; Nair, M.S.; Huang, Y.; Kwong, P.D.; Shapiro, L.; Ho, D.D. Increased Resistance of SARS-CoV-2 Variant P.1 to Antibody Neutralization. bioRxiv 2021. [Google Scholar] [CrossRef]
- Zhou, D.; Dejnirattisai, W.; Supasa, P.; Liu, C.; Mentzer, A.J.; Ginn, H.M.; Zhao, Y.; Duyvesteyn, H.M.E.; Tuekprakhon, A.; Nutalai, R.; et al. Evidence of escape of SARS-CoV-2 variant B.1.351 from natural and vaccine-induced sera. Cell 2021. epub ahead of print. [Google Scholar] [CrossRef]
- Furuse, Y. Genomic sequencing effort for SARS-CoV-2 by country during the pandemic. Int. J. Infect. Dis. 2020, 103, 305–307. [Google Scholar] [CrossRef] [PubMed]
- Dia, N.; Lakh, N.A.; Diagne, M.M.; Mbaye, K.D.; Taieb, F.; Fall, N.M.; Barry, M.A.; Ka, D.; Fall, A.; Diallo, V.M.P.C.; et al. COVID-19 Outbreak, Senegal, 2020. Emerg. Infect. Dis. 2020, 26, 2772–2774. [Google Scholar] [CrossRef] [PubMed]
- Ze, A.N.; Easa Amer, K.; Hafez, M.M.; Hassan, Z.K.; Ahmed, O.S.; Soliman, H.K.; Bahnasy, A.A.; Abdel Hamid, W.; Gad, A.; Ali, M.; et al. Genomic characterization of SARS-CoV-2 in Egypt. J. Adv. Res. 2020. epub ahead of print. [Google Scholar] [CrossRef]
- Happi, C.; Omilabu, S.; Salako, B.L.; Abayomi, A.; Oluniyi, P.E. Virological. 2020. Available online: https://virological.org/t/first-african-sars-cov-2-genome-sequence-from-nigerian-covid-19-case/421 (accessed on 11 April 2021).
Figure 1.
Numbers of SARS-CoV-2 genomes per 100 SARS-CoV-2-diagnosed cases (left, orange) and per 100 SARS-CoV-2-associated deaths (right, blue) according to countries.
Figure 1.
Numbers of SARS-CoV-2 genomes per 100 SARS-CoV-2-diagnosed cases (left, orange) and per 100 SARS-CoV-2-associated deaths (right, blue) according to countries.

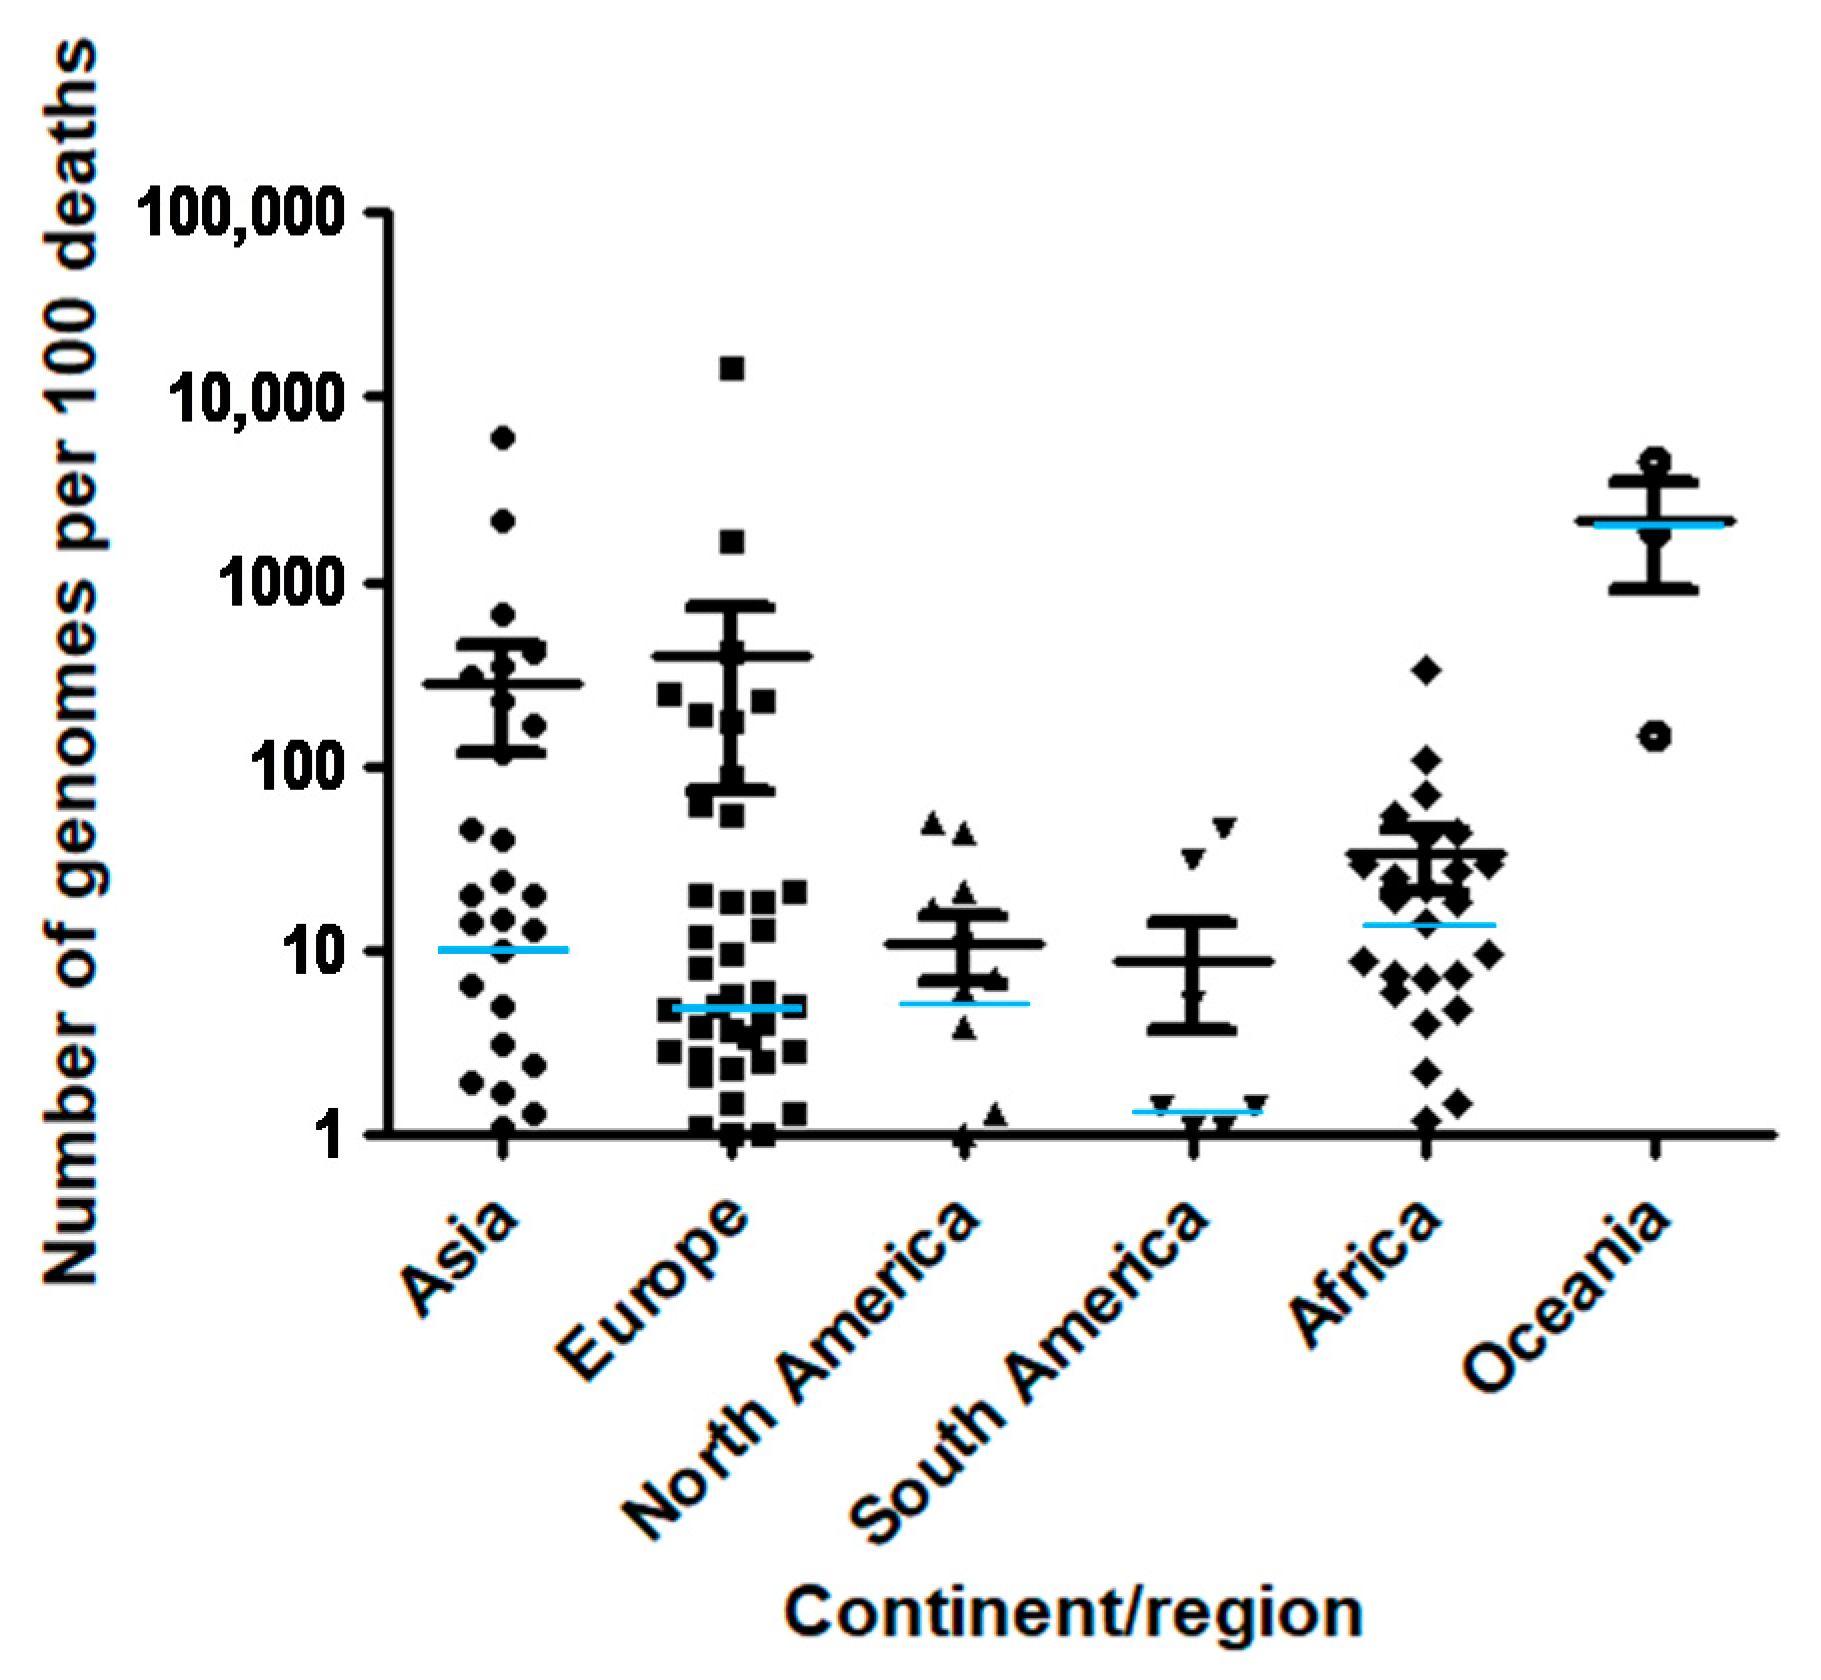
Figure 2.
Number of SARS-CoV-2 genomes per 100 SARS-CoV-2-associated deaths according to continent/region. Median value for each region is indicated by a light blue horizontal bar.
Figure 2.
Number of SARS-CoV-2 genomes per 100 SARS-CoV-2-associated deaths according to continent/region. Median value for each region is indicated by a light blue horizontal bar.

Figure 3.
Number of SARS-CoV-2 genomes per 100 SARS-CoV-2-associated deaths vs. human development index.
Figure 3.
Number of SARS-CoV-2 genomes per 100 SARS-CoV-2-associated deaths vs. human development index.

Figure 4.
Number of SARS-CoV-2 genomes per 100 SARS-CoV-2-associated deaths vs. gross domestic product per capita (GDP).
Figure 4.
Number of SARS-CoV-2 genomes per 100 SARS-CoV-2-associated deaths vs. gross domestic product per capita (GDP).


Table 1.
Number of genomes, of SARS-CoV-2-diagnosed cases, of SARS-CoV-2-associated deaths per country, and various epidemiological data among which population size, life expectancy, gross domestic product (GDP) per capita, or human development index.
Table 1.
Number of genomes, of SARS-CoV-2-diagnosed cases, of SARS-CoV-2-associated deaths per country, and various epidemiological data among which population size, life expectancy, gross domestic product (GDP) per capita, or human development index.
| Country | Continent/Region | Number of Genomes | Number of Genomes per 100 Cases | Number of Genomes per 100 Deaths | Number of Cases | Number of Deaths | Population | GDP per Capita | Human Development Index |
|---|---|---|---|---|---|---|---|---|---|
| Iceland | Europe | 4175 | 69.6 | 14,397 | 6001 | 29 | 341,25 | 46,483 | 0.935 |
| Singapore | Asia | 1731 | 2.9 | 5969 | 59,425 | 29 | 5,850,343 | 85,535 | 0.932 |
| New Zealand | Oceania | 1095 | 47.5 | 4380 | 2305 | 25 | 4,822,233 | 36,086 | 0.917 |
| Taiwan | Asia | 150 | 16.8 | 2143 | 895 | 7 | 23,816,775 | - | - |
| Australia | Oceania | 17,29 | 60.0 | 1902 | 28,799 | 909 | 25,499,881 | 44,649 | 0.939 |
| Denmark | Europe | 34,819 | 17.6 | 1680 | 197,892 | 2072 | 5,792,203 | 46,683 | 0.929 |
| Thailand | Asia | 496 | 3.1 | 653 | 16,221 | 76 | 69,799,978 | 16,278 | 0.755 |
| Vietnam | Asia | 142 | 8.6 | 406 | 1651 | 35 | 97,338,583 | 6172 | 0.694 |
| Luxembourg | Europe | 2325 | 4.6 | 405 | 50,228 | 574 | 625,976 | 94,278 | 0.904 |
| Mongolia | Asia | 7 | 0.4 | 350 | 1,71 | 2 | 3,278,292 | 11,841 | 0.741 |
| Gambia | Africa | 427 | 10.6 | 334 | 4019 | 128 | 2,416,664 | 1562 | 0.460 |
| Japan | Asia | 17,052 | 4.5 | 310 | 380,644 | 5503 | 126,476,458 | 39,002 | 0.909 |
| IHU Méditerranée Infection * | Europe | 1585 | 5.2 | 250 | 30,237 | 633 | - | - | - |
| Norway | Europe | 1278 | 2.1 | 229 | 62,276 | 557 | 5,421,242 | 64,8 | 0.953 |
| United Arab Emirates | Asia | 1845 | 0.6 | 225 | 293,052 | 819 | 9,890,400 | 67,293 | 0.863 |
| United Kingdom | Europe | 192,556 | 5.1 | 186 | 3,754,448 | 103,324 | 67,886,004 | 39,753 | 0.922 |
| Finland | Europe | 1154 | 2.6 | 174 | 44,039 | 664 | 5,540,718 | 40,586 | 0.920 |
| Brunei | Asia | 5 | 2.8 | 167 | 180 | 3 | 437,483 | 71,809 | 0.853 |
| Papua New Guinea | Oceania | 13 | 1.5 | 144 | 851 | 9 | 8947,027 | 3823 | 0.544 |
| South Korea | Asia | 1631 | 2.1 | 117 | 77,395 | 1399 | 51,269,183 | 35,938 | 0.903 |
| Equatorial Guinea | Africa | 95 | 1.7 | 110 | 5492 | 86 | 1,402,985 | 22,605 | 0.591 |
| Switzerland | Europe | 8071 | 1.6 | 87 | 519,404 | 9308 | 8,654,618 | 57,41 | 0.944 |
| Burkina Faso | Africa | 85 | 0.8 | 71 | 10,377 | 120 | 20,903,278 | 1703 | 0.423 |
| Ireland | Europe | 1973 | 1.0 | 62 | 193,645 | 3167 | 4,937,796 | 67,335 | 0.938 |
| Democratic Republic of Congo | Africa | 360 | 1.6 | 54 | 22,322 | 665 | 89,561,404 | 808 | 0.457 |
| Netherlands | Europe | 7422 | 0.8 | 53 | 979,702 | 13,925 | 17,134,873 | 48,473 | 0.931 |
| Saint Vincent and the Grenadines | North America | 1 | 0.1 | 50 | 827 | 2 | 110,947 | 10,727 | 0.723 |
| Surinam | South America | 71 | 0.9 | 46 | 8293 | 154 | 586,634 | 13,767 | 0.720 |
| Malaysia | Asia | 321 | 0.2 | 45 | 198,208 | 717 | 32,365,998 | 26,808 | 0.802 |
| Canada | North America | 8613 | 1.1 | 44 | 770,433 | 19,659 | 37,742,157 | 44,018 | 0.926 |
| Côte d’Ivoire | Africa | 65 | 0.2 | 43 | 27,694 | 151 | 26,378,275 | 3601 | 0.492 |
| Uganda | Africa | 133 | 0.3 | 42 | 39,424 | 318 | 45,741,000 | 1698 | 0.516 |
| Bahrain | Asia | 150 | 0.1 | 40 | 101,503 | 372 | 1,701,583 | 43,291 | 0.846 |
| Uruguay | South America | 129 | 0.3 | 31 | 39,887 | 415 | 3,473,727 | 20,551 | 0.804 |
| Kenya | Africa | 514 | 0.5 | 29 | 100,422 | 1753 | 53,771,300 | 2993 | 0.590 |
| Ghana | Africa | 114 | 0.2 | 29 | 63,883 | 390 | 31,072,945 | 4228 | 0.592 |
| Mozambique | Africa | 94 | 0.3 | 27 | 35,833 | 347 | 31,255,435 | 1136 | 0.437 |
| Benin | Africa | 12 | 0.3 | 25 | 3786 | 48 | 12,123,198 | 2064 | 0.515 |
| Israel | Asia | 1128 | 0.2 | 24 | 628,895 | 4669 | 8,655,541 | 33,132 | 0.903 |
| Senegal | Africa | 136 | 0.5 | 22 | 25,711 | 614 | 16,743,930 | 2471 | 0.505 |
| Portugal | Europe | 2422 | 0.4 | 21 | 685,383 | 11,608 | 10,196,707 | 27,937 | 0.847 |
| USA | North America | 89,814 | 0.3 | 21 | 25,766,681 | 433,196 | 331,002,647 | 54,225 | 0.924 |
| Latvia | Europe | 233 | 0.4 | 20 | 63,992 | 1148 | 1,886,202 | 25,064 | 0.847 |
| Sri Lanka | Asia | 60 | 0.1 | 20 | 61,586 | 297 | 21,413,250 | 11,669 | 0.770 |
| China | Asia | 949 | 1.0 | 20 | 99,746 | 4813 | 1,439,323,774 | 15,309 | 0.752 |
| Nigeria | Africa | 290 | 0.2 | 19 | 127,024 | 1547 | 206,139,587 | 5338 | 0.532 |
| Rwanda | Africa | 34 | 0.2 | 18 | 14,529 | 186 | 12,952,209 | 1854 | 0.524 |
| Belgium | Europe | 3743 | 0.5 | 18 | 702437 | 20,982 | 11,589,616 | 42,659 | 0.916 |
| Austria | Europe | 1344 | 0.3 | 18 | 410,23 | 7607 | 9,006,400 | 45,437 | 0.908 |
| Antigua and Barbuda | North America | 1 | 0.5 | 17 | 215 | 6 | 97,928 | 21,491 | 0.780 |
| Saudi Arabia | Asia | 953 | 0.3 | 15 | 367,276 | 6366 | 34,813,867 | 49,045 | 0.853 |
| Sierra Leone | Africa | 11 | 0.3 | 14 | 3,282 | 77 | 7,976,985 | 1390 | 0.419 |
| Jordan | Asia | 581 | 0.2 | 14 | 324,169 | 4269 | 10,203,140 | 8337 | 0.735 |
| Oman | Asia | 205 | 0.2 | 13 | 133,728 | 1527 | 5,106,622 | 37,961 | 0.821 |
| Spain | Europe | 7431 | 0.3 | 13 | 2,705,001 | 57,806 | 46,754,783 | 34,272 | 0.891 |
| Trinidad and Tobago | North America | 17 | 0.2 | 13 | 7,52 | 134 | 1,399,491 | 28,763 | 0.784 |
| Sweden | Europe | 1388 | 0.2 | 12 | 564,557 | 11,52 | 10,099,270 | 46,949 | 0.933 |
| Bangladesh | Asia | 792 | 0.1 | 9.8 | 533,953 | 8087 | 164,689,383 | 3524 | 0.608 |
| Botswana | Africa | 13 | 0.1 | 9.7 | 21,293 | 134 | 2,351,625 | 15,807 | 0.717 |
| Lithuania | Europe | 258 | 0.1 | 9.4 | 180,16 | 2749 | 2,722,291 | 29,524 | 0.858 |
| Zimbabwe | Africa | 101 | 0.3 | 8.7 | 32,646 | 1160 | 14,862,927 | 1900 | 0.535 |
| Germany | Europe | 4582 | 0.2 | 8.2 | 2,194,562 | 55,883 | 83,783,945 | 45,229 | 0.936 |
| Mali | Africa | 24 | 0.3 | 7.3 | 8056 | 328 | 20,250,834 | 2014 | 0.427 |
| Guinea | Africa | 6 | 0.0 | 7.3 | 14,435 | 82 | 13,132,792 | 1999 | 0.459 |
| South Africa | Africa | 3062 | 0.2 | 7.1 | 1,437,798 | 43,105 | 59,308,690 | 12,295 | 0.699 |
| Costa Rica | North America | 181 | 0.1 | 7.0 | 192,637 | 2599 | 5,094,114 | 15,525 | 0.794 |
| Qatar | Asia | 16 | 0.0 | 6.5 | 150,28 | 248 | 2,881,060 | 116,936 | 0.856 |
| Panama | North America | 314 | 0.1 | 6.0 | 316,808 | 5196 | 4,314,768 | 22,267 | 0.789 |
| Gabon | Africa | 4 | 0.0 | 5.9 | 10,536 | 68 | 2,225,728 | 16,562 | 0.702 |
| France | Europe | 4379 | 0.1 | 5.9 | 3,166,145 | 74,601 | 65,273,512 | 38,606 | 0.901 |
| Liechtenstein | Europe | 3 | 0.1 | 5.8 | 2475 | 52 | 38,137 | - | 0.916 |
| Chile | South America | 966 | 0.1 | 5.3 | 714,143 | 18,174 | 19,116,209 | 22,767 | 0.843 |
| Malta | Europe | 13 | 0.1 | 5.0 | 17,4 | 261 | 441,539 | 36,513 | 0.878 |
| Estonia | Europe | 20 | 0.0 | 4.9 | 42,656 | 406 | 1,326,539 | 29,481 | 0.871 |
| Palestine | Asia | 88 | 0.1 | 4.9 | 157,593 | 1812 | 5,101,416 | 4450 | 0.686 |
| Cameroon | Africa | 22 | 0.1 | 4.8 | 29,617 | 462 | 26,545,864 | 3365 | 0.556 |
| Slovenia | Europe | 162 | 0.1 | 4.7 | 163,235 | 3448 | 2,078,932 | 31,401 | 0.896 |
| Cyprus | Europe | 8 | 0.0 | 4.1 | 30,538 | 197 | 875,899 | 32,415 | 0.869 |
| Egypt | Africa | 366 | 0.2 | 4.0 | 164,282 | 9169 | 102,334,403 | 10,55 | 0.696 |
| Czech Republic | Europe | 614 | 0.1 | 3.9 | 964,66 | 15,944 | 10,708,982 | 32606 | 0.888 |
| Jamaica | North America | 13 | 0.1 | 3.8 | 15,435 | 344 | 2 961,161 | 8194 | 0.732 |
| France minus IHU Méditerranée Infection * | Europe | 2794 | 0.1 | 3.8 | 3,135,908 | 73,968 | - | - | - |
| Serbia | Europe | 146 | 0.0 | 3.7 | 390,637 | 3965 | 6,804,596 | 14,049 | 0.787 |
| Italy | Europe | 2974 | 0.1 | 3.4 | 2,515,507 | 87,381 | 60,461,828 | 35,22 | 0.880 |
| India | Asia | 4778 | 0.0 | 3.1 | 10,720,048 | 154,01 | 1,380,004,385 | 6427 | 0.640 |
| North Macedonia | Europe | 82 | 0.1 | 2.9 | 91,891 | 2831 | 2,083,380 | 13,111 | 0.757 |
| Slovakia | Europe | 122 | 0.1 | 2.8 | 243,427 | 4411 | 5,459,643 | 30,155 | 0.855 |
| Russia | Europe | 1820 | 0.0 | 2.6 | 3,752,548 | 70,533 | 145,934,460 | 24,766 | 0.816 |
| Greece | Europe | 141 | 0.1 | 2.5 | 154,796 | 5742 | 10,423,056 | 24,574 | 0.870 |
| Kuwait | Asia | 23 | 0.0 | 2.4 | 163,45 | 958 | 4,270,563 | 65,531 | 0.803 |
| Hungary | Europe | 278 | 0.1 | 2.3 | 363,45 | 12,291 | 9,660,350 | 26,778 | 0.838 |
| Madagascar | Africa | 6 | 0.0 | 2.2 | 18,743 | 279 | 27,691,019 | 1416 | 0.519 |
| Belarus | Europe | 35 | 0.0 | 2.1 | 242,851 | 1688 | 9,449,321 | 17,168 | 0.808 |
| Turkey | Asia | 493 | 0.0 | 1.9 | 2,457,118 | 25,605 | 84,339,067 | 25,129 | 0.791 |
| Kazakhstan | Asia | 53 | 0.0 | 1.7 | 231,716 | 3040 | 18,776,707 | 24,056 | 0.800 |
| Montenegro | Europe | 12 | 0.0 | 1.5 | 60,288 | 790 | 628,062 | 16,409 | 0.814 |
| Morocco | Africa | 122 | 0.0 | 1.5 | 469,139 | 8224 | 36,910,558 | 7485 | 0.667 |
| Ecuador | South America | 208 | 0.1 | 1.4 | 246 | 14,766 | 17,643,060 | 10,582 | 0.752 |
| Argentina | South America | 662 | 0.0 | 1.4 | 1,905,524 | 47,601 | 45,195,777 | 18,934 | 0.825 |
| Belize | North America | 4 | 0.0 | 1.3 | 11,845 | 298 | 397,621 | 7824 | 0.708 |
| Myanmar | Asia | 41 | 0.0 | 1.3 | 139,152 | 3103 | 54,409,794 | 5592 | 0.578 |
| Poland | Europe | 473 | 0.0 | 1.3 | 1,496,665 | 36,443 | 37,846,605 | 27,216 | 0.865 |
| Tunisia | Africa | 78 | 0.0 | 1.2 | 204,351 | 6508 | 11,818,618 | 10,849 | 0.735 |
| Peru | South America | 441 | 0.0 | 1.1 | 1,113,970 | 40,272 | 32,971,846 | 12,237 | 0.750 |
| Brazil | South America | 2414 | 0.0 | 1.1 | 9,058,687 | 221,547 | 212,559,409 | 14,103 | 0.759 |
| Indonesia | Asia | 313 | 0.0 | 1.1 | 1,037,993 | 29,331 | 273,523,621 | 11,189 | 0.694 |
| Romania | Europe | 191 | 0.0 | 1.1 | 721,513 | 18,105 | 19,237,682 | 23,313 | 0.811 |
| Croatia | Europe | 50 | 0.0 | 1.0 | 230,978 | 4943 | 4,105,268 | 22,67 | 0.831 |
| Andorra | Europe | 1 | 0.0 | 1.0 | 9779 | 100 | 77,265 | - | 0.858 |
| Cuba | North America | 2 | 0.0 | 1.0 | 24,105 | 208 | 11,326,616 | - | 0.777 |
| Lebanon | Asia | 23 | 0.0 | 0.9 | 293,157 | 2621 | 6,825,442 | 13,368 | 0.757 |
| Georgia | Asia | 26 | 0.0 | 0.8 | 256,287 | 3127 | 3,989,175 | 9745 | 0.780 |
| Kosovo | Europe | 12 | 0.0 | 0.8 | 58,988 | 1479 | 1,932,774 | 9796 | - |
| Nepal | Asia | 15 | 0.0 | 0.7 | 270,588 | 2020 | 29,136,808 | 2443 | 0.574 |
| Bosnia and Herzegovina | Europe | 33 | 0.0 | 0.7 | 121,194 | 4659 | 3,280,815 | 11,714 | 0.768 |
| Algeria | Africa | 18 | 0.0 | 0.6 | 106,61 | 2881 | 43,851,043 | 13,914 | 0.754 |
| Guatemala | North America | 32 | 0.0 | 0.6 | 157,595 | 5543 | 17,915,567 | 7424 | 0.650 |
| Colombia | South America | 290 | 0.0 | 0.5 | 2,067,575 | 52,913 | 50,882,884 | 13,255 | 0.747 |
| Pakistan | Asia | 58 | 0.0 | 0.5 | 541,031 | 11,56 | 220,892,331 | 5035 | 0.562 |
| Mexico | North America | 598 | 0.0 | 0.4 | 1,825,519 | 155,145 | 128,932,753 | 17,336 | 0.774 |
| El Salvador | North America | 6 | 0.0 | 0.4 | 53,989 | 1599 | 6,486,201 | 7292 | 0.674 |
| Philippines | Asia | 38 | 0.0 | 0.4 | 519,575 | 10,552 | 109,581,085 | 7599 | 0.699 |
| Dominican Republic | North America | 8 | 0.0 | 0.3 | 208,61 | 2603 | 10,847,904 | 14,601 | 0.736 |
| Ukraine | Europe | 67 | 0.0 | 0.3 | 1,247,674 | 23,469 | 43,733,759 | 7894 | 0.751 |
| Zambia | Africa | 2 | 0.0 | 0.3 | 50,319 | 705 | 18,383,956 | 3689 | 0.588 |
| Bolivia | South America | 27 | 0.0 | 0.3 | 210,726 | 10,226 | 11,673,029 | 6886 | 0.693 |
| Moldova | Europe | 9 | 0.0 | 0.3 | 158,309 | 3413 | 4,033,963 | 5190 | 0.700 |
| Azerbaijan | Asia | 8 | 0.0 | 0.3 | 229,793 | 3113 | 10,139,175 | 15,847 | 0.757 |
| Venezuela | South America | 3 | 0.0 | 0.3 | 125,364 | 1171 | 28,435,943 | 16,745 | 0.761 |
| Iraq | Asia | 31 | 0.0 | 0.2 | 617,202 | 13,024 | 40,222,503 | 15,664 | 0.685 |
| Bulgaria | Europe | 15 | 0.0 | 0.2 | 217,574 | 8973 | 6,948,445 | 18,563 | 0.813 |
| Armenia | Asia | 3 | 0.0 | 0.1 | 166,669 | 3067 | 2,963,234 | 8788 | 0.755 |
| Albania | Europe | 1 | 0.0 | 0.1 | 75,454 | 1350 | 2,877,800 | 11,803 | 0.785 |
| Iran | Asia | 36 | 0.0 | 0.1 | 1,398,841 | 5, 736 | 83,992,953 | 19,083 | 0.798 |
| Saint Kitts and Nevis | North America | 3 | 8.1 | 0.0 | 37 | - | 53,192 | 24,654 | 0.778 |
| Cambodia | Asia | 4 | 0.9 | 0.0 | 463 | - | 16,718,971 | 3645 | 0.582 |
| Hong Kong | Asia | 344 | 0.0 | 0.0 | - | - | 7,496,988 | 56,055 | 0.933 |
| Slovakia | Europe | 122 | 0.1 | 2.8 | 243,427 | 4411 | 5,459,643 | 30,155 | 0.855 |
* Our institute; GDP, gross domestic product; GDP per capita is in US dollars.
Publisher’s Note: MDPI stays neutral with regard to jurisdictional claims in published maps and institutional affiliations. |
© 2021 by the authors. Licensee MDPI, Basel, Switzerland. This article is an open access article distributed under the terms and conditions of the Creative Commons Attribution (CC BY) license (https://creativecommons.org/licenses/by/4.0/).
Share and Cite
MDPI and ACS Style
Colson, P.; Raoult, D. Global Discrepancies between Numbers of Available SARS-CoV-2 Genomes and Human Development Indexes at Country Scales. Viruses 2021, 13, 775. https://0-doi-org.brum.beds.ac.uk/10.3390/v13050775
AMA Style
Colson P, Raoult D. Global Discrepancies between Numbers of Available SARS-CoV-2 Genomes and Human Development Indexes at Country Scales. Viruses. 2021; 13(5):775. https://0-doi-org.brum.beds.ac.uk/10.3390/v13050775
Chicago/Turabian StyleColson, Philippe, and Didier Raoult. 2021. "Global Discrepancies between Numbers of Available SARS-CoV-2 Genomes and Human Development Indexes at Country Scales" Viruses 13, no. 5: 775. https://0-doi-org.brum.beds.ac.uk/10.3390/v13050775
Note that from the first issue of 2016, this journal uses article numbers instead of page numbers. See further details here.