
Cell Population Data and Serum Polyclonal Immunoglobulin Free Light Chains in the Assessment of COVID-19 Severity

 ,
,
Abstract
:1. Introduction
2. Materials and Methods
3. Results
4. Discussion
5. Conclusions
Author Contributions
Funding
Institutional Review Board Statement
Informed Consent Statement
Data Availability Statement
Conflicts of Interest
References
- Formica, V.; Minieri, M.; Bernardini, S.; Ciotti, M.; D’Agostini, C.; Roselli, M.; Andreoni, M.; Morelli, C.; Parisi, G.; Federici, M.; et al. Complete blood count might help to identify subjects with high probability of testing positive to SARS-CoV-2. Clin. Med. 2020, 20, e114–e119. [Google Scholar] [CrossRef] [PubMed]
- Zhou, P.; Yang, X.L.; Wang, X.G.; Hu, B.; Zhang, L.; Zhang, W.; Si, H.R.; Zhu, Y.; Li, B.; Huang, C.L.; et al. A pneumonia outbreak associated with a new coronavirus of probable bat origin. Nature 2020, 579, 270–273. [Google Scholar] [CrossRef] [PubMed] [Green Version]
- Slomka, A.; Kowalewski, M.; Zekanowska, E. Coronavirus disease 2019 (COVID-19): A Short review on hematological manifestations. Pathogens 2020, 9, 493. [Google Scholar] [CrossRef]
- Lu, R.; Zhao, X.; Li, J.; Niu, P.; Yang, B.; Wu, H.; Wang, W.; Song, H.; Huang, B.; Zhu, N.; et al. Genomic characterisation and epidemiology of 2019 novel coronavirus: Implications for virus origins and receptor binding. Lancet 2020, 395, 565–574. [Google Scholar] [CrossRef] [Green Version]
- Nazarullah, A.; Liang, C.; Villarreal, A.; Higgins, R.A.; Mais, D.D. Peripheral blood examination findings in SARS-CoV-2 infection. Am. J. Clin. Pathol. 2020, 154, 319–329. [Google Scholar] [CrossRef]
- Terpos, E.; Ntanasis-Stathopoulos, I.; Elalamy, I.; Kastritis, E.; Sergentanis, T.N.; Politou, M.; Psaltopoulou, T.; Gerotziafas, G.; Dimopoulos, M.A. Hematological findings and complications of COVID-19. Am. J. Hematol. 2020, 95, 834–847. [Google Scholar] [CrossRef] [PubMed] [Green Version]
- Singh, S.; Sharma, A.; Arora, S.K. High producer haplotype (CAG) of -863C/A, -308G/A and -238G/A polymorphisms in the promoter region of TNF-alpha gene associate with enhanced apoptosis of lymphocytes in HIV-1 subtype C infected individuals from North India. PLoS ONE 2014, 9, e98020. [Google Scholar] [CrossRef]
- Liao, Y.C.; Liang, W.G.; Chen, F.W.; Hsu, J.H.; Yang, J.J.; Chang, M.S. IL-19 induces production of IL-6 and TNF-alpha and results in cell apoptosis through TNF-alpha. J. Immunol. 2002, 169, 4288–4297. [Google Scholar] [CrossRef] [Green Version]
- Han, H.; Yang, L.; Liu, R.; Liu, F.; Wu, K.L.; Li, J.; Liu, X.H.; Zhu, C.L. Prominent changes in blood coagulation of patients with SARS-CoV-2 infection. Clin. Chem. Lab. Med. 2020, 58, 1116–1120. [Google Scholar] [CrossRef] [Green Version]
- Chng, W.J.; Lai, H.C.; Earnest, A.; Kuperan, P. Haematological parameters in severe acute respiratory syndrome. Clin. Lab. Haematol 2005, 27, 15–20. [Google Scholar] [CrossRef]
- Mousavi, S.A.; Rad, S.; Rostami, T.; Rostami, M.; Mousavi, S.A.; Mirhoseini, S.A.; Kiumarsi, A. Hematologic predictors of mortality in hospitalized patients with COVID-19: A comparative study. Hematology 2020, 25, 383–388. [Google Scholar] [CrossRef]
- Zeng, F.; Li, L.; Zeng, J.; Deng, Y.; Huang, H.; Chen, B.; Deng, G. Can we predict the severity of coronavirus disease 2019 with a routine blood test? Pol. Arch. Intern. Med. 2020, 130, 400–406. [Google Scholar] [CrossRef]
- Mu, T.; Yi, Z.; Wang, M.; Wang, J.; Zhang, C.; Chen, H.; Bai, M.; Jiang, L.; Zhang, Y. Expression of eosinophil in peripheral blood of patients with COVID-19 and its clinical significance. J. Clin. Lab. Anal. 2021, 35, e23620. [Google Scholar] [CrossRef]
- Lagunas-Rangel, F.A. Neutrophil-to-lymphocyte ratio and lymphocyte-to-C-reactive protein ratio in patients with severe coronavirus disease 2019 (COVID-19): A meta-analysis. J. Med. Virol. 2020, 92, 1733–1734. [Google Scholar] [CrossRef] [Green Version]
- Xie, G.; Ding, F.; Han, L.; Yin, D.; Lu, H.; Zhang, M. The role of peripheral blood eosinophil counts in COVID-19 patients. Allergy 2021, 76, 471–482. [Google Scholar] [CrossRef]
- Yan, B.; Yang, J.; Xie, Y.; Tang, X. Relationship between blood eosinophil levels and COVID-19 mortality. World Allergy Organ. J. 2021, 14, 100521. [Google Scholar] [CrossRef]
- Mateos Gonzalez, M.; Sierra Gonzalo, E.; Casado Lopez, I.; Arnalich Fernandez, F.; Beato Perez, J.L.; Monge Monge, D.; Vargas Nunez, J.A.; Garcia Fenoll, R.; Suarez Fernandez, C.; Freire Castro, S.J.; et al. The prognostic value of eosinophil recovery in COVID-19: A multicentre, retrospective cohort study on patients hospitalised in Spanish hospitals. J. Clin. Med. 2021, 10, 305. [Google Scholar] [CrossRef]
- Mao, J.; Dai, R.; Du, R.C.; Zhu, Y.; Shui, L.P.; Luo, X.H. Hematologic changes predict clinical outcome in recovered patients with COVID-19. Ann. Hematol. 2021, 100, 675–689. [Google Scholar] [CrossRef]
- Martens, R.J.H.; van Adrichem, A.J.; Mattheij, N.J.A.; Brouwer, C.G.; van Twist, D.J.L.; Broerse, J.; Magro-Checa, C.; van Dongen, C.M.P.; Mostard, R.L.M.; Ramiro, S.; et al. Hemocytometric characteristics of COVID-19 patients with and without cytokine Storm syndrome on the Sysmex XN-10 hematology analyzer. Clin. Chem. Lab. Med. 2020. [Google Scholar] [CrossRef]
- Urrechaga, E.; Aguirre, U.; Espana, P.P.; Garcia de Guadiana, L. Complete blood counts and cell population data from Sysmex XN analyser in the detection of SARS-CoV-2 infection. Clin. Chem. Lab. Med. 2020, 59, e57–e60. [Google Scholar] [CrossRef]
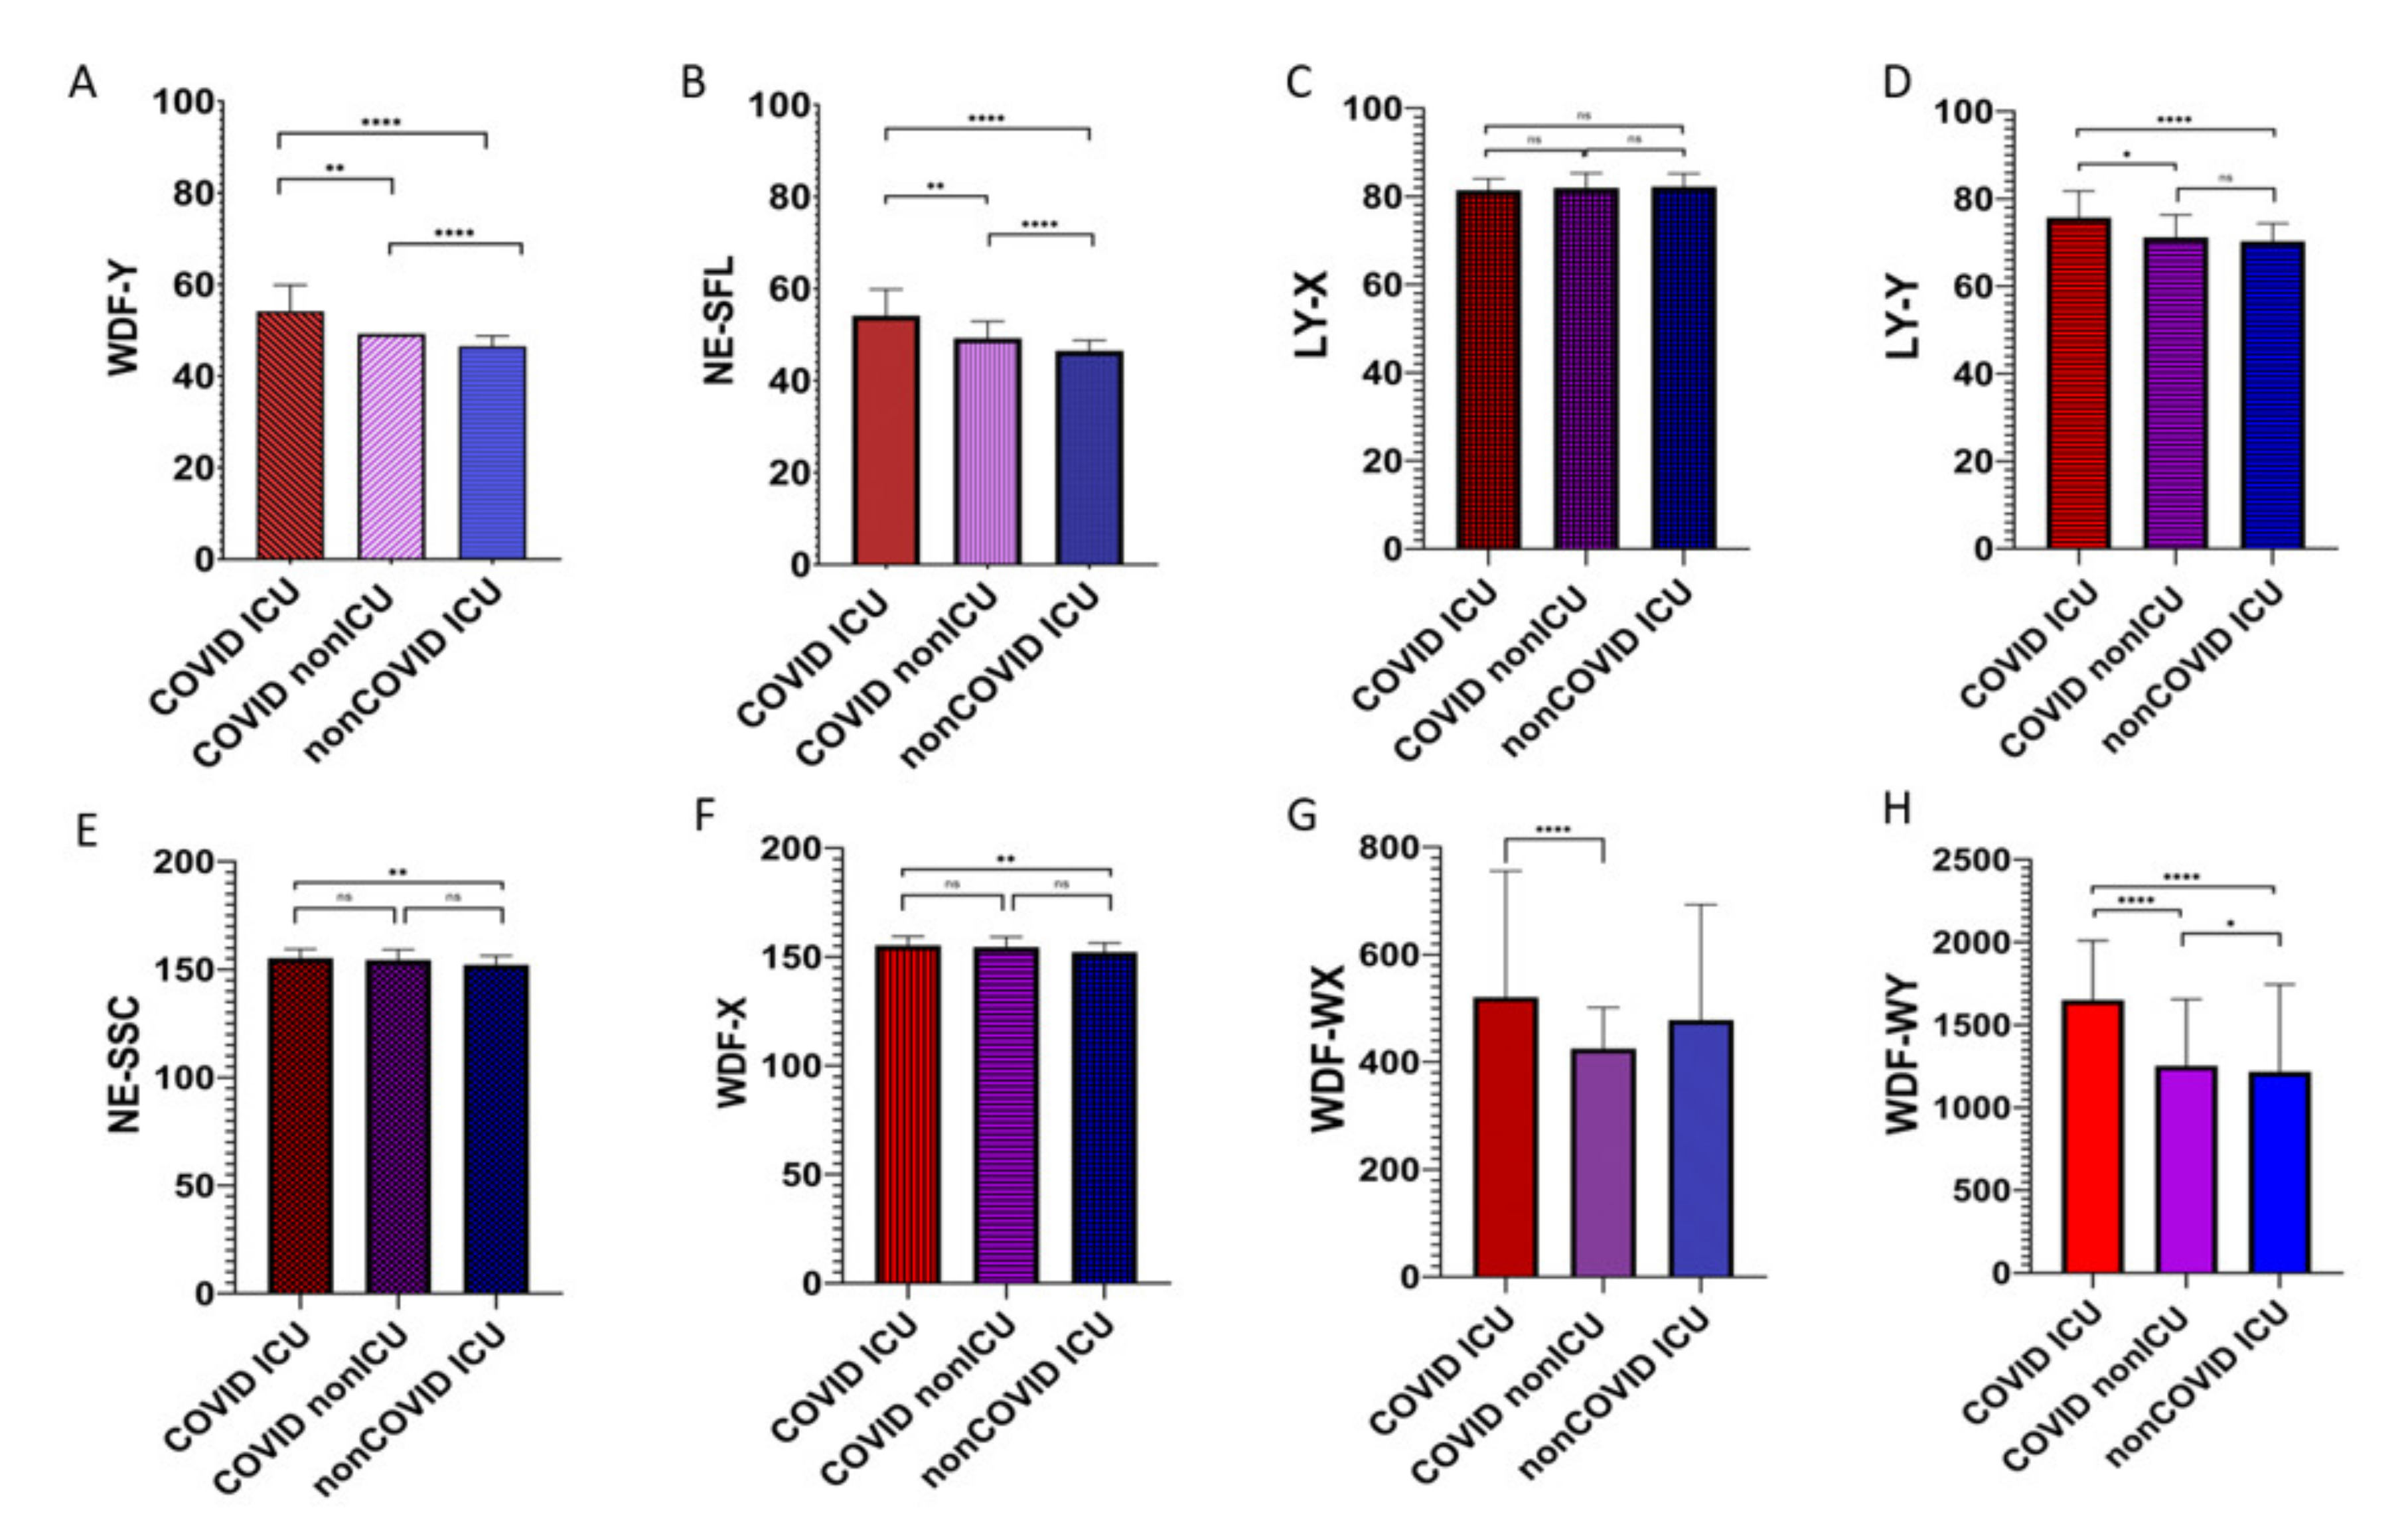
- Park, S.H.; Park, C.J.; Lee, B.R.; Nam, K.S.; Kim, M.J.; Han, M.Y.; Kim, Y.J.; Cho, Y.U.; Jang, S. Sepsis affects most routine and cell population data (CPD) obtained using the Sysmex XN-2000 blood cell analyzer: Neutrophil-related CPD NE-SFL and NE-WY provide useful information for detecting sepsis. Int. J. Lab. Hematol. 2015, 37, 190–198. [Google Scholar] [CrossRef]
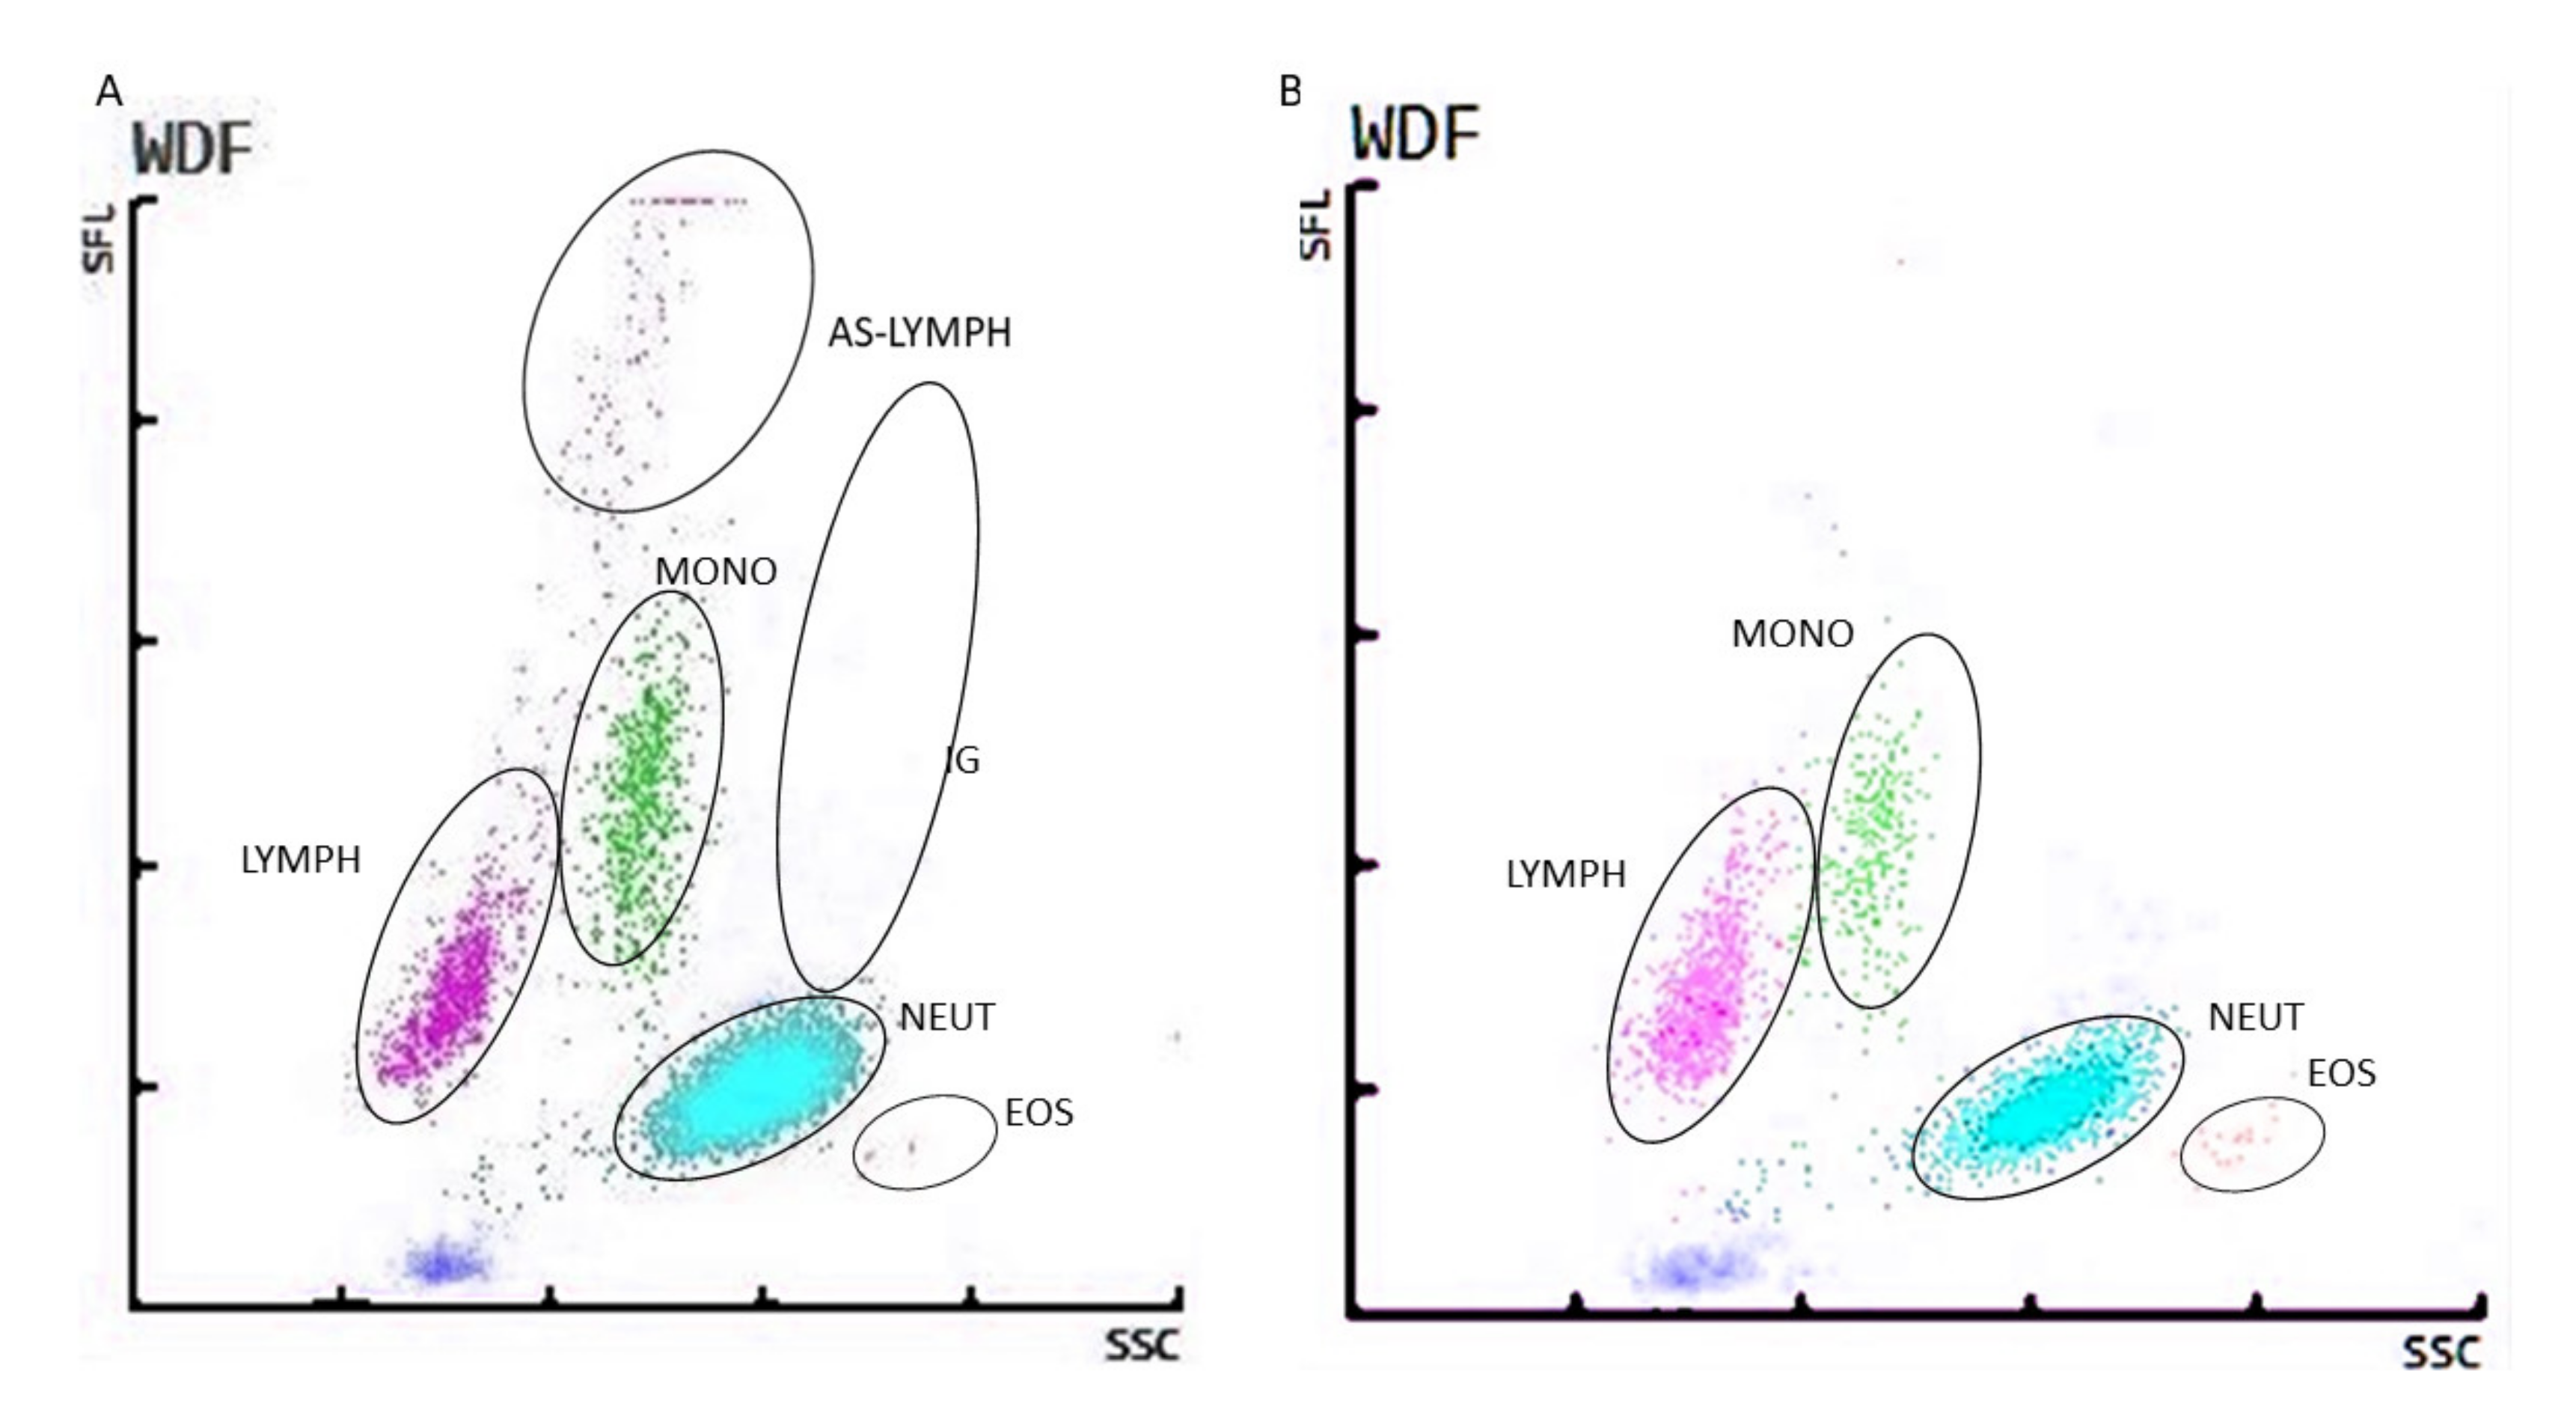
- Osman, J.; Lambert, J.; Temple, M.; Devaux, F.; Favre, R.; Flaujac, C.; Bridoux, D.; Marque-Juillet, S.; Bruneel, F.; Mignon, F.; et al. Rapid screening of COVID-19 patients using white blood cell scattergrams, a study on 381 patients. Br. J. Haematol. 2020, 190, 718–722. [Google Scholar] [CrossRef]
- Foldes, D.; Hinton, R.; Arami, S.; Bain, B.J. Plasmacytoid lymphocytes in SARS-CoV-2 infection (Covid-19). Am. J. Hematol. 2020, 95, 861–862. [Google Scholar] [CrossRef]
- Cantu, M.D.; Towne, W.S.; Emmons, F.N.; Mostyka, M.; Borczuk, A.; Salvatore, S.P.; Yang, H.S.; Zhao, Z.; Vasovic, L.V.; Racine-Brzostek, S.E. Clinical significance of blue-green neutrophil and monocyte cytoplasmic inclusions in SARS-CoV-2 positive critically ill patients. Br. J. Haematol. 2020, 190, e89–e92. [Google Scholar] [CrossRef]
- Mitra, A.; Dwyre, D.M.; Schivo, M.; Thompson, G.R., 3rd; Cohen, S.H.; Ku, N.; Graff, J.P. Leukoerythroblastic reaction in a patient with COVID-19 infection. Am. J. Hematol. 2020, 95, 999–1000. [Google Scholar] [CrossRef] [Green Version]
- Ali, N. Elevated level of C-reactive protein may be an early marker to predict risk for severity of COVID-19. J. Med. Virol. 2020, 92, 2409–2411. [Google Scholar] [CrossRef]
- Katzmann, J.A.; Clark, R.J.; Abraham, R.S.; Bryant, S.; Lymp, J.F.; Bradwell, A.R.; Kyle, R.A. Serum reference intervals and diagnostic ranges for free kappa and free lambda immunoglobulin light chains: Relative sensitivity for detection of monoclonal light chains. Clin. Chem. 2002, 48, 1437–1444. [Google Scholar] [CrossRef] [Green Version]
- Gudowska-Sawczuk, M.; Mroczko, B. Free light chains as a novel diagnostic biomarker of immune system abnormalities in multiple sclerosis and HIV infection. Biomed. Res. Int. 2019, 2019, 8382132. [Google Scholar] [CrossRef]
- Brebner, J.A.; Stockley, R.A. Polyclonal free light chains: A biomarker of inflammatory disease or treatment target? F1000 Med. Rep. 2013, 5, 4. [Google Scholar] [CrossRef]
- Aggarwal, R.; Sequeira, W.; Kokebie, R.; Mikolaitis, R.A.; Fogg, L.; Finnegan, A.; Plaas, A.; Block, J.A.; Jolly, M. Serum free light chains as biomarkers for systemic lupus erythematosus disease activity. Arthritis Care Res. 2011, 63, 891–898. [Google Scholar] [CrossRef]
- Gottenberg, J.E.; Aucouturier, F.; Goetz, J.; Sordet, C.; Jahn, I.; Busson, M.; Cayuela, J.M.; Sibilia, J.; Mariette, X. Serum immunoglobulin free light chain assessment in rheumatoid arthritis and primary Sjogren’s syndrome. Ann. Rheum Dis 2007, 66, 23–27. [Google Scholar] [CrossRef] [Green Version]
- Bettacchioli, E.; Le Gaffric, C.; Mazeas, M.; Borghi, M.O.; Frostegard, J.; Barturen, G.; Makowska, Z.; Babei, S.; Lesche, R.; Meroni, P.L.; et al. An elevated polyclonal free light chain level reflects a strong interferon signature in patients with systemic autoimmune diseases. J. Transl. Autoimmun. 2021, 4, 100090. [Google Scholar] [CrossRef]
- Oliveira, I.S.; Cabral, M.S.; Jesus, L.S.; Parana, R.; Atta, A.M.; Sousa Atta, M.L. Serum levels of immunoglobulin free light chains in patients with chronic hepatitis C presenting cryoglobulinemia. Braz. J. Infect. Dis. 2014, 18, 638–642. [Google Scholar] [CrossRef] [Green Version]
- Caponi, L.; Romiti, N.; Koni, E.; Fiore, A.D.; Paolicchi, A.; Franzini, M. Inter-assay variability in automated serum free light chain assays and their use in the clinical laboratory. Crit. Rev. Clin. Lab. Sci. 2020, 57, 73–85. [Google Scholar] [CrossRef]
- Shepherd, L.; Borges, A.H.; Harvey, R.; Bower, M.; Grulich, A.; Silverberg, M.; Weber, J.; Ristola, M.; Viard, J.P.; Bogner, J.R.; et al. The extent of B-cell activation and dysfunction preceding lymphoma development in HIV-positive people. HIV Med. 2018, 19, 90–101. [Google Scholar] [CrossRef]
- Kumar, S.; Larson, D.R.; Dispenzieri, A.; Therneau, T.M.; Murray, D.L.; Leif Bergsagel, P.; Kyle, R.A.; Vincent Rajkumar, S. Polyclonal serum free light chain elevation is associated with increased risk of monoclonal gammopathies. Blood Cancer J. 2019, 9, 49. [Google Scholar] [CrossRef]
- Kadhim, A.S.; Abdullah, Y.J. Serum levels of interleukin-6, ferritin, C-reactive protein, lactate dehydrogenase, D-dimer, and count of lymphocytes and neutrophils in COVID-19 patients: Its correlation to the disease severity. Biomed. Biotechnol. Res. J. 2021, 5, 69–73. [Google Scholar] [CrossRef]
- Sabaka, P.; Koščálová, A.; Straka, I.; Hodosy, J.; Lipták, R.; Kmotorková, B.; Kušnírová, A.; Kachlíková, M. Role of interleukin 6 as a predictive factor for a severe course of Covid-19: Retrospective data analysis of patients from a long-term care facility during Covid-19 outbreak. BMC Infect. Dis. 2021, 21, 308. [Google Scholar] [CrossRef]
- Yazdanpanah, P.; Vafaei, F.; Javdansirat, S.; Afrouz, S. Diagnosis of Coronavirus disease by measuring serum concentrations of IL-6 and blood Ferritin, 15 September 2020, PREPRINT (Version 1). Available online: https://www.researchsquare.com/article/rs-74750/v1 (accessed on 27 June 2021).
- Broman, N.; Rantasärkkä, K.; Feuth, T.; Valtonen, M.; Waris, M.; Hohenthal, U.; Rintala, E.; Karlsson, A.; Marttila, H.; Peltola, V.; et al. IL-6 and other biomarkers as predictors of severity in COVID-19. Ann. Med. 2021, 53, 410–412. [Google Scholar] [CrossRef]
- Santa Cruz, A.; Mendes-Frias, A.; Oliveira, A.I.; Dias, L.; Matos, A.R.; Carvalho, A.; Capela, C.; Pedrosa, J.; Castro, A.G.; Silvestre, R. Interleukin-6 is a biomarker for the development of fatal severe acute respiratory syndrome coronavirus 2 pneumonia. Front. Immunol. 2021, 12, 613422. [Google Scholar] [CrossRef]
- Zhang, J.; Hao, Y.; Ou, W.; Ming, F.; Liang, G.; Qian, Y.; Wei, S.; Cai, Q.; Dong, S.; Hu, S. Serum interleukin-6 is an indicator for severity in 901 patients with SARS-CoV-2 infection: A cohort study. J. Transl. Med. 2020, 18, 406. [Google Scholar] [CrossRef]


| COVID-19 Patients Hospitalized in the Intensive Care Unit | COVID-19 Patients Hospitalized in the other Units | Non-COVID-19 Patients Hospitalized in the Intensive Care Unit | |||
|---|---|---|---|---|---|
| Parameter | SI Units | Mean | Mean | Mean | p-Value |
| WBC (n = 735) | (109/L) | 11.42 (10.42–12.41) | 9.18 (8.23–10.13) | 7.64 (7.18–8.15) | p1 < 0.0001 p2 < 0.0001 p3 < 0.0001 |
| NEUT (n = 735) | (109/L) | 8.97 (7.96–9.94) | 6.31 (5.55–7.02) | 4.68 (4.24–5.16) | p1 <0.0001 p2 < 0.0001 p3 < 0.0001 |
| NEUT (n = 735) | (%) | 73.0 (71.0–75.0) | 66.96 (64.6–69.4) | 57.3 (55.3–59.1) | p1 < 0.0001 p2 < 0.0001 p3 < 0.0001 |
| LYMPH (n = 735) | (109/L) | 1.33 (1.21–1.45) | 1.60 (1.43–1.86) | 1.95 (1.79–2.11) | p1 <0.0001 p2 < 0.0001 p3 < 0.0001 |
| LYMPH (n = 735) | (%) | 15.40 (13.80–16.90) | 19.61 (17.78–21.43) | 28.5 (26.83–30.12) | p1 < 0.0001 p2 < 0.0001 p3 < 0.0217 |
| MONO (n = 735) | (109/L) | 0.85 (0.71–0.99) | 0.91 (0.69–1.13) | 0.71 (0.66–0.76) | p1 < 0.0001 p2 < 0.0001 p3 < 0.0001 |
| MONO (n = 735) | (%) | 7.9 (7.3–8.6) | 9.4 (8.5–10.3) | 9.9 (8.5–10.3) | p1 = 0.0001 p2 = 0.0001 p3 = 0.0001 |
| EOS (n = 735) | (109/L) | 0.10 (0.07–0.12) | 0.12 (0.09–0.15) | 0.20 (0.16–0.23) | p1 < 0.0001 p2 < 0.0001 p3 < 0.0001 |
| EOS (n = 735) | (%) | 1.20 (0.88–1.46) | 1.49 (1.12–1.87) | 2.8 (2.35–3.17) | p1 < 0.0001 p2 < 0.0001 p3 < 0.0001 |
| BASO (n = 735) | (109/L) | 0.04 (0.03–0.05) | 0.07 (0.06–0.22) | 0.04 (0.02–0.04) | p1 < 0.0001 p2 < 0.0001 p3 < 0.0001 |
| BASO (n = 735) | (%) | 0.3 (0.3–0.4) | 0.9 (0.9–2.5) | 0.6 (0.6–0.7) | p1 < 0.0001 p2 < 0.0001 p3 < 0.0001 |
| IG (n = 735) | (109/L) | 0.3 (0.2–0.4) | 0.2 (0.1–0.4) | 0.1 (0.05–0.1) | p1 < 0.0001 p2 < 0.0001 p3 < 0.0001 |
| IG (n = 735) | (%) | 2.0 (1.2–2.8) | 1.70 (1.4–2.0) | 0.9 (0.5–1.3) | p1 < 0.0001 p2 < 0.0001 p3 < 0.0001 |
| NLR (n = 735) | 10.25 (8.85–11.63) | 8.28 (7.13–9.43) | 3.97 (2.78–5.21) | p1 < 0.0001 p2 < 0.0001 p3 = 0.0079 |
| COVID-19 Patients Hospitalized in the Intensive Care Unit | COVID-19 Patients Hospitalized in the other Units | Non-COVID-19 Patients Hospitalized in the Intensive Care Unit | ||
|---|---|---|---|---|
| CRP (n = 735) | Mean (mg/L) | 145.7 | 85.2 | 34.9 |
| 95% CI | 115.9–175.4 | 57.9–112.5 | 24.4–45.5 | |
| p-value | p < 0.001 | p < 0.001 | p < 0.001 | |
| Ferritin (n = 88) | Mean (μg/L) | 2178 | 518.0 | 112.6 |
| 95% CI | 1765 to 2591 | 280.5 to 755.4 | 76.29 to 148.9 | |
| p-value | p < 0.0001 | p < 0.0001 | p < 0.0001 | |
| IL-6 (n = 88) | Mean (pg/mL) | 2203 | 85.15 | 33.52 |
| 95% CI | 1323 to 3083 | 50.72 119.6 | 10.41 to 77.44 | |
| p-value | p < 0.0001 | p < 0.0001 | p < 0.0001 |
| Parameter | COVID-19 Patients Hospitalized in Intensive care Units | COVID-19 Patients Hospitalized in Other Units | p-Value | R2 | ||
|---|---|---|---|---|---|---|
| Mean | 95% CI for the Mean | Mean | 95% CI for the Mean | |||
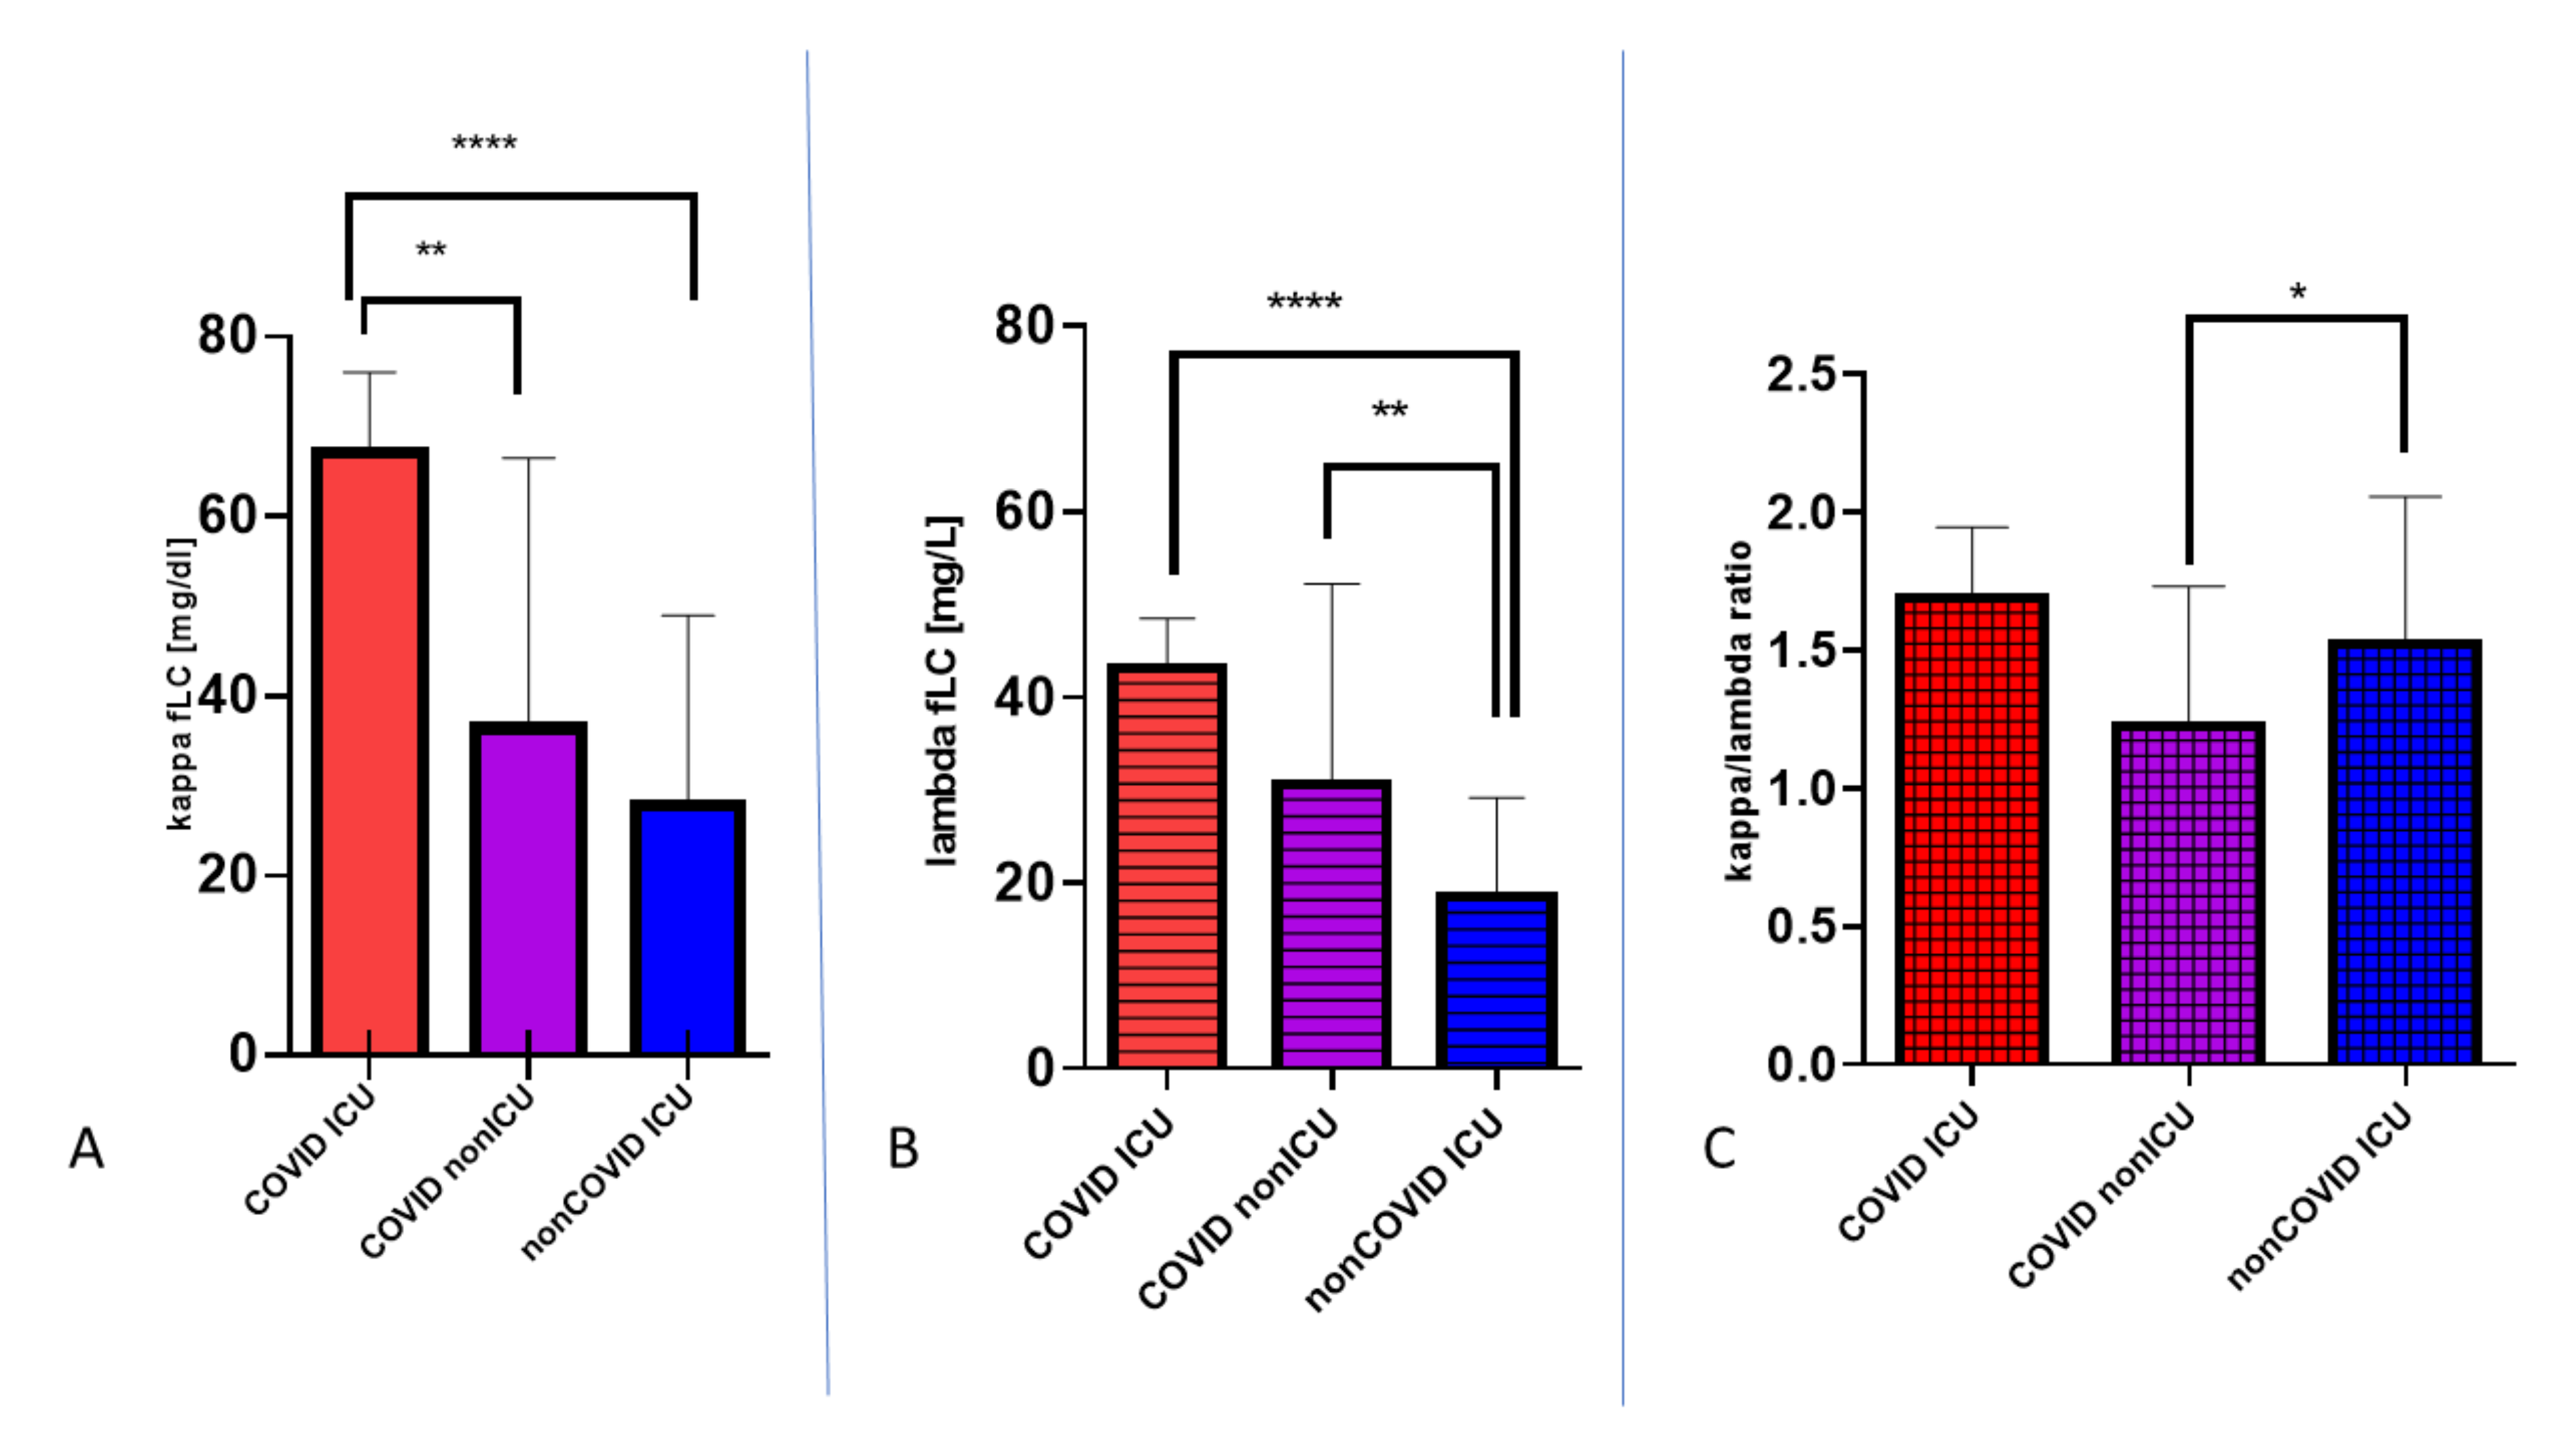
| κ (mg/L) | 47.03 | 43.52 to 64.76 | 24.62 | 21.22 to 36.45 | p1 = 0.0020 p2 < 0.0001 | 0.995 |
| λ (mg/L) | 34.71 | 30.66 to 47.23 | 25.83 | 19.26 to 28.38 | p1 = 0.0167 p2 < 0.001 | 0.984 |
| κ/λ | 1.34 | 1.1990 to 1.5150 | 1.27 | 1.06 to 1.35 | p1 = 0.1108 p2 = 0.4017 | |
| mean of antibody synthesis lymphocytes in manual smear | 6 | 2 |
| Parameter | OR | 95% CI |
|---|---|---|
| κ (mg/L) | 3.0401 | 0.1592 to 58.0000 |
| λ (mg/L) | 0.9956 | 0.9075 to 1.0956 |
| κ/λ | 0.9879 | 0.931 to 1.0482 |
| antibody synthesis lymphocytes | 0.0930 | 0.0091 to 0.9332 |
| κ (mg/L) | λ (mg/L) | κ/λ | CRP (mg/L) | Ferritin (μg/L) | IL-6 (pg/mL) | p-value | R2 | ||
|---|---|---|---|---|---|---|---|---|---|
| COVID ICU | Mean | 47.03 | 34.71 | 1.34 | 147.5 | 2178 | 2203 | p1 < 0.0001 p2 < 0.0001 p3 < 0.0001 | 0.986 0.845 0.978 |
| 95% CI for the mean | 43.52 to 64.76 | 30.66 to 47.23 | 1.20 to 1.52 | 116.0 to 179.0 | 1765 to 2591 | 1323 to 3083 | |||
| COVID non-ICU | Mean | 24.62 | 25.83 | 1.27 | 67.15 | 518.0 | 85.15 | p1 < 0.0005 p2 < 0.0001 p3 < 0.0001 | 0.876 0.990 0.889 |
| 95% CI for the mean | 21.22 to 36.45 | 19.26 to 28.38 | 1.06 to 1.35 | 50.32 to 98.07 | 280.5 to 755.4 | 50.72 119.6 |
Publisher’s Note: MDPI stays neutral with regard to jurisdictional claims in published maps and institutional affiliations. |
© 2021 by the authors. Licensee MDPI, Basel, Switzerland. This article is an open access article distributed under the terms and conditions of the Creative Commons Attribution (CC BY) license (https://creativecommons.org/licenses/by/4.0/).
Share and Cite
Małecka-Giełdowska, M.; Fołta, M.; Wiśniewska, A.; Czyżewska, E.; Ciepiela, O. Cell Population Data and Serum Polyclonal Immunoglobulin Free Light Chains in the Assessment of COVID-19 Severity. Viruses 2021, 13, 1381. https://0-doi-org.brum.beds.ac.uk/10.3390/v13071381
Małecka-Giełdowska M, Fołta M, Wiśniewska A, Czyżewska E, Ciepiela O. Cell Population Data and Serum Polyclonal Immunoglobulin Free Light Chains in the Assessment of COVID-19 Severity. Viruses. 2021; 13(7):1381. https://0-doi-org.brum.beds.ac.uk/10.3390/v13071381
Chicago/Turabian StyleMałecka-Giełdowska, Milena, Maria Fołta, Agnieszka Wiśniewska, Emilia Czyżewska, and Olga Ciepiela. 2021. "Cell Population Data and Serum Polyclonal Immunoglobulin Free Light Chains in the Assessment of COVID-19 Severity" Viruses 13, no. 7: 1381. https://0-doi-org.brum.beds.ac.uk/10.3390/v13071381