Article

Experimental Identification of Backbone Curves of Strongly Nonlinear Systems by Using Response-Controlled Stepped-Sine Testing (RCT)

by
Taylan Karaağaçlı
1,2 and
H. Nevzat Özgüven
2,*
1
The Scientific and Technological Research Council of Turkey, Defense Industries Research and Development Institute, TÜBİTAK-SAGE, P.K. 16, Mamak, Ankara 06261, Turkey
2
Mechanical Engineering Department, Middle East Technical University, Ankara 06800, Turkey
*
Author to whom correspondence should be addressed.
Submission received: 27 July 2020 / Revised: 25 August 2020 / Accepted: 2 September 2020 / Published: 7 September 2020
(This article belongs to the Special Issue Data-Driven Modelling of Nonlinear Dynamic Systems)

Abstract

:
In stepped-sine testing of strongly nonlinear structures with the classical force-control strategy, corrective force perturbations of a standard controller used to capture the reference signal in the proximity of turning points of frequency response curves may often lead to a premature jump before reaching the actual resonance peak. Accordingly, a classical force-control approach is not suitable to identify backbone curves of strongly nonlinear structures. This paper shows that currently available commercial modal test equipment can accurately identify backbone curves of strongly nonlinear structures by using Response-Controlled stepped-sine Testing (RCT) and the Harmonic Force Surface (HFS) concept, both recently proposed by the authors. These methods can be applied to systems where there are many nonlinearities at several different (and even unknown) locations. However, these techniques are not applicable to systems where internal resonances occur. In RCT, the displacement amplitude of the driving point, rather than the amplitude of the applied force, is kept constant during the stepped-sine testing. Spectra of the harmonic excitation force measured at several different displacement amplitude levels are used to build up a smooth HFS. Isocurves of constant amplitude forcing on the HFS lead to constant-force frequency response curves with accurately measured turning points and unstable branches (if there are any), which makes it possible to identify backbone curves of strongly nonlinear structures experimentally. The validation of the proposed approach is demonstrated with numerical and experimental case studies. A five degree-of-freedom (DOF) lumped system with five cubic stiffness elements, which create strong conservative nonlinearity, is used in the numerical example. Experimental case studies consist of a cantilever beam and a control fin actuation mechanism of a real missile structure. The cantilever beam is supported at its free-end by two metal strips constrained at both ends to create strong stiffening nonlinearity. The control fin actuation mechanism exhibits very complex and strong nonlinearity due to backlash and friction.

1. Introduction

By virtue of various advanced techniques developed in the field of linear experimental modal analysis over the last 40 years, the modal survey of aerospace structures, specifically named as ground vibration testing, was established as an industry standard in the new millennium. On the other hand, the increasing competition in the industry to achieve higher performance in aircraft, missiles, and satellites inevitably increased the frequency of occurrence of non-negligible structural nonlinearities in aerospace applications (e.g., References [1,2,3]), which led to a shift of emphasis towards the development of nonlinear system identification techniques in structural dynamics [4,5].
The modal testing of linear structures is accomplished either by using broad band random testing or by using classical force-controlled stepped-sine testing, where the force amplitude is kept constant. Unfortunately, direct implementation of these conventional modal testing techniques to structures that exhibit strong nonlinearity does not give satisfactory results. Random testing, which requires taking many averages to increase the coherence of measured frequency response functions (FRFs), is not suitable for nonlinear system identification because averages do their best to hide nonlinearity, as stated in Reference [
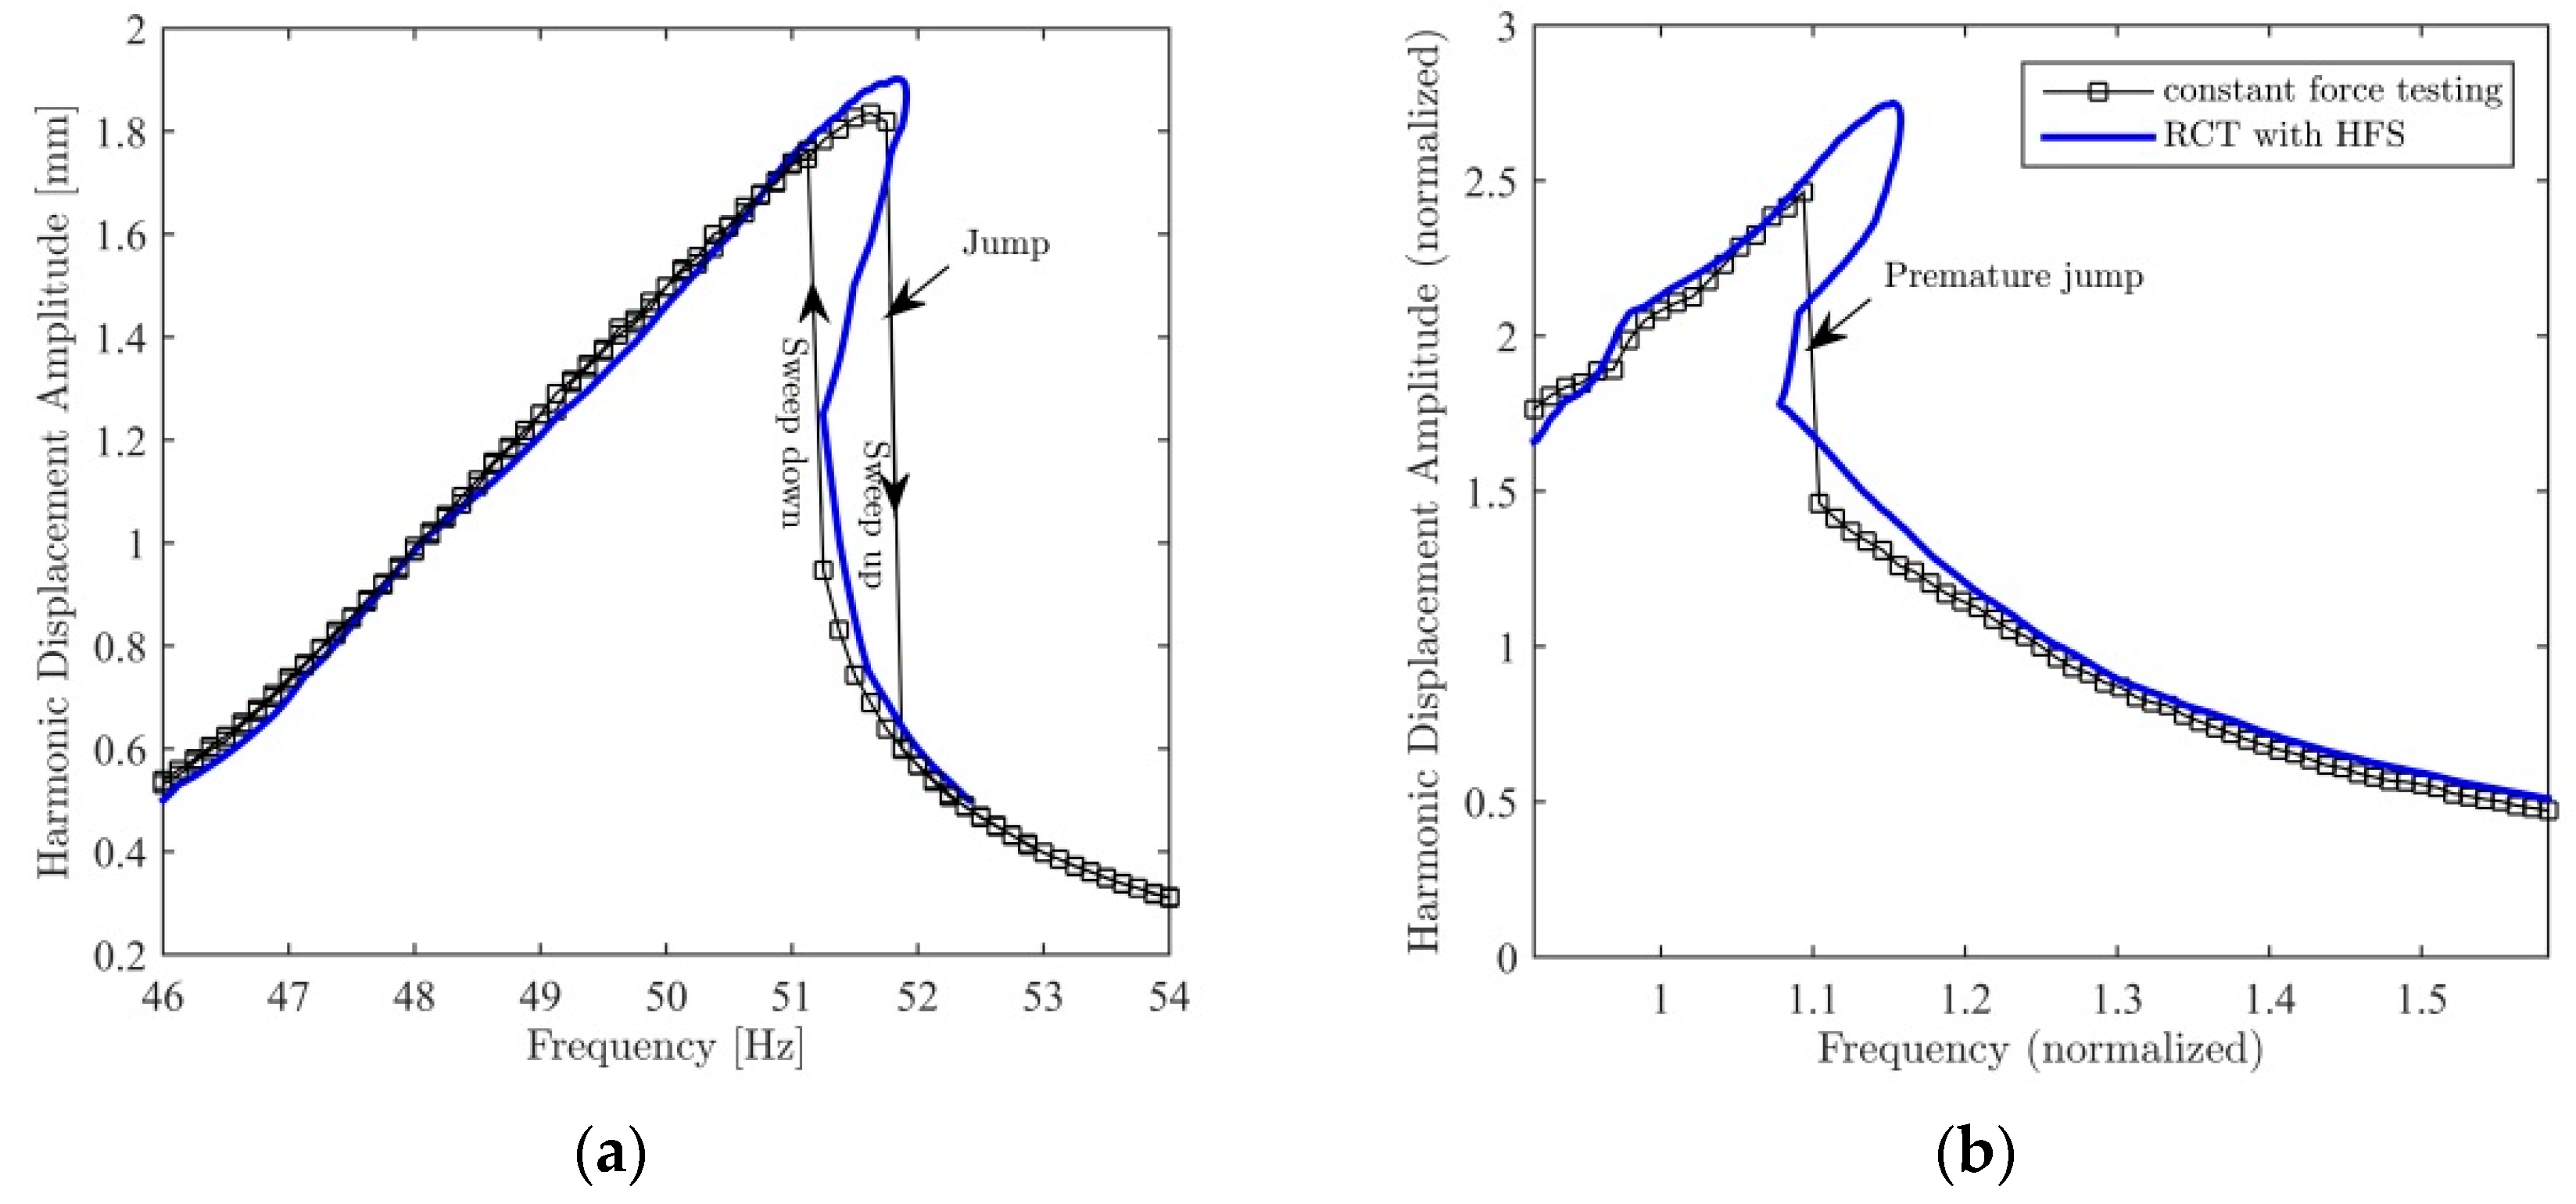
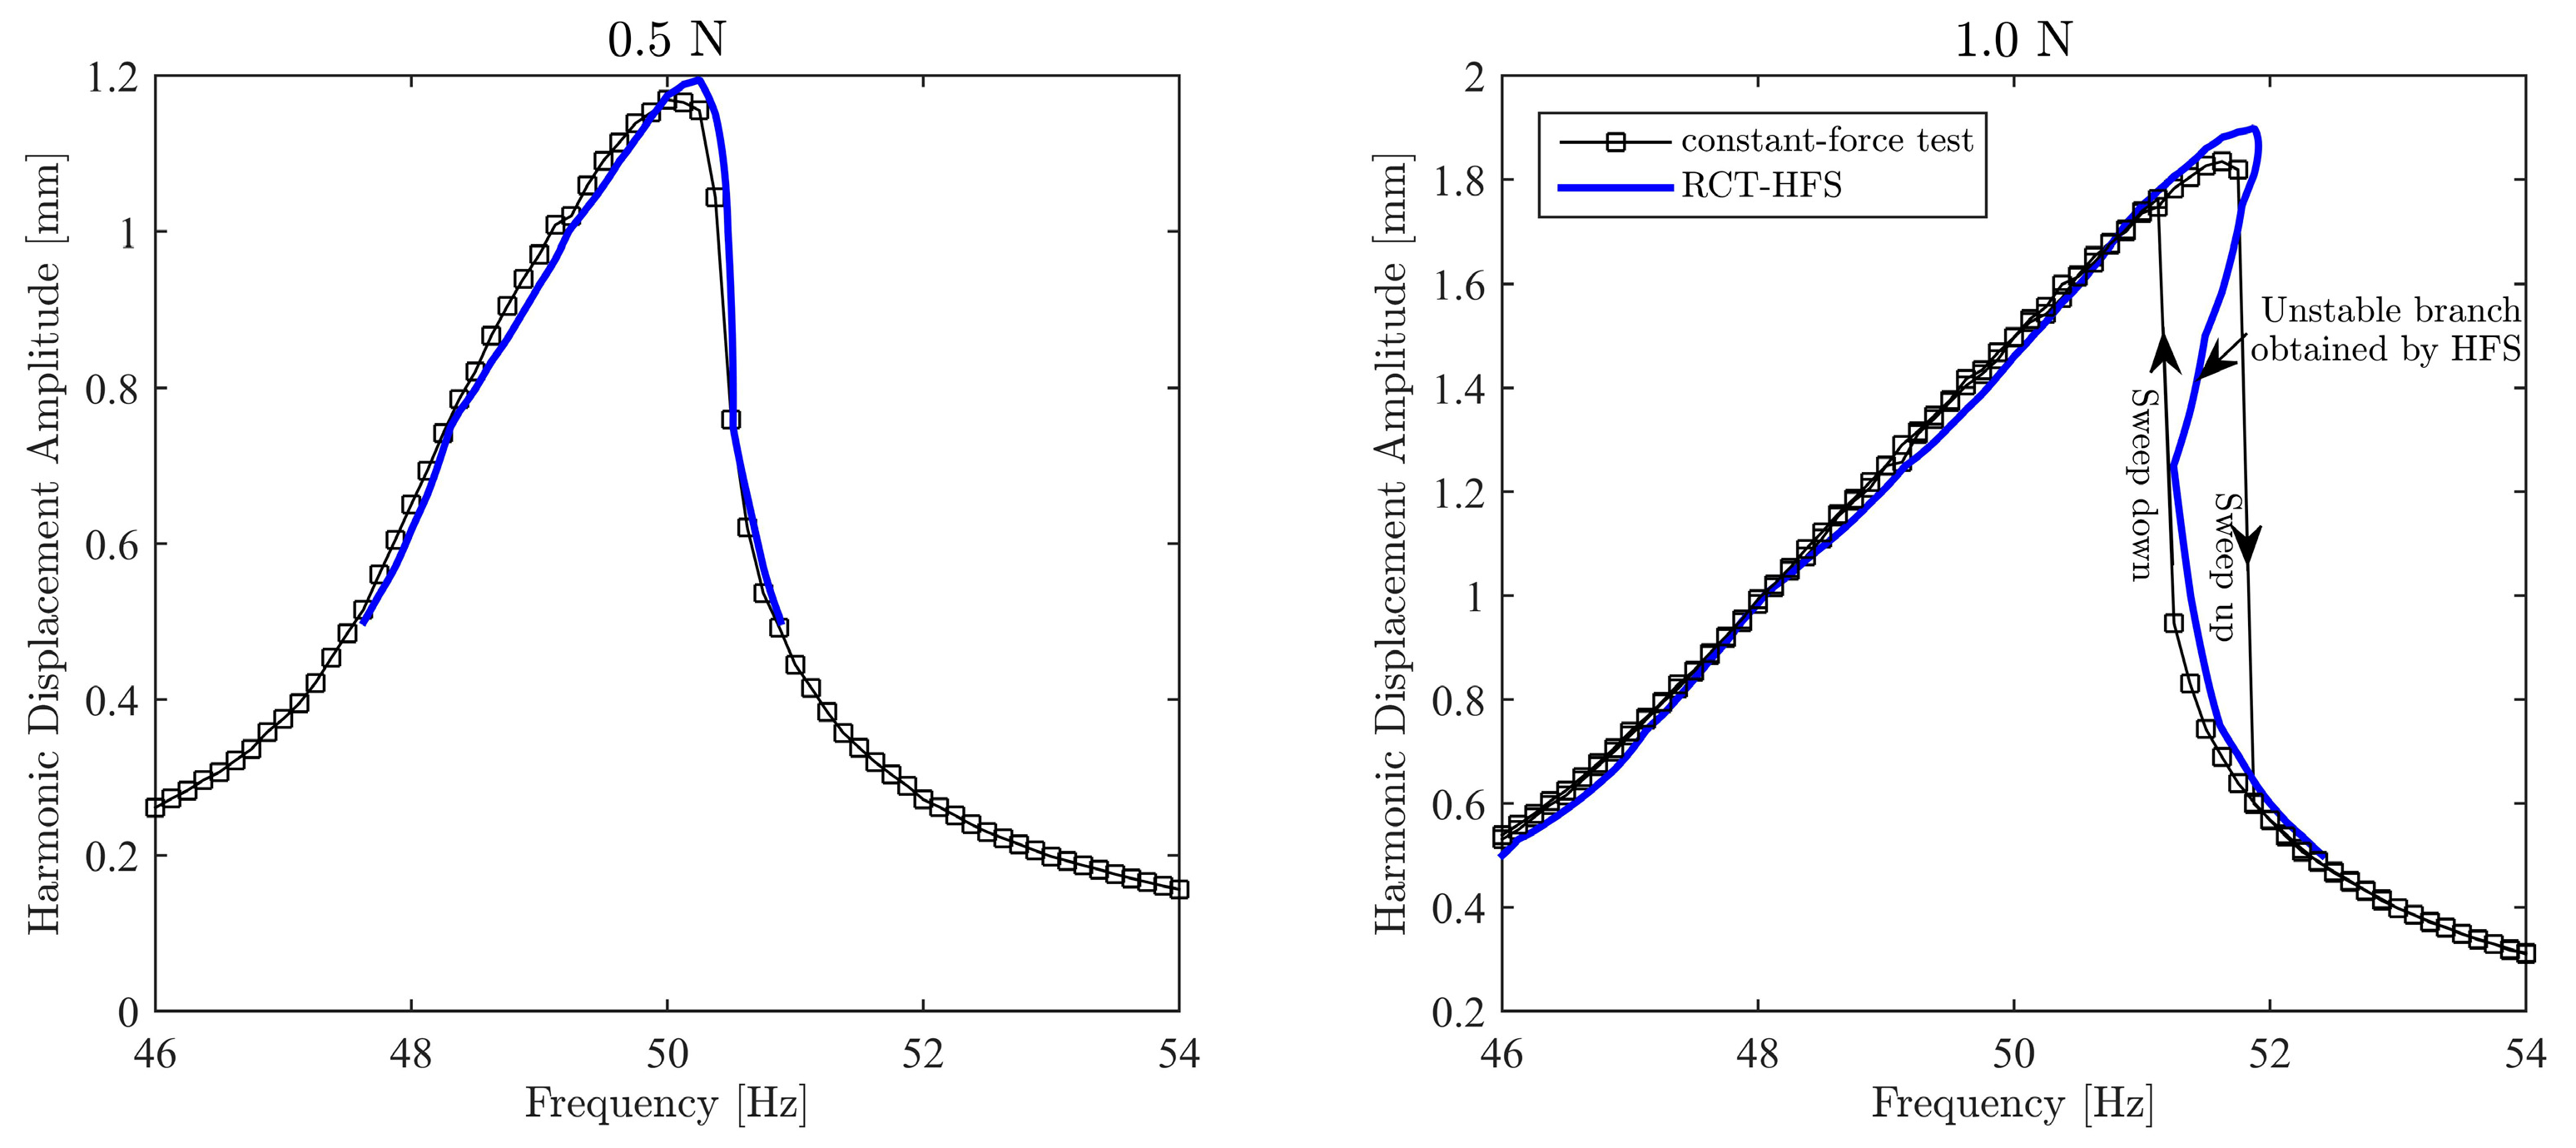
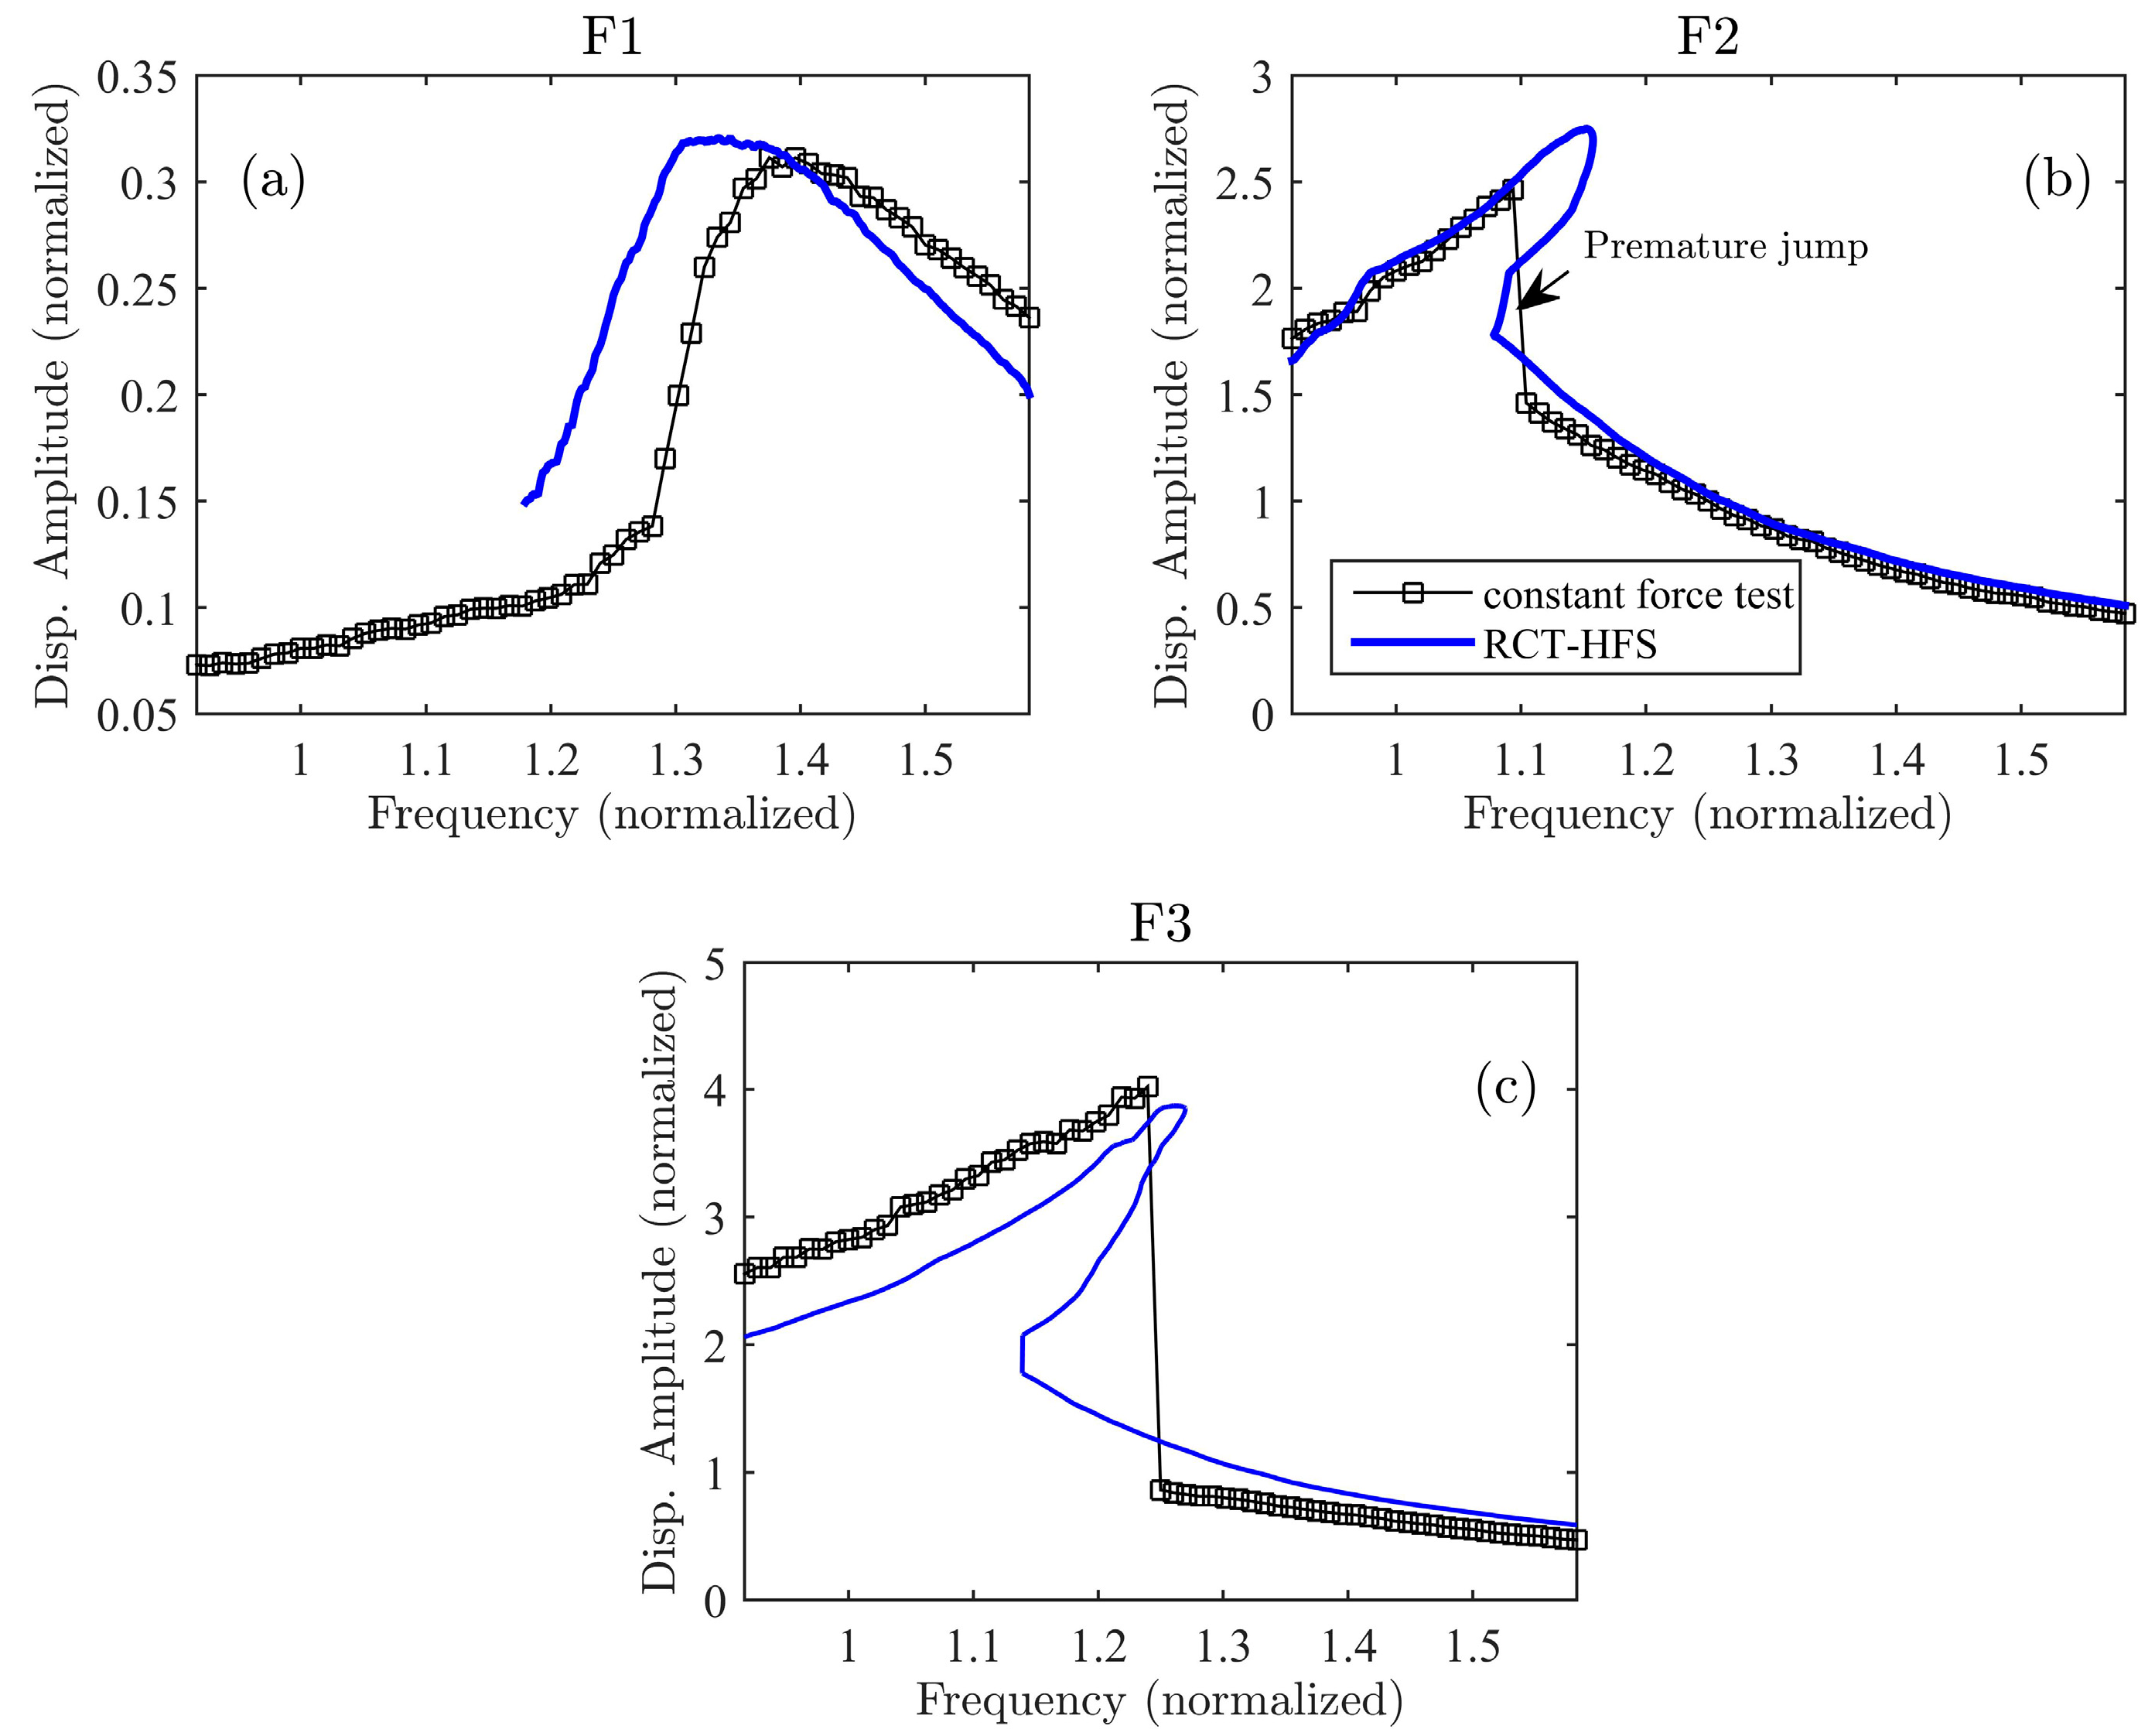
6]. On the other hand, constant-force sine testing often fails to capture turning points and unstable branches of nonlinear frequency response curves. The constant-force test algorithm available in commercial equipment can measure only the stable branches of the nonlinear frequency responses, which requires running multiple sine tests in opposite sweep directions. In the case of standard constant-force sine testing, the controller unavoidably jumps from one stable branch to another, as shown in Figure 1a. Moreover, in some cases, a premature jump may occur, as shown in Figure 1b. Early methods [7,8] attempted to identify amplitude-dependent nonlinear modal parameters by developing curve fitting procedures applicable to measured constant-force FRFs based on the single nonlinear mode theory [9]. However, their applications remained limited to simple benchmark structures due to the computational burden in the case of complex structures and due to the missing frequency response data caused by the jump phenomenon.
Contrary to the early attempts based on phase separation testing mentioned above, most of the techniques proposed in succeeding years were inspired by the phased resonance testing approach. Two interesting approaches based on normal mode force appropriation and on the application of the restoring force surface in modal space were proposed in References [10,11]. Experimental application of the nonlinear resonant decay method proposed in Reference [11] to identify the backbone curve of a single degree-of-freedom oscillator was demonstrated in Reference [12]. Alternatively, the phase lag quadrature criterion was implemented in nonlinear structures in order to isolate a single nonlinear normal mode (NNM) in Reference [13]. In this approach, the NNM appropriation is succeeded by time-frequency analysis of the free-decay response data to determine the frequency-energy dependence of the nonlinear mode of interest. However, an important drawback of this method is the manual tuning of the phase lag between response and excitation, which introduces difficulty in the experiment and requires longer experimentation time. The two recently proposed experimental continuation techniques [14,15] eliminated this drawback by automating the tuning of the phase lag throughout the complete backbone curve. The phase-locked-loop (PLL) control algorithm [14] is capable of tracing out backbone curves and also captures the unstable branches of frequency response curves, if there are any. Similarly, the control-based continuation (CBC) approach [15] relies on phase-quadrature condition to trace out the backbone curve. In CBC, unstable branches of constant-force frequency response curves are obtained by processing S-curves measured at several fixed frequencies by varying the response level. However, these two state-of-the-art techniques cannot utilize commercial modal testing equipment, and although the determination of NNMs and corresponding modal frequencies is straightforward, identification of nonlinear modal damping is still a considerable problem.
As an alternative to these experimental continuation techniques, a systematic approach called Response-Controlled stepped-sine Testing (RCT) was proposed quite recently by the authors of this paper, which constitutes the main step of a new experimental modal analysis method for nonlinear systems [16]. The method can be applied to systems where there are many nonlinearities at several different (and even unknown) locations. However, this technique is not applicable to systems with internal resonances. In other words, the effects of sub- and super-harmonics are assumed to be negligible. In the RCT strategy, the displacement amplitude of the test point (equivalently, the modal amplitude) is kept constant during stepped-sine testing, which leads to quasi-linear FRFs even in the case of strongly nonlinear structures. Accordingly, conventional linear modal analysis techniques can be employed to identify nonlinear modal parameters as functions of modal amplitude. Unmeasured constant-force FRFs, which may even have unstable branches, can then be synthesized by using these modal parameters based on the single nonlinear mode theory [9]. Alternatively, constant-force FRFs can be directly extracted from the measured Harmonic Force Surface (HFS), an innovative concept proposed in Reference [16]. The key feature of the RCT approach is that it simply uses standard equipment, which makes it very attractive especially for industrial applications. Furthermore, the identification of nonlinear modal damping and of mass normalized NNMs is straightforward via applying standard linear modal analysis methods to measured quasi-linear FRFs. The proposed HFS concept was employed as a validation tool for the constant-force FRFs synthesized by using experimentally extracted nonlinear modal parameters. The current paper is a complementary work specifically dedicated to demonstrating the performance of HFS in experimentally identifying backbone curves of strongly nonlinear systems by emphasizing its ability to accurately identify turning points of frequency response curves with unstable branches. It is important to note that in the context of this paper, strong nonlinearity terminology is used to refer to nonlinear systems with overhanging unstable branches in the frequency response curves which result in jump phenomenon in standard constant-force stepped-sine testing. This does not necessarily imply a significant effect of higher harmonics, as illustrated in the numerical and experimental case studies.
The paper is organized as follows. In Section 2, the RCT approach and HFS concept are briefly summarized. 
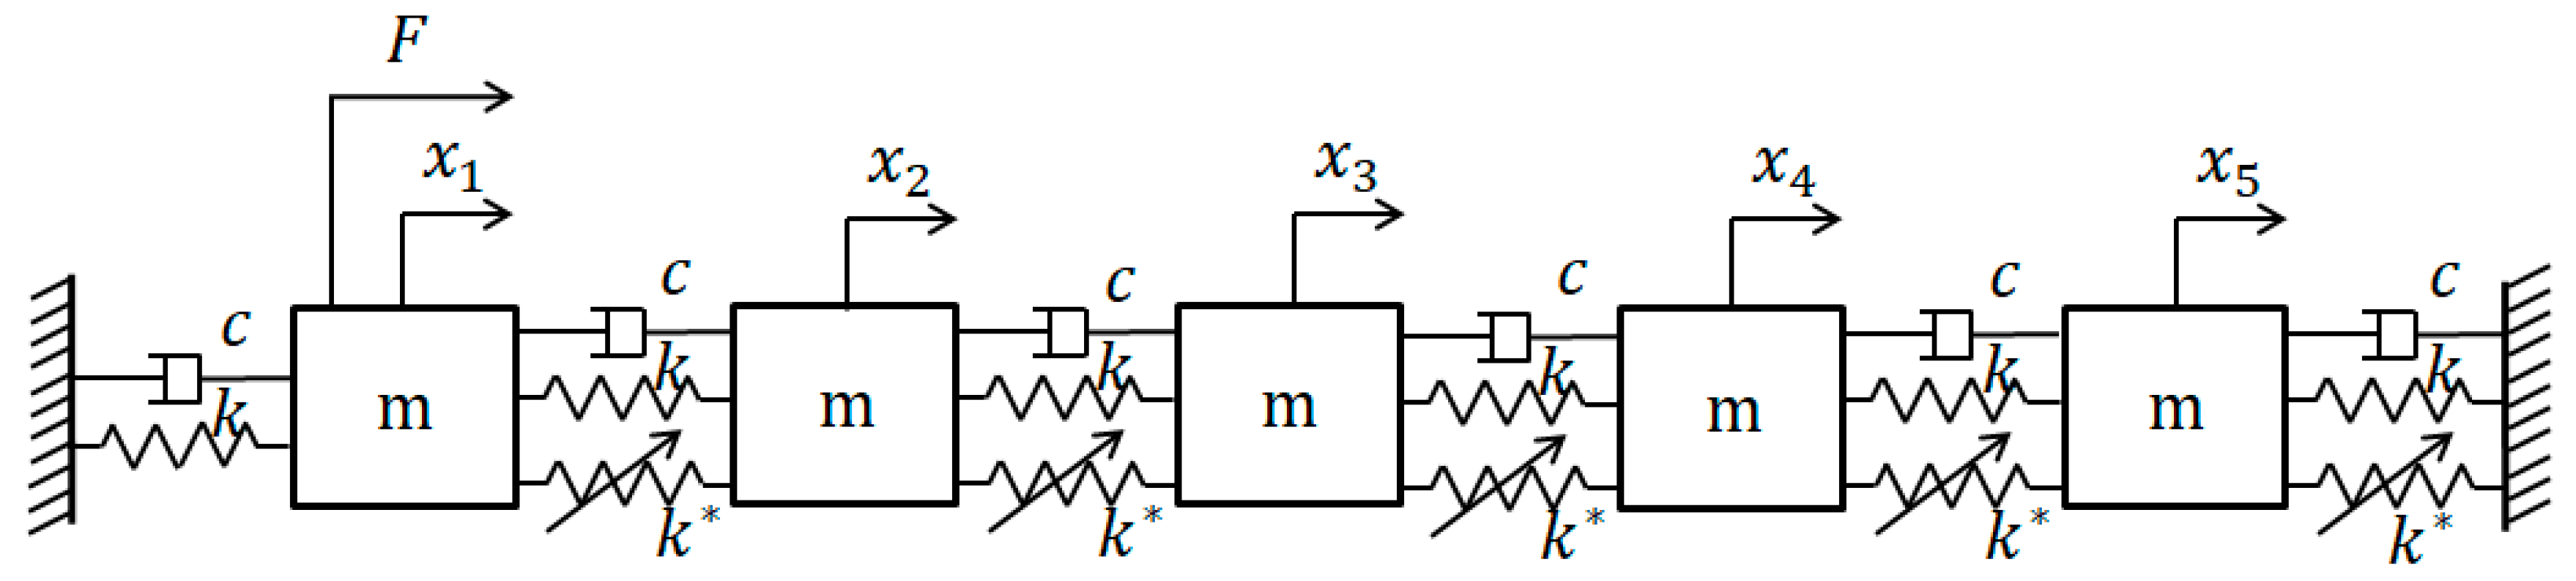
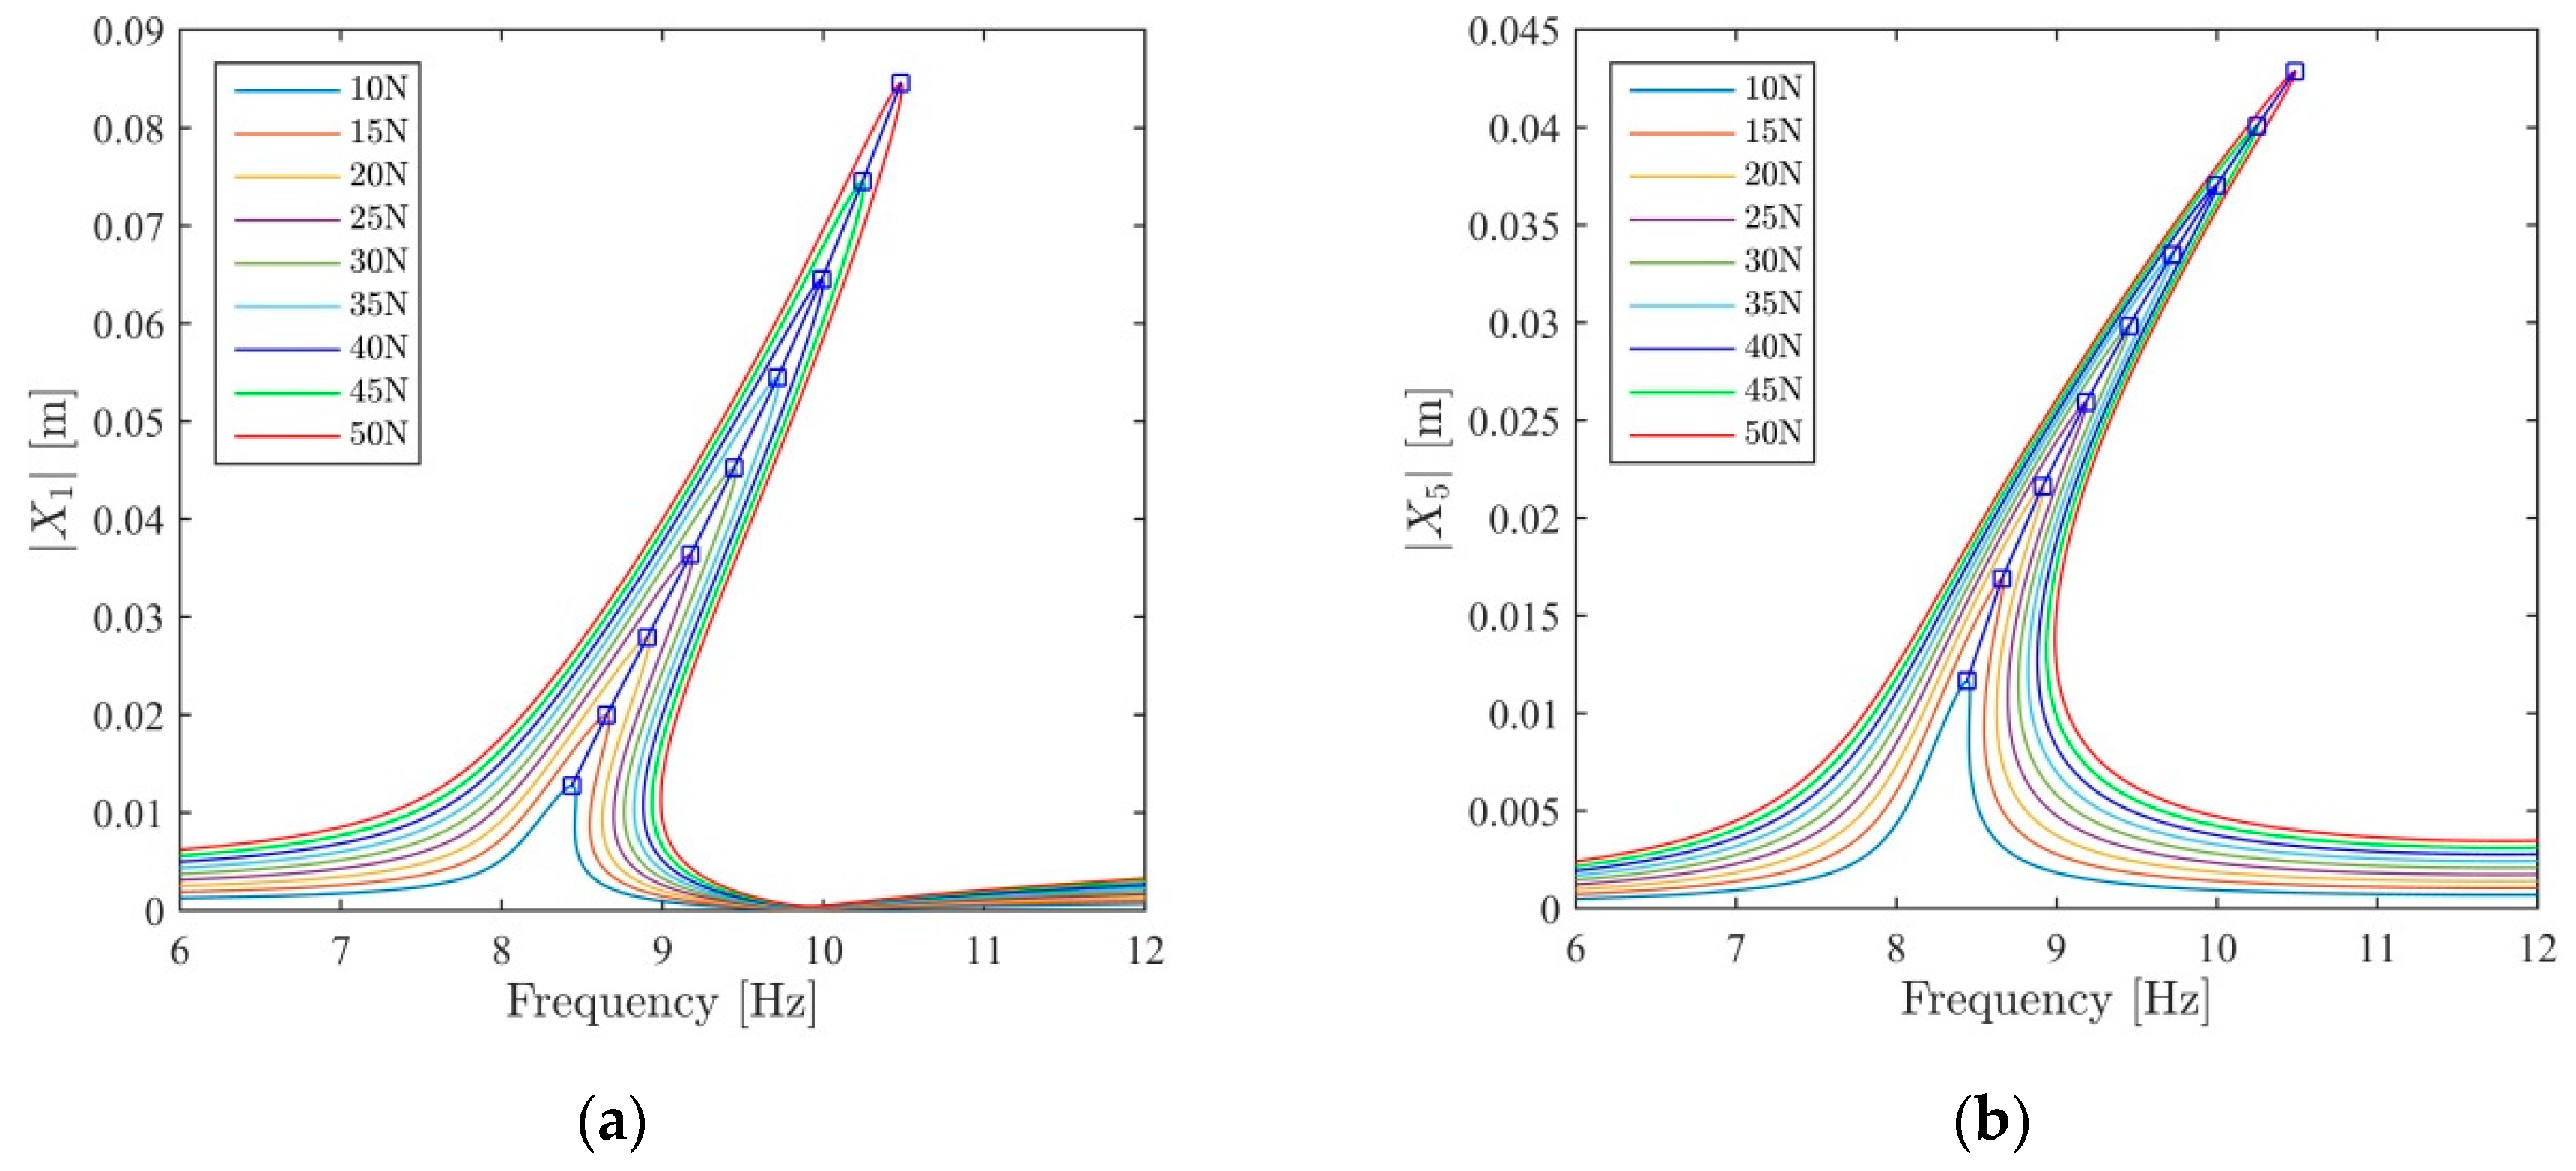
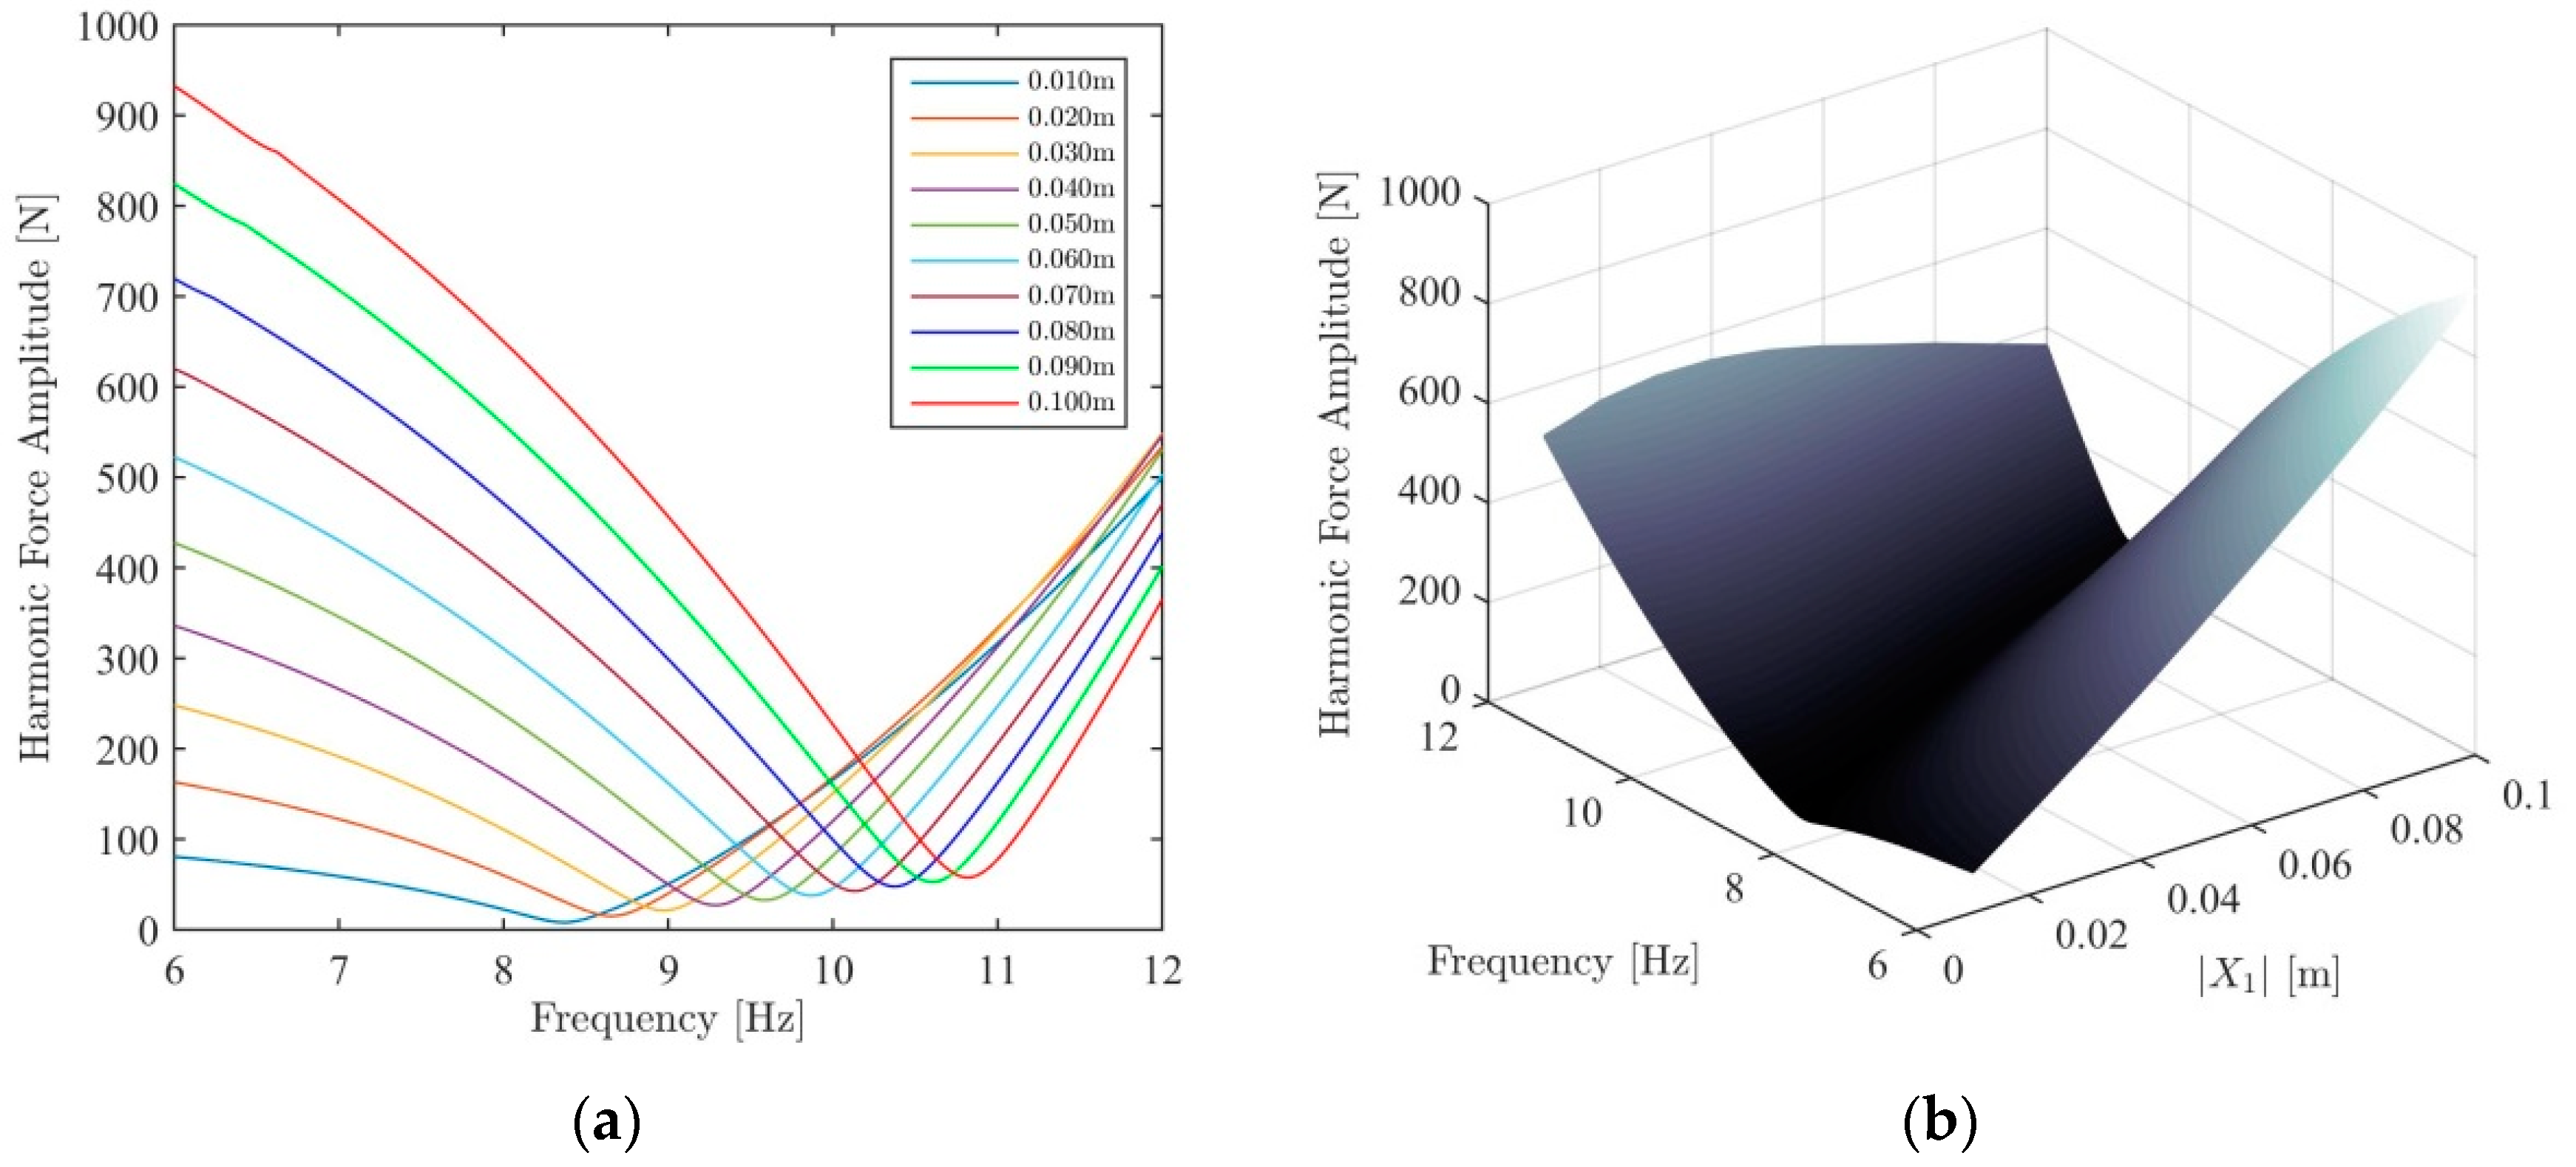
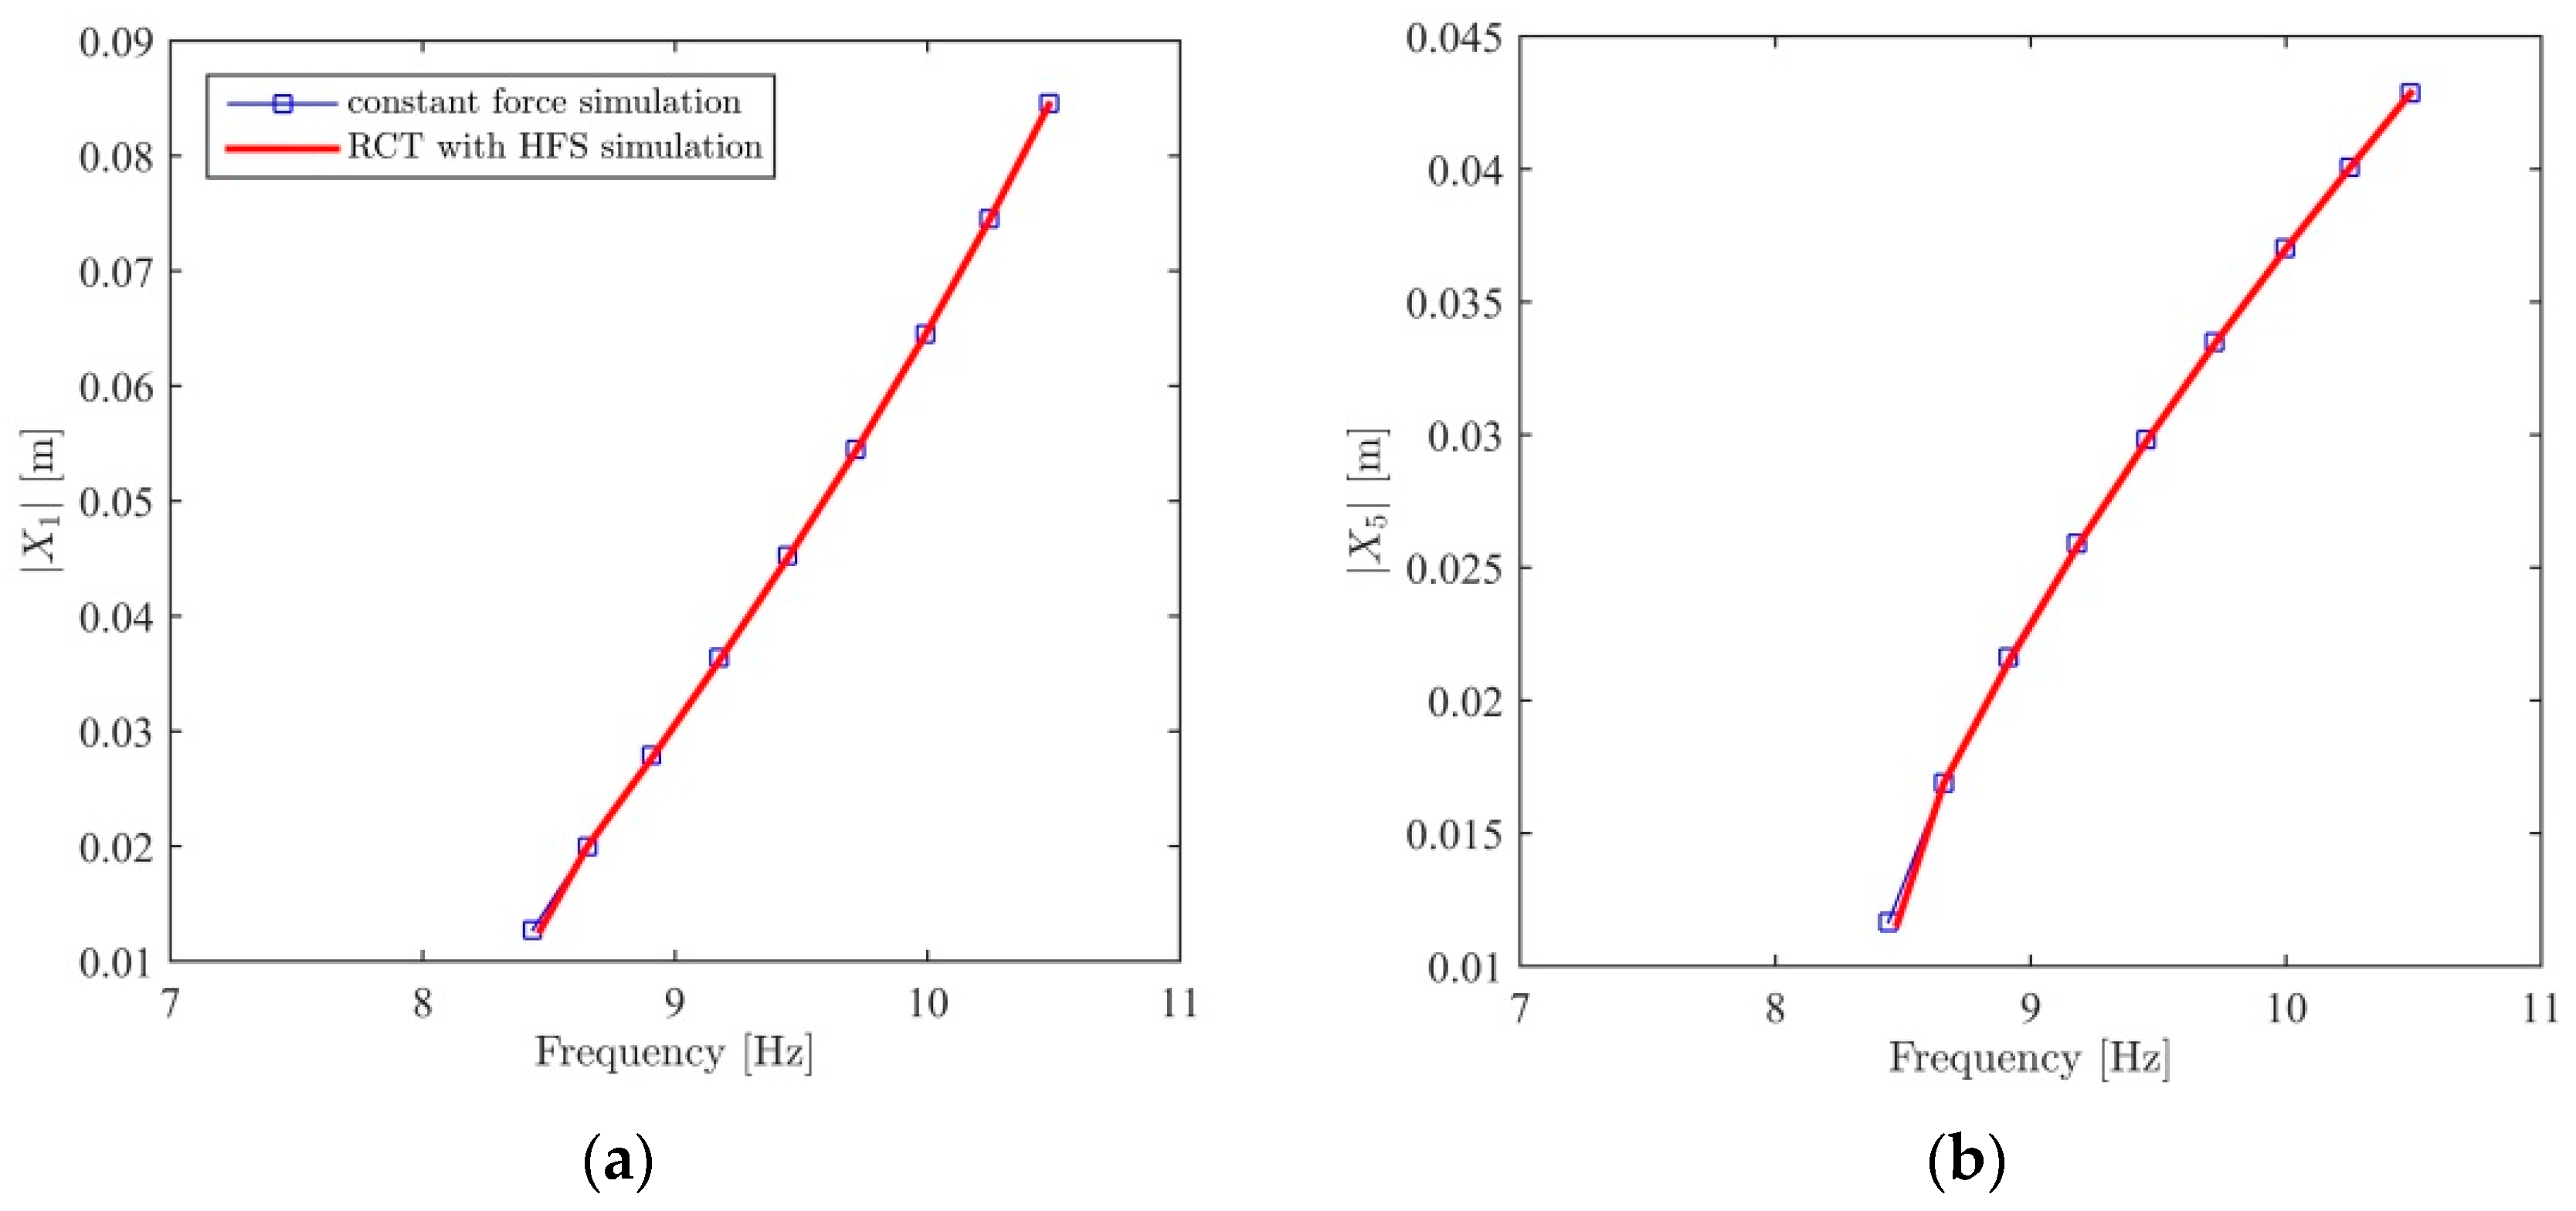
Section 3 is dedicated to the analytical illustration of the HFS method on a 5 DOF system with strong conservative nonlinearity. In Section 4, HFS is successfully applied to identify the backbone curves of a benchmark beam with cubic stiffness and of a control fin actuation mechanism of a real missile structure, both of which exhibit strong nonlinearity causing jump phenomenon during classical constant-force stepped-sine testing. Finally, conclusions are given in Section 5.

2. Experimental Modal Analysis with RCT and HFS

Experimental modal analysis using response-controlled stepped-sine testing was recently proposed by the authors of this paper in Reference [16], where the theoretical background is explained in full detail. Here, only a brief summary of the experimental methodology will be given, with the emphasis being on important key features.
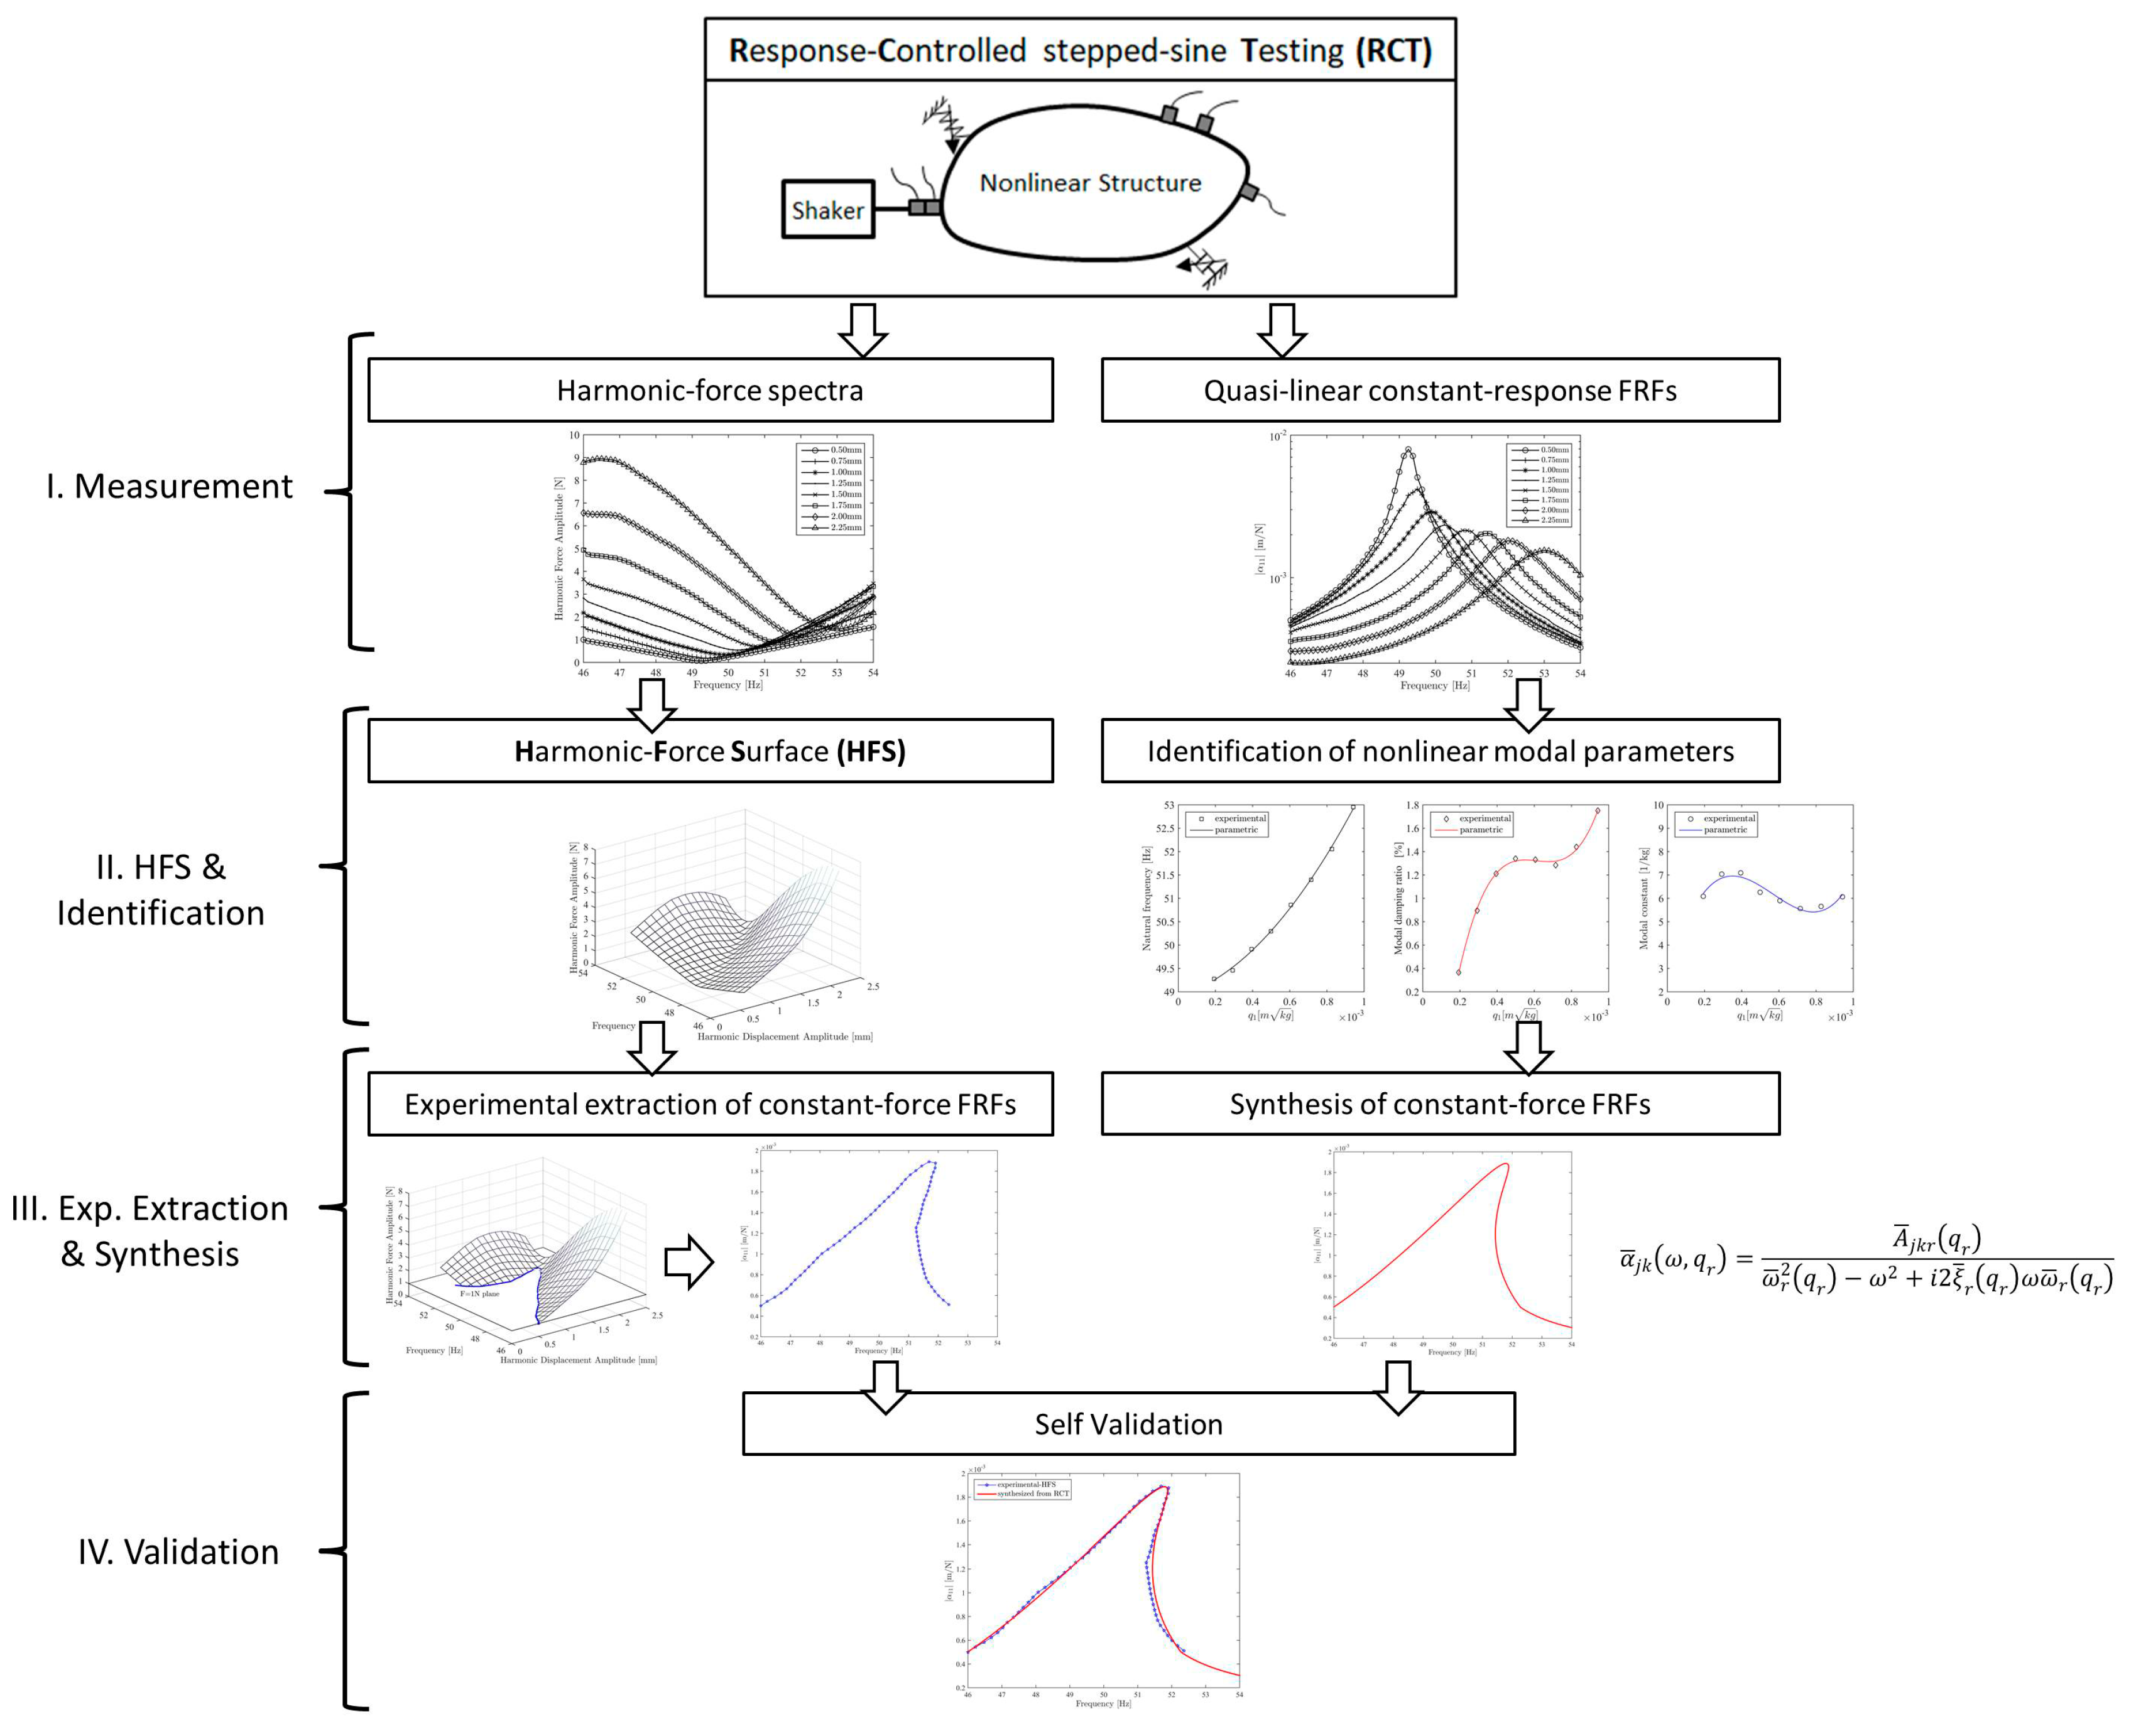
The flow chart of the proposed experimental methodology by using RCT is shown in Figure 2. The right column of the flow chart consists of the experimental extraction of nonlinear modal parameters and of the synthesis of constant-force FRFs by using these parameters. The identification of nonlinear modal parameters is straightforward via applying standard linear modal analysis techniques to quasi-linear constant-response FRFs measured by RCT. Quasi-linearization of FRFs by keeping the displacement of the test point (equivalently, the modal amplitude) constant is based on the Nonlinearity Matrix concept [17] and the single nonlinear mode theory [9] as explained in Reference [16]. The key formulation of the quasi-linearization concept is as follows:
α ¯ j k ( ω , q r ) = A ¯ j k r ( q r ) ω ¯ r 2 ( q r ) ω 2 + i 2 ξ ¯ r ( q r ) ω ω ¯ r ( q r )
where α ¯ j k is the near-resonant receptance at point j for a given excitation at point k and ω is the excitation frequency. A ¯ j k r ( q r ) , ω ¯ r ( q r ) and ξ ¯ r ( q r ) are the modal constant, natural frequency, and modal damping ratio of the r th mode, respectively. These nonlinear modal parameters are functions of a single parameter; the modal amplitude q r .
It was shown that if the modal amplitude is kept constant during stepped-sine testing, the measured constant-response FRFs turn out to be quasi-linear. In the case of a single input sine testing, the modal amplitude can be kept constant by just keeping the displacement amplitude of the driving point constant. In References [13,16,18], it was shown that nonlinear modes can be isolated with acceptable accuracy by just using single-point single harmonic excitation under the condition that no internal resonance occurs. On the other hand, the RCT method can theoretically be employed by using multi-input sine testing, which requires careful tuning of the amplitude ratios of excitation signals to keep the modal amplitude at a constant level [16].
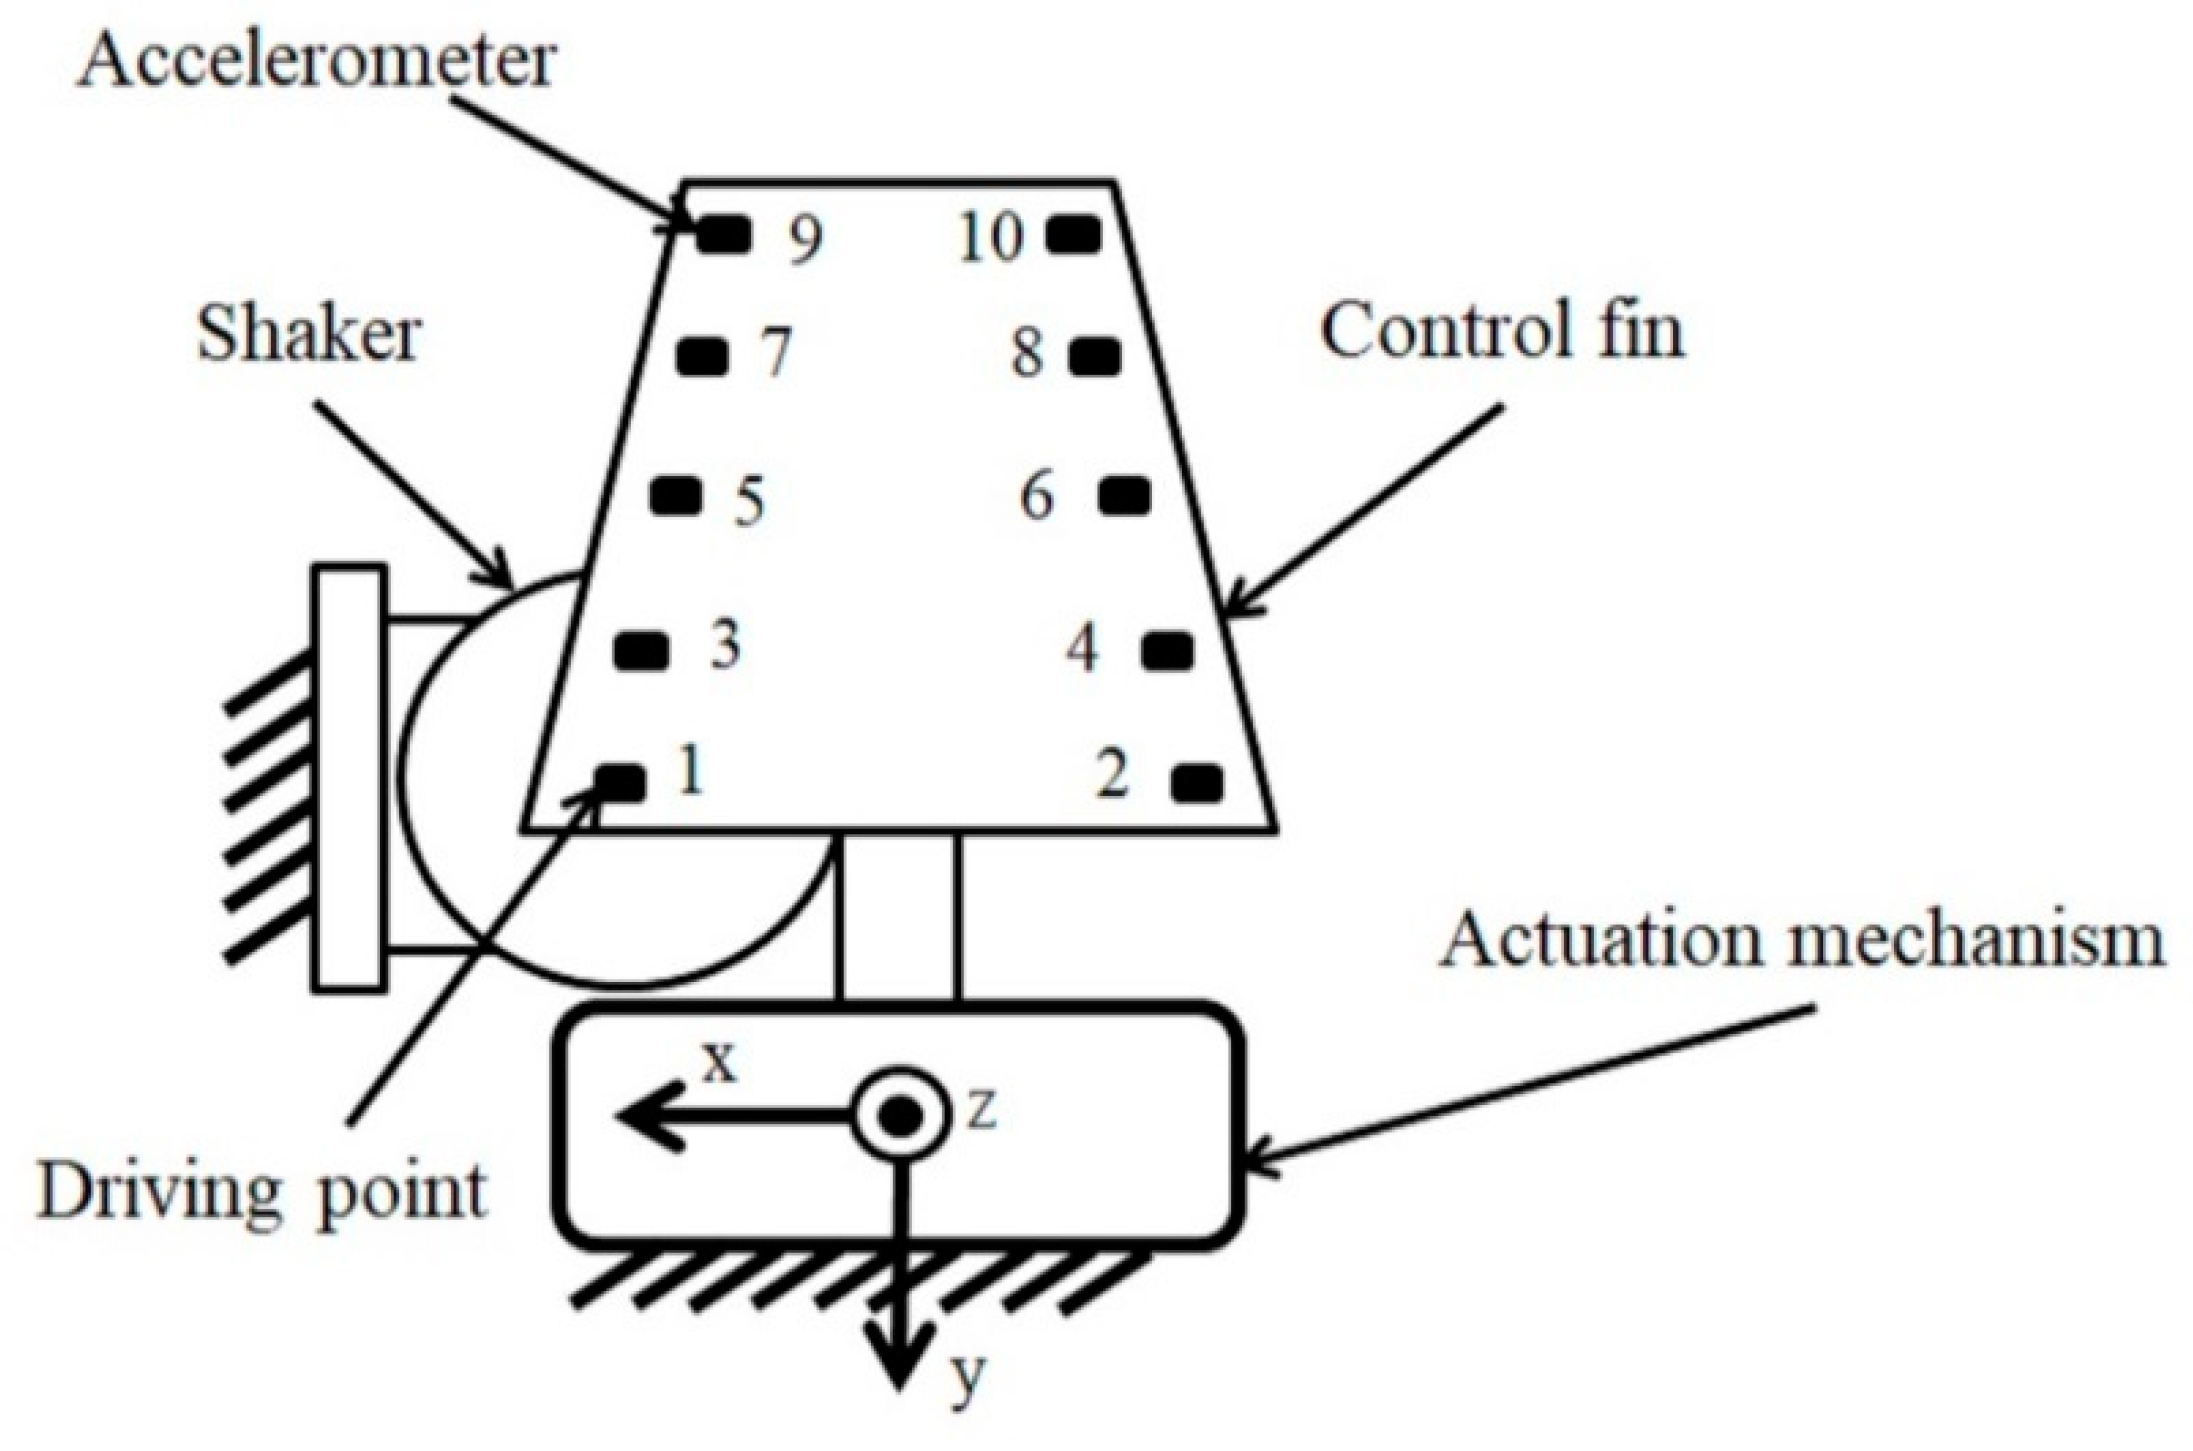
Due to the popularity of accelerometer in modal testing, it was preferably used as the control sensor in the applications of the proposed method. Accordingly, a constant displacement amplitude condition at the driving point over the frequency range of interest was achieved in an indirect way by feeding the closed-loop controller with an appropriate user-defined acceleration profile, which is supported by standard modal testing software (e.g., LMS Test Lab).
The HFS concept was successfully used for the validation of constant-force FRFs synthesized from identified nonlinear modal parameters [16]. The focus of the current paper is demonstrating the performance of HFS in experimentally extracting the backbone curves of strongly nonlinear systems by emphasizing its ability to accurately extract the turning points of frequency response curves with unstable branches.
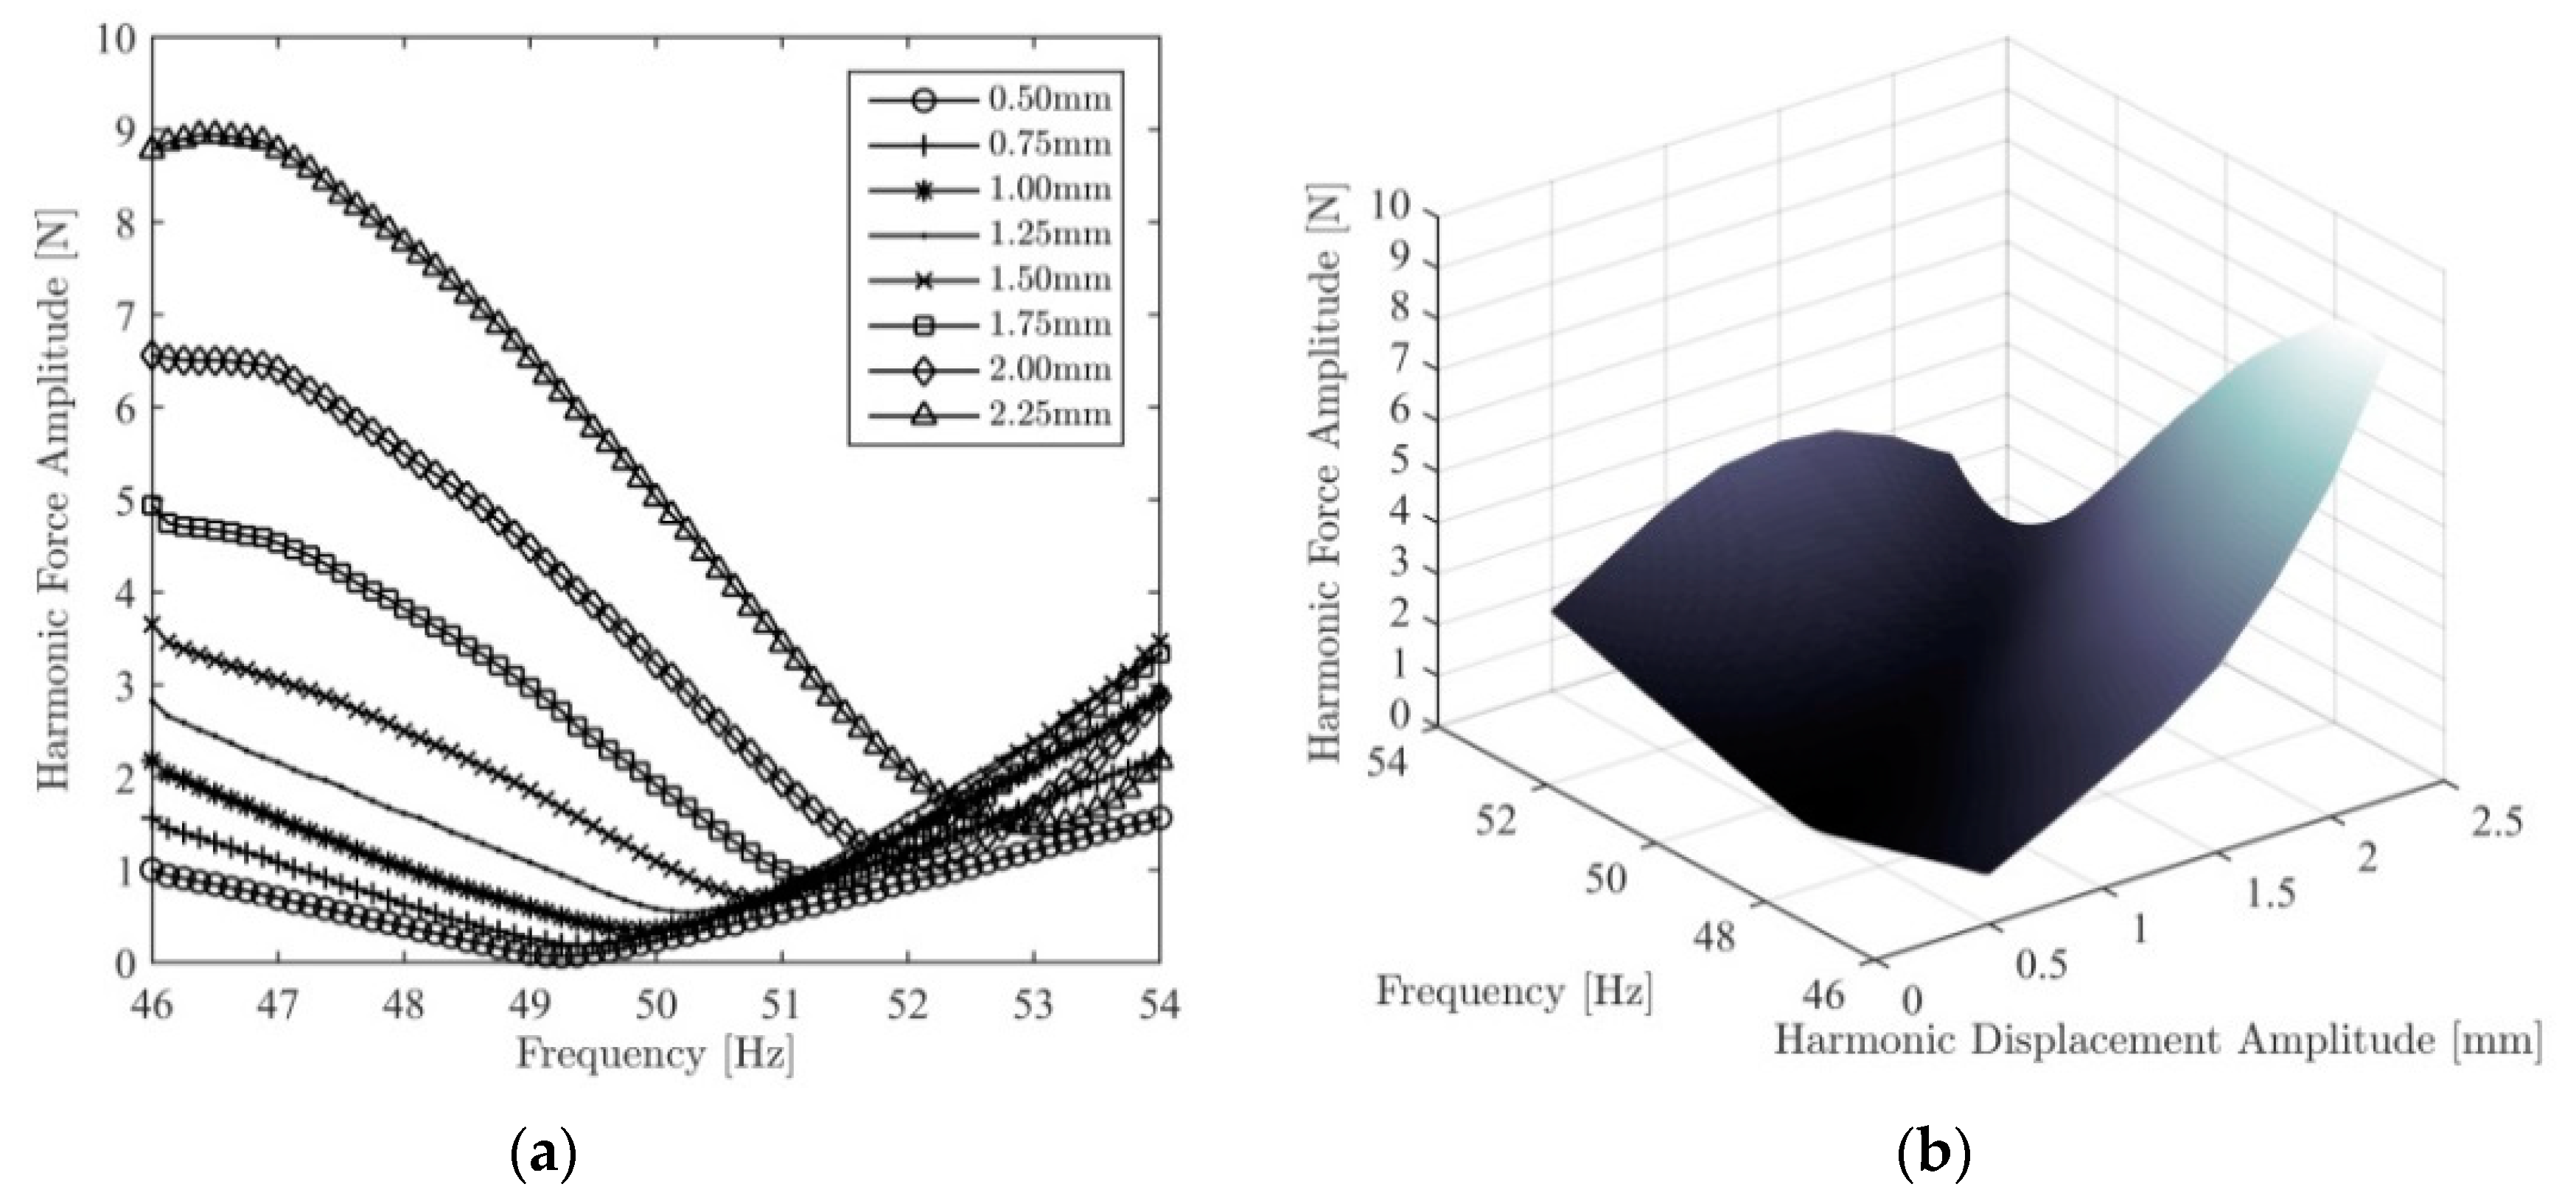
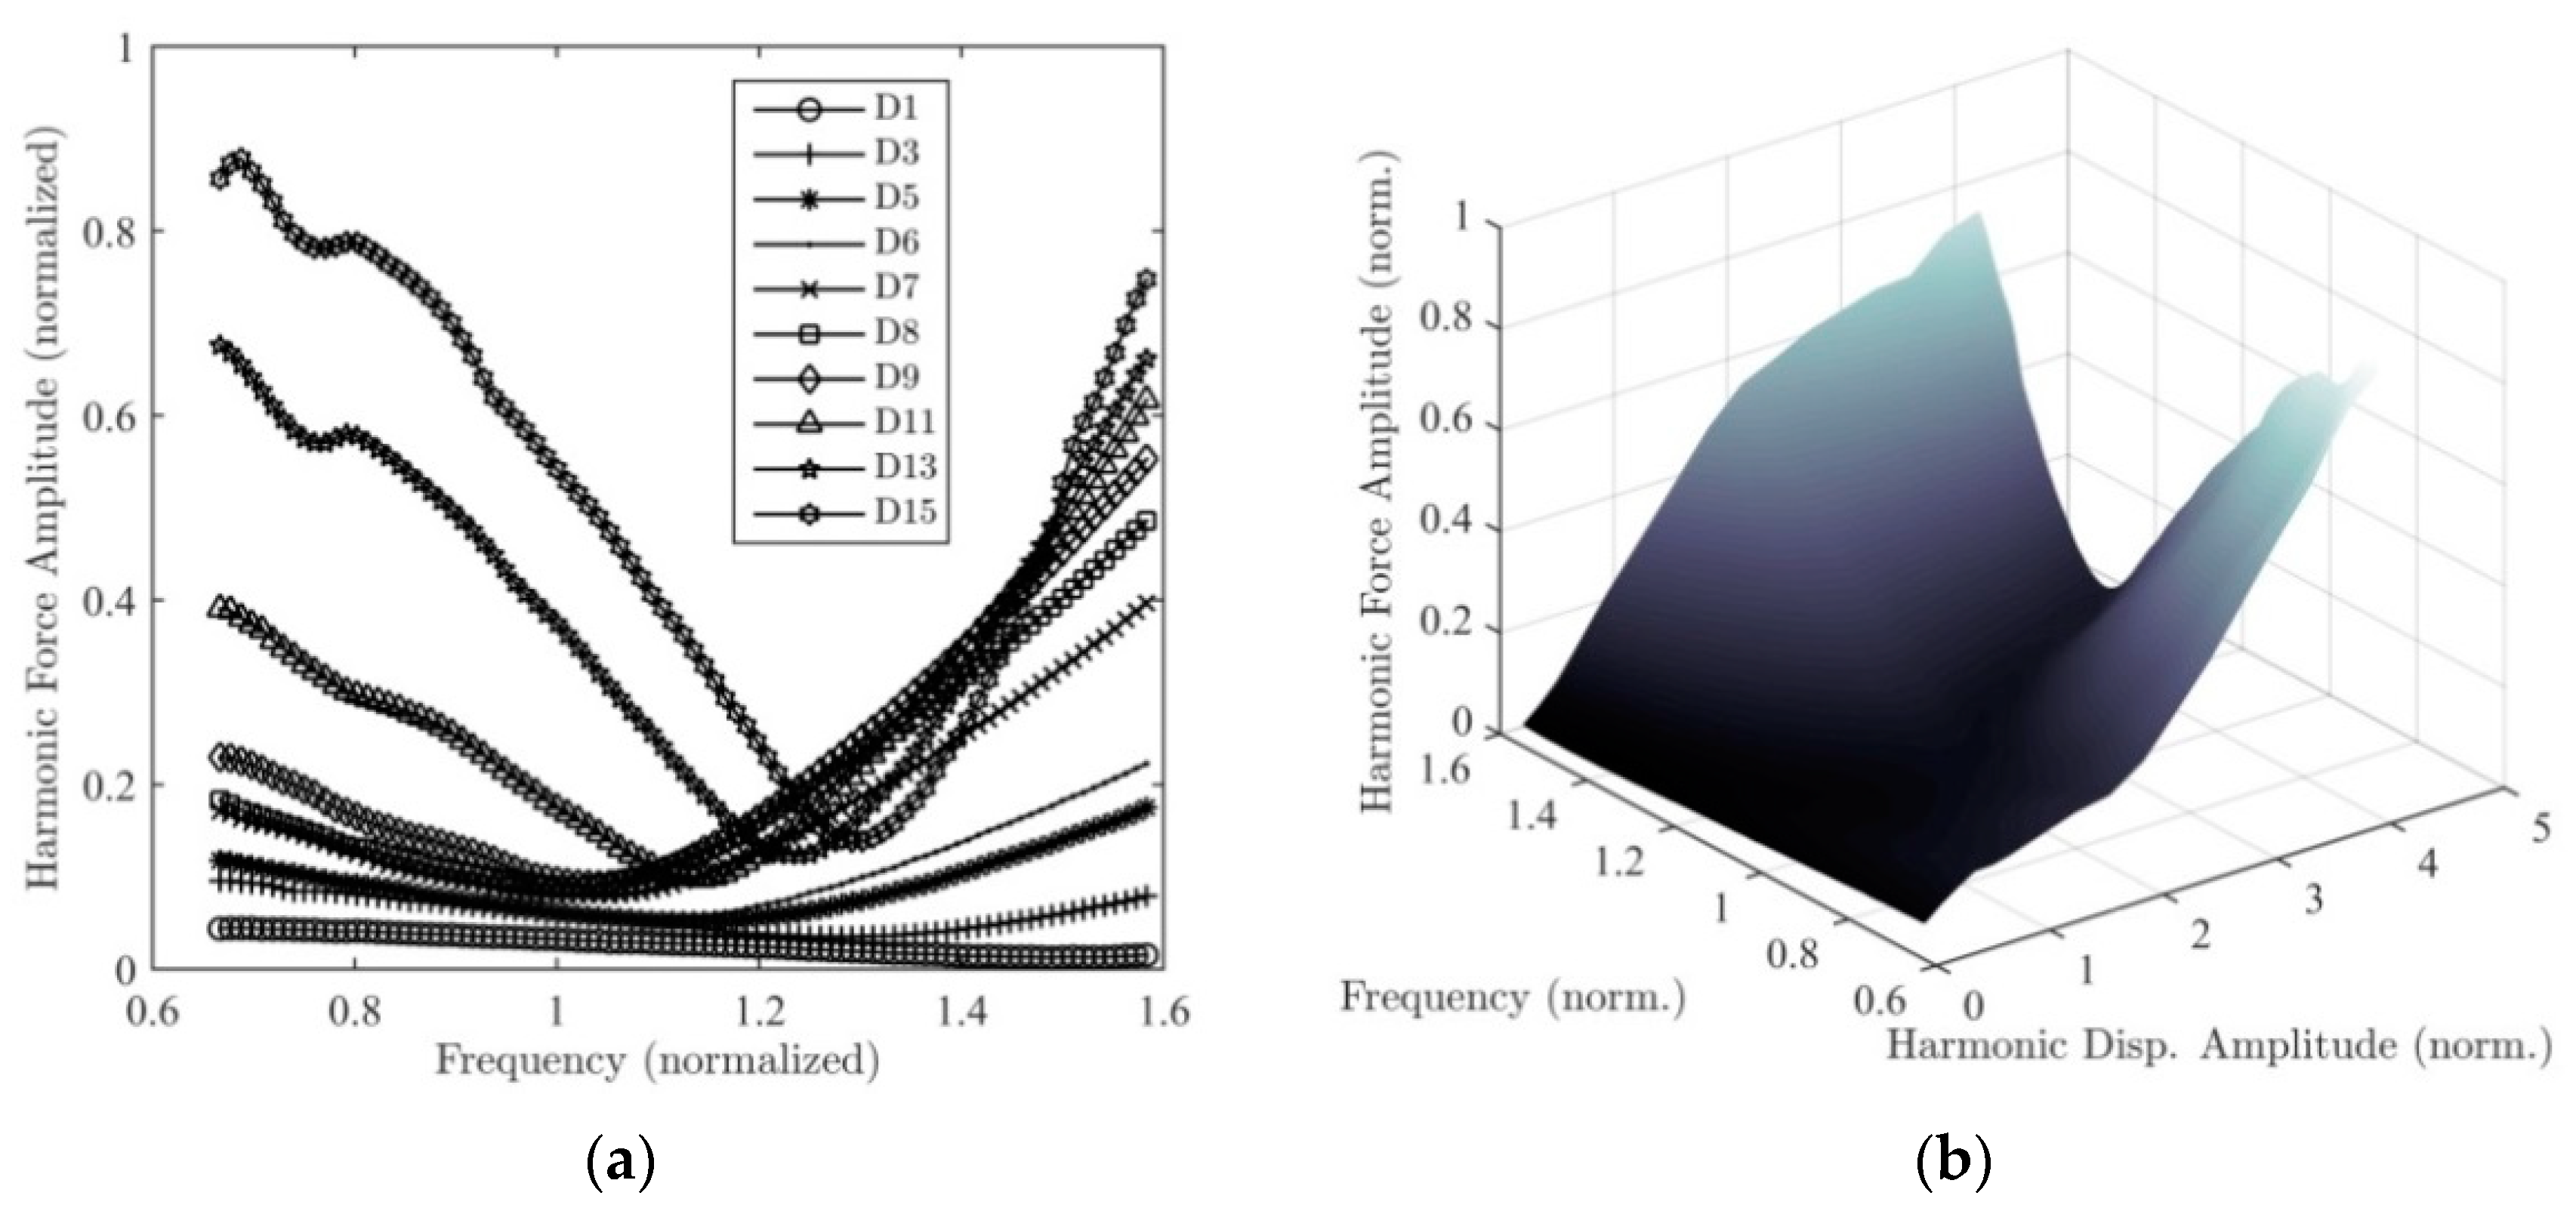
As shown in the left column of the flow chart given in 
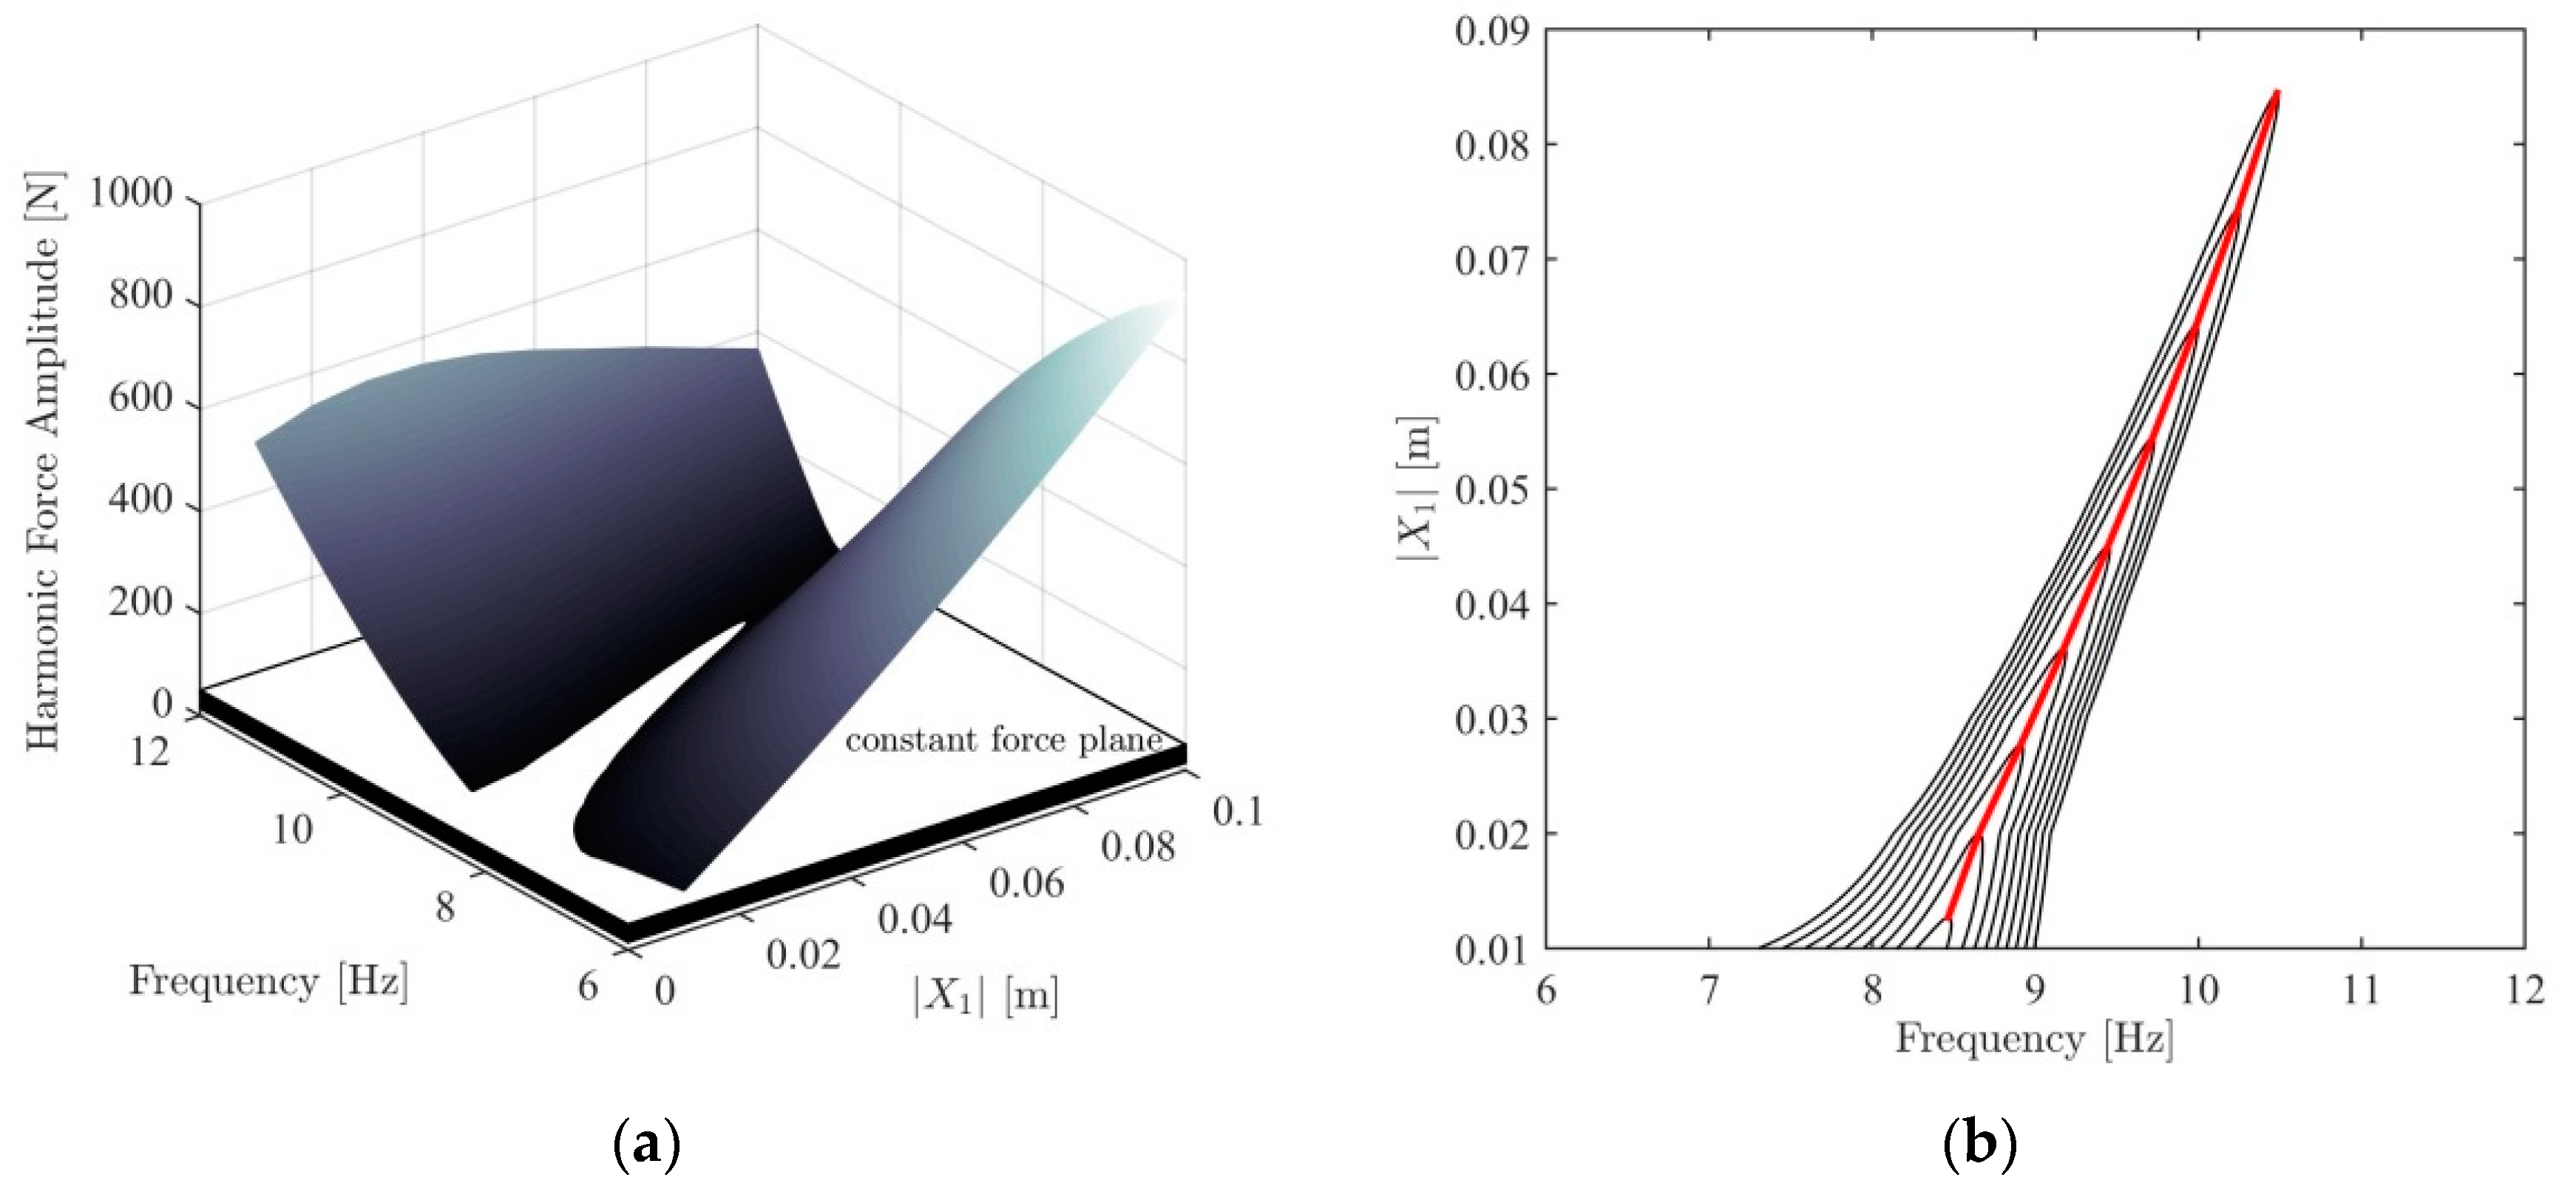
Figure 2, HFS is constructed from the harmonic force spectra of the driving point measured at different constant displacement amplitude levels by using linear interpolation. A frequency response curve corresponding to a specific constant force level, which will include any existing unstable branch, is simply determined by picking up points of the HFS corresponding to that force level.
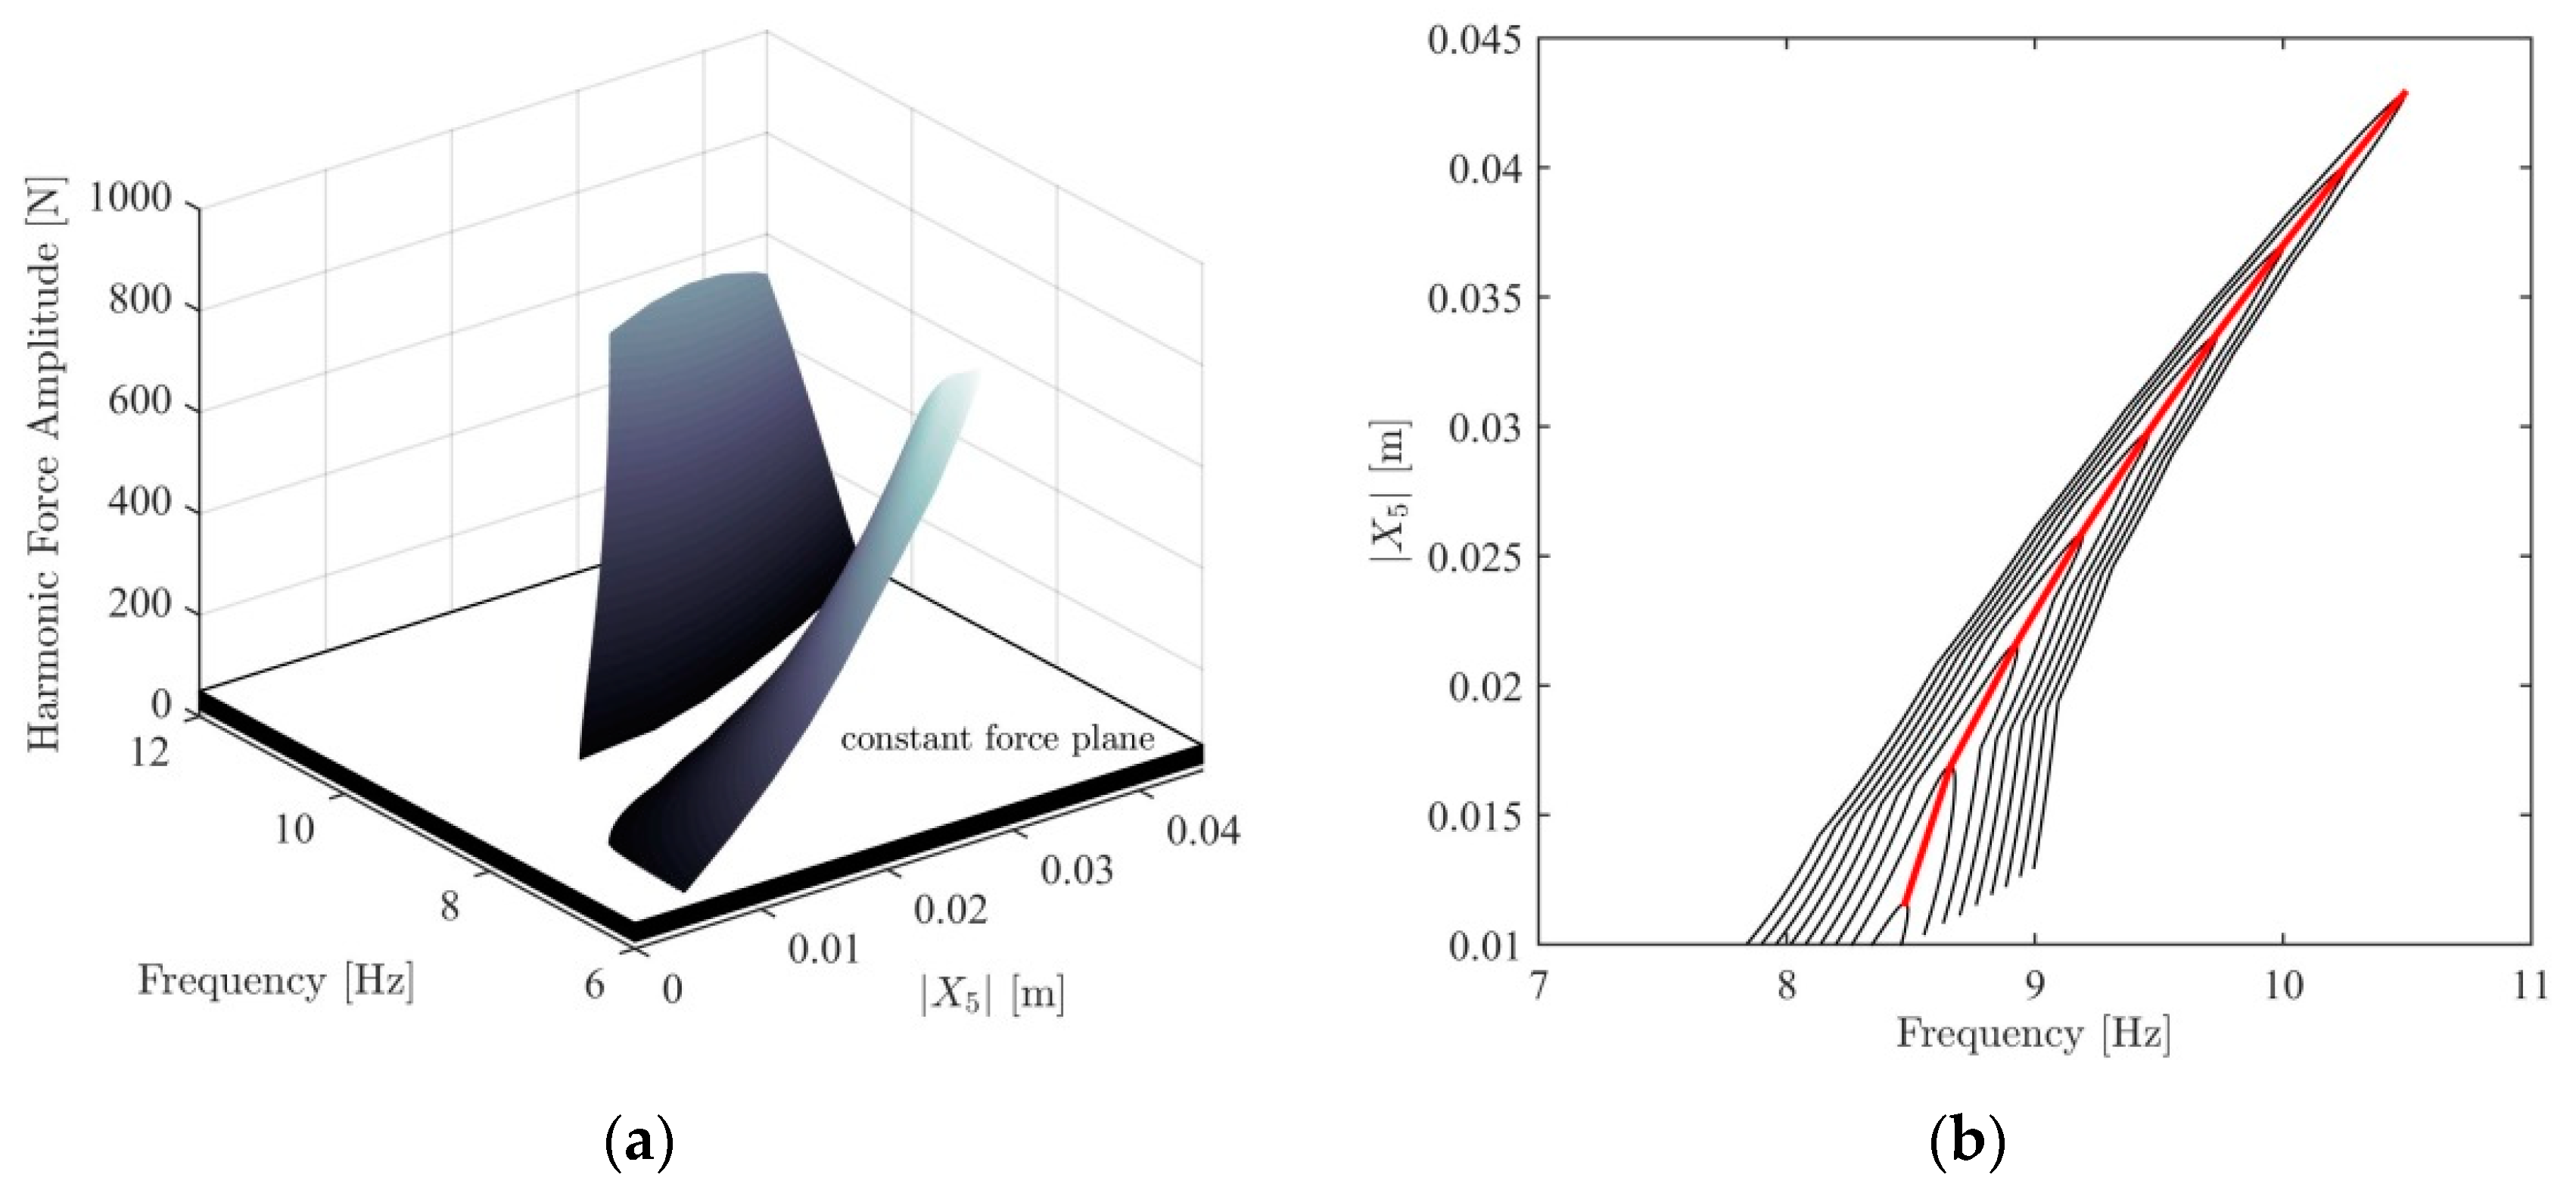
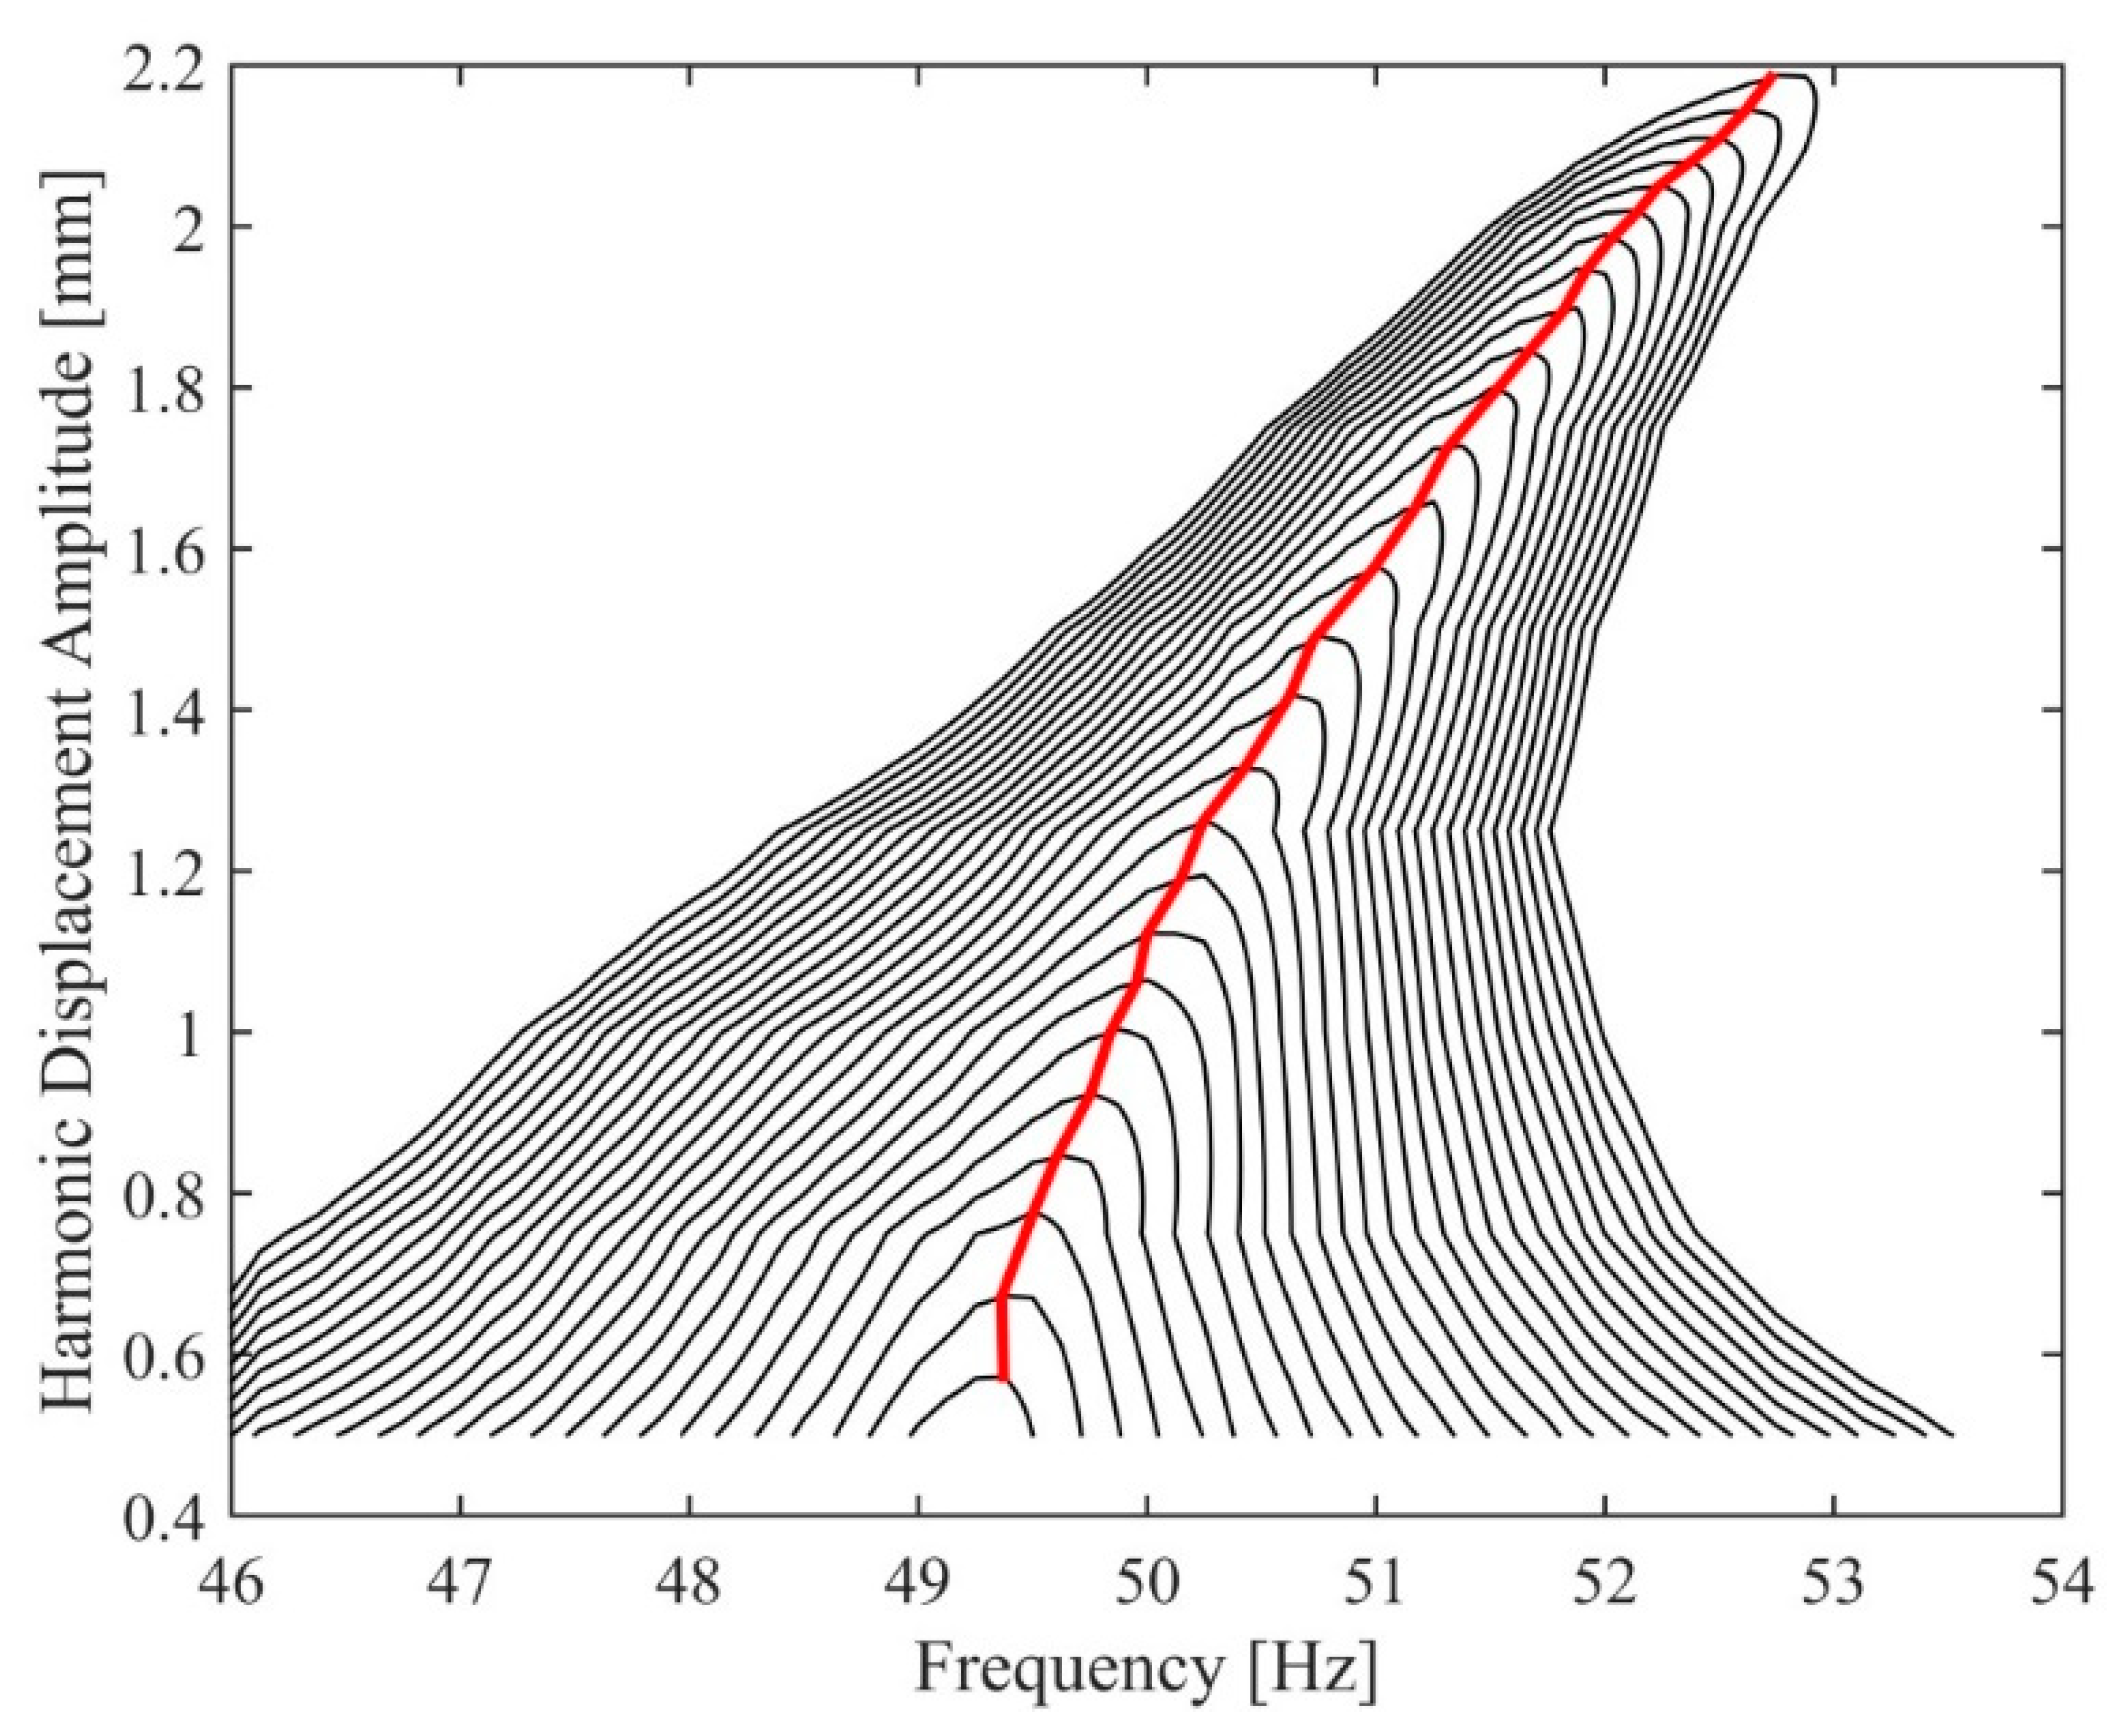
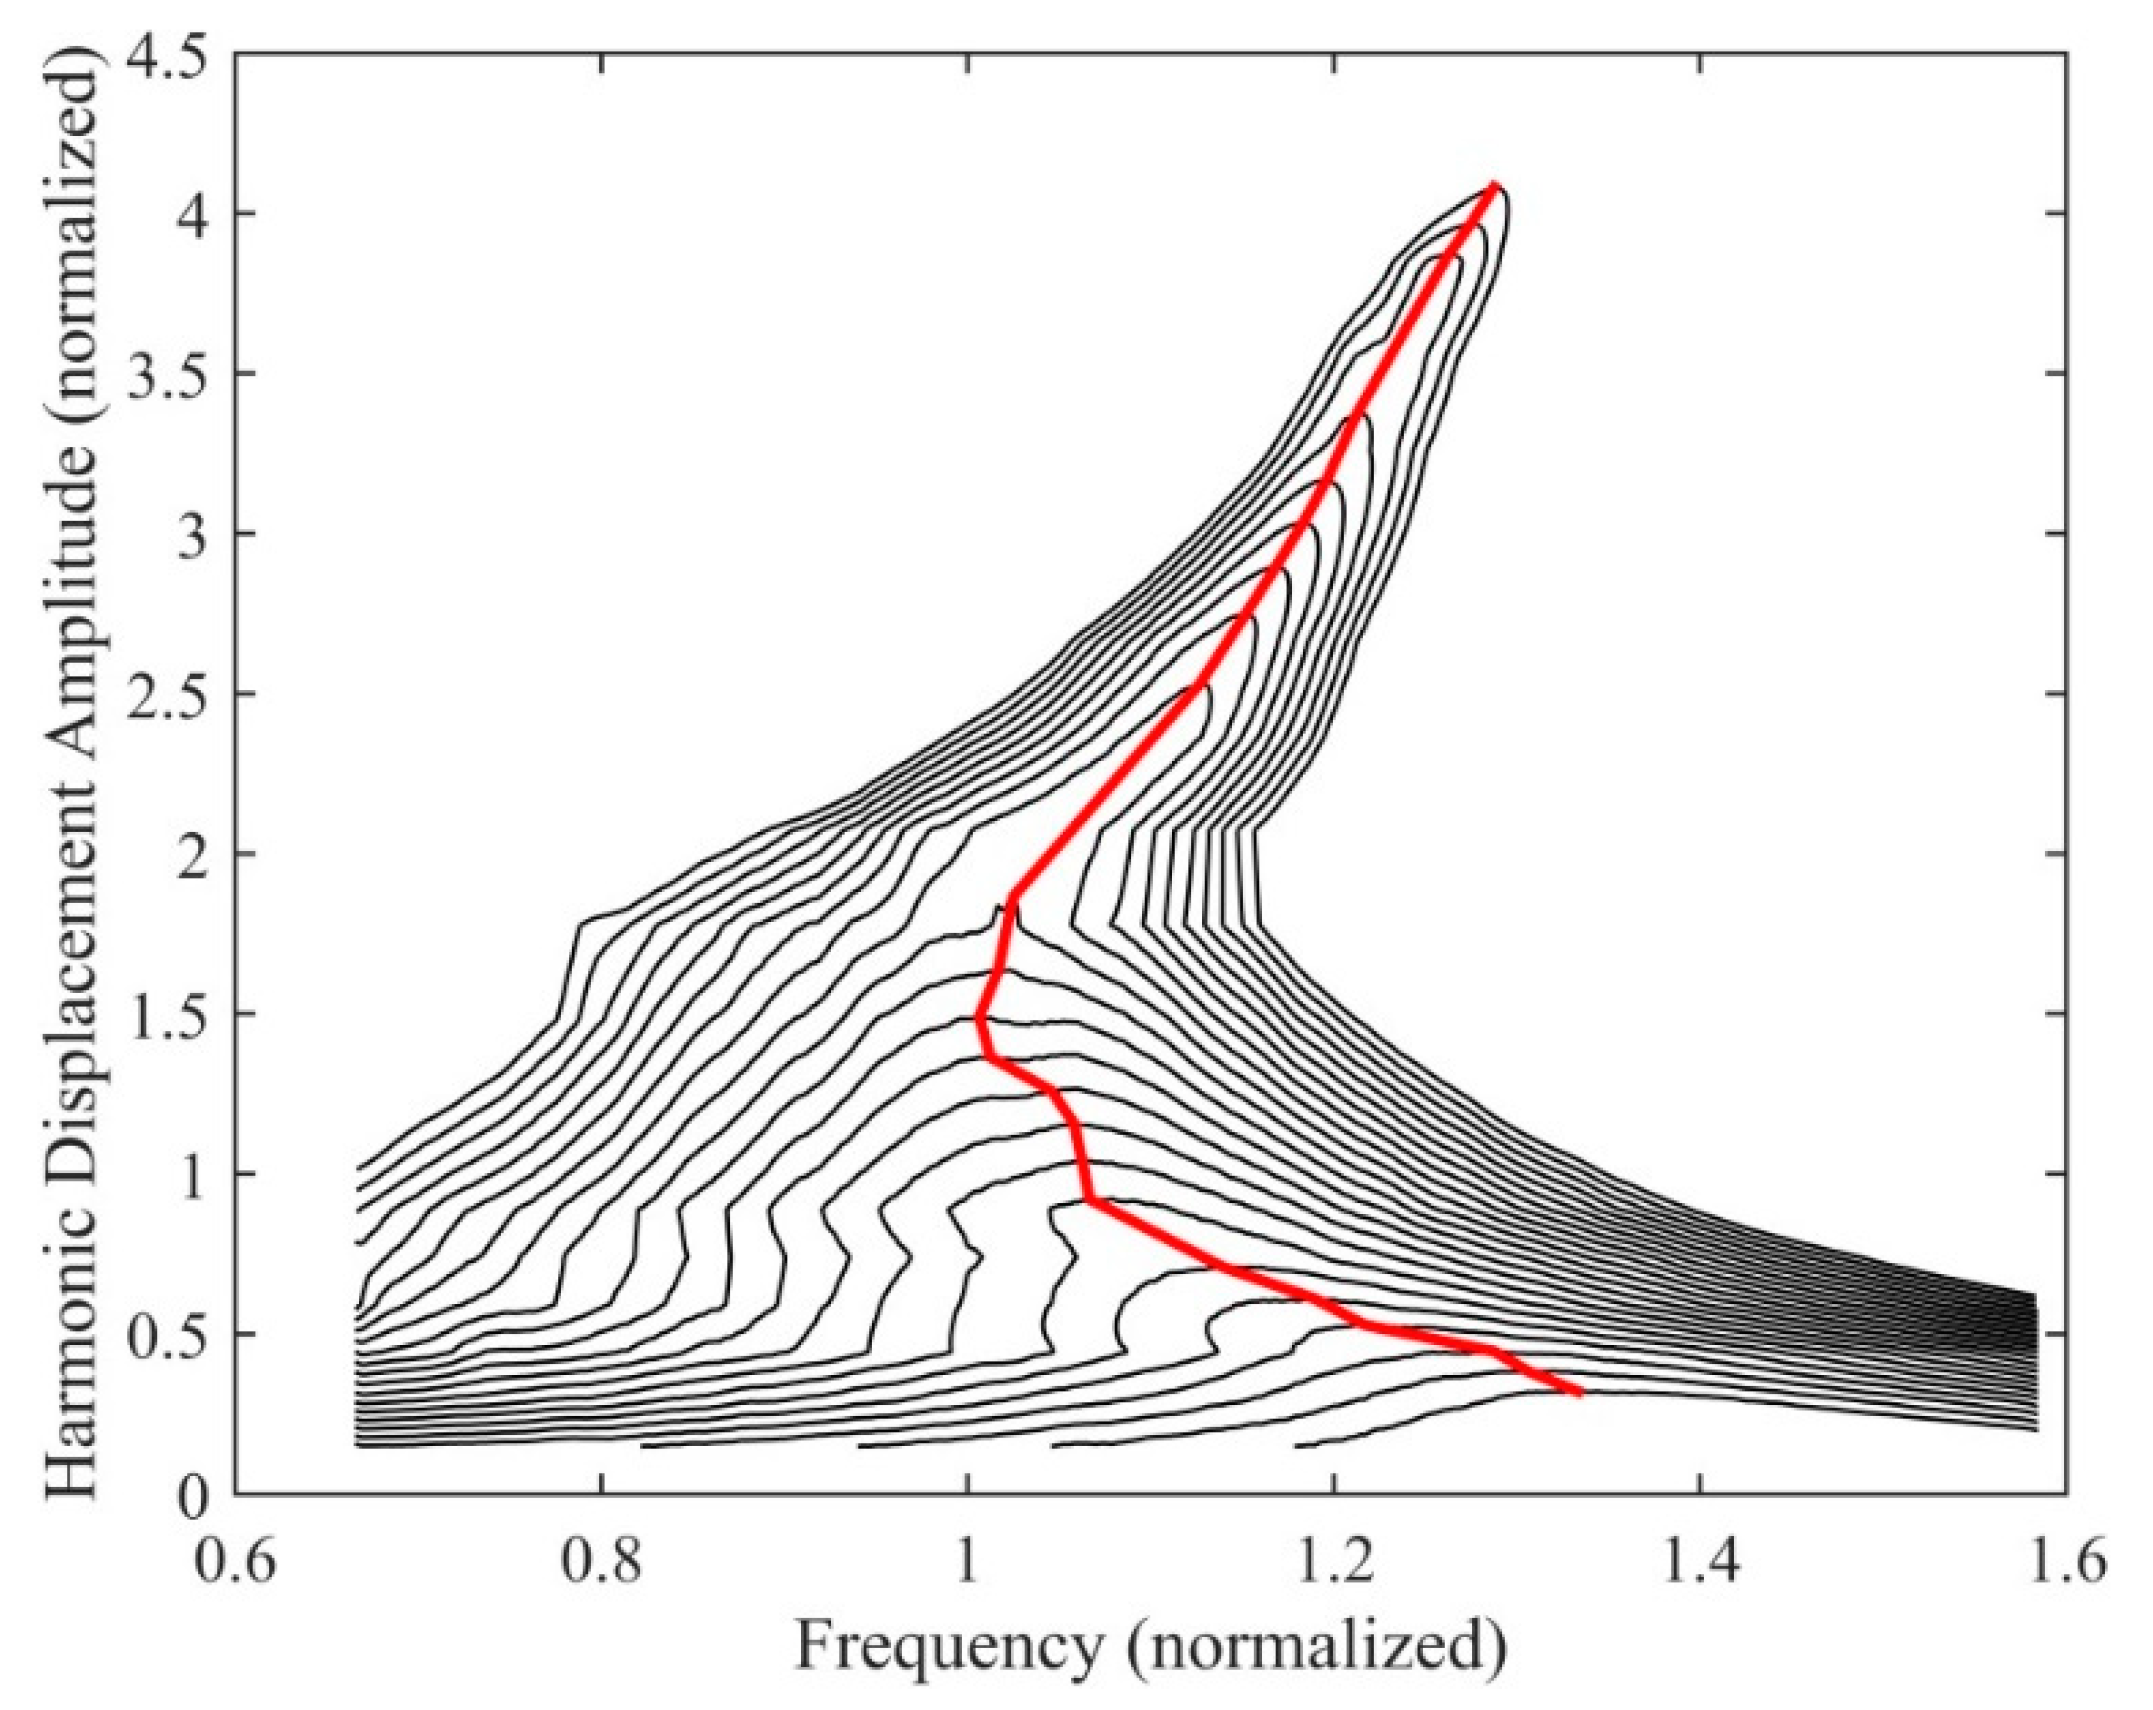
In this paper, it is proposed to determine the backbone curves of nonlinear systems by picking up resonance peaks of nonlinear frequency response curves extracted from HFS at various different constant force levels. Picking up resonance peaks requires smoothly identified turning points, which is an important issue for the state-of-the-art experimental continuation techniques. The successful application of HFS in extracting backbone curves of strongly nonlinear systems is demonstrated with numerical and experimental case studies in the subsequent sections.

3. Numerical Validation

In this section, the application of the HFS approach to identify the backbone curves is demonstrated on a 5 DOF nonlinear lumped system with 5 cubic stiffness elements. The parameters of the system (Figure 3) are as follows: m = 1   kg , k = 10,000   N / m , c = 5   Ns / m , k * = 10   7   N / m 3 . Here, k * denotes the coefficient of cubic stiffness.
The backbone curves obtained from HFS are validated with the ones determined from constant-force simulation. Constant-force and RCT simulations used to extract backbone curves are conducted by using a multiple harmonics version of the Describing Function Method (DFM) details of which can be found in References [16,17,19].

3.1. Determination of Backbone Curves by Using Constant-Force Simulations

Frequency response curves of the 1st and 5th DOFs obtained from constant force simulations at force levels ranging from 10 N to 50 N and corresponding to the first mode are illustrated in Figure 4. In Reference [16], where the same simulated data is used to validate nonlinear modal parameters identified with RCT, it is shown that the effect of higher harmonics is negligible for the force and displacement levels of interest. However, stiffness nonlinearity is still strong in the sense that it leads to overhanging unstable branches, as shown in Figure 4. Although in a simulated experiment resonance peaks can accurately be determined with the help of an arc length continuation algorithm, in a real experiment this may not be possible due to a jump or, even worse, due to a premature jump, as explained in the Introduction section. In the next section, it is demonstrated that by just using RCT and HFS concept, the inaccuracies due to the jump can be avoided, which makes it possible to identify the backbone curve more accurately with standard equipment.

3.2. Determination of Backbone Curves by Using RCT with HFS

Harmonic excitation force spectra of the driving point (1st DOF) obtained from RCT simulations at several constant displacement amplitude levels ranging from 0.01 m to 0.1 m in the first mode are illustrated in Figure 5a. As explained in Section 2, the HFS corresponding to the 1st DOF is constructed by combining harmonic excitation force spectra and using linear interpolation, as shown in Figure 5b.
By cutting the HFS with constant force planes ranging from 10 N to 50 N (with 5 N increments) as shown in Figure 6a, constant-force frequency response curves of the 1st DOF are successfully extracted with accurate resonance turning points and unstable branches as demonstrated in Figure 6b. Finally, the backbone curve of the 1st DOF is determined by combining resonance peaks of the extracted frequency response curves, as shown in the same figure.
In real experimental cases, the measurements of unstable branches together with smooth turning points shown in Figure 6b would not be possible with conventional constant-force testing due to the jump (or even worse, premature jump) phenomenon, which eventually led the development of advanced experimental continuation techniques in the last decade to determine the backbone curves of structures exhibiting strong conservative nonlinearity. Alternatively, the RCT strategy combined with HFS concept reveals that standard equipment can still do a good job in the experimental extraction of unstable branches and backbone curves. In the RCT-HFS approach, instead of consecutively tracing out points on an unstable branch or a backbone curve, these points are measured at different times during stepped-sine tests carried out at different constant amplitude levels, and then merged into the HFS.
It is important to note that HFS given in Figure 5b was constructed by considering the displacement amplitudes of the 1st DOF, i.e., | X 1 | , as can be seen from the label of the displacement axis. So, this surface specifically belongs to the 1st DOF, and can only be used to obtain constant-force frequency response curves of the 1st DOF. In order to obtain frequency responses of another DOF, the HFS needs to be reconstructed by considering the displacement amplitudes of that specific DOF. As an example, the HFS corresponding to the 5th DOF is illustrated in Figure 7a. Once again, constant-force frequency response curves and the backbone curve corresponding to the 5th DOF are successfully determined, as shown in Figure 7b.
Finally, backbone curves determined from the HFS approach are compared with those obtained from constant-force simulations for the 1st and 5th DOFs, as shown in Figure 8. The excellent match indicates that HFS is a very promising concept for extracting backbone curves of strongly nonlinear systems directly from experimental measurements. It is interesting to note that, once backbone curves corresponding to several different measurement points are experimentally identified as illustrated in Figure 8, collecting the points on these backbone curves corresponding to the same resonance frequency (or equivalently energy level) into a vector gives the NNM of the structure at that energy level. This is an alternative way of obtaining the NNM of a nonlinear structure directly from experimental measurements, whereas in the earlier work of the authors [16] it is proposed to use experimental data to identify nonlinear modal constants and then to calculate NNM by using these modal constants.

4. Experimental Applications

4.1. T-Beam

The T-beam is a benchmark test setup which consists of a cantilever beam clamped at its free end by two metal strips, as shown in Figure 9. The structure exhibits geometric nonlinearity due to large deformations of the metal strips. Dimensions of the rig are given in Reference [20]. The focus of this study is the first nonlinear mode of the structure, where a strong cubic stiffness behavior is observed.
During experiments, the structure was excited with a B&K shaker at the T-junction. The excitation force was measured by using a Dytran 1022 V force transducer and vibration measurement was accomplished via a Dytran 3225M23 miniature accelerometer attached to the top of the T-junction. The frequency step was taken to be 0.125 Hz. All measurements and closed-loop controls were achieved using LMS modal test equipment (SCADAS Mobile and LMS Test Lab.).
As a first step in determining unstable branches and backbone curve, eight stepped-sine tests were conducted at constant displacement amplitude levels ranging from 0.50 mm to 2.25 mm by using the RCT approach. Even though the proposed approach requires more measured data compared to some other state-of-the-art techniques, the testing time is within reasonable limits thanks to the response control strategy which renders the system more predictable due to quasi-linear behavior. In the case of this T-beam application, a single stepped-sine test conducted at a constant response level was 3 times faster than a single constant-force stepped-sine test.
Harmonic force spectra measured at each displacement amplitude level are shown in Figure 10a. Secondly, the HFS is built up by combining these force spectra and using linear interpolation as shown in Figure 10b. Nonlinear frequency response curves extracted by cutting the HFS with 0.5 N and 1.0 N constant force planes are validated by comparing them with constant-force test results, as shown in Figure 11. Obviously, the frequency response curve obtained from HFS incorporates the unstable branch at 1.0 N, which cannot be captured by constant-force testing. It is important to note that the negligible effect of higher harmonics around resonance for the force and displacement amplitude levels considered in this case study, which is the fundamental assumption of the proposed RCT-HFS technique, is experimentally confirmed in [21].
Nonlinear frequency response curves corresponding to various constant force levels ranging from 0.1 N to 1.4 N with 0.05 N increments were extracted by cutting the HFS with corresponding constant force planes, as shown in Figure 12. Finally, the backbone curve was determined by collecting resonance peaks of these frequency response curves, as shown in the same figure. It is important to note that, in this context, the resonance peak is defined as the maximum value of the imaginary part of the frequency response curve. Figure 12 clearly demonstrates that the HFS technique can successfully extract the turning points of overhanging frequency response curves, which cannot be achieved accurately by conventional constant-force testing due to the jump phenomenon and which is still a challenging issue for the state-of-the-art experimental continuation techniques.

4.2. Control Fin Actuation Mechanism

Control fins of guided missiles, which play a key role in aeroelastic behavior of the missile system [22,23], may exhibit severe nonlinearity caused by backlash and friction between moving parts of the actuation mechanism. In some cases, the first torsional mode may exhibit strong nonlinearity with a jump in the frequency response, which makes it a challenging nonlinear system identification problem. In this experimental study, the HFS approach is successfully applied to identify the backbone curve of a real control fin actuation mechanism of a missile. The sketch of the test rig is shown in Figure 13. The same experimental setup was also used in Reference [21] to validate the so-called Describing Surface Method recently proposed by the authors for nonparametric identification of structural nonlinearities in the frequency domain.
The casing of the mechanism is rigidly fixed to the ground. The response of the system was measured by using 10 accelerometers as shown in Figure 13. The system was excited, in the z-direction, with an electrodynamic shaker (B&K) at point 1. The excitation force at the driving point is measured with a Dytran 1022 V force transducer.
During the test campaign, RCT was repeated at 15 different displacement amplitude levels, which are labelled as D1, D2, …, D15, around the first torsional mode. The harmonic force spectra measured at only 10 different constant displacement amplitude levels are shown in Figure 14a for clarity. The HFS constructed by combining harmonic force spectra with linear interpolation is shown in Figure 14b. The frequency response curves obtained by cutting HFS with constant force planes F1, F2, and F3 are compared with constant force testing results in Figure 15a–c, respectively. Obviously, the frequency response curves measured during constant-force testing and those obtained by the HFS do not match perfectly. In Reference [21], it is experimentally confirmed that the effect of higher harmonics is not significant. Therefore, it is concluded that the contribution of higher harmonics cannot be the main reason for the discrepancy between two types of tests. The main reason seems to be the repeatability issue, which is very typical even in simple benchmark structures [24]. In the control fin problem, repeating the same test for a second time does not give exactly the same constant-force frequency response curve. This may be related to the reconfiguration of the gaps and contact surfaces due to vibration as well as a significant temperature change of lubricants due to heat generation.
Nonlinear frequency response curves corresponding to various constant force levels were extracted by cutting the HFS with corresponding constant force planes as shown in Figure 16. Finally, the backbone curve was determined by collecting resonance peaks of these frequency response curves, as shown in the same figure. This backbone curve indicates the softening–hardening nonlinear behavior of the control fin actuation mechanism, where the initial softening is probably related to the stick to slip transition and the hardening results from the backlash. This experimental case study shows that HFS can successfully determine backbone curves of real engineering structures which exhibit strong and complex nonlinear behavior, whereas the backbone curve that could be obtained from constant-force tests would be considerably inaccurate (Figure 15 for F2 indicates huge inaccuracy in resonance peak prediction due to premature jump). It is important to note that the backbone curve shown in Figure 16 was identified from a single data set, and consequently it does not reflect the variability of the repeatedly measured frequency response data which is discussed in the previous paragraph.

5. Conclusions

Conventional constant-force sine testing is not suitable for accurately measuring turning points of frequency response curves of nonlinear structures exhibiting strong conservative nonlinearity due to the jump phenomenon. Consequently, the accuracy of backbone curves determined by constant-force testing is always questionable, which led to the development of advanced experimental continuation algorithms to extract backbone curves in the last decade. Although the current state-of-the-art provides promising control algorithms, it cannot directly make use of available modal testing equipment. This paper proposes an alternative approach that relies on standard equipment to identify backbone curves of strongly nonlinear systems directly from experimental measurements by using the Response-Controlled stepped-sine Testing (RCT) and the Harmonic Force Surface (HFS) concept recently proposed by the authors. These methods can be applied to systems where there are several nonlinearities at unknown locations. However, these techniques are not applicable to systems where internal resonances occur. So, the method is applicable to systems with strong nonlinearity in the sense that they exhibit unstable branches in the frequency response curves obtained with constant-force testing, as illustrated in the numerical and experimental case studies given in this paper, but not for nonlinearities which give rise to internal resonance.
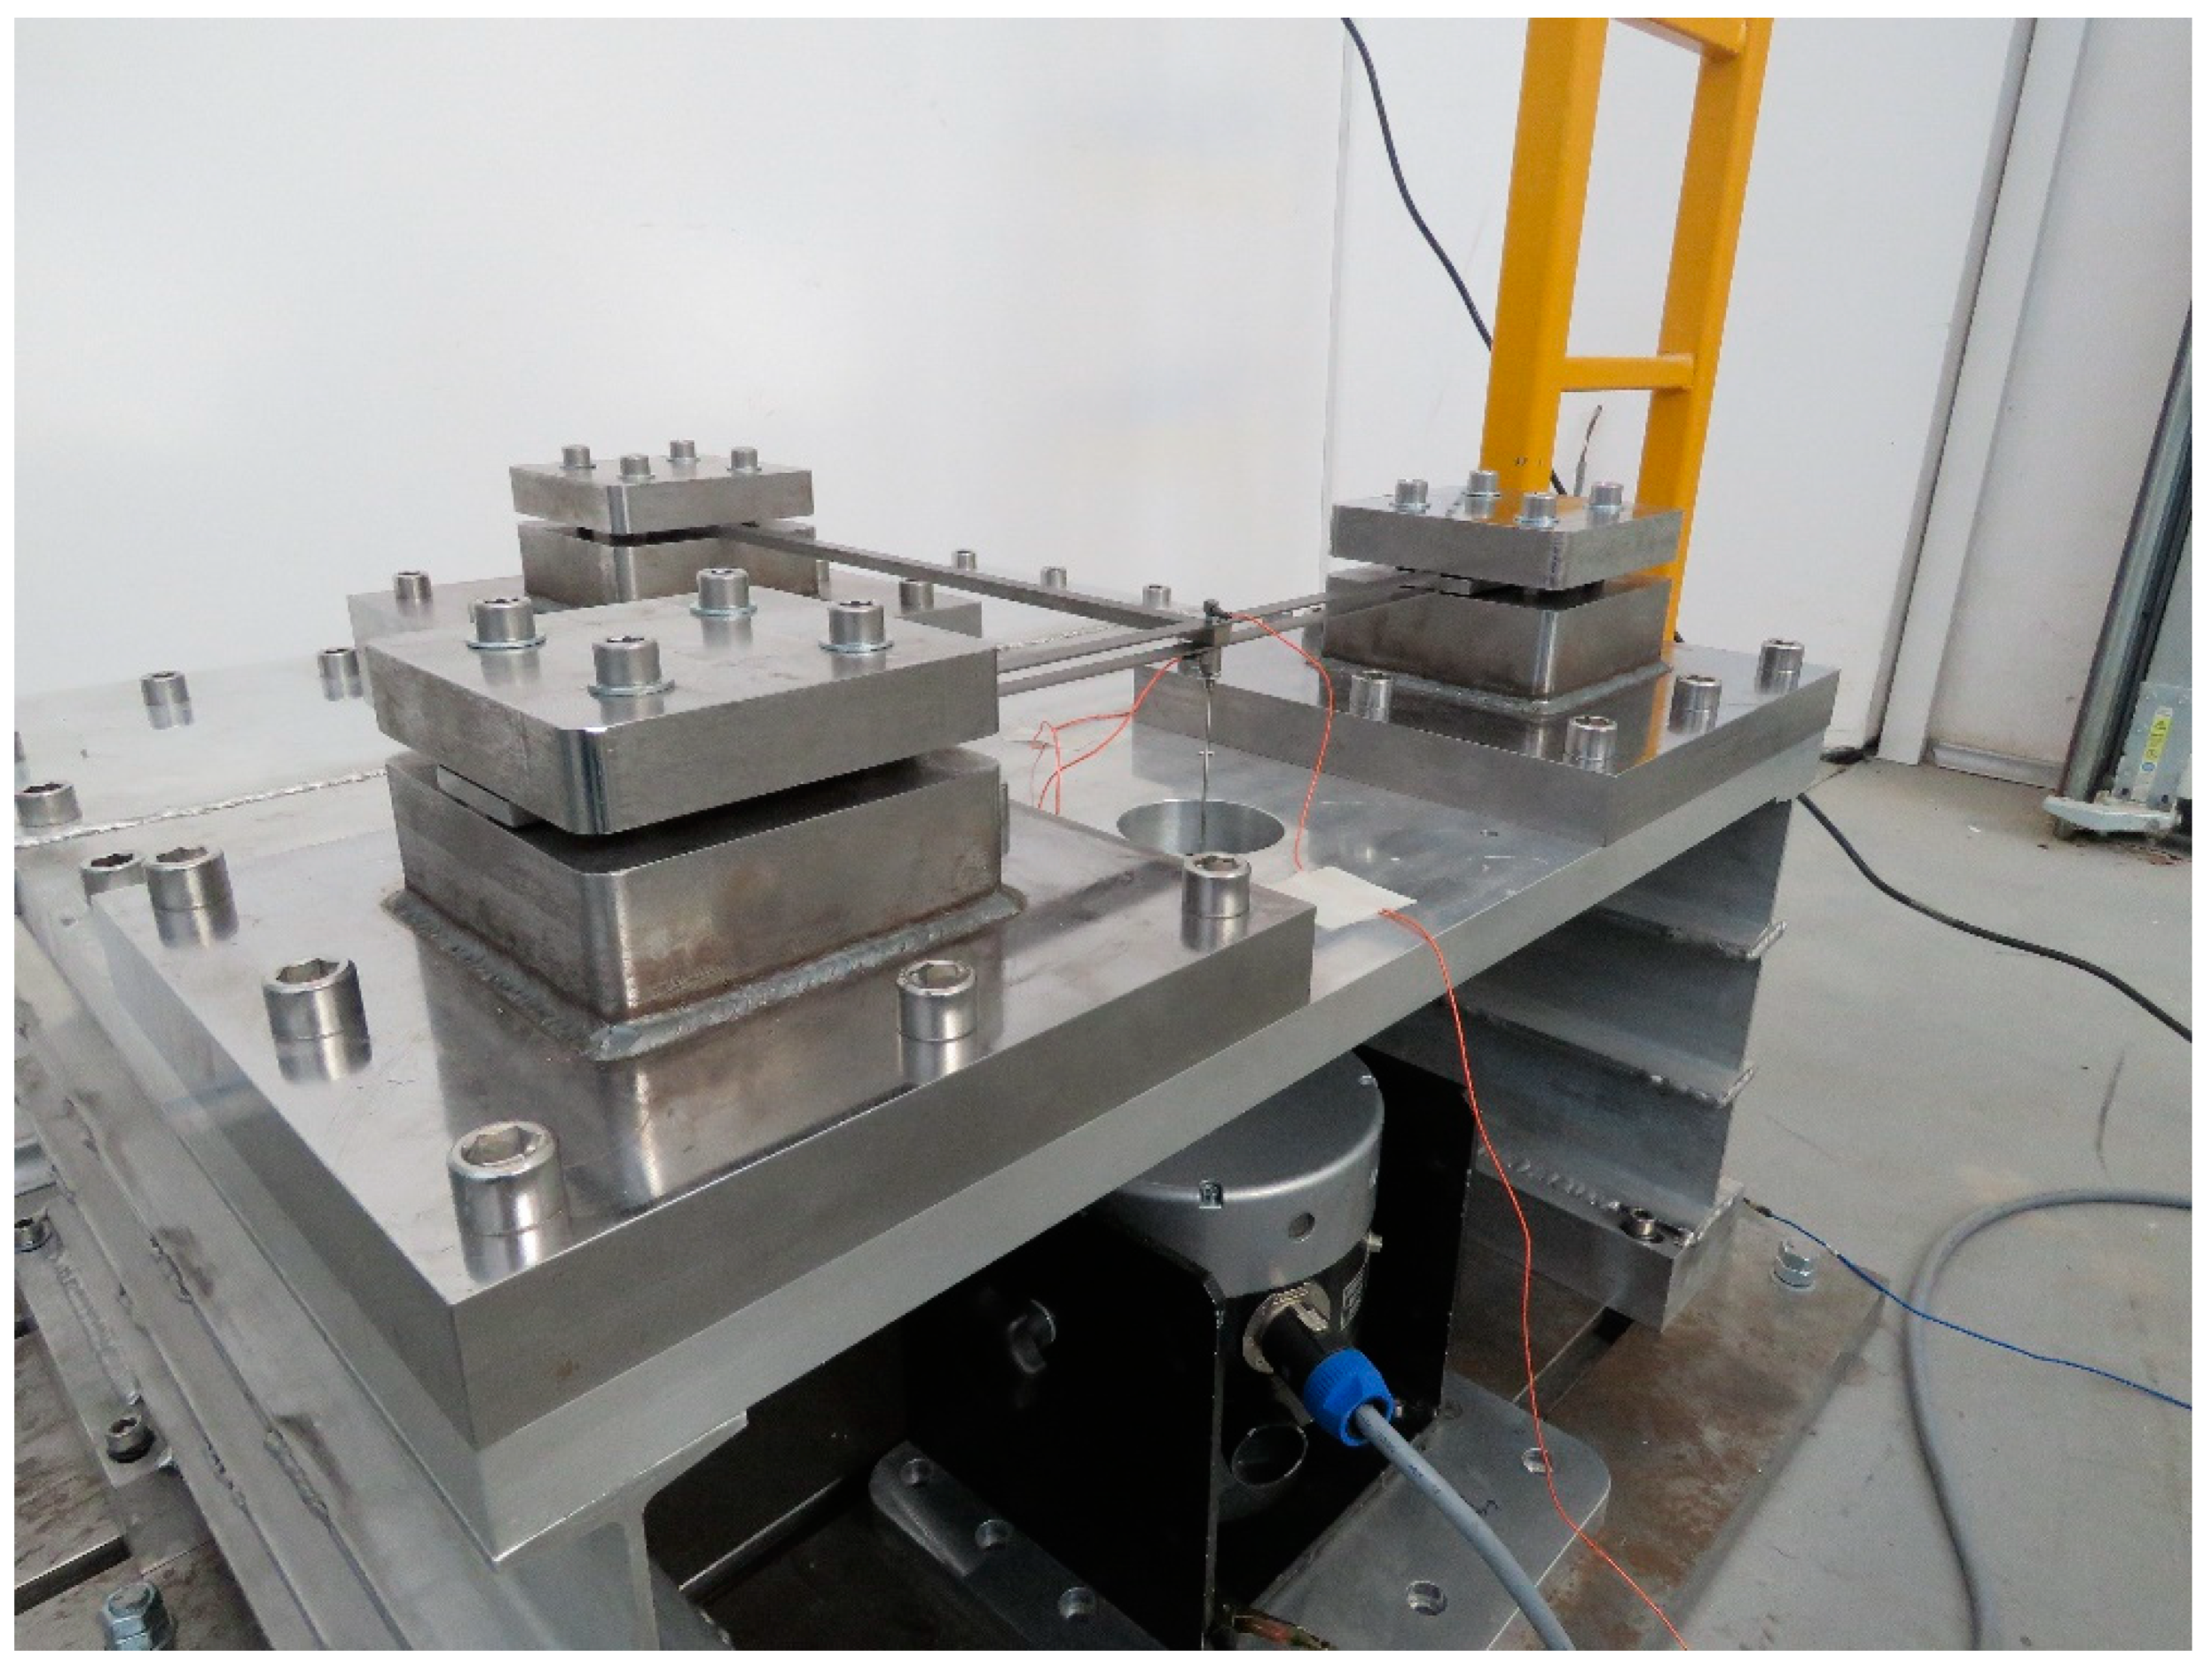
In the proposed method, harmonic excitation force spectra measured at several different constant displacement amplitudes are collected into a smooth HFS by using linear interpolation. Next, constant-force frequency response curves with smooth turning points and unstable branches (if there is any) are extracted by cutting the HFS with constant force planes. Finally, the backbone curve is determined by connecting the resonance peaks of these frequency response curves. Points which correspond to the same resonance frequency on the backbone curves that belong to different locations build-up the NNM of the structure under test. The proposed method is numerically validated on a 5 DOF lumped system which exhibits strong conservative nonlinearity due to cubic stiffnesses. Furthermore, the method is successfully applied on a cantilever beam with a nonlinear connection and a control fin actuation mechanism of a real missile structure. The cantilever beam is supported at its free-end by two metal strips constrained at both ends to create strong stiffening nonlinearity. The control fin actuation mechanism exhibits very complex and strong nonlinearity due to backlash and friction.

Author Contributions

Conceptualization, T.K. and H.N.Ö.; methodology, T.K. and H.N.Ö.; software, T.K.; validation, T.K.; formal analysis, T.K.; investigation, T.K.; data curation, T.K.; writing—original draft preparation, T.K.; writing—review and editing, H.N.Ö.; supervision, H.N.Ö. All authors have read and agreed to the published version of the manuscript.

Funding

This research received no external funding.

Acknowledgments

The provision of TÜBİTAK-SAGE for modal testing and analysis capabilities is gratefully acknowledged.

Conflicts of Interest

The authors declare no conflict of interest.

References

  1. Carney, K.; Yunis, I.; Smith, K.; Peng, C.Y. Nonlinear dynamic behavior in the Cassini spacecraft modal survey. In Proceedings of the 15th International Modal Analysis Conference (IMAC), Orlando, FL, USA, 3–6 February 1997. [Google Scholar]
  2. Ahlquist, J.R.; Carreño, J.M.; Climent, H.; de Diego, R.; de Alba, J. Assessment of nonlinear structural response in A400M GVT. In Proceedings of the 28th International Modal Analysis Conference (IMAC), Jacksonville, FL, USA, 1–4 February 2010. [Google Scholar]
  3. Noël, J.P.; Renson, L.; Kerschen, G. Complex dynamics of a nonlinear aerospace structure: Experimental identification and modal interactions. J. Sound Vib. 2014, 333, 2588–2607. [Google Scholar] [CrossRef] [Green Version]
  4. Kerschen, G.; Worden, K.; Vakakis, A.F.; Golinval, J.C. Past, present and future of nonlinear system identification in structural dynamics. Mech. Syst. Signal Process. 2006, 20, 505–592. [Google Scholar] [CrossRef] [Green Version]
  5. Noël, J.P.; Kerschen, G. Nonlinear system identification in structural dynamics: 10 more years of progress. Mech. Syst. Signal Process. 2017, 83, 2–35. [Google Scholar] [CrossRef]
  6. Adams, D.E.; Allemang, R.J. Survey of nonlinear detection and identification techniques for experimental vibrations. In Proceedings of the International Conference on Noise and Vibration Engineering, Leuven, Belgium, 16–18 September 1998. [Google Scholar]
  7. Setio, S.; Setio, H.D.; Jezequel, L.A. method of nonlinear modal identification from frequency response tests. J. Sound Vib. 1992, 158, 497–515. [Google Scholar] [CrossRef]
  8. Gibert, C. Fitting measured frequency responses using nonlinear modes. Mech. Syst. Signal Process. 2003, 17, 211–218. [Google Scholar] [CrossRef]
  9. Szemplinska-Stupnicka, W. The modified single mode method in the investigation of the resonant vibration of nonlinear systems. J. Sound Vib. 1979, 63, 475–489. [Google Scholar] [CrossRef]
  10. Göge, D.; Füllekrug, U.; Sinapius, M.; Link, M.; Gaul, L. Advanced test strategy for identification and characterization of nonlinearities of aerospace structures. AIAA J. 2005, 43, 974–986. [Google Scholar] [CrossRef]
  11. Platten, M.F.; Wright, J.R.; Dimitriadis, G.; Cooper, J.E. Identification of multi-degree of freedom nonlinear systems using an extended modal space model. Mech. Syst. Signal Process. 2009, 23, 8–29. [Google Scholar] [CrossRef]
  12. Londono, J.M.; Neild, S.A.; Cooper, J.E. Identification of backbone curves of nonlinear systems from resonance decay responses. J. Sound Vib. 2015, 348, 224–238. [Google Scholar] [CrossRef] [Green Version]
  13. Peeters, M.; Kerschen, G.; Golinval, J.C. Dynamic testing of nonlinear vibrating structures using nonlinear normal modes. J. Sound Vib. 2011, 330, 486–509. [Google Scholar] [CrossRef] [Green Version]
  14. Peter, S.; Leine, R.I. Excitation power quantities in phase resonance testing of nonlinear systems with phase-locked-loop excitation. Mech. Syst. Signal Process. 2017, 96, 139–158. [Google Scholar] [CrossRef]
  15. Renson, L.; Gonzalez-Buelga, A.; Barton, D.A.W.; Neild, S.A. Robust identification of backbone curves using control-based continuation. J. Sound Vib. 2016, 367, 145–158. [Google Scholar] [CrossRef] [Green Version]
  16. Karaağaçlı, T.; Özgüven, H.N. Experimental modal analysis of nonlinear systems by using response-controlled stepped-sine testing. Mech. Syst. Signal Process. 2021, 146. [Google Scholar] [CrossRef]
  17. Tanrıkulu, Ö.; Kuran, B.; Özgüven, H.N.; Imregün, M. Forced harmonic response analysis of nonlinear structures using describing functions. AIAA J. 1993, 31, 1313–1320. [Google Scholar]
  18. Peter, S.; Scheel, M.; Krack, M.; Leine, R.I. Synthesis of nonlinear frequency responses with experimentally extracted nonlinear modes. Mech. Syst. Signal Process. 2018, 101, 498–515. [Google Scholar] [CrossRef]
  19. Ferreira, J.V.; Ewins, D.J. Algebraic nonlinear impedance equation using multi-harmonic describing function. In Proceedings of the 15th International Modal Analysis Conference (IMAC), Orlando, FL, USA, 3–6 February 1997. [Google Scholar]
  20. Arslan, Ö.; Aykan, M.; Özgüven, H.N. Parametric identification of structural nonlinearities from measured frequency response data. Mech. Syst. Signal Process. 2011, 25, 1112–1125. [Google Scholar] [CrossRef]
  21. Karaağaçlı, T.; Özgüven, H.N. A frequency domain nonparametric identification method for nonlinear structures: Describing surface method. Mech. Syst. Signal Process. 2020, 144. [Google Scholar] [CrossRef]
  22. Shin, W.H.; Lee, I. Nonlinear aeroelastic analysis for a control fin with actuator. J. Aircraft 2007, 44, 597–605. [Google Scholar] [CrossRef]
  23. Ning, Y.; Nan, W.; Xin, Z.; Wei, L. Nonlinear flutter wind tunnel test and numerical analysis of folding fins with freeplay nonlinearities. Chin. J. Aeronaut. 2016, 29, 144–159. [Google Scholar]
  24. Muller, F.; Abeloos, G.; Ferhatoglu, E.; Scheel, M.; Brake, M.R.W.; Tiso, P.; Renson, L.; Krack, M. Comparison between control-based continuation and phase-locked loop methods for the identification of backbone curves & nonlinear frequency responses. In Proceedings of the 38th International Modal Analysis Conference (IMAC), Houston, TX, USA, 10–13 February 2020. [Google Scholar]
Figure 1. Frequency response curves measured in constant-force stepped-sine testing compared to the ones measured by RCT with HFS: (a) jump phenomenon; (b) premature jump.
Vibration 03 00019 g001
Figure 2. Experimental modal analysis with RCT and HFS.
Vibration 03 00019 g002
Figure 3. The 5 DOF system with cubic stiffness nonlinearity [16].
Vibration 03 00019 g003
Figure 4. Determination of the backbone curves (blue square markers) of the 5 DOF system corresponding to the 1st and 5th DOFs by using constant-force stepped-sine simulations. (a) The backbone curve of the 1st DOF; (b) the backbone curve of the 5th DOF.
Vibration 03 00019 g004
Figure 5. Construction of the HFS corresponding to the 1st DOF by combining harmonic force spectra with linear interpolation. (a) Harmonic excitation force spectra; (b) HFS of the 1st DOF [16].
Vibration 03 00019 g005
Figure 6. (a) HFS of the 1st DOF cut with constant force planes; (b) extraction of constant-force frequency response curves (black—ranging from 10 N to 50 N with 5N increments) and identification of the backbone curve (red) of the 1st DOF from HFS.
Vibration 03 00019 g006
Figure 7. (a) HFS of the 5th DOF cut with constant force planes; (b) extraction of the constant-force frequency response curves (black—ranging from 10 N to 50 N with 5 N increments) and the backbone curve (red) of the 5th DOF from HFS.
Vibration 03 00019 g007
Figure 8. Comparison of backbone curves obtained from RCT with HFS simulations with those obtained from constant force simulations: (a) the backbone curve of the 1st DOF; (b) the backbone curve of the 5th DOF.
Vibration 03 00019 g008
Figure 9. T-beam experimental setup.
Vibration 03 00019 g009
Figure 10. (a) Harmonic force spectra of the T-beam measured by RCT; (b) HFS of the T-beam built up by combining harmonic force spectra with linear interpolation [16].
Vibration 03 00019 g010
Figure 11. Validation of the frequency response curves of the T-beam extracted from HFS by using constant-force test results.
Vibration 03 00019 g011
Figure 12. Constant-force frequency response curves (0.1 N–1.4 N) and backbone curve of the T-beam at the T-junction obtained by cutting the HFS with various constant force planes.
Vibration 03 00019 g012
Figure 13. Sketch of the experimental setup for the real control fin actuation mechanism.
Vibration 03 00019 g013
Figure 14. (a) Harmonic force spectra of the control fin actuation mechanism measured by RCT; (b) HFS of the control fin actuation mechanism at the driving point, constructed by combining harmonic force spectra.
Vibration 03 00019 g014
Figure 15. Comparison of the frequency response curves of the control fin actuation mechanism at the driving point, extracted from HFS with those obtained by using constant-force test results in the sweep-up direction for: (a) force level F1; (b) force level F2; (c) force level F3.
Vibration 03 00019 g015
Figure 16. Constant-force frequency response curves and the backbone curve of the real control fin actuation mechanism at the driving point, obtained by cutting the HFS with various constant force planes.
Vibration 03 00019 g016

