Article

Coupled Wave-2D Hydrodynamics Modeling at the Reno River Mouth (Italy) under Climate Change Scenarios

by
Maria Gabriella Gaeta
1,*,
Davide Bonaldo
2,
Achilleas G. Samaras
3,
Sandro Carniel
2 and
Renata Archetti
1,2
1
Department of Civil, Chemical, Environmental, and Materials Engineering (DICAM), University of Bologna, Bologna 40136, Italy
2
Institute of Marine Sciences, National Research Council (CNR-ISMAR), Venice 30122, Italy
3
Department of Civil Engineering, Aristotle University of Thessaloniki, Thessaloniki 54124, Greece
*
Author to whom correspondence should be addressed.
Submission received: 4 July 2018 / Revised: 26 September 2018 / Accepted: 28 September 2018 / Published: 2 October 2018

Abstract

:
This work presents the results of the numerical study implemented for the natural area of Lido di Spina, a touristic site along the Italian coast of the North Adriatic Sea, close to the mouth of River Reno. High-resolution simulations of nearshore dynamics are carried out under climate change conditions estimated for the site. The adopted modeling chain is based on the implementation of multiple-nested, open-source numerical models. More specifically, the coupled wave-2D hydrodynamics runs, using the open-source TELEMAC suite, are forced at the offshore boundary by waves resulting from the wave model (SWAN) simulations for the Adriatic Sea, and sea levels computed following a joint probability analysis approach. The system simulates present-day scenarios, as well as conditions reflecting the high IPCC greenhouse concentration trajectory named RCP8.5 under predicted climate changes. Selection of sea storms directed from SE (Sirocco events) and E–NE (Bora events) is performed together with Gumbel analysis, in order to define ordinary and extreme sea conditions. The numerical results are here presented in terms of local parameters such as wave breaking position, alongshore currents intensity and direction and flooded area, aiming to provide insights on how climate changes may impact hydrodynamics at a site scale. Although the wave energy intensity predicted for Sirocco events is expected to increase only slightly, modifications of the wave dynamics, current patterns, and inland flooding induced by climate changes are expected to be significant for extreme conditions, especially during Sirocco winds, with an increase in the maximum alongshore currents and in the inundated area compared to past conditions.

1. Introduction

Strong anthropic pressures, together with the effects of a changing climate, are contributing to the recent increase in the vulnerability of coastal areas. This is particularly significant in the case of extreme events, which, even in the case of a possible decrease of the storminess, are expected to be superimposed to an increased sea level, with an overall intensification of the flooding hazard in coastal regions (for the Mediterranean Sea see for instance [1,2]).
The development of efficient tools to accurately represent nearshore wave and current-induced dynamics is essential for today’s operational and forecasting applications in coastal zones [3,4]. High-resolution wave and hydrodynamics modeling offer an extensive range of capabilities to support coastal planning and decision assessment, accounting for typical features at a coastal engineering scale, such as nonlinear processes of wave propagation and interactions between offshore and coastal structures and the inclusion of inshore boundary conditions, such as river run-off.
In recent years, research efforts have focused on the development of methodological frameworks based on advanced numerical modeling [5,6], which can be used to study the effects of future climate change scenarios affecting both the intensity and frequency of storm-surge events, wave climate, currents, sea-level rise, and riverine sediment discharge. Since the above-mentioned phenomena may increase the flood risk for coastal areas, the understanding of their dynamics at coastal scale becomes essential for the design of climate-change resilience protection and, in general, spatial planning activities.
Thus, the development of multipurpose measures mitigating erosion and inundation and increasing coastal defense efficiency requires a challenging prediction of sea forcings variation induced by the estimated effects of climate change.
Recently, regional future scenarios accounting for the Intergovernmental Panel on Climate Change (IPCC) sea-level projections at 2100 characterized by Representative Concentration Pathways equal to +8.5 W/m2 (hereafter RCP8.5) were applied along the Italian peninsula at DTM (Digital Terrain model) scale [7,8], in order to define the most vulnerable coastal areas in the country and to assess coastal mitigation and adaptation strategies in response to climate change [9]. This static GIS approach can be applied to indicate flood-prone areas at regional [10] or national [11] scales, which can potentially become inundated under future sea-level conditions [12]. However, the implementation of coupled wave-hydrodynamics models, in addition to this static approach, may be advisable on a local scale to obtain more accurate results in terms of nearshore dynamics connected to vulnerability levels and to account for processes of wave propagation, littoral drift, and coastal flooding.
The objective of the present paper is the description of an operational strategy for the development of a multiple-nesting system based on the implementation of open-source numerical models at a high resolution. The natural beach of Lido di Spina, in the vicinity of River Reno mouth, along the eastern coast of Northern Italy (Section 2), is selected to simulate nearshore dynamics induced by the projected effects of climate-change scenarios.
In the specific area of study presented here, we recall the efforts carried out in a 3D context [13,14,15] and in integrated 2D as well [16], the latter representing a good trade-off between computational costs and results. The proposed study aims to investigate on a site scale how climate changes may impact local parameters such as wave breaking position, alongshore currents intensity and direction and flooded area.
Section 3 describes materials and methods adopted in the present study: In Section 3.1, the framework of the multi-model approach is introduced by specifying the modeling chain of the implemented open-source models, namely, SWAN and TELEMAC. The results of two thirty-year numerical sea state simulations of past (1971–2000) and future (2071–2100) scenarios forced by the climate model COSMO-CLM, in a severe emission future scenario (RCP8.5 in [17]), are presented in Section 3.2, under ordinary and extreme sea events. The implementation of the high-resolution coastal model at the natural beach of Lido di Spina is described in Section 3.3. The model results for both simulated scenarios are discussed in terms of wave nearshore dynamics, current patterns, and flooded areas in Section 4. Conclusions derived from this study are presented in Section 5.

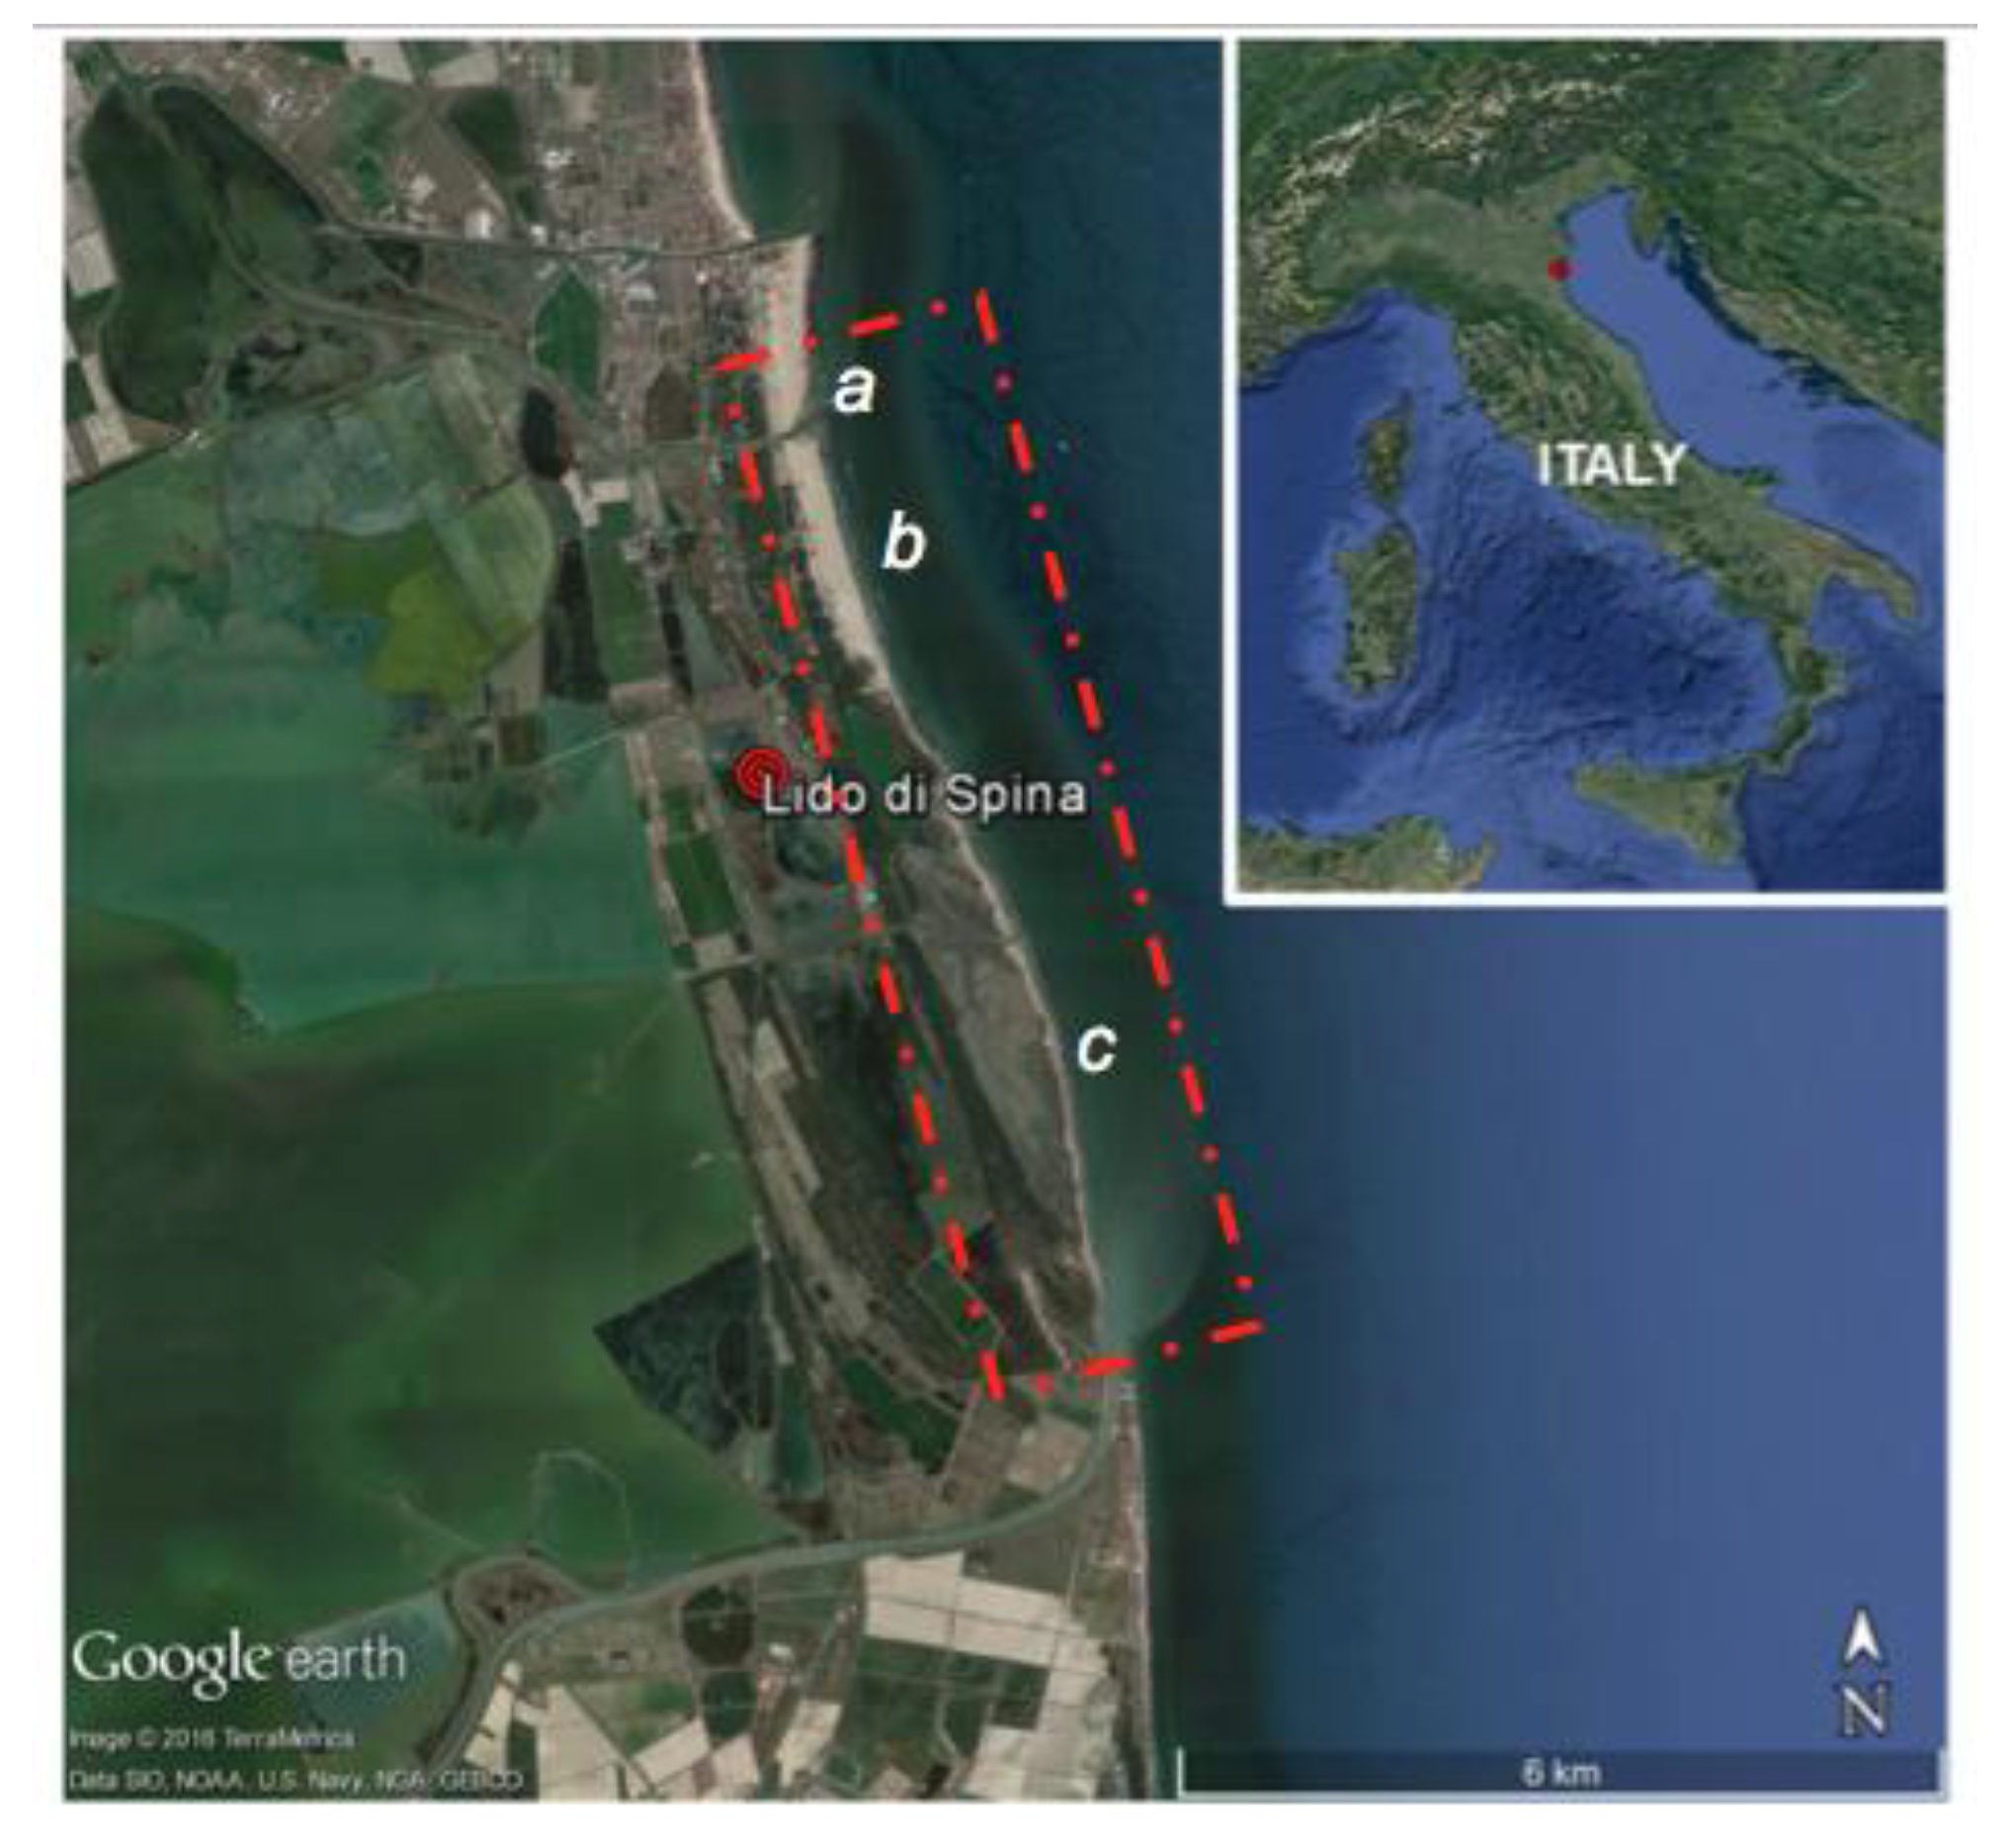
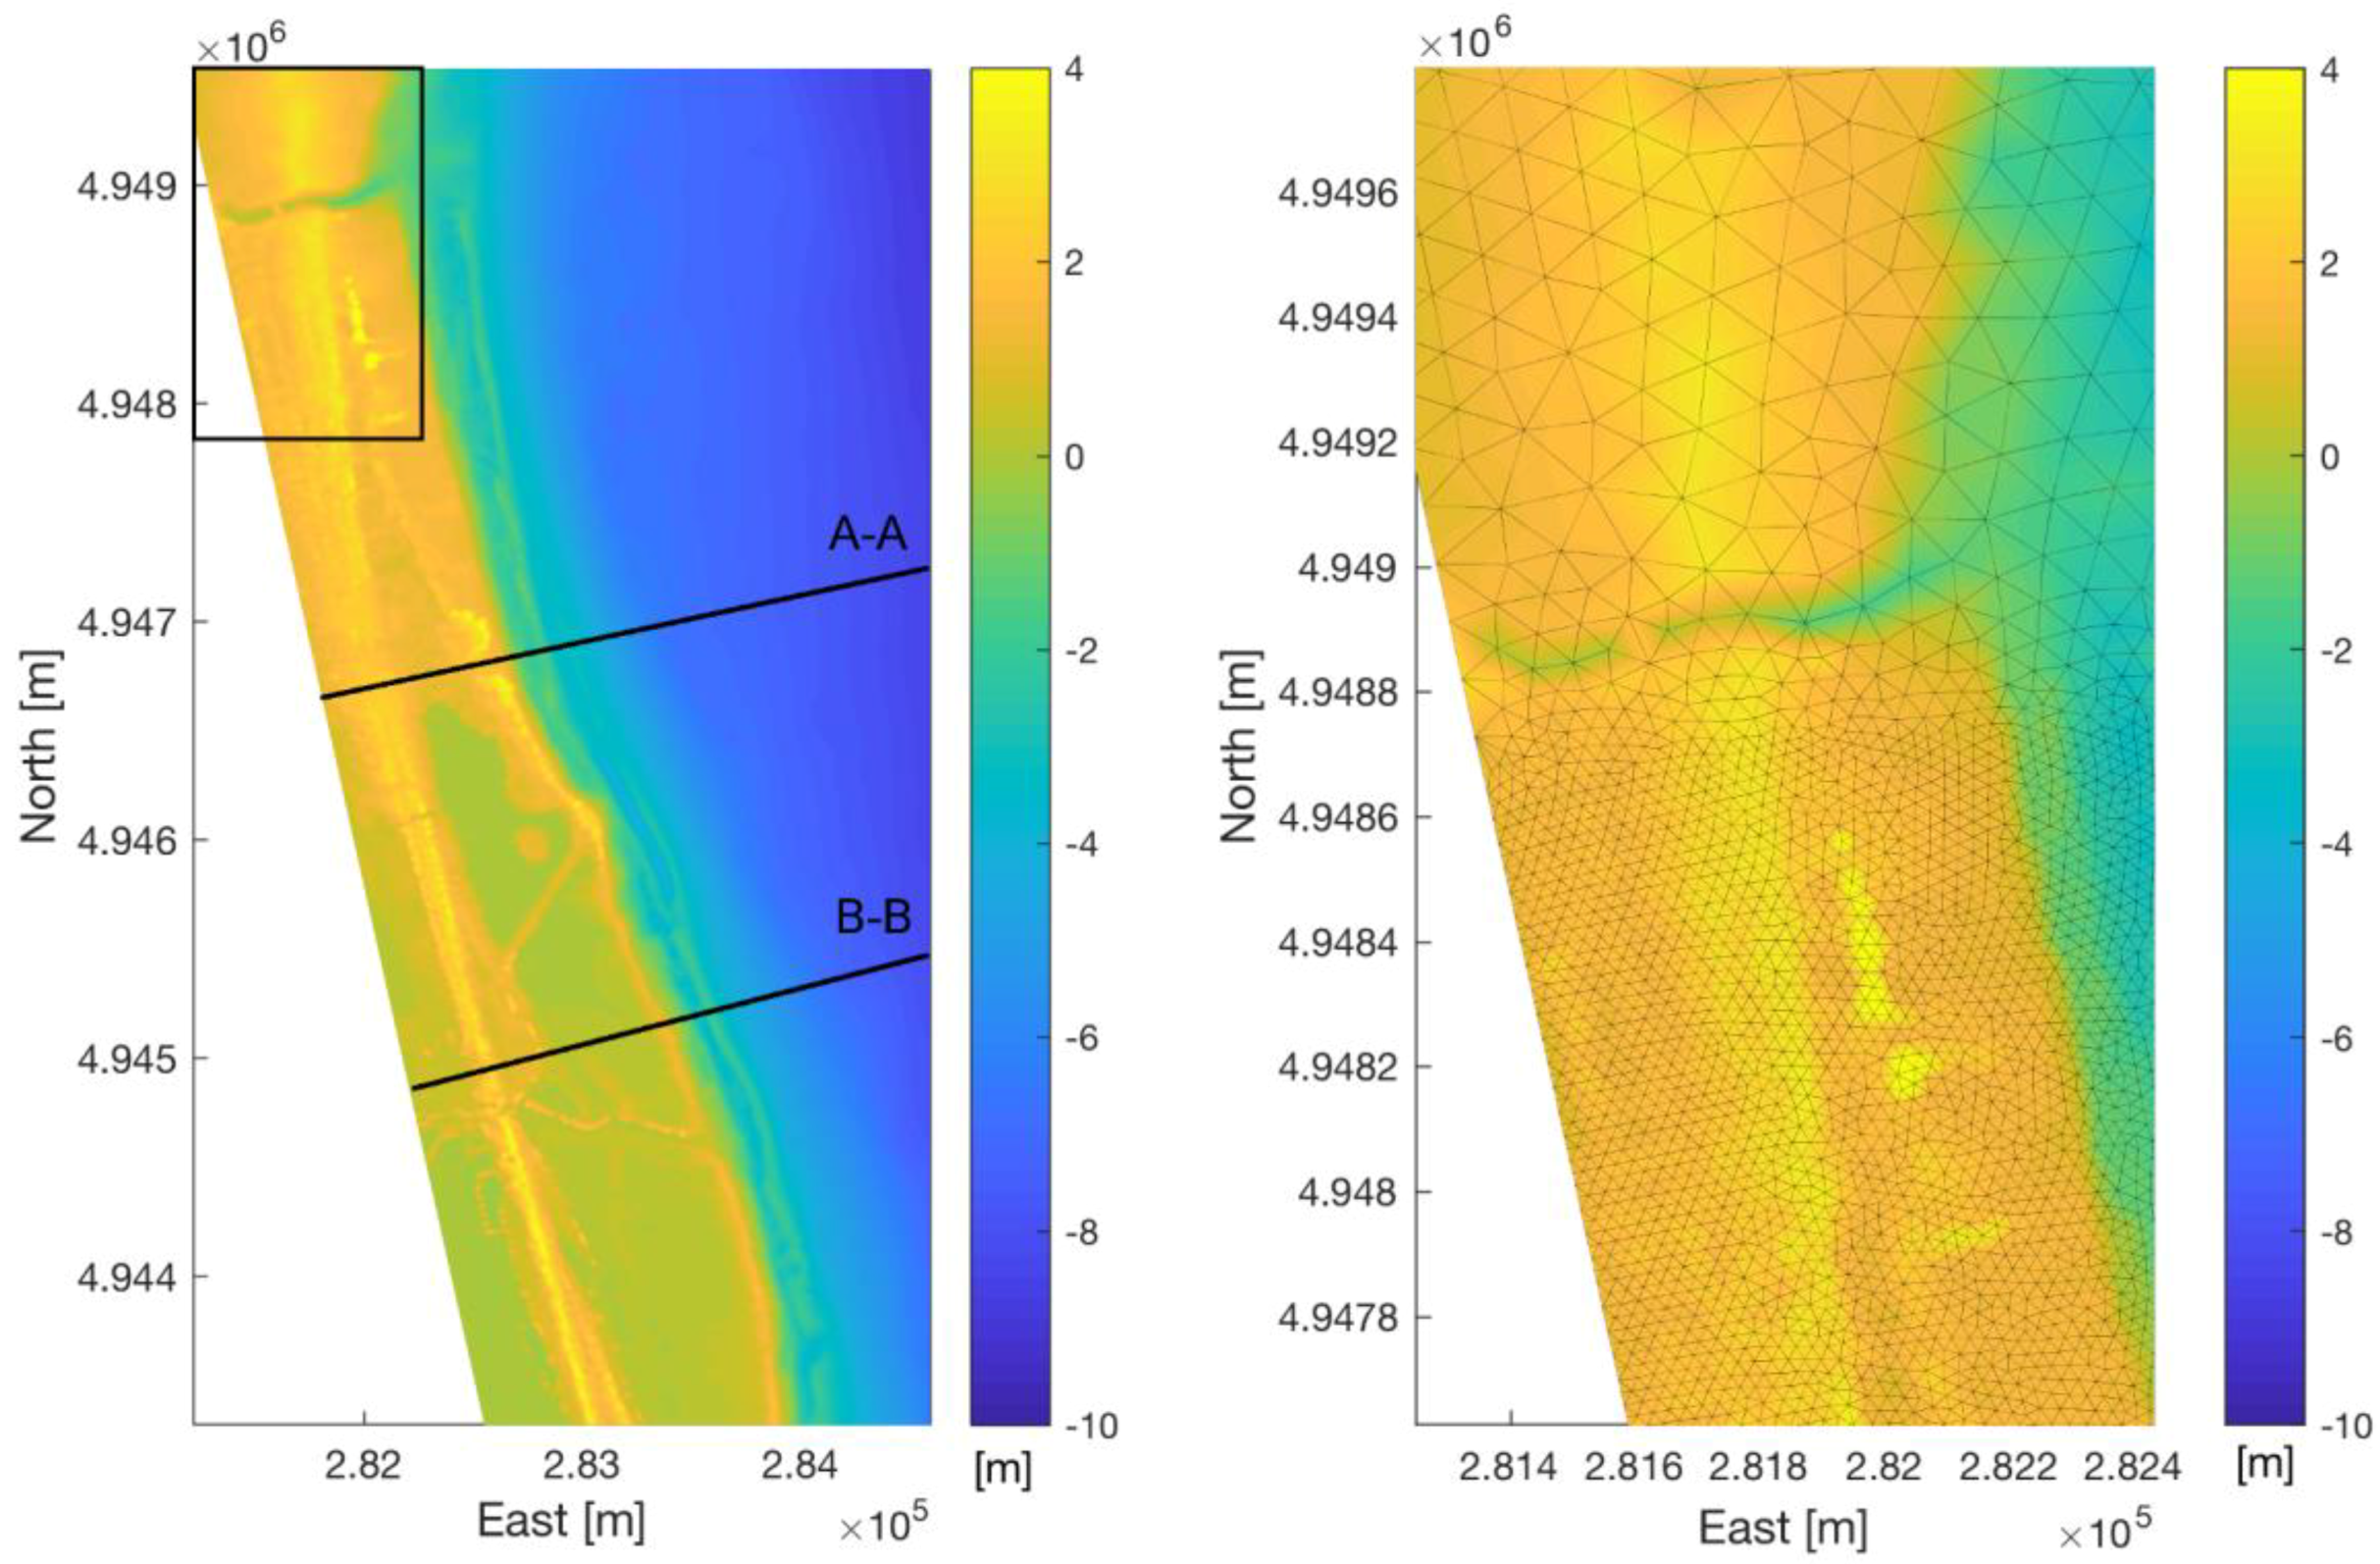
2. Description of the Study Area

Figure 1 shows the area selected as the representative study case: The natural beach of Lido di Spina and adjacent low-lying zones, located along the coast of Emilia Romagna Region, in the Northern Adriatic Sea. The zone was declared a National (Italian) Nature reserve in 1981, as part of the Po Delta Regional Park, and the Sites of European Community Importance under Directive 92/43/EEC. The site was an extremely dynamic area, under erosion in the last decade and exposed to several climate change related effects, e.g., higher occurrence of flooding and beach retreat [18,19].
The modeled site includes, from North to South, the coastal area between the south-side of Porto Garibaldi and the Reno River mouth (Figure 1), and comprises the mouth of Logonovo channel (zone a) at Lido degli Estensi, where sediments transported northwards from the Reno outflow are intercepted by the jetty of Porto Garibaldi, the touristic shoreline of Lido di Spina (zone b), and the old outlet plain of Gobbino channel (zone c) with low-lying plains.
As is common in all the Northern Adriatic Sea, the wave climate in the study site is characterized by storms mainly generated by northeasterly and southeasterly winds, named Bora and Sirocco, respectively [20,21], the latter inducing the highest surge levels [9].
The investigated area is subject both to a high rate of coastal erosion, with a beach retreat of about 3 km over the last 70 years and a total of about 75 ha of land lost, and to high, human-induced land subsidence due to fluid extraction and off-shore gas platforms activity [22,23]. Moreover, the coastal area presents highly urbanized touristic resorts, known for the wide and sandy open beaches and the natural areas of the Po Delta Park.
The recent local management strategies to protect the area from flooding and erosion have been based on frequent beach nourishments, using depositional materials from the north of the study area, and on the construction of defense structures, such as stone revetments (especially in the area northern the mouth of the River Reno, see [18]). Sea banks along the coastal area strongly preserved it from inundation, although these defense structures may turn out to be rather ineffective in case of poor maintenance and frequently occurring storm events have rendered these defense structures ineffective [24]. In addition, important morphological variations at the mouth of the River Reno, as those related to the deconstruction of the final part of its right riverside, partly compromised the inland safety.

3. Materials and Methods

3.1. Adopted Methodology and Numerical Modelling Chain

The proposed multiple-nesting methodology is based on a progressive down-scaling, from global climate to coastal models, as described in the following.
  • Wind fields in the Adriatic Sea are obtained every 6 h at 8 km horizontal resolution from the Regional Climate Model (RCM) COSMO-CLM [26], a climate version of the operational weather forecast model COSMO-LM [27]. The simulation generating this dataset [28] encompasses the Italian peninsula and its marine regions, describing the climate evolution under the IPCC RCP8.5 scenario [29,30] in the period 1971–2100. The model is initialized by ERA-Interim Reanalysis [31], and the same model provided boundary conditions for the period 1971–2005, and by the coupled atmosphere-ocean general circulation model CMCC-CM [32] in the period 2006–2100. Compared to previous implementations [33], the validation of the COSMO-CLM wind fields based on in-situ observations along the Italian coast [34] exhibits a particular skill in capturing the wind directional distribution. In turn, results on climatological projections suggest a tendency towards an overall wind energy decrease (in the range of 0–10% across the whole Adriatic Sea), with a stronger decrease along the Bora jets patterns.
  • The spectral properties of the sea states in the Adriatic basin are described by means of the phase-averaged wave model SWAN [35] forced by the climatological wind fields from RCM COSMO-CLM [34]. Wave model simulations are carried out under the severe climate change conditions envisaged by the IPCC RCP8.5 scenario in the period 2071–2100 (henceforth referred to as SCE—SCEnarios—dataset) and, for an overall assessment of the model performances, under control conditions in the period 1971–2000 (henceforth referred to as CTR—ConTRol—dataset). The geographical SWAN domain, encompassing the whole Adriatic Sea, is discretized into a curvilinear orthogonal grid with a resolution ranging approximately from nearly 10 km in the southeastern regions to 2 km along the northern Italian coasts. The spectral domain is divided into 25 logarithmically-distributed values between 0.05 and 0.5 Hz and 36 directional sectors. Since the focus of the model is on the northern basin and in the absence of regional wave dataset consistent with the wind forcing, following the same approach described by previous studies [36,37], no waves are prescribed entering the southern boundary, whereas internally-generated energy is allowed to radiate outward.
  • The coupled wave-2D hydrodynamics model of the natural beach of Lido di Spina (Figure 1) is implemented by means of the TELEMAC suite [38]. The above-described SWAN results of wave field are extrapolated at the offshore boundary nodes of the detailed mesh performed for TELEMAC runs. The spectral module TOMAWAC (henceforth denoted as TOM [38]) is forced under control and climatological scenarios, and wave-induced currents are taken into account coupling the 2D hydrodynamics module TELEMAC2D (henceforth denoted as TEL2D [39]).
Table 1 shows the numerical characteristics of each of the different modeling chain level of the proposed nesting approach, i.e., the model extension, the mesh-size range, the simulated period, the type of run, and the forcings inducing atmospheric and sea dynamics.
The level (a) of the modeling chain, although described in the table, is not discussed in the present study, since its implementation and results are largely described and examined in [28]. Its numerical outputs, such as wind fields under different scenarios, are used to force the wave model SWAN, developed by [34] for the Adriatic Sea, namely, the chain level (b).
The numerical results of SWAN offshore the study site are (1) statistically elaborated and compared to the transposed observations and under CTR and SCE scenarios, (2) analyzed in order to identify extreme events and estimate Gumbel distributions for each simulated scenario, and (3) used to force the TELEMAC model, implemented at high resolution for the beach of Lido di Spina. Details on the statistics applied on the SWAN outputs and on the sea state conditions simulated by TELEMAC are given in the following sections.

3.2. Past and Projected Future Wave Climate Scenarios

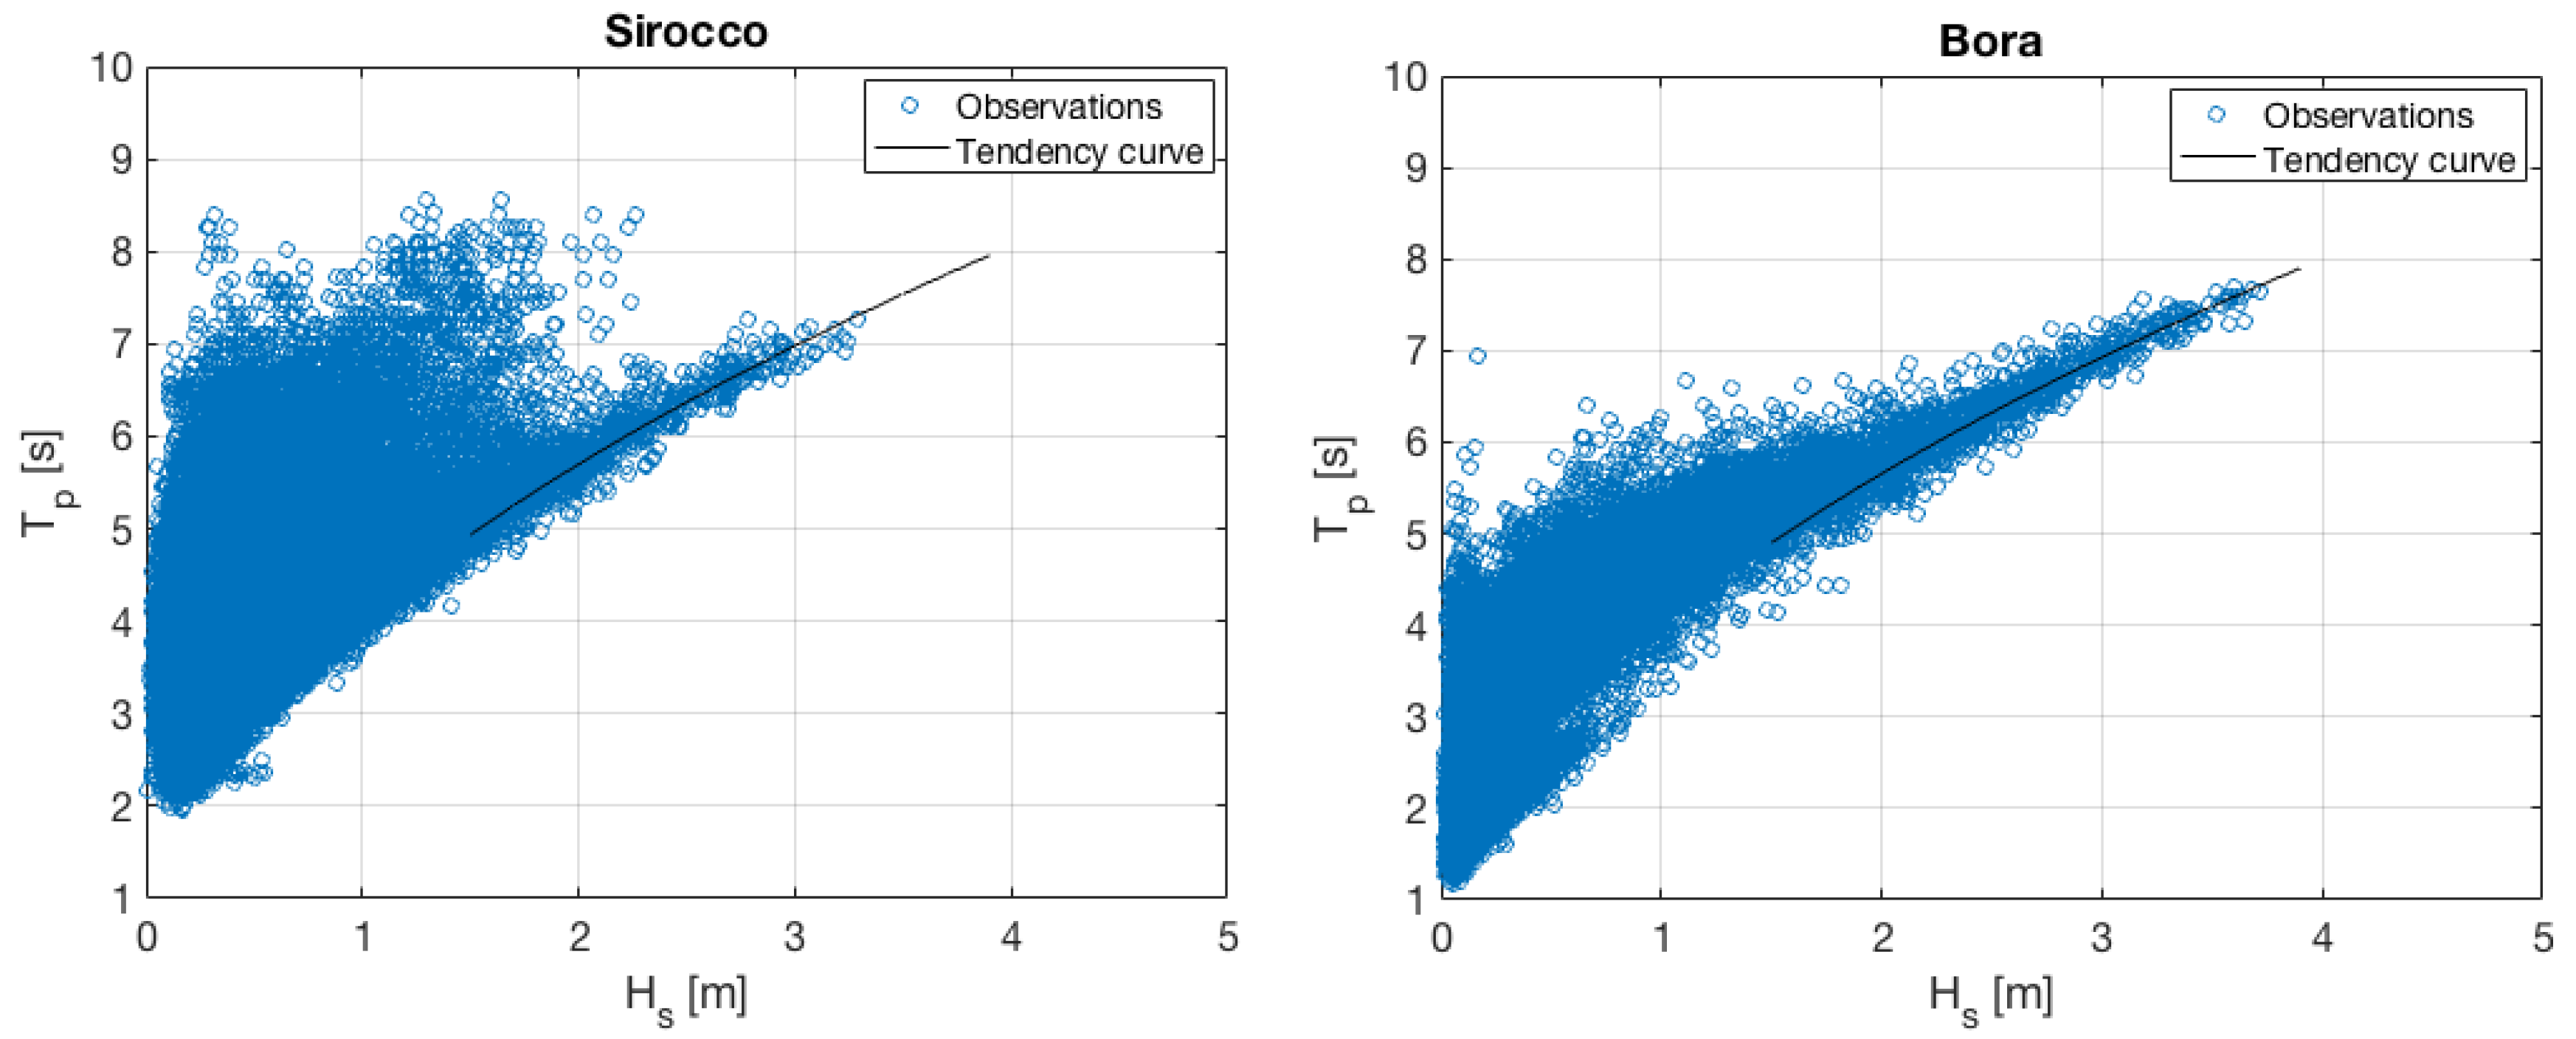
3.2.1. Statistics on Wave Forcings

The 10-year-long data acquired by the regional NAUSICAA buoy, offshore the near coastline of Cesenatico, at a water depth of 10 m (data available at http://www.smr.arpa.emr.it/dext3r), are analytically transposed offshore the study site. Since the buoy data are not measured at waters deep enough to neglect the refraction effect on the wave directions [40]—that are supposed to be actually altered by refraction—the recorded waves at NAUSICAA are already slightly rotated towards the perpendicular to isobaths lines, ranging approximately between 55 and 60° N.
The wave rose showing the distribution of the significant wave height and the mean wave directions at the study area and as a result of the transposed observations is presented in Figure 2, showing that:
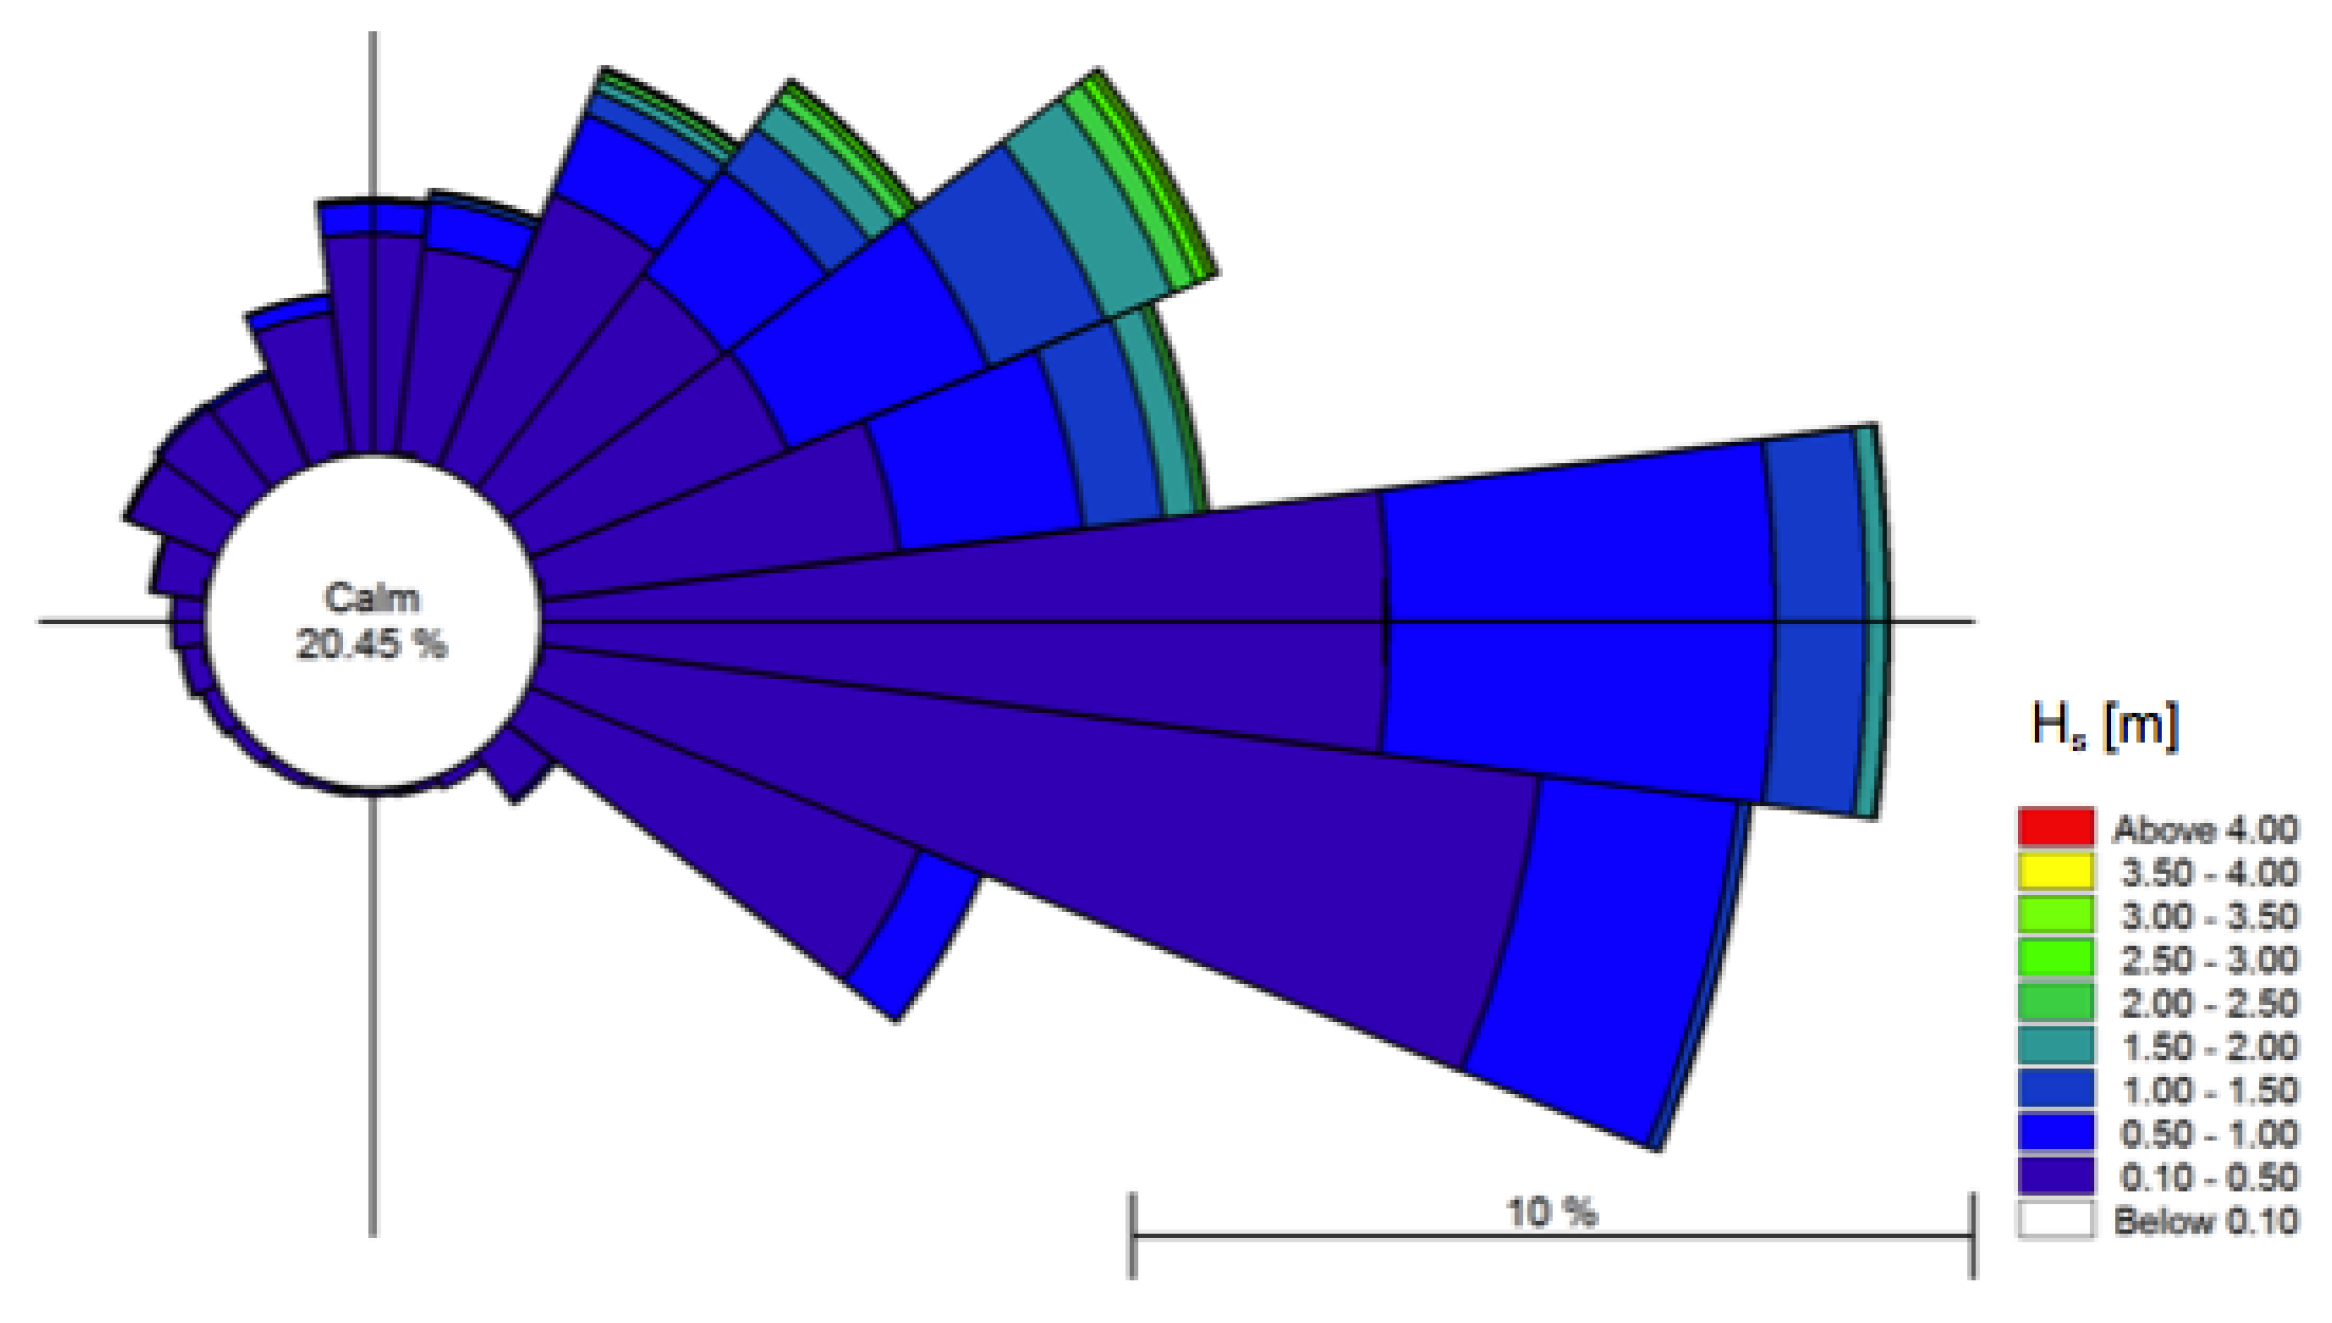
  • the most energetic waves, up to 3.7 m of height, propagate from sectors 50–60° N;
  • the most frequent conditions, with wave height up to 1 m, come from 100° N;
  • calm sea conditions comprise 20.45% of annual frequency.
For the simulations carried out in this work, SWAN outputs are retrieved offshore the beach of Lido di Spina, at the nearest grid nodes to the offshore boundary of the implemented TELEMAC.
The seasonal variability of the monthly average of the significant wave height for Sirocco and Bora events is reported in Figure 3, both for the 30-year-long numerical simulations by the SWAN model results under CTR and SCE scenarios and for the transposed measurements from the 10-year-long NAUSICAA buoy records.
A slightly local increase in wave energy intensity is forecasted for events from Sirocco and especially during winter, while Bora energy tends to decrease on average. By comparing with CTR runs, the available transposed observations show good agreement in case of Sirocco events, while, during Bora events, the numerical results underestimate the monthly average of the significant wave height in winter and fall seasons, despite a slight overestimation during summer events.

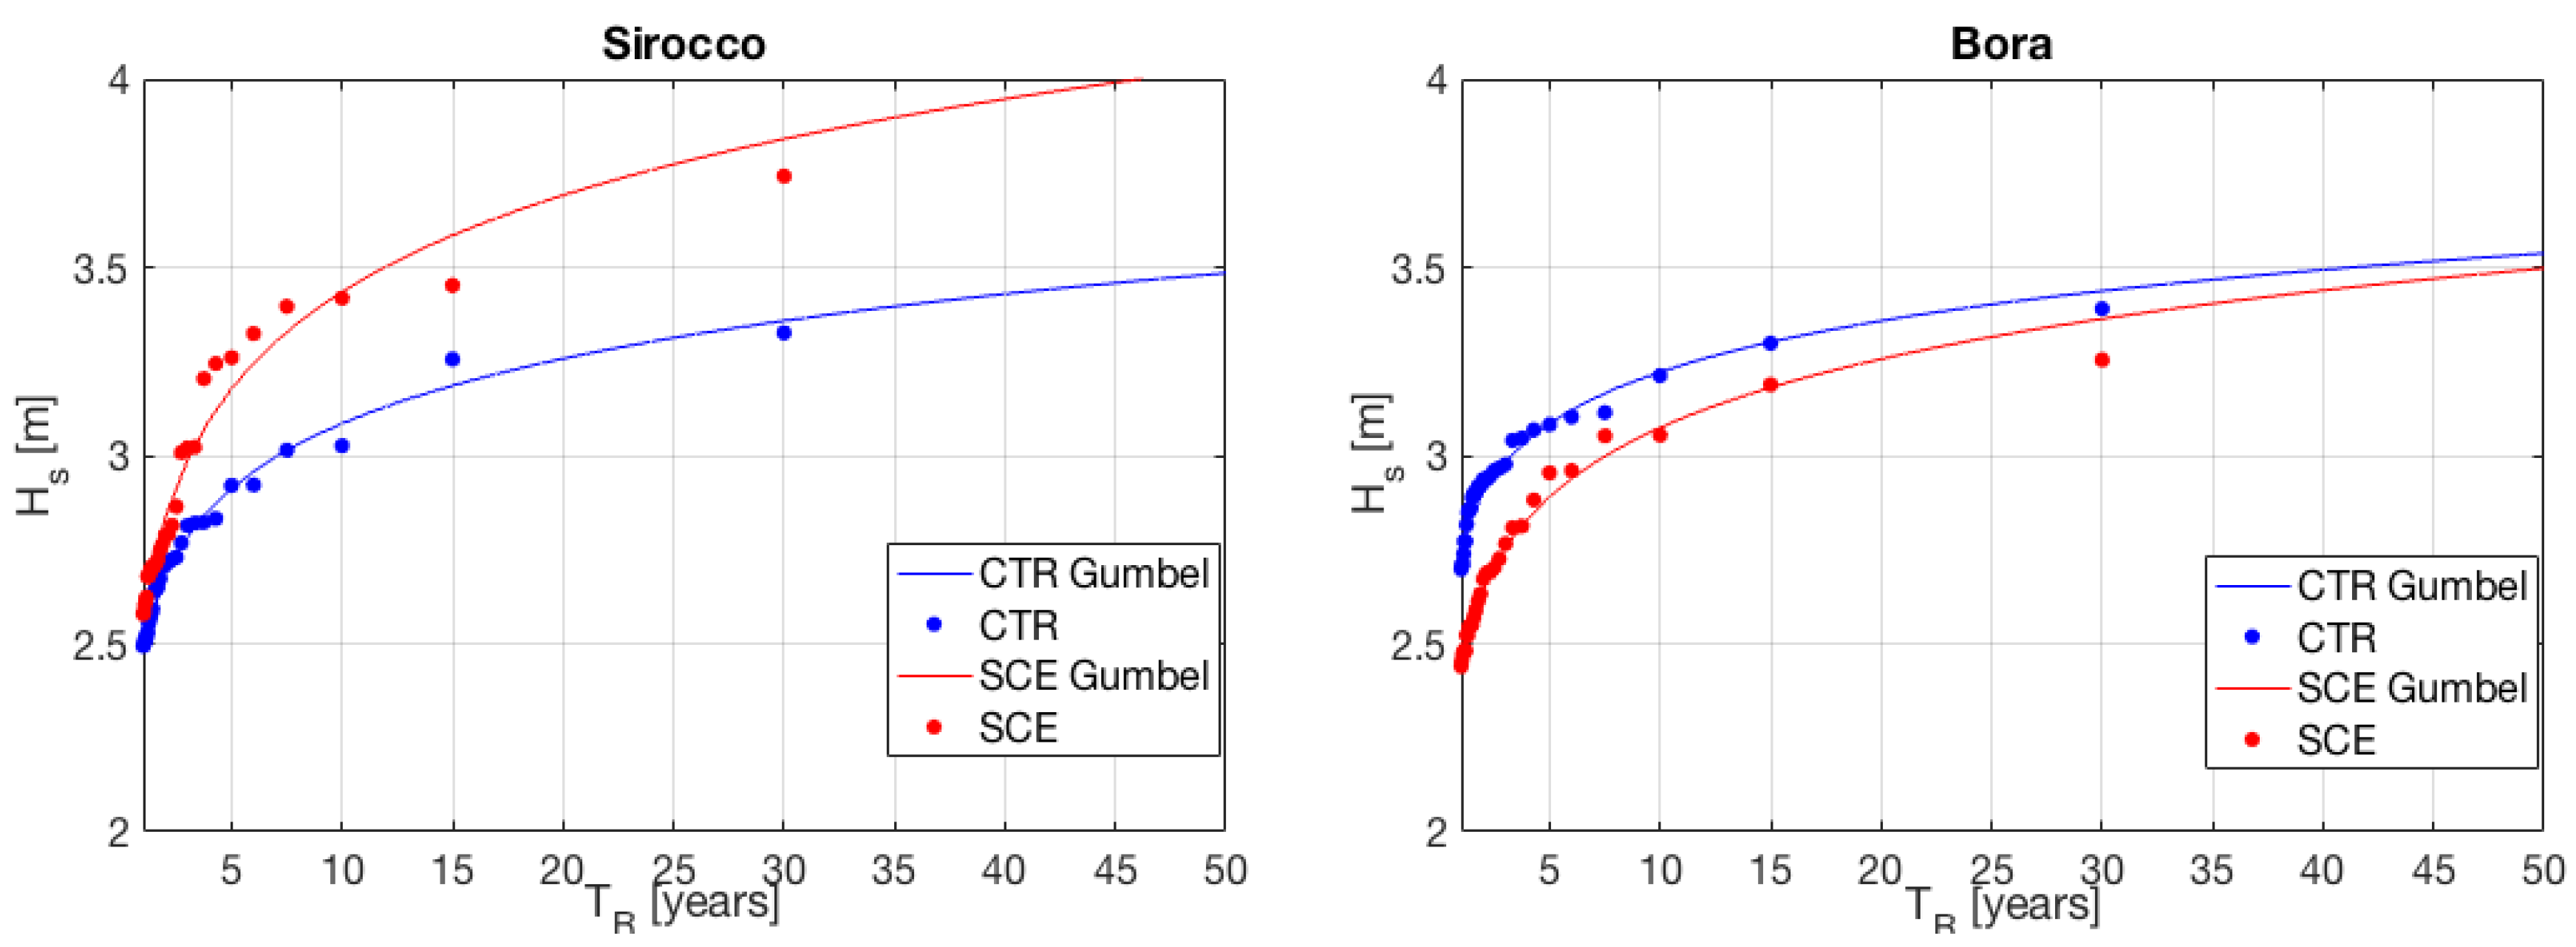
3.2.2. Extreme Event Analysis: Joint Probability of Significant Wave Height, Period, and Sea-Level Rise

Storms are identified following the procedure proposed by [41] and classified based on their generating wind direction (Sirocco or Bora). For each of the two dominant directions, extreme events are analyzed considering the return period (henceforth referred to as TR) associated with their maximum significant wave height and fitting the modeled storms with a return period greater than 1 year by means of Gumbel distributions.
In comparison with the control scenario, the analysis in Figure 4 reveals a significant increase in the extreme events coming from Sirocco for the future projection, which is also expected to be important for return periods greater than 50 years; on the other hand, extreme Bora events are expected to reduce their occurrence at the study site.
The joint distributions of the significant wave height Hs and the peak wave period Tp along the offshore boundary of TELEMAC model are obtained from the transposed observations and plotted in Figure 5 for Sirocco (left panel) and Bora (right panel) events.
The two variables can be directly correlated for extreme events (i.e., Hs > 2 m) with an exponential law (black lines in Figure 5), giving a correlation coefficient of 0.92 and 0.97 for Sirocco and Bora, respectively.
The effects of the peak water level, including high tidal level and storm surge, are included in the numerical simulations of the study site, following the accurate analysis performed by [40]. They applied a joint probability analysis by means of a copula-based approach [42] to the registered significant wave heights at NAUSICAA buoy and to the contemporary peak water levels measured at Porto Corsini, located 20 km south of Lido di Spina.
Thanks to the proposed cumulated density functions for the two contemporary variables, peak water levels with return periods TR equal to 1 year and 25 years are extracted for the present study, under the assumption that extreme sea storms are generated and forced by same meteorological events at the two locations, i.e., Cesenatico and Lido di Spina.
The authors of [1,43] suggested the existence of strong correlation in the Northern Adriatic Sea between winds and maximum sea levels induced by meteorological events, and this aspect is particularly evident during Sirocco events. Under future scenario conditions, their validated simulations showed how inter-annual evolution of maximum sea levels is expected to be essentially stable from 2051 to 2100, as well as how unchanged extreme statistics for events characterized by return period of less than 100 years [44]. Following these future projections, no modifications in the extreme statistics connecting peak sea-water levels and significant wave heights are reasonably assumed; therefore, also for SCE runs, the peak water levels contemporary to extreme significant wave heights are also extrapolated by the authors of [40].
Finally, sea-level rise in the SCE runs is taken into account by uniformly increasing the bottom depth by +0.70 m: This is a basin-scale bulk estimate based on the recent projections provided by [8] for the Northern Adriatic Sea, based on the authors of [17,45] adopting RCP8.5 scenarios of climate change and adjusting them to the projected rates of vertical land movements (isostasy and tectonics).
Table 2 summarizes all the conditions used in this work for the TELEMAC simulations, in terms of sets of significant wave height Hs, peak period Tp, mean wave direction Dir, peak water level PWL (comprising higher tidal level and storm surge), and the expected sea-level rise SLR values.

3.3. Set-up of the Coupled Wave-2D Hydrodynamics Numerical Model

Approaching the coastal region, waves generated offshore are influenced by shoaling, refraction, and loss of energy either due to bottom friction or wave breaking [46]. To simulate all these physical processes, including wave-induced currents, the present study is carried out using the wave and hydrodynamics models of the TELEMAC-MASCARET suite that is distributed under a General Public License and is available at TELEMAC [47].
The suite comprises finite-element-based solvers to simulate shallow water hydrodynamics and wave propagation, and is able to model inshore water levels and wave spectra under different forcings. The different included modules can simulate wind wave propagation, ground water flows, tracer transport, sediment transport, and morphodynamics.
In the proposed approach, the wave and 2D hydrodynamics modules of TELEMAC are implemented in order to propagate offshore waves and currents, and reproduce nearshore dynamics and flood processes.
TOM module is a third-generation spectral wave model and solves a simplified equation for the spectral-angular density of wave action by means of a finite-element type method, in order to describe wave propagation and dynamics in coastal areas [38]. The model takes into account bathymetric wave breaking, bottom friction, non-linear wave-wave interactions, wind wave generation, and white-capping. The authors of [48] showed that it is also able to represent the spread wave fields induced by the presence of sandbanks in the nearshore region.
TEL2D module solves the 2D shallow water equations (also referred to as Saint-Venant equations [39]), derived by integrating the Reynolds-averaged Navier-Stokes equations over the flow depth. Several options for the horizontal diffusion terms (depth-averaged k-ε, or constant eddy viscosity models) and source terms (atmospheric pressure gradients, Coriolis force, etc.) could be chosen in the model setup, while the numerical discretization adopts classical methods for the advection terms, such as characteristics, and distributive schemes. Recently, the implementation of implicit schemes enabling relaxation of the CFL limitation on time steps made TEL2D applicable to the treatment of tidal flats, ensuring positive water depth and mass conservation without extra limitation of the time step [49,50].
Since using the same horizontal discretization with a series of Delaunay triangular unstructured elements, the two described modules can be directly coupled (two-way coupling) to account for the effects of waves on the mean coastal circulation reproducing wave-induced currents leading to littoral drift. The gradients of the radiation stress induced by waves are computed using the theory of [51] as part of the hydrodynamics equations in TEL2D.
The implementation of the numerical models in TELEMAC suite, after a series of preliminary tests on the optimal edge dimension for the mesh by using the freely-available pre-processing tool Blue Kenue™ [52], results in a variable density unstructured mesh, consisting of two density areas, the characteristic triangular element size being set to 25 m close to the shore and on the inland areas, in order to better capture the presence of sandbanks and nearshore seabed profiles, and to 50 m for the rest of the computational domain; the total number of nodes is equal to 40,350.
LIDAR topo-bathymetrical data collected by Emilia Romagna Region in 2012 with a spatial resolution up to 1 m are interpolated on the implemented mesh as presented in Figure 6, allowing a detailed analysis of wave-induced hydrodynamics and floods under different sea-level rise scenarios.
TOM and TEL2D are properly set up for the studied area based on previous experience on coupled wave-2D hydrodynamics runs for the representation of nearshore processes, as presented in [53,54]. The processes included in the wave model simulations are (a) energy dissipation due to wave breaking according to [55], (b) energy dissipation due to bottom friction according to [56], and (c) nonlinear transfer of energy due to triad (three-wave) interactions according to [57]. No movable seabed, no defense breaching, and no past subsidence-induced movements are assumed in the study.
The simulated conditions as described in Table 2 are performed for the duration necessary to reach the equilibrium states for all the spectral and hydrodynamics variables, i.e., 3 h, and the presented results are extracted at the final time step of the computations.

4. Results and Discussion

Numerical outputs from TELEMAC runs under CTR and SCE scenarios and for Sirocco and Bora events are presented in the following sections, in terms of wave nearshore dynamics, current patterns, and flooded areas.

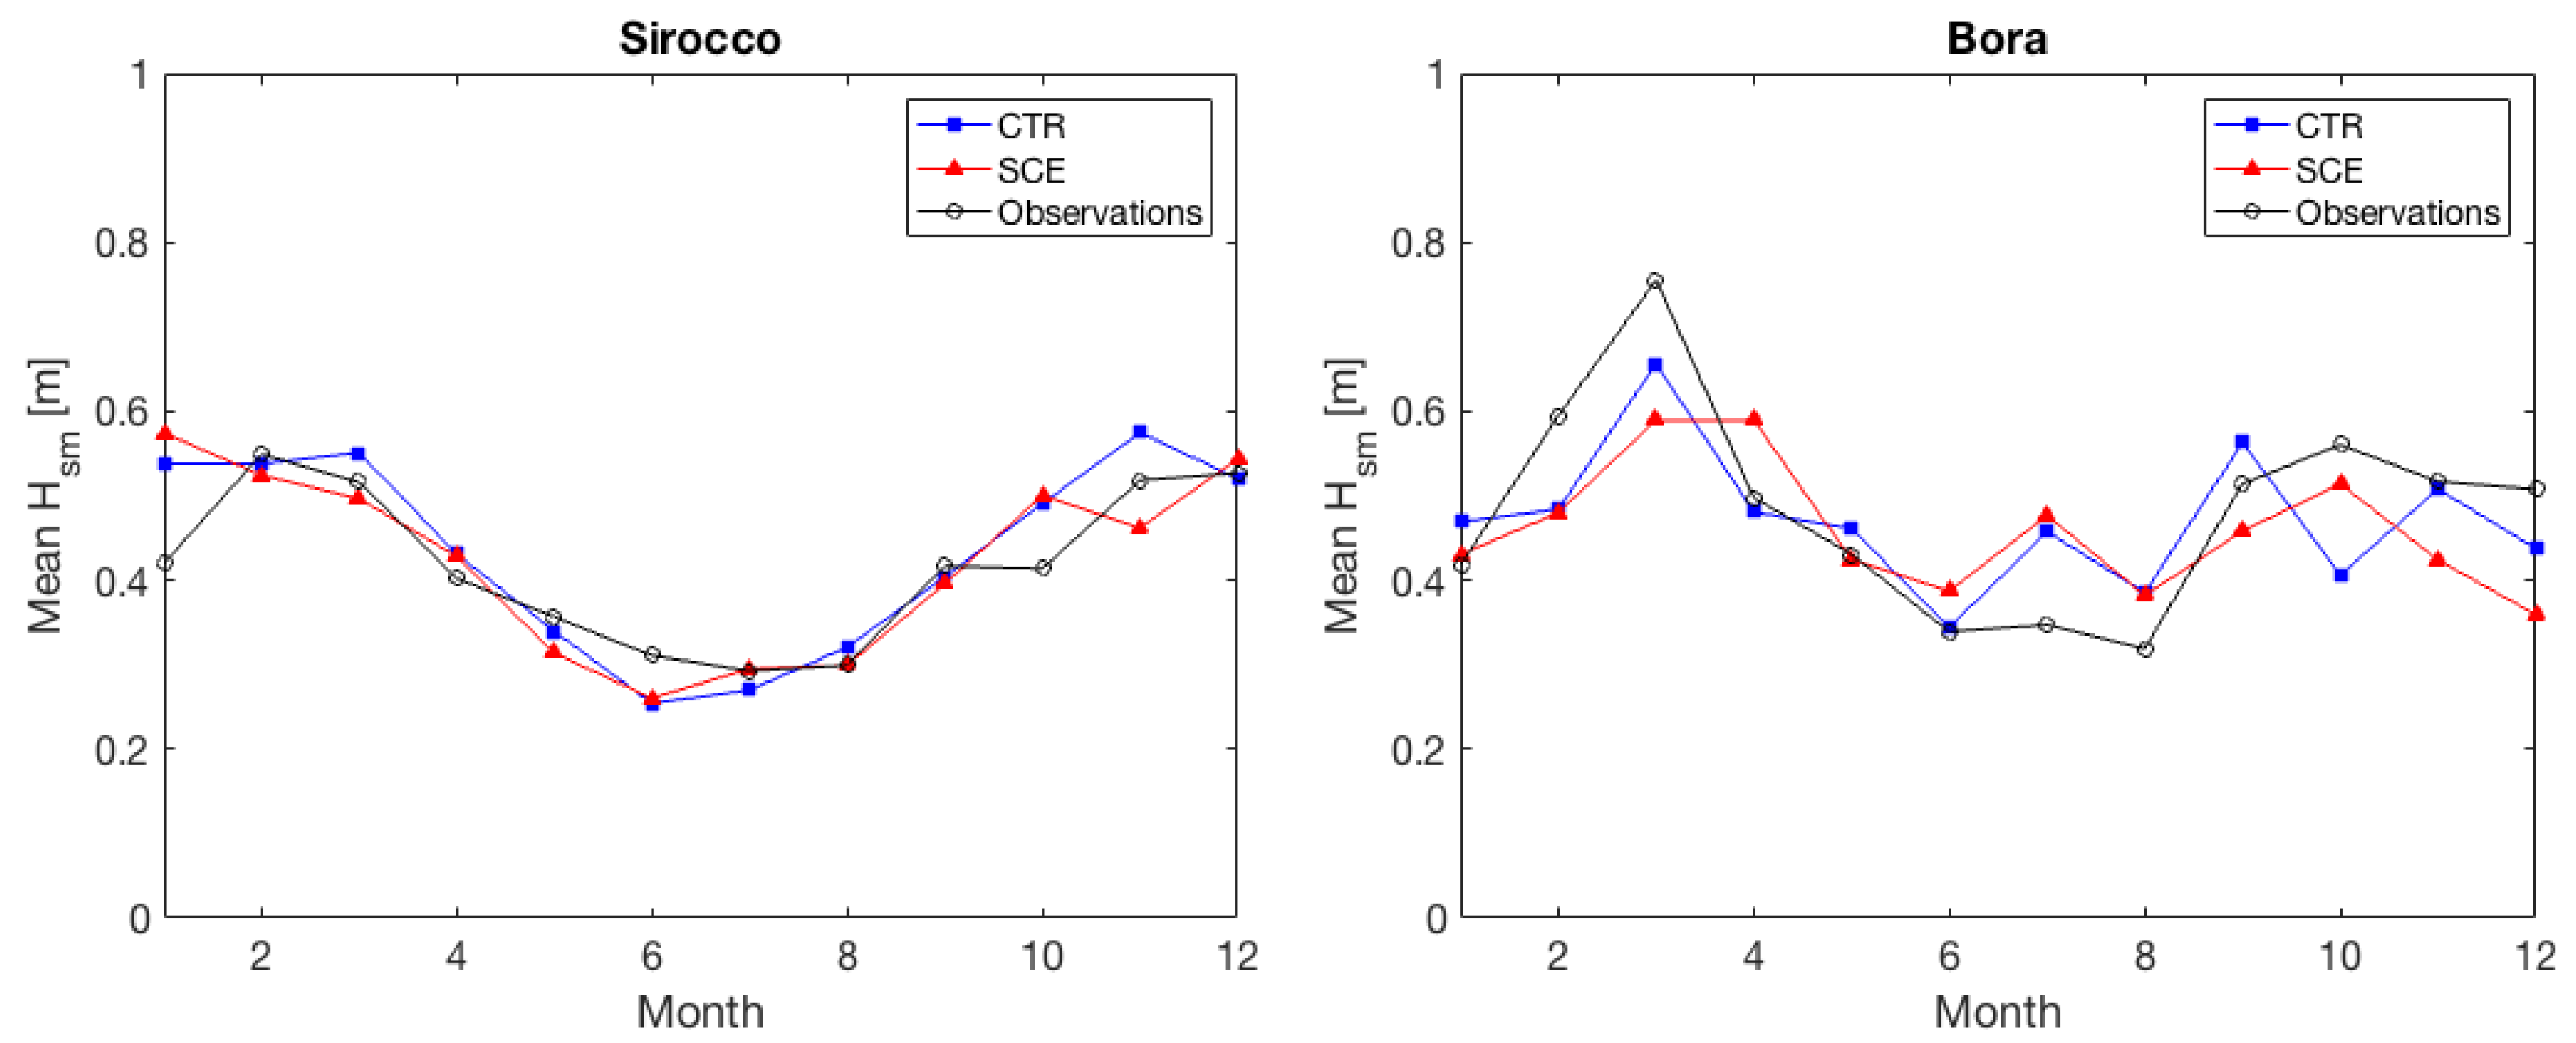
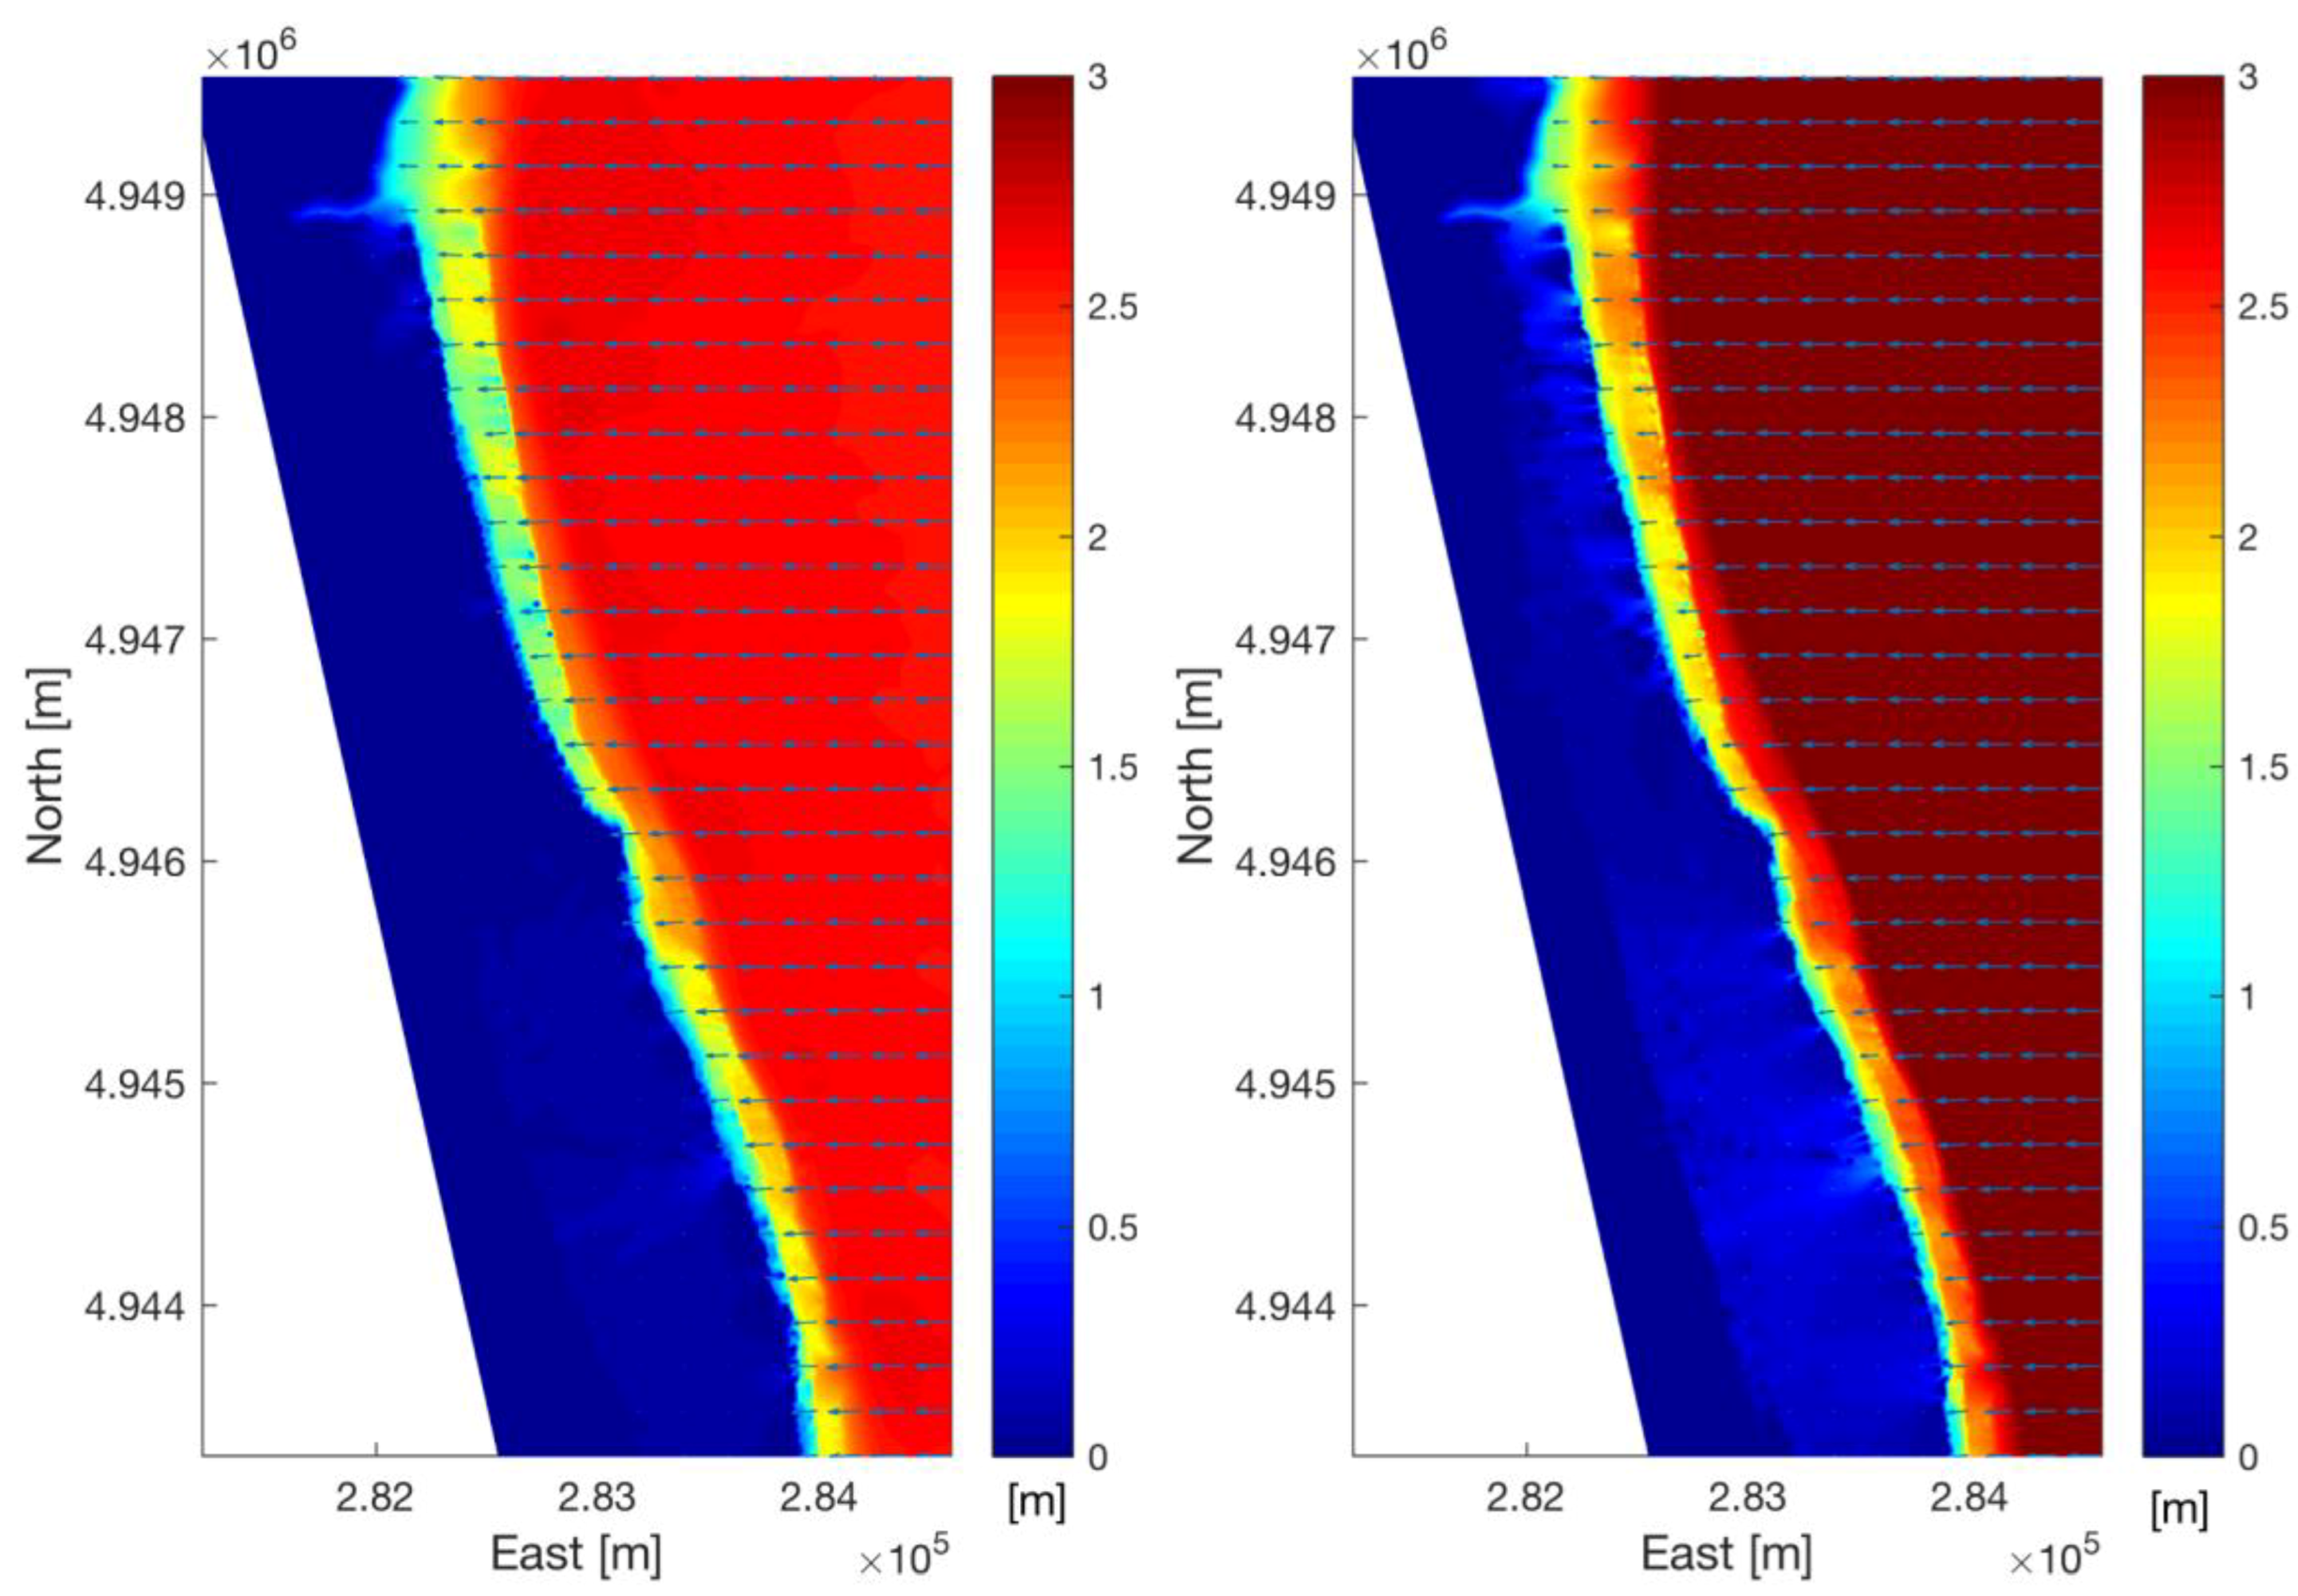
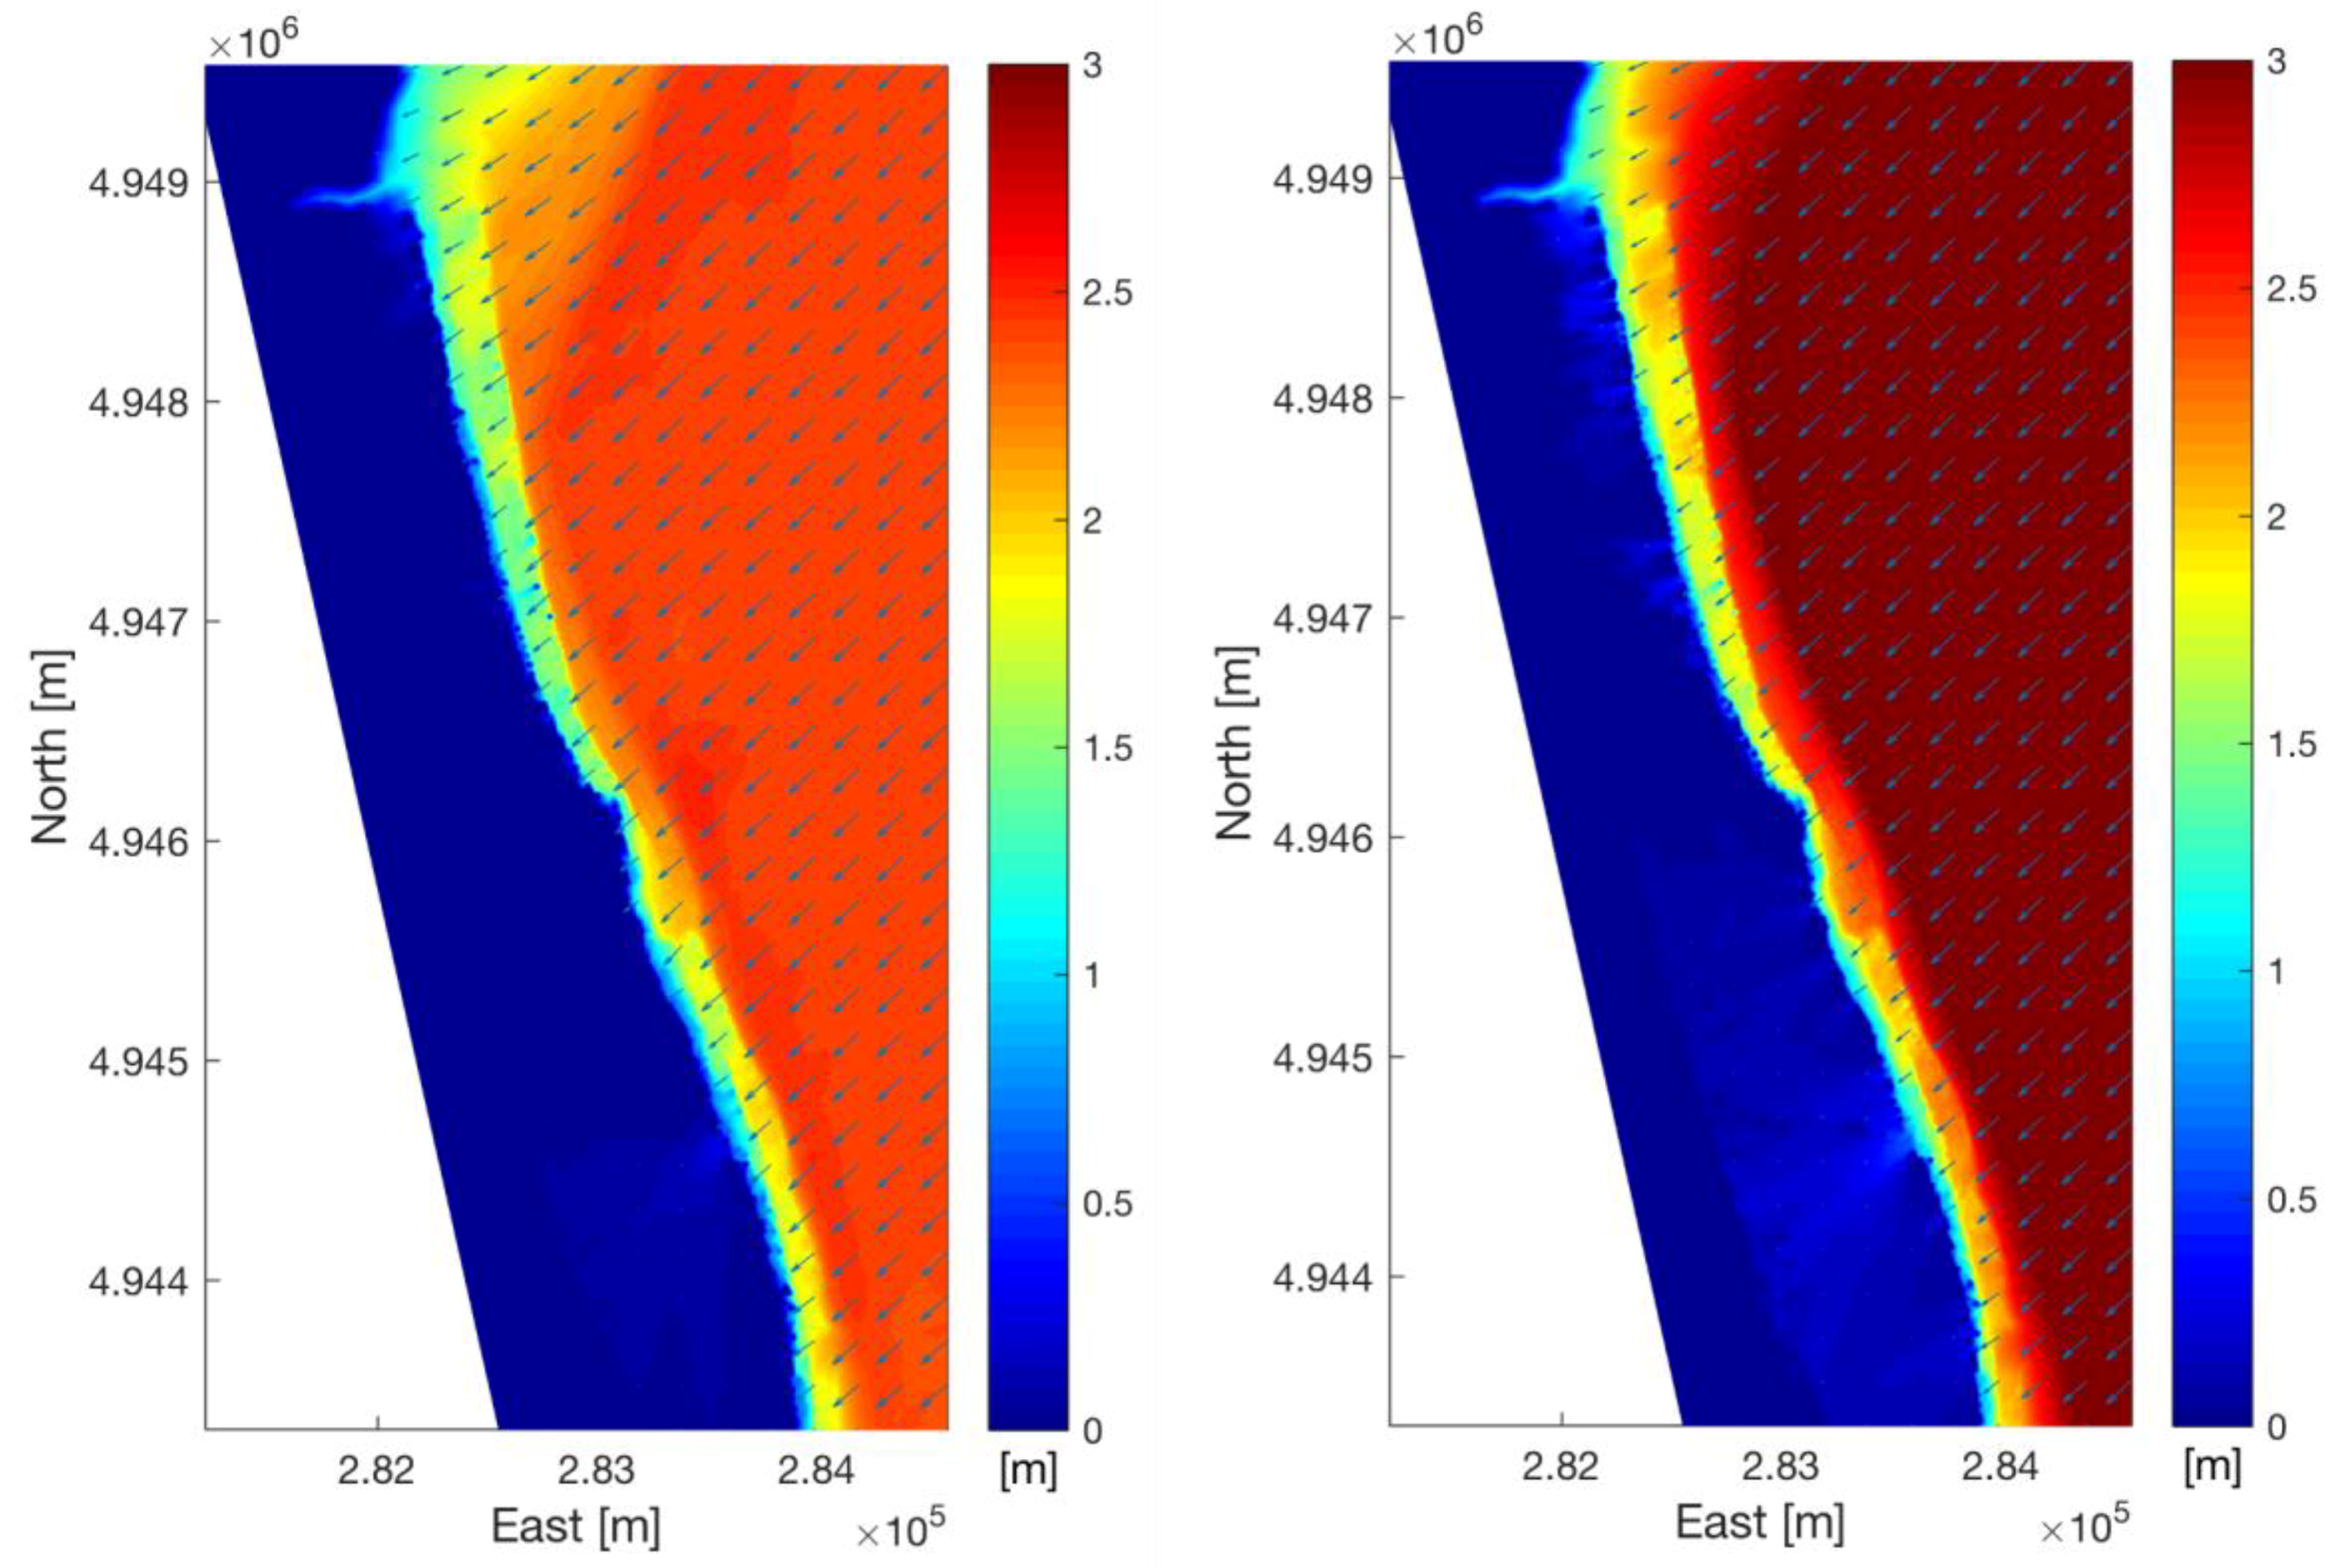
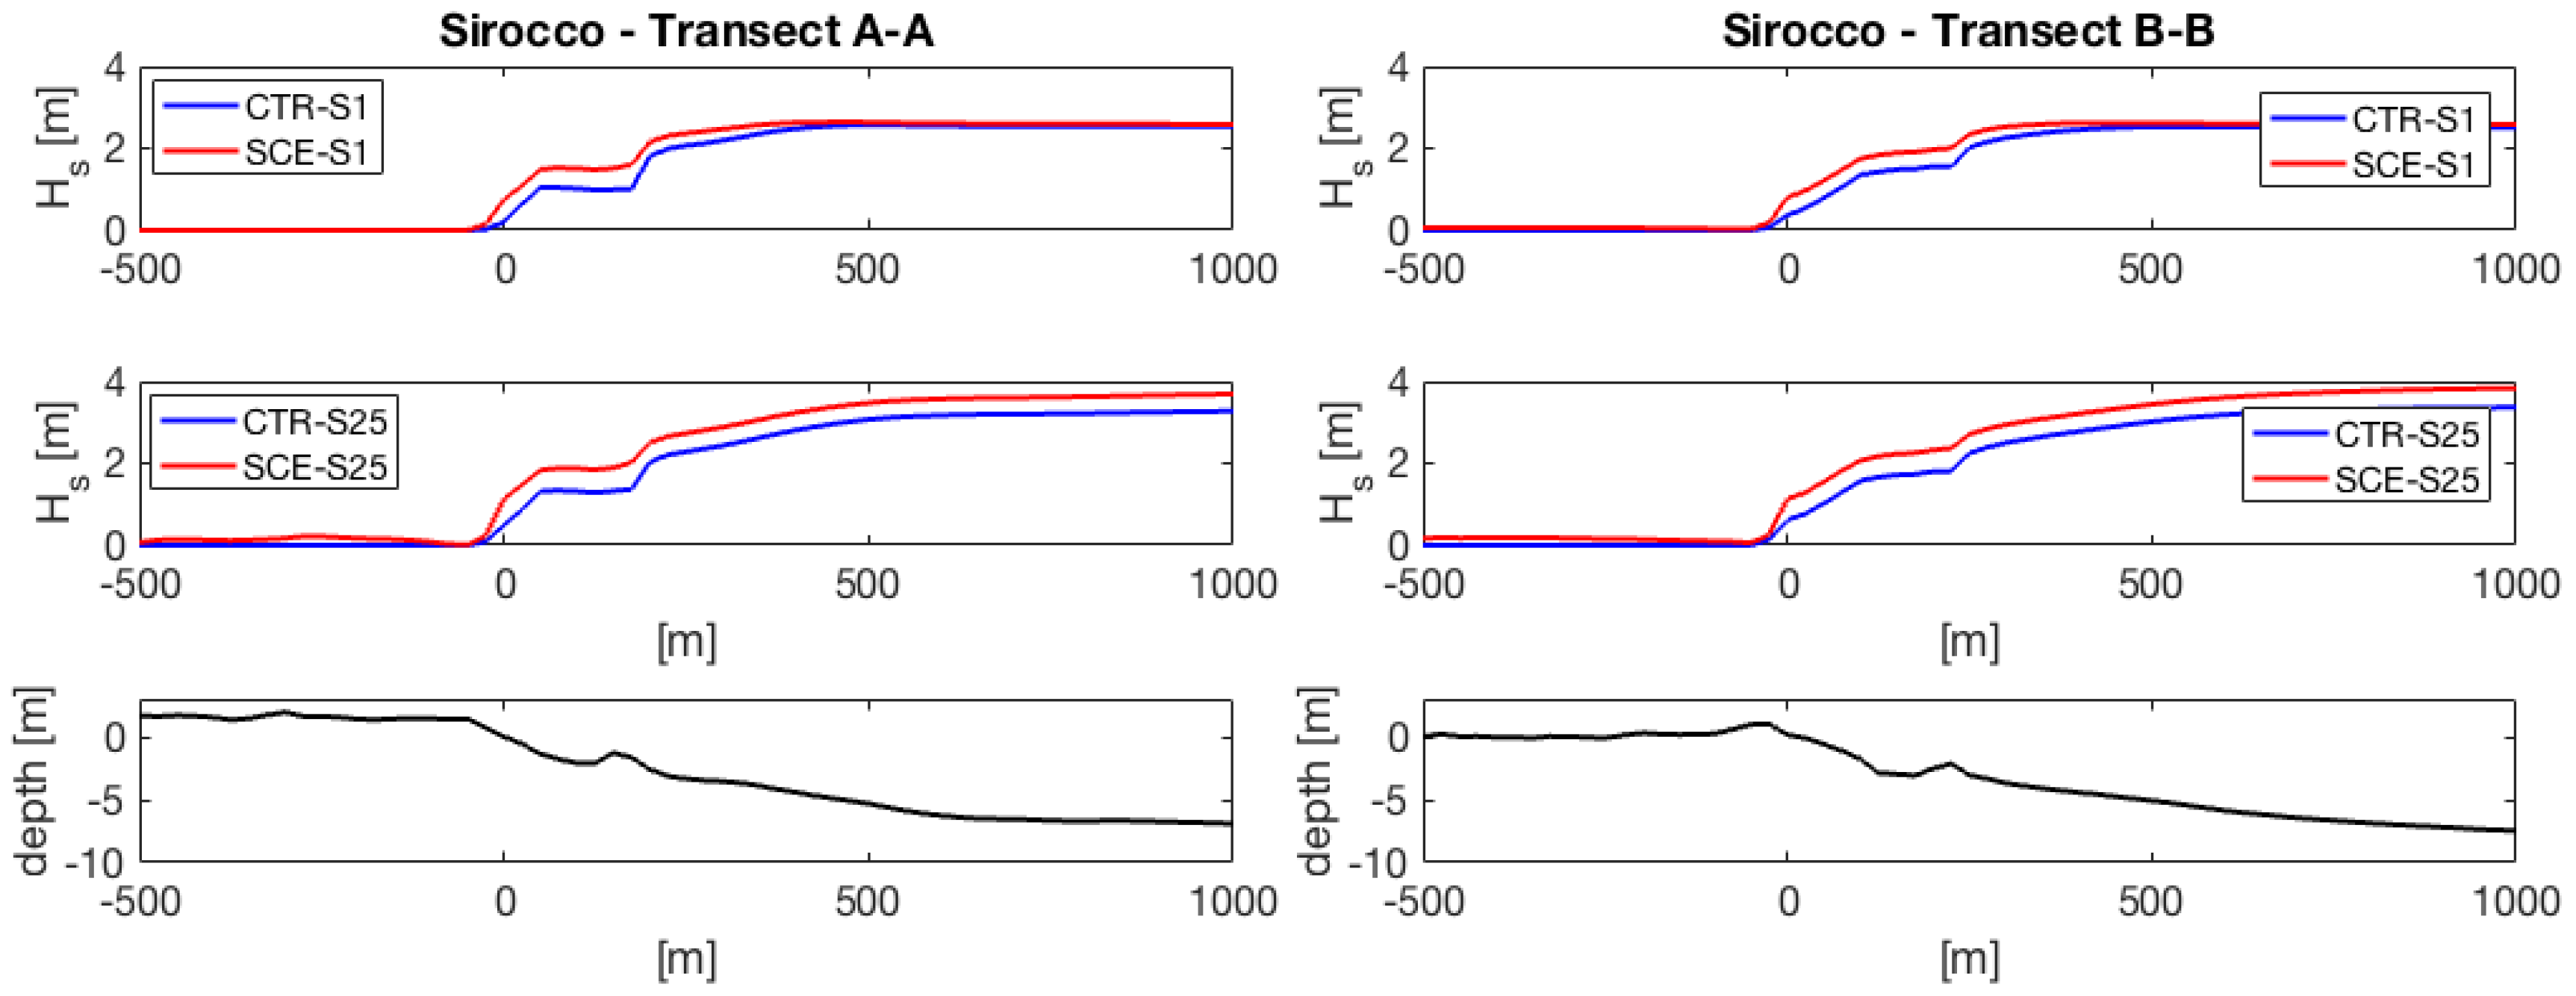
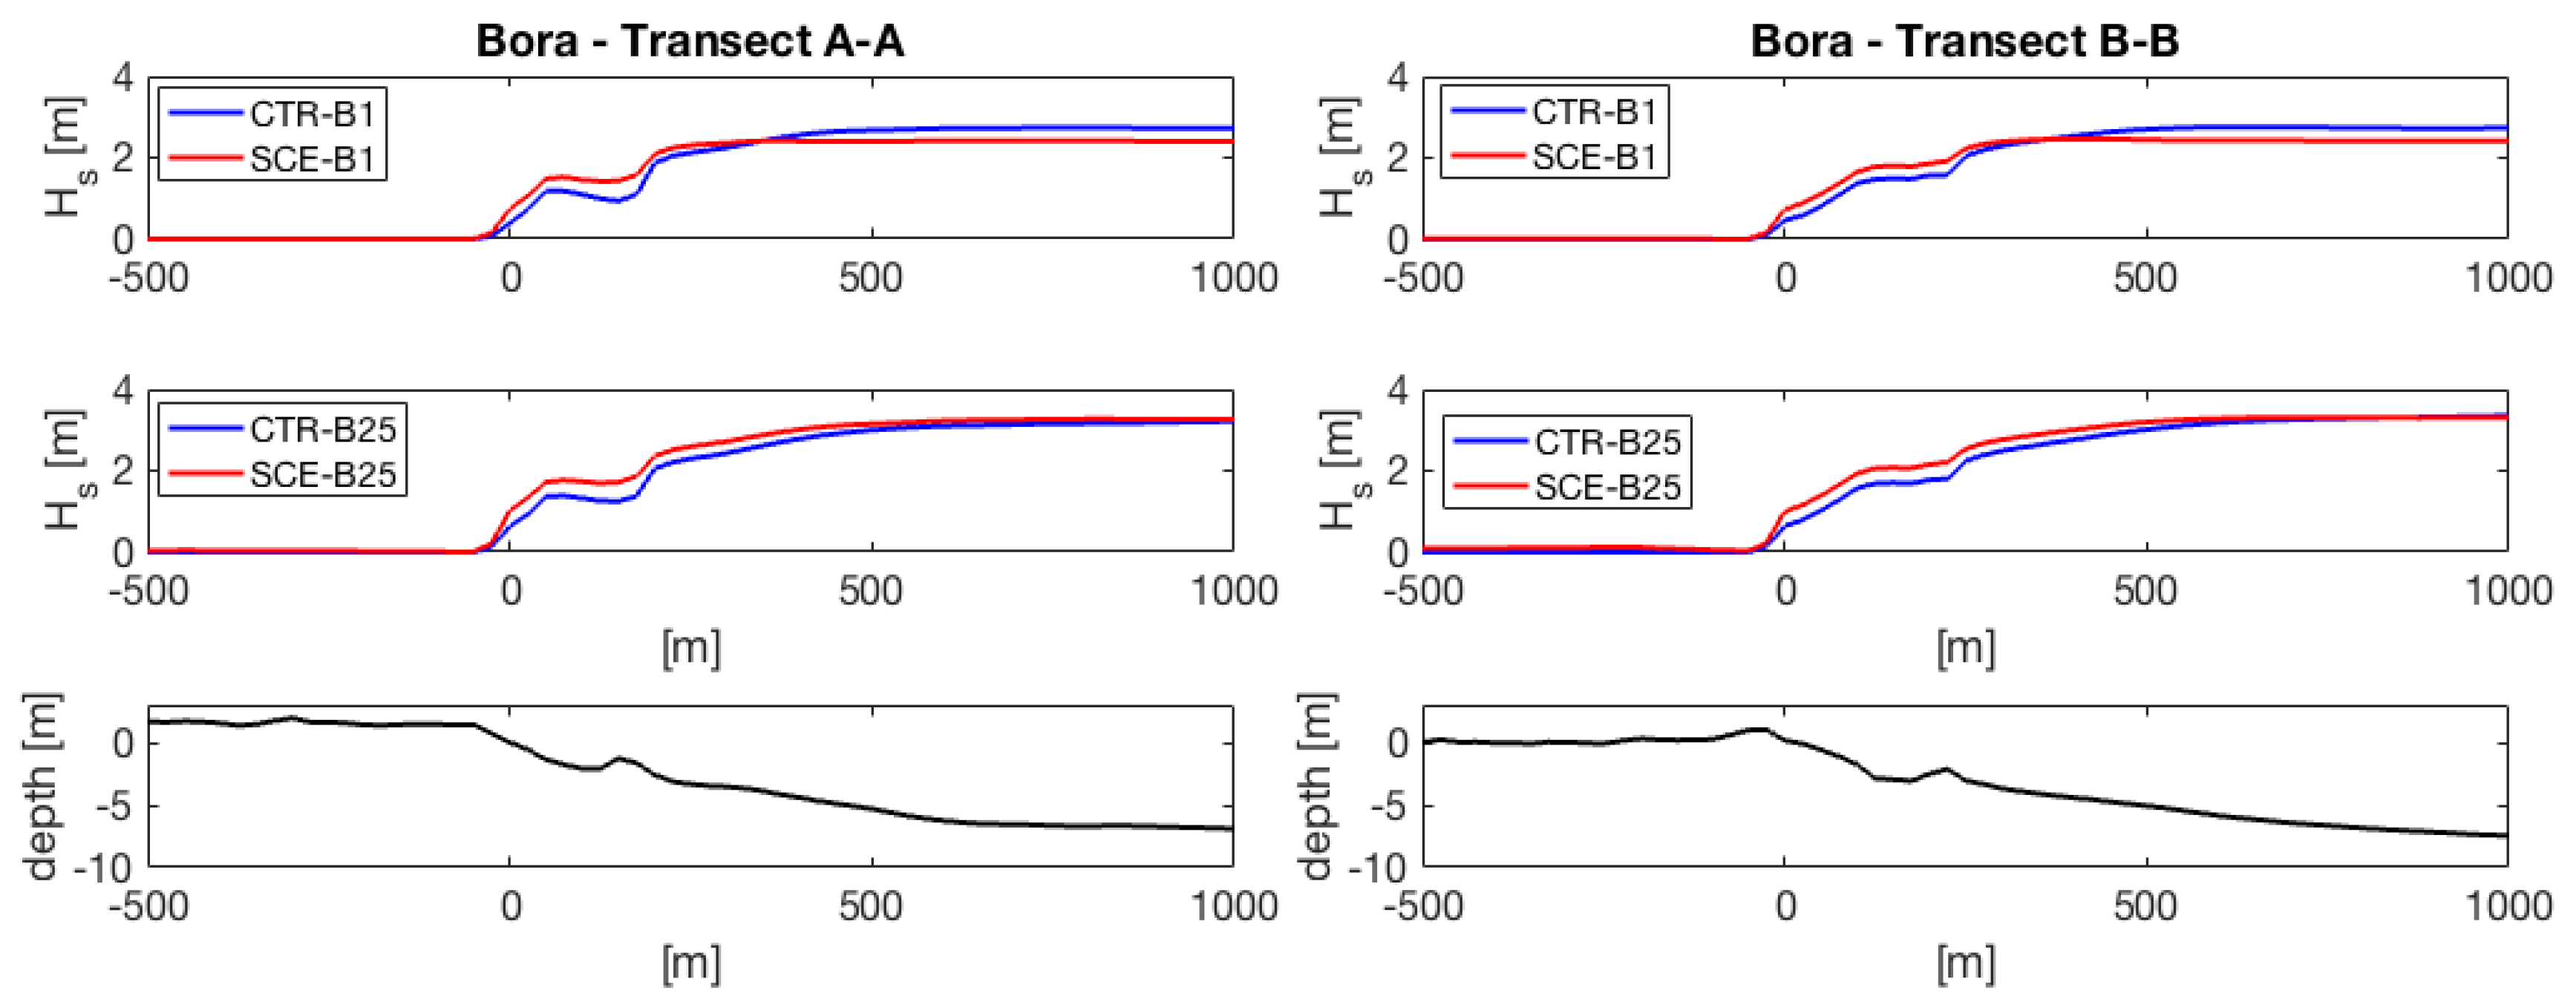
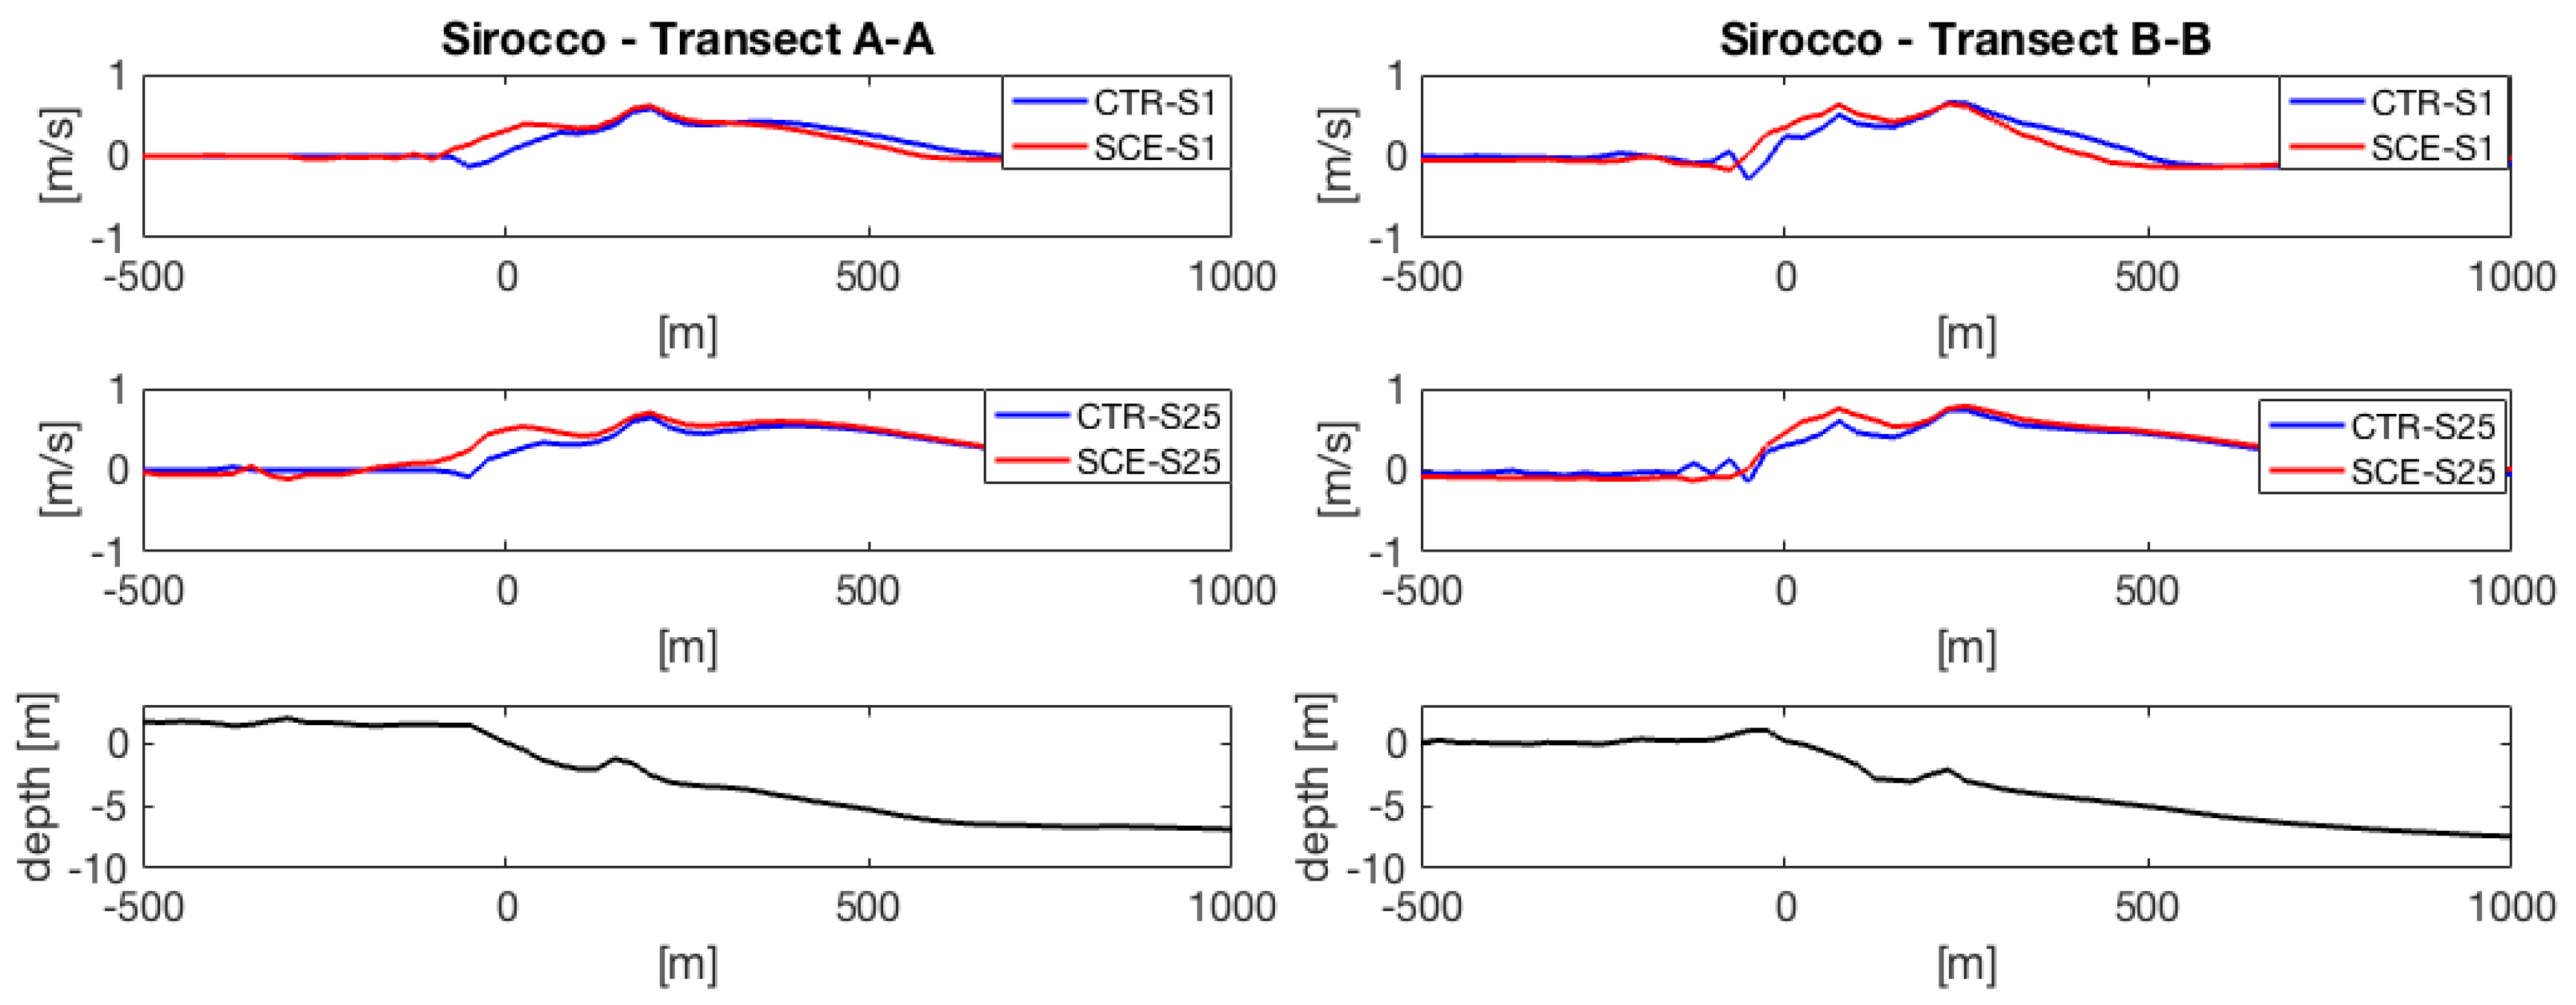
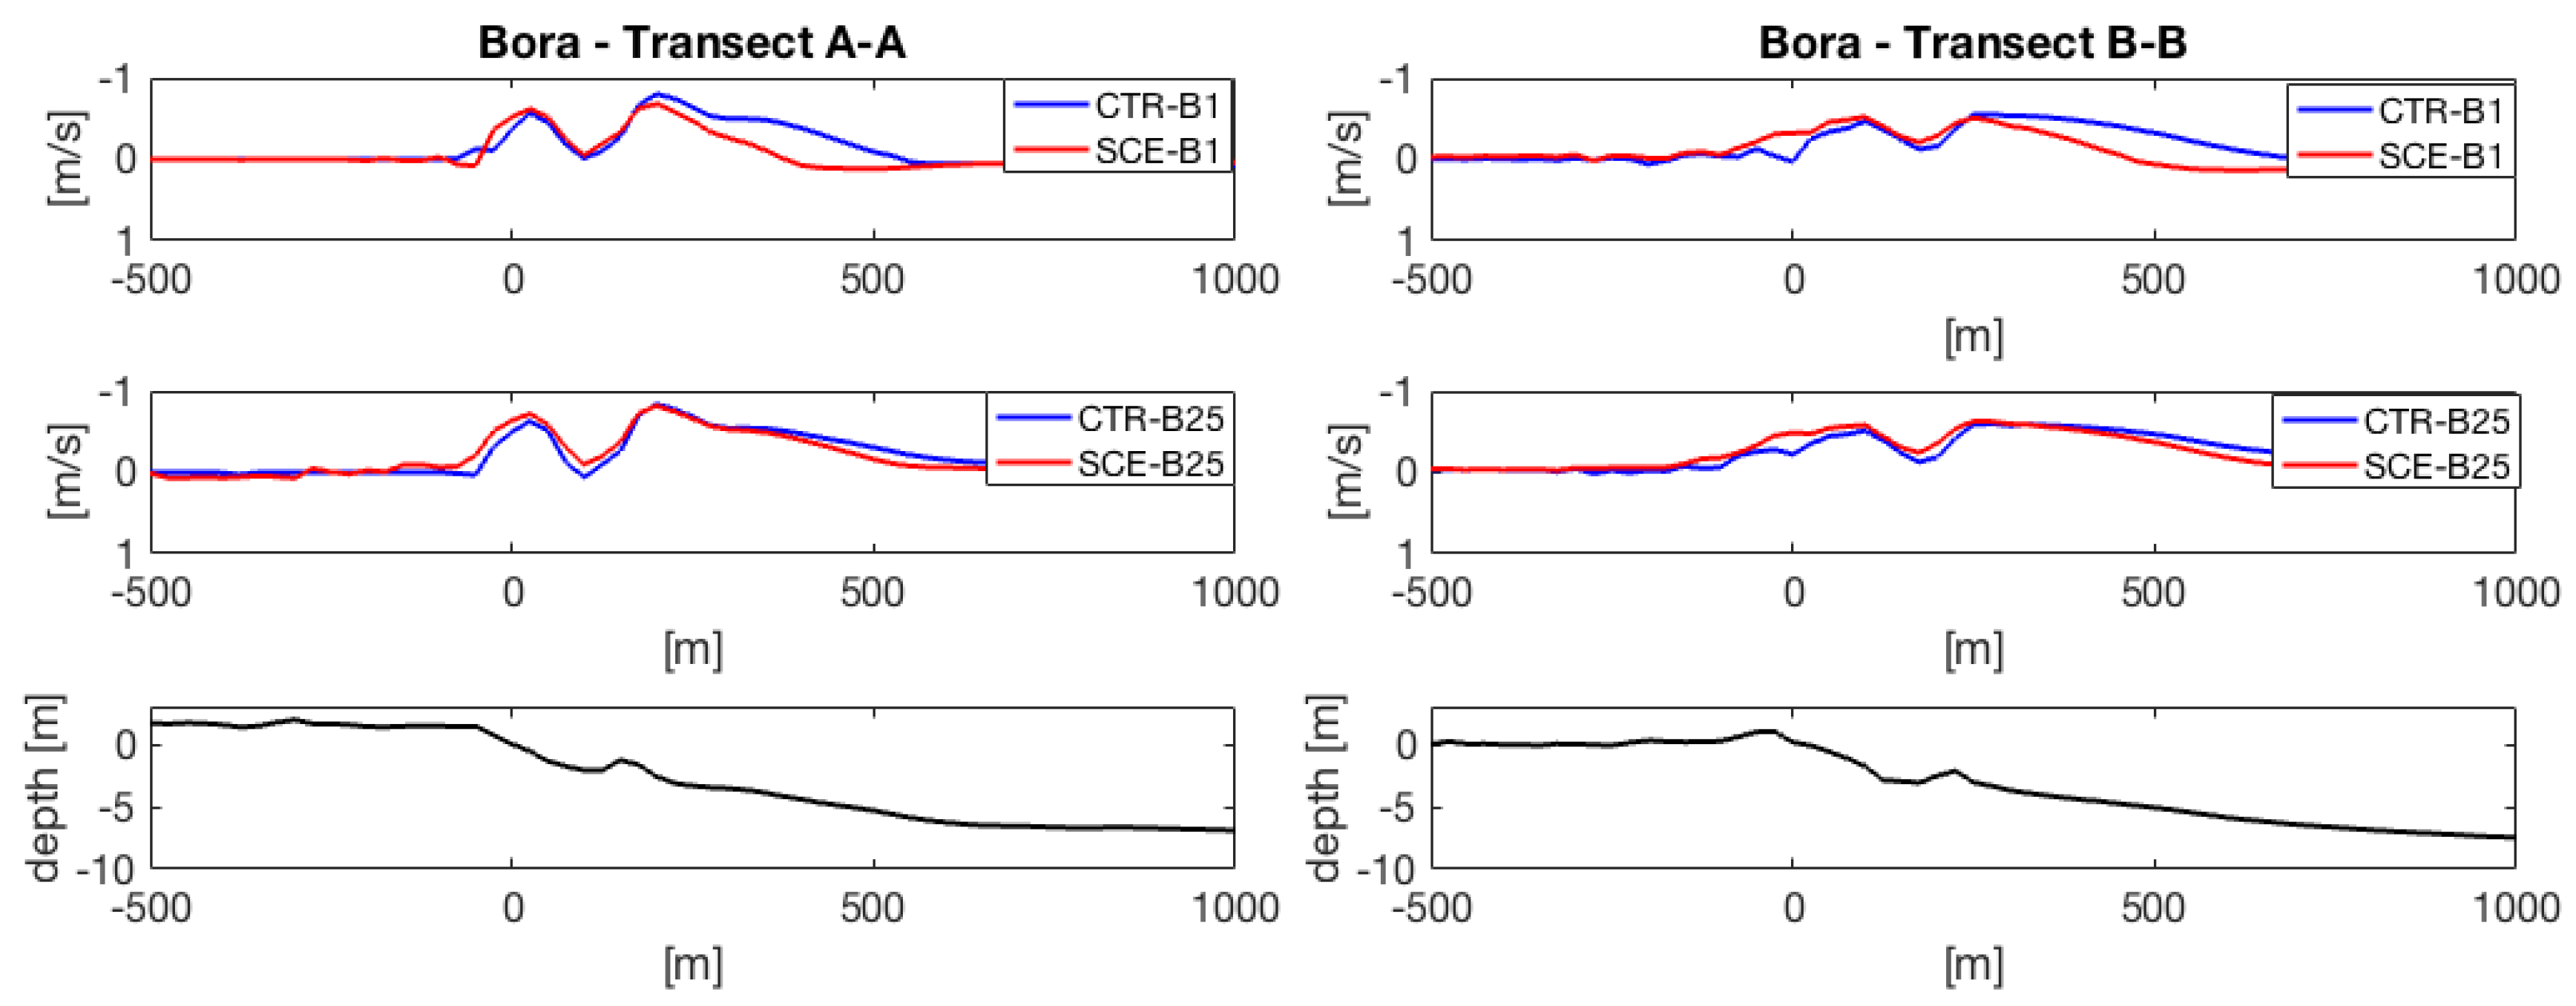
4.1. Wave and Hydrodynamics

Model results for SCE runs described in Table 2 are presented in the following figures. For Sirocco and Bora events, the significant wave height distribution and mean wave direction vectors that resulted from TOM are shown in Figure 7 and Figure 8, respectively. The increment of water levels in SCE runs, including sea-level rise induced by climate changes, leads to wave propagation over the initially dry zone of the beach, especially in case of TR = 25 years, revealing an expected increase of sea flooding events in the future.
Since differences between runs may appear less significant than in reality on a scale of representation of the global model domain; a comparison of the results is performed along linear transects from the offshore computational boundary to the shoreline (as represented in the left panel of Figure 6), where the distance is taken from the original shoreline position at 0.0 m of mean sea level (hereafter MSL).
The first transect A-A is located in the zone a (in Figure 1) of the beach of Lido di Spina and is characterized by a natural submerged bar at a 160 m offshore distance from the shoreline, at a water depth of around 1.8 m, and by an emerged beach at +1.4 m level with a 2% slope. The transect B-B is instead located in the low-lying area of the old outlet of Bellocchio channel (zone c in Figure 1) and presents a submerged natural sand bar at a distance of 220 m from the shoreline, at a water depth of 3 m. The spatial evolution of the significant wave height along these two transects is reported in Figure 9 and Figure 10 for Sirocco and Bora events, respectively.
Wave dissipation occurs as a result of both breaking and bottom friction. TOM model simulates the evolution of the wave height, frequency, and direction as the waves propagate towards the beach. In the presence of sand bars, the cross-shore distribution of significant wave height usually has a typical evolution, influenced by the composite bathymetry. Indeed, wave steadily propagates towards the breaking point, beyond which it starts to decrease in height up to submerged bar crest. Then, it remains constant until water depth reaches again the bar crest depth; then, it slowly decreases up to reach the shoreline.
Simulations of CTR and SCE scenarios produce evident variation in wave breaking position and height, denoting a shift to higher wave heights closer to the shoreline in case of SCE runs (especially in case of Sirocco events) and a significant shift of the breaking line position towards the shoreline.
The wave radiation stresses give rise to the alongshore velocity profiles, which are responsible for inter-annual sediment transport, as reported in Figure 11 and Figure 12, showing Sirocco and Bora (with opposite ordinate axis) events, respectively, where positive values denote currents directed from South to North. The maximum value of alongshore velocity occurs within the breaking zone of each simulation.
In presence of submerged bars, as in the case of the adopted bathymetry, the distribution of alongshore current usually has two peaks, each corresponding to the peaks of wave breaking-points [58,59], with the maximum on the bar crest and the minimum much closer to the shoreline. In the critical part of the surf zone beneath the alongshore-current jet, the intense wave-current stresses occur, while prior to breaking and in the inner surf zone, the current strength is smaller.
The combined effects of the expected sea-level rise and the intensity increase of Sirocco events bring a modest shift in nearshore wave-induced currents, resulting from the respective change in wave dynamics. This is evident for both the analyzed transects in case of Sirocco events but only for the low-lying area of Bellocchio channel in case of Bora events.

4.2. Inundated Areas

Figure 13 and Figure 14 show the comparative effects of changing climate scenarios on the inundated areas that result from Sirocco and Bora runs, respectively: Black lines indicate the initial shoreline at a water depth equal to ±0 m MSL, while blue and red lines represent the upper limits of the inundated area at the end of CTR and SCE simulations.
Differences between CTR and SCE scenarios are the most noticeable ones among the presented results on the scale of the representation; they highlight the utility and effectiveness of the implemented numerical approach in the simulation of the respective phenomena, and they are used to make a comparative analysis.
The areas mainly suffering flooding in the scenarios of climate changes are the northern mouth of Logonovo channel (zone a in Figure 1) and the southern low-lying plain of the older outlet of Bellocchio channel (zone c in Figure 1), which are expected to be the most vulnerable and exposed to flooding hazards induced by sea-level rise, and during ordinary events.
Indeed, looking at the numerical results for the three different zones in which the studied site is divided in Figure 1:
  • In the northern area, the channel outlet is subject to a general increment of flooded area extension in all the simulated scenarios and despite the absence of river discharges, revealing the high vulnerability of these flood prone areas to climate changes.
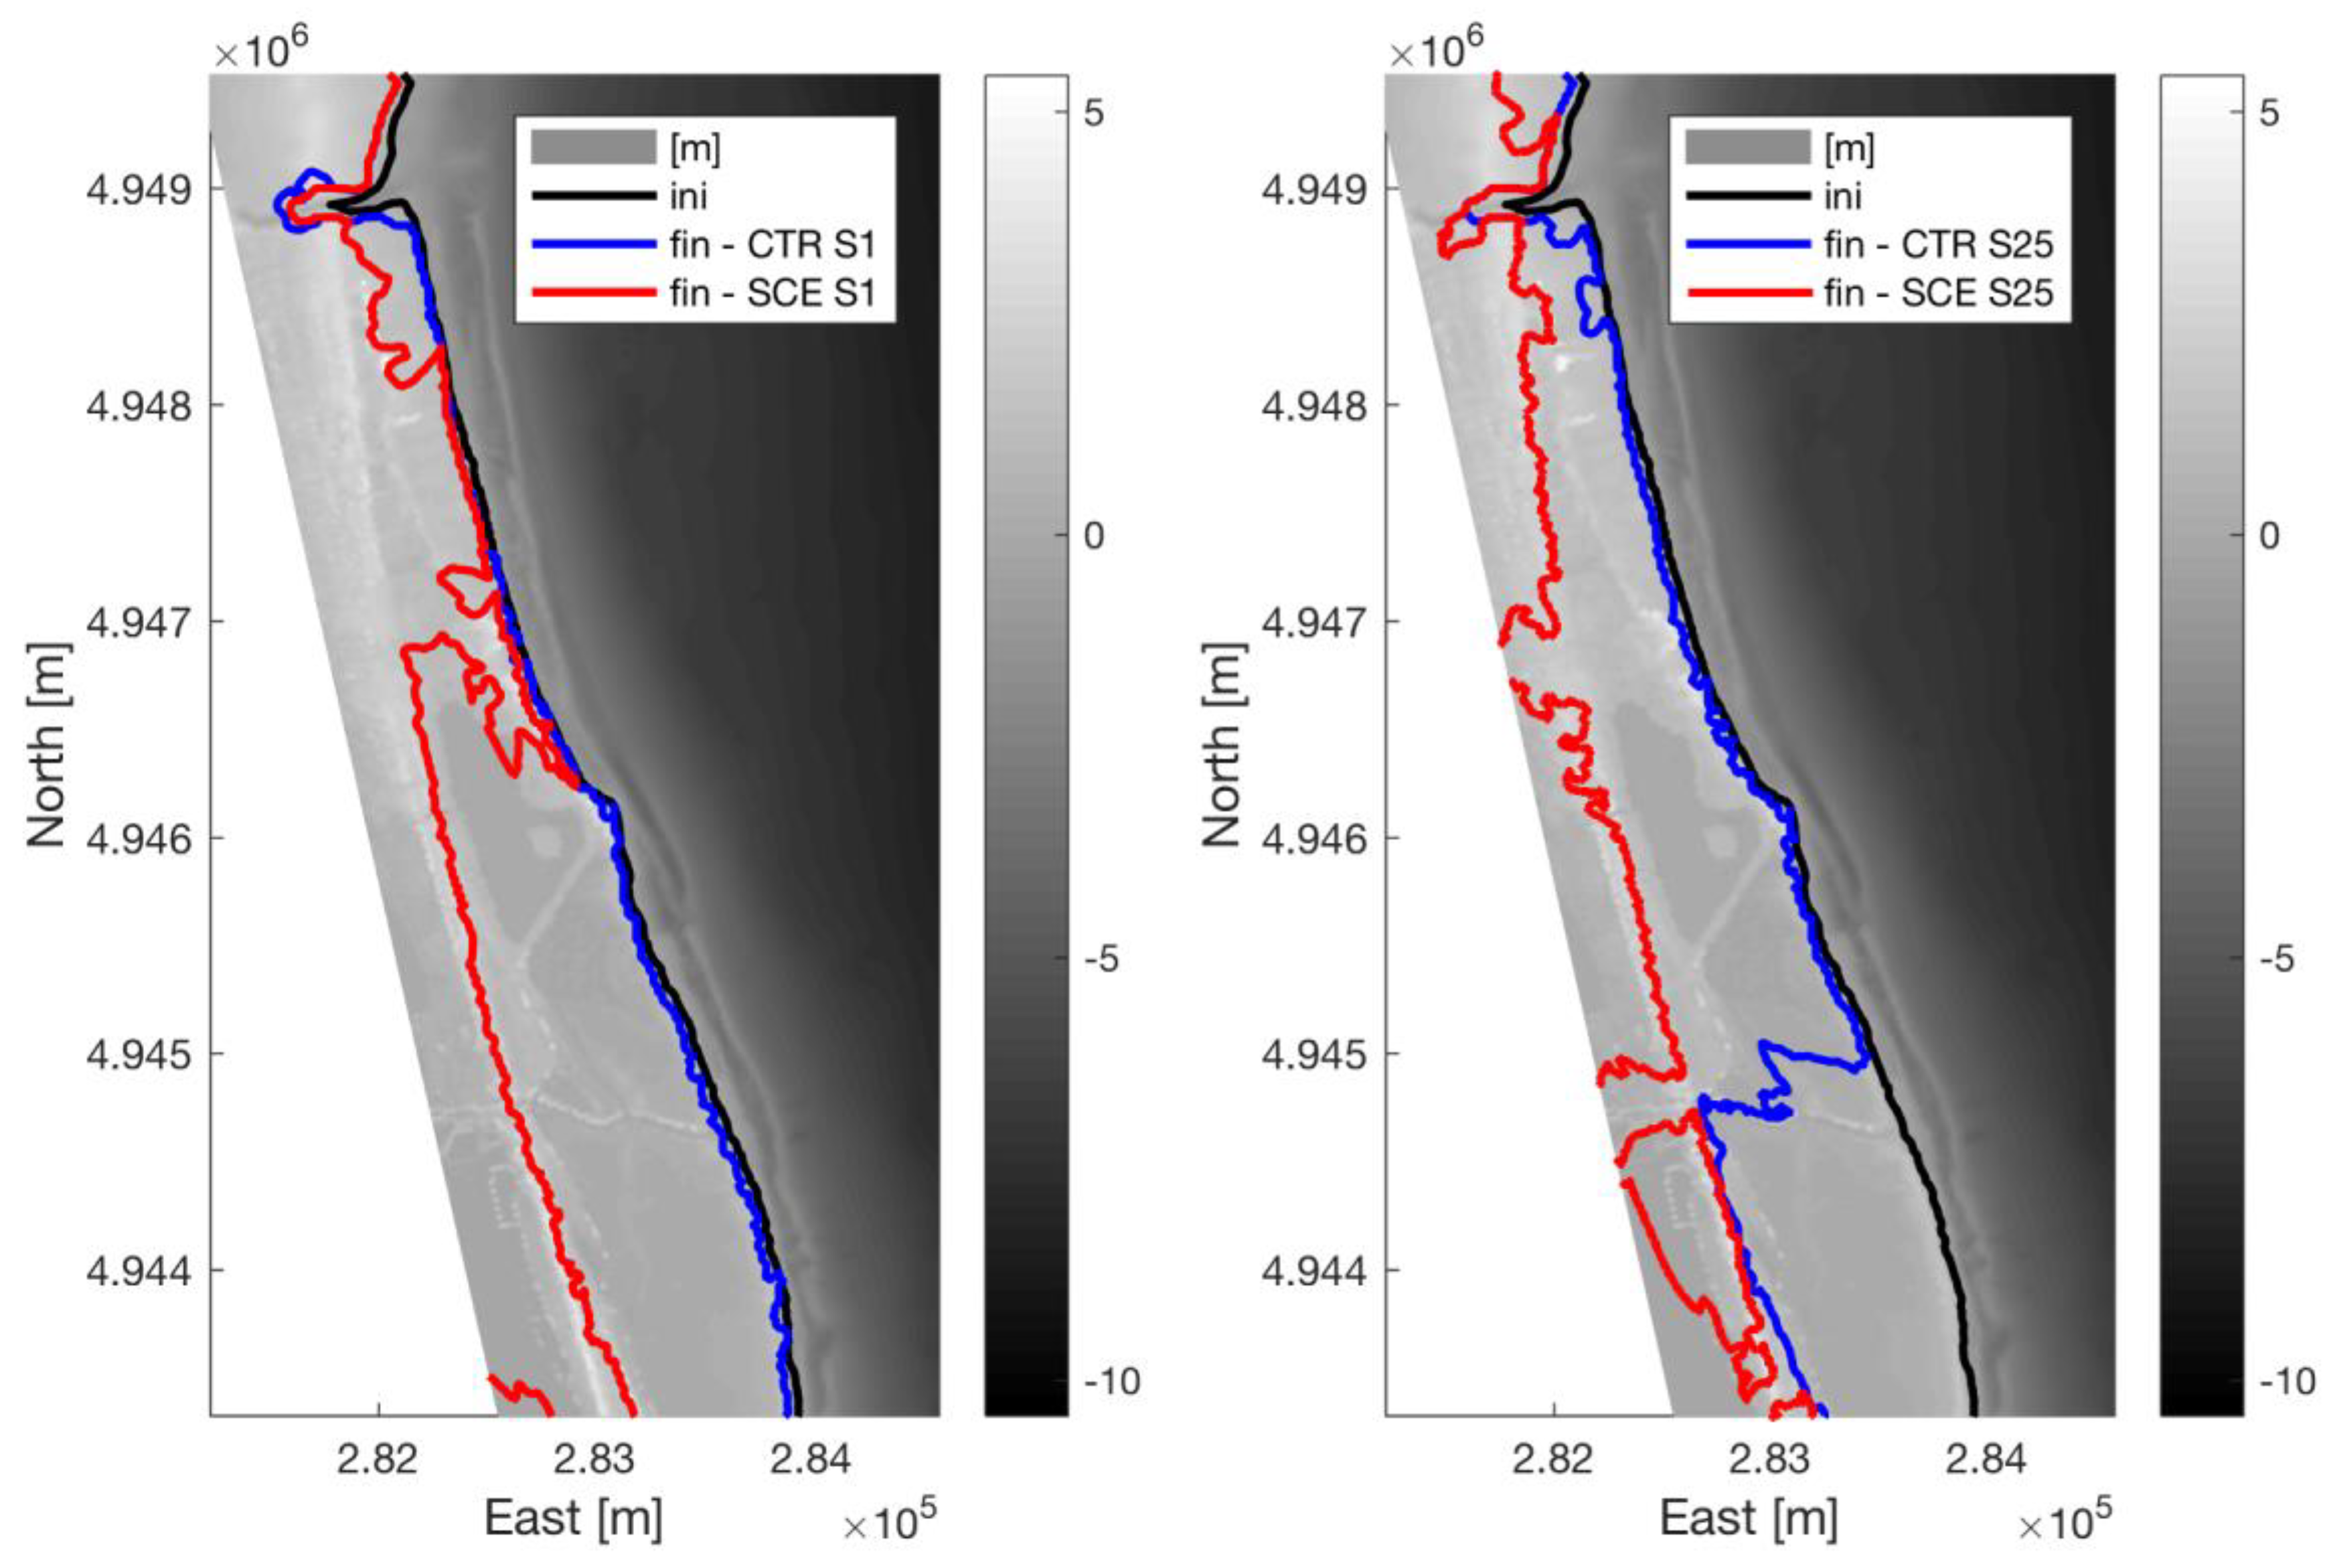
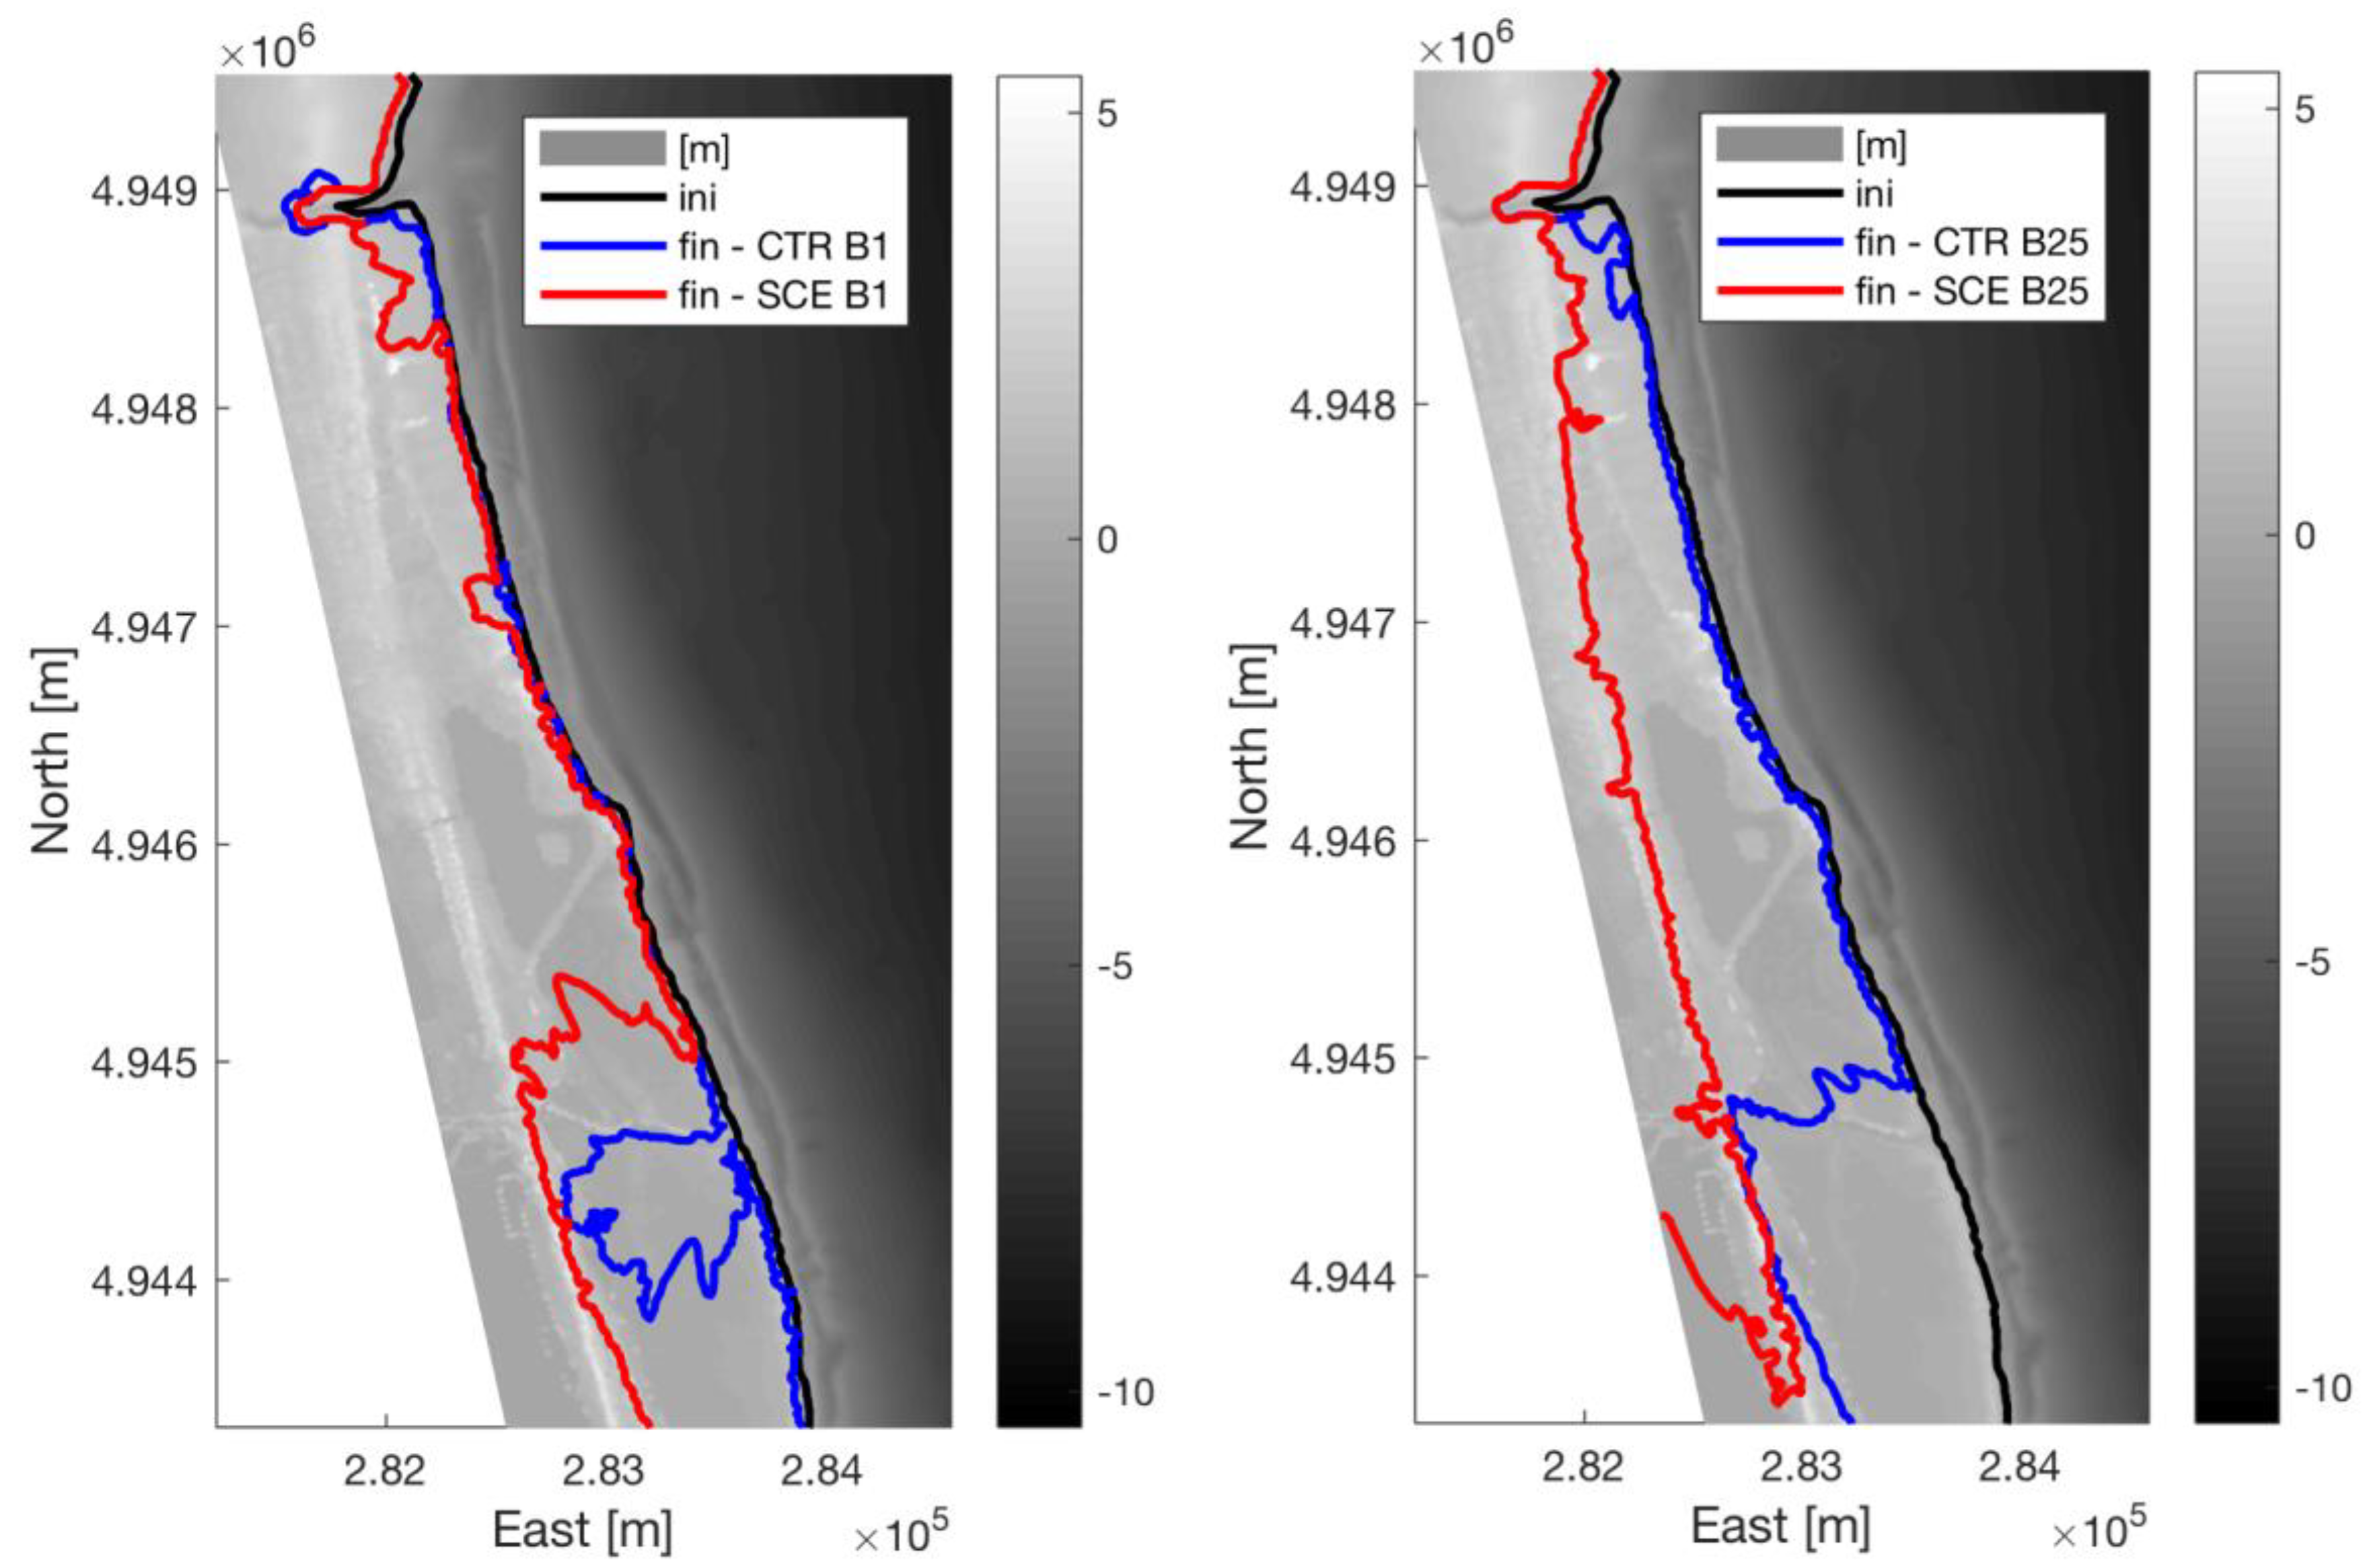
  • The natural beach of Lido di Spina seems not to be significantly inundated in case of ordinary events both from Sirocco and Bora, as well as in future scenarios as resulted after SCE runs; the area, instead, is much more strongly threatened by the predicted future sea-level rise in case of extreme events (Figure 13 and Figure 14, right panels).
  • The older outlet of Bellocchio channel seems not to be particularly affected in terms of inundated area by climate change scenarios under extreme conditions (TR = 25 years), both for Sirocco and Bora events (Figure 13 and Figure 14, right panels). While in case of ordinary event generated by Bora wind (Figure 14, left panel), and already for conditions typical of the CTR scenario, the area experiences a sea inundation that significantly increases in SCE scenario; sea-level rise is also responsible of a significant increase in the flooded area extension also in case of ordinary event generated by Sirocco event (Figure 13, left panel).

4.3. Discussion of the Effects of Expected Climate Changes

Changes in deep-water wave climate drive littoral hydrodynamics and morphological variation, such as the patterns of nearshore wave propagation and alongshore currents over local shelf bathymetry.
A quantitative comparison between the different scenarios and events is proposed in Table 3, in which differences between the simulated CTR and SCE scenarios are reported in terms of characteristics of wave-current-induced dynamics with the aim of estimating the effects of expected climate changes at the study site.
In particular, the following features are calculated from the numerical results:
  • Variation of the wave breaking line position ΔxB (m) calculated as
    ΔxB = xB, SCE − xB, CTR
    in which xB,SCE and xB,CTR are the breaking line positions for SCE and CTR runs, respectively. This data would allow estimating wave energy in the surf zone and impacting the shoreline.
  • Changes in the maximum alongshore currents calculated ΔUls, MAX (%) as
    ΔUls, MAX = (Uls, MAX SCE − Uls, MAX CTR)/Uls, MAX CTR × 100
    in which Uls, MAX SCE and Uls, MAX CTR are the maximum alongshore velocity computed in SCE and CTR runs, respectively. This value could give evidence of the estimated variation induced by climate changes in morphological patterns driving the inter-annual area evolution.
  • The computed percentage of inundated area variation ΔΩ (-) is calculated as
    ΔΩ =(ΩSCE − ΩCTR)/ΩCTR
    in which ΩSCE and ΩCTR are the estimated inundated areas for SCE and CTR runs, respectively; this information could help in evaluating the flooding hazard increment connected to climate changes.
According to computed results reported in Table 3, modifications of the wave dynamics, currents patterns, and inland water propagation induced by climate changes are expected to be mainly significant for extreme conditions, and especially for Sirocco events, with increases in the maximum alongshore currents and in the flooded area dimensions. Decreases or negligible variations are instead estimated for Bora events in terms of alongshore currents, again revealing how long-term effects of a changing climate along the North Adriatic shoreline may be stronger related to Sirocco events.
Expected effects of increments in wave height and in sea level in case of Sirocco events during SCE runs (as reported in Table 2) may induce no evident variations in the breaking line position, while wave energy impacting the shoreline and inland area may be strongly affected by wave energy flux, which is related to wave height and storm duration. An onshore shift of the breaking line in case of Bora events is instead connected to a balance between wave height decrement and sea-level rise during SCE runs (as reported in Table 2).
An overall increase of the flooded area extension ranging from 3 to 9 times the CTR values is observed in the results of all the simulated scenarios, showing that the greatest threat from future climate changes, especially during ordinary sea storms generated by Sirocco winds, would be the relative rise of sea level, while slight modifications of the littoral currents would drive morphological dynamics in the shoreline stability and evolution.

5. Conclusions

Wave-current dynamics represent a feature of paramount importance in the northern Adriatic basin, both for triggering local circulation [13,60] influencing connections in terms of amount of dense water produced [59] and driving sediment re-suspension and mobilization [14,61,62]. Modifications induced by climate changes in wave-current dynamics need to be carefully evaluated, since they can be regarded as among the main threats to coastal protection and stability, with important implications for the assessment of littoral management plans and for mitigation efforts [4,63].
In the present study, coupled wave-2D hydrodynamics simulations carried out by means of the open-source TELEMAC suite were implemented in the coastal area of the River Reno mouth, along the eastern coast of Northern Italy. A multiple-nesting approach was developed by adopting COSMO-CML and SWAN results for the Adriatic Sea in order to run past (1971–2000), and future climate change (2071–2100) scenarios were developed at high-resolution coupled wave-2D-hydrodynamics TELEMAC model.
Presented results showed modifications in the area dynamics as a response to expected climate change scenarios and previously integrated carried out studies, limited to sea level dynamics. A slight local growth in the wave energy intensity for Sirocco events, however, inducing an increase in alongshore currents and inundated areas, is observed. On the other hand, during Bora events, negligible changes in wave-induced coastal dynamics are forecasted, while flooded area dimensions again increased under the simulated sea-level rise effects.
The presented numerical results showed that flooding hazards and changes in littoral hydrodynamics at the selected site are nowadays already significant, especially during Sirocco extreme events [24], and are expected to further increase in the future. It is also found that, according to the basin sea level projections elaborated by IPCC [8,17], the highest contribution to the coastal vulnerability of the studied beach is due to the relative rise of sea level, especially when this is combined with extreme sea storms.
Overall, the described methodology is deemed to be of general interest for ocean and coastal modelers involved in the development of procedures for offline multiple-nested high-resolution simulations from global circulation models, the adaptation of coastal models to platforms of operational oceanography, and the implementation of the above in coastal planning and design actions at the light of climate change scenarios.
Future studies of the selected site will focus on the implementation of a validated morphological model to perform erosional risk analysis and the running of long-term scenarios in order to estimate the shoreline evolution and seasonal variability of coastal dynamics in the area.

Author Contributions

For the presented research, D.B. performed the climatologic simulations with SWAN, M.G.G. and D.B. analyzed the wave climate and performed statistics, M.G.G. and A.G.S. performed the numerical simulations set-up and analyzed the results from TELEMAC runs, and R.A. and S.C. conceived the research aim and contributed to the discussion on the study outcomes.

Funding

This work was supported by the Flagship Project RITMARE—The Italian Research for the Sea, coordinated by the Italian National Research Council and funded by the Italian Ministry of Education, University, and Research within the National Research Program 2011–2013.

Acknowledgments

Geological Unit from Emilia Romagna Region is acknowledged to provide DTM data of the study area. D.B. and S.C. acknowledge the support from the UE H2020 program under grant agreement n. 730030 (“CEASELESS” Project) and the INTERREG MED “CO-EVOLVE” Project. The authors thankfully acknowledge Edoardo Bucchignani (CMCC and CIRA, Capua, Italy) for providing the COSMO-CLM wind fields used in the wave model simulations.

Conflicts of Interest

The authors declare no conflict of interest.

References

  1. Androulidakis, Y.S.; Kombiadou, K.D.; Makris, C.V.; Baltikas, V.N.; Krestenitis, Y.N. Storm surges in the Mediterranean Sea: Variability and trends under future climatic condition. Dyn. Atmos. Ocean. 2015, 71, 56–82. [Google Scholar] [CrossRef]
  2. Lionello, P.; Conte, D.; Marzo, L.; Scarascia, L. The contrasting effect of increasing mean sea level and decreasing storminess on the maximum water level during storms along the coast of the Mediterranean Sea in the mid 21st century. Glob. Planet. Chang. 2017, 151, 80–91. [Google Scholar] [CrossRef]
  3. Carisi, F.; Domeneghetti, A.; Gaeta, M.G.; Castellarin, A. Is anthropogenic land-subsidence a possible driver of riverine flood-hazard dynamics? A case study in Ravenna, Italy. Hydrol. Sci. J. 2017, 62, 1–16. [Google Scholar] [CrossRef]
  4. Bonaldo, D.; Antonioli, F.; Archetti, R.; Bezzi, A.; Correggiari, A.; Davolio, S.; de Falco, G.; Fantini, M.; Fontolan, G.; Furlani, S.; et al. Integrating multidisciplinary instruments for assessing coastal vulnerability to erosion and sea level rise: Lessons and challenges from the Adriatic Sea, Italy. J. Coast. Conserv. 2018, 22, 1–19. [Google Scholar] [CrossRef]
  5. Samaras, A.G.; Koutitas, C.G. Modeling the impact of climate change on sediment transport and morphology in coupled watershed-coast systems: A case study using an integrated approach. Int. J. Sediment Res. 2014, 29, 304–315. [Google Scholar] [CrossRef]
  6. Tsoukala, V.K.; Chondros, T.M.; Kapelonis, Z.G.; Martzikos, N.; Lykou, A.; Belibassakis, K.; Makropoulos, C. An integrated wave modelling framework for extreme and rare events for climate change in coastal areas—The case of Rethymno, Crete. Oceanologia 2016, 58, 71–89. [Google Scholar] [CrossRef]
  7. Lambeck, K.; Antonioli, F.; Anzidei, M.; Ferranti, L.; Leoni, G.; Scicchitano, G.; Silenzi, S. Sea level change along the Italian coast during the Holocene and projections for the future. Quat. Int. 2011, 232, 250–257. [Google Scholar] [CrossRef]
  8. Antonioli, F.; Anzidei, M.; Amorosi, A.; Presti, V.L.; Mastronuzzi, G.; Deiana, G.; De Falco, G.; Fontana, A.; Fontolan, G.; Lisco, S.; et al. Sea-level rise and potential drowning of the Italian coastal plains: Flooding risk scenarios for 2100. Quat. Sci. Rev. 2017, 158, 29–43. [Google Scholar] [CrossRef]
  9. Perini, L.; Calabrese, L.; Luciani, P.; Olivieri, M.; Galassi, G.; Spada, G. Sea-level rise along the Emilia-Romagna coast (Northern Italy) in 2100: Scenarios and impacts. Nat. Hazards Earth Syst. Sci. 2017, 17, 2271–2287. [Google Scholar] [CrossRef]
  10. Perini, L.; Calabrese, L.; Salerno, G.; Ciavola, P.; Armaroli, C. Evaluation of coastal vulnerability to flooding: Comparison of two different methodologies adopted by the Emilia-Romagna region (Italy). Nat. Hazards Earth Syst. Sci. 2016, 16, 181–194. [Google Scholar] [CrossRef]
  11. Di Risio, M.; Bruschi, A.; Lisi, I.; Pesarino, V.; Pasquali, D. Comparative analysis of coastal flooding vulnerability and hazard assessment at national scale. J. Mar. Sci. Eng. 2017, 5, 51. [Google Scholar] [CrossRef]
  12. Seenath, A.; Wilson, M.; Miller, K. Hydrodynamic versus GIS modelling for coastal flood vulnerability assessment: Which is better for guiding coastal management? Ocean Coast. Manag. 2016, 120, 99–109. [Google Scholar] [CrossRef]
  13. Carniel, S.; Warner, J.C.; Chiggiato, J.; Sclavo, M. Investigating the impact of surface wave breaking on modelling the trajectories of drifters in the Northern Adriatic Sea during a wind-storm event. Ocean Model. 2009, 30, 225–239. [Google Scholar] [CrossRef]
  14. Boldrin, A.; Carniel, S.; Giani, M.; Marini, M.; Bernardi Aubry, F.; Campanelli, A.; Grilli, F.; Russo, A. The effect of Bora wind on physical and bio-chemical properties of stratified waters in the Northern Adriatic. J. Geophys. Res. 2009, 114, C08S92. [Google Scholar] [CrossRef]
  15. Carniel, S.; Sclavo, M.; Archetti, R. Towards validating a last generation, integrated wave-current-sediment numerical model in coastal regions using video measurements. Ocean. Hydrobiol. Stud. 2011, 40, 11–20. [Google Scholar] [CrossRef] [Green Version]
  16. Archetti, R.; Zanuttigh, B. Integrated monitoring of the hydro-morphodynamics of a beach protected by low crested detached breakwaters. Coast. Eng. 2010, 57, 879–891. [Google Scholar] [CrossRef]
  17. Stocker, T.F.; Qin, D.; Plattner, G.-K.; Tignor, M.; Allen, S.K.; Boschung, J.; Nauels, A.; Xia, Y.; Bex, V.; Midgley, P.M. Summary for policy makers. In Climate Change 2013: The Physical Science Basis; Cambridge University Press: Cambridge, UK, 2013; pp. 3–29. [Google Scholar]
  18. Villatoro, M.; Silva, R.; Méndez, F.J.; Zanuttigh, B.; Pan, S.; Trifonova, E.; Losada, I.J.; Izaguirre, C.; Simmonds, D.; Reeve, D.E.; et al. An approach to assess flooding and erosion risk for open beaches in a changing climate. Coast. Eng. 2014, 87, 50–76. [Google Scholar] [CrossRef]
  19. Sanuy, M.; Duo, E.; Jäger, W.S.; Ciavola, P.; Jiménez, J.A. Linking source with consequences of coastal storm impacts for climate change and risk reduction scenarios for Mediterranean sandy beaches. Nat. Hazards Earth Syst. Sci. 2018, 18, 1825–1847. [Google Scholar] [CrossRef]
  20. Artegiani, A.; Barale, V.; Cushman-Roisin, B.; Gačić, M.; Kourafalou, V.H.; Lascaratos, A.; Malačić, V.; Manca, B.B.; Mantziafou, A.; Orlić, M.; et al. Northern Adriatic Sea. In Physical Oceanography of the Adriatic Sea Past, Present and Future; Cushman-Roisin, B., Gačić, M., Poulain, P.M., Artegiani, A., Eds.; Kluwer Academic Publishers: Dordrecht, The Netherlands, 2001; pp. 143–165. [Google Scholar]
  21. Lionello, P.; Cavaleri, L.; Nissen, K.M.; Pino, C.; Raicich, F.; Ulbrich, U. Severe marine storms in the Northern Adriatic: Characteristics and trends. Phys. Chem. Earth Parts A/B/C 2012, 40–41, 93–105. [Google Scholar] [CrossRef]
  22. Aguzzi, M.; Bonsignore, F.; De Nigris, N.; Morelli, M.; Paccagnella, T.; Romagnoli, C.; Unguendoli, S. Stato Del Litorale Emiliano—Romagnolo Al 2012. Erosione e Interventi di Difesa, Quaderni di ARPAE—Regione Emilia Romagna; Arpae Emilia-Romagna: Bologna, Italy, 2012; ISBN 978-88-87854-41-1. (In Italian) [Google Scholar]
  23. Martinelli, L.; Zanuttigh, B.; Corbau, C. Assessment of coastal flooding hazard along the Emilia Romagna Littoral, IT. Coast. Eng. 2010, 57, 1042–1158. [Google Scholar] [CrossRef]
  24. Archetti, R.; Gaeta, M.G. Design of multipurpose coastal protection measures at the Reno river mouth (Italy). In Proceedings of the 28th International Ocean and Polar Engineering Conference, Sapporo, Japan, 10–15 June 2018; pp. 1343–1348. [Google Scholar]
  25. Google Earth (Image ©2017 TerraMetrics, Data SIO, NOAA, U.S. Navy, NGA, GEBCO, 2017). Available online: https://www.google.com/earth/ (accessed on 5 April 2018).
  26. Rockel, B.; Will, A.; Hense, A. The regional Climate Model COSMO-CLM (CCLM). Meteorol. Z. 2008, 17, 347–348. [Google Scholar] [CrossRef]
  27. Steppeler, J.; Doms, G.; Schattler, U.; Bitzer, H.W.; Gassmann, A.; Damrath, U.; Gregoric, G. Meso-gamma scale forecasts using the nonhydrostatic model LM. Meteorol. Atmos. Phys. 2003, 82, 75–96. [Google Scholar] [CrossRef]
  28. Bucchignani, E.; Montesarchio, M.; Zollo, A.L.; Mercogliano, P. High-resolution climate simulations with COSMO-CLM over Italy: Performance evaluation and climate projections for the 21st century. Int. J. Climatol. 2016, 36, 735–756. [Google Scholar] [CrossRef]
  29. Moss, R.; Edmons, J.; Hibbard, K.; Manning, M.; Rose, S.; van Vuuren, D.P.; Carter, T.; Emori, S.; Kainuma, M.; Kram, T.; et al. The next generation of scenarios for climate change research and assessment. Nature 2010, 463, 747–756. [Google Scholar] [CrossRef] [PubMed]
  30. Church, J.A.; Clark, P.U.; Cazenave, A.; Gregory, J.M.; Jevrejeva, S.; Levermann, A.; Merrifield, M.A.; Milne, G.A.; Nerem, R.S.; Nunn, P.D.; et al. Sea level change. In Climate Change 2013: The Physical Science Basis. Contribution of Working Group I to the Fifth Assessment Report of the Intergovernmental Panel on Climate Change; Cambridge University Press: Cambridge, UK; New York, NY, USA, 2013. [Google Scholar]
  31. Dee, D.; Uppala, S.; Simmons, A.; Berrisford, P.; Poli, P.; Kobayashi, S.; Andrae, U.; Balmaseda, M.; Balsamo, G.; Bauer, P.; et al. The era-interim reanalysis: Configuration and performance of the data assimilation system. Q. J. R. Meteorol. Soc. 2011, 137, 553–597. [Google Scholar] [CrossRef]
  32. Scoccimarro, E.; Gualdi, S.; Bellucci, A.; Sanna, A.; Fogli, P.; Manzini, E.; Vichi, M.; Oddo, P.; Navarra, A. Effects of tropical cyclones on ocean heat transport in a high resolution coupled general circulation model. J. Clim. 2011, 24, 4368–4384. [Google Scholar] [CrossRef]
  33. Bellafiore, D.; Bucchignani, E.; Gualdi, S.; Carniel, S.; Djurdjevic, V.; Umgiesser, G. Assessment of meteorological climate models as inputs for coastal studies. Ocean Dyn. 2012, 62, 555–568. [Google Scholar] [CrossRef]
  34. Bonaldo, D.; Bucchignani, E.M.; Ricchi, A.; Carniel, S. Wind storminess in the Adriatic Sea in a climate change scenario. Acta Adriat. 2017, 58, 195–208. [Google Scholar]
  35. Booij, N.; Ris, R.C.; Holthuijsen, L.H. A third-generation wave model for coastal regions: 1. Model description and validation. J. Geophys. Res. 1999, 104, 7649–7666. [Google Scholar] [CrossRef] [Green Version]
  36. Benetazzo, A.; Fedele, F.; Carniel, S.; Ricchi, A.; Bucchignani, E.; Sclavo, M. Wave climate of the Adriatic Sea: A future scenario simulation. Nat. Hazards Earth Syst. Sci. 2012, 12, 2065–2076. [Google Scholar] [CrossRef]
  37. Benetazzo, A.; Bergamasco, A.; Bonaldo, D.; Falcieri, F.M.; Sclavo, M.; Langone, L.; Carniel, S. Response of the Adriatic Sea to an intense cold air outbreak: Dense water dynamics and wave-induced transport. Prog. Oceanogr. 2014, 128, 115–138. [Google Scholar] [CrossRef]
  38. Benoit, M.; Marcos, F.; Becq, F. Development of a third generation shallow-water wave model with unstructured spatial meshing. In Proceedings of the 25th International Conference on Coastal Engineering, Orlando, FL, USA, 2–6 September 1996. [Google Scholar]
  39. Hervouet, J.M. Hydrodynamics of Free Surface Flows: Modelling with the Finite Element Method; John Wiley & Sons, Ltd.: London, UK, 2007; p. 360. [Google Scholar]
  40. Masina, M.; Lamberti, A.; Archetti, R. Coastal flooding: A copula based approach for estimating the joint probability of water levels and waves. Coast. Eng. 2015, 97, 37–52. [Google Scholar] [CrossRef]
  41. Boccotti, P. Wave Mechanics for Ocean Engineering; Elsevier: New York, NY, USA, 2000. [Google Scholar]
  42. Husler, J.; Reiss, R.-D. Maxima of normal random vectors: Between independence and complete dependence. Stat. Probab. Lett. 1989, 7, 283–286. [Google Scholar] [CrossRef]
  43. Conte, D.; Lionello, P. Characteristics of large positive and negative surges in the Mediterranean Sea and their attenuation in future climate scenarios. Glob. Planet. Chang. 2013, 111, 159–173. [Google Scholar] [CrossRef]
  44. Vousdoukas, M.I.; Voukouvalas, E.; Annunziato, A.; Giardino, A.; Feyen, L. Projections of extreme storm surge levels along Europe. Clim. Dyn. 2016, 47, 3171–3190. [Google Scholar] [CrossRef] [Green Version]
  45. Rahmstorf, S. A semi-empirical approach to projecting future sea-level rise. Science 2007, 315, 368–370. [Google Scholar] [CrossRef] [PubMed]
  46. Cavaleri, L.; Abdalla, S.; Benetazzo, A.; Bertotti, L.; Bidlot, J.-R.; Breivik, Ø.; Carniel, S.; Jensen, R.E.; Portilla-Yandun, J.; Rogers, W.E.; et al. Wave modelling in coastal and inner seas. Prog. Oceanogr. 2018. [Google Scholar] [CrossRef]
  47. TELEMAC. The Mathematically Superior Suite of Solvers 2017. Available online: http://www.opentelemac.com (accessed on 10 April 2018).
  48. Kuang, C.P.; Stansby, P. Modelling directional random wave propagation inshore. Proc. Inst. Civ. Eng. Marit. Eng. 2004, 157, 123–131. [Google Scholar] [CrossRef]
  49. Hervouet, J.-M.; Razafindrakoto, E.; Villaret, C. Dealing with dry zones in free surface flows: A new class of advection schemes. In Proceedings of the 34th IAHR World Congress, Brisbane, Australia, 26 June–1 July 2011. [Google Scholar]
  50. Villaret, C.; Hervouet, J.-M.; Kopmann, R.; Merkel, U.; Davies, A. Morphodynamic modeling using the Telemac finite-element system. Comput. Geosci. 2013, 53, 105–113. [Google Scholar] [CrossRef]
  51. Longuet-Higgins, M.S.; Stewart, R.W. Radiation stresses in water waves; a physical discussion, with applications. Deep Sea Res. Oceanogr. Abstr. 1964, 11, 529–562. [Google Scholar] [CrossRef]
  52. CHC—Canadian Hydraulics Centre, National Research Council. Blue Kenue. Reference Manual; Canadian Hydraulics Centre, National Research Council: Ottawa, ON, Canada, 2010.
  53. Samaras, A.G.; Gaeta, M.G.; Miquel, A.M.; Archetti, R. High-resolution wave and hydrodynamics modelling in coastal areas: Operational applications for coastal planning, decision support and assessment. Nat. Hazards Earth Syst. Sci. 2016, 16, 1499–1518. [Google Scholar] [CrossRef]
  54. Gaeta, M.G.; Samaras, A.G.; Federico, I.; Archetti, R.; Maicu, F.; Lorenzetti, G. A coupled wave-3D hydro-dynamics model of the Taranto Sea (Italy): A multiple-nesting approach. Nat. Hazards Earth Syst. Sci. 2016, 16, 2071–2083. [Google Scholar] [CrossRef]
  55. Battjes, J.A.; Janssen, J.P.F.M. Energy loss and set-up due to breaking of random waves. In Proceedings of the 16th International Conference on Coastal Engineering, Hamburg, Germany, 27 August–3 September 1978; pp. 569–587. [Google Scholar]
  56. Hasselmann, K.; Barnett, T.P.; Bouws, E.; Carlson, H.; Cartwright, D.E.; Enke, K.; Ewing, J.A.; Gienapp, H.; Hasselmann, D.E.; Kruseman, P.; et al. Measurements of wind-wave growth and swell decay during the Joint North Sea Wave Project (JONSWAP). Ergänz. Dtsch. Hydrogr. Z. Reihe 1973, A 8, 95. [Google Scholar]
  57. Eldeberky, Y.; Battjes, J.A. Parameterisation of triads interactions in wave energy models. In Proceedings of the Coastal Dynamics Conference ’95, Gdansk, Poland, 4–8 September 1995; pp. 140–148. [Google Scholar]
  58. Ruessink, B.; Miles, J.; Feddersen, F.; Guza, R.; Elgar, S. Modeling the alongshore current on barred beaches. J. Geophys. Res. 2001, 106, 22451–22463. [Google Scholar] [CrossRef] [Green Version]
  59. Feddersen, F.; Guza, R. Observation of nearshore circulation: Alongshore uniformity. J. Geophys. Res. 2003, 108, 6-1–6-10. [Google Scholar] [CrossRef]
  60. Sclavo, M.; Benetazzo, A.; Carniel, S.; Bergamasco, A.; Falcieri, F.M.; Bonaldo, D. Wave-current interaction effect on sediment dispersal in a shallow semi-enclosed basin. J. Coast. Res. 2013, 65, 1587–1592. [Google Scholar] [CrossRef]
  61. Carniel, S.; Bonaldo, D.; Benetazzo, A.; Bergamasco, A.; Boldrin, A.; Falcieri, F.M.; Sclavo, M.; Trincardi, F.; Langone, L. Off-shelf fluxes across the southern Adriatic margin: Factors controlling dense-water-driven transport phenomena. Mar. Geol. 2016, 375, 44–63. [Google Scholar] [CrossRef]
  62. Archetti, R. Quantifying the evolution of a beach protected by low crested structures using video monitoring. J. Coast. Res. 2009, 25, 884–899. [Google Scholar] [CrossRef]
  63. Bonaldo, D.; Benetazzo, A.; Sclavo, M.; Carniel, S. Modelling wave-driven sediment transport in a changing climate: A case study for northern Adriatic Sea (Italy). Reg. Environ. Chang. 2015, 15, 45–55. [Google Scholar] [CrossRef]
Figure 1. Wider view of the study area of Lido di Spina (images from Google Earth [25]; privately processed). The plot also shows the location of areas of interest: Logonovo channel at Lido degli Estensi (zone a), Lido di Spina (zone b), and Gobbino channel (zone c).
Water 10 01380 g001
Figure 2. Wave rose at the study area of Lido di Spina from the transposed observations.
Water 10 01380 g002
Figure 3. Monthly averages of the significant wave height Hs,m offshore of the study area of Lido di Spina that resulted from CTR (1971–2000) and SCE (2071–2100) scenarios performed by SWAN implementation [34] and from NAUSICAA—transposed observations (2007–2017) for Sirocco (left panel) and Bora (right panel) events.
Water 10 01380 g003
Figure 4. Statistics of extreme events for CTR (blue) and SCE (red) runs for Sirocco (left panel) and Bora (right panel) events. Filled dots show extreme values from simulations; tendency curves following Gumbel distribution are plotted in solid lines.
Water 10 01380 g004
Figure 5. Relation between Hs and Tp for Sirocco (left panel) and Bora (right panel) events for the NAUSICAA-transposed observations at the study site. Tendency curves for the extreme events are also plotted with solid black lines.
Water 10 01380 g005
Figure 6. Interpolated bathymetry map in UTM-WGS84 coordinates used for the TELEMAC simulations (left panel), as well as the position of the two selected transects A-A and B-B (solid lines). Zoom on the implemented variable density unstructured mesh for the study area ((right panel) corresponding to the black box in (left panel)).
Water 10 01380 g006
Figure 7. Sirocco events. Distribution of significant wave height and mean wave direction vectors for SCE—S1 (left panel) and SCE—S25 (right panel) runs, respectively.
Water 10 01380 g007
Figure 8. Bora events. Distribution of significant wave height and mean wave direction vectors for SCE—B1 (left panel) and SCE—B25 (right panel) runs, respectively.
Water 10 01380 g008
Figure 9. Sirocco events. Cross-shore distribution of the significant wave height Hs as calculated by TOM along the transect A-A (left panels) and transect B-B (right panels).
Water 10 01380 g009
Figure 10. Bora events. Cross-shore distribution of the significant wave height Hs as calculated by TOM along the transect A-A (left panels) and transect B-B (right panels).
Water 10 01380 g010
Figure 11. Sirocco events. Cross-shore distribution of the alongshore velocity as calculated by TEL2D for ordinary S1 and extreme S25 events and of the water depth along transect A-A (left panels) and transect B-B (right panels).
Water 10 01380 g011
Figure 12. Bora events. Cross-shore distribution of the alongshore velocity as calculated by TEL2D for ordinary B1 and extreme B25 events, and of the water depth along transect A-A (left panels) and transect B-B (right panels).
Water 10 01380 g012
Figure 13. Sirocco events. Inundated areas for ordinary (left panel) and extreme (right panel) events and for CTR (blue lines) and SCE (red lines) scenarios. Black lines indicate the initial shoreline.
Water 10 01380 g013
Figure 14. Bora events. Inundated areas for ordinary (left panel) and extreme (right panel) events and for CTR (blue lines) and SCE (red lines) scenarios. Black lines indicate the initial shoreline.
Water 10 01380 g014
Table 1. Numerical characteristics of the proposed nesting approach for each of the different chain levels, i.e., the model extension, the mesh size range, the simulated period, the type of run, and the forcings inducing atmospheric and sea dynamics.
Chain LevelModelExtensionMesh Size RangePeriodRun TypeForcings
aRCM COSMO-CLMItalian marine regions [28]0.0715°
(~8 km)
1971–2100Atmospheric circulation SST, atmospheric conditions from [31,32]
bSWANAdriatic Sea2–10 km1971–2000Non-stationary wave fieldsFrom (a), wind at 10-m height
2071–2100Non-stationary wave fields
cTELEMACLido di Spina (4 km long and 2 km wide)25–50 m1971–2000Stationary wave fieldsFrom (b), after statistics: wave spectra, sea-level rise
2071–2100Stationary wave fields
Table 2. Characteristics of the simulated scenarios, with the significant wave height Hs, the peak period Tp, the mean wave direction Dir, the peak water level PWL, and the sea-level rise SLR.
ScenarioPeriodStorm DirectionStatisticsTR (year)Run NameHs (m)Tp (1) (s)Dir (° N)PWL (2) (m)SLR (m)
CTR1971–2000SiroccoOrdinary1CTR-S12.506.56900.790.00
SiroccoExtreme 25CTR-S253.317.55901.050.00
BoraOrdinary1CTR-B12.766.64450.830.00
BoraExtreme 25CTR-B253.47.38451.100.00
SCE2071–2100SiroccoOrdinary1SCE-S12.576.65900.81+0.70
SiroccoExtreme 25SCE-S253.778.06901.18+0.70
BoraOrdinary1SCE-B12.466.27450.79+0.70
BoraExtreme 25SCE-B253.317.28451.05+0.70
Note: (1) The values of Tp were estimated according to the exponential curves in Figure 5. (2) The joint probability analysis presented in [40] was adopted to estimate the peak water levels, as described in the text.
Table 3. Computed variation induced by climate changes between SCE and CTR runs of wave breaking line position ΔxB, maximum alongshore velocity ΔUls, MAX, and percentage of inundated area ΔΩ.
EventΔxB (m)ΔUls, MAX (%)ΔΩ (-)
Sirocco
TR = 1 year
−20+29
Sirocco
TR = 25 years
±0.0+84
Bora
TR = 1 year
−200−83.5
Bora
TR = 25 years
−70±03

