Article

Drought Risk Assessment in Cultivated Areas of Central Asia Using MODIS Time-Series Data

1
Key Laboratory of Digital Earth Sciences, Aerospace Information Research Institute, Chinese Academy of Sciences, Beijing 100101, China
2
National Center for Space Research and Technology, No. 15 Shevchenko, Almaty 050010, Kazakhstan
3
University of Chinese Academy of Sciences, No. 19(A) Yuquan Road, Shijingshan District, Beijing 100049, China
4
TEA, Key Laboratory of Regional Climate-Environment for Temperate East Asia, Institute of Atmospheric Physics, Chinese Academy of Sciences, Beijing 100029, China
*
Author to whom correspondence should be addressed.
Submission received: 18 May 2020 / Revised: 10 June 2020 / Accepted: 11 June 2020 / Published: 18 June 2020
(This article belongs to the Special Issue Global Changes in Drought Frequency and Severity)

Abstract

:
Drought is one of the most damaging environmental hazards and a naturally occurring phenomenon in Central Asia that is accompanied by crucial consequences for the agriculture sector. This research aimed at understanding the nature and extent of drought over the cropland regions of Central Asia with the help of spatiotemporal information from the region. We assessed drought occurrence using the vegetation health index (VHI). An algorithm was developed to reduce the noise of heterogeneous land surfaces by adjusting the vegetation index and brightness temperature. The vegetation condition index (VCI) and temperature condition index (TCI) were calculated using Moderate Resolution Imaging Spectroradiometer (MODIS) products for the growing season (April–September) from 2000 to 2015. The intense drought years were identified and a drought map (drought probability occurrence) was generated. The findings of this research indicated regional heterogeneity in the cropland areas having experienced droughts, observed through spatiotemporal variations. Some of the rain-fed and irrigated croplands of Kazakhstan demonstrated a higher vulnerability to annual drought occurrences and climate change impacts, while other cropland regions were found to be more resistant to such changes. The development of policy tools is required to support informed decision-making and planning processes to adapt to the occurrence of droughts. This could be achieved by the timely assessment, monitoring, and evaluation of the spatiotemporal distribution trends and variabilities of drought occurrences in this region. The results from this study focus on the spatiotemporal variations in drought to reveal the bigger picture in order to better understand the regional capacity for sustainable land management and agricultural activities within a changing environment.

1. Introduction

Drought occurrence is primarily a climatic event which is characterized by anomalies in the accumulated precipitation, reduced soil moisture, and decreased river runoff [1]. Under climate change [2], drought has been identified as one of the natural disasters with the potential for a non-homogeneous spatiotemporal increase in frequency, extent, and severity [3]. Drought is a periodical event in dry and arid regions of Central Asia, where severe drought occurrences generally happen once or twice per decade [4]. Spatially, with the annual drought region covering approximately 43%, Central Asia is alternating between wet and dry periods lasting over longer time spans [5]. Since 2000, the region has been predominantly experiencing wet conditions [5]; nevertheless, severe drought conditions were observed in 2000, 2001, 2010, and 2012 over spatially significant cultivated areas [4], which has resulted in decreased crop production [6]. With increasing global temperatures, it has been predicted that Central Asia will face a serious water crisis in the future, emerging as a result of the diminution of critical glacial masses and hence a reduction in water reserves over mountainous areas [7] along with changing precipitation patterns [8], which may have a serious impact on the future of crops and food security.
Monitoring the climatic and environmental parameters that affect cropland aids in scheduling cultivation and irrigation routines for optimal productivity. The time-series analysis of cropland conditions is therefore an essential tool to detect the effects of the extent and severity of drought events on crop yields for specific regions [9]. The quantification of a complex phenomenon such as drought over space and time requires an understanding of its spatial and temporal characteristics, which are difficult to analyze when utilizing the conventional methods. Drought indices are a valuable tool to study different aspects of drought, such as severity, duration, onset, and areal extent in spatiotemporal dimensions. Important examples of drought indices include the standardized precipitation index (SPI), Palmer drought severity index (PDSI), crop moisture index (CMI), surface water supply index (SWSI), reclamation drought index (RDI), and evapotranspiration deficit index (ETDI) [10,11]. Drought-related indices mainly consider parameters such as temperature, precipitation, soil moisture, evapotranspiration, stream flow, snowpack, and storage water levels in reservoirs, along with other parameters. Unlike Earth observation platforms, meteorological stations lack synoptic data coverage as they are not homogeneously positioned and are often quantitatively limited to the region of interest. With the improving quality of Earth observation technologies, the quantification of the aforementioned parameters for drought calculation has now become more feasible, and these parameters are being utilized to calculate drought indices. Important remote sensing-based drought indices include the normalized difference vegetation index (NDVI), vegetation health index (VHI), drought severity index (DSI), evapotranspiration deficit index (ETDI), vegetation condition index (VCI), and temperature condition index (TCI) [11,12]. These indices can help in employing alternate approaches to assess and mitigate crop failure at national, regional, and global scales. A number of researchers have successfully used the VHI in cultivated areas for the assessment of drought at different scales and spatial resolutions [12,13,14,15,16]. Rojas and Vrieling [13] calculated the VHI over the African continent for two seasons and estimated the probability of agricultural drought occurrence using long time-series datasets. In an earlier study by Chen et al. [14], they calculated the drought occurrence probability using the VHI for Central America with MODIS products for two different seasons, revealing a good correlation between the climate variables and the VHI. Another comparative study by Amalo et al. [15] revealed the TCI to be drought-sensitive during the dry season, whereas the VCI was found to drought-sensitive during the wet season. Furthermore, the joint use of remote sensing and standard drought indices has been suggested, resulting in increased accuracy and an improved prediction performance [12]. The use of the VHI for regions where vegetation is mainly constrained by moisture—as in arid, semi-arid, and sub-humid climatic regions—has also been recommended [16].
In Central Asia, moisture-related drought indices have been widely used rather than temperature-related ones, due to the major issues of water scarcity in the area [17,18,19], where 80% of the land surface has a higher sensitivity to precipitation anomalies [20]. However, temperature is becoming an important parameter in drought assessment for the better estimation of the potential impacts of climate change on dry-land areas. According to a study by Mirzabaev [21], there has been an unprecedented increase in atmospheric temperature observed over the Central Asian territory, whereby temperatures above 30 °C used to occur for around 100 days a year in the 1960s, but this has recently increased to over 150 days a year over the whole region. Even with no significant changes in precipitation, the increased atmospheric temperatures can still lead to higher rates of evaporation and evapotranspiration, resulting in a decreased ground water availability.
A drought risk assessment for cropland is imperative to determine the overall regional productivity and to avert or mitigate the impact of environmental change for higher crop resilience. Timely information about the onset of drought, its extent, intensity, duration, and impacts can help to limit drought-related losses to society and human life while minimizing human suffering and reducing damage to the economy and the environment. The purpose of this study was to explore the potential applicability of a drought index for the Central Asia region while assessing the seasonal drought characteristics in order to investigate the spatiotemporal pattern of drought occurrences and changes for the region.

2. Materials and Methods
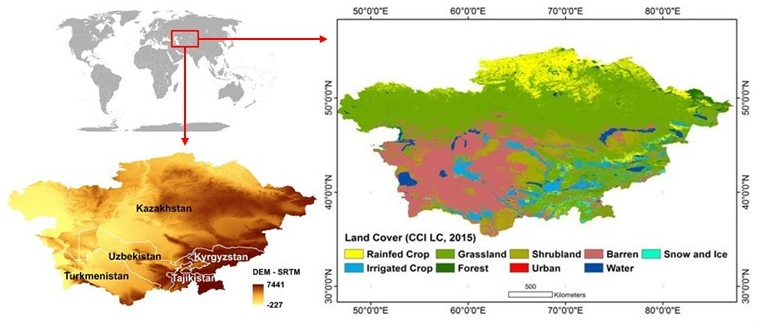
2.1. Study Area

Central Asia was selected as the study area for this work. The region consists of the five countries of Kyrgyzstan, Kazakhstan, Tajikistan, Turkmenistan, and Uzbekistan, which together cover over 4 million km2 of territory in the Asian continent. The region is defined by a continental climate with cold winters and hot summers. The annual average precipitation is 150 mm in the temperate desert, 300 mm in the temperate steppes, and 600 mm in the temperate mountain regions, and the majority of precipitation falls as snow [22,23]. The territory is mainly covered by grasslands and barren areas (Figure 1), with an uneven distribution of precipitation [4]. Moisture and water availability are the main factors controlling the distribution of cropland areas across Central Asia. Consequently, crops are less affected by drought than natural vegetation [24,25,26], due to the comparatively higher amount of rain during summer and irrigation. Dense cropland areas are found in the southern and northern parts of the region. Spatiotemporal studies of the cropland areas in Central Asia are still relatively few in number compared to studies of the decreasing volume of the Aral Sea, water resources, and climate change [27,28]. In fact, the impact of agriculture on the environment has been studied more due to the fragility of the ecosystem.
Agriculture is one of the main industries contributing to the Central Asian economy, and 20% to 60% of the entire population is linked to the agricultural sector, increasing the national GDP by 8% to 30% [29]. Institutional change during the 1990s had an impact on the stability and productivity of agriculture, but since 2000 most of the region’s cropland area has been recovered or restored [30,31]. Wheat is the chief crop in the region, occupying more than 50% of the cropland area in all five countries [6]. Overall, wheat production has increased during the study period (2000–2015), but during unfavorable years wheat productivity has declined by 20% to 60% [6,32].

2.2. Cropland Extraction

The cropland regions were extracted from the European Space Agency (ESA) Climate Change Initiative Land Cover (CCI LC) dataset, which is a free global dataset providing land-cover information from 1992 to 2015 at a spatial resolution of 300 m. ESA produced the CCL LC maps from spectral and temporal data obtained by the Advanced Very High Resolution Radiometer (AVHRR), Satellite Pour l’Observation dela Terre (SPOT) Vegetation, Medium Resolution Imaging Spectrometer (MERIS), and Sentinel systems [33]. The land-cover map contains 22 different classes, including rain-fed and irrigated cropland [34]. All the classes other than cropland (rain-fed and irrigated) were masked out. Only the regions classified as cropland for each season during the study period (2000–2015), according to the CCI LC data, were used for the time-series data analysis and the extraction of the drought index changes over the 16 years.

2.3. Drought Index Calculation

The MODIS datasets and products have been widely used to address environmental issues due to their relatively high spatial, spectral, and temporal resolutions [35,36,37]. The MODIS, MOD13Q1, and MOD11C2 products used in this study were downloaded from the https://ladsweb.modaps.eosdis.nasa.gov/ and https://search.earthdata.nasa.gov/ websites for the period of 2000 to 2015. The study analysis covered eight tiles of MOD13Q1 and MOD11C2 (h21v03, h21v04, h22v03, h22v04, h22v05, h23v03, h23v04, h23v05). The downloaded sinusoidal projected MODIS tiles were mosaicked and reprojected using the MODIS Reprojection Tool (MRT), which can be downloaded freely from https://lpdaac.usgs.gov/tools/. The MODIS land surface temperature (LST) product is produced from thermal infrared bands (bands 31 and 32 in the range of 10.780–11.280 and 11.770–12.270 μkm) and provides information on how hot the land surface is [38]. The MODIS enhanced vegetation index (EVI) data are computed from surface reflectance data, based on the fact that the chlorophyll pigment in plant leaves absorbs the red (670 nm) and blue (470 nm) wavelengths of the electromagnetic spectrum while strongly scattering the near-infrared (NIR) portion.
Consequently, the VCI is computed from the EVI time series using the reflectance data in the visible and NIR bands, and the TCI is computed from brightness temperature data from the MODIS thermal infrared spectral band [39]. The VHI, TCI, and VCI can be expressed as follows:
VHI = 0.5 × TCI + 0.5 × VCI
TCI = ( LSTmax LST ) ( LSTmax LSTmin )
VCI = ( EVI EVImin ) ( EVImax EVImin )
EVI = 2.5 × ( NIR     Red ) ( NIR   + 6 ×   Red   7.5 ×   Blue   + 1 )
where NIR, Red, and Blue are the surface reflectance; LST and EVI are the downloaded MODIS products; LSTmax and LSTmin are the maximum and minimum values of LST; and EVImax and EVImin are the maximum and minimum values of EVI, respectively.
The maximum and minimum EVI and LST values for each of the 16 days (the EVI product is available for each 16 days and the values of the LST product were averaged for each of the 16 days due to its availability for each 8 days) were calculated from April to September at the pixel scale with a spatial resolution of 250 m. Monthly and annual levels were produced for the analysis of the results. The VHI is a result of a weighted average of two indices and ranges from 0 to 1. In this work, we followed the standard definition of the VHI, where the weights are equal (0.5) for the TCI and the VCI (Equation (1)). For easy calculation, the VHI results were multiplied by 100 and thus range from 0 to 100, where 0 is minimum value of VHI and quantified as extreme crop stress and 100 is maximum value of VHI and is the most optimal condition for crops [39,40,41,42]. By considering the high correlation of VHI < 40 and crop stress, which has also been used and verified in previous drought studies, the VHI was categorized into five classes based on the threshold values expressed in the following table (Table 1).

2.4. Drought Probability Mapping
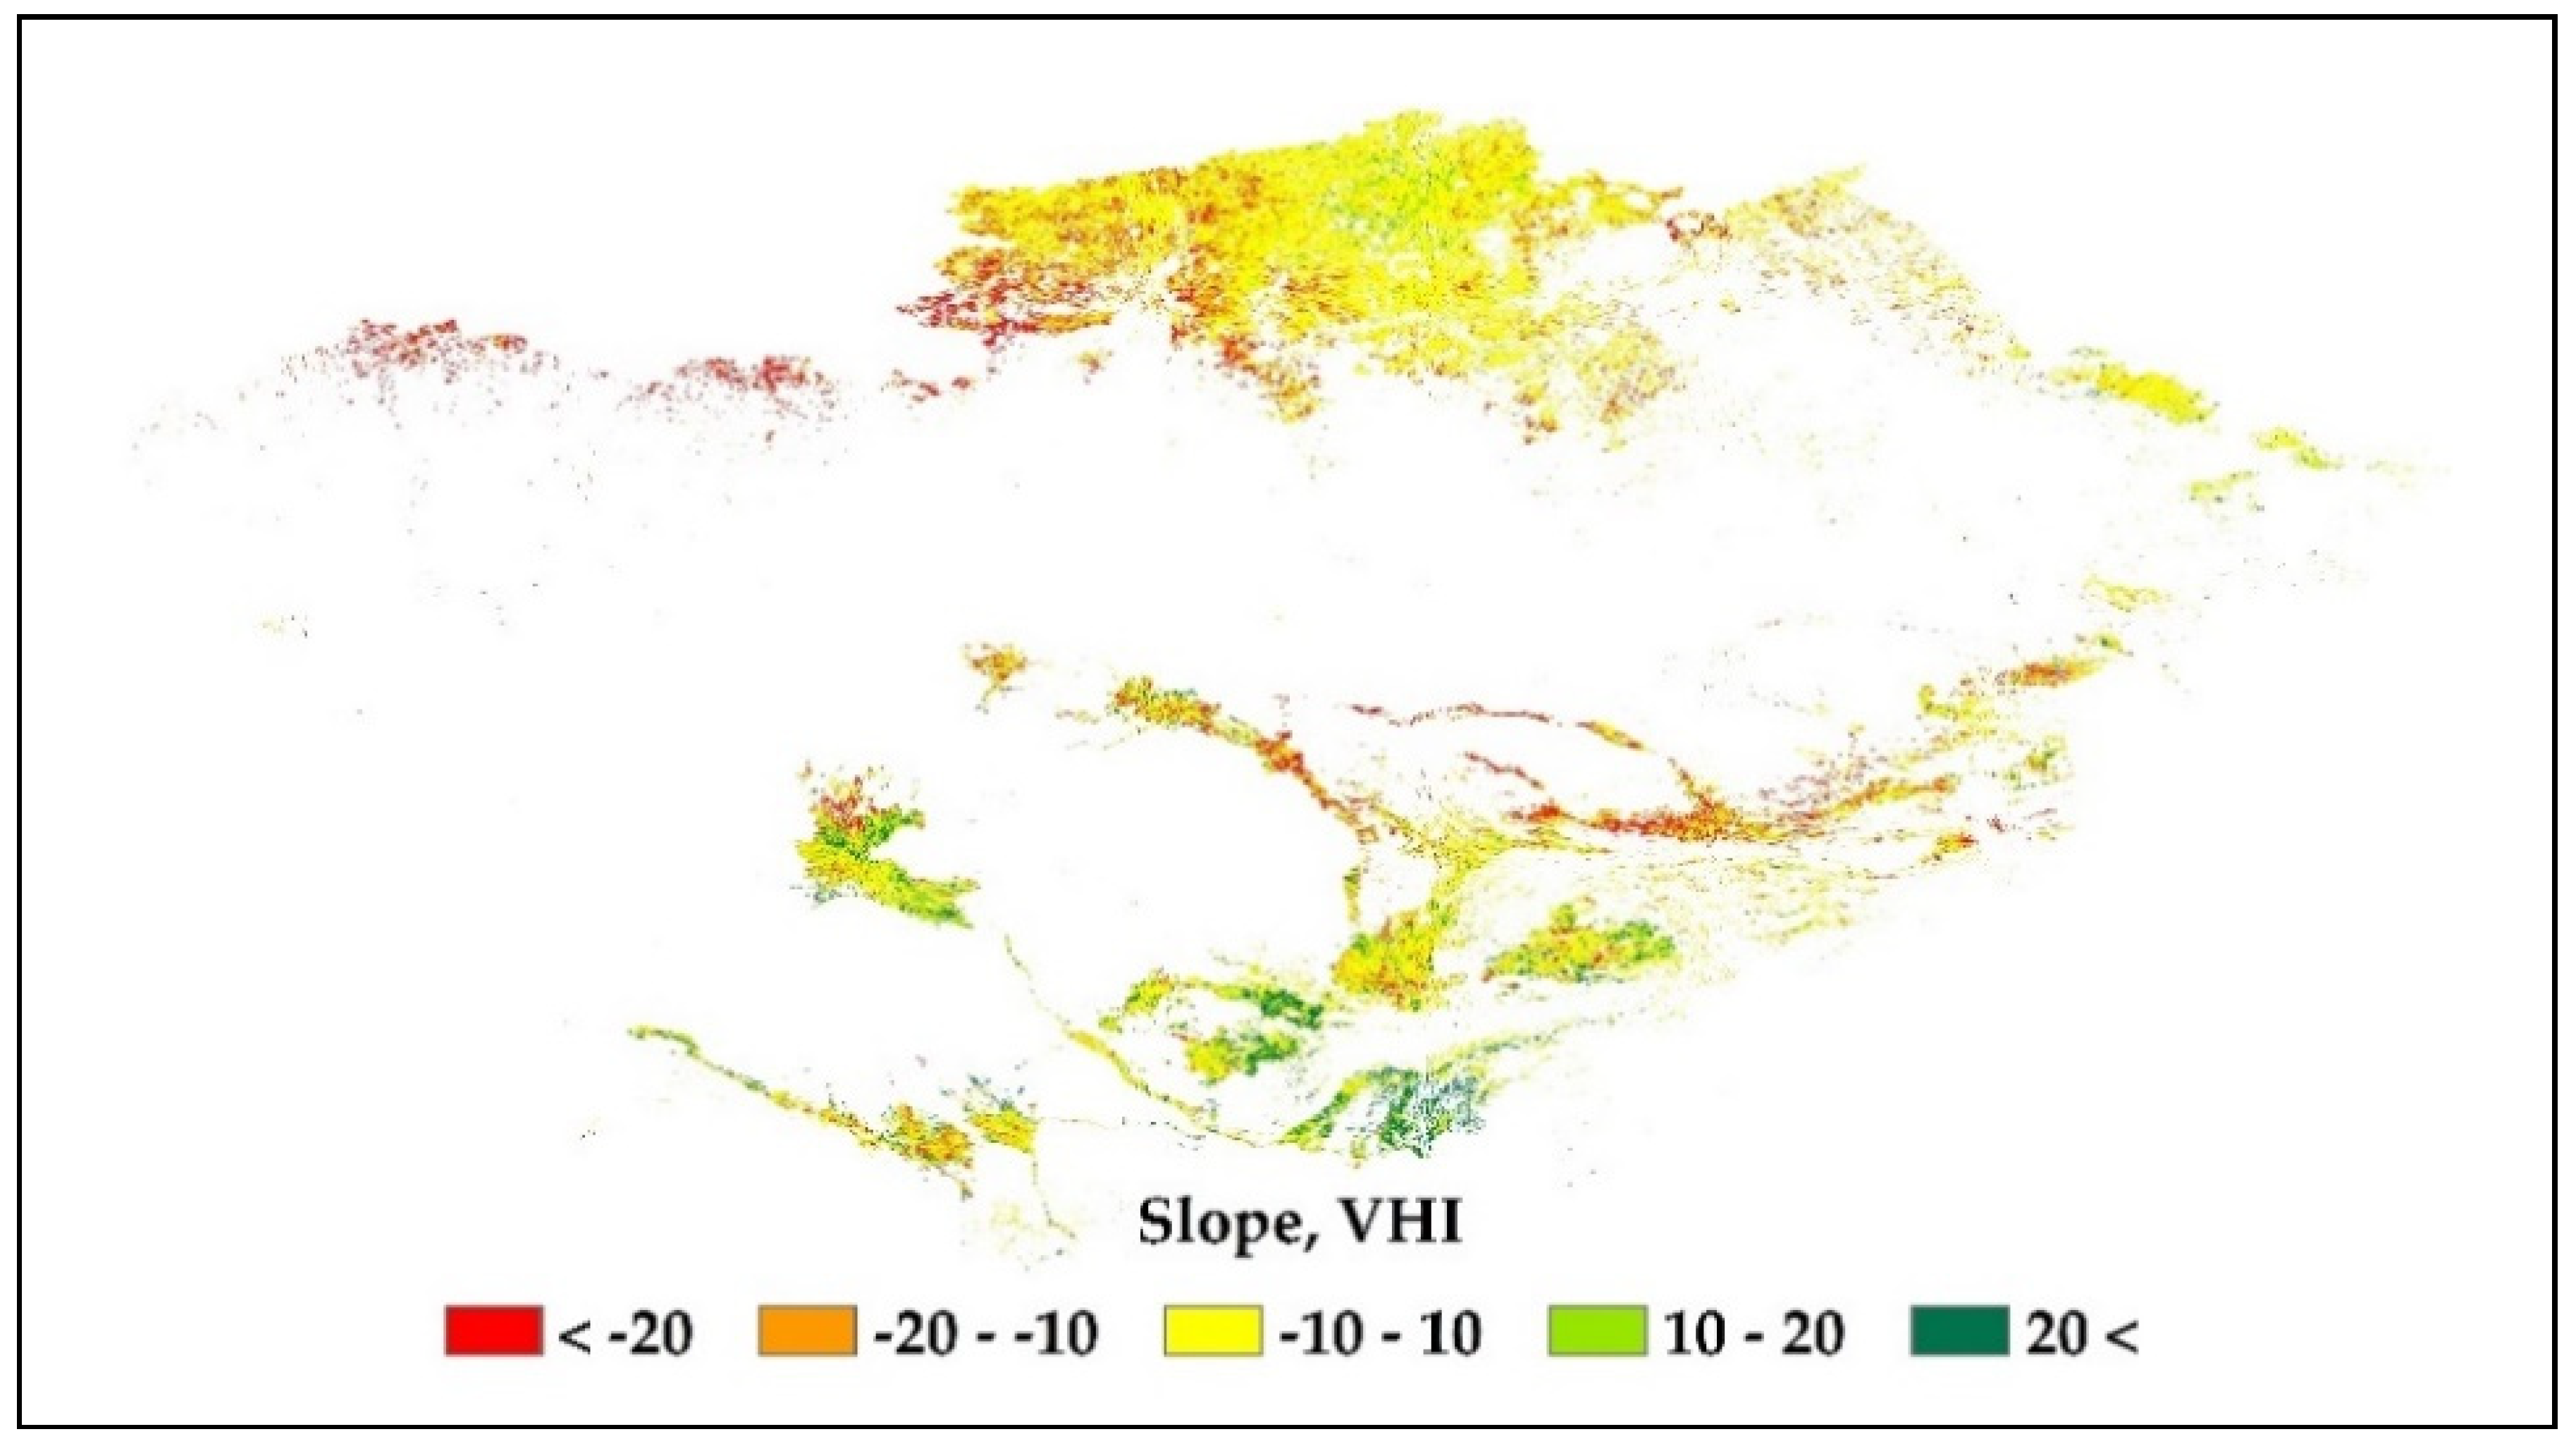
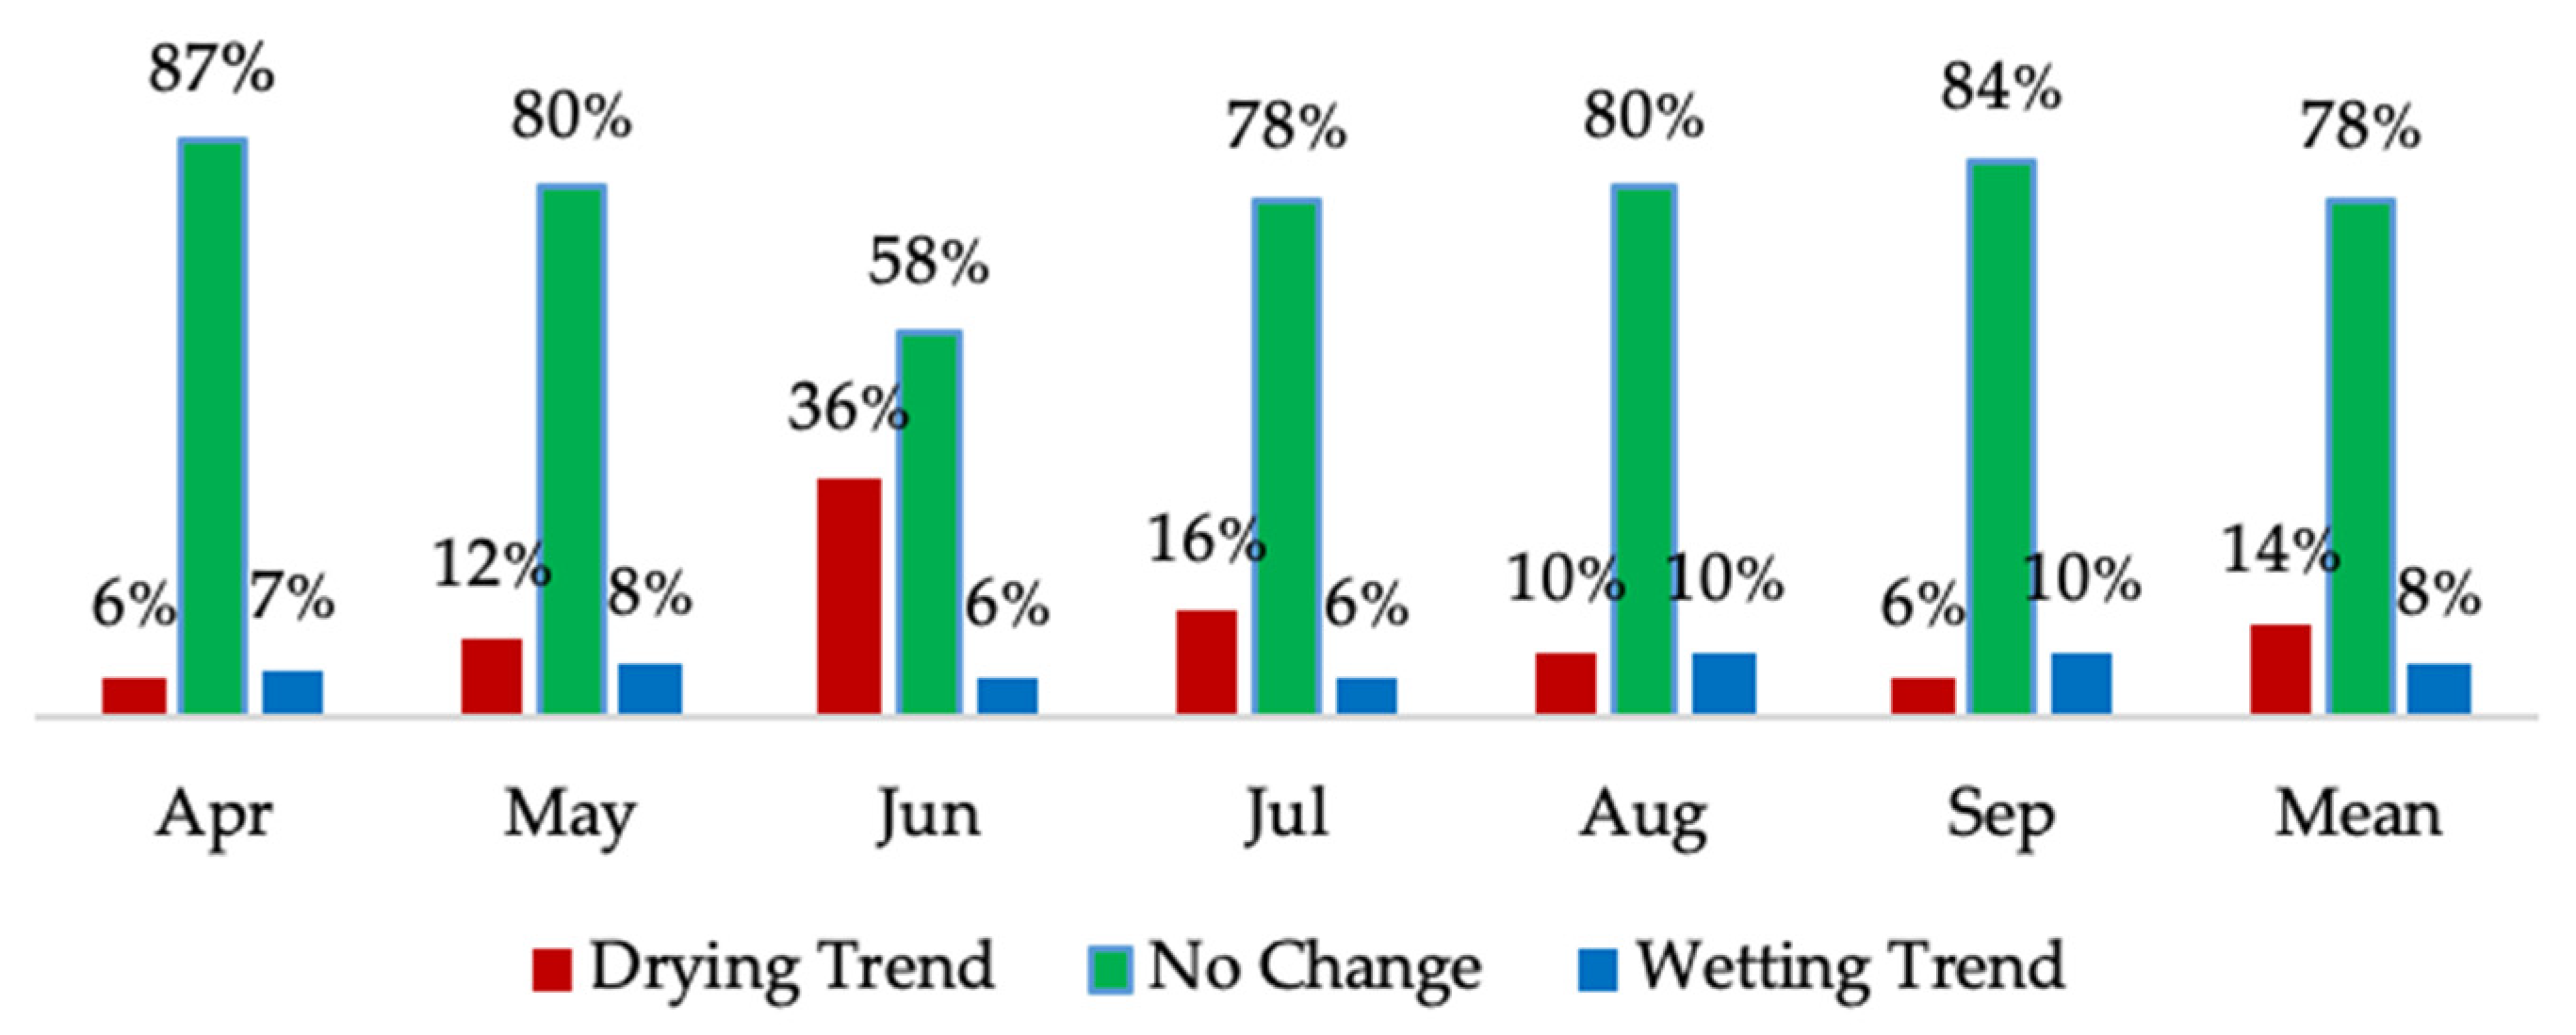
Drought recurrence, duration, and severity are vital aspects for water supply management, because droughts exacerbate the scarcity of natural water availability and resources. The probability of the occurrence of drought was therefore calculated at the pixel level by extracting drought events. The probability of a drought event ( p ) , considering all the growing season time, was calculated as follows:
p ^ = n / N ,
where n is the number of years that the drought event occurred in a period of N (16 years), and the confidence interval for p is p p ^ 2 p ^ ( 1 p ^ ) / N [13].

2.5. Trend Analysis

The trend analysis of environmental parameters plays an important role in the development and sustainable management of natural resources. A long-term change analysis was performed in this study using a linear approach. The linear trends were calculated for the yearly and monthly period of 2000–2015. A straight line was adjusted to each pixel location in the time-series data by using the least squares linear regression method. The linear regression line can be computed as follows:
y = a + bx .
The extracted regression line was then used to estimate the slope, where x (time) and y (drought) are the explanatory variable and dependent variable, respectively, while a and b are the intercept and slope, respectively. The slope indicates the temporal change of the studied variable at the pixel level. A positive slope indicates an increasing trend, while a negative slope indicates a decreasing trend. The adjustment to extracted regression line was evaluated by Pearson’s correlation coefficients, which reflect the degree of linear dependency between the datasets. The significance of the coefficients was evaluated at the 90–99% confidence level.

3. Results

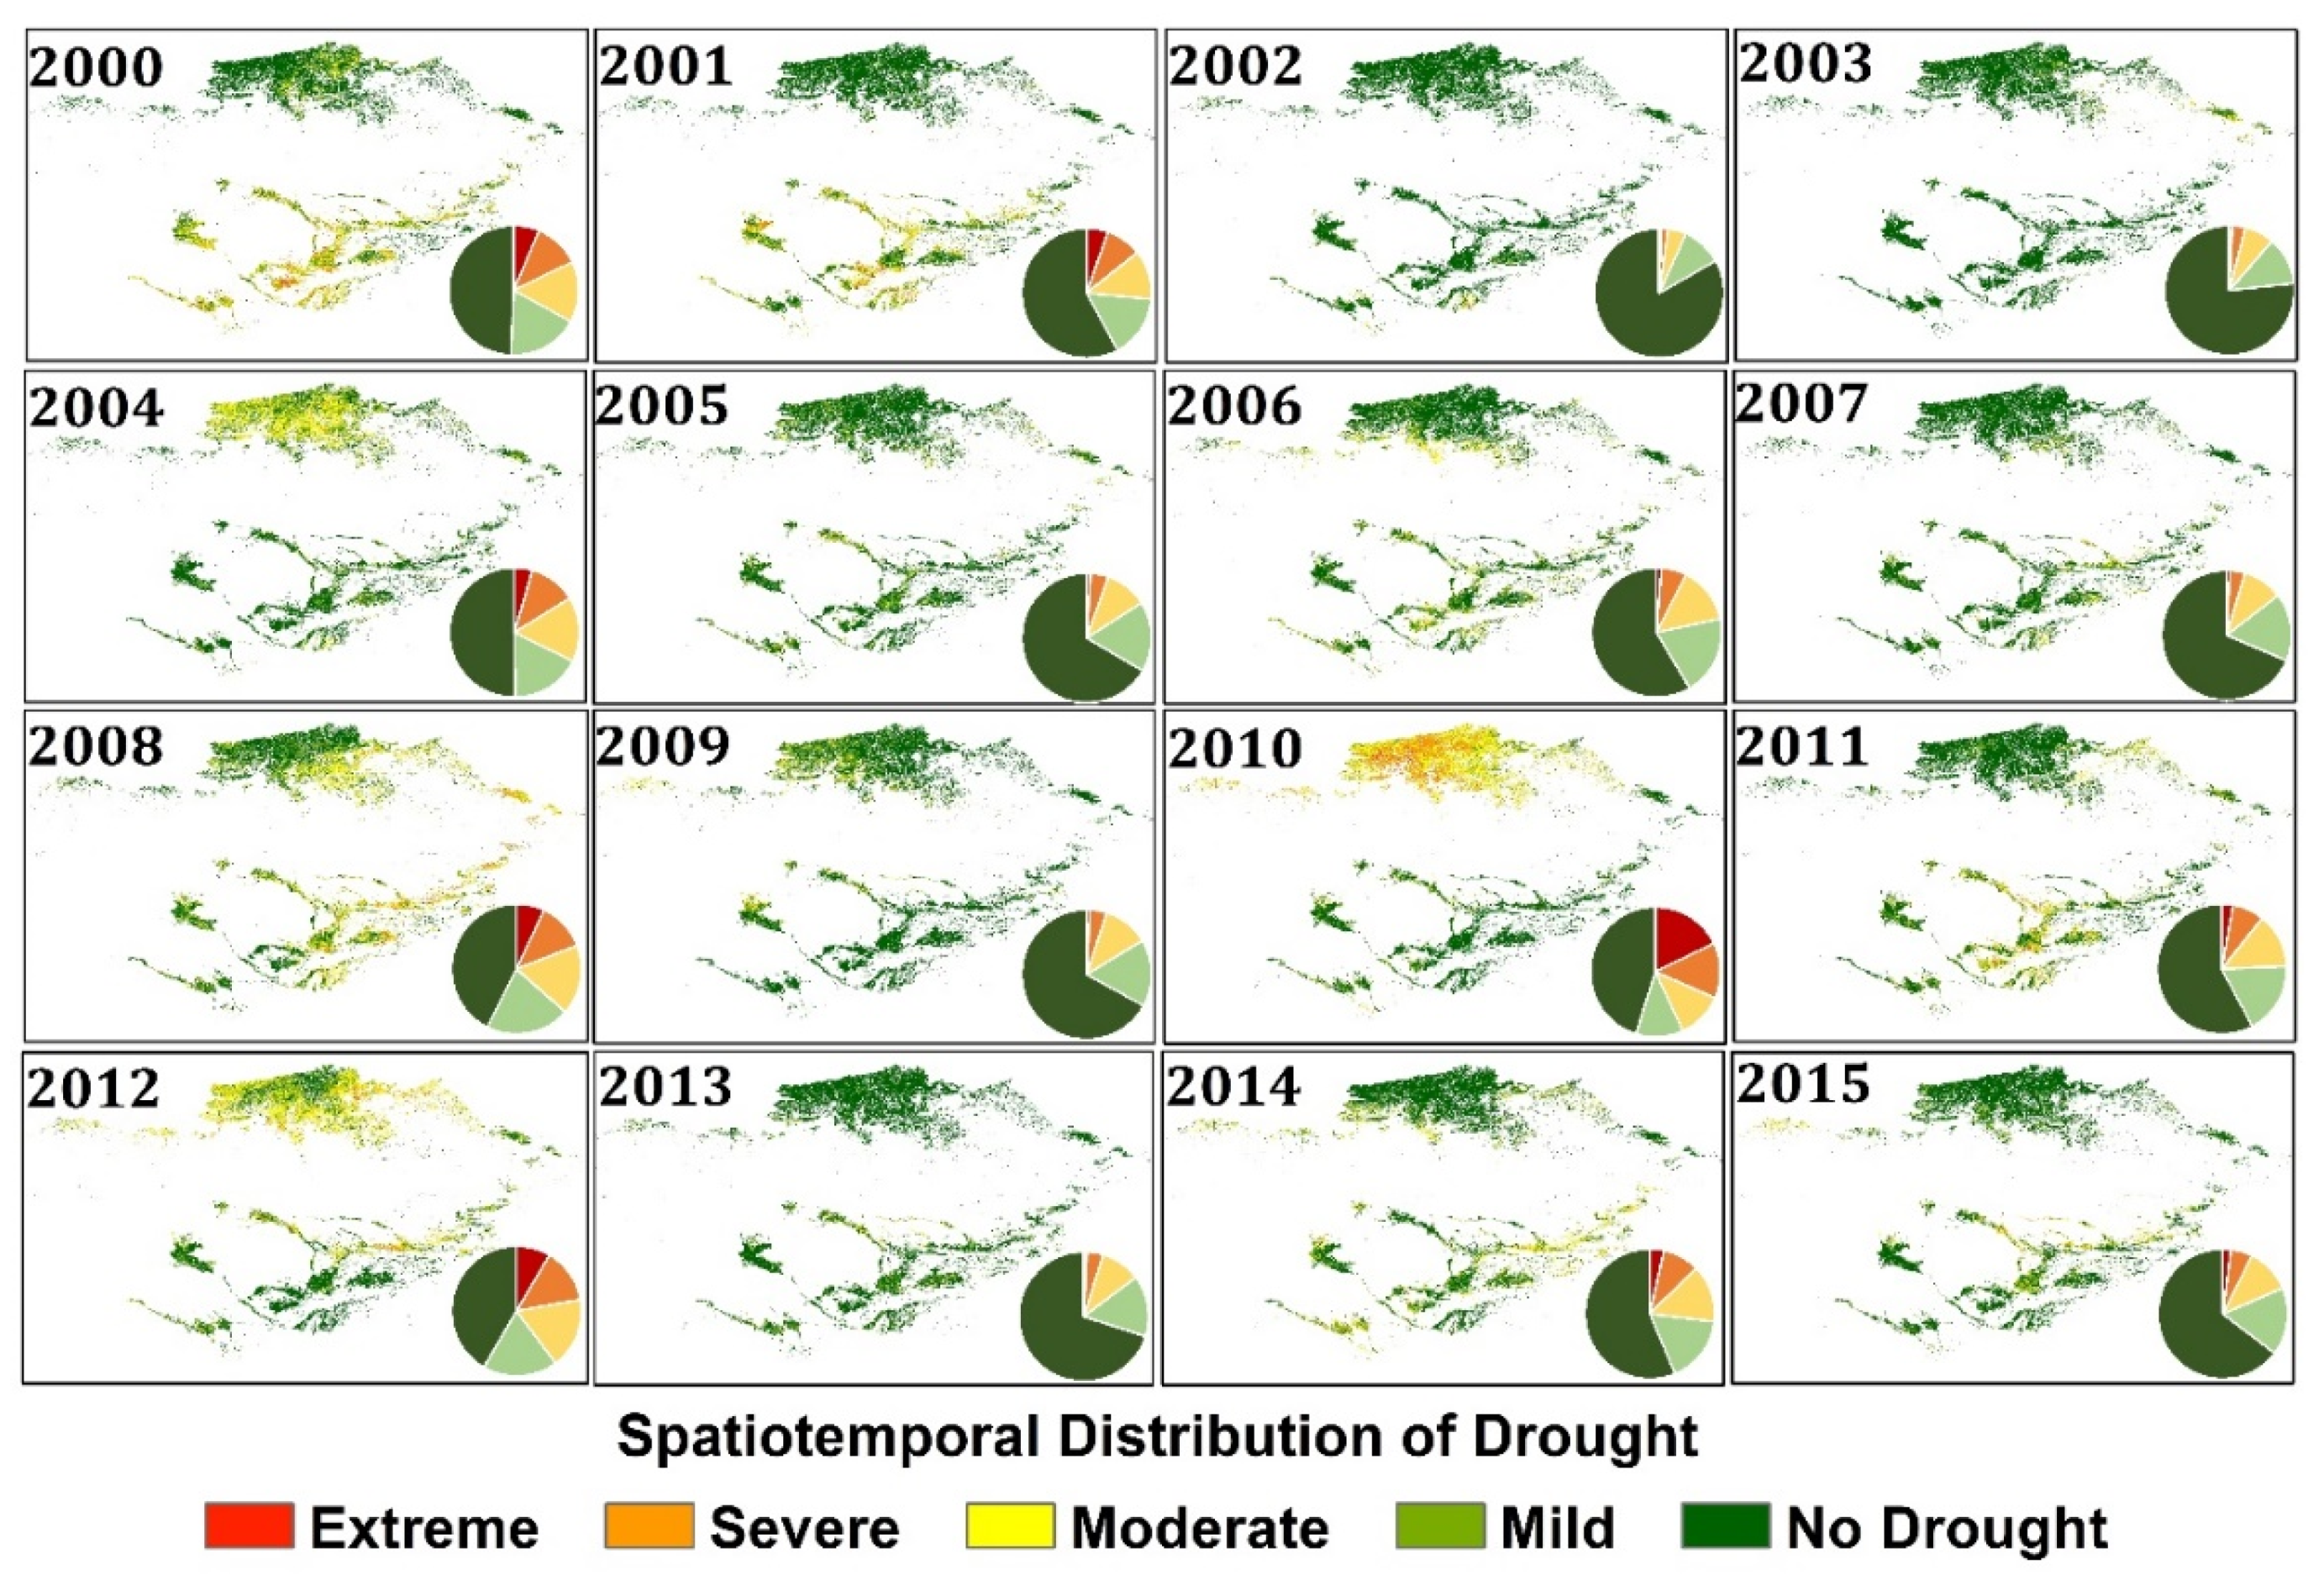
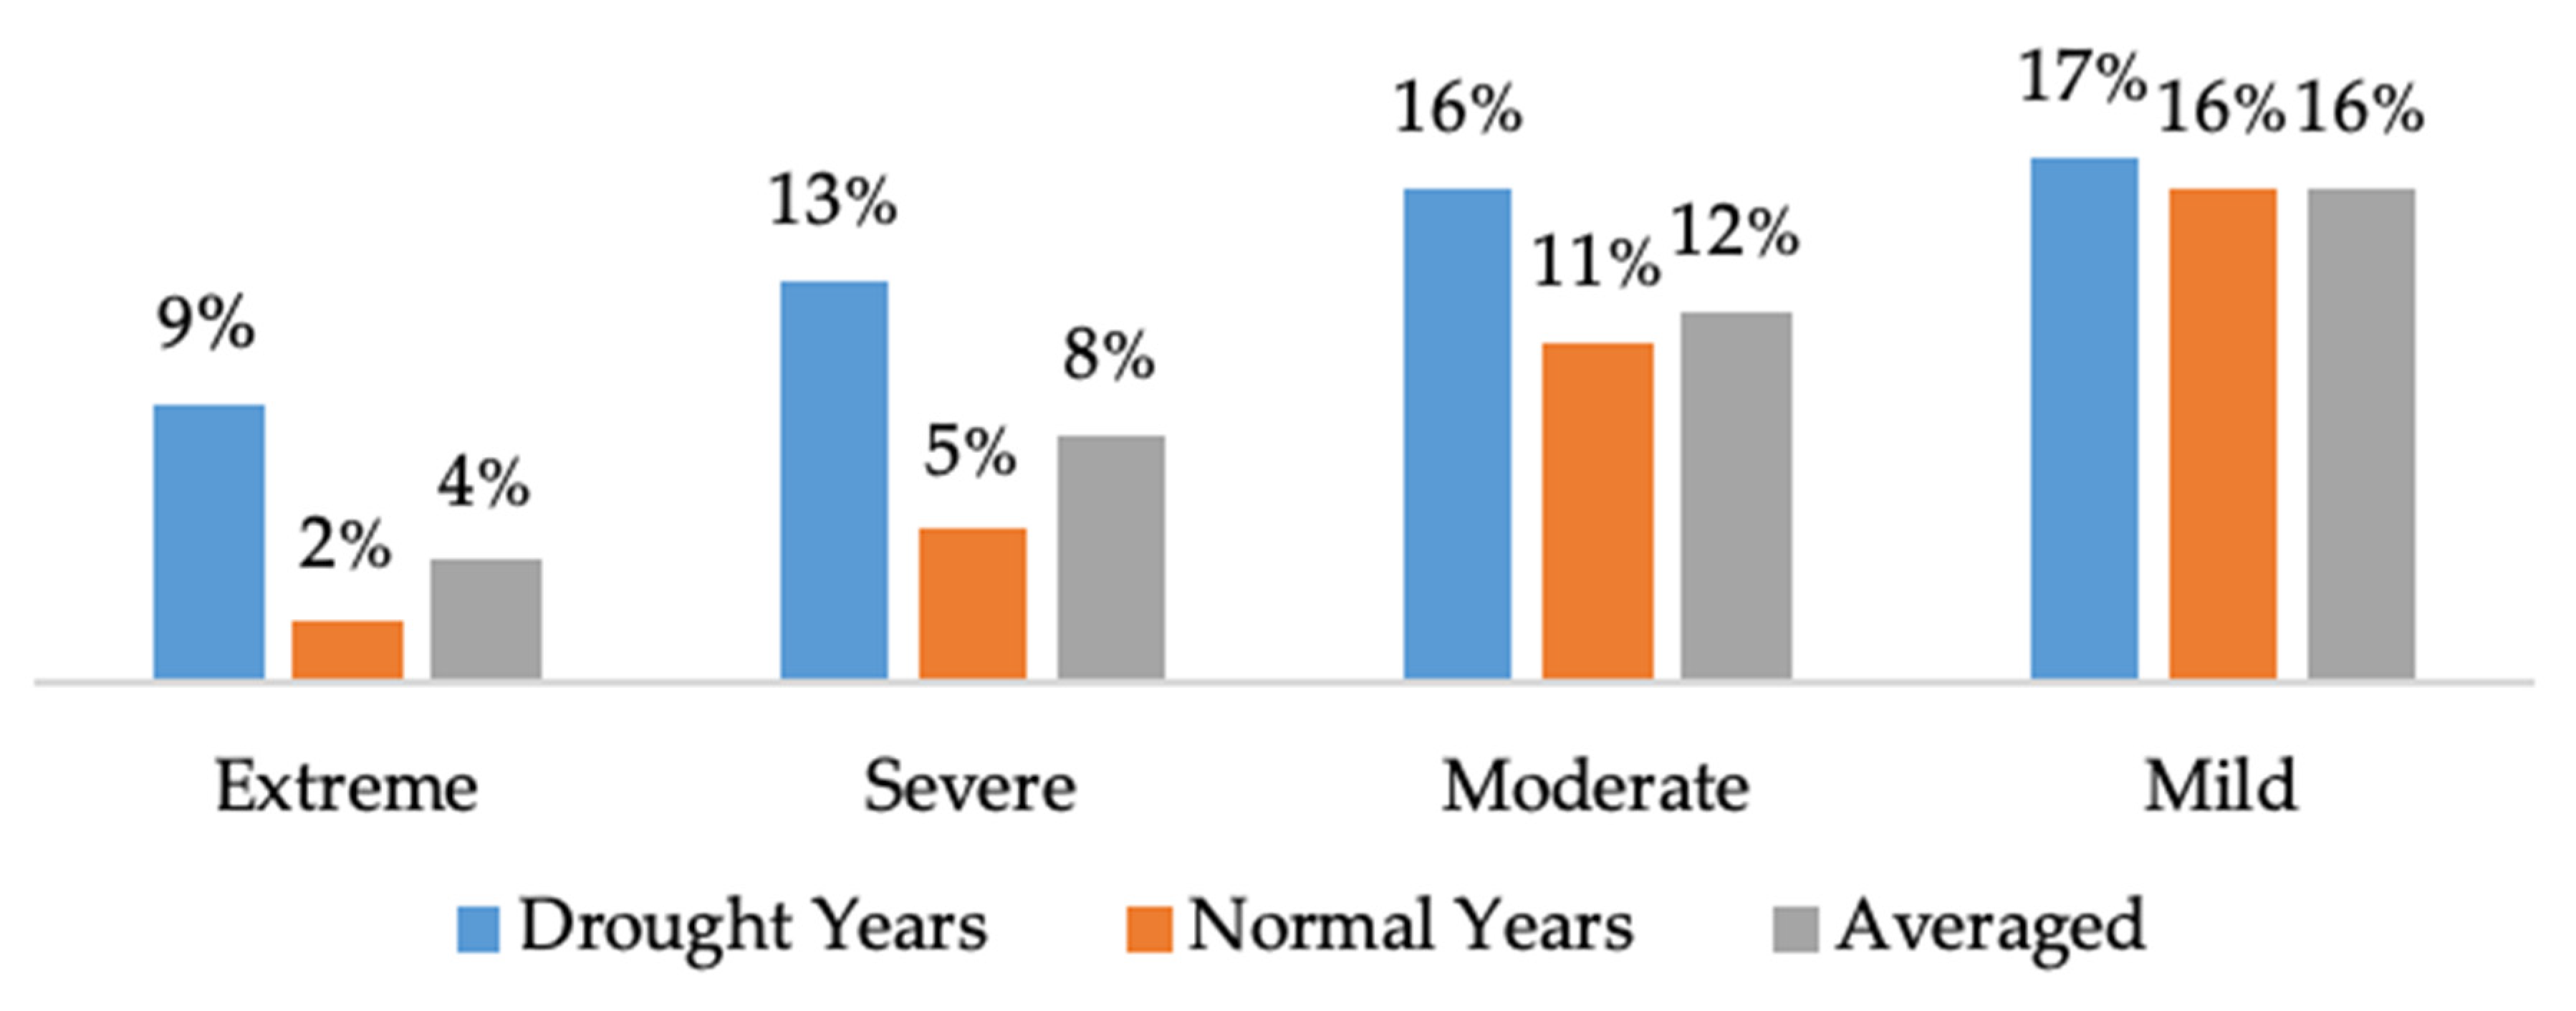
3.1. Drought Distribution
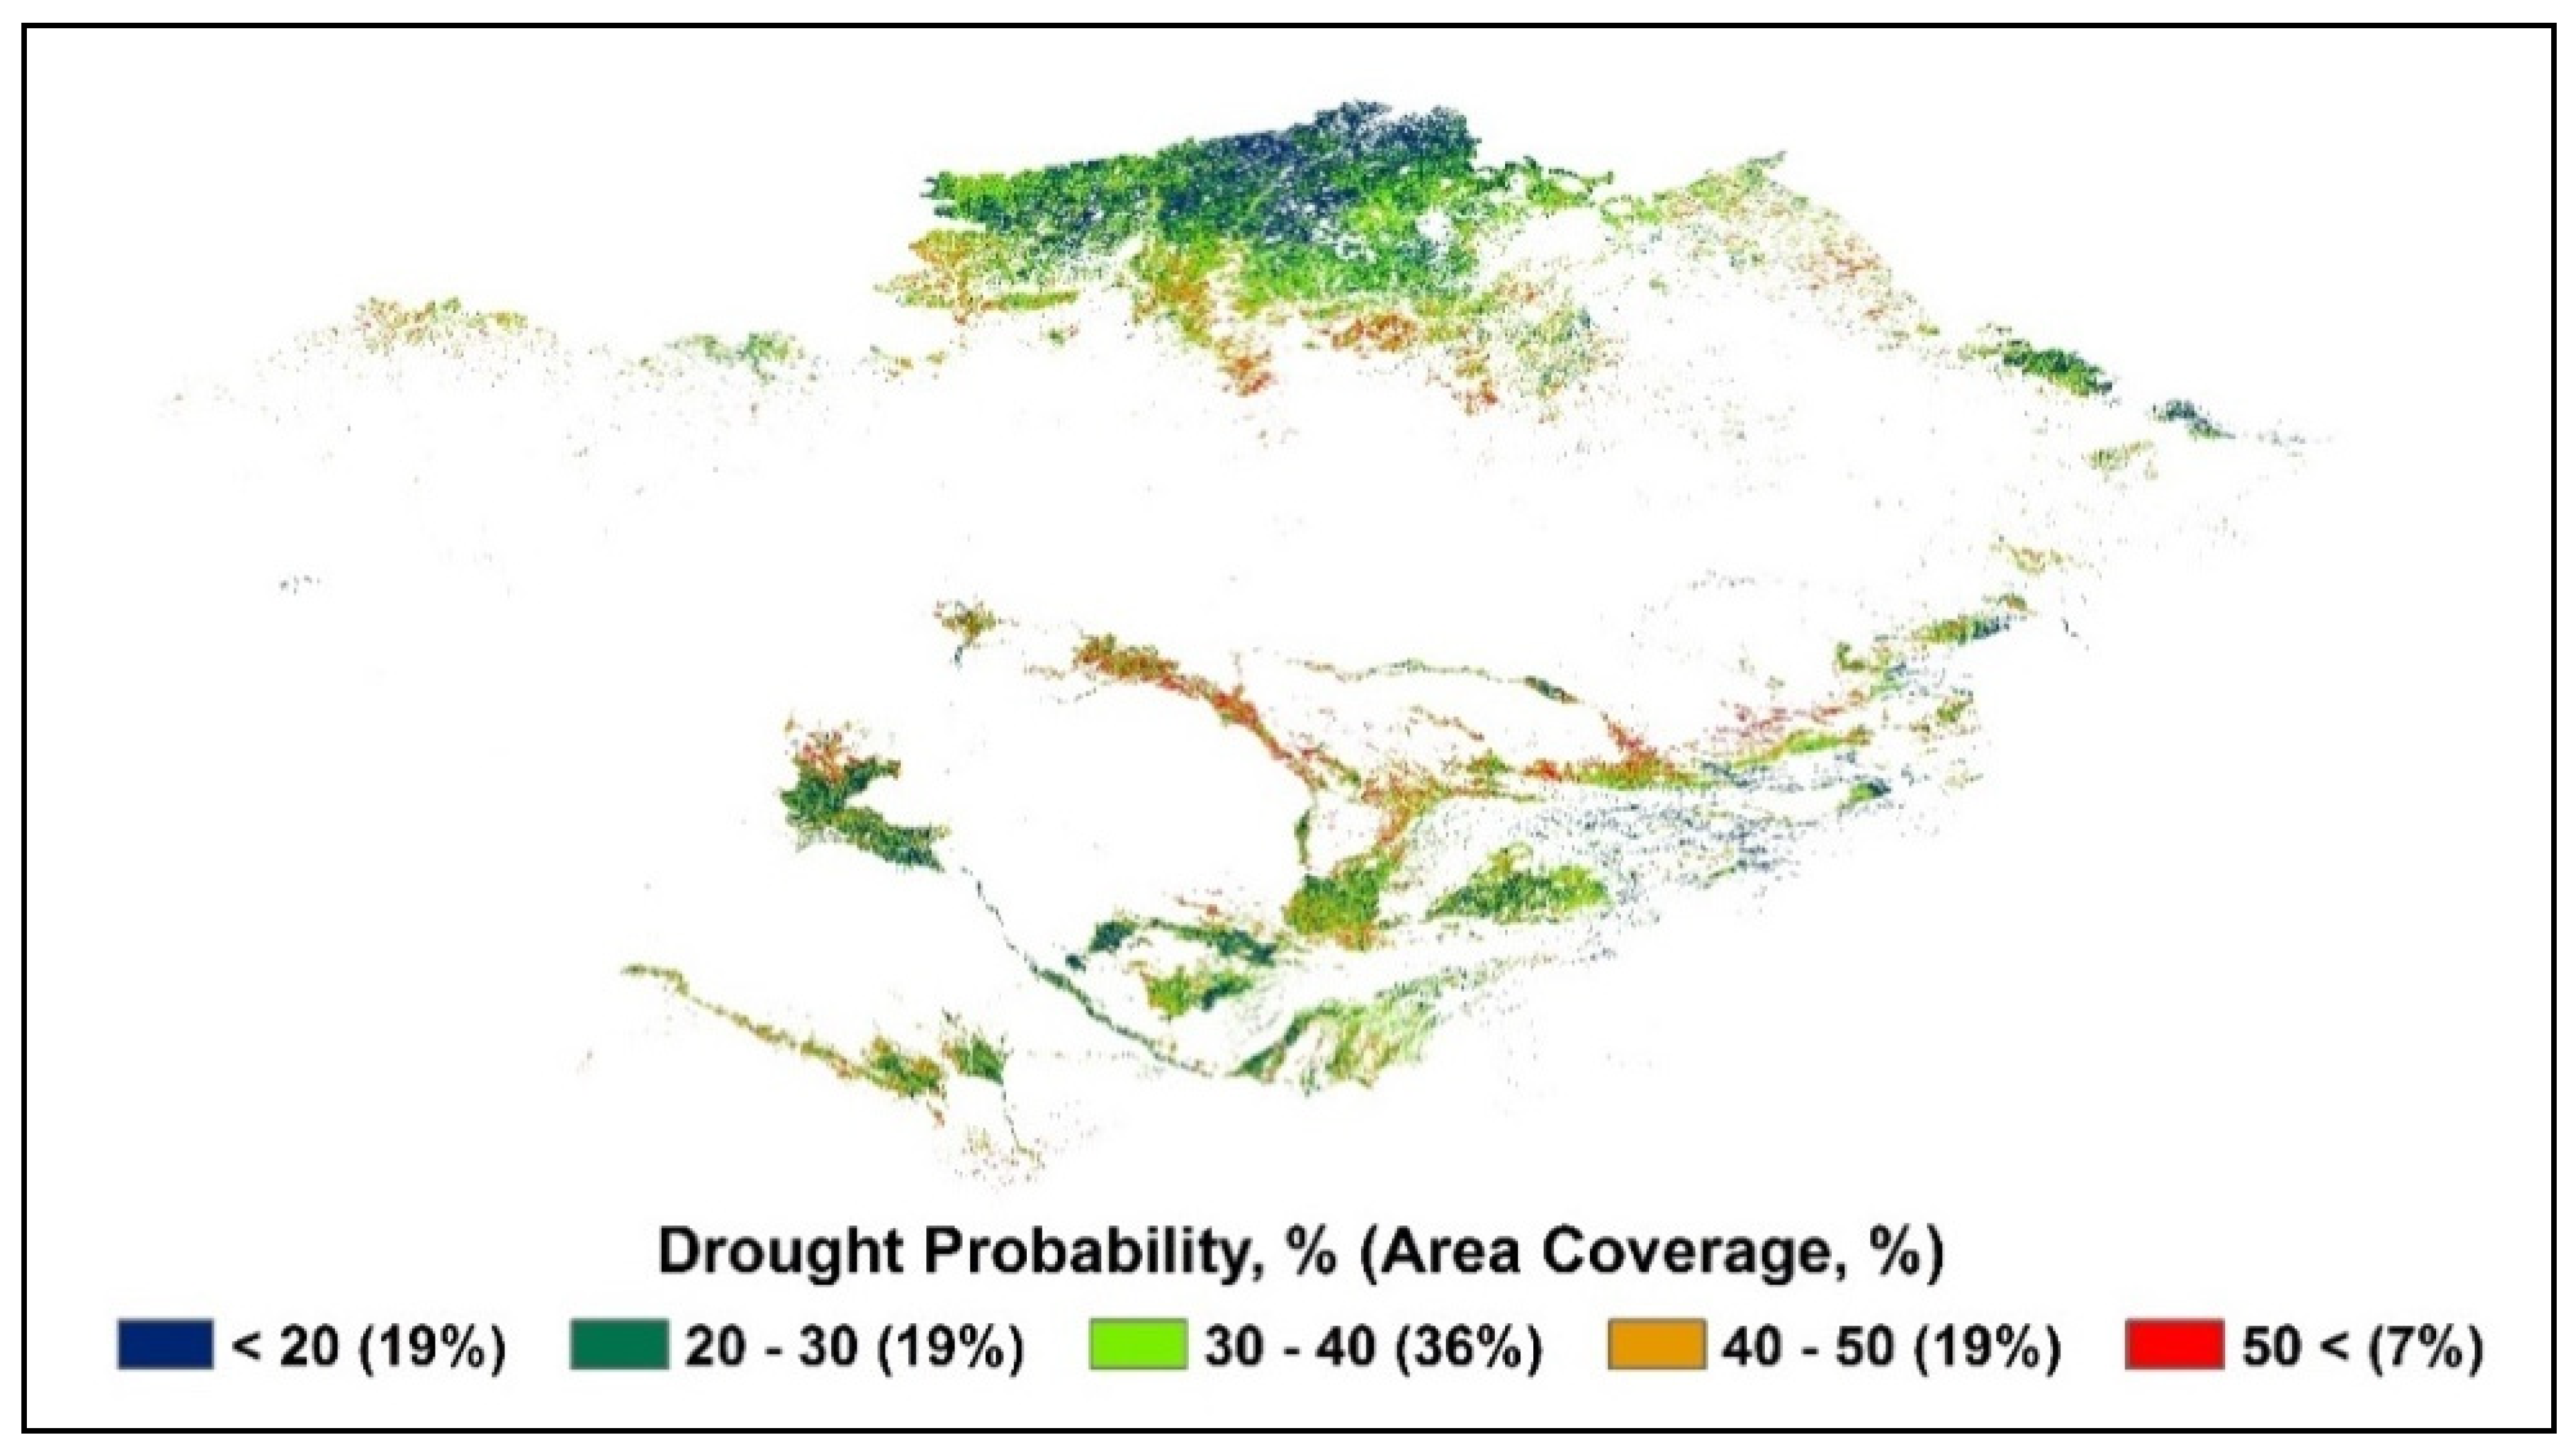
An area of more than 430,000 km2 of permanent cropland was studied. The drought extent and intensity in the cultivated areas have shown heterogeneous patterns and have varied annually at spatiotemporal scales, affecting the crop yield. However, when combined with geographical factors, the spatial coverage and intensity of the drought in Central Asia have shown negligible variation between countries. During the entire study period, the annual drought area (VHI < 40) covered 37% of the total cropland region in Kyrgyzstan; 40% in Kazakhstan, Tajikistan and Uzbekistan; and 41% in Turkmenistan. Annually, an average of 40% of the cropland area of Central Asia was found to have been affected by drought, varying between 20% and 57%. Furthermore, in our results, five years (2000, 2004, 2008, 2010, 2012) counted as significant drought episodes for the whole of the Central Asia region, affecting more than 50% of the total cropland of the region (Figure 2).
The areal extent of the extreme drought category occupied around 4% of the cropland territory, while the severe drought category accounted for 8%, the moderate drought category covered 12%, and the mild drought category occupied 16%, by annual average, including drought and non-drought years. During the significant drought years (2000, 2004, 2008, 2010, 2012) comparatively to non-drought years, the areal extent of the extreme and severe drought categories was significantly higher than for the moderate and mild drought categories (Figure 3). Moderate and mild droughts naturally occurred annually, mainly at the initial and final stages of crops during the time of the growing season, and they did not change significantly during the significant drought years (2000, 2004, 2008, 2010, 2012). The drought-prone months were May, June, August, and September, when the areal extent of the drought coverage was between 40% and 45% of the area. April and July were the months least affected by drought, where the drought coverage was about 30% to 40%, except for the significant drought years.

3.2. Drought Map

A pixel-based map of the drought occurrence probability in cultivated areas was generated using Equation (5). The map represents the high and low drought occurrence probability regions (Figure 4). Overall, for the cropland of Central Asia, the drought probability occurrence is one time in four years, while spatially it varies from once in every two years to once in every eight years, as presented in the drought probability occurrence map (Figure 4). The irrigated regions, especially in Uzbekistan, are showing less vulnerability to drought incidents except for the dominant part of the irrigated croplands in Kazakhstan, which are experiencing drought occurrences, in overall, every three years. In addition, rain-fed crops in the east and north part of Kazakhstan and rain-fed crops in Kyrgyzstan are showing less vulnerability to drought than the west, central, north-east rain-fed crops of Kazakhstan. In total, 74% of the area has a probability of drought occurrence equal to or less than 40%, and 26% of the area (mainly located in the territory of Kazakhstan) has a probability of drought occurrence of higher than 40%.

3.3. Drought Index Change

The spatiotemporal wetting and drying trends for Central Asia were extracted by calculating the slope of the drought index for the 16 years, as discussed in Section 2.5. The calculated slope for the drought index shows a non-homogeneous change in the spatiotemporal dimension, with a general trend of drying over rain-fed crop areas and wetting over irrigated cropland areas, except for some regions of irrigated cropland in Kazakhstan. For our study period of 16 years, the analysis of the annual drought index results reveals spatially significant drying and wetting trends on 14% and 8% of the area, respectively. Therefore, over these years, the annual drought-affected region has increased from 37% to 44%. The annual change in the value of drought index in most of the cropland regions of Central Asia is not significant (the average value of VHI over the study region is 46), and can be mainly considered as no change, but regions where there has been a change (of VHI < −20 and VHI > 20) demonstrate a significance value of 90–99% (Figure 5). The three other classes (−20 to −10, −10 to 10, and 10 to 20), although covering the maximum spatial extent, have undergone changes, but these are not significant, covering the cropland areas in the north, north-east, and east of Kazakhstan, as well as Kyrgyzstan and Turkmenistan. Positive changes are mainly found in Tajikistan and some parts of Uzbekistan. A negative linear slope with high significance is mainly found over the rain-fed crop areas in the western, northwestern, and over irrigated crop areas in the southern regions of Kazakhstan.
The monthly change of the drought index also differs (Figure 6). June is the month when the drought index shows a significant drying trend over Central Asia’s cropland region. Overall, in June, 36% of the area experienced a strong significant drying trend over Central Asia, with areal concentrations observed in the cropland areas of Kazakhstan. In contrast, 10% of the area experienced a strong significant wetting trend, mainly over irrigated cropland areas, during August and September. The western region of Kazakhstan has shown the highest increment of drought region per annum (4% area), and a higher drought region increase per annum (6% area) can be observed in the individual monthly calculations for June and July, with the highest rate of significance (99%) being seen during these months.

4. Discussion

Yield prediction is one of the most important tasks when attempting to mitigate food crises in the growing world. As drought is one of the main reasons for yield failure, drought assessment is an important task in a changing environment. In summary, in this study the estimation and calculation of the drought index revealed five historic agricultural drought years (2000, 2004, 2008, 2010, 2012), with the drought area (VHI < 40) occupying more than 50% of the total cropland area, explaining the years of lower productivity between 2000 and 2015. The extreme and severe droughts in 2000 mainly hit the south of the region, affecting all five countries, and decreasing the chief crop yield (wheat) by 39% in Uzbekistan and 49% in Tajikistan [6]. In 2004, 2010, and 2012, the area affected by drought increased in the north of the region, decreasing wheat production in Kazakhstan by around 21%, 31%, and 36% in 2004, 2010, and 2012, respectively [6,32], which mainly occurred due to precipitation decreases during the important time of wheat growth [43,44]. In 2008, wheat production decreased by 22% in Kyrgyzstan [6]. Our results based on spatiotemporal drought trends did not reveal any agreement of drought occurrence with wheat yield variations over Turkmenistan [6].
The explanation of drought occurrences over Central Asia indicates different causes at the micro and macro climatic scales. At the micro scale, the drought can be explained by increased heat and limited moisture, which are primarily caused by local climate variations or decreased river runoff [32,45]. At the macro scale, drought and heatwaves over the northern regions of Eurasia can be linked to anticyclones caused by the invasion of Arctic air masses or prolonged atmospheric blocking events in connection with Rossby waves [46,47,48]. The prolonged duration of the La Niña phenomenon and the unusually warm sea surface temperature (SST) in the Western Pacific could be the main reason for the hydrological drought in the south of Central Asia [49], which can also be linked to regulatory water management practices [50].
Drought cannot be stopped and is difficult to forecast through the assessment of historical datasets and monitoring of global climate conditions [51,52]. However, the global temperature increase has been identified as changing drought attributes over the last few decades, and several studies have also reported the significant drying trend observed over some of the regions of Central Asia [25,53]. Some of the scholars have reported that the most significant changes observed over cropland regions since the beginning of current century [54], which might be the impact of institutional, economic, and global climate changes over the study area [24,45,55]. Some studies have predicted that the region will get drier with increasing temperatures [56], which might significantly affect the cropland regions by decreasing the yield and increasing the food insecurity. However, currently irrigated regions (the southern part of Central Asia) are experiencing a wetting trend compared to some regions of rain-fed cropland, which are experiencing a significant drying trend. As a result, wheat production increased twofold during the study period (2000–2015) in Tajikistan and Uzbekistan [6]. This stability in terms of crop yield is in good agreement with the higher water availability, which may be related to increased precipitation [57], river runoff increases due to the melting of glaciers [7], or better water management practices [56].
Most developing economies are vulnerable to the climate hazards linked to climate change as a consequence of the low level of preparedness and resilience, and Central Asia is no exception [58]. Temperature and precipitation dynamics are the key climate factors for rain-fed areas, while for irrigated areas the availability of sufficient water resources becomes an important additional and related risk factor [59]. Climate change (hazards) may increase these risks even further, and adapting cultivation methods might be of less advantage in the future for some parts of Central Asia due to the unprecedented environmental changes. Studies related to the assessment of cropland regions need to further consider other factors such as river runoff, land cover, crop phenology, soil moisture, and other environmental changes [60,61,62]. These factors should be further considered when analyzing the influence of driving forces such as institutional, anthropogenic, and natural factors for resource availability at national, regional, and local scales to improve the regulation of natural resources. Several solutions have been proposed by scholars to resolve the future food security challenges of the region through the use of hydrological dams [63], changes in farming practices [62], and sustainable use of water resources [63] along with improved drought prediction using drought indices [41] for regional sustainability and food security.

5. Conclusions

This study has been an attempt to understand and assess the drought conditions over the arid regions of Central Asia using a drought index extracted from the freely available products of medium spatial resolution for the period 2000–2015. The initial focus of the work was an extraction of the monthly and yearly drought information at the spatial scale of Central Asia. Furthermore, a drought probability map and a map of the VHI trend were generated to aid in improved sustainable land management planning and the mitigation of climate change threats, with the potential to adapt agricultural practices accordingly. Some of the rain-fed and irrigated cropland regions of Kazakhstan are the areas being negatively affected by the drying trend, especially during June, which is the significant month for crop development in the west and north-west region of Kazakhstan. Future unprecedented changes relating to global climate change may affect the drought characteristics, such as intensity, duration, and frequency, posing a potential threat to the food security of the region. However, the decrease in the drought-affected area over the irrigated regions in the southern part of Central Asia indicates that it is possible to improve cropland management in order to ensure favorable harvests, directly helping regional food security.

Author Contributions

N.A., X.L., and S.I. were involved in conceptualizing the problem and identifying the data; H.G., W.W., and Z.S. mostly conducted the data integration; A.Y. and Y.H. assisted in the data analysis. All the authors helped with the design of the research methods, worked on the entire framework of this research, carried out the discussion and analysis, and assisted with the review of the manuscript. All authors have read and agreed to the published version of the manuscript.

Funding

This research received no external funding.

Acknowledgments

The authors would like to thank the editor and anonymous reviewers for their valuable comments and suggestions to improve the quality of this paper. This work was supported by the International Partnership Program of the Chinese Academy of Sciences, Grant No. 131C11KYSB20160061. The first author also acknowledges the Chinese Academy of Sciences (CAS) and The World Academy of Sciences (TWAS) for awarding the CAS-TWAS President’s Fellowship to carry out this research.

Conflicts of Interest

The authors declare no conflict of interest.

References

  1. Mishra, K.A.; Singh, P.V. A review of drought concepts. J. Hydrol. 2010, 391, 202–216. [Google Scholar] [CrossRef]
  2. Cook, B.I.; Smerdon, J.E.; Seager, R.; Sloan, C. Global warming and 21st century drying. Clim. Dyn. 2014, 43, 2607–2627. [Google Scholar] [CrossRef] [Green Version]
  3. Spinoni, J.; Naumann, G.; Carrao, H.; Barbosa, P. World drought frequency, duration, and severity for 1951–2010. Int. J. Climatol. 2014, 34, 2792–2804. [Google Scholar] [CrossRef] [Green Version]
  4. Patrick, E. Drought characteristics and management in Central Asia and Turkey. In FAO Water Reports; Food and Agriculture Organization of the United Nations Rome: Rome, Italy, 2017; Available online: http://www.fao.org/3/a-i6738e.pdf (accessed on 30 April 2019).
  5. Ta, Z.; Yu, R.; Chen, X.; Mu, G.; Guo, Y. Analysis of the spatio-temporal patterns of dry and wet conditions in Central Asia. Atmosphere 2018, 9, 7. [Google Scholar] [CrossRef] [Green Version]
  6. FAO. FAOSTAT Statistics Database. Available online: http://www.fao.org/faostat/en/#data (accessed on 20 December 2017).
  7. Hagg, W.; Mayer, C.; Lambrecht, A.; Kriegel, D.; Azizov, E. Glacier changes in the Big Naryn basin, Central Tian Shan. Glob. Planet. Chang. 2013, 110, 40–50. [Google Scholar] [CrossRef]
  8. Narama, C.; Kääb, A.; Duishonakunov, M.; Abdrakhmatov, K. Spatial variability of recent glacier area changes in the Tien Shan Mountains, Central Asia, using Corona (~1970), Landsat (~2000), and ALOS (~2007) satellite data. Glob. Planet. Chang. 2010, 71, 42–54. [Google Scholar] [CrossRef]
  9. Mannocchi, F.; Todisco, F.; Vergni, L. Agricultural drought: Indices, definition and analysis. In The Basis of Civilization—Water Science? UNESCO/IAHS/IWHA Symposium: Wallingford, UK, 2004; pp. 246–254. [Google Scholar]
  10. Bayissa, Y.; Maskey, S.; Tadesse, T.; Van Andel, S.J.; Moges, S.; Van Griensven, A.; Solomatine, D. Comparison of the Performance of Six Drought Indices in Characterizing Historical Drought for the Upper Blue Nile Basin, Ethiopia. Geosciences 2018, 8, 81. [Google Scholar] [CrossRef] [Green Version]
  11. Zargar, A.; Sadiq, R.; Naser, B.; Khan, F.I. A review of drought indices. Environ. Rev. 2011, 19, 333–349. [Google Scholar] [CrossRef]
  12. Choi, M.; Jacobs, J.M.; Anderson, M.C.; Bosch, D.D. Evaluation of drought indices via remotely sensed data with hydrological variables. J. Hydrol. 2013, 476, 265–273. [Google Scholar] [CrossRef]
  13. Rojas, O.; Vrieling, A. Assessing drought probability for agricultural areas in Africa with coarse resolution remote sensing imagery. Remote Sens. Environ. 2011, 115, 343–352. [Google Scholar] [CrossRef]
  14. Chen, C.F.; Son, N.T.; Chen, C.R.; Chiang, S.H.; Chang, L.Y.; Valdez, M. Drought monitoring in cultivated areas of Central America using multi-temporal MODIS data. Geomat. Nat. Hazards Risk ISSN 2017, 8, 402–417. [Google Scholar] [CrossRef] [Green Version]
  15. Amalo, L.F.; Hidayat, R. Comparison between remote-sensing-based drought indices in East Java. In IOP Conference Series: Earth and Environmental Science; IOP Publishing: Bogor, Indonesia, 2017; Volume 54, p. 012009. [Google Scholar] [CrossRef]
  16. Karnieli, A.; Agam, N. Comments on the use of the Vegetation Health Index over Mongolia. Int. J. Remote Sens. 2006, 27, 2017–2024. [Google Scholar] [CrossRef]
  17. Kogan, F.; Gitelson, A.; Zakarin, E.; Spivak, L.; Lebedev, L. AVHRR-Based Spectral Vegetation Index for Quantitative Assessment of Vegetation State and Productivity: Calibration and Validation. Photogramm. Eng. Remote Sens. 2003, 69, 899–906. [Google Scholar] [CrossRef]
  18. Vitkovskaya, I.; Batyrbayeva, M.; Spivak, L. The estimate of the spatial-temporal features of vegetation cover of Kazakhstan based on time series satellite indices in 2000–2015. In The International Archives of the Photogrammetry, Remote Sensing and Spatial Information Sciences; ISPRS: Prague, Czech Republic, 2016; pp. 1067–1071. [Google Scholar] [CrossRef]
  19. Gitelson, A.; Felix, K.; Spivak, L.; Zakarin, E.; Lebed, L. Estimation of Seasonal Dynamics of Pasture and Crop Productivity in Kazakhstan Using NOAA/AVHRR Data. In IGARSS’96. 1996 International Geoscience and Remote Sensing Symposium; IGARSS: Lincoln, NE, USA, 1996; pp. 209–211. Available online: https://digitalcommons.unl.edu/natrespapers/234 (accessed on 15 June 2017).
  20. Gessner, U.; Naeimi, V.; Klein, I.; Kuenzer, C.; Klein, D.; Dech, S. The relationship between precipitation anomalies and satellite-derived vegetation activity in Central Asia. Glob. Planet. Chang. 2013, 110, 74–87. [Google Scholar] [CrossRef]
  21. Mirzabaev, A. Climate Volatility and Change in Central Asia: Economic Impacts and Adaptation. 2016. Available online: http://hss.ulb.uni-bonn.de/2013/3238/3238.htm (accessed on 16 June 2018).
  22. Chen, X.; Zhang, C.; Luo, G.P. Modeling Dryland Ecosystems’ Response to Global Change in Central Asia; Science Press: Beijing, China, 2014; Available online: https://chinascientificbooks.com (accessed on 20 April 2020).
  23. Chen, X.; Zhou, Q. Ecological and Environmental Remote Sensing in Arid Zones—A Case Study of Central Asia; Science Press: Beijing, China, 2015; Available online: https://amazon.com/ECOLOGICAL-ENVIRONMENTAL-REMOTE-SENSING-CENTRAL/dp/7030461665 (accessed on 10 April 2020).
  24. Kariyeva, J.; van Leeuwen, W.J.D. Phenological dynamics of irrigated and natural drylands in Central Asia before and after the USSR collapse. Agric. Ecosyst. Environ. 2012, 162, 77–89. [Google Scholar] [CrossRef]
  25. De Beurs, K.M.; Henebry, G.M.; Owsley, B.C.; Sokolik, I. Using multiple remote sensing perspectives to identify and attribute land surface dynamics in Central Asia 2001–2013. Remote Sens. Environ. 2015, 170, 48–61. [Google Scholar] [CrossRef]
  26. Bohovic, R.; Dobrovolny, P.; Klein, D. The spatial and temporal dynamics of remotely-sensed vegetation phenology in central Asia in the 1982–2011 period. Eur. J. Remote Sens. 2016, 49, 279–299. [Google Scholar] [CrossRef] [Green Version]
  27. Klein, I.; Dietz, A.J.; Gessner, U.; Galayeva, A.; Myrzakhmetov, A.; Kuenzer, C. International Journal of Applied Earth Observation and Geoinformation Evaluation of seasonal water body extents in Central Asia over the past 27 years derived from medium-resolution remote sensing data. Int. J. Appl. Earth Obs. Geoinf. 2014, 26, 335–349. [Google Scholar] [CrossRef]
  28. Giese, E.; Mossig, I.; Rybski, D.; Bunde, A. Long-term analysis of air temperature trends in Central Asia. Erdkunde 2007, 61, 186–202. [Google Scholar] [CrossRef]
  29. Erdinger, L.; Hollert, H.; Eckl, P. Aral Sea: An Ecological Disaster Zone with Impact on Human Health. In Encyclopedia of Environmental Health; Nriagu, J.O., Ed.; Elsevier: Burlington, ON, Canada, 2011; Volume 1, pp. 136–144. ISBN 978-0-444-52272-6. [Google Scholar]
  30. Chen, X.; Bai, J.; Li, X.; Luo, G.; Li, J.; Li, B.L. Changes in land use/land cover and ecosystem services in Central Asia during 1990–2009. Curr. Opin. Environ. Sustain. 2013, 5, 116–127. [Google Scholar] [CrossRef]
  31. Lioubimtseva, E.U.; Henebry, G.M. Grain production trends in Russia, Ukraine and Kazakhstan: New opportunities in an increasingly unstable world? Front. Earth Sci. 2012, 6, 157–166. [Google Scholar] [CrossRef]
  32. Kazhydromet. Drought Management and Mitigation Assessment for Kazakhstan, Phase Two: Regional Vulnerability and Capacity Assessment Survey; Kazhydromat: Almaty, Kazakhstan, 2006; Available online: https://kazhydromet.kz/en/ (accessed on 18 June 2019).
  33. Li, W.; MacBean, N.; Ciais, P.; Defourny, P.; Lamarche, C.; Bontemps, S.; Houghton, R.A.; Peng, S. Gross and net land cover changes in the main plant functional types derived from the annual ESA CCI land cover maps (1992–2015). Earth Syst. Sci. Data 2018, 10, 219–234. [Google Scholar] [CrossRef] [Green Version]
  34. Kirches, G.; Brockmann, C.; Boettcher, M.; Peters, M.; Bontemps, S.; Lamarche, C.; Schlerf, M.; Santoro, M.; Defourny, P. Land Cover CCI Product User Guide Version 2; ESA Public Document CCI-LC-PUG: Paris, France, 2014. [Google Scholar]
  35. Yu, K.; Wang, Z.; Sun, L.; Wang, J.; Shan, J.; Lu, B. Crop phenology estimation by time series MODIS medium-resolution data. In Proceedings of the 2017 6th International Conference on Agro-Geoinformatics, Fairfax, VA, USA, 7–10 August 2017; pp. 1–4. [Google Scholar]
  36. Huete, A.; Didan, K.; Miura, H.; Rodriguez, E.P.; Gao, X.; Ferreira, L.F. Overview of the radiometric and biopyhsical performance of the MODIS vegetation indices. Remote Sens. Environ. 2002, 83, 195–213. [Google Scholar] [CrossRef]
  37. Lu, L.; Guo, H.; Kuenzer, C.; Klein, I.; Zhang, L.; Li, X. Analyzing phenological changes with remote sensing data in Central Asia. In Proceedings of the IOP Conference Series: Earth and Environmental Science, Jakarta, Indonesia, 23–24 January 2014; Volume 17, pp. 15–21. [Google Scholar]
  38. Wan, Z.; Hook, S.; Hulley, G. MOD11A2 MODIS/Terra Land Surface Temperature/Emissivity 8-Day L3 Global 1km SIN Grid V006. In NASA EOSDIS Land Processes DAAC; NASA LP DAAC, 2015; Available online: http://0-doi-org.brum.beds.ac.uk/10.5067/MODIS/MOD11A2.006 (accessed on 18 June 2019).
  39. Kogan, F. Application of vegetation index and brightness temperature for drought detection. Adv. Space Res. 1995, 15, 91–100. [Google Scholar] [CrossRef]
  40. Kogan, F. Operational Space Technology for Global Vegetation Assessment. Remote Sens. Environ. 2001, 82, 1949–1964. [Google Scholar] [CrossRef]
  41. Bokusheva, R.; Kogan, F.; Vitkovskaya, I.; Conradt, S.; Batyrbayeva, M. Agricultural and Forest Meteorology Satellite-based vegetation health indices as a criteria for insuring against drought-related yield losses. Agric. Meteorol. 2016, 220, 200–206. [Google Scholar] [CrossRef] [Green Version]
  42. Kogan, F.; Guo, W. Strong 2015–2016 El Niño and implication to global ecosystems from space data. Int. J. Remote Sens. 2016, 38, 161–178. [Google Scholar] [CrossRef]
  43. Xu, H.J.; Wang, X.P.; Zhang, X.X. Decreased vegetation growth in response to summer drought in Central Asia from 2000 to 2012. Int. J. Appl. Earth Obs. Geoinf. 2016, 52, 390–402. [Google Scholar] [CrossRef]
  44. Morgounov, A.; Sonder, K.; Abugalieva, A.; Bhadauria, V.; Cuthbert, R.D.; Shamanin, V.; Zelenskiy, Y.; DePauw, R.M. Effect of climate change on spring wheat yields in North America and Eurasia in 1981–2015 and implications for breeding. PLoS ONE 2018, 13, e0204932. [Google Scholar] [CrossRef] [PubMed]
  45. Li, Z.; Chen, Y.; Fang, G.; Li, Y. Multivariate assessment and attribution of droughts in Central Asia. Sci. Rep. 2017, 7, 1–12. [Google Scholar] [CrossRef] [PubMed]
  46. Schubert, S.D.; Stewart, R.E.; Wang, H.; Barlow, M.; Berbery, E.H.; Cai, W.; Hoerling, M.P.; Kanikicharla, K.K.; Koster, R.D.; Lyon, B.; et al. Global Meteorological Drought: A Synthesis of Current Understanding with a Focus on SST Drivers of Precipitation Deficits. J. Clim. 2016, 29, 3989–4019. [Google Scholar] [CrossRef] [Green Version]
  47. Schubert, S.; Wang, H.; Koster, R.; Suarez, M. Northern Eurasian Heat Waves and Droughts. J. Clim. 2014, 27, 3169–3207. [Google Scholar] [CrossRef]
  48. Lau, W.K.M.; Kim, K.-M. The 2010 Pakistan Flood and Russian Heat Wave: Teleconnection of Hydrometeorological Extremes. J. Hydrometeorol. 2011, 13, 392–403. [Google Scholar] [CrossRef] [Green Version]
  49. Yon, B.R.L. Drought in Central and Southwest Asia: La Niña, the Warm Pool, and Indian Ocean Precipitation. J. Clim. 2002, 15, 697–700. [Google Scholar]
  50. Wegerich, K. Natural drought or human made water scarcity in Uzbekistan? Publ. Cent. Asia Cauc. 2002, 2, 154–162. [Google Scholar]
  51. Kogan, F.; Guo, W. Early twenty-first-century droughts during the warmest climate. Geomat. Nat. Hazards Risk 2016, 7, 127–137. [Google Scholar] [CrossRef] [Green Version]
  52. Wang, H.; Chang, Y.; Schubert, S.; Koster, R. Subseasonal Prediction of Warm Season Drought in North America. In Science and Technology Infusion Climate Bulletin NOAA’s National Weather Service; 42nd NOAA Annual Climate Diagnostics and Prediction Workshop; NOAA: Norman, OK, USA, 2017; pp. 116–120. Available online: https://nws.noaa.gov/ost/climate/STIP/42CDPW/42cdpw-Hwang.pdf (accessed on 12 May 2020).
  53. Lioubimtseva, E. A multi-scale assessment of human vulnerability to climate change in the Aral Sea basin. Environ. Earth Sci. 2014, 73, 719–729. [Google Scholar] [CrossRef]
  54. Yin, G.; Hu, Z.; Chen, X.; Tiyip, T. Vegetation dynamics and its response to climate change in Central Asia. J. Arid Land 2016, 8, 375–388. [Google Scholar] [CrossRef] [Green Version]
  55. Lioubimtseva, E.; Henebry, G.M. Climate and environmental change in arid Central Asia: Impacts, vulnerability, and adaptations. J. Arid Environ. 2009, 73, 963–977. [Google Scholar] [CrossRef]
  56. The World Bank Group. Climate Change Knowledge Portal. Available online: http://sdwebx.worldbank.org/climateportal/ (accessed on 14 May 2020).
  57. Global Water Partnership. Integrated Water Resources Management in Central Asia: The Challenges of Managing Large Transboundary Rivers; Global Water Partnership: Tashkent, Uzbekistan, 2014. [Google Scholar]
  58. Propastin, P.A.; Kappas, M.; Muratova, N.R. Inter-annual changes in vegetation activities and their relationship to temperature and precipitation in Central Asia from 1982 to 2003. J. Environ. Inform. 2008, 12, 75–87. [Google Scholar] [CrossRef] [Green Version]
  59. Li, X.; Gao, X.; Wang, J.; Guo, H. Microwave soil moisture dynamics and response to climate change in Central Asia and Xinjiang Province, China, over the last 30 years. J. Appl. Remote Sens. 2015, 9, 096012. [Google Scholar] [CrossRef]
  60. Yang, P.; Chen, Y. An analysis of terrestrial water storage variations from GRACE and GLDAS: The Tianshan Mountains and its adjacent areas, central Asia. Quat. Int. 2015, 358, 106–112. [Google Scholar] [CrossRef]
  61. Sorg, A.; Mosello, B.; Shalpykova, G.; Allan, A.; Clarvis, M.H.; Stoffel, M. ScienceDirect Coping with changing water resources: The case of the Syr Darya river basin in Central Asia. Environ. Sci. Policy 2013, 43, 68–77. [Google Scholar] [CrossRef]
  62. Devkota, M.; Devkota, K.P.; Gupta, R.K.; Martius, C. Conservation agriculture farming practices for optimizing water and fertilizer use efficiency in Central Asia. In Managing Water and Fertilizer for Sustainable Agricultural Intensification; CIFOR: Bogor, Indonesia, 2015; pp. 242–252. Available online: https://cifor.org/knowledge/publications/5459/ (accessed on 10 April 2020).
  63. Seidakhmetov, M.; Alzhanova, A.; Baineeva, P.; Abdramankyzy, A.; Bekmanova, G.; Tymbaeva, Z. Mechanism of Transboundary Water Resources Management for Central Asia Countries. Procedia Soc. Behav. Sci. 2014, 143, 604–609. [Google Scholar] [CrossRef] [Green Version]
Figure 1. Location, spatial information, and land-cover map of Central Asia. The digital elevation model was downloaded from https://www.srtm.csi.cgiar.org. The European Space Agency (ESA) Climate Change Initiative Land Cover map was downloaded from https://www.esa-landcover-cci.org.
Water 12 01738 g001
Figure 2. Spatiotemporal distribution of the annual drought severity and the respective percentage contributions for the drought categories of each year over the cultivated regions of Central Asia, where the total cropland area covers approximately 432,517 km2.
Water 12 01738 g002
Figure 3. Areal extent of the drought severity classes.
Water 12 01738 g003
Figure 4. Drought probability occurrence map for the cropland of Central Asia, showing the areal coverage for each drought probability class.
Water 12 01738 g004
Figure 5. Spatiotemporal trend of the VHI for Central Asia between 2000 and 2015.
Water 12 01738 g005
Figure 6. Areal extent of the VHI change, drying trend (>90% significance), no change (non-significant), and wetting trend (>90% significance) over the cropland of Central Asia (2000–2015).
Water 12 01738 g006
Table 1. Drought severity classes for the vegetation health index (VHI).
Severity ClassValue
Extreme drought<10
Severe drought10–20
Moderate drought20–30
Mild drought30–40
No drought>40

