Experimental Characterization of Air Entrainment in Rectangular Free Falling Jets


1
Hidr@m Group, Civil Engineering and Mining Engineering School, Universidad Politécnica de Cartagena, 30203 Cartagena, Spain
2
Civil and Environmental Engineering Department, Escuela Politécnica Nacional, Quito 170517, Ecuador
*
Author to whom correspondence should be addressed.
Water 2020, 12(6), 1773; https://0-doi-org.brum.beds.ac.uk/10.3390/w12061773
Submission received: 29 May 2020
/
Revised: 17 June 2020
/
Accepted: 19 June 2020
/
Published: 22 June 2020
(This article belongs to the Special Issue Physical Modelling in Hydraulics Engineering)
Abstract
:This experimental study presents an analysis of the air–water flow in rectangular free-falling jets. The measurements were obtained downstream of a 1.05 m wide sharp-crested weir. The properties of the air–water flow were registered in several cross-sections of the nappe. A conductivity phase detection probe was employed, sampling at 20 kHz. Three different specific flows were considered, with energy head over the crest of 0.080, 0.109 and 0.131 m to avoid scale effects. To analyze the flow properties, air–water parameters during the fall, such as the phase change spatial distribution, air–water phase change of frequency, Sauter mean diameter, bubble chord length, turbulent intensities and spectral analyses, were studied. The jet thickness behaviors (inner jet core and free surface) were also analyzed in the falling jet. The jet thickness related to a void fraction of 90% seems to be similar to the theoretical proposal obtained by Castillo et al. (2015), while the jet thickness related to a void fraction of 10% seems to be similar to the jet thickness due to gravitational effects. The results show relative differences in the behavior of the upper and lower sides of the nappe. The experimental data allow us to improve on and complement previous research.
1. Introduction
The increase in the magnitude of design floods at large dams around the world and the new regulations in demands have driven a more rigorous assessment of the spillways’ capacity and their use in normal and extraordinary operating scenarios. Given the current capacity of many spillways, their discharge capacity may be inadequate in extreme operating scenarios. During these events, dams may overflow, thus compromising their stability and safety (US Department of Homeland Security-Federal Emergency Management, FEMA [1]). In some cases, such as extreme events and/or in emergency scenarios, the overflow may be considered as an extra discharge operation. This situation creates new questions about the actions at the dam toe and in the regulation structures of the dams (Wahl et al. [2]). Currently, it is necessary to evaluate these considerations and propose viable technical/economic solutions.
Air–water flows are commonly present in nature and may also be found in hydraulic structures (Chanson [3]). Air entrainment effects in hydraulic structures may be essential for safe operation (Wood [4]). The flow properties and the energy dissipation mechanism are changed by the air present in the flow. The aeration processes in high-velocity flows produce a modification of the air–water flow structure and turbulent mixing processes (Boes [5]).
The theoretical flow profiles of rectangular free-falling jets are affected by air entrainment through the free surface. Self-aeration and atomization processes reduce the falling velocity and increment the jet thickness (bulking process). Air entrainment and turbulent processes may also induce fluctuations and instabilities in the free surfaces of turbulent jets. Moreover, nappe oscillation may cause vibrations in the structure (Anderson and Tullis [6]). Besides this, pressure fluctuations, macroturbulence and energy dissipation in the receiving plunge pools are also influenced by the air entrainment content and the degree of jet break-up length. Hence, the mean pressure in the stagnation point of rectangular jets tends to reduce as the falling distance/break-up length, H/Lb, rate increases, while the fluctuating pressure tends toward a maximum value for H/Lb ratios between 1.0 and 1.3 (Castillo et al. [7]). Knowledge of the impingement jet stream’s power is essential to preventing scour at the dam toe.
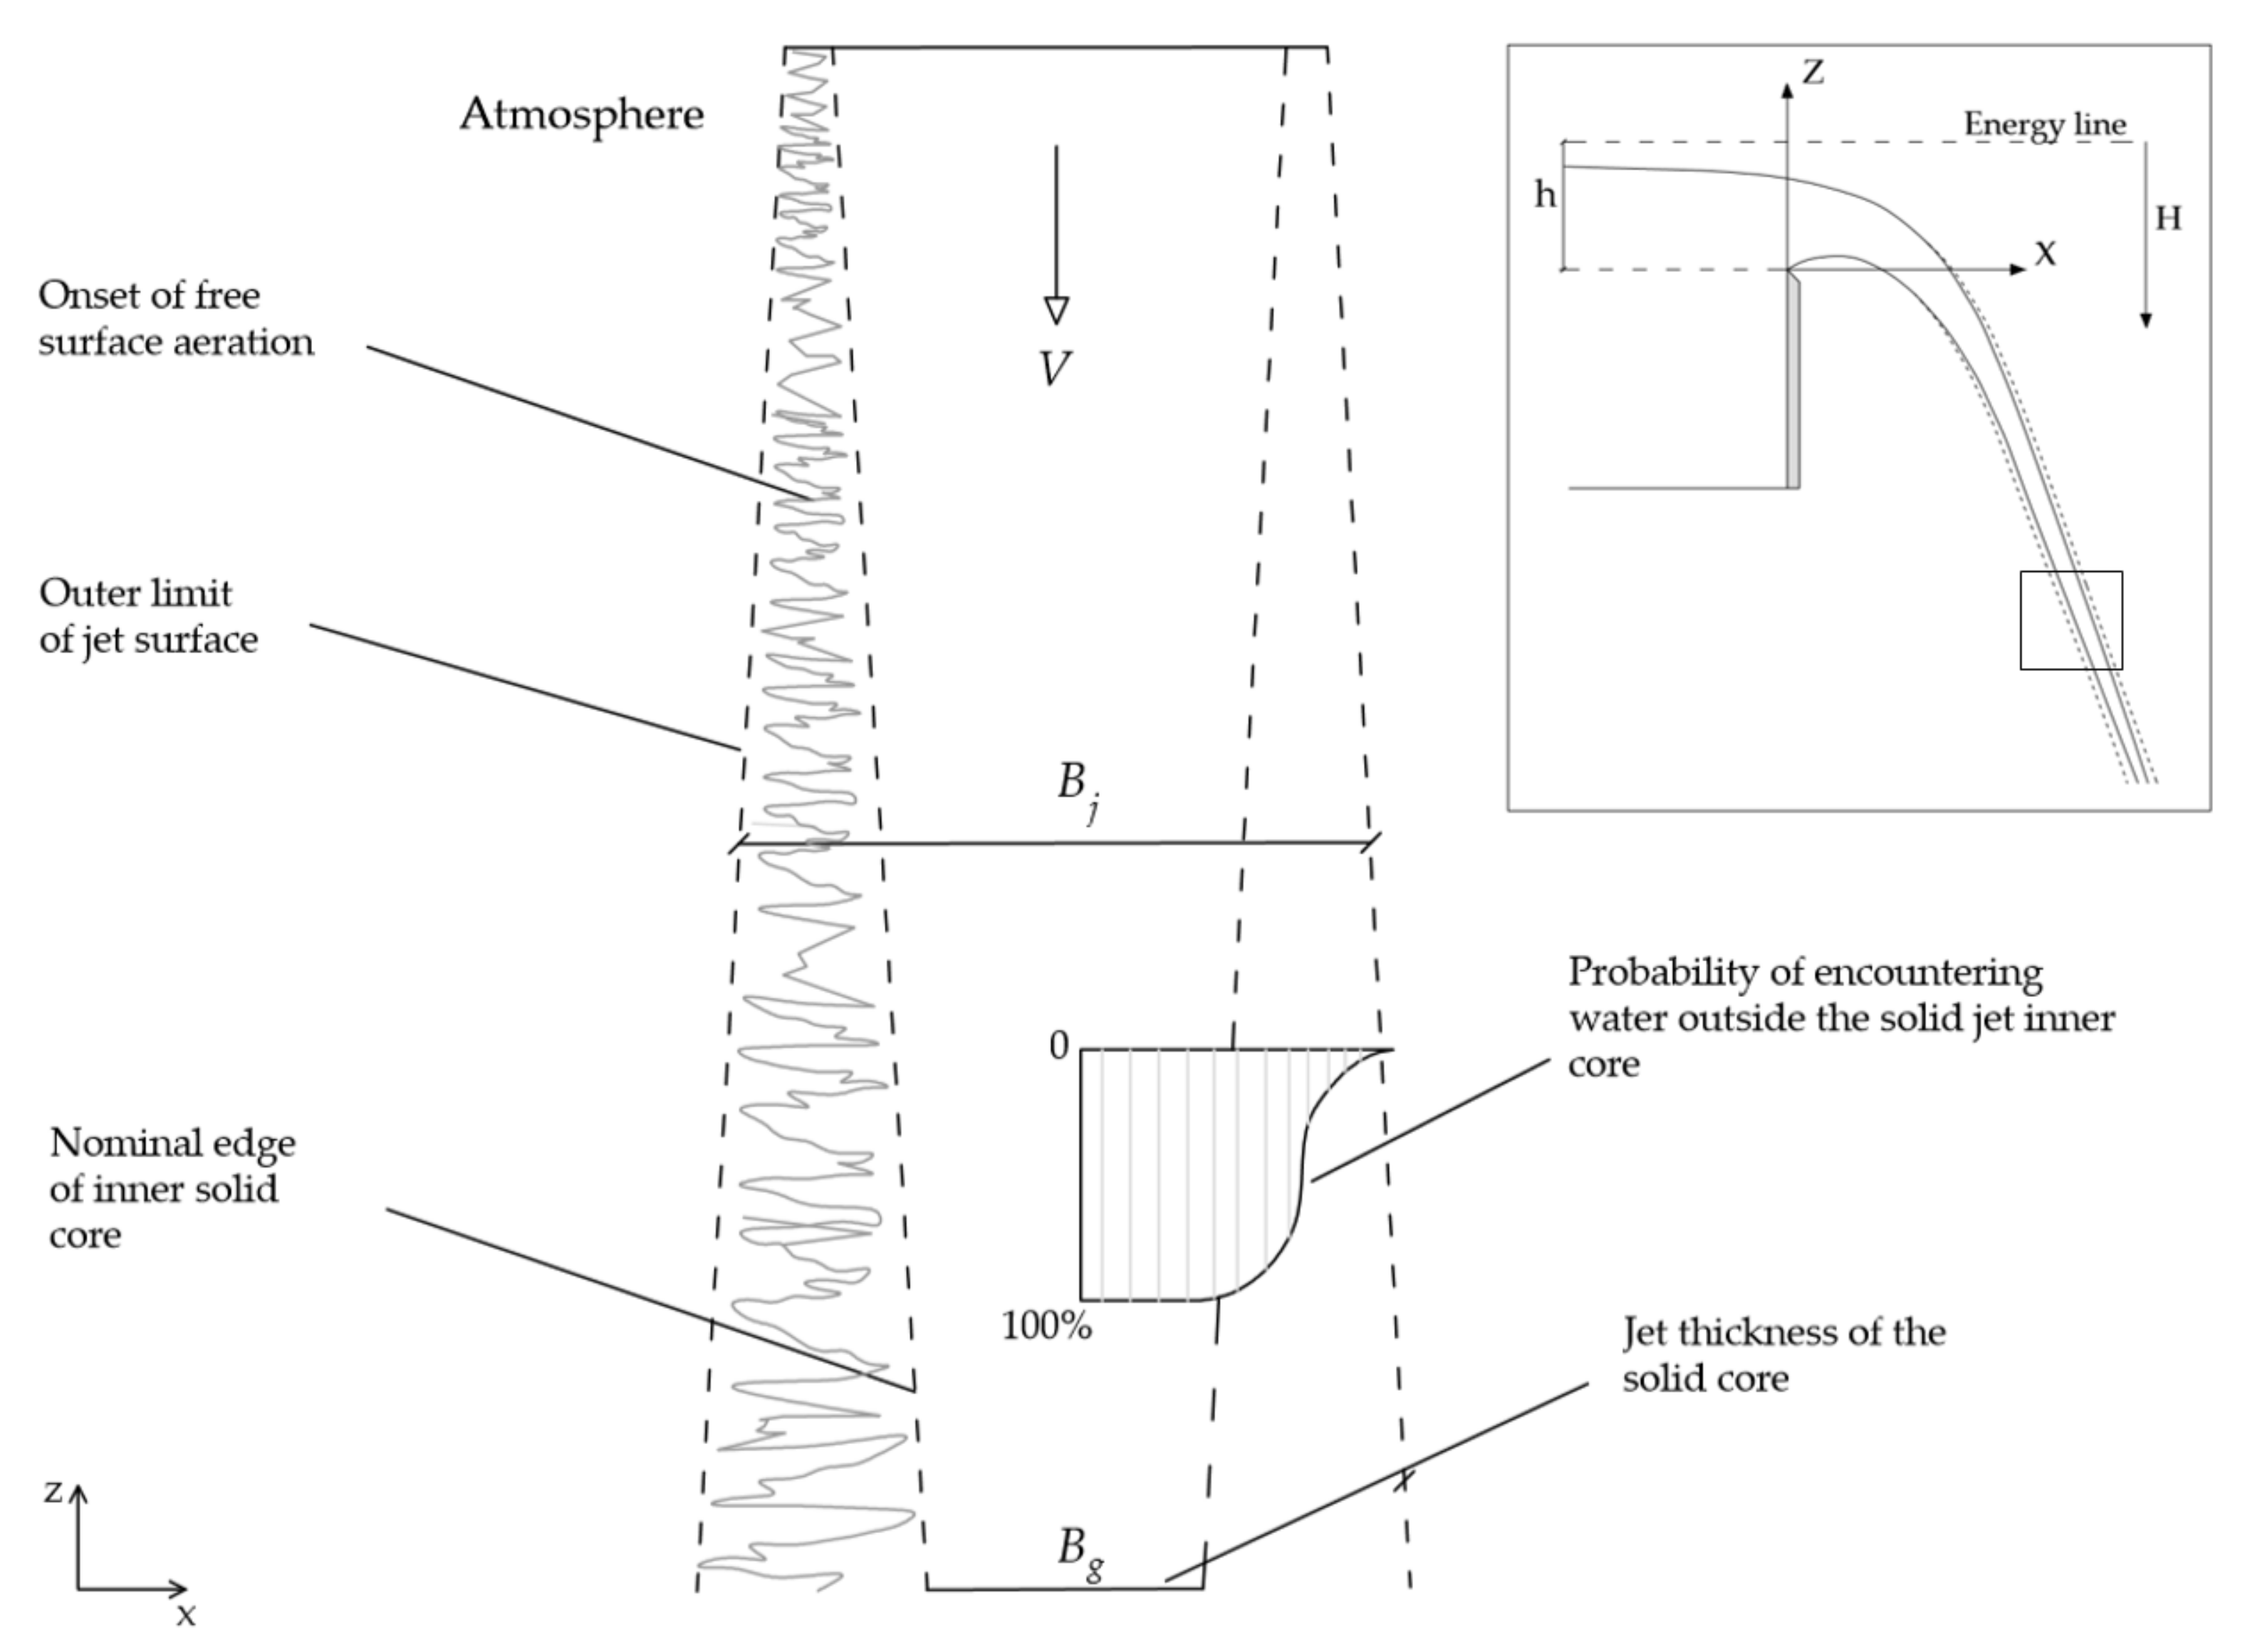
According to Ervine and Falvey [8], turbulence is paramount in the air entrainment mechanisms in jets; turbulence fluctuations affect the jet spread and deformations of the free surface. Self-aeration may be related to the turbulence boundary layer and the turbulent mixing processes. The internal turbulence in the jets forms small waves and instabilities on the surface at the beginning of the jet. The growth of these instabilities is related to the surface tension. Later, instabilities and waves are amplified in the flow direction. The velocity of the non-aerated jet core is the same as the air entrained within the turbulence instabilities in the free surface. Finally, turbulent fluctuations are large enough to penetrate and affect the non-aerated core of the jet. The surface tension and the turbulent layer influence the jet break-up length (Ervine et al. [9]). Through the air–water interphase there are continuous exchanges of mass and momentum between water and atmosphere (Chanson and Toombes [10]). According to Bertola [11], the air–water properties of rectangular free-falling jets may be determinant in the energy dissipation and the air entrainment in plunge pools. The energy dissipation mechanisms in rectangular free-falling jets can be divided into several steps (Castillo et al. [7]): spreading of the jet during the falling (aeration and atomization), entrainment of air and diffusion of the jet in the water cushion, impact on the basin bottom and recirculation and diffusion in the basin. Figure 1 shows a sketch of the spreading of a rectangular free-falling jet in the atmosphere.
Horeni [12] proposed one of the first known expressions to estimate the jet break-up length Lb in rectangular jets. Later, Castillo [13] and Castillo et al. [7] proposed a practical design methodology for rectangular free-falling jets. This methodology analyzes the jet thickness Bj and the break-up length Lb. The jet thickness in rectangular jets is given as:
where Bg is the thickness of the jet due to gravitational effects, Bs the lateral spread, q the specific flow, g the gravitational acceleration, H the vertical distance between the upstream and the downstream water levels, h the total energy head over the weir and = KφTu*. For the three-dimensional nappe flow case, Kφ ≈ 1.24 (Carrillo [14]; Castillo et al. [15]). Tu* is the turbulent intensity defined as (Castillo et al. [7]):
with IC being the initial conditions:
where K ≈ 0.85 is a dimensionless coefficient (Castillo [13]), and Cd is the discharge coefficient which depends on the type of structure (Cd ≈ 1.85 for sharp weir crest and 2.10 for hydrodynamic spillway).
This work aims to experimentally analyze the self-aeration of turbulent rectangular free-falling jets as measured downstream of a rectangular weir. For this purpose, a conductivity probe was used for measuring the air–water flow characteristics in a relatively large experimental device.
2. Materials and Methods
2.1. Experimental Setup
This work was performed in a relatively large experimental device at the Hydraulic Laboratory located in the Universidad Politécnica de Cartagena (Spain). This experimental device was specifically built for the analysis of rectangular jets and their energy dissipation in overflow cases. The inlet flow structure is a mobile device with a 4.00 m long and 1.05 m wide inlet channel. The inlet channel ends in a sharp-crested weir without lateral contractions, located at an elevation of 2.20 m above the bottom of the plunge pool.
2.2. Instrumentation
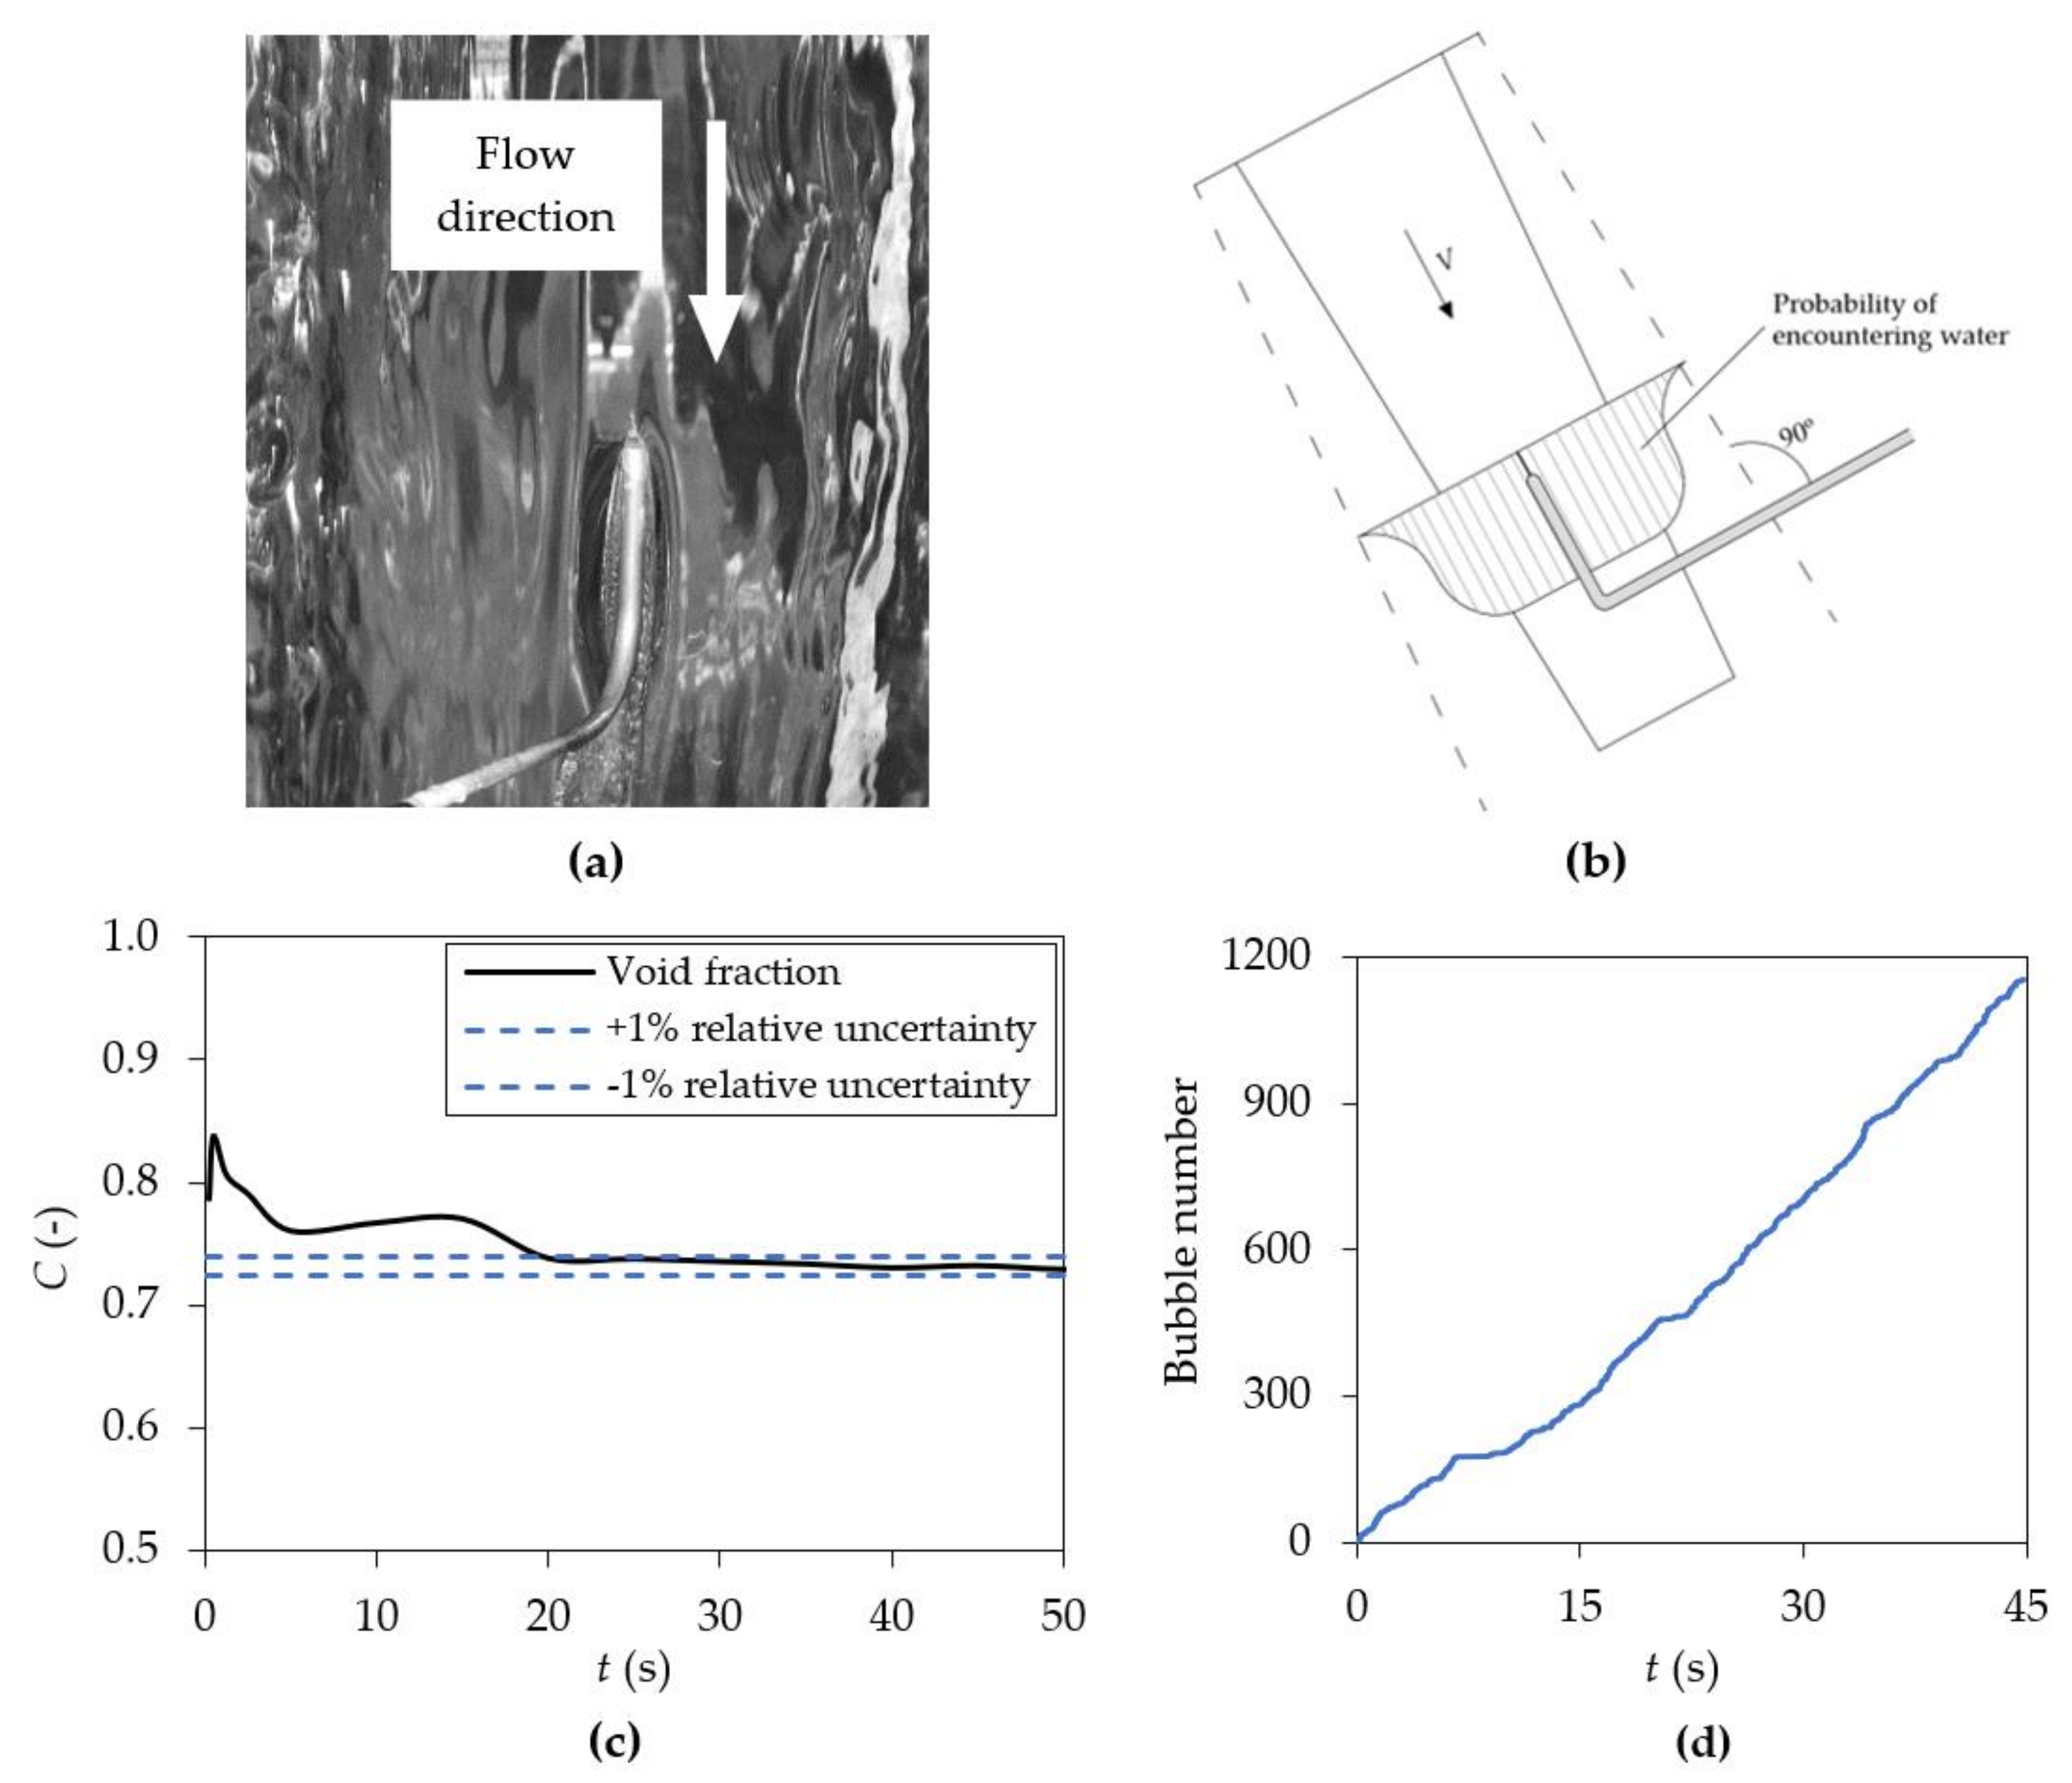
The flow properties of the free-falling jet were measured using a conductivity phase detection probe [18]. The intrusive probe was designed and built at the Universidad Politécnica de Cartagena (Figure 2a). The conductivity probe was built considering the phase detection instrumentation that has been used in previous works (e.g., Chanson [19,20]; Matos et al. [21]; Toombes [22]). The probe tip of Ø = 0.25 mm was made of platinum.
The air–water phases were registered in the probe tip. The equipment detects the changes in electrical conductivity between both phases (air and water), causing a sudden voltage drop when the probe tip changes from water to air. Flow properties were analyzed from the signal processing of the raw signal. A single-threshold technique was used for converting the raw signal into a binary signal (air–water). The total time that the probe tip was in the air Σti over the total recorded time t is known as the time-average void fraction (C = Σti/t).
Previous analyses have shown that at least 30 s are needed for obtaining an uncertainty of about ±1% in the void fraction (Figure 2c). With these conditions, each measurement was sampled at a frequency of 20 kHz for 45 s. Figure 2d shows the cumulative number of bubbles detected during the sampling time.
2.3. Experimental Test and Flow Conditions
The experiments were performed for three specific flows q (0.048, 0.072 and 0.096 m3/s/m). The local measurements were carried out in different cross-sections of each specific flow. The probe tip was placed in the jet centerline and aligned with the flow direction using the theoretical trajectory proposed by Scimemi [23]. The probe tip was located at different distances from the centerline; the probe was moved perpendicularly along the flow with a spatial resolution of 1.0 mm. Table 1 shows the experimental test conditions and the Reynolds and Weber numbers, Re and We, respectively. Issuance conditions are defined at vertical elevation Z = −h downstream of the weir crest (origin of coordinates), with Z being the vertical coordinate. The issuance velocity is defined as Vi = , where h0 = 2h. The maximum Z/h ratio, where measurements were able to be obtained without influence of the instabilities around the impingement point, has also been indicated.
In a sharp-crested weir, scale effects may be neglected when the total head h > 0.045 m and We > 1103 (Chanson [24]; Heller [25]). The flow conditions were selected to avoid scale effects in the jet (h = 0.08–0.131 m). However, special caution needs to be taken when scaling air–water flows, since the air bubble size is not correctly scalable (Chanson [24]). Hence, several parameters, such as the Sauter mean diameter Dsm and the air–water chord length Ch, are difficult to scale.
3. Results and Discussion
3.1. Void Fraction Distribution
Void fraction measurements were performed with a conductivity probe in several cross-sections of the falling distance. Several authors have analyzed the water core evolution in two-phase jets of different types (e.g., Chanson [26]; Toombes [27]; Pfister and Schwindt [28]). However, analyses of nappe jets are scarce [18].
During the fall, the amount of air that is entrained in the rectangular jet tends to increase, changing the flow properties, such as the jet thickness B and the density of the mixture. Considering the spatial resolution of 1 mm between measurements and the uncertainty of about ±1% in the void fraction,
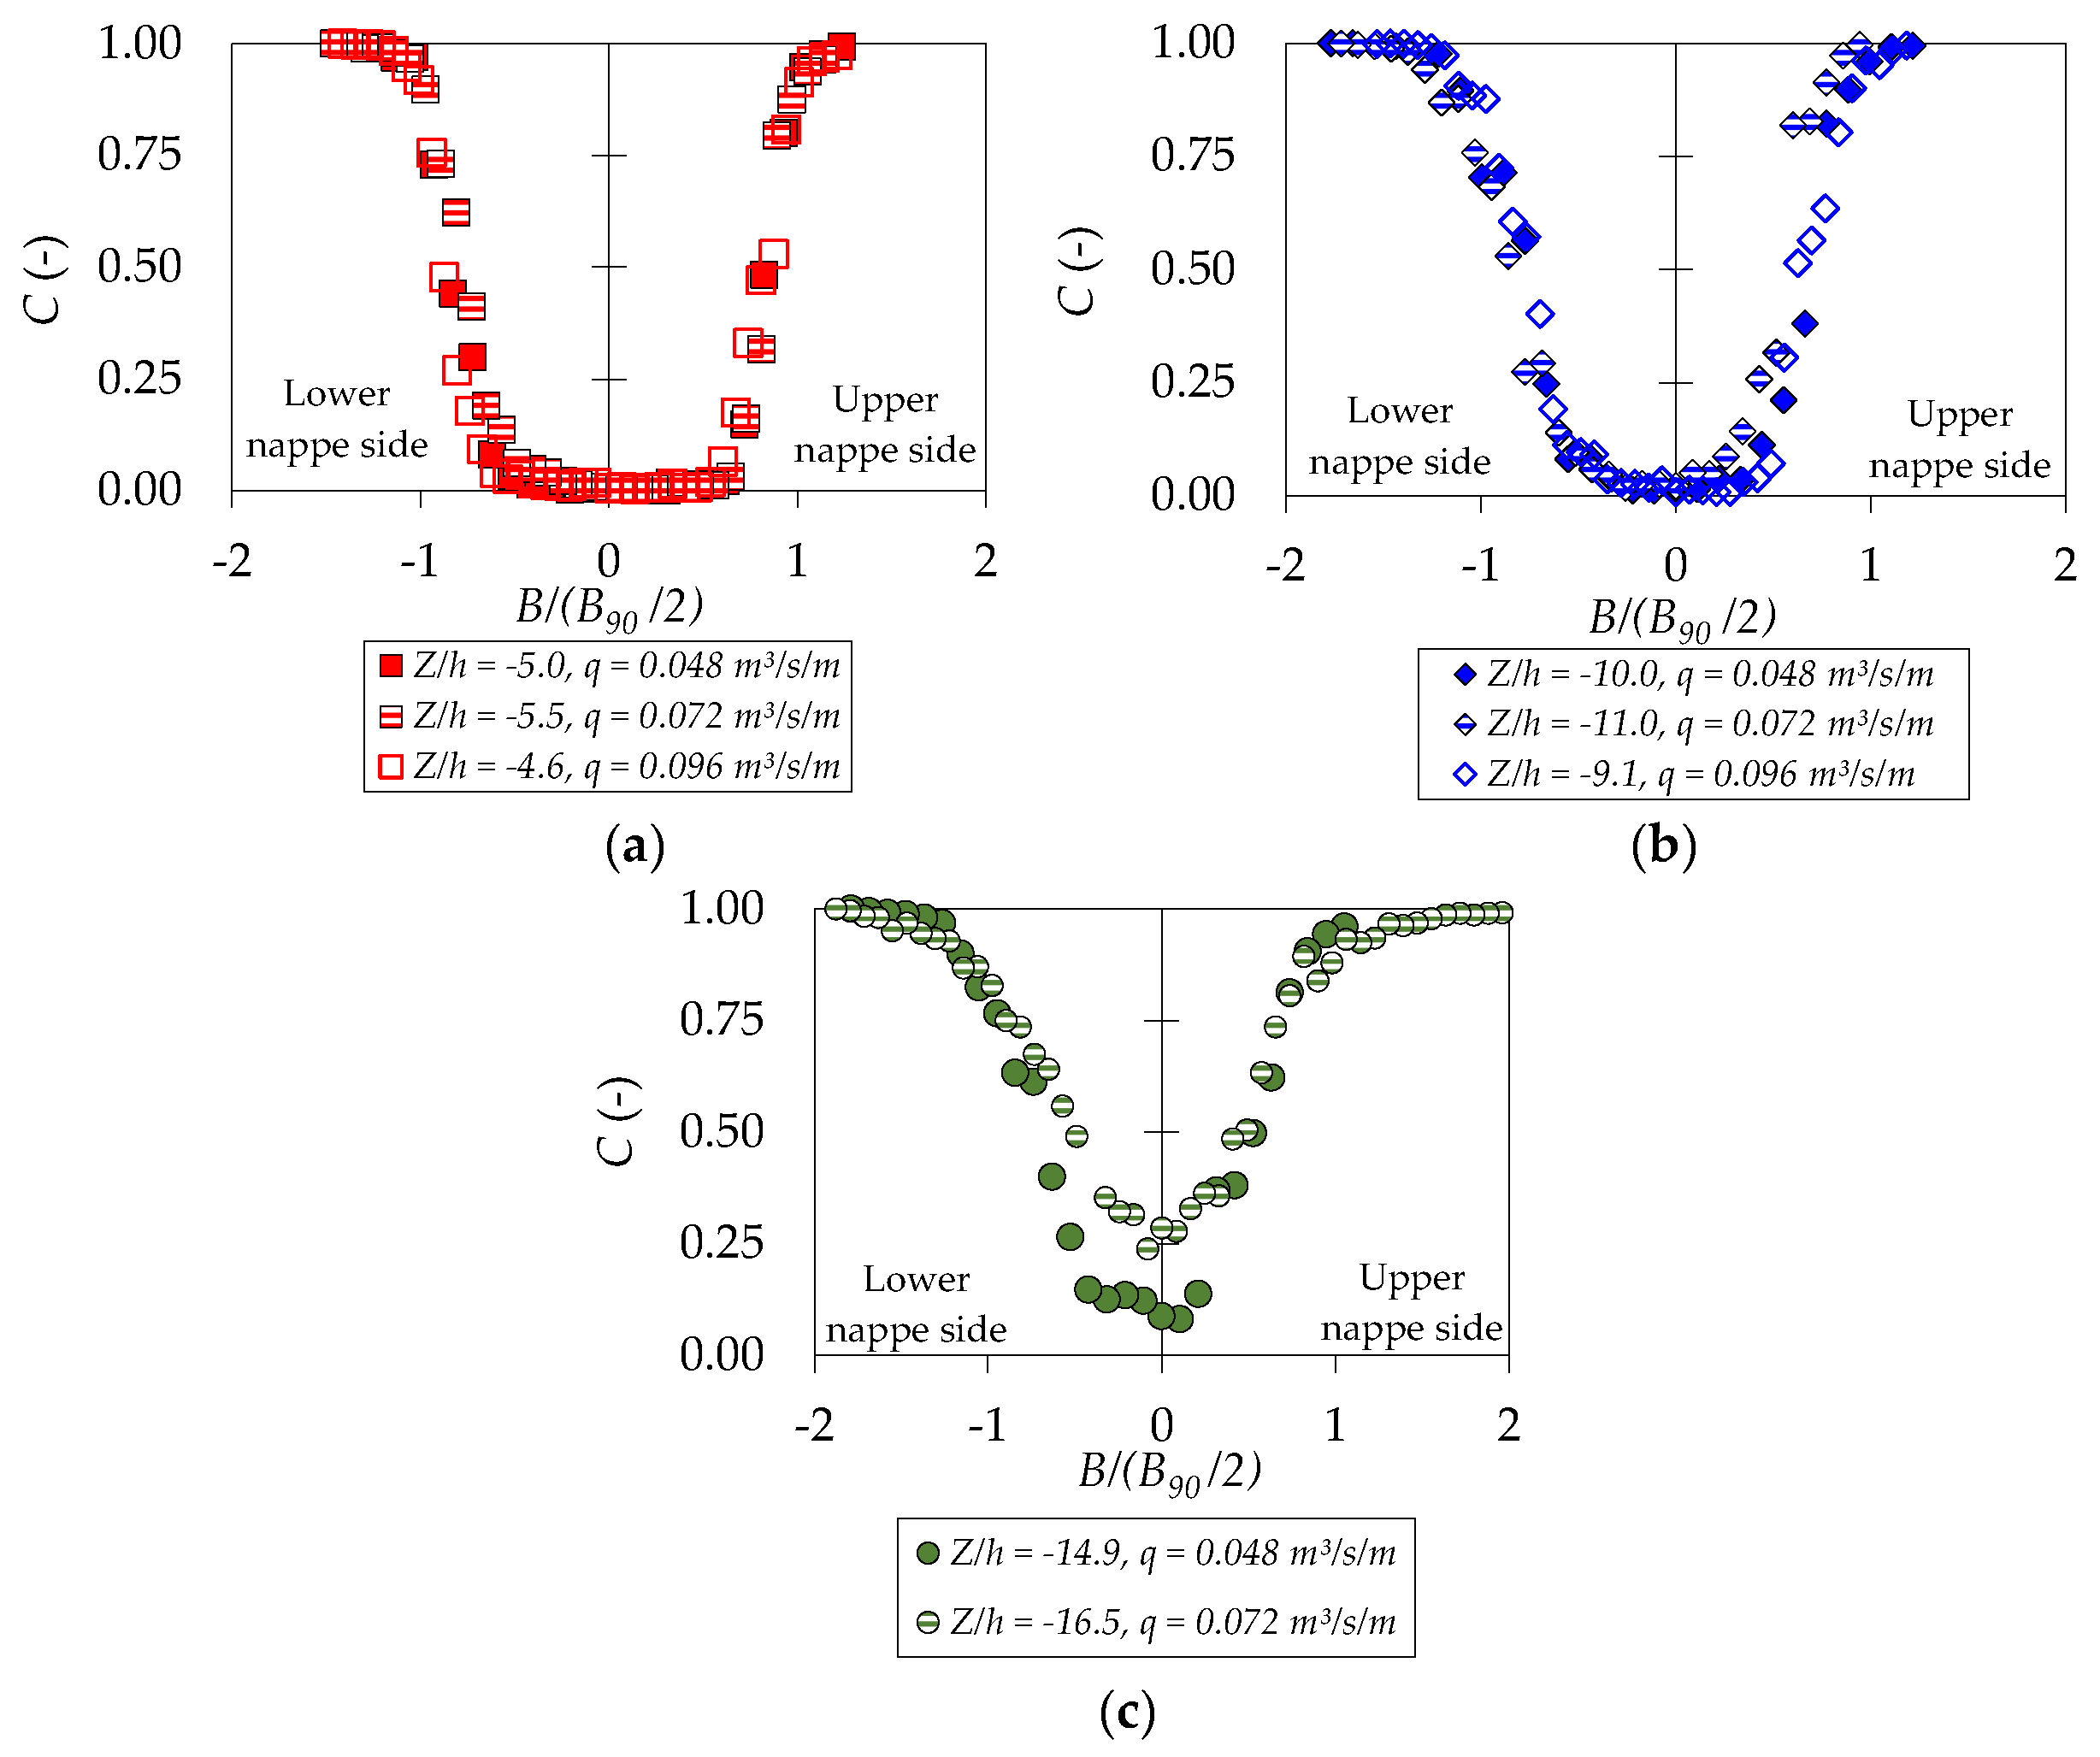
Figure 3 shows the void fraction distributions C for different dimensionless falling distances Z/h, where Z is the vertical distance from the weir crest to the center of each cross-section, and h is the energy head over the weir. The points of the upper and lower nappe are where C = 0.90 was used to obtain the B90 jet thickness. This parameter defines the part of the jet in which the probability to find water is more than 10%. The center of the B90 values was used to align the center of the cross-sections, allowing us to compare the void fraction distributions.
For Z/h ratios between −4.6 and −5.5 (Figure 3a), the void fraction profile is very similar in the three specific flows, and the inner jet core showed almost clear water (C = 0), with its center displaced to the upper nappe side. The shape of the void fraction distribution is not symmetrical, with less air entrainment in the upper side of the nappe. As the flow falls, the water jet core tends to reduce. For values of Z/h between −9.1 and −11.0 (Figure 3b), the air entrainment reaches almost all the jet thickness, with few differences between the shapes of the upper and lower sides of the nappe jet.
For falling distances Z/h between −14.9 and −16.5 (Figure 3c), air entrainment is noticeable in the entire cross-section, with minimum values of void fraction of 0.08 < C < 0.24. As the water falls, the slopes of the void fraction distribution of the upper and lower nappe sides tend to be less sharp.
3.2. Jet Thickness
Turbulence has an important effect on rectangular free-falling jets during the fall. It modifies the cross-section’s profile due to the spread of the jet thickness. The inner jet core tends to reduce due to the air entrainment and the interaction with the boundary’s turbulent layer.
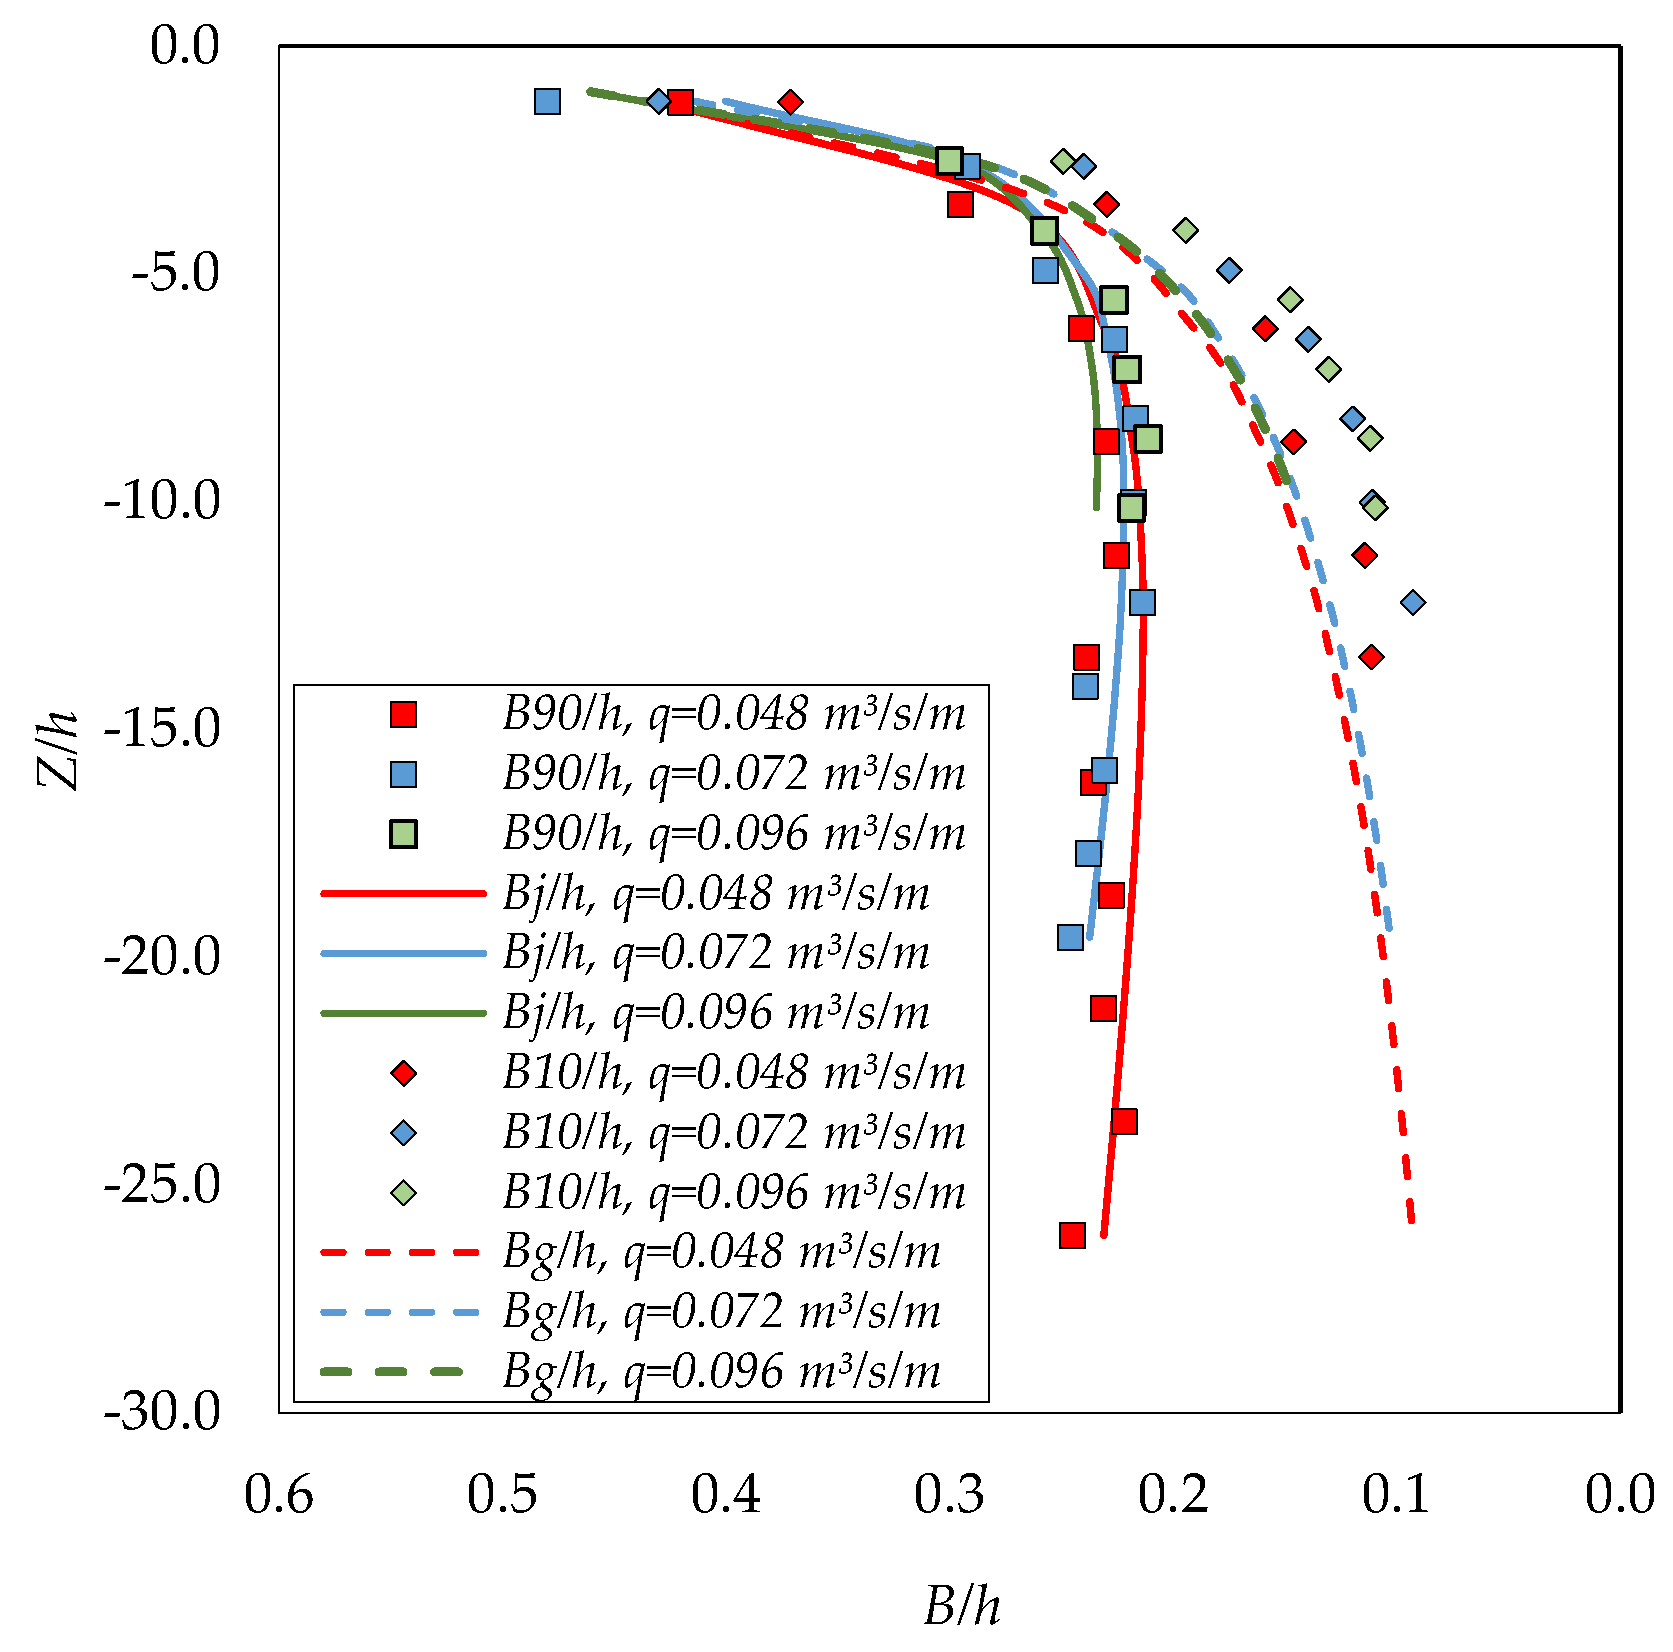
Figure 4 shows the dimensionless evolution of the thickness B90 and B10 as the flow moves from the weir, where B10 has been estimated as the distance between the upper and lower nappe with a void fraction of C = 0.10 (jet thickness with probability to find air of less than 10%). The Z/h normalization seems to be a good choice for analyzing the trends of both parameters. The experimental data were also compared with the aerated jet thickness Bj value calculated by Equation (1) of the parametric methodology and the theoretical jet thickness considering gravitational effects Bg (see Castillo et al. [7]).
As stated by Carrillo et al. [18], although the jet thickness values may be affected by fluctuations in the nappe jet, the B10 values seem to be similar to the jet thickness due to gravitational effects, while the B90 values seem to be quite similar to the Bj values obtained with Equation (1).
Regarding the B10 value, the maximum absolute differences in the Bg values are around 5–8 mm. The jet thickness B10 disappeared for fall distances greater than 1.20–1.40 m (Z/h ratios between −10.1 and −13.4). Regarding the comparison between B90 and Bj values, the maximum absolute differences are roughly between 2 and 3 mm. These results may be affected by the spatial resolution in the cross-section measurements (1 mm), and the void fraction’s relative accuracy (about ±1%).
3.3. Air–Water Phase Variation Count Rate
The air–water phase change count or bubble frequency F may be defined as the number of air–water detections by the probe’s tip (Felder [29]). This statistical parameter is considered a good estimator of the existence of air in the flow (André et al. [30]). The number of phase changes per second in rectangular free-falling jets has been analyzed in this study with the phase detection probe.
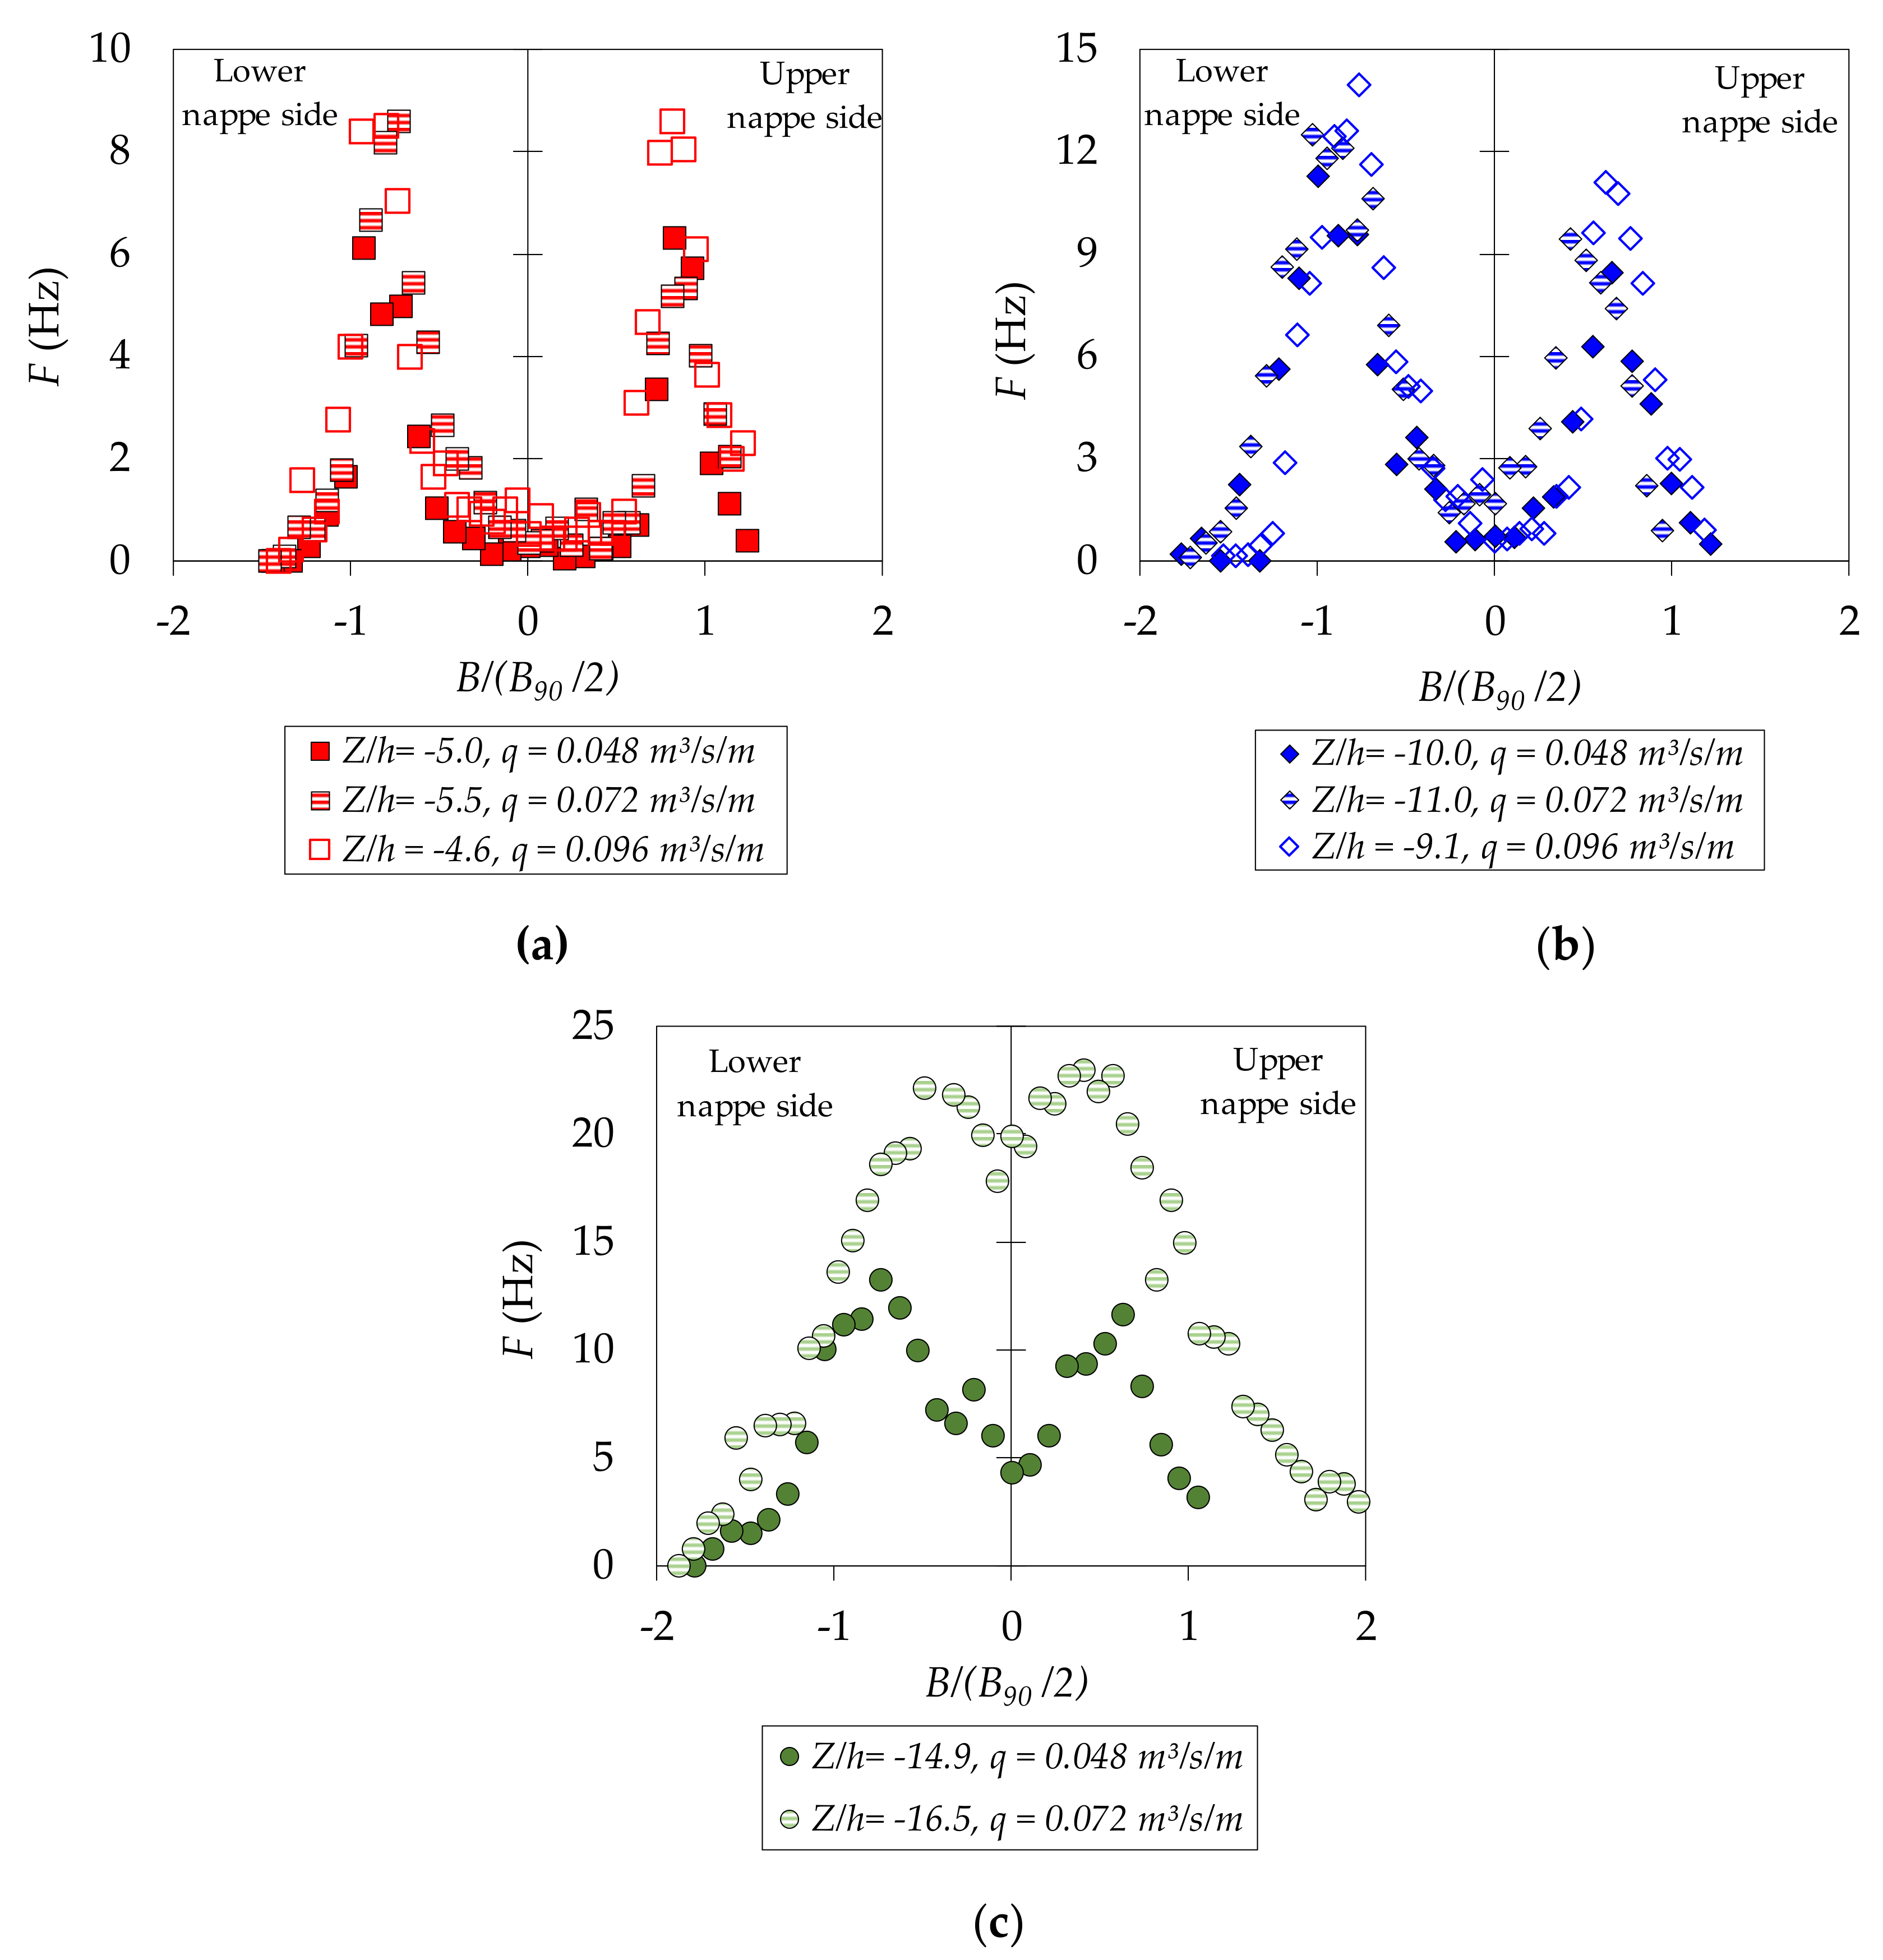
Figure 5 shows the air–water phase count rate F. At the beginning of the fall, the maximum values of the interference frequency are observed in the limits of the free surface of the jet, corresponding to the upper and lower nappe trajectories, with maximum values in the lower nappe side being slightly higher than in the upper nappe side. These maximum values tend to increase with the dimensionless falling distance Z/h: for values Z/h between −4.6 and −5.5 (Figure 5a), the maximum values are between 6 and 8 Hz; for Z/h between −9.1 and −11.0 (Figure 5b), the maximum values of F are between 8 and 14 Hz; and for dimensionless falling distances Z/h between −14.9 and −16.5 (Figure 5c), the bubble count rate tends to increase to 13–21 Hz.
As the non-aerated inner core has disappeared in Figure 5c, the maximum values tend to appear closer to the centerline of the cross-section. In all cases, the maximum air–water phase count rates were observed with a void fraction between 35% and 70%.
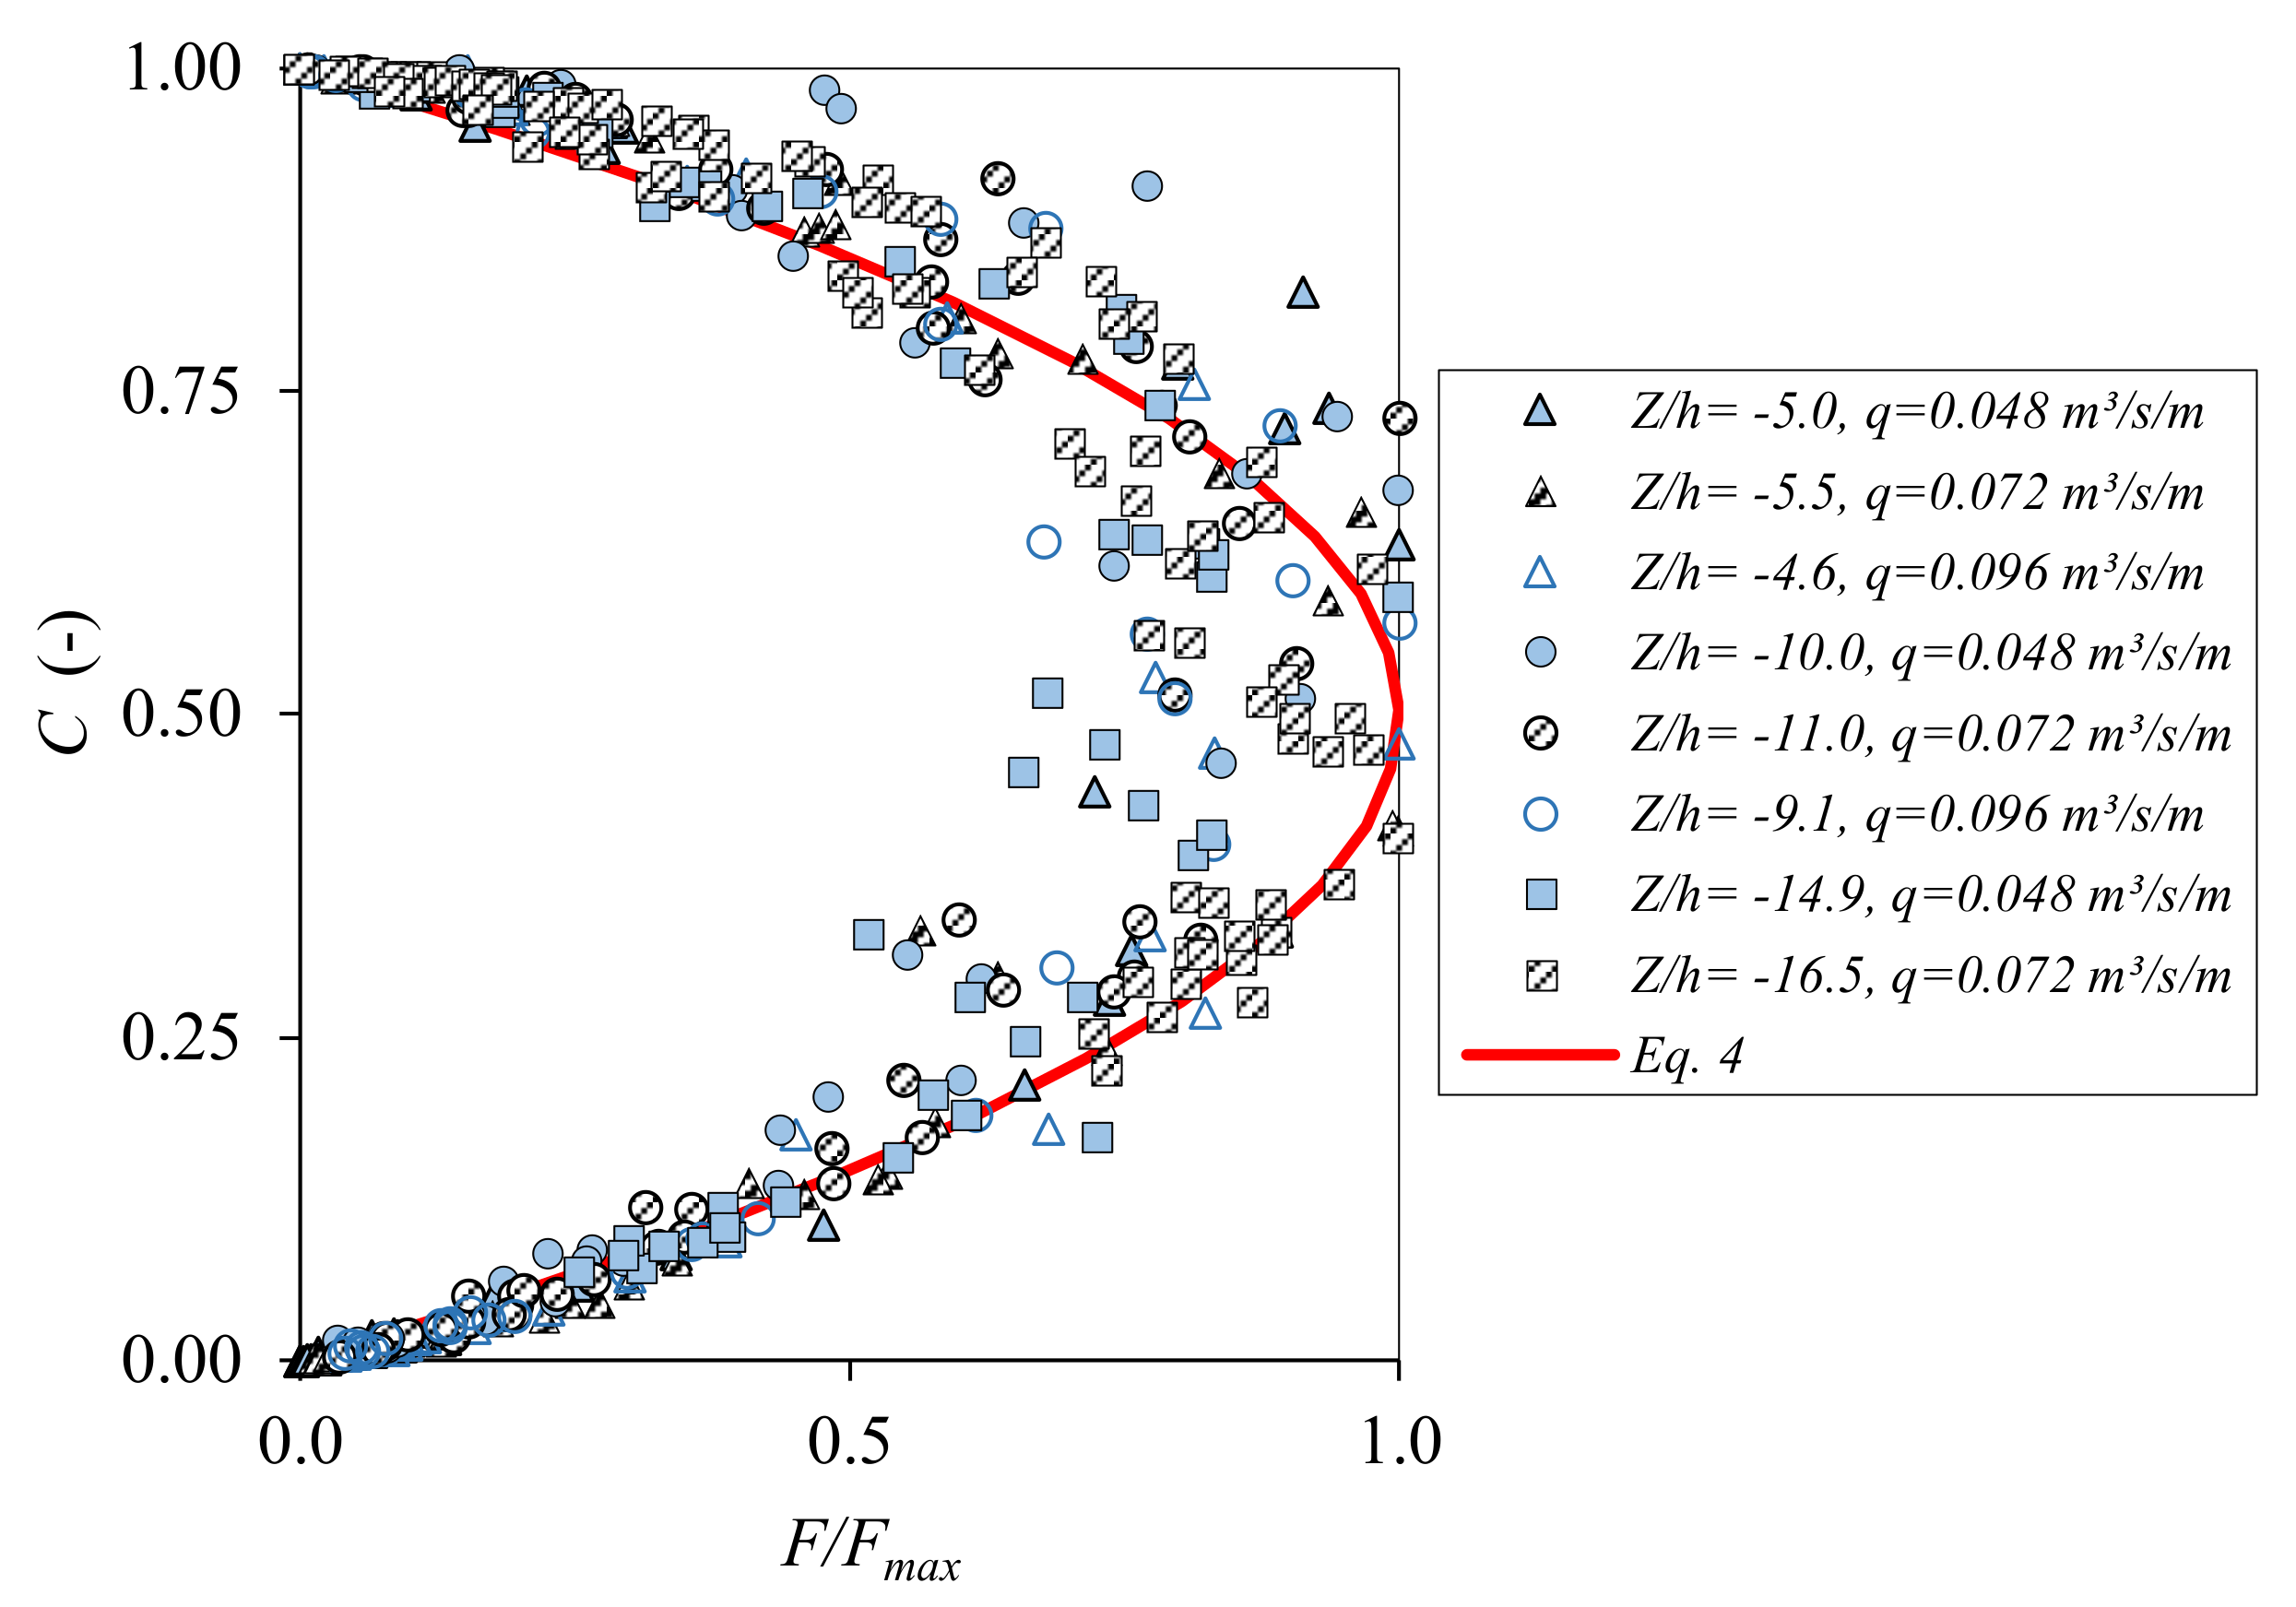
Several studies (e.g., Brattberg et al. [31], Toombes [22]) have stated that a relationship between the void fraction and the phase change count rate may be considered in two-dimensional water jets and stepped cascades. This relationship follows an approximately parabolic shape that may be defined as:
where F and Fmax are the bubble phase count rate and the maximum bubble count rate in each section, respectively, and C is the time-average void fraction.
Following these ideas, Figure 6 shows this normalization for the nappe flow case. The maximum values of F/Fmax may be observed at around C ≈ 0.50 (50% of the void fraction). For the range of velocities tested (from 2.5 to 6.5 m/s), the normalization seems to be independent of the jet velocity, jet thickness and aeration and the dimensionless falling distance. Considering the dispersion, the experimental data reasonably fit with Equation (4) in relation to rectangular free-falling jets.
3.4. Sauter Mean Bubble Diameter
If the simplification that the shape of air entrapped is spherical and equally distributed is assumed, then the air bubbles detected by the conductivity probe tip may be defined by the Sauter mean air bubble diameter Dsm (Clift et al. [32]). This is the mean diameter of a sphere that has the same distribution as the volume/surface ratio in the entire register. The Sauter mean bubble diameter may be estimated as:
where V is the mean velocity of the bubbles (considered as the gravitational velocity in each cross-section), and F is the air–water phase change frequency.
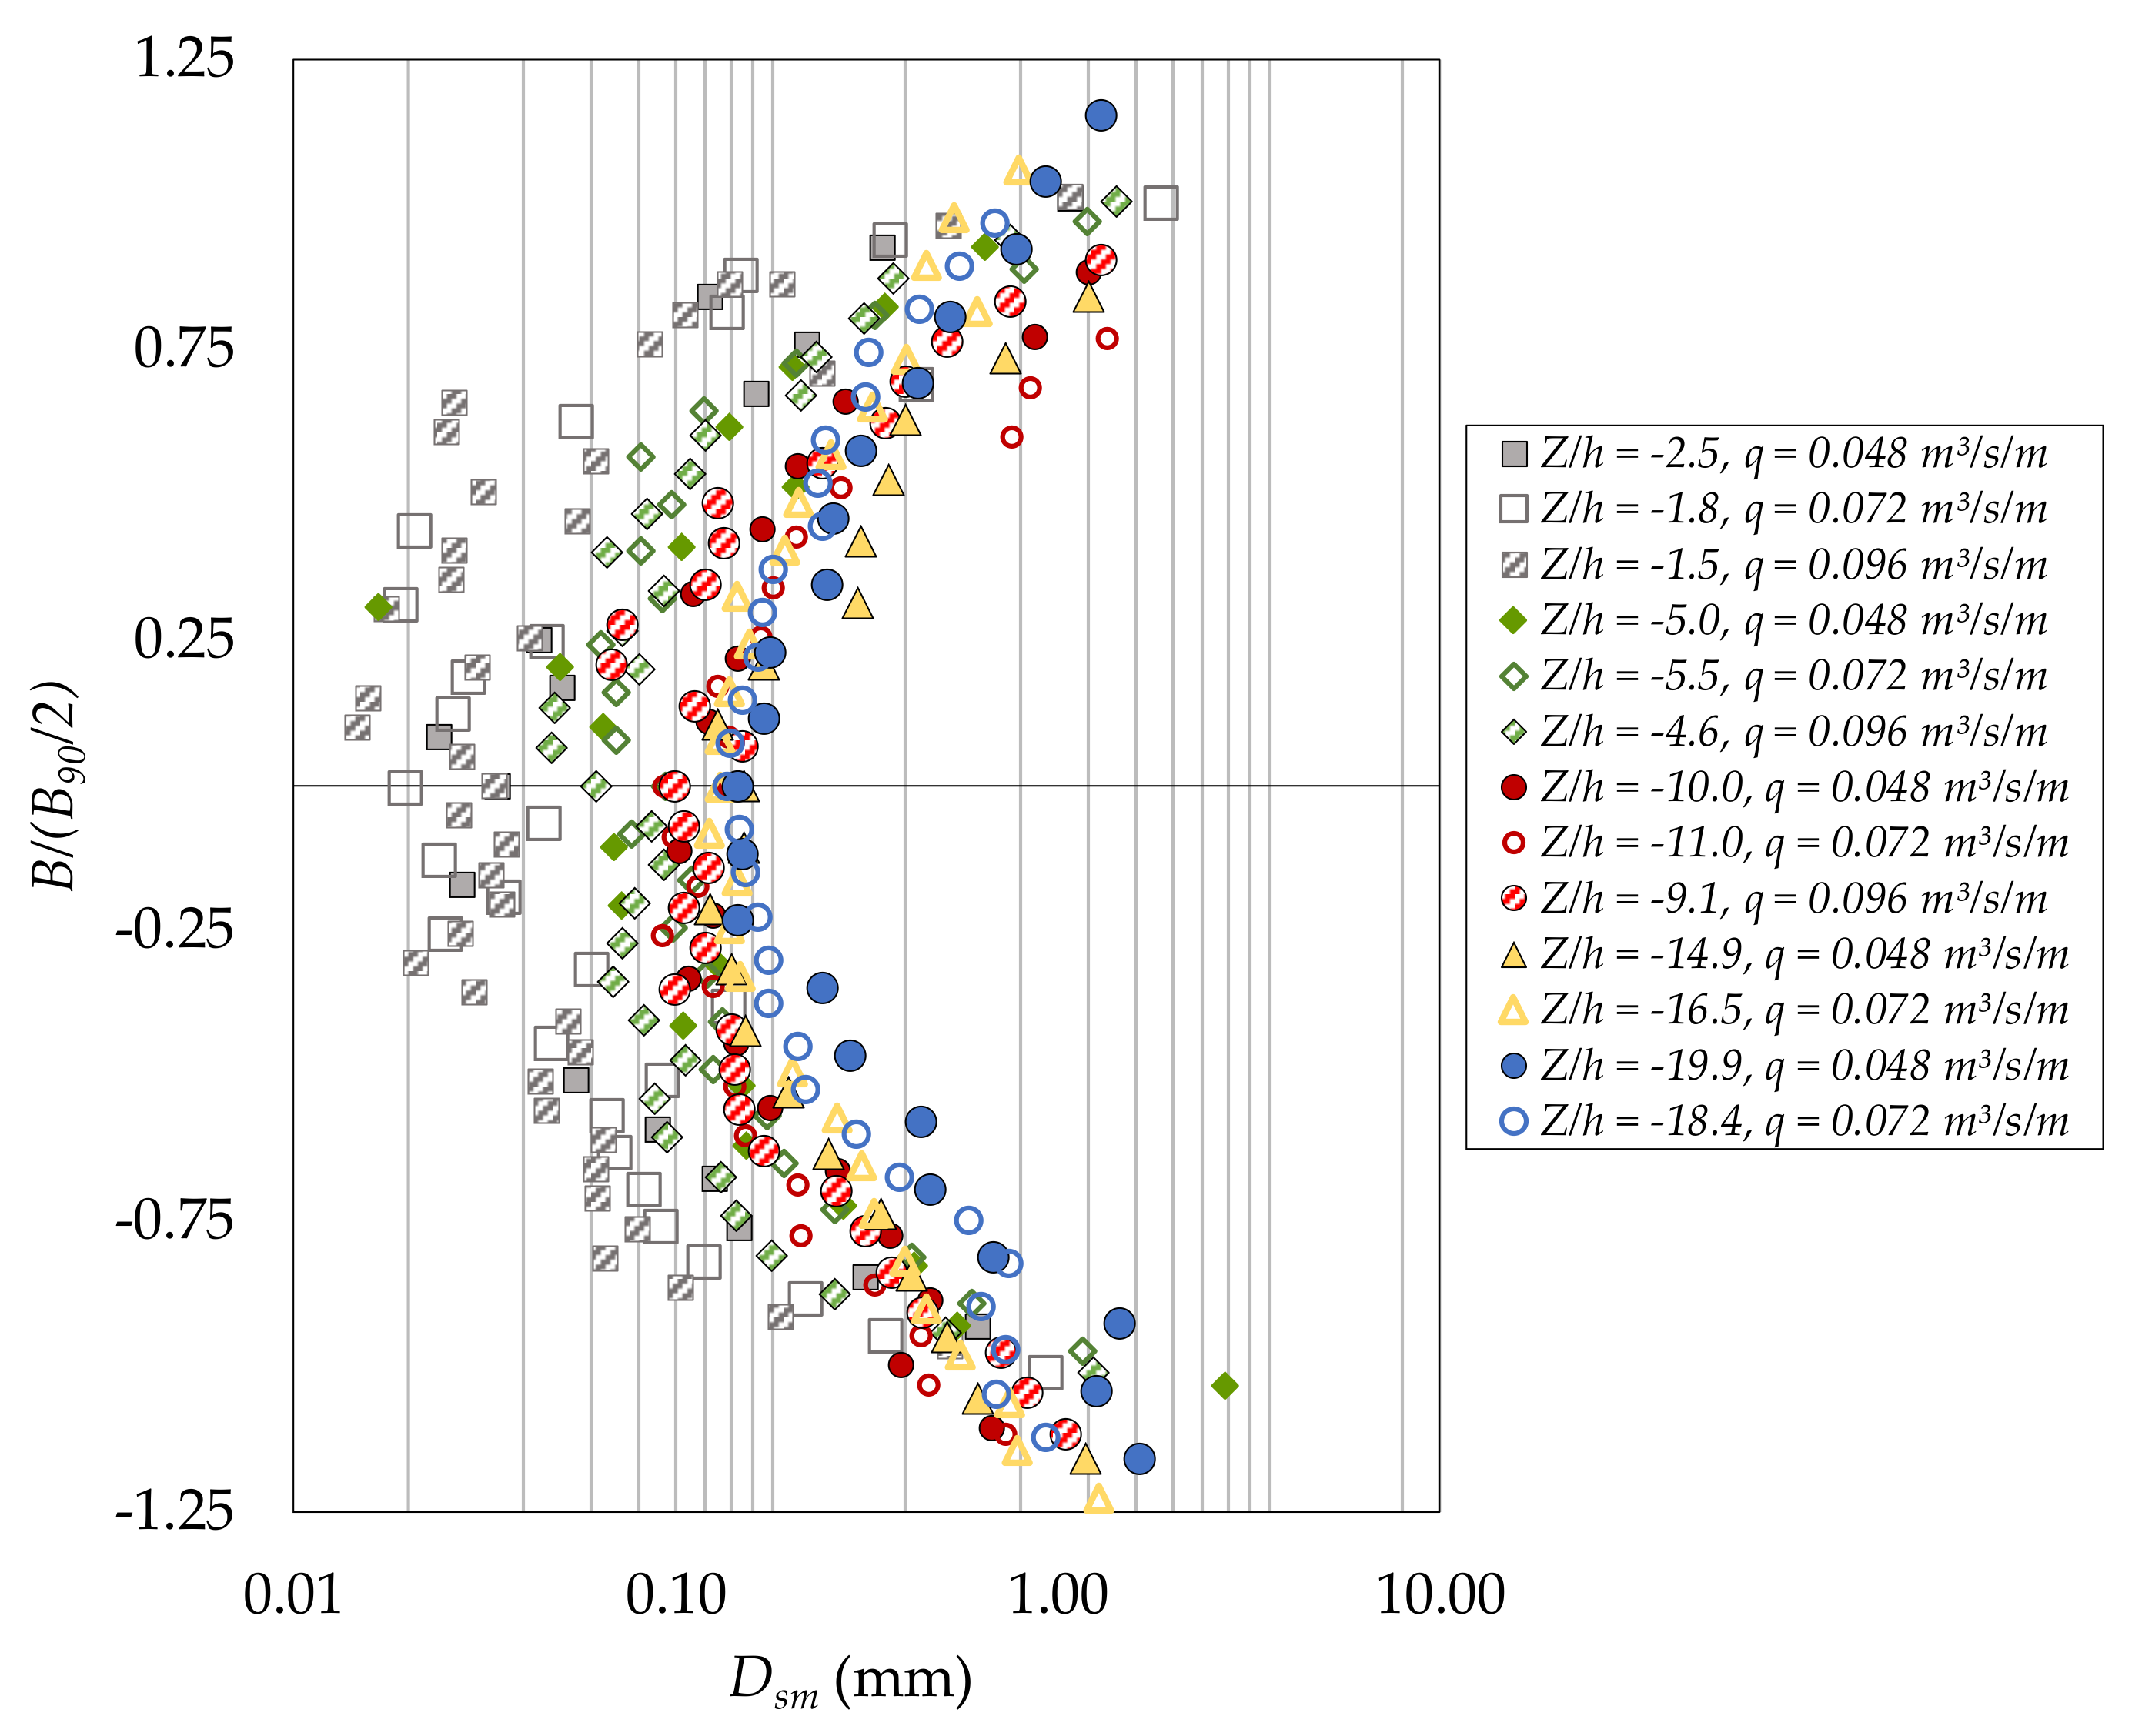
Figure 7 shows the Sauter mean air bubble diameter for different falling distances from the weir. The plot has been limited to the C ≤ 0.9 values. In general, the Sauter mean diameter values are between 0.02 and 1.0 mm, with maximum values below 3.0 mm. Minimum values are obtained in the center of the jet in all the cross-sections, with maximum values being obtained as the measurement locations move to the free surface of the nappe. The minimum values also increase as the falling distance increases in the closer sections. After falling distances of around 5–6 times the energy head (Z/h > 5–6), the minimum Sauter mean diameter tends toward a constant value around 0.1 mm. Data show a relatively low deviation from the symmetrical behavior tending to the lower nappe side, with skewness values of between 1 and 2 for q = 0.048 m3/s/m, 1 and 3 for q = 0.072 m3/s/m and 2 and 3 for q = 0.096 m3/s/m, where values closer to zero indicate a symmetric trend and lower dispersion.
3.5. Air–Water Chord Length
According to Chanson and Carosi [33], the void fraction distribution does not adequately describe the structure of air–water flows or the interactions between entrapped bubbles and the turbulent shear. However, the signal processing may provide additional information about the flow characteristics. The conductivity probe signals register the time by the air/water phase change, which is known as the chord time. The chord time of the local measurements can be classified in terms of the bubble chord length:
where V is the mean velocity (obtained as the gravitational velocity in each cross-section), and tch is the chord time.
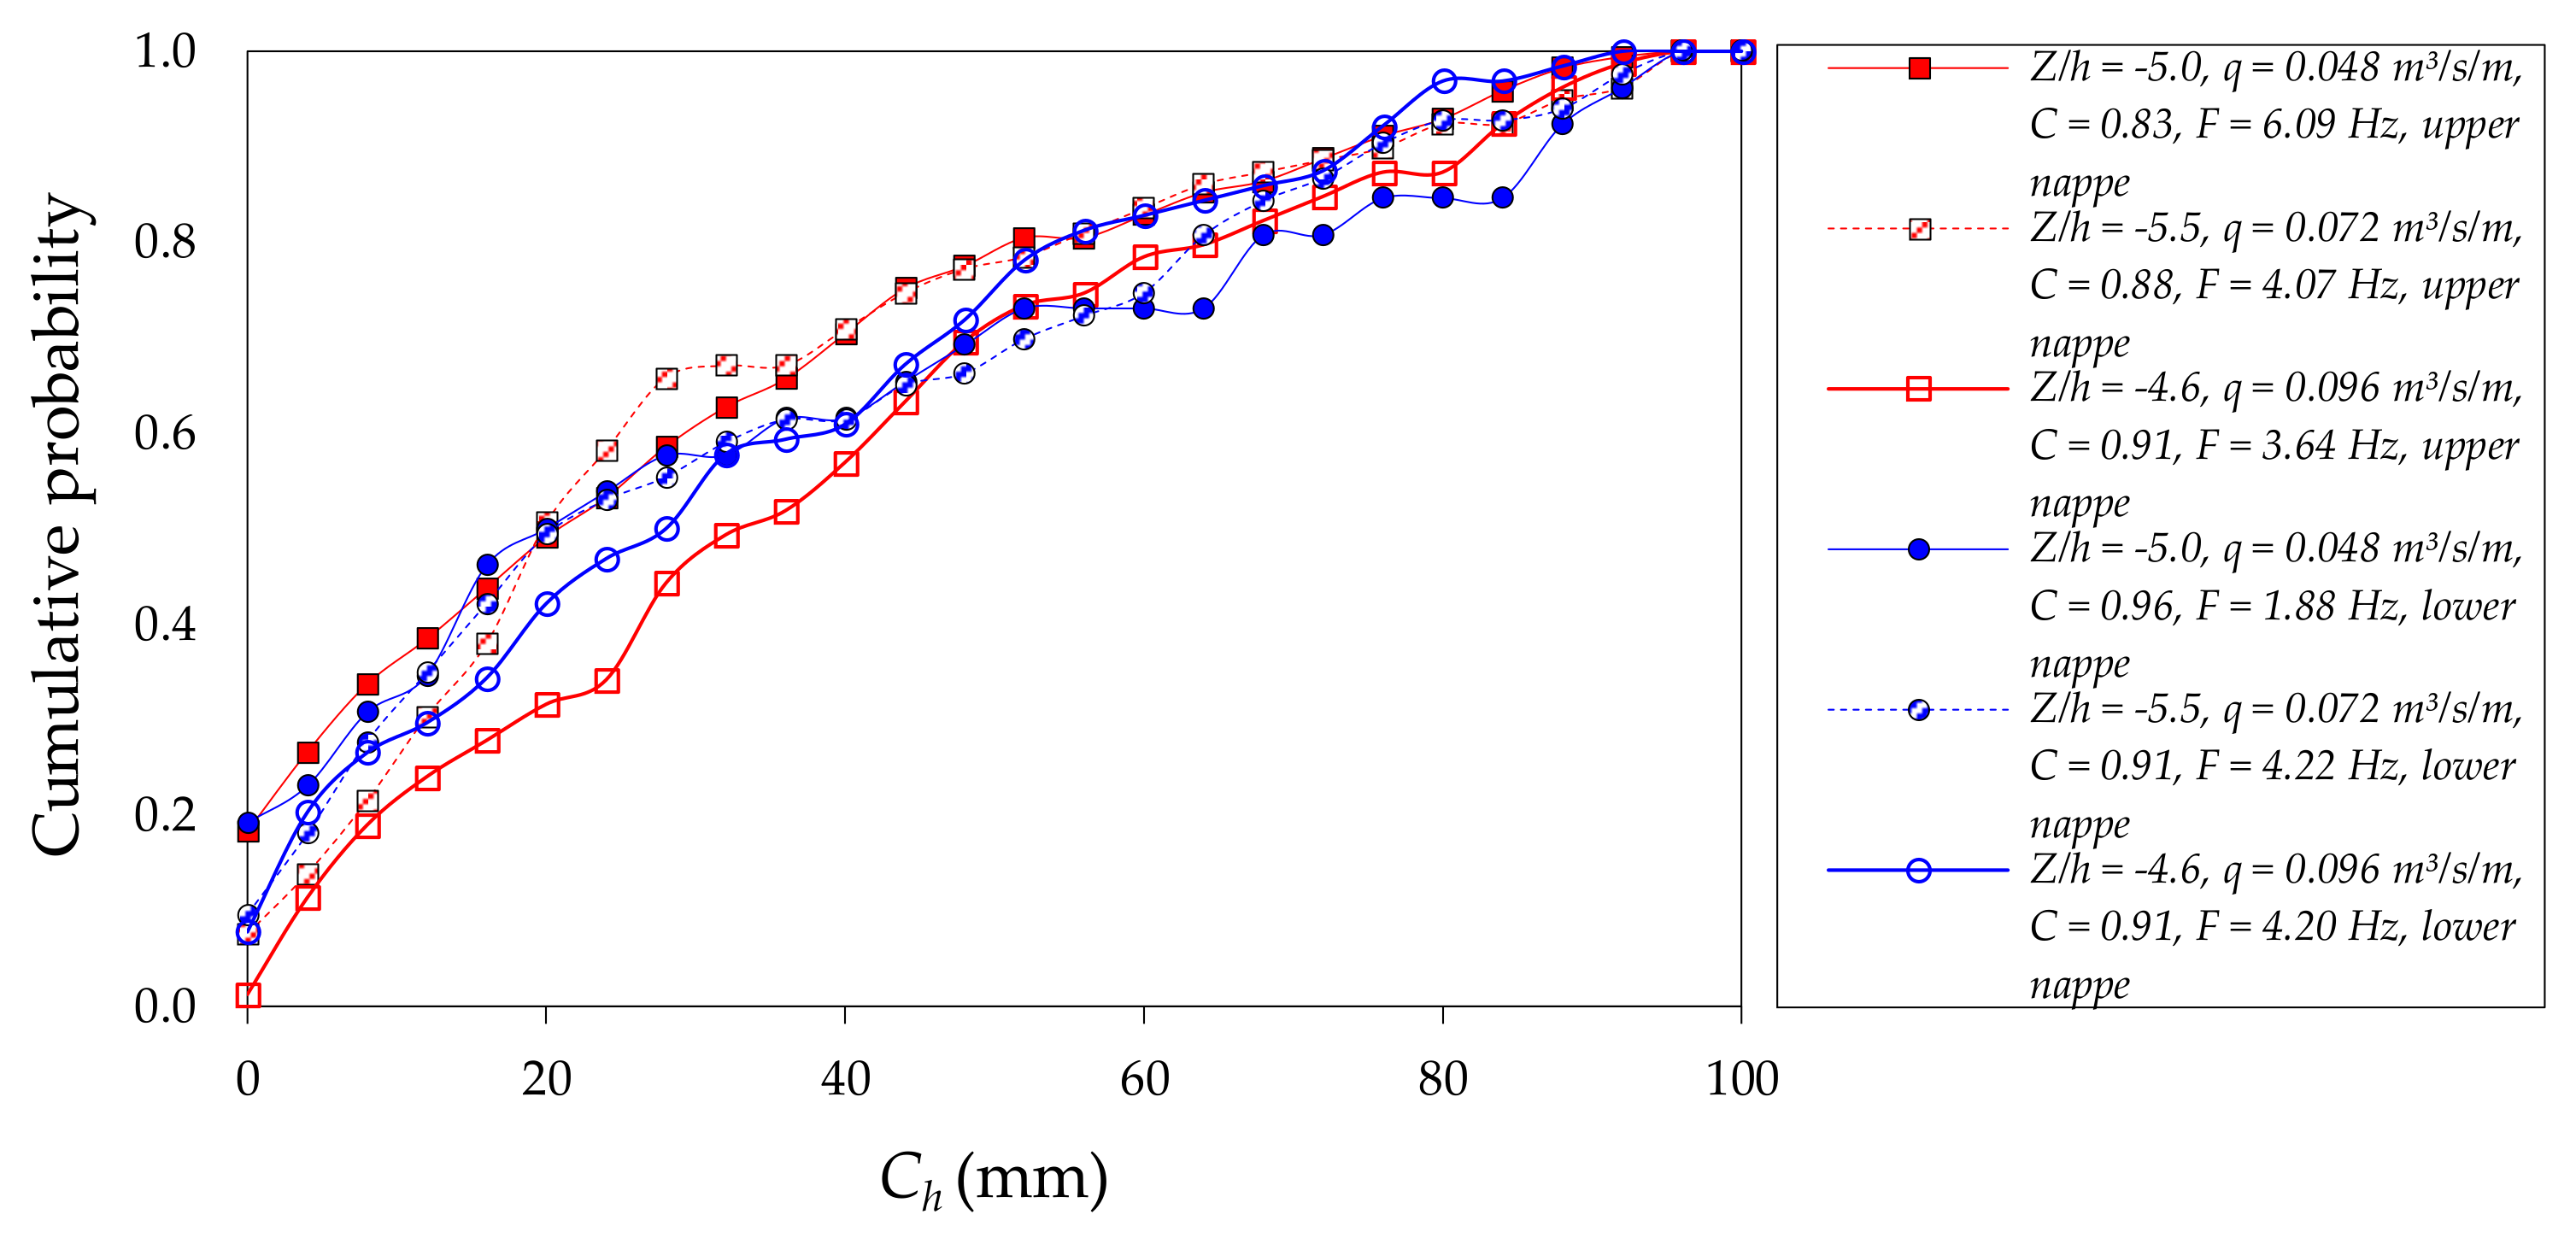
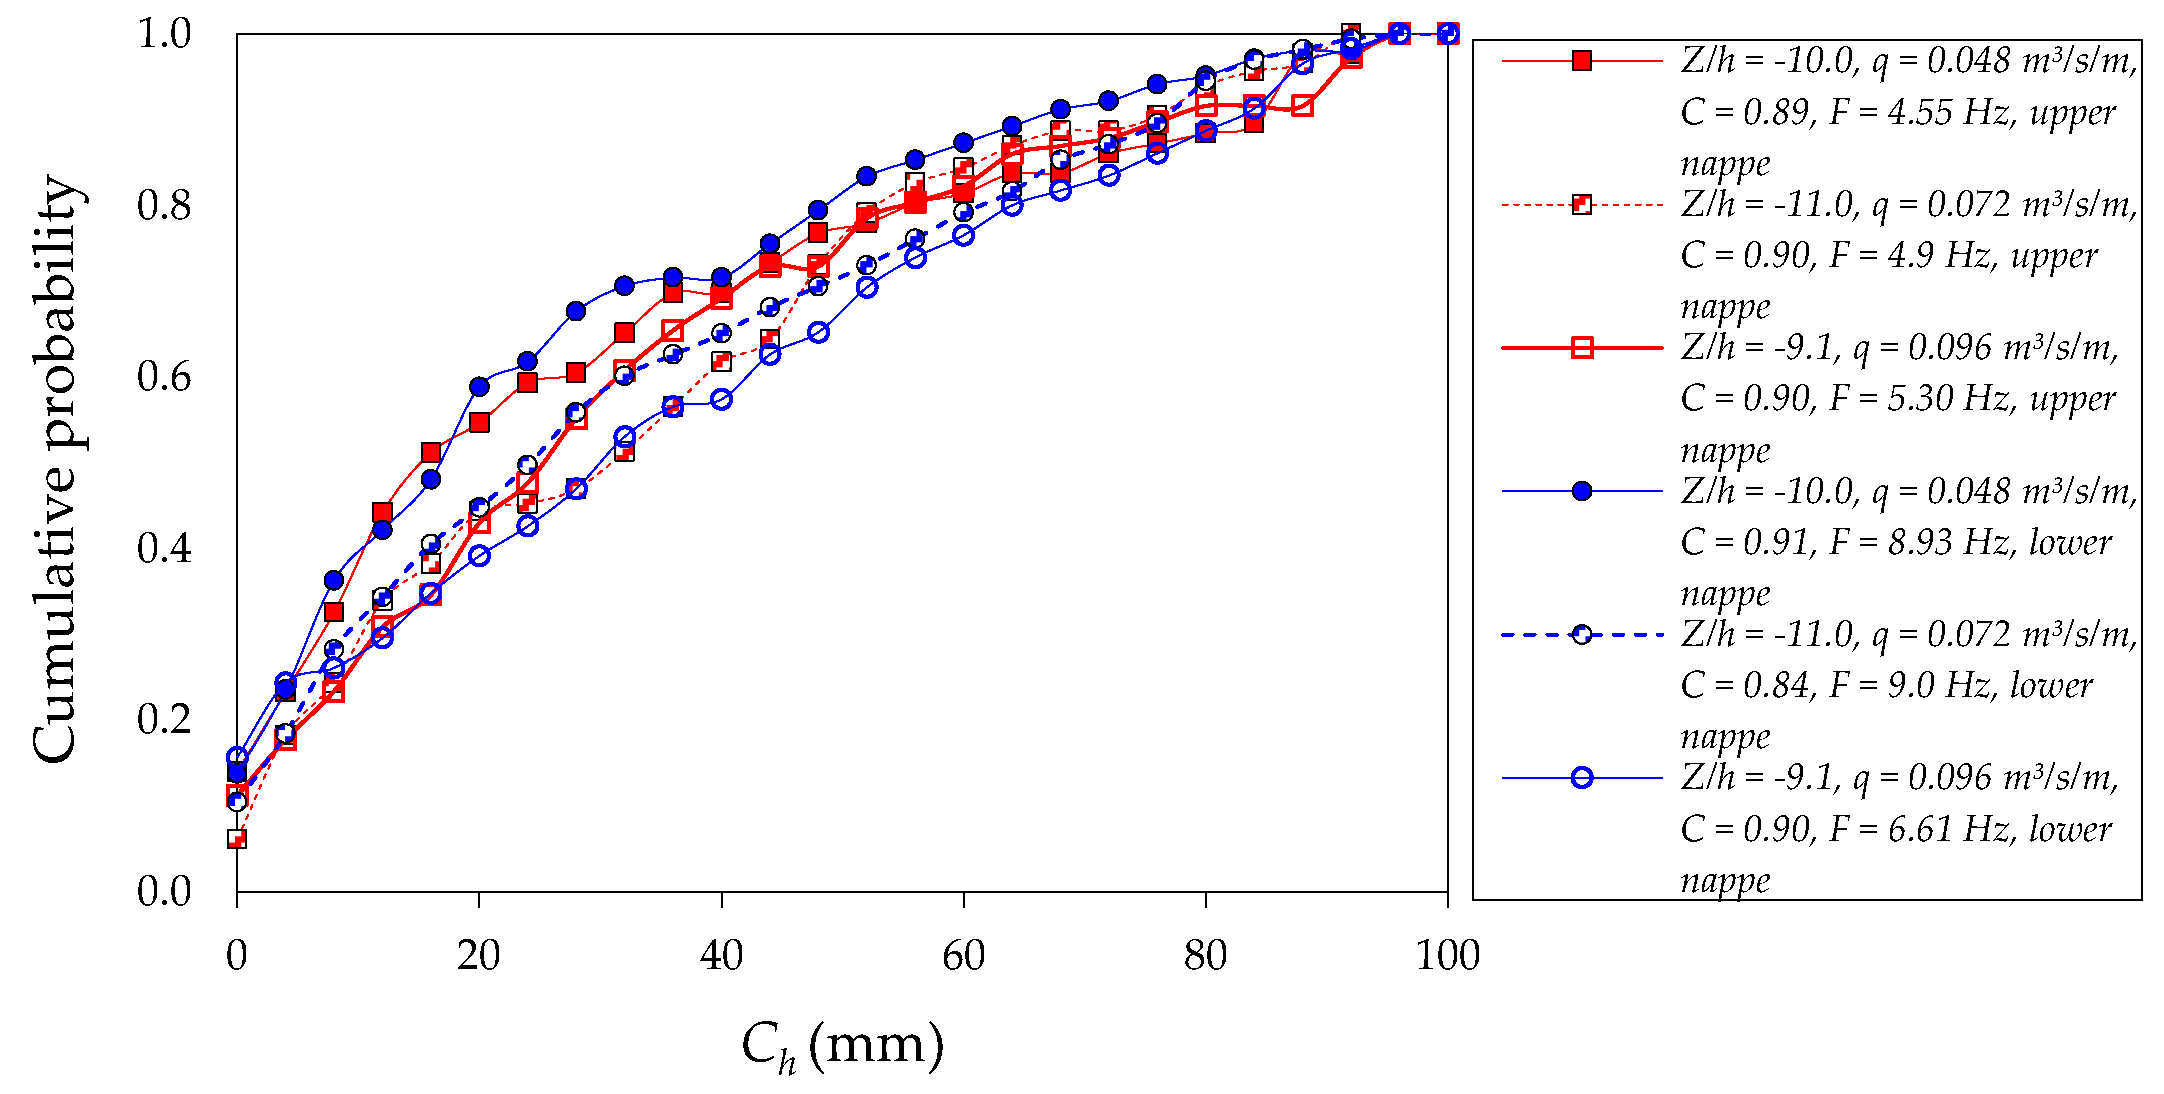
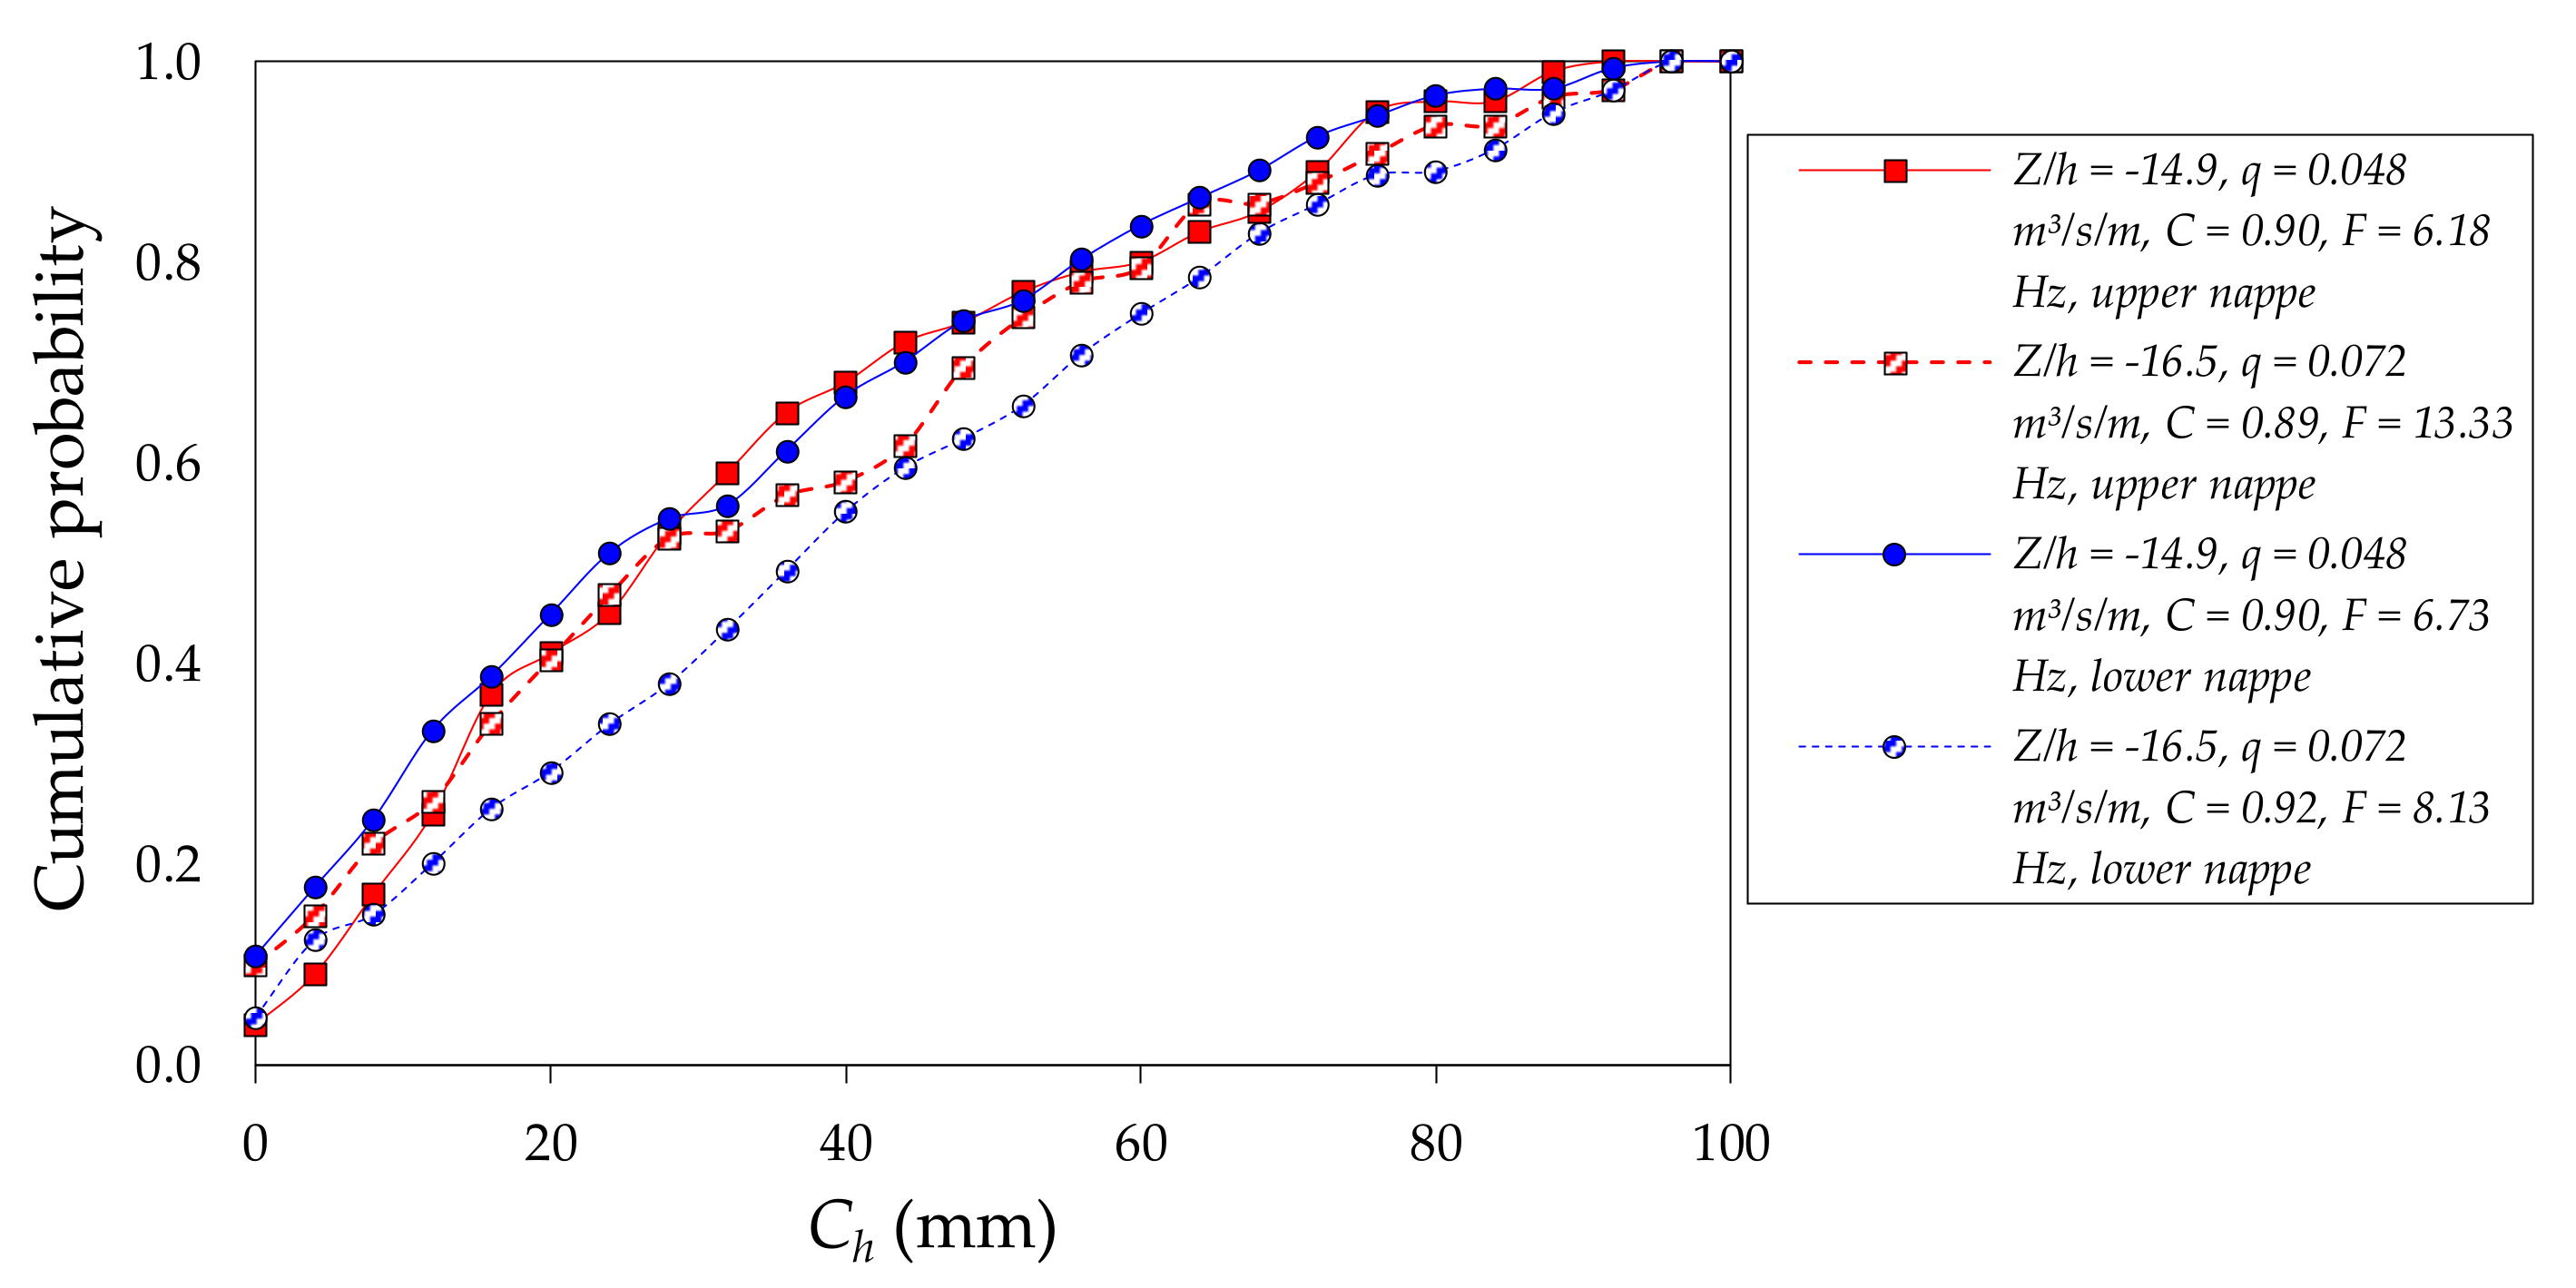
Some authors (e.g., Toombes [22], Chanson and Carosi [33], Felder, [34]) have considered the bubble chord length distributions as a probability distribution function (PDF) in the form of a frequency histogram. Other authors (e.g., Herringe and Davis [35]) have presented these data as a cumulative probability distribution function. Figure 8, Figure 9, Figure 10 show the cumulative probability distribution functions obtained for the bubble chord lengths that were measured in the upper and lower nappes of the rectangular free-falling jets. The bubble chord lengths have a wide range of values (from zero to 100 mm). The maximum slopes of the cumulative distribution were obtained with the smaller bubble chord lengths (between 0 and 20 mm) in the three falling distances that were analyzed. The cumulative probability distribution function slopes tend to reduce as the bubble chord length increases. In general, the distributions of the upper and lower nappe sides show the same trend, and few differences are observed as a function of the normalization of the falling distance Z/h. These values agree with the results obtained by Brattberg [31] in two-dimensional water jets, whose representative probabilities were between 2.0 and 2.5 mm with the maximum chord lengths of up to 100 mm.
3.6. Turbulence Intensity
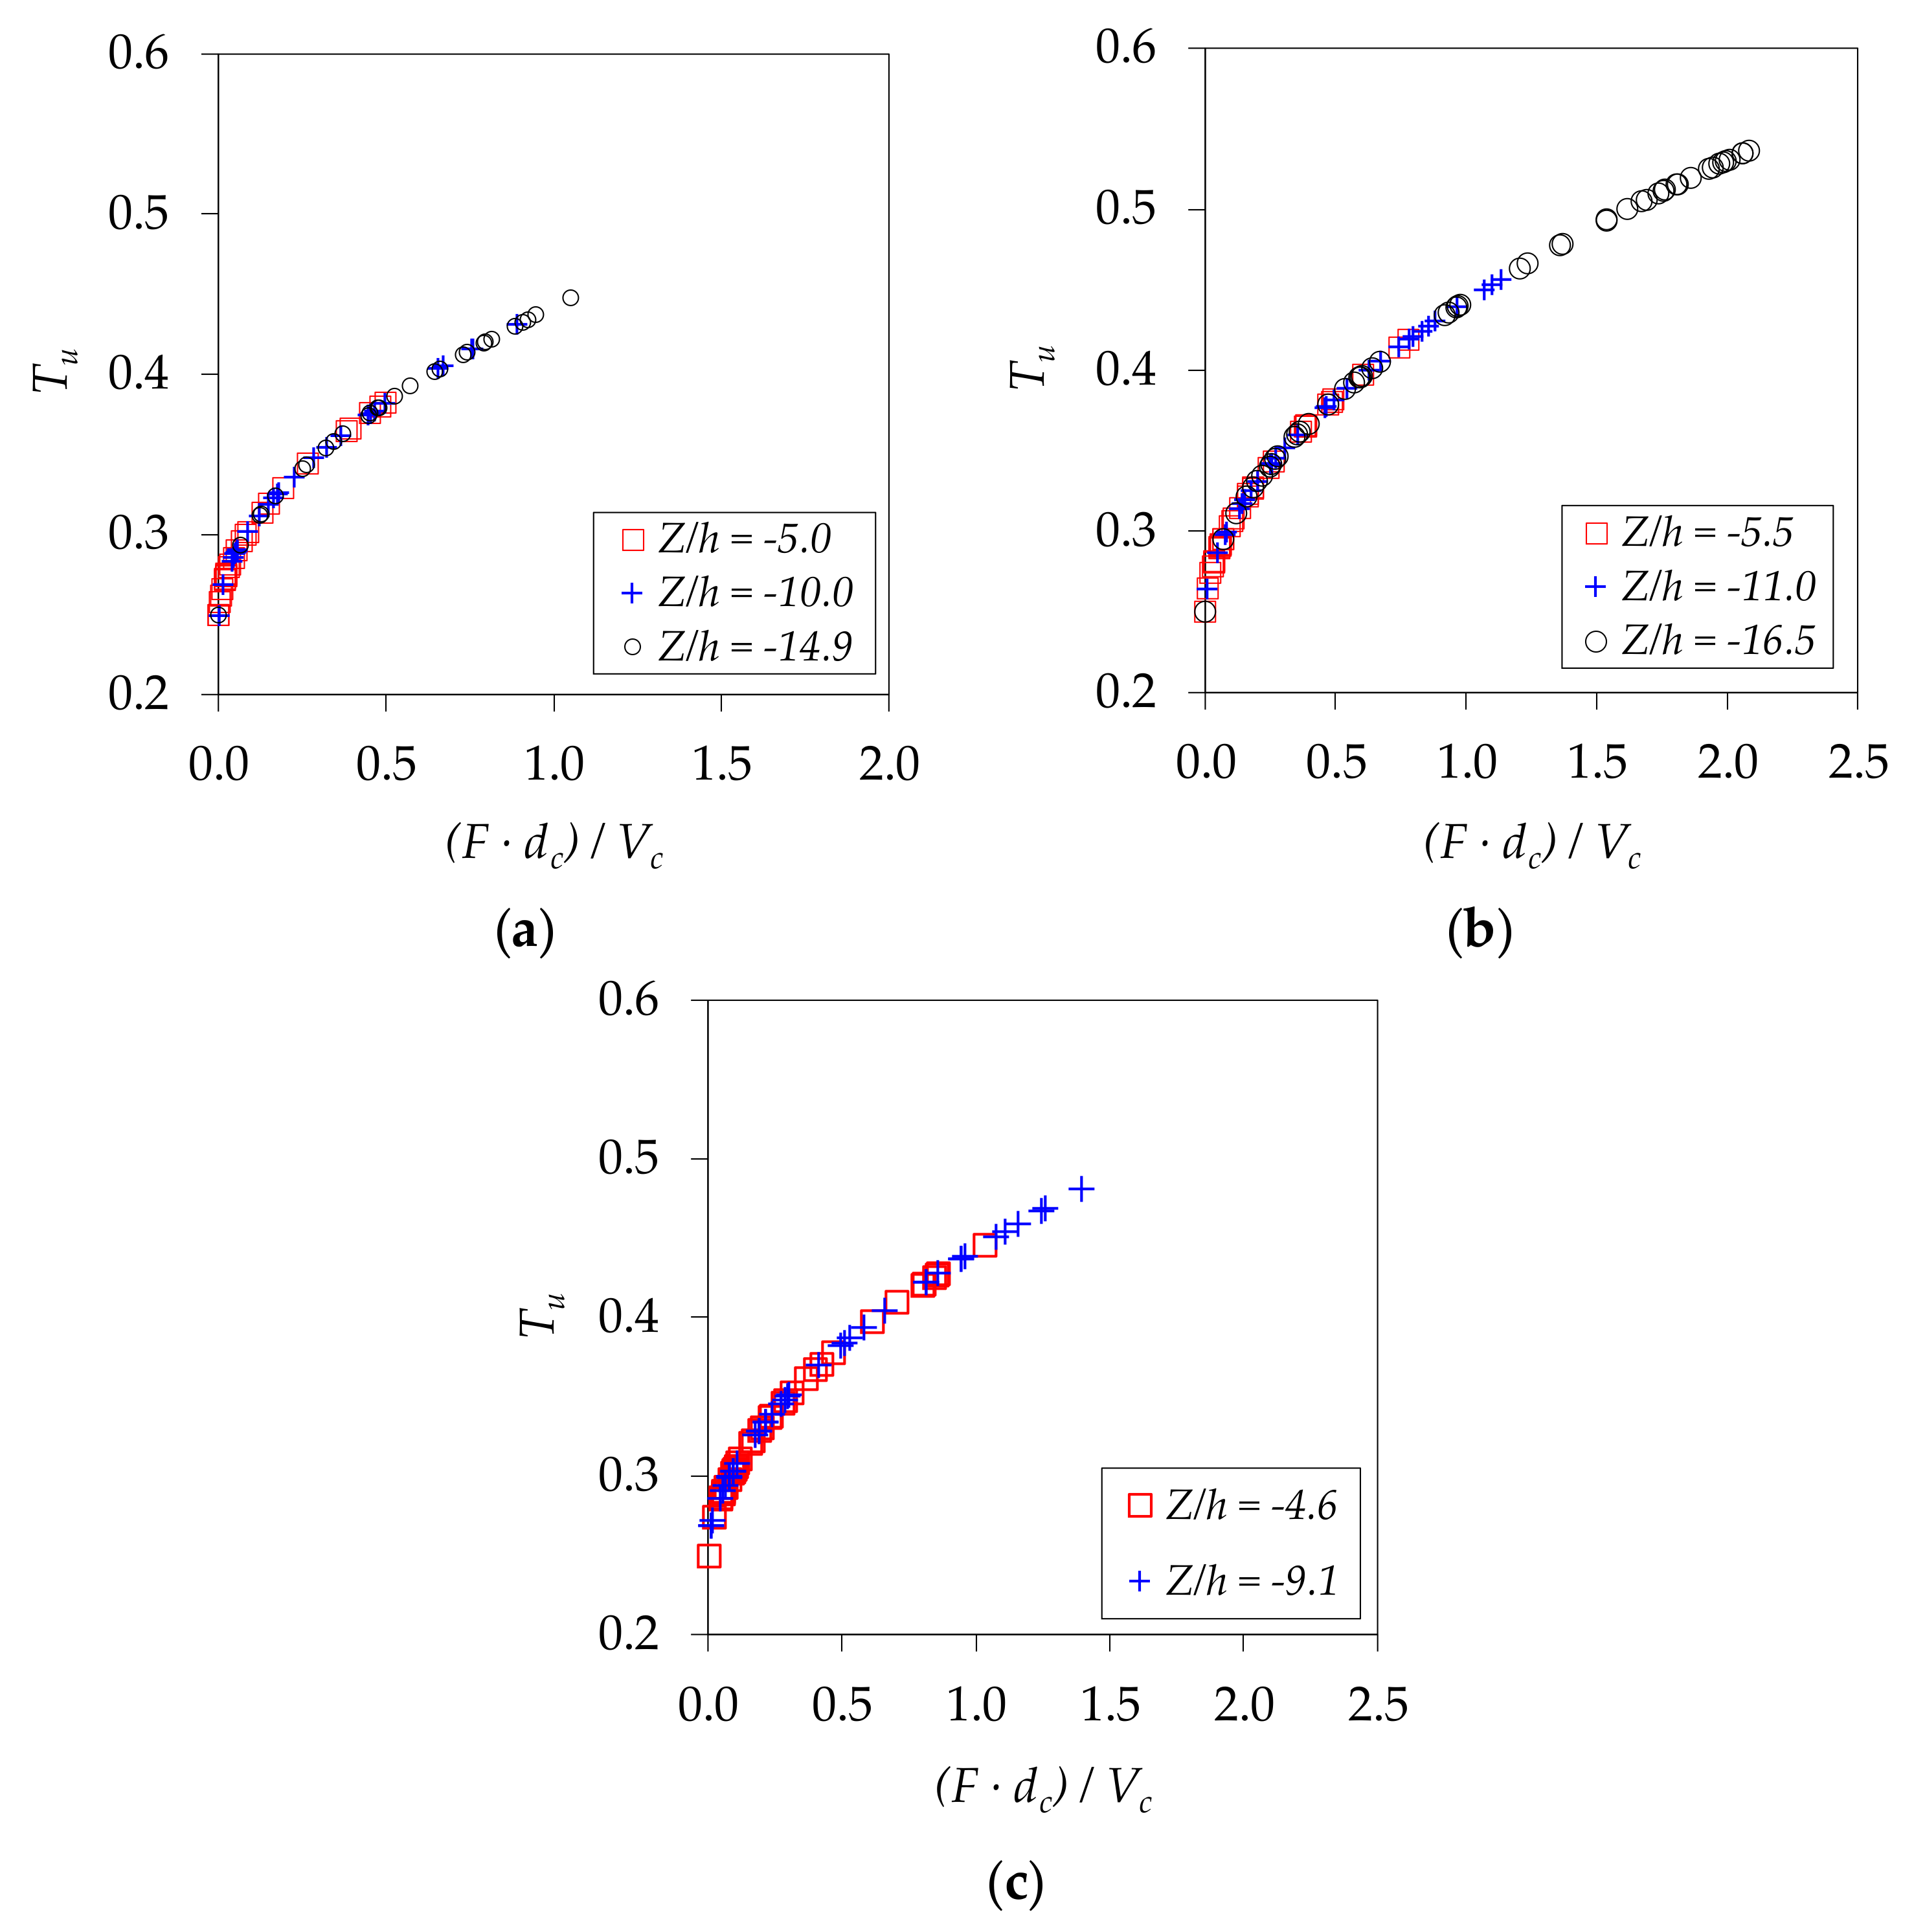
Several authors (e.g., Chanson and Toombes [10], Felder [34]) have experimentally observed a relationship between the increase in the turbulent intensity and the number of entrainment bubbles/droplets in skimming flow cases. These studies stated that the turbulence intensity Tu is correlated to the dimensionless bubble frequency by:
where dc is the critical flow depth (dc = ) and Vc the critical flow velocity (Vc = ).
Following these ideas, Figure 11 shows the turbulent intensity and the dimensionless air–water phase count rate in rectangular free-falling jets. In the three specific flows, the range of values obtained in each cross-section changes according to the dimensionless falling distance. The turbulent intensity values are between 0.25 and 0.45–0.53. Differences in the three specific flows are related to the differences in the phase change count rate F that is measured in the further cross-sections (see Figure 5c). The range of Tu values obtained is similar to those obtained by [10] and [34], with maximum values of up to 1.7 in steeped chutes.
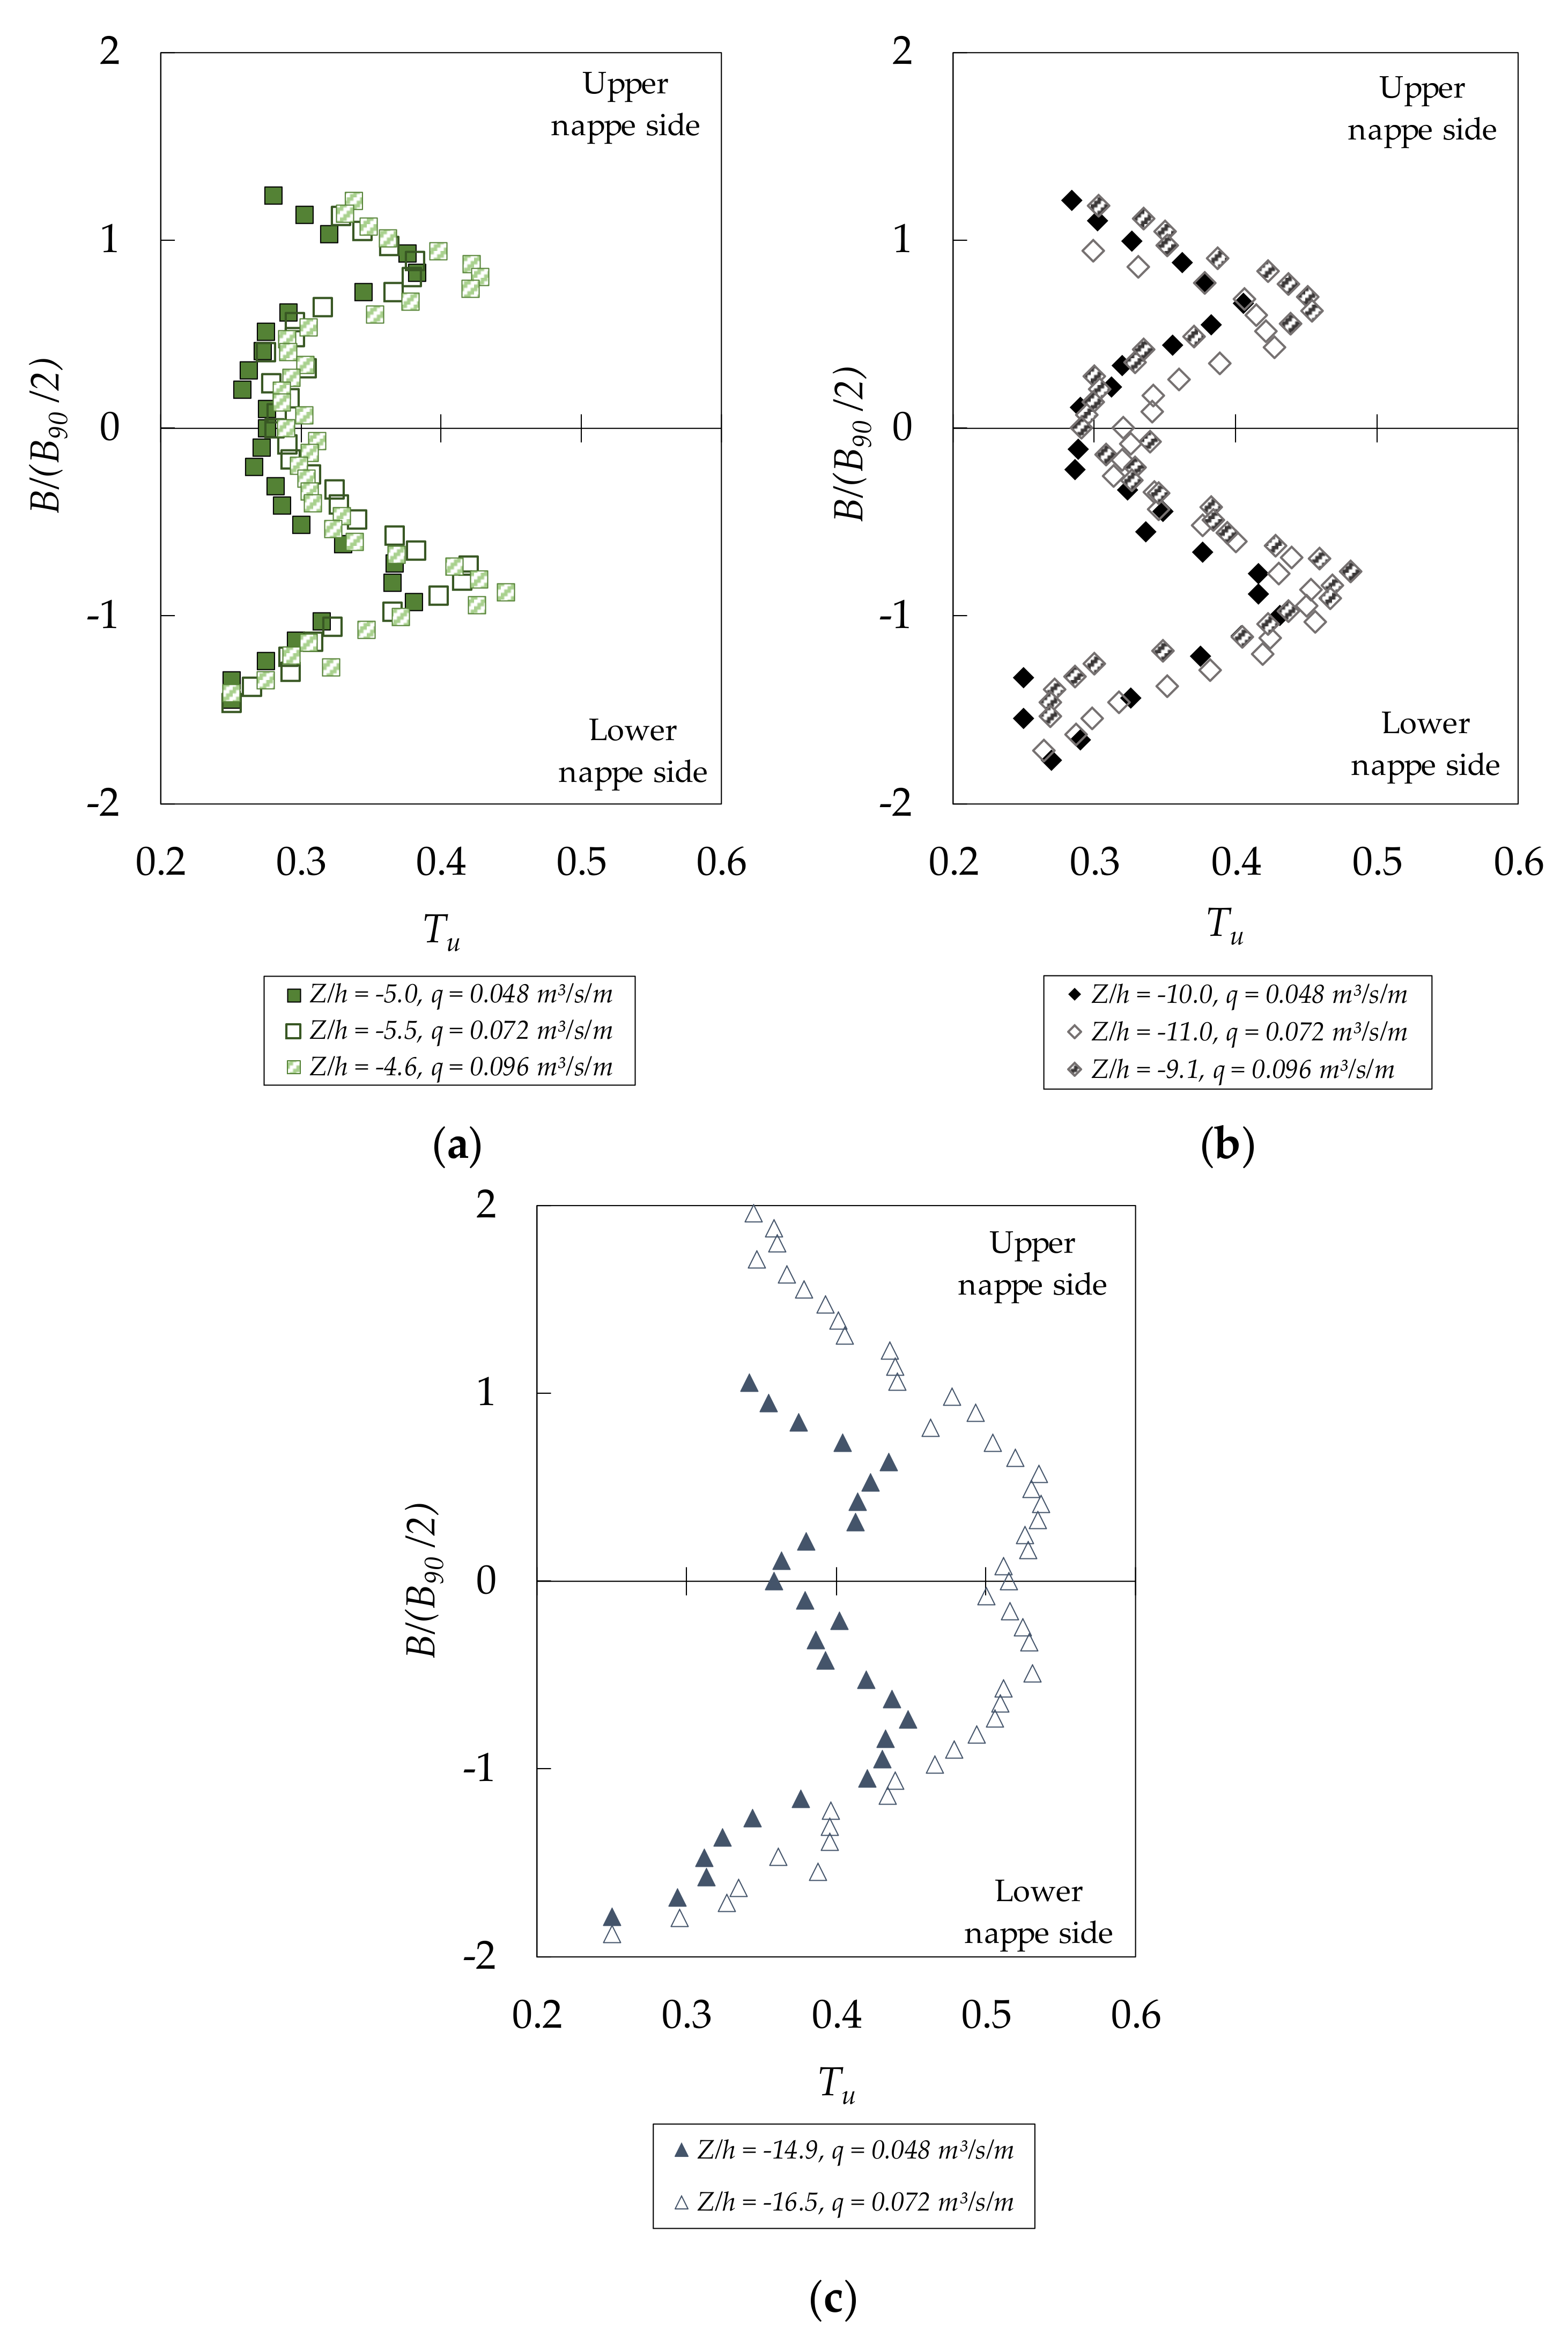
Figure 12 shows the turbulent intensity distribution as a function of the dimensionless distance from the center of the jet B/(B90/2). The Tu distribution is similar in the lower and intermediate falling distances (Figure 12a–c), with the maximum peaks obtained in the free surface of the jet in the upper and lower nappe sides. Among them, the maximum values tend to be slightly higher in the lower nappe side. Outside the B90 jet thickness, the turbulence intensity tends to reduce rapidly. As the air entrainment reaches the inner core of the jet, the differences between the center of the jet and the maximum peaks tend to reduce. In the furthest cross-sections from the weir crest (Z/h = −14.9 and −16.5), the differences in the turbulent intensity are more remarkable due to the differences observed in the phase change frequency F (see Figure 5c).
3.7. Characteristic Frequencies and Spectral Analysis
The power spectrum density (PSD) is defined as a decomposition of the frequency. The typical power spectra of the conductivity probe signals that were recorded at 20 kHz were obtained from the raw signal in the rectangular free-falling jets, analyzed with FFT (fast Fourier transform) spectral analyses.
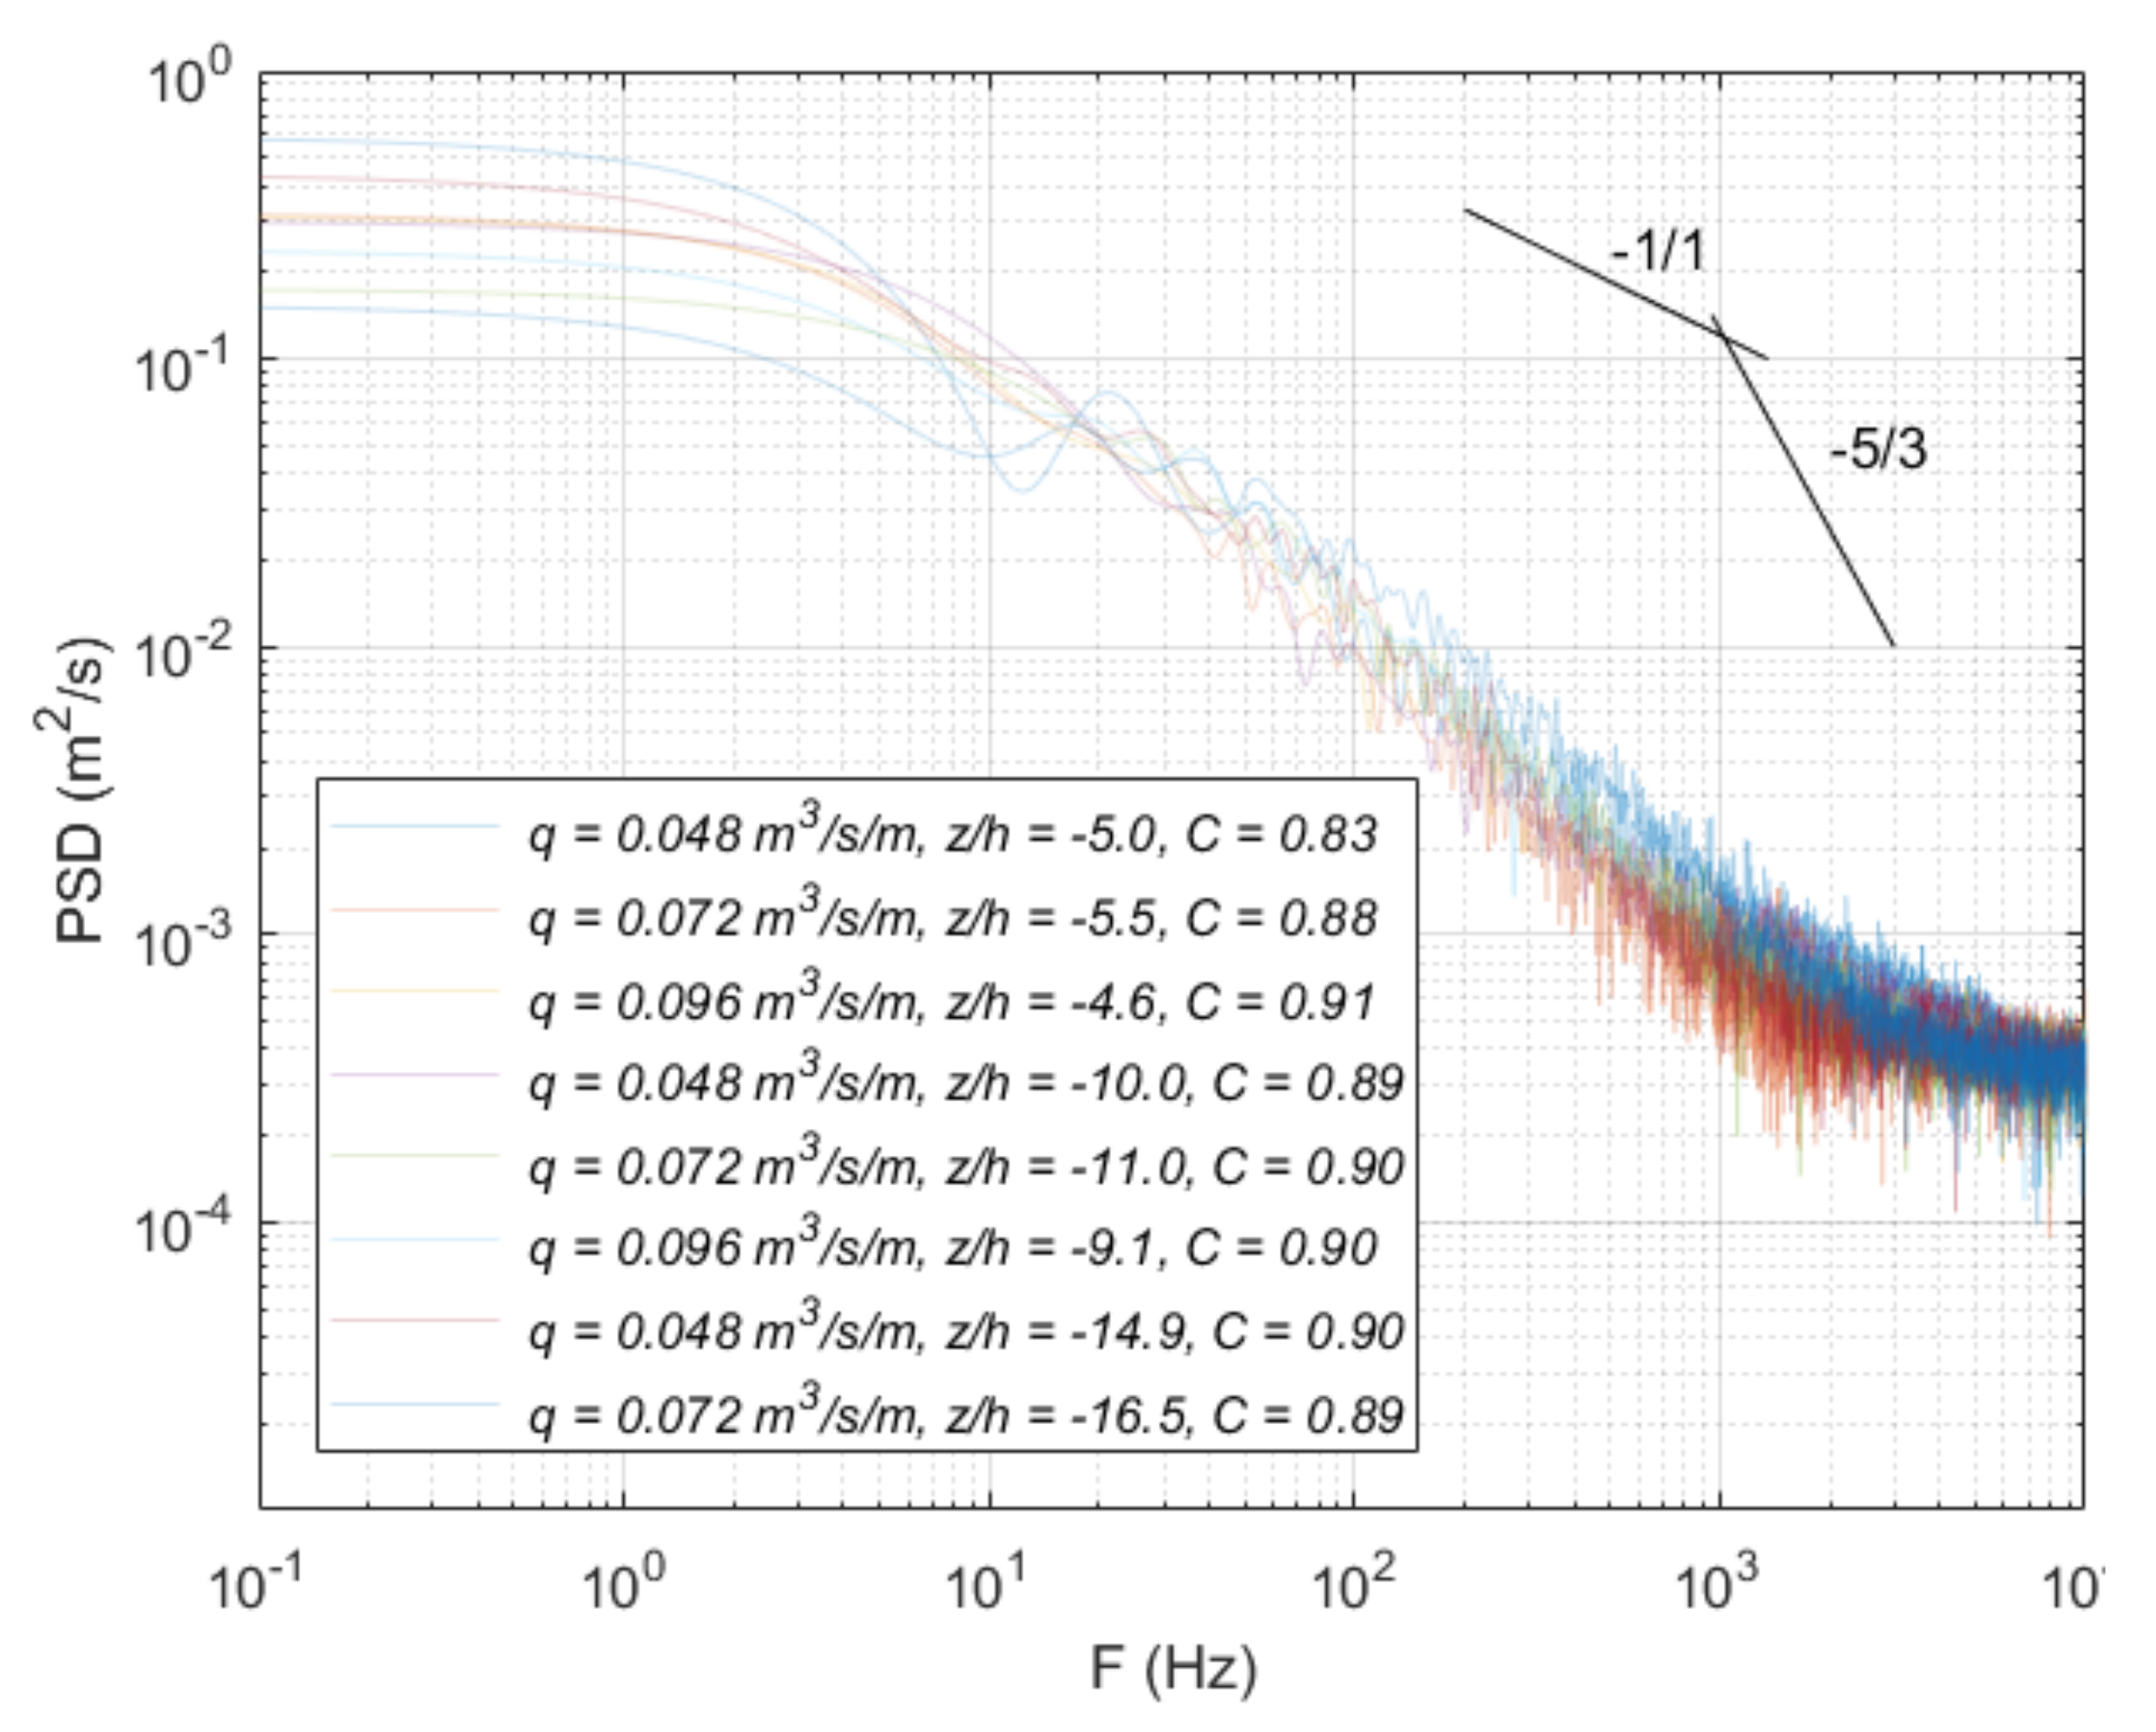
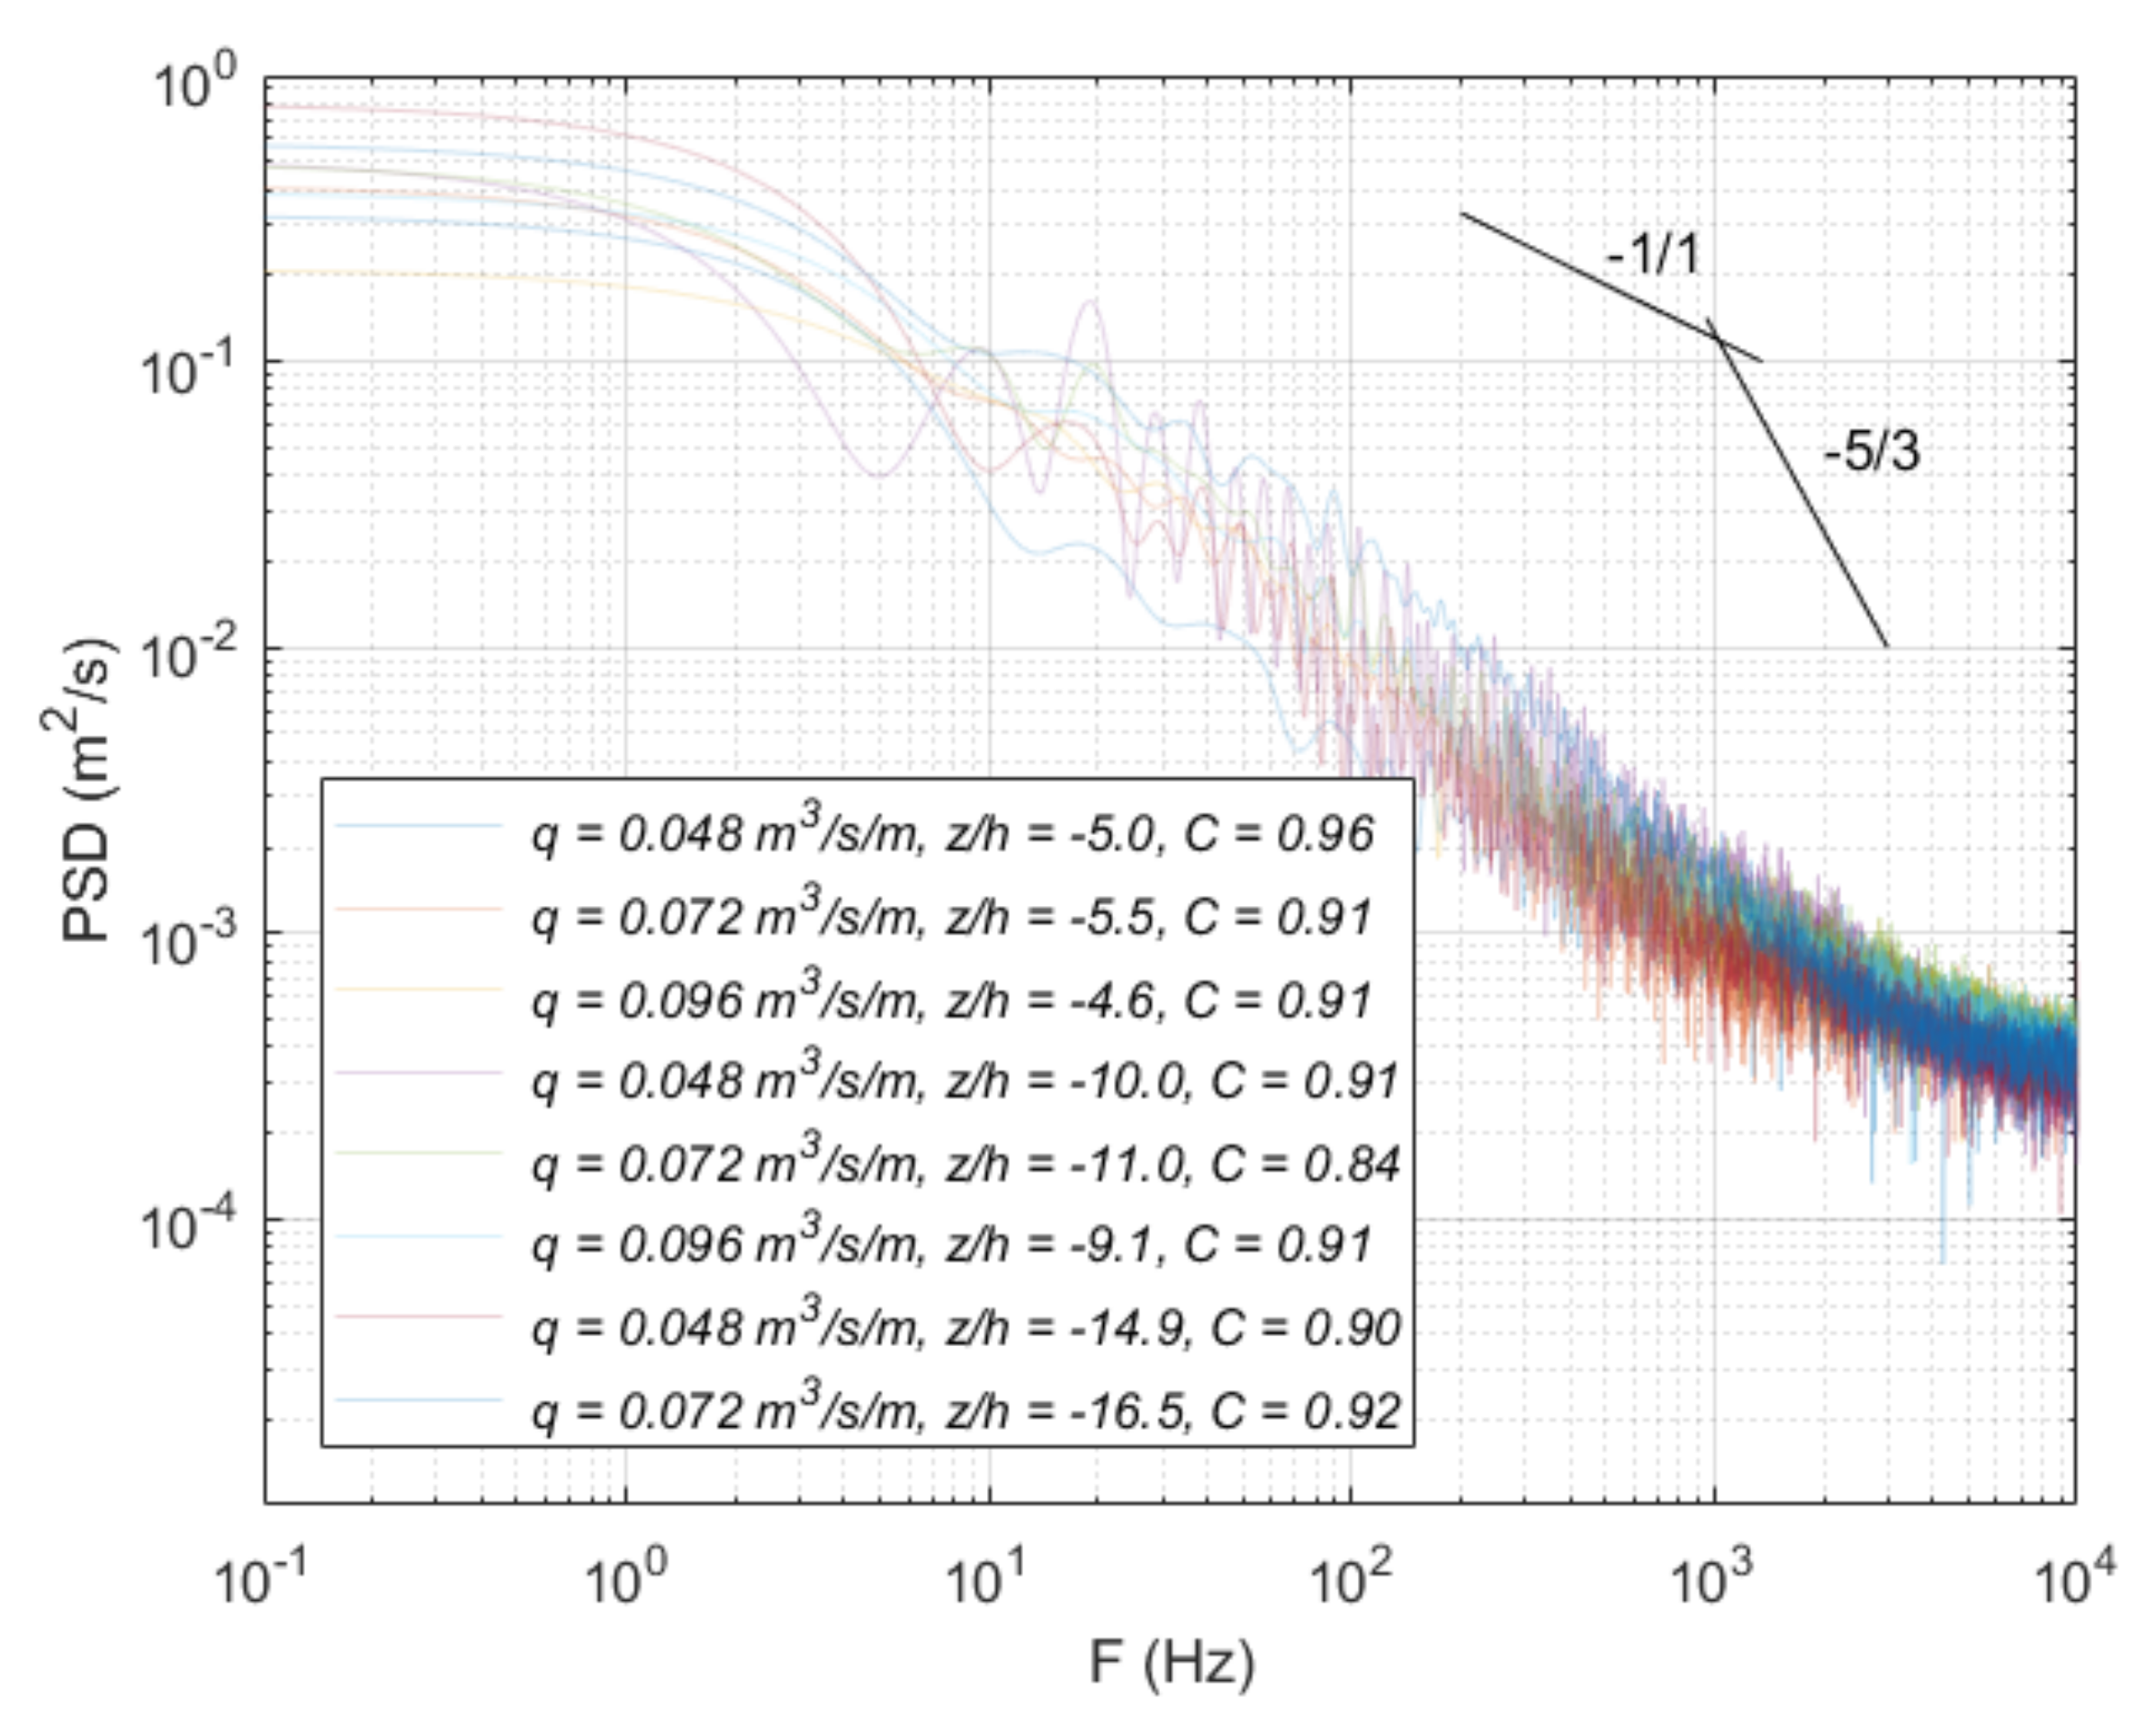
Figure 13 and Figure 14 show the power spectral density in different falling distances, corresponding to the upper and lower nappe sides, respectively. Independently of the normalized falling distance to the weir crest Z/h, similar behavior is found in the upper and lower nappe sides. For frequencies between 0.1 and 1 Hz, the power spectra density shows the higher values in each case. For frequencies between 101 and 103 Hz, the spectral curves show a rapid decay, with a quasi linear slope. This may be considered the viscous dissipation range. For frequencies higher than 103, the power spectral density tends to stabilize at the same PSD value. These values are similar to those obtained by Wang [36], who analyzed the power spectral density with a phase detection conductivity probe in hydraulic jumps.
4. Conclusions
Free surface aeration in rectangular free-falling jets may be considered an effect of the surface instabilities and turbulent fluctuations which act on the upper and lower free surfaces of the nappe jets. These processes affect the non-aerated inner core and change the flow properties (e.g., jet thickness and density of the mixture). A better knowledge of the air entrainment mechanism in rectangular free-falling jets will allow hydraulic engineers to know the flow characteristics of the impingement jets into the plunge pools.
To minimize possible scale effects, the jet flow conditions were selected with energy head over weir crest values between 0.08 and 0.131 m. For the minimum flow rate (q = 0.048 m3/s/m), the Weber number is close to 1103, and some scale effects may be expected to appear. However, comparing the results of the three specific flows, no significant variations have been observed. Hence, our findings may be considered exempt from systematic errors caused by surface tension.
The non-aerated inner core of the jet begins to disappear for falling distances Z/h larger than 10. The methodology proposed by Castillo et al. [14] for nappe jets seems to follow the jet thickness corresponding to the Cair = 0.90 during the fall, while the gravitational thickness seems to be similar to the jet thickness corresponding to the Cair = 0.10.
The maximum air–water phase count rates were obtained with void fractions between 0.35 and 0.70, and these maximum values tended to increase with the vertical distance to the weir crest. The higher frequencies in the cross-sections were observed near the free surfaces, and their values tended to increase with the falling distance. For vertical distances Z/h larger than −14.9–−16.5, the non-aerated inner core tended to disappear and the air–water phase change frequency in the inner core tended to increase. The parabolic relationship between the bubble frequency and the void fraction seems to have a relatively good fit in nappe jets, with the maximum F/Fmax values obtained around Cair = 0.40–0.60.
After a relative falling distance Z/h ≥ 10, the Sauter mean air bubble diameter tends toward a value of 0.1 mm in the center of the air–water jet. The non-dimensional falling distance seems to have no influence on the probability distribution functions of bubble sizes measured in the upper and lower nappe sides, with similar chord length distributions at both free surfaces of the falling jet.
The range of the turbulent intensities seems to be related to the dimensionless falling distances, increasing with the falling distance. The jet produces more spectral energy at low frequencies, with the dissipation range at intermediate frequencies (between 101 and 103). For frequencies higher than 103, the power spectral density tends to stabilize at the same value for all the considered registers. The behavior between the upper and lower nappe shows slight differences in the void fraction distribution, air–water phase count rates and Sauter mean air bubble diameter. However, no remarkable differences were observed in the spectral analysis.
Author Contributions
J.M.C. planned and managed the laboratory measurements, the data analysis and participated in the writing. P.R.O. carried out the laboratory measurements, the data treatment and participated in the writing. L.G.C. participated in the analysis of the results and in the writing. J.T.G. participated in the analysis of the results and in the writing. All authors have read and agreed to the published version of the manuscript.
Funding
This research was funded by the “Ministerio de Ciencia, Innovación y Universidades” (MCIU), the “Agencia Estatal de Investigación” (AEI) and the “Fondo Europeo de Desarrollo Regional” (FEDER), through the Project “La aireación del flujo en el vertido en lámina libre por coronación de presas a nivel de prototipo y su efecto en cuencos de disipación de energía”, grant number RTI2018-095199-B-I00, and by the “Comunidad Autónoma de la Región de Murcia” through the “Programa Regional de Fomento de la Investigación Científica y Técnica (Plan de Actuación 2018) de la Fundación Séneca-Agencia de Ciencia y Tecnología de la Región de Murcia”, Project “Análisis de la capacidad de descarga de vertederos tipo laberinto y de la disipación de energía aguas abajo de los mismos”, grant number 20879/PI/18.
Conflicts of Interest
The authors declare no conflict of interest.
References
- Federal Emergency Management Agency. FEMA. P-1015 Technical Manual: Overtopping Protection for Dams; US Department of Homeland Security: Washington, DC, USA, 2014. Available online: https://www.fema.gov/es/media-library/assets/documents/97888 (accessed on 21 June 2020).
- Wahl, T.L.; Frizell, K.H.; Cohen, E.A. Computing the trajectory of free jets. J. Hydraul. Eng. 2008, 134, 256–260. [Google Scholar] [CrossRef] [Green Version]
- Chanson, H. Air Bubble Entrainment in Free-Surface Turbulent Shear Flows; Academic Press: London, UK, 1997; p. 401. [Google Scholar]
- Wood, I.R. Air Entrainment in Free-Surface Flows; International Association for Hydro-Environment Engineering and Research: Madrid, Spain, 1991. [Google Scholar]
- Boes, R.M. Zweiphasenströmung und Energieumsetzung an Grosskaskaden (Two-Phase Flow and Energy Dissipation on Cascades). Ph.D. Thesis, VAW-ETH, Zürich, Switzerland, 2000. (In German). [Google Scholar]
- Anderson, A.A.; Tullis, B.P. Finite crest length weir nappe oscillation. J. Hydraul. Eng. 2018, 144, 04018020. [Google Scholar] [CrossRef]
- Castillo, L.; Carrillo, J.M.; Blázquez, A. Plunge pool mean dynamic pressures: A temporal analysis in nappe flow case. J. Hydraul. Res. 2015, 53, 101–118. [Google Scholar] [CrossRef]
- Ervine, D.A.; Falvey, H. Behaviour of turbulent jets in the atmosphere and plunge pools. Proc. Inst. Civ. Eng. 1987, 83, 295–314. [Google Scholar] [CrossRef]
- Ervine, D.A.; Falvey, H.; Withers, W.A. Pressure fluctuations on plunge pool floors. J. Hydraul. Res. 1997, 35, 257–279. [Google Scholar] [CrossRef]
- Chanson, H.; Toombes, L. Air-Water Flows down Stepped chutes: Turbulence and Flow Structure Observations. Int. J. Multiph. Flow 2002, 28, 1737–1761. [Google Scholar] [CrossRef] [Green Version]
- Bertola, N.; Wang, H.; Chanson, H. A physical study of air-water flow in planar plunging water jet with large inflow distance. Int. J. Multiph. Flow 2017, 100, 155–171. [Google Scholar] [CrossRef] [Green Version]
- Horeni, P. Disintegration of a Free Jet of Water in Air; Vyzkumny Ustav Vodohospodarsky Prace a Studie: Praha, Czech Republic, 1956. (In Czech) [Google Scholar]
- Castillo, L. Aerated jets and pressure fluctuation in plunge pools. In Proceedings of the Seventh International Conference on Hydroscience and Engineering; Piasecki, M., Ed.; College of Engineering, Drexel University: Philadelphia, PL, USA, 2006; pp. 1–23. [Google Scholar]
- Carrillo, J.M. Metodología Numérica y Experimental para el Diseño de los Cuencos de Disipación en el Sobrevertido de Presas de Fábrica. Ph.D. Thesis, Universidad Politécnica de Cartagena, Murcia, Spain, 2014. (In Spanish). [Google Scholar] [CrossRef] [Green Version]
- Castillo, L.; Carrillo, J.M.; Sordo-Ward, A. Simulation of overflow nappe impingement jets. J. Hydroinform. 2014, 16, 922–940. [Google Scholar] [CrossRef] [Green Version]
- Carrillo, J.M.; Castillo, L.G.; Marco, F.; García, J.T. Characterization of two-phase flows in plunge pools. In Proceedings of the 7th IAHR International Symposium on Hydraulic Structures, Aachen, Germany, 15–18 May 2018. [Google Scholar] [CrossRef]
- Carrillo, J.M.; Castillo, L.G.; Marco, F.; García, J.T. Experimental and numerical analysis of two-phase flows in plunge pools. J. Hydraul. Eng. 2020. [Google Scholar] [CrossRef] [Green Version]
- Carrillo, J.M.; Ortega, P.R.; Castillo, L.G.; García, J.T. Air entrainment in rectangular free falling jets. In Proceedings of the 8th IAHR International Symposium on Hydraulic Structures 2020, Santiago, Chile, 12–15 May 2020. [Google Scholar] [CrossRef]
- Chanson, H. Air bubble entrainment in open channels. Flow structure and bubble size distributions. Int. J. Multiph. Flow 1997, 23, 193–203. [Google Scholar] [CrossRef] [Green Version]
- Chanson, H. Air-water Flows in Water Engineering and Hydraulic Structures. Basic Processes and Metrology. In Proceedings of the Hydraulics of Dams and River Structures, London, UK; CRC Press: Boca Raton, FL, USA, 2004; pp. 3–16. ISBN 90 5809 632. [Google Scholar]
- Matos, J.; Frizell, K.H.; André, S.; Frizell, K.W. On the performance of velocity measurement techniques in air-water flows. In Proceedings of the Hydraulic Measurements and Experimental Methods, Estes Park, CO, USA, 28 July–1 August 2002; pp. 130–140. [Google Scholar]
- Toombes, L. Experimental Study of Air-Water Flow Properties on Low-Gradient Stepped Cascades. Ph.D. Thesis, School of Civil Engineering, The University of Queensland, St Lucia, Australia, 2002. Available online: https://espace.library.uq.edu.au/view/UQ:9270 (accessed on 21 June 2020).
- Scimemi, E. Sulla forma delle vene tracimanti. L’Energ. Elettr. 1931, 7, 293–305. (In Italian) [Google Scholar]
- Chanson, H. Turbulent air-water flows in hydraulic structures: Dynamic similarity and scale effects. Environ. Fluid. Mech. 2009, 9, 125–142. [Google Scholar] [CrossRef] [Green Version]
- Heller, V. Scale effects in physical hydraulic engineering models. J. Hydraul. Res. 2011, 49, 293–306. [Google Scholar] [CrossRef]
- Chanson, H. Velocity measurements within high velocity air-water jets. J. Hydraul. Res. 1993, 31, 365–382. [Google Scholar] [CrossRef] [Green Version]
- Toombes, L.H.; Chanson, H. Free-surface aeration and momentum exchange at a bottom outlet. J. Hydraul. Res. 2007, 45, 100–110. [Google Scholar] [CrossRef]
- Pfister, M.; Schwindt, S. Air concentration distribution in deflector jets. In Proceedings of the 5th IAHR International Symposium on Hydraulic Structures, Brisbane, Australia, 25–27 June 2014; pp. 1–8. [Google Scholar] [CrossRef] [Green Version]
- Felder, S. Air-Water Flow Properties on Stepped Spillways for Embankment Dams: Aeration, Energy Dissipation and Turbulence on Uniform, Non-Uniform and Pooled Stepped Chutes. Ph.D. Thesis, School of Civil Engineering, The University of Queensland, St Lucia, Australia, 2013. Available online: https://espace.library.uq.edu.au/view/UQ:301329 (accessed on 21 June 2020).
- André, S.; Boillat, J.L.; Schleiss, A.J. Discussion of “Two-phase flow characteristics of stepped spillways” by Robert M. Boes and Willi H. Hager. J. Hydraul. Eng. 2005, 131, 423–427. [Google Scholar]
- Brattberg, T.; Toombes, L.; Chanson, H. Developing air-water shear layers of two-dimensional water jets discharging into air. In Proceedings of the ASME Fluids Engineering Division Summer Meeting (FEDSM’98), Washington, DC, USA, 21–25 June 2008. [Google Scholar]
- Clift, R.; Grace, J.R.; Weber, M.E. Bubbles, Drops and Particles; Academic Press: New York, NY, USA, 1978. [Google Scholar]
- Chanson, H.; Carosi, G. Advanced post-processing and correlation analyses in high-velocity air-water flows. Environ. Fluid Mech. 2007, 7, 495–508. [Google Scholar] [CrossRef] [Green Version]
- Felder, S.; Chanson, H. Phase-detection probe measurements in high-velocity free-surface flows including a discussion of key sampling parameters. Exp. Therm. Fluid Sci. 2014, 61, 66–78. [Google Scholar] [CrossRef]
- Herringe, R.A.; Davis, M.R. Structural development of gas-liquid mixture flows. J. Fluid Mech. 1976, 73, 97–123. [Google Scholar] [CrossRef]
- Wang, H. Turbulence and Air Entrainment in Hydraulic Jumps. Ph.D. Thesis, School of Civil Engineering, The University of Queensland, St Lucia, Australia, 2014. Available online: https://espace.library.uq.edu.au/view/UQ:345033 (accessed on 21 June 2020).
Figure 1.
Spreading of a rectangular free-falling jet in the atmosphere. Adapted from Ervine and Falvey [8].
Figure 1.
Spreading of a rectangular free-falling jet in the atmosphere. Adapted from Ervine and Falvey [8].

Figure 2.
Conductivity probe designed and developed at Universidad Politécnica de Cartagena: (a) conductivity probe, Ø = 0.25 mm; (b) scheme of the probe location; (c) evolution of the void fraction during the test; (d) number of bubbles accumulated by the probe sensor.
Figure 2.
Conductivity probe designed and developed at Universidad Politécnica de Cartagena: (a) conductivity probe, Ø = 0.25 mm; (b) scheme of the probe location; (c) evolution of the void fraction during the test; (d) number of bubbles accumulated by the probe sensor.

Figure 3.
Void fraction distributions as a function of the dimensionless jet thickness B/(B90/2): (a) for Z/h around −5.0; (b) for Z/h around −10.0; (c) for Z/h around −15.0.
Figure 3.
Void fraction distributions as a function of the dimensionless jet thickness B/(B90/2): (a) for Z/h around −5.0; (b) for Z/h around −10.0; (c) for Z/h around −15.0.

Figure 4.
Evolution of the dimensionless thickness of the jet during the fall for q = 0.048, 0.072 and 0.096 m3/s/m (q = 0.048 and 0.072 m3/s/m, data obtained from Carrillo et al. [18]).
Figure 4.
Evolution of the dimensionless thickness of the jet during the fall for q = 0.048, 0.072 and 0.096 m3/s/m (q = 0.048 and 0.072 m3/s/m, data obtained from Carrillo et al. [18]).

Figure 5.
Phase change count rate F as a function of the dimensionless jet thickness B/(B90/2): (a) for Z/h around −5.0; (b) for Z/h around −10.0; (c) for Z/h around −15.0.
Figure 5.
Phase change count rate F as a function of the dimensionless jet thickness B/(B90/2): (a) for Z/h around −5.0; (b) for Z/h around −10.0; (c) for Z/h around −15.0.

Figure 6.
Dimensionless air–water phase frequency F/Fmax as a function of the void fraction C.

Figure 7.
Sauter mean diameter in rectangular free-falling jets.

Figure 8.
Cumulative probability of air bubble chord lengths in the upper and lower interfaces of rectangular free-falling jets for q = 0.048 m3/s/m, Z/h = −5.0; q = 0.072 m3/s/m, Z/h = −5.5; and q = 0.096 m3/s/m, Z/h = −4.6.
Figure 8.
Cumulative probability of air bubble chord lengths in the upper and lower interfaces of rectangular free-falling jets for q = 0.048 m3/s/m, Z/h = −5.0; q = 0.072 m3/s/m, Z/h = −5.5; and q = 0.096 m3/s/m, Z/h = −4.6.

Figure 9.
Cumulative probability of air bubble chord lengths in the upper and lower interfaces of rectangular free-falling jets for q = 0.048 m3/s/m, Z/h = −10.0; q = 0.072 m3/s/m, Z/h = −11.0; and q = 0.096 m3/s/m, Z/h = −9.1.
Figure 9.
Cumulative probability of air bubble chord lengths in the upper and lower interfaces of rectangular free-falling jets for q = 0.048 m3/s/m, Z/h = −10.0; q = 0.072 m3/s/m, Z/h = −11.0; and q = 0.096 m3/s/m, Z/h = −9.1.

Figure 10.
Cumulative probability of air bubble chord lengths in the upper and lower interfaces of rectangular free-falling jets for q = 0.048 m3/s/m, Z/h = −14.9; and q = 0.072 m3/s/m, Z/h = −16.5.
Figure 10.
Cumulative probability of air bubble chord lengths in the upper and lower interfaces of rectangular free-falling jets for q = 0.048 m3/s/m, Z/h = −14.9; and q = 0.072 m3/s/m, Z/h = −16.5.

Figure 11.
Dimensionless relationship between turbulence intensity and air–water phase count rate in rectangular free-falling jets: (a) q = 0.048 m3/s/m; (b) q = 0.072 m3/s/m; (c) q = 0.096 m3/s/m.
Figure 11.
Dimensionless relationship between turbulence intensity and air–water phase count rate in rectangular free-falling jets: (a) q = 0.048 m3/s/m; (b) q = 0.072 m3/s/m; (c) q = 0.096 m3/s/m.

Figure 12.
Dimensionless relationship between turbulence intensity Tu and B/(B90/2) in rectangular free-falling jets: (a) q = 0.048 m3/s/m, Z/h = −5.0; q = 0.072 m3/s/m, Z/h = −5.5; and q = 0.096 m3/s/m, Z/h = −4.6; (b) q = 0.048 m3/s/m, Z/h = −10.0; q = 0.072 m3/s/m, Z/h = −11.0; and q = 0.096 m3/s/m, Z/h = −9.1; (c) q = 0.048 m3/s/m, Z/h = −14.9; and q = 0.072 m3/s/m, Z/h = −16.5.

Figure 13.
Spectral analysis of the fluctuations of the conductivity probe signal in the upper nappe of the rectangular free-falling jet for different falling distances between −4.6 < Z/h < −16.5.
Figure 13.
Spectral analysis of the fluctuations of the conductivity probe signal in the upper nappe of the rectangular free-falling jet for different falling distances between −4.6 < Z/h < −16.5.

Figure 14.
Spectral analysis of the fluctuations of the conductivity probe signal in the lower nappe of the rectangular free-falling jet for different falling distances between −4.6 < Z/h < −16.5.
Figure 14.
Spectral analysis of the fluctuations of the conductivity probe signal in the lower nappe of the rectangular free-falling jet for different falling distances between −4.6 < Z/h < −16.5.


Table 1.
Experimental tests and issuance flow conditions.
| Specific Flow, q (m3/s/m) | Energy Head over the Weir Crest, h (m) | Velocity at Initial Condition, Vi (m/s) | Reynolds Number at the Initial Condition, Re (-) | Weber Number at the Initial Condition, We (-) | Maximum Measurable Free-Falling Distance Ratio, Z/h (-) |
|---|---|---|---|---|---|
| 0.048 | 0.080 | 1.78 | 47,148 | 1162 | −21.3 |
| 0.072 | 0.109 | 2.07 | 70,721 | 2029 | −15.6 |
| 0.096 | 0.131 | 2.25 | 94,202 | 2940 | −13.0 |
© 2020 by the authors. Licensee MDPI, Basel, Switzerland. This article is an open access article distributed under the terms and conditions of the Creative Commons Attribution (CC BY) license (http://creativecommons.org/licenses/by/4.0/).
Share and Cite
MDPI and ACS Style
Carrillo, J.M.; Ortega, P.R.; Castillo, L.G.; García, J.T. Experimental Characterization of Air Entrainment in Rectangular Free Falling Jets. Water 2020, 12, 1773. https://0-doi-org.brum.beds.ac.uk/10.3390/w12061773
AMA Style
Carrillo JM, Ortega PR, Castillo LG, García JT. Experimental Characterization of Air Entrainment in Rectangular Free Falling Jets. Water. 2020; 12(6):1773. https://0-doi-org.brum.beds.ac.uk/10.3390/w12061773
Chicago/Turabian StyleCarrillo, José M., Patricio R. Ortega, Luis G. Castillo, and Juan T. García. 2020. "Experimental Characterization of Air Entrainment in Rectangular Free Falling Jets" Water 12, no. 6: 1773. https://0-doi-org.brum.beds.ac.uk/10.3390/w12061773
Note that from the first issue of 2016, this journal uses article numbers instead of page numbers. See further details here.