Article

Sorption Characteristics and Removal Efficiency of Organic Micropollutants in Drinking Water Using Granular Activated Carbon (GAC) in Pilot-Scale and Full-Scale Tests

1
Department of Aquatic Sciences and Assessment, Swedish University of Agricultural Sciences (SLU), SE-75007 Uppsala, Sweden
2
Chemical Engineering Department, Federal University of Amazonas (UFAM), Avenida General Rodrigo Octavio, 69067-005 Manaus, Amazonas, Brazil
3
Veolia Water Technologies, Process Department, Vretenvägen 9, 171 54 Solna, Sweden
4
Norrvatten, Skogsbacken 6, 17241 Sundyberg, Sweden
*
Author to whom correspondence should be addressed.
Submission received: 30 June 2020 / Revised: 16 July 2020 / Accepted: 16 July 2020 / Published: 19 July 2020
(This article belongs to the Special Issue Drinking Water Treatment Optimization: Challenges and Innovations)

Abstract

:
Granulated active carbon (GAC) is commonly used as a chemical barrier for the removal of organic micropollutants (OMPs) in drinking water treatment plants (DWTPs). However, little is known about the impact of dissolved organic carbon (DOC) and its long-term performance with regard to OMP removal efficiency. This study examined the performance of two GAC types (Norit 830W and Filtrasorb 400) in the removal of OMPs and DOC from natural lake water, in pilot-scale and full-scale tests run for almost one year. Potential early warning indicators of the exhaustion of GAC sorption capacity were also evaluated. The seven OMPs investigated (carbamazepine, lamotrigine, cetirizine, fexofenadine, oxazepam, fluconazole and N,N-diethyl-meta-toluamide (DEET)) all showed decreasing removal efficiencies after ~20,000 bed volumes (BV) in the pilot-scale Norit 830W and Filtrasorb 400 columns. However, columns with an 18-min empty bed contact time (EBCT) showed better performances than columns with 6-min EBCT. DEET was the OMP adsorbed most weakly. We found that DOC concentrations, methylene blue sorption kinetics, UV and fluorescence did not sufficiently explain the OMP breakthrough in the GAC columns. We concluded that carbamazepine, lamotrigine and fexofenadine can be used as indicators of decreasing GAC adsorption performance, due to their later breakthrough. Based on the results, UV and fluorescence removal could be used for the early detection of declining DOC removal, and online solid-phase extraction (SPE)–liquid chromatography–tandem mass spectrometry (SPE-LC-MS/MS) could be used for the early detection of OMPs in drinking water.

Graphical Abstract

1. Introduction

Climate change and water scarcity, in combination with urbanization, will increase the need for water re-use in many regions of the world [1]. Scientific studies have reported the ongoing contamination of aquatic environments with organic micropollutants (OMPs), such as pharmaceuticals, personal care products, illicit drugs and pesticides [2,3]. Pharmaceuticals are continuously excreted or discarded into sewer systems, in the form of unaltered parent compounds or their metabolites [4]. These often end up in environmental waters, as a consequence of incomplete removal by wastewater treatment plants (WWTPs) [5]. The continuous introduction of persistent OMPs into the aqueous environment may cause toxic effects on aquatic organisms, and result in a loss of biodiversity and ecosystem functioning in the water bodies. The increased detection of a wide range of OMPs in the aquatic environment demonstrates the limitations of conventional WWTPs in removing these compounds [3,4,5]. The presence of OMPs in drinking water is related to their presence in the aqueous environment. Conventional drinking water plants (DWTPs) feature multistage treatments, including coagulation/flocculation, clarification and filtration. These are followed by disinfection, which may be further augmented by advanced treatments such as activated carbon, membrane filtrations, ozone oxidation, or advanced oxidation processes [6,7,8,9,10].
Granulated activated carbon (GAC) is currently the most economical and widely used material for the removal of OMPs during drinking and wastewater water treatment [6,7,8,9]. GAC has the advantage of a high surface area, an affinity to a broad spectrum of organic molecules, and cost-effectiveness. Additionally, GAC adsorption is easier to scale up, operate and control than other separation methods. Adsorption using GAC is frequently applied in removing natural or synthetic organic compounds in DWTPs [7,10]. Many laboratory-based studies have investigated the removal of OMPs using GAC, typically at high spiked concentrations [6,7], but few studies in the literature have examined the removal of OMPs in full-scale DWTPs for natural raw water [6,9,11].
Previous studies have investigated the sorption characteristics of OMPs into GAC, in order to better predict the breakthrough of OMPs in GAC filtration [6,7]. Brunauer–Emmett–Teller (BET) (i.e., surface area, iodine number and aniline number) and the methylene blue number have been used to predict breakthroughs of OMPs [9,11], but they are not suitable markers for predicting the sorption of pharmaceuticals to GAC [9,12]. Mailler [13] studied six of the physical-chemical properties of 26 pharmaceuticals in a large-scale powdered activated carbon (PAC) pilot plant, using real wastewater, and found that the molecular charge of the pharmaceuticals was the most important property influencing adsorption. Mailler et al. [13] also found that the presence of organic matter was an important factor, due to its competition with pharmaceuticals for adsorption onto PAC, but it was insufficient to explain the adsorption performance. Other studies have shown the negative effect of organic matter on OMP removal efficiency [14,15]. This is alarming, since many Nordic countries derive their drinking water from surface waters with relatively high organic matter concentrations (dissolved organic carbon (DOC) >10 mg L−1) [14,15].
Raw water from lakes and streams may occasionally face accidental inputs of, for example, wastewater, due to the malfunctioning of storage dams or stormwater runoff [16]. In such situations, there is a need for fast detection of OMPs and estimates of their breakthrough during full-scale treatment in DWTPs. On-line solid-phase extraction (SPE)–liquid chromatography–tandem mass spectrometry (SPE-LC-MS/MS) could be a good option for the fast and sensitive analysis of OMPs in water [17,18], avoiding the time-consuming pre-concentration and clean-up steps of sample preparation [19,20].
The main aim of the present study was to investigate the sorption characteristics and removal efficiency of OMPs and DOC from organic matter-rich lake water, using two types of GAC, in pilot-scale and full-scale drinking water treatment processes. The GAC breakthrough behavior of seven OMPs was studied over almost a year, using the online SPE-LC-MS/MS method.

2. Material and Methods

2.1. Chemicals and Reagents

Seven OMPs were analyzed: two antiepileptic drugs (carbamazepine and lamotrigine), two antihistamines (cetirizine and fexofenadine), one antidepressant (oxazepam), one antifungal drug (fluconazole) and one pesticide (N,N-diethyl-meta-toluamide (DEET)) (Table 1, Table S1 in Supplementary Information (SI)). These OMPs were selected for analysis as they are frequently detected in raw water. All analytical standards were of high purity grade (>95%). Native analytical standards were purchased from Sigma-Aldrich (Stockholm, Sweden). Isotopically labeled internal standards (ISs) were purchased from Teknolab AB (Kungsbacka, Sweden) and Toronto Research Chemicals (Toronto, ON, Canada). Detailed information (CAS number, molecular formula, molecular weight and log Kow value) of the OMP reagents used is provided elsewhere [19].
Ultrapure water was produced by a Milli-Q Advantage Ultrapure Water purification system and filtered through a 0.22-μm Millipak Express membrane and an LC-Pak® polishing unit (Merck Millipore, Billercia, MA, USA). Methanol, acetonitrile and ammonium acetate were all of high-performance liquid chromatography (HPLC)-grade and purchased from Sigma-Aldrich (Stockholm, Sweden).

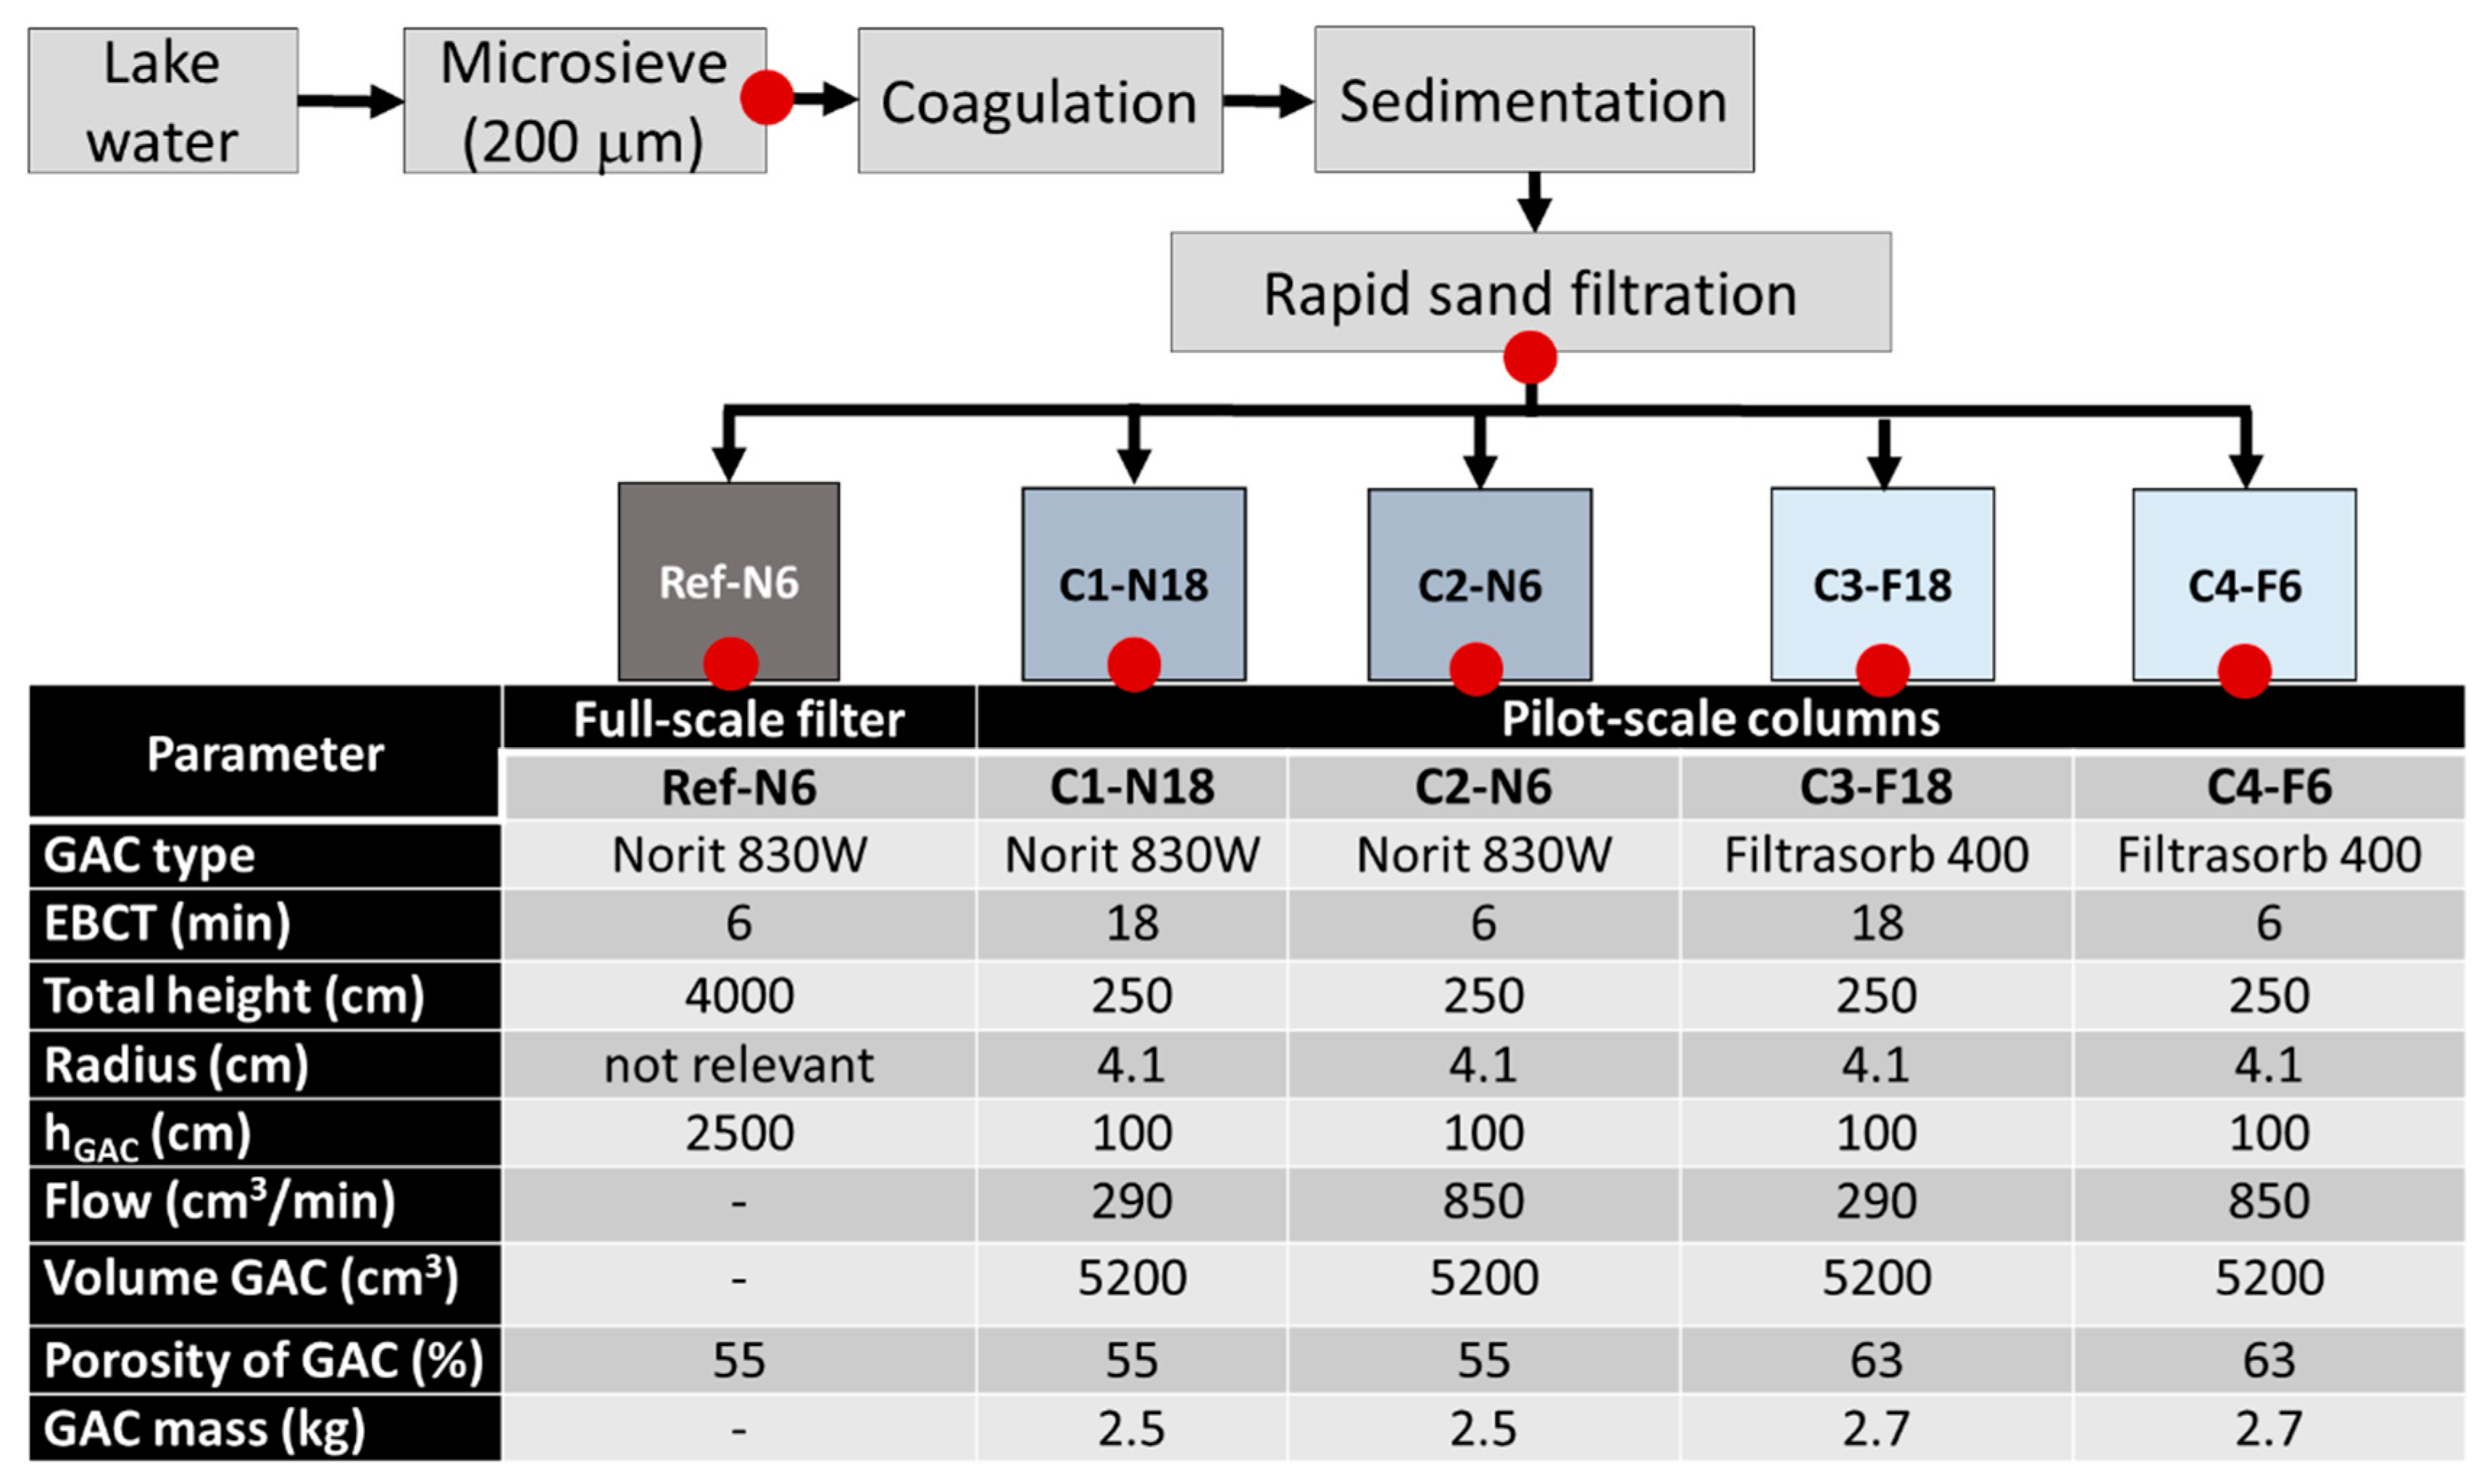
2.2. Full-Scale GAC Treatment at a DWTP

The GAC treatment technique was investigated at Görväln DWTP, which takes its raw water from part of Lake Mälaren, Sweden. The treatment steps at this DWTP comprise a microsieve filter (pore size 200 µm), followed by coagulation using aluminum sulfate (Al2(SO4)3; dose 35–80 mg L−1 depending on raw water quality), sedimentation, and then rapid sand filtration (4–7 m h−1), whereby residual flocs are removed. After rapid sand filtration, the water passes through 10 GAC filters (Norit 830W) for empty bed contact times (EBCTs) of 5–6 min (20–25 m h−1). The GAC filters are currently operated as biologically active carbon filters with a running time of 13 years, with the main function of removing taste and odor compounds, as OMP concentrations in the incoming raw water are considered too low to be a human health concern. In this study, we sampled the filtrate of the oldest GAC filter at Görväln DWTP (Ref-N6, Norit 830W, installed 2004) between June 2017 and March 2018. Data on total organic carbon (TOC), water temperature and flow of the incoming raw water during the whole study period are provided in Figure S1. For OMP analysis, water samples were collected after microsieve filtration (n = 11), after rapid sand filtration (n = 11), and after the GAC treatment (n = 11) (Figure 1, Table S1). All samples for OMP analysis were collected in high-density polyethylene (HDPE) bottles and frozen (−20 °C) until analysis.

2.3. Pilot-Scale GAC Column Tests at a DWTP

Four GAC column filters (approximately 2.5 m high, 9 cm diameter; Figure 1) were filled with a 1-m layer of GAC (2.5 kg, V = 5200 cm3) of one of two types (Norit 830W (N-) and Filtrasorb 400 (F-)) and subjected to a hydraulic load of 8.0 m h−1 (6 min EBCT) or 2.7 m h−1 (18 min EBCT) as described previously [14]. All GAC columns (C1–C4) were fed from the top with water from the full-scale rapid sand filtration unit at the DWTP (see Section 2.2). Two EBCTs were tested: ~6 min (column C2 with Norit 830W, contact time 6 min (treatment C2–N6) and column C4 filled with Filtrasorb 400, contact time 6 min (treatment C4-F6)) and 18 min (treatments C1-N18 and C3-F18), at flow rates of 0.29 and 0.85 L min−1, respectively. The DOC concentration was monitored from April 2017 to March 2018. For OMP analysis, samples were collected monthly between June 2017 and March 2018 (total n = 11 per column) in HDPE bottles and frozen (−20 °C) until analysis. The C2-N6 column was only used between June and September 2017, due to difficulties with maintenance, and therefore only methylene blue results are shown for this column. All columns were backwashed bi-weekly using a 20–30% bed expansion.

2.4. Organic Matter Quantification and Characterization

Water samples were filtered (pre-combusted glass microfiber filters (GF/F) with 0.7-µm nominal pore size) and analyzed for DOC using a TOC-VCPH carbon analyzer (Shimadzu) with a measurement error of ±0.3 mg C L−1 and a resulting coefficient of variation (CV) below 2% (for details see [21]).
Ultraviolet (UV) absorbance by filtered samples was measured using an AvaSpec-ULS3648 high-resolution spectrometer (Avantes) and a quartz cuvette (5 cm, wavelength range: 200–1100 nm; resolution: 0.34 nm). The spectra of potassium phthalate standard (KHP) at 10 mg C L−1 were analyzed every three samples, to monitor instrument drift.
Fluorescence excitation emission matrices (EEMs) by filtered samples were analyzed using an Aqualog spectrofluorometer (Horiba Jobin Yvon) with a flow-through quartz cuvette (1 cm, excitation and emission wavelength range 240–450 nm and 212–620 nm, respectively; resolution 3 nm) and corrected as described by Lavonen et al. [15].
The percentage decrease in the fluorescence signal of the rapid sand filtration effluent and of the pilot-scale column effluents (C1-N18, C3-F18, C4-F6) was calculated as explained elsewhere [14].

2.5. Methylene Blue Kinetic Experiments

Methylene blue kinetic adsorption experiments were performed on GAC collected from all four test columns (i.e., C1-N18, C2-N6, C3-F18 and C4-F6) at different numbers of bed volumes (BV, from 250 to 12700, 3–4 replicates) in order to investigate possible correlations between GAC saturation state, with respect to both DOC and OMPs (at full- and pilot-scale), and laboratory-based methylene blue uptake rates. Instead of using batch methylene blue equilibrium experiments, we examined the kinetically controlled methylene blue sorption to GAC under fixed conditions during an experimental period of 30 min. After a thorough pre-study of optimal experimental conditions, we chose an initial methylene blue concentration of 10 mg L−1 at a fixed pH (7.0 ± 0.3, maintained using sodium carbonate (Na2CO3), 5 mmol L−1) and at room temperature, using a solid/liquid ratio of 3.33 (mg methylene blue/g GAC). A flow-through photometer system was connected via a peristaltic pump to a titration vessel, which was continuously mixed using a Teflon-coated floating stirring bar to avoid grinding of GAC particles.
Methylene blue concentration was calculated from measured absorbance at 665 nm (74021 M cm−1), molar mass (MM = 319.85 g mol−1) and linear calibration curves (5–6 calibration points with R2 > 0.99). The experimental data on methylene blue concentration over time were then fitted to the following exponential curve (R2 values > 0.97 for all experiments):
A(t) = B*e–MBkin*t
where the derived parameter for methylene blue (MBkin) is the slope of the regression curve of absorbance over time A(t) at that wavelength (665 nm), with B being the known starting concentration of methylene blue (10 mg L−1). The experimental set-up reflected adsorption controlled by diffusion at the boundary layer as a first-order kinetic process.
For the experiments, 3–4 GAC samples were collected from each column (from the top of the column for the first sampling and from the bottom for the other three samplings) at 250, 2400, 4500 and 7100 BV for C1-N18 and C3-F18; at 660, 6600 and 12,700 BV for C2-N6; and at 660, 6600, 12700 and 20,400 BV for C4-F6. All GAC samples were washed with ultrapure water to remove dissolved contaminants and fine particles, and then ‘dried’ and stored in a desiccator until use.

2.6. OMP Kinetic and Isotherm Experiments

Kinetic and isotherm experiments were conducted for carbamazepine, oxazepam, DEET, fexofenadine, fluconazole, cetirizine and lamotrigine, using the same experimental conditions as in the methylene blue kinetic experiments (see Section 2.5). None of the target compounds were detected in control samples.
Two isotherm experiments were conducted using fresh GAC (Norit 830W and Filtrasorb 400), and mixtures of the seven OMPs at concentrations of 20, 50, 100, 200, 500 and 1000 ng L−1 in 1 L of distilled water were used. To reach the adsorption equilibrium rapidly, 4 g of fresh GAC (Norit 830W and Filtrasorb 400) was added to the test solution. The adsorption was performed for 1 h (chosen based on kinetic experiment results, see Section 3). All bottles were tightly sealed and shaken at 120 rpm in darkness at 20 °C (room temperature).
Two kinetic experiments were conducted using fresh GAC (Norit 830W and Filtrasorb 400), with the initial concentration of the seven OMPs set to 1000 ng L−1 in ultrapure water and with a GAC concentration of 4 g L−1. During this kinetic experiment, aliquots were sampled at 0, 5, 10, 15, 20 and 30 min, and each sample set was analyzed in duplicate.

2.7. Sample Preparation and OMP Analysis

Triplicate thawed water samples (10 mL) were filtered through a syringe filter (0.22 μm, regenerated cellulose) and spiked with a mixture of ISs to achieve a concentration of 50 ng/L (for details see [18]).
In SPE-LC-MS/MS analysis, an LC/LC system from Thermo Fisher Scientific (San Jose, CA, USA) was used for liquid chromatography. An Acquity UPLC BEH-C18 column (Waters, 100 mm × 2.1 inner diameter (i.d.), 1.7 µm particle size from Waters Corporation, Manchester, UK) was used as the analytical column. A Hypersil GOLD aQ column (20 mm × 2.1 mm i.d, 12 µm particles, from Thermo Fisher Scientific (San Jose, CA, USA)) was used as the extraction column for on-line solid phase extraction. The injection volume was 1.0 mL for all samples. A triple-stage quadrupole MS/MS TSQ Quantiva (Thermo Fisher Scientific) was used for the detection of compounds (for details see [18]).
The limit of quantification (LOQ) of OMPs was determined by measuring aqueous standard solution at concentrations ranging from 0.1 ng L−1 to 100 ng L−1, as 30% of the lowest calibration point in the linear range (relative standard deviation of the average response factor by 30%) if the signal to noise ratio was higher than 10. For the OMPs studied, the LOQ was within the range 0.09–1.5 ng L−1. The average recovery rate was 86 ± 18% for carbamazepine, 92 ± 5% for cetirizine, 87 ± 2% for oxazepam, 78 ± 3% for DEET, 122 ± 7% for fexofenadine, 101 ± 23% for lamotrigine and 85 ± 19% for fluconazole.

2.8. Calculation of Removal Efficiency

Removal efficiency (RE) was calculated as:
RE = SF GAC SF
where SF is the average mass transport of the compound in rapid sand filtration effluent (ng) and GAC is the average mass transport through the GAC column, calculated as mean outgoing mass transport of the compound (ng) for three sampling events multiplied by pilot column operating time (days). The OMP concentration was set to zero if the compound was not detected in any sample, and to LOQ/2 if the concentration was below its LOQ but detected in some samples.

3. Results and Discussion

3.1. Kinetic and Isotherm Experiments for OMPs

The isotherm experiments demonstrated the sorption affinity of the seven selected OMPs to the two fresh GAC types (Table 1). Of the two GAC types tested, Filtrasorb 400 generally showed a higher sorption for most OMPs than Norit 830W. The highest sorption capacity was observed for cetirizine (16 and 22 ng g−1, for Norit 830W and Filtrasorb 400, respectively), while the lowest capacity was observed for DEET (3.7 and 4.6 ng g−1, respectively). It should be noted that fexofenadine showed a high sorption capacity for Filtrasorb 400 (26 ng g−1) and a moderate sorption capacity (9.3 ng g−1) for Norit 830W. The different sorption behaviors of the OMPs can be explained by their different physical-chemical properties, and the GAC material [10]. For example, it has been shown that sorption of OMPs to GAC increases with increases in the octanol–water partition coefficient values (log KOW) [10,22]. OMPs with high log KOW (>2) are easily adsorbed to particles (such as soils, sediments, etc.) and removed from the aqueous phases. On the other hand, those with low KOW (<2) tend to remain in aqueous phases.
It was shown that the sorption capacity correlates with the molecular weight of studied compounds [10]. In the present study, the highest sorption capacity was mainly shown for compounds a with high molecular mass, such as cetirizine (388.9) and fexofenadine (501.7) (Table 1). DEET and carbamazepine have low molecular mases (191.1 and 236, respectively) among the studied compounds, and showed low sorption capacities.
It is important to note that the isotherm data reported in many studies (for review, see Delgado et al., [10]) were mainly measured at mg L−1 or even higher concentrations [23]. These are greater than the OMP concentrations found in real source waters (usually 10–100 ng L−1) [3,5,20]. Because isotherm models (e.g., the Freundlich model) are dependent on the concentration range, the isotherm tests in the present study were performed at concentrations similar to those expected in the aquatic environment.
The kinetic experiments were performed to investigate the effect of EBCT on OMP adsorption (Table 1), with increasing contact time expected to allow higher OMP removal rates [6]. The differences in half-time (T1/2, min) OMP concentrations in the aqueous phases were small, with EBCTs of ~6 (±1) min, and did not explain the observed pilot-scale removal efficiency of the OMPs.
In order to assess the removal efficiency of the seven OMPs under real conditions, the old GAC (after 104,000 BV, over 13 years) from the full-scale filter (Ref-N6) at Görväln DWTP was used for the kinetic experiments. None of the seven OMPs investigated were removed by the old GAC after 30 min (as shown for carbamazepine and fexofenadine in Figure 2). In fact, the concentrations (C/C0) of the tested OMPs decreased during the first 5 min of exposure, and increased at the end of the experiment. This systematic pattern of decreases followed by increases in the concentrations of the OMPs could reflect the dynamic interaction between the liquid phase and solid phase of old GAC. This can be explained by saturation of the GAC material, resulting in the adsorption and desorption of OMPs, and competition with DOC and other OMPs. These results are in agreement with the full-scale results (see Section 3.3).

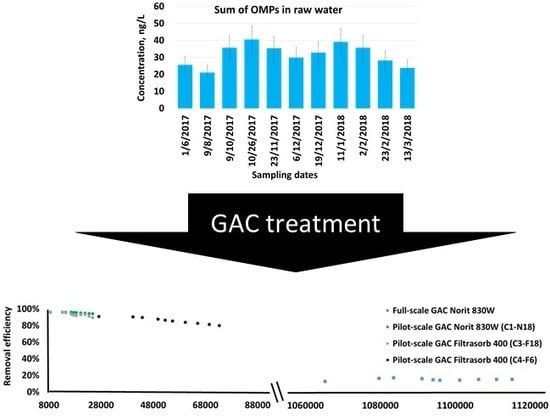
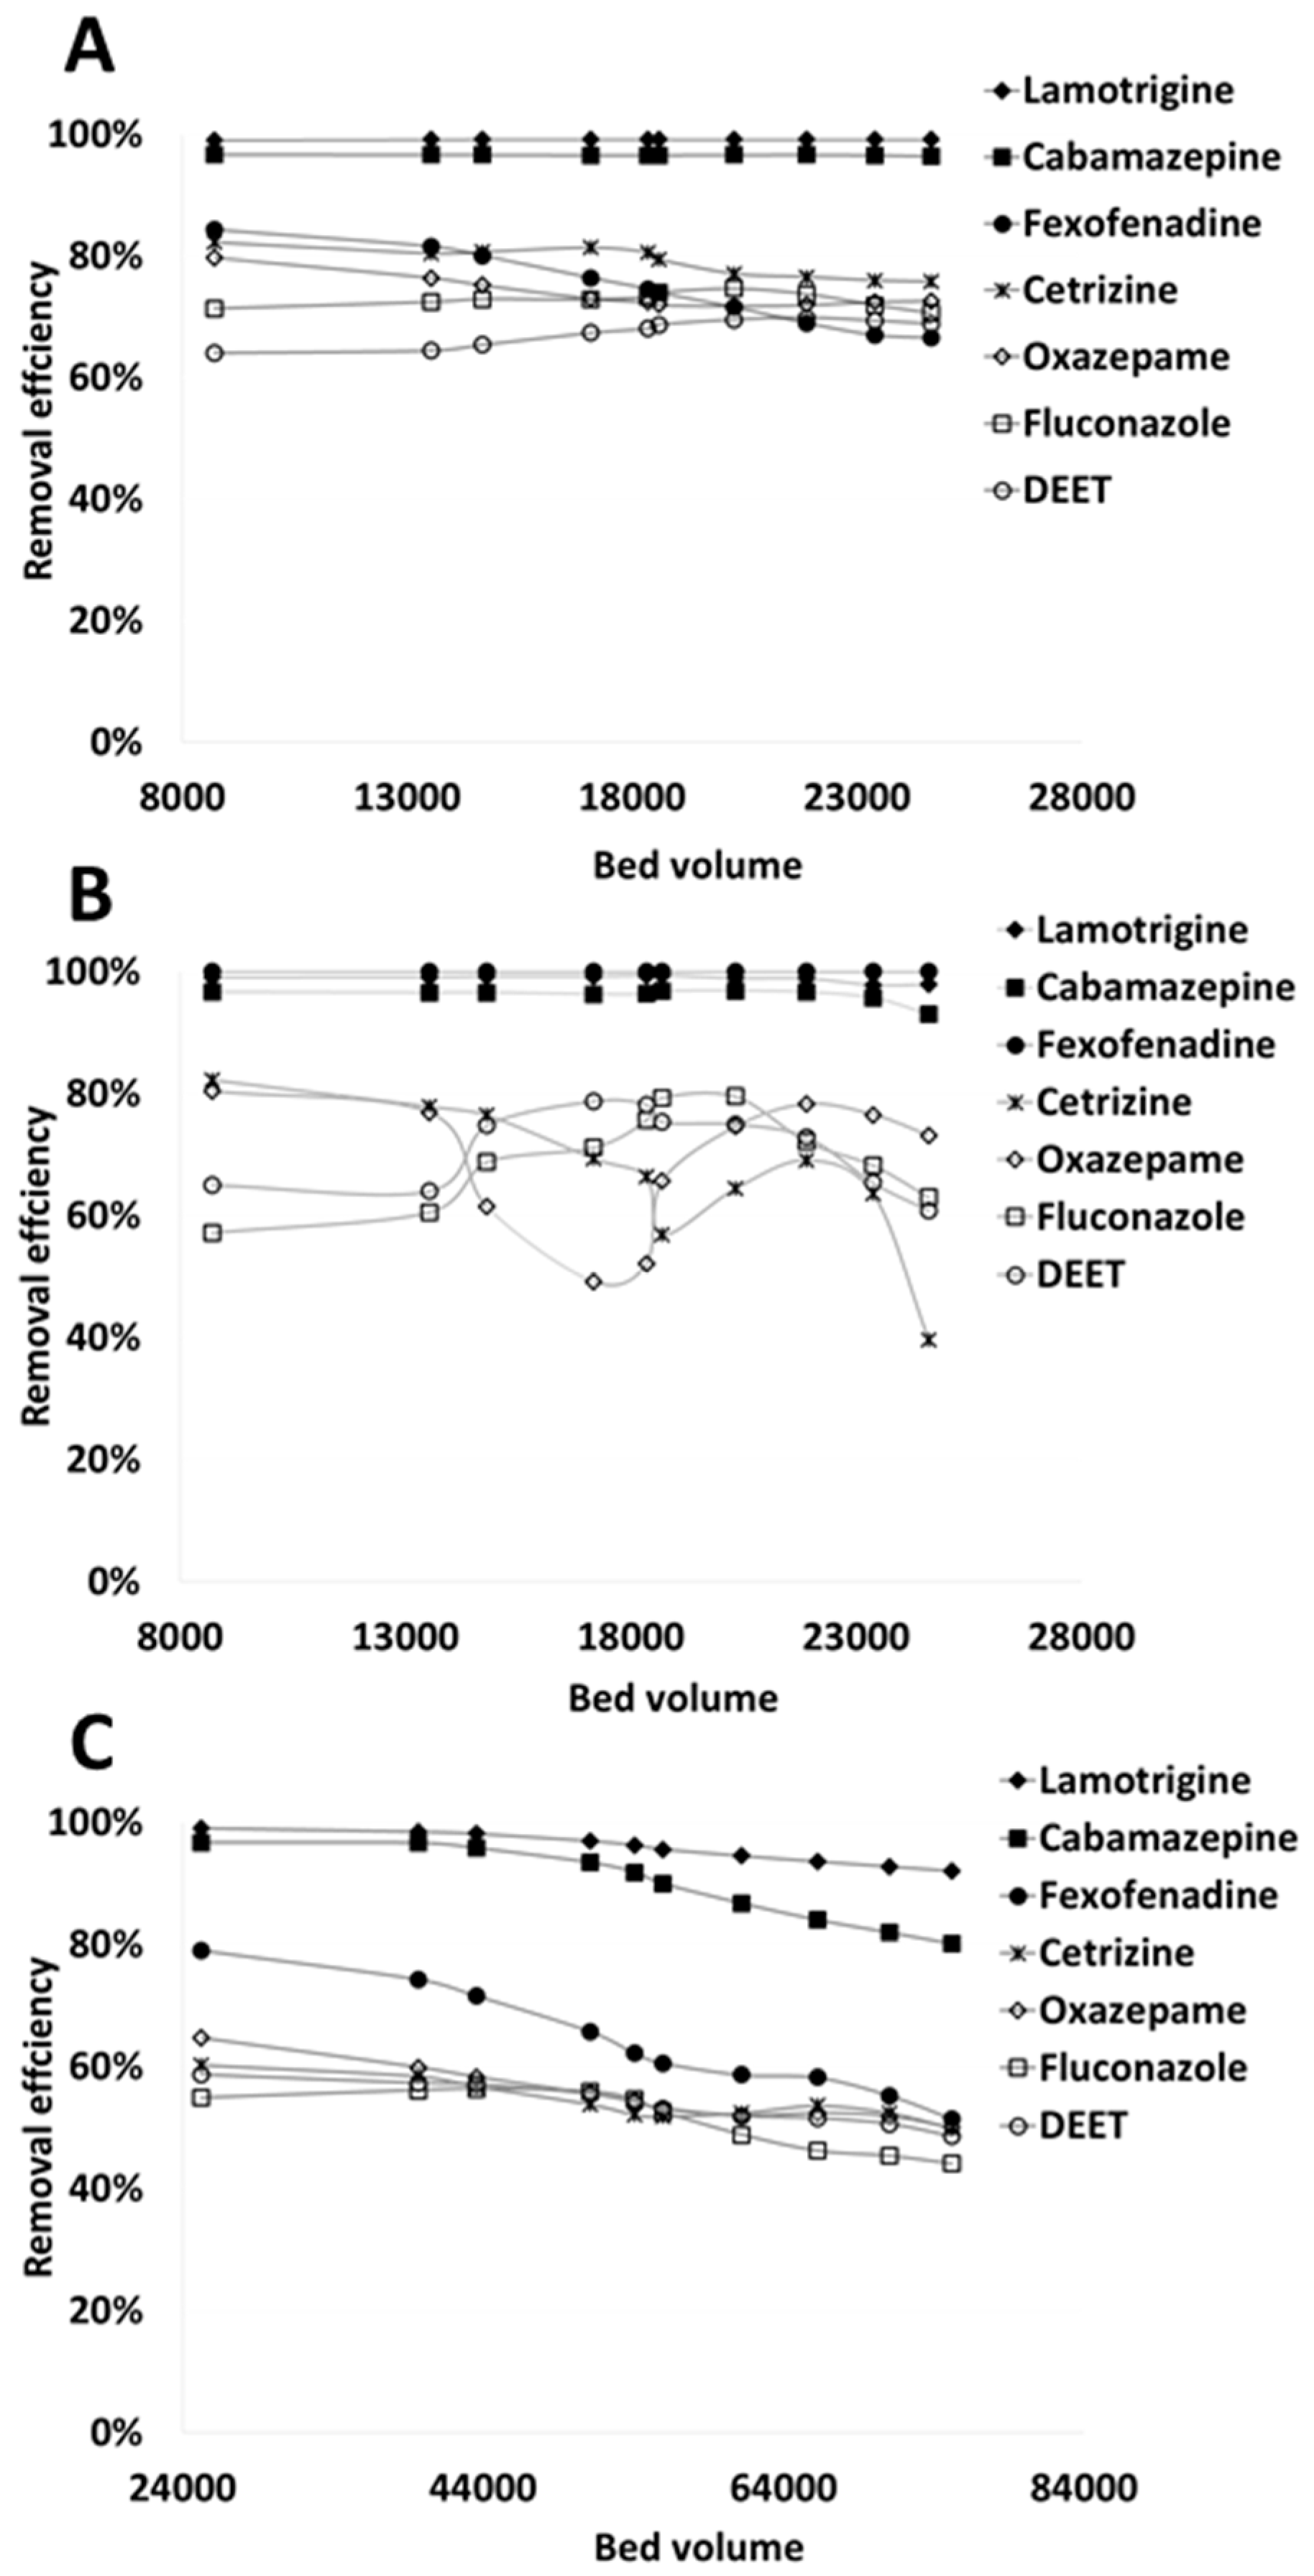
3.2. Removal of OMPs Using GAC in Pilot-Scale Experiments

The combined concentrations of the target OMPs varied from 0.40 to 26 ng L−1. The median concentration in the incoming lake water was 3.8 ng L−1 (±0.86) for carbamazepine, 2.5 ng L−1 (±0.74) for cetirizine, 2.4 ng L−1 (±0.66) for oxazepam, 1.8 ng L−1 (±0.28) for DEET, 0.67 ng L−1 (±0.26) for fexofenadine, 19 ng L−1 (±4.26) for lamotrigine and 1.65 ng L−1 (±0.36) for fluconazole (Figure S2 and Table S1). These OMPs have been detected previously in surface waters, and in wastewater treatment plant influent and effluent [3,5,24]. The measured OMP concentrations in water coming in to the full-scale and pilot-scale GAC treatments showed relatively large variations (Figure S2), possibly due to seasonal variations in the concentrations, analytical uncertainties for compounds with low concentrations (<1 ng L−1), and dynamic competition reactions [25] on the GAC columns.
Comparisons of results from the three pilot-scale GAC columns for the seven OMPs revealed that the removal efficiency was initially high for individual OMPs (on average, 80%), and it decreased slightly over time (on average 71%) (Figure 3). This decreasing adsorption efficiency indicates that the availability of sorption sites decreased over time due to the sorption of OMPs and DOC. The best removal efficiencies in all three GAC columns were observed for lamotrigine (on average 99% at the end of the experiment) and carbamazepine (on average 90% at the end of the experiment). Thus, these compounds can be considered late indicators of breakthrough under the prevailing operating conditions. Lamotrigine and carbamazepine are generally considered to be highly persistent compounds, and have been detected in different environmental samples all over the world [24,26]. Lamotrigine also has high water solubility (170 mg L−1) and low Kow value (0.99) [6], indicating that this compound can be problematic for DWTPs. The removal efficiency of fexofenadine, oxazepam, cetirizine, DEET and fluconazole was on average 74% over the study period when using Norit 830W (C1-N18) and Filtrasorb 400 (C3-F18) with EBCT 18 min, while it was 56% when using Filtrasorb 400 (C4-F6) with EBCT 6 min. Thus, these OMP compounds can be considered earlier indicators of breakthrough than lamotrigine and carbamazepine, under the operating conditions applied here. Oxazepam, cetirizine, DEET and fluconazole showed varying removal efficiencies for GAC Filtrasorb 400 (C3-F18), at around 15,000 BV. This can be explained by the very low concentrations observed for these compounds (the maximum measured concentration in this column was 1.6 ng L−1 for cetirizine), and by analytical artefacts.
In general, the adsorption of compounds onto GAC is primarily due to physical adsorption (van der Waals forces), and is strongly dependent on the solubility (hydrophobicity) and size of the compound [27]. However, for charged molecules, electrostatic interactions can play a major role in adsorption, and these interactions are highly dependent on the pH of the water, the pKa of the compound, and the surface charge of the GAC [10,28]. The OMPs investigated in this study were not charged at the prevailing pH (~6.9), indicating that physical adsorption processes dominated. Here, the removal of OMPs was studied under real water treatment conditions for natural lake water with a low OMP concentration (a few ng L−1), whereas previous studies reporting concentration-dependent removal efficiencies for GAC have used high spiked concentrations [6,7]. It is important to note that other parameters, such as DOC, pH and temperature, can also influence sorption processes [10,22]. It has been shown that the presence of dissolved organic matter inhibits the adsorption of OMPs [22].

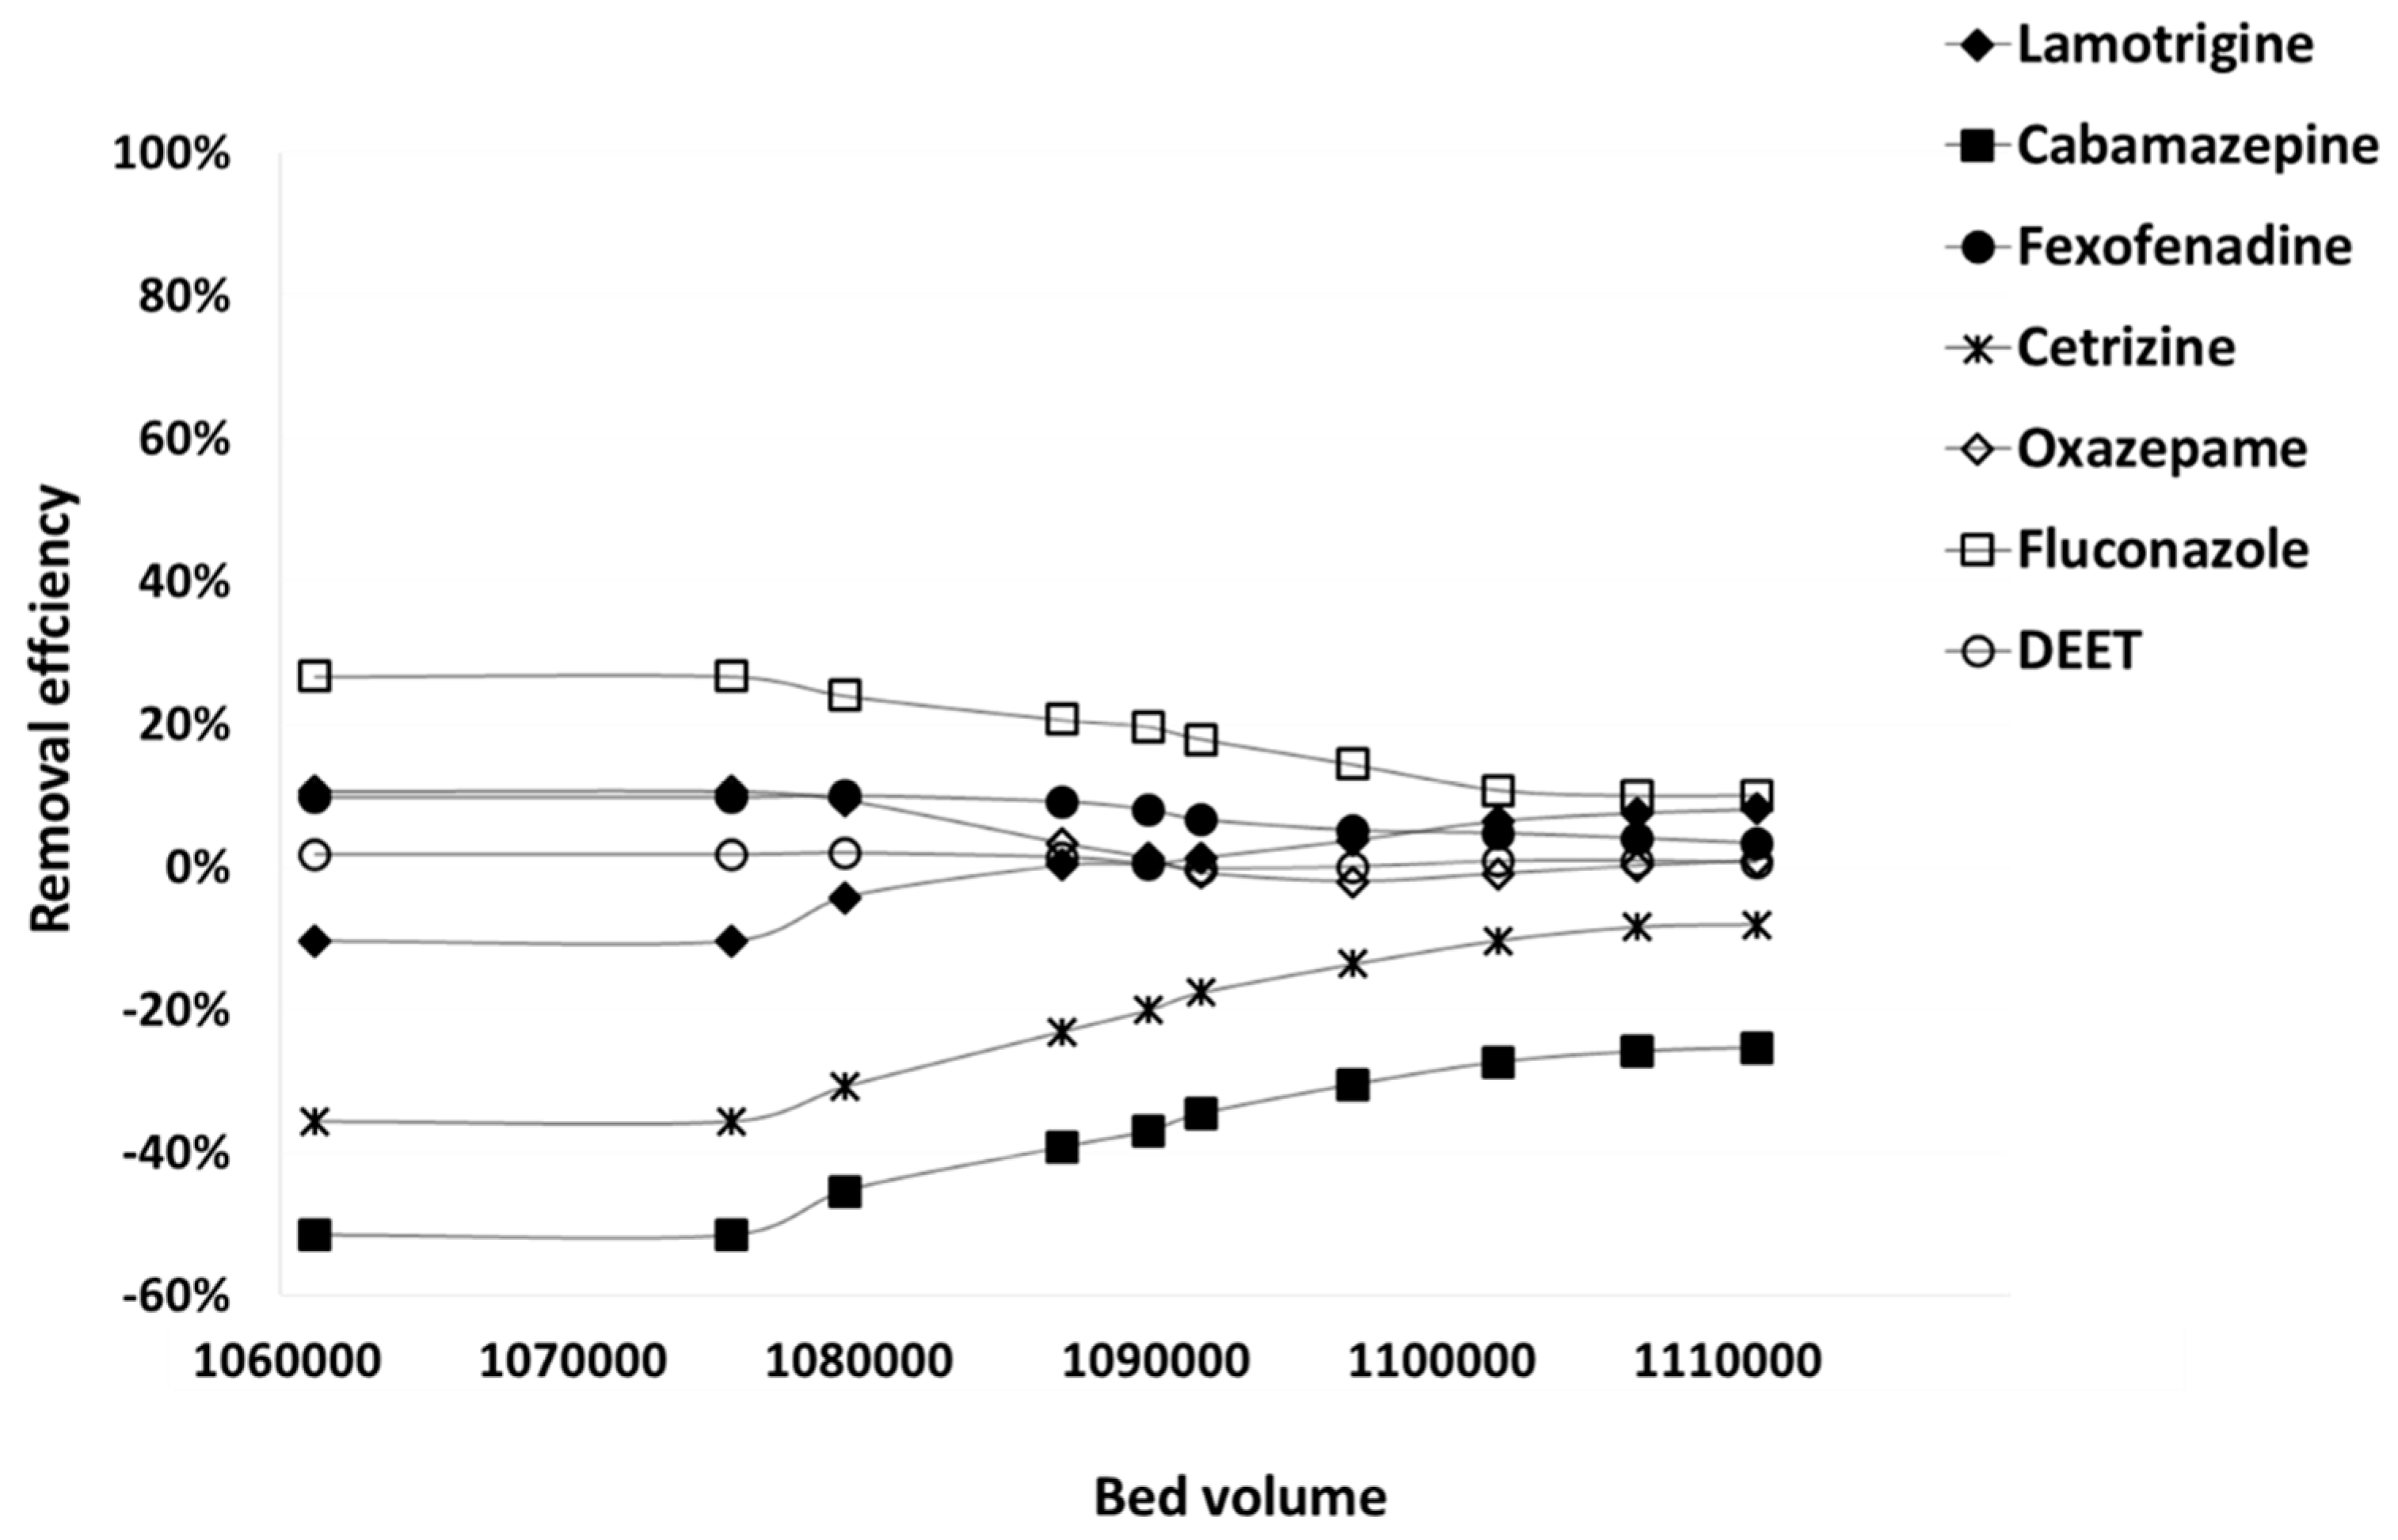
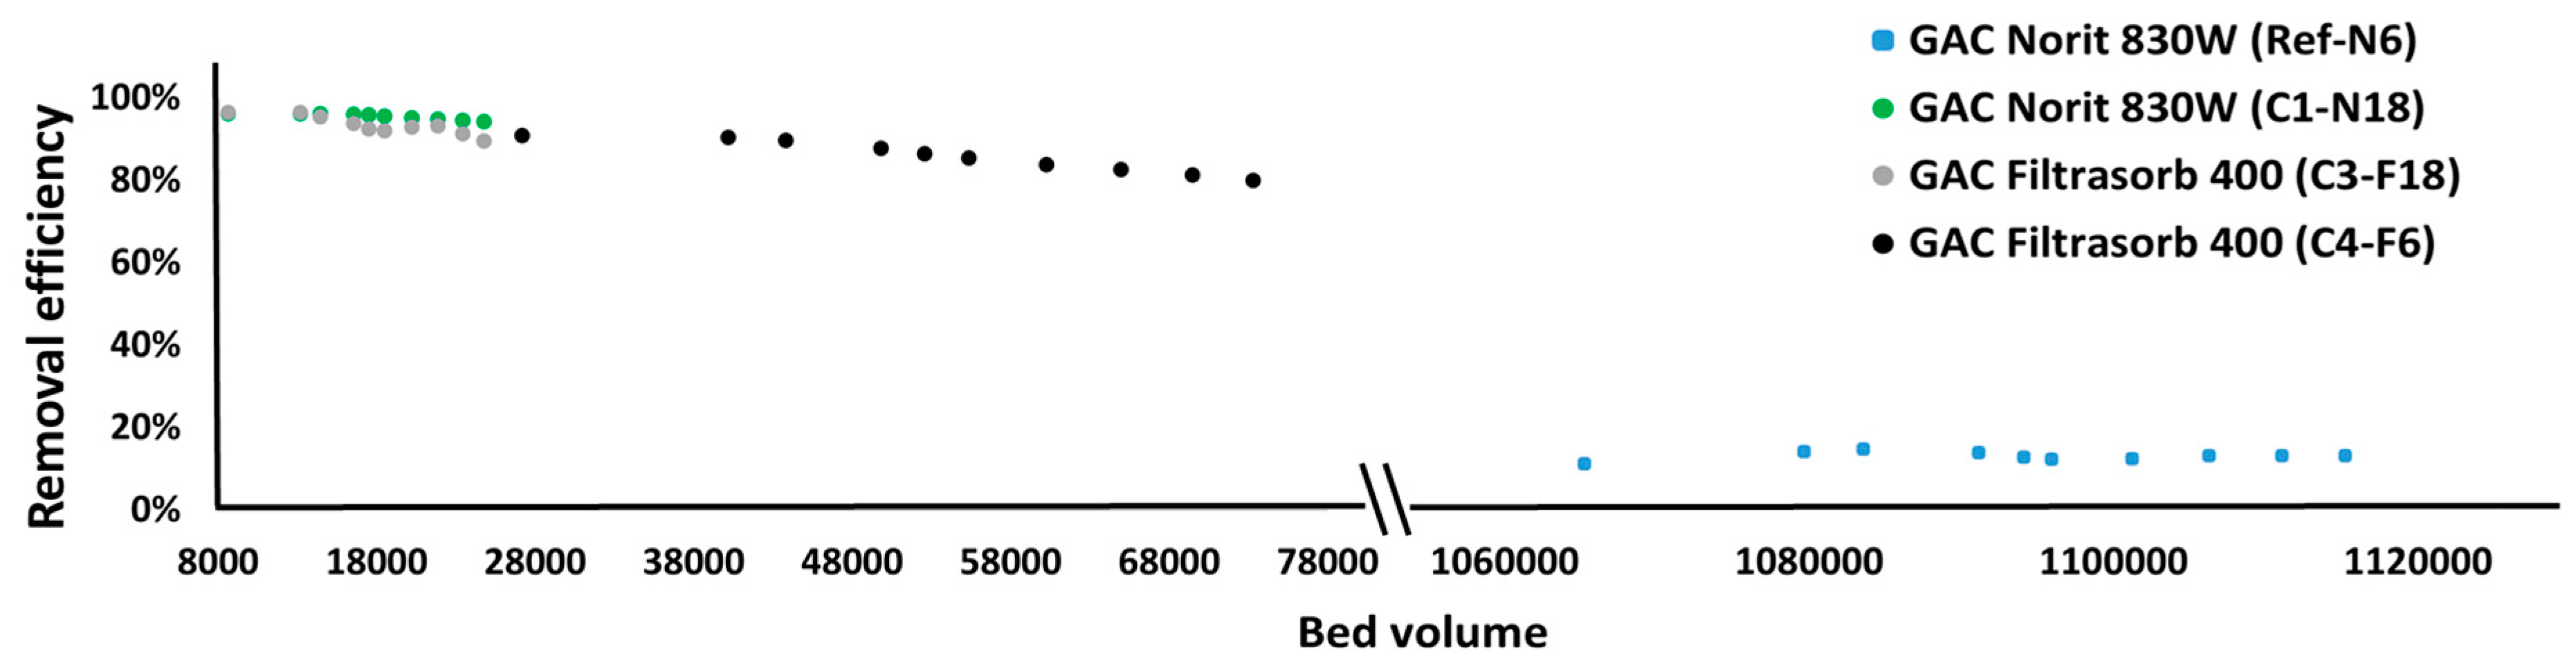
3.3. Removal of OMPs Using GAC in Full-Scale

The removal efficiency for the seven OMPs in the full-scale GAC filter (Ref-N6) was relatively low (<25%) (Figure 4). This can be explained by the age of the GAC (installed 2004), and thus the high number of BVs treated, as has been shown in previous studies [20]. Another reason for the low removal of OMPs by the old GAC filter may be desorption [29]. OMPs adsorb onto GAC with weak binding forces, and thus adsorbed compounds can also desorb again. The desorption of OMPs can generally be induced by decreased influent concentrations, and by competitive adsorption. The old GAC filter tested may have been be affected by desorption, because it remained in the system for much longer (13 years) than the treated water.
No removal was observed for DEET, which can be explained by its low adsorption affinity to GAC (see Section 3.1). Negative removal, i.e., a higher outgoing than incoming OMP concentration, was observed for carbamazepine, lamotrigine and cetirizine. All three compounds are relatively resistant to biodegradation [30], and thus are probably more prone to later release than compounds degraded on the GAC biofilm. However, the removal efficiencies for carbamazepine, lamotrigine and cetirizine increased after 155,000 BVs. This increase in removal efficiency for lamotrigine can be explained by an increase in its concentration in the feed water, from 10 to 25 ng L−1 from June to October 2017 (Figure S1). Previous studies have shown that OMPs and DOC can compete for pore sites, and that DOC can block pore sites on GAC, resulting in a decrease in the adsorption capacity of GAC for OMPs over time [10,13,31]. However, it has also been shown that DOC concentration is not sufficient for explaining OMP breakthrough behaviors [7].
The removal efficiency of the seven OMPs in the full-scale GAC treatment plant (Norit 830W, Ref-N6) was considerably different from that in the pilot-scale GAC columns (C1-N18, C3-F18, C4-F6) (Figure 5). For the full-scale GAC treatment plant, the first sampling started at approximately 129,000 BV, and the average treatment efficiency of ∑OMPs was consistently low (<20%) until 155,000 BV. For the pilot-scale GAC columns, the removal efficiency of ∑OMPs decreased slightly, from 90–95% at 20,000 BV (C1-N18, C3-F18, C4-F6) to ~80% at 75,000 BV (C4-F6). These differences between the full-scale and pilot-scale results can be explained by the age of the GAC (GAC in the full-scale test was used for >13 years; GAC from pilot-scale columns was used for <1 year).

3.4. Early Warning Indicators of GAC Sorption Capacity

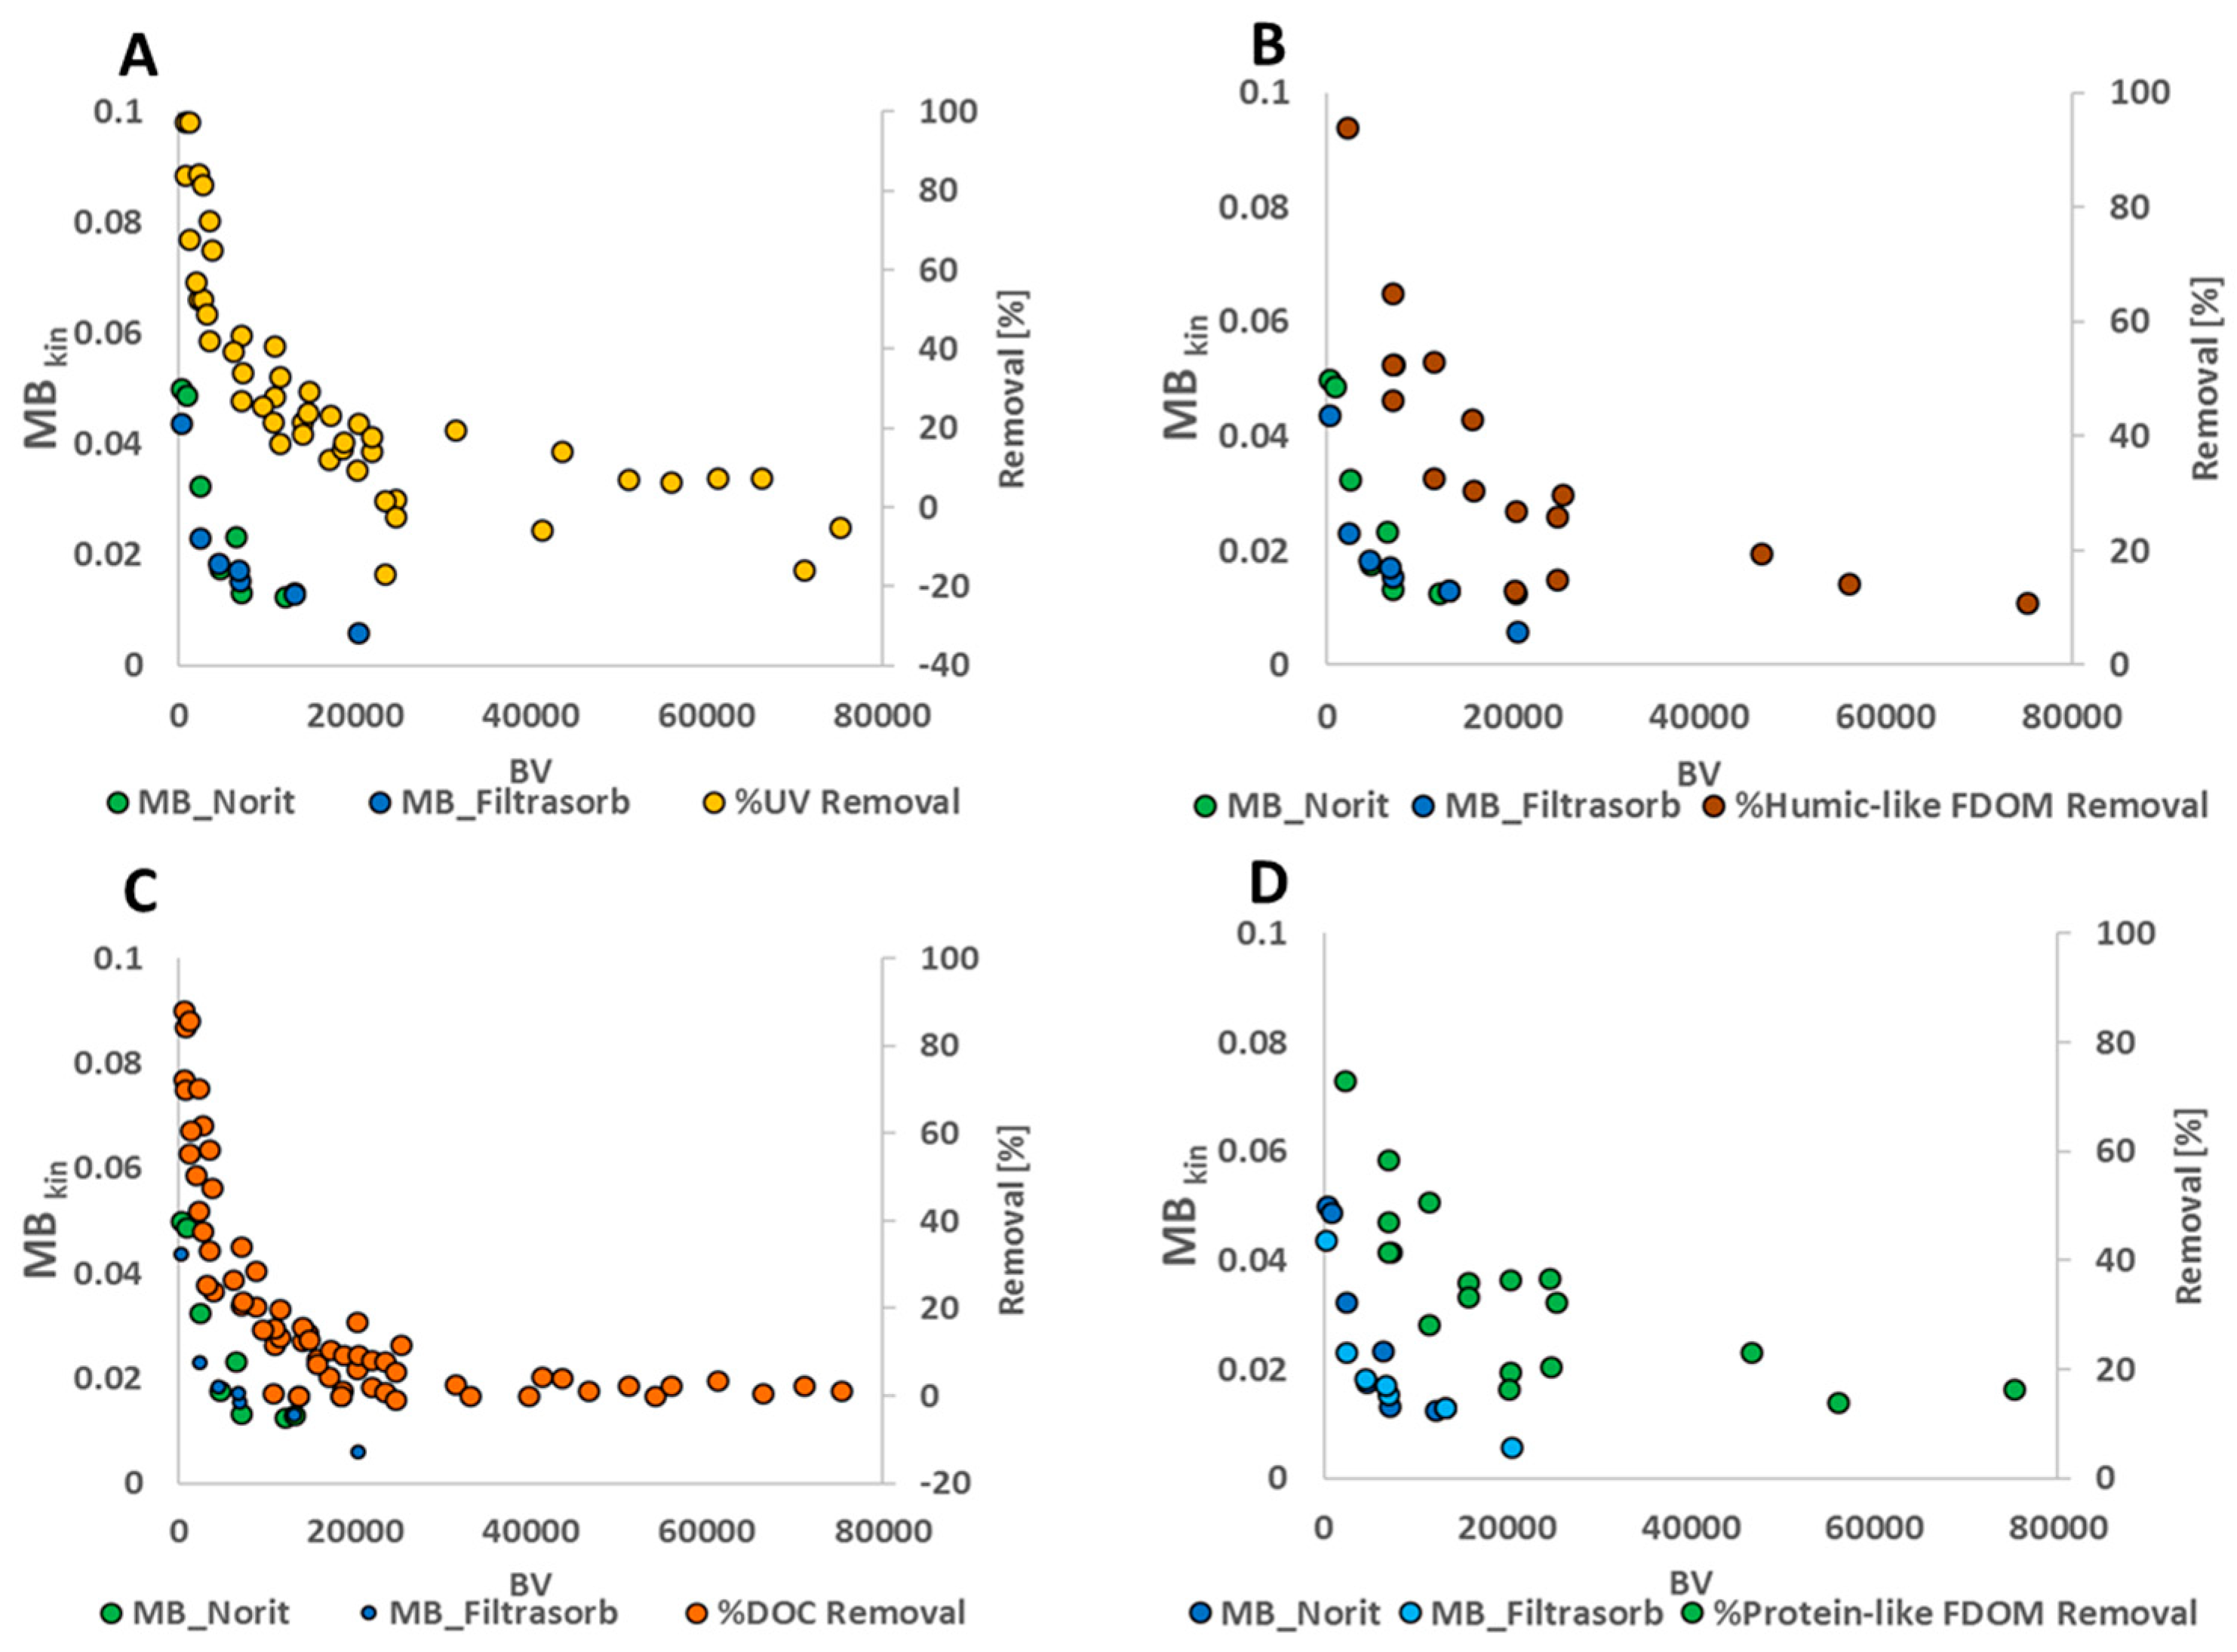
3.4.1. DOC, UV Absorbance and Fluorescence

Removal of possible indicator compounds is shown as a function of the number of BV treated with Filtrasorb 400 (light blue, C3-F18, C4-F6) and Norit 830W (dark blue, C1-N18) in Figure 6, together with the methylene blue kinetic sorption factors (Table S2). The removal of UV, humic-like fluorescent dissolved organic matter (FDOM), DOC and protein-like FDOM over time consisted of two stages, with initial high removal (probably dominated by sorption, which decreases with time) and then stable, but lower removal (probably by biodegradation of selected DOC fractions). In accordance with earlier work [32], it was found that DOC broke through before UV and humic substances. Mass balance calculations, based on incoming and outgoing DOC, indicated that Filtrasorb 400 had a higher adsorption capacity (60–70 g DOC kg−1 GAC) than Norit 830W (40–45 g DOC kg−1 GAC). For Filtrasorb 400 (C4-F6), assuming that 0.15 mg L−1 of the incoming DOC was biodegradable and based on the outgoing DOC, it was estimated that ~100 g of the total mass of incoming DOC (600 g) had been removed, and that ~20 g had been biodegraded after 25,000 BV. For Norit 830W (C1-N18 and C2-N6), ~90 g and ~150 g of the total mass of incoming DOC, respectively, was removed after 20,000 BV, and ~20 g was biodegraded in both columns. This reflects the higher reactive surface area of Filtrasorb 400 compared to Norit 830W (Table S2). The differences in removal rates between Filtrasorb 400 and Norit 830W for DOC were not observed for OMPs (Section 3.2), which indicates that OMPs have a different sorption mechanism than DOC. However, DOC can interfere with the sorption of OMPs [6,7,31].
Overall, DOC, UV absorbance and fluorescence were not sufficient to explain the differences in the breakthroughs of OMPs in the different GAC columns. Similar conclusions were reached in recent studies testing for OMPs in drinking water and wastewater effluents [6,7]. However, it has been shown that GAC capacities can be predicted for different waters if initial the OMPs, and the concentrations of low-molecular-weight acids and neutral organics, in these waters are known [7].

3.4.2. Methylene Blue

We tested whether kinetic sorption using methylene blue, a known organic molecule with a molecular size comparable to both humic acids and OMP, could capture the decreasing sorption capacity of the GAC filters over time. The sorption of methylene blue to GAC decreased over time for all four columns, but with slightly larger variations for Filtrasorb 400 than Norit 830W, especially when fresh (Figure S2). Saturation of the methylene blue occurred earlier for Norit 830W (~30,000 BV) than Filtrasorb 400 (~50,000 BV) (Figure S3). The adsorption kinetics of methylene blue as a function of BV were similar for the two Norit 830W GAC columns, with EBCTs of 6 min (C2-N6) and 18 min (C1-N18), indicating that contact time was not a determining factor for methylene blue adsorption onto Norit 830W. This suggests that methylene blue adsorption onto Norit 830W may be mainly dependent on the amount of DOC in the incoming water (here ~4.4 mg L−1), as an organic matter layer on the GAC surface may have a significant impact on methylene blue uptake even if internal pores are available for adsorption [33].
The two Filtrasorb 400 columns (C3-F18 and C4-F6) demonstrated higher adsorption capacities than 830W, which is in agreement with the results obtained in the kinetic experiments (Section 3.1). In addition, Filtrasorb 400 showed better adsorption performance with a contact time of 18 min (C3-F18) compared to with 6 min (C4-F6). The observed decrease in methylene blue correlated well with the removal of DOC over time, but not with the removal of OMPs, even though methylene blue is positively charged and DOC is negatively charged. This indicates that methylene blue removal by Filtrasorb 400 is controlled by similar sorption processes as DOC, whereas the removal of OMPs is controlled by other processes that need further investigation.

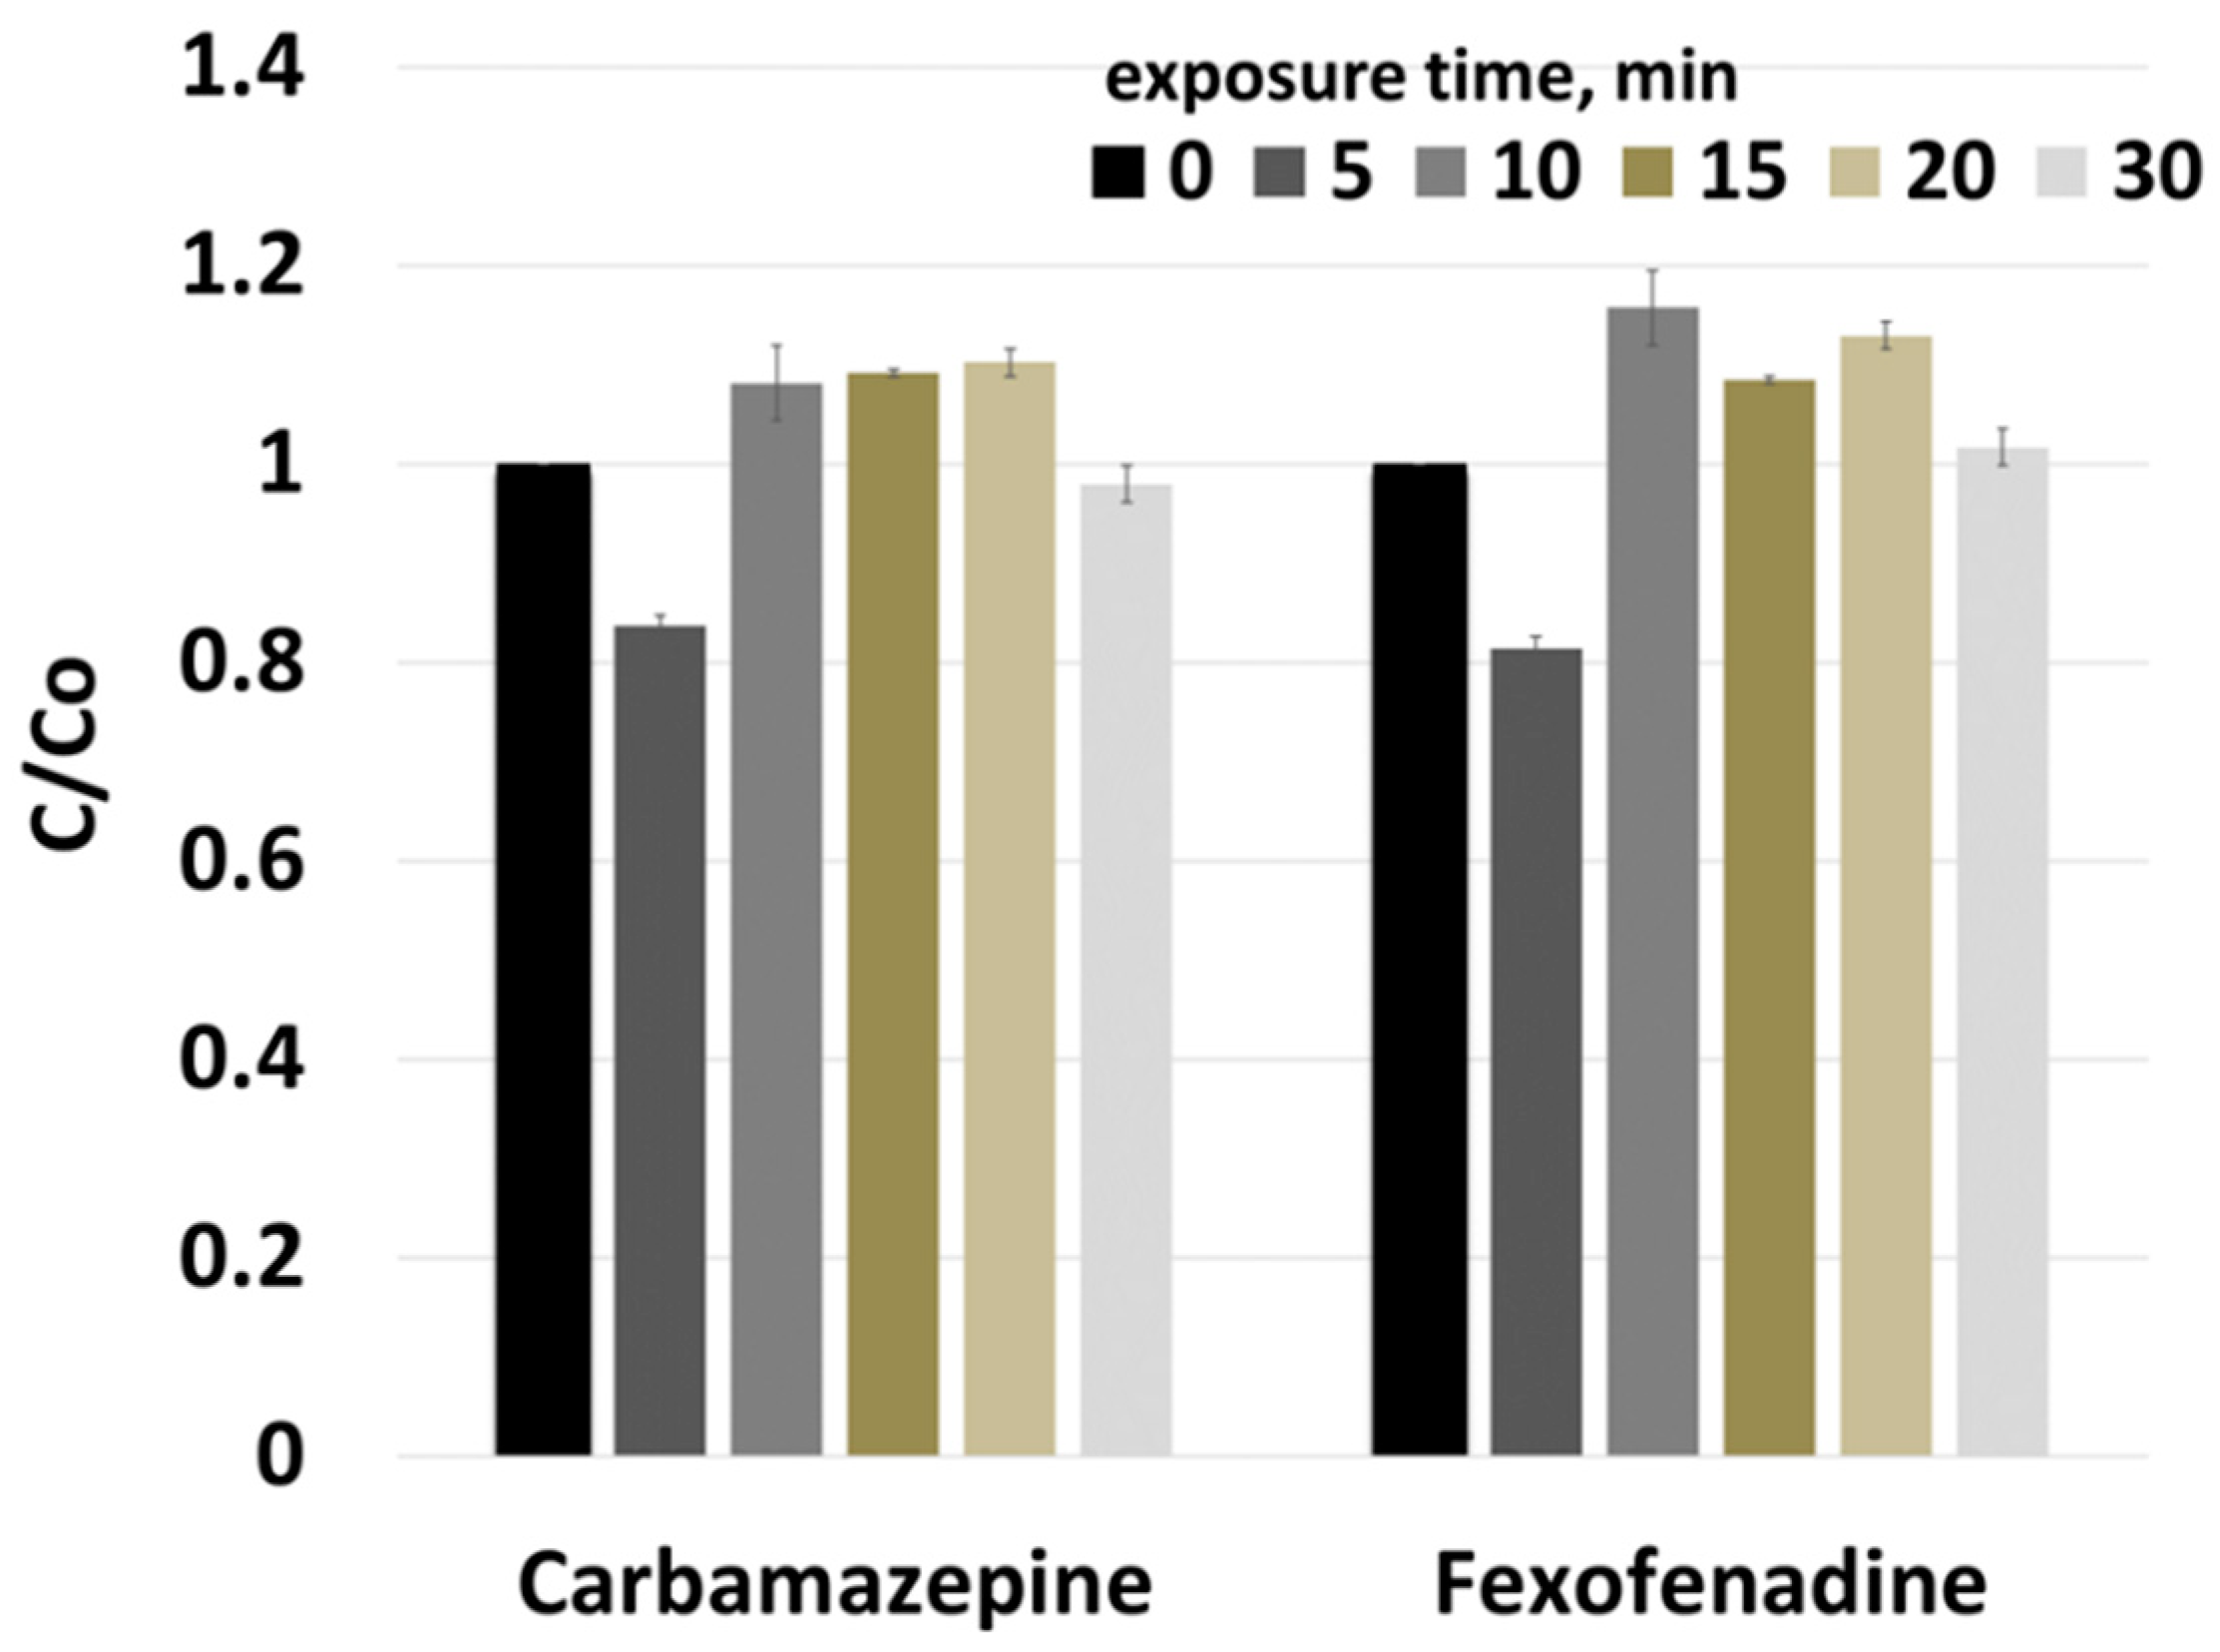
3.4.3. Online SPE of OMPs

Based on our results and recent published data [10], the removals of DOC, UV absorbance, fluorescence and methylene blue are only of limited value in predicting OMP removal using GAC. In the present study, the analysis of seven OMPs in water samples was performed using online SPE-LC-MS/MS, which is a simple, sensitive, reliable and rapid method for measuring a large range of OMPs simultaneously [2,18]. Our study showed that online SPE-LC-MS/MS can be used for the early detection of OMPs in drinking water, since the results can be obtained on the same day as sample collection. The method is based on the target screening of selected OMPs, but unknown OMPs present in the samples can be identified using suspect and non-target screening approaches.

4. Conclusions

The removal efficiency and adsorption of OMPs onto two GAC types (Filtrasorb 400 and Norit 830W) were investigated for drinking water treated in pilot-scale columns and in a full-scale DWTP under real conditions. It was shown that the GAC breakthrough behaviors of the seven OMPs tested (carbamazepine, lamotrigine, cetirizine, fexofenadine, oxazepam, fluconazole and DEET) were mainly impacted by EBCT and GAC type. The results for the pilot-scale columns showed decreasing OMP removal after ~20000 BV. DEET was the OMP most weakly adsorbed to GAC in the present study. It was shown that carbamazepine, lamotrigine and fexofenadine can be used as late indicators for the breakthrough of OMPs in GAC. The removal of UV, DOC and fluorescence could not sufficiently explain OMP removal in the different GAC columns. However, the removal of UV and fluorescence could be used to obtain an early warning of DOC breakthrough, and the online LC-MS/MS method could be used to obtain an early warning of OMP breakthrough in drinking water treatment. More research is needed in order to develop efficient chemical barriers for DWTPs and early warning tools to detect potential toxic OMPs, to ensure safe drinking water production.

Supplementary Materials

The following are available online at https://0-www-mdpi-com.brum.beds.ac.uk/2073-4441/12/7/2053/s1, Figure S1: Total organic carbon content, flow and temperature of incoming raw water during the whole study period (April 2017 to March 2018), Figure S2: Occurrence of OMPs in the raw water (R) and sand filter water (SF) (ng L−1), Figure S3. Change in methylene blue (MB) kinetic sorption factor of Filtrasorb (light blue), Norit (dark blue) against bed volume (BV, A) or total amount of dissolved organic carbon (DOC) retained ([g], B) for all columns. The dashed line represents full-scale GAC filter - Ref-N6, filled with Norit 830W and with an empty bed contact time (EBCT) of 6 min, Table S1: Occurrence of OMPs in raw water (RAW), rapid sand filtrate effluent water (SF) and the effluent from a full-scale GAC treatment (Ref-N6, column filled with Norit 830W and with an empty bed contact time (EBCT) of 6 min) and from pilot-scale columns (C1-N18, Norit 830W and EBCT of 18 min; C3-F18, Filtrasorb 400 and EBCT of 18 min; C4-F6, Filtrasorb 400 and EBCT of 6 min) (ng L−1).

Author Contributions

O.G.: Formal analysis, Conceptualization, Methodology, Writing—Original draft preparation; L.d.B.A.: Formal analysis, Conceptualization, Methodology, Writing—Reviewing and Editing; C.C.: Formal analysis, Writing—Reviewing and Editing; L.A.: Conceptualization, Resources, Writing—Reviewing and Editing; E.L.: Supervision, Conceptualization, Resources, Writing—Reviewing and Editing; S.J.K.: Supervision, Project administration, Funding Acquisition Conceptualization, Formal analysis, Resources, Writing—Reviewing and Editing. All authors have read and agreed to the published version of the manuscript.

Funding

This research received no external funding.

Acknowledgments

The analytical part of this study was supported financially by Norrvatten, a municipal drinking water producer for the greater Stockholm region, and by the DRICKS network, a center for drinking water research hosted by Chalmers University and involving researchers at Chalmers, LTH in Lund and SLU in Uppsala.

Conflicts of Interest

The authors declare no conflict of interest.

References

  1. König, M.; Escher, B.I.; Neale, P.A.; Krauss, M.; Hilscherova, K.; Novak, J.; Teodorovic, I.; Schulze, T.; Seidensticker, S.; Kamal Hashmi, M.A.; et al. Impact of untreated wastewater on a major European river evaluated with a combination of in vitro bioassays and chemical analysis. Environ. Pollut. 2017, 220, 1220–1230. [Google Scholar] [CrossRef] [PubMed]
  2. Golovko, O.; Kumar, V.; Fedorova, G.; Randak, T.; Grabic, R. Seasonal changes in antibiotics, antidepressants/psychiatric drugs, antihistamines and lipid regulators in a wastewater treatment plant. Chemosphere 2014, 111, 418–426. [Google Scholar] [CrossRef] [PubMed]
  3. Rehrl, A.L.; Golovko, O.; Ahrens, L.; Köhler, S. Spatial and seasonal trends of organic micropollutants in Sweden’s most important drinking water reservoir. Chemosphere 2020, 249, 126168. [Google Scholar] [CrossRef] [PubMed]
  4. Sörengård, M.; Campos-Pereira, H.; Ullberg, M.; Lai, F.Y.; Golovko, O.; Ahrens, L. Mass loads, source apportionment, and risk estimation of organic micropollutants from hospital and municipal wastewater in recipient catchments. Chemosphere 2019, 234, 931–941. [Google Scholar] [CrossRef] [PubMed]
  5. Petrie, B.; Barden, R.; Kasprzyk-Hordern, B. A review on emerging contaminants in wastewaters and the environment: Current knowledge, understudied areas and recommendations for future monitoring. Water Res. 2015, 72, 3–27. [Google Scholar] [CrossRef] [PubMed]
  6. Kennedy, A.M.; Reinert, A.M.; Knappe, D.R.U.; Ferrer, I.; Summers, R.S. Full- and pilot-scale GAC adsorption of organic micropollutants. Water Res. 2015, 68, 238–248. [Google Scholar] [CrossRef]
  7. Zietzschmann, F.; Stützer, C.; Jekel, M. Granular activated carbon adsorption of organic micro-pollutants in drinking water and treated wastewater—Aligning breakthrough curves and capacities. Water Res. 2016, 92, 180–187. [Google Scholar] [CrossRef]
  8. Zoppini, A.; Ademollo, N.; Amalfitano, S.; Casella, P.; Patrolecco, L.; Polesello, S. Organic priority substances and microbial processes in river sediments subject to contrasting hydrological conditions. Sci. Total Environ. 2014, 484, 74–83. [Google Scholar] [CrossRef]
  9. Benstoem, F.; Nahrstedt, A.; Boehler, M.; Knopp, G.; Montag, D.; Siegrist, H.; Pinnekamp, J. Performance of granular activated carbon to remove micropollutants from municipal wastewater—A met a-analysis of pilot- and large-scale studies. Chemosphere 2017, 185, 105–118. [Google Scholar] [CrossRef]
  10. Delgado, L.F.; Charles, P.; Glucina, K.; Morlay, C. The removal of endocrine disrupting compounds, pharmaceutically activated compounds and cyanobacterial toxins during drinking water preparation using activated carbon—A review. Sci. Total Environ. 2012, 435, 509–525. [Google Scholar] [CrossRef]
  11. Hallé, C.; Huck, P.M.; Peldszus, S. Emerging Contaminant Removal by Biofiltration: Temperature, Concentration, and EBCT Impacts. J. Am. Water Work. Assoc. 2015, 107, E364–E379. [Google Scholar]
  12. Benstoem, F.; Pinnekamp, J. Characteristic numbers of granular activated carbon for the elimination of micropollutants from effluents of municipal wastewater treatment plants. Water Sci. Technol. 2017, 76, 279–285. [Google Scholar] [CrossRef] [PubMed]
  13. Mailler, R.; Gasperi, J.; Coquet, Y.; Deshayes, S.; Zedek, S.; Cren-Olivé, C.; Cartiser, N.; Eudes, V.; Bressy, A.; Caupos, E.; et al. Study of a large scale powdered activated carbon pilot: Removals of a wide range of emerging and priority micropollutants from wastewater treatment plant effluents. Water Res. 2015, 72, 315–330. [Google Scholar] [CrossRef] [PubMed] [Green Version]
  14. Köhler, S.J.; Lavonen, E.; Keucken, A.; Schmitt-Kopplin, P.; Spanjer, T.; Persson, K. Upgrading coagulation with hollow-fibre nanofiltration for improved organic matter removal during surface water treatment. Water Res. 2016, 89, 232–240. [Google Scholar] [CrossRef] [Green Version]
  15. Lavonen, E.E.; Kothawala, D.N.; Tranvik, L.J.; Gonsior, M.; Schmitt-Kopplin, P.; Köhler, S.J. Tracking changes in the optical properties and molecular composition of dissolved organic matter during drinking water production. Water Res. 2015, 85, 286–294. [Google Scholar] [CrossRef]
  16. Tran, N.H.; Reinhard, M.; Khan, E.; Chen, H.; Nguyen, V.T.; Li, Y.; Goh, S.; Nguyen, Q.B.; Saeidi, N.; Gin, K.Y.H. Emerging contaminants in wastewater, stormwater runoff, and surface water: Application as chemical markers for diffuse sources. Sci. Total Environ. 2019, 676, 252–267. [Google Scholar] [CrossRef]
  17. Lindberg, R.H.; Östman, M.; Olofsson, U.; Grabic, R.; Fick, J. Occurrence and behaviour of 105 active pharmaceutical ingredients in sewage waters of a municipal sewer collection system. Water Res. 2014, 58, 221–229. [Google Scholar] [CrossRef] [PubMed]
  18. Golovko, O.; Kumar, V.; Fedorova, G.; Randak, T.; Grabic, R. Removal and seasonal variability of selected analgesics/anti-inflammatory, anti-hypertensive/cardiovascular pharmaceuticals and UV filters in wastewater treatment plant. Environ. Sci. Pollut. Res. 2014, 21, 7578–7585. [Google Scholar] [CrossRef]
  19. Gago-Ferrero, P.; Gros, M.; Ahrens, L.; Wiberg, K. Impact of on-site, small and large scale wastewater treatment facilities on levels and fate of pharmaceuticals, personal care products, artificial sweeteners, pesticides, and perfluoroalkyl substances in recipient waters. Sci. Total Environ. 2017, 601, 1289–1297. [Google Scholar] [CrossRef] [PubMed]
  20. Tröger, R.; Klöckner, P.; Ahrens, L.; Wiberg, K. Micropollutants in drinking water from source to tap—Method development and application of a multiresidue screening method. Sci. Total Environ. 2018, 627, 1404–1432. [Google Scholar] [CrossRef] [PubMed]
  21. Lavonen, E.E.; Gonsior, M.; Tranvik, L.J.; Schmitt-Kopplin, P.; Köhler, S.J. Selective Chlorination of Natural Organic Matter: Identification of Previously Unknown Disinfection Byproducts. Environ. Sci. Technol. 2013, 47, 2264–2271. [Google Scholar] [CrossRef] [PubMed]
  22. Nam, S.W.; Choi, D.J.; Kim, S.K.; Her, N.; Zoh, K.D. Adsorption characteristics of selected hydrophilic and hydrophobic micropollutants in water using activated carbon. J. Hazard. Mater. 2014, 270, 144–152. [Google Scholar] [CrossRef] [PubMed]
  23. Baccar, R.; Sarrà, M.; Bouzid, J.; Feki, M.; Blánquez, P. Removal of pharmaceutical compounds by activated carbon prepared from agricultural by-product. Chem. Eng. J. 2012, 211, 310–317. [Google Scholar] [CrossRef]
  24. Patel, M.; Kumar, R.; Kishor, K.; Mlsna, T.; Pittman, C.U.; Mohan, D. Pharmaceuticals of Emerging Concern in Aquatic Systems: Chemistry, Occurrence, Effects, and Removal Methods. Chem. Rev. 2019, 119, 3510–3673. [Google Scholar] [CrossRef] [Green Version]
  25. Ort, C.; Lawrence, M.G.; Rieckermann, J.; Joss, A. Sampling for Pharmaceuticals and Personal Care Products (PPCPs) and Illicit Drugs in Wastewater Systems: Are Your Conclusions Valid? A Critical Review. Environ. Sci. Technol. 2010, 44, 6024–6035. [Google Scholar] [CrossRef] [PubMed]
  26. Young, R.B.; Chefetz, B.; Liu, A.; Desyaterik, Y.; Borch, T. Direct photodegradation of lamotrigine (an antiepileptic) in simulated sunlight – pH influenced rates and products. Environ. Sci. Process. Impacts 2014, 16, 848–857. [Google Scholar] [CrossRef]
  27. Corwin, C.J.; Summers, R.S. Controlling trace organic contaminants with GAC adsorption. J. Am. Water Work. Assoc. 2012, 104, 43–44. [Google Scholar] [CrossRef]
  28. Newcombe, G. Charge vs. porosity—Some influences on the adsorption of natural organic matter (NOM) by activated carbon. Water Sci. Technol. 1999, 40, 191–198. [Google Scholar] [CrossRef]
  29. Crittenden, J.C.; Trussell, R.R.; Hand, D.W.; Howe, K.J.; Tchobanoglous, G. MWH’s Water Treatment: Principles and Design; John Wiley & Sons: Hoboken, NJ, USA, 2005. [Google Scholar]
  30. Mead, R.N.; Barefoot, S.; Helms, J.R.; Morgan, J.B.; Kieber, R.J. Photodegradation of the antihistamine cetirizine in natural waters. Environ. Toxicol. Chem. 2014, 33, 2240–2245. [Google Scholar] [CrossRef]
  31. Zietzschmann, F.; Müller, J.; Sperlich, A.; Ruhl, A.S.; Meinel, F.; Altmann, J.; Jekel, M. Rapid small-scale column testing of granular activated carbon for organic micro-pollutant removal in treated domestic wastewater. Water Sci. Technol. 2014, 70, 1271–1278. [Google Scholar] [CrossRef]
  32. Anumol, T.; Sgroi, M.; Park, M.; Roccaro, P.; Snyder, S.A. Predicting trace organic compound breakthrough in granular activated carbon using fluorescence and UV absorbance as surrogates. Water Res. 2015, 76, 76–87. [Google Scholar] [CrossRef] [PubMed]
  33. Gilbert, O.; Lefevre, B.; Fernandez, M.; Bernat, X.; Paraira, M.; Pons, M. Fractionation and removal of dissolved organic carbon in a full-scale granular activated carbon filter used for drinking water production. Water Res. 2013, 47, 2821–2829. [Google Scholar] [CrossRef] [PubMed]
Figure 1. Schematic diagram of treatment in the full-scale granulated activated carbon (GAC) filter (type Norit 830W) and pilot-scale GAC columns (Norit 830W and Filtrasorb 400), and parameters used in treatment. EBCT = empty bed contact time; hGAC = height of the GAC in the filter and columns (cm); red dots represent sampling locations for OMPs.
Water 12 02053 g001
Figure 2. Results of kinetic experiments showing removal of the organic micropollutants carbamazepine and fexofenadine by granulated activated carbon (GAC) in a full-scale drinking water treatment process (Ref-N6).
Water 12 02053 g002
Figure 3. Removal efficiency profiles as a function of number of bed volumes for seven organic micropollutants in granulated activated carbon pilot-scale columns: (A) containing Norit 830W (C1-N18) and with an empty bed contact time (EBCT) of 18 min; (B) containing Filtrasorb 400 (C3-F18) and with EBCT of 18 min; and (C) containing Filtrasorb 400 (C4-F6) and with EBCT of 6 min.
Water 12 02053 g003
Figure 4. Removal efficiency profile as a function of the number of bed volumes for seven organic micropollutants in a full-scale granulated activated carbon filter (Ref-N6), filled with Norit 830W and with an empty bed contact time of 6 min.
Water 12 02053 g004
Figure 5. Removal efficiency profile as a function of number of bed volumes for all seven organic micropollutants in the full-scale granulated activated carbon (GAC) filter containing GAC type Norit 830W (Ref-N6), and in the pilot-scale GAC columns containing Norit 830W (C1-N18), Filtrasorb 400 (C3-F18) and Filtrasorb 400 (C4-F6). The x-axis is truncated at 1,060,000 BV.
Water 12 02053 g005
Figure 6. Change in methylene blue (MB) kinetic sorption factor as a function of the number of bed volumes (BV) for the granulated activated carbon types Filtrasorb 400 (light blue, columns C3-F18, C4-F6) and Norit 830W (dark blue, column C1-N18) compared with removal of (A) UV (light orange), (B) humic-like fluorescent dissolved organic matter (FDOM) (dark brown), (C) dissolved organic carbon (dark orange), and (D) protein-like FDOM (green). Percentage change for all columns (n = 4).
Water 12 02053 g006
Table 1. Compound name, molecular formula, molar mass, acid dissociation constant (pKa), log octanol/water partition coefficient (Kow) and T1/2 (half-life time, min) of concentration in the aqueous phase, and Freundlich adsorption coefficient (Kf) for the seven selected organic micropollutants (OMPs) onto two different granulated active carbon (GAC) types (Norit 830W and Filtrasorb 400).
CompoundMolecular
Formula
Molar Mass
(g mol−1)
pKaLog KOWNorit 830W Filtrasorb 400
Kf (ng g−1)nR2T1/2, minKf (ng g−1)nR2T1/2, min
CarbamazepineC15H12N2O2364.22.34.30.950.9976.79.30.970.9245.7
CetirizineC21H25ClN2O3388.92.71.7161.30.9857.2221.20.9595.8
DEETC12H17NO191.10.672.33.71.20.9898.94.61.20.9796.5
FexofenadineC32H39NO4501.79.02.89.30.970.9786.2260.510.8076.6
FluconazoleC13H12F2N6O306.12.00.255.21.10.9877.0111.20.9725.0
LamotrigineC9H7Cl2N5255.05.70.99110.780.9767.4100.820.9796.3
OxazepamC15H11ClN2O2286.01.73.361.10.9986.9111.10.9775.4

