Recent Increase of Flood Frequency in the Ionian Belt of Basilicata Region, Southern Italy: Human or Climatic Changes?


1
Department of Sciences, University of Basilicata, Via Ateneo Lucano 10, 85100 Potenza, Italy
2
Ministero dell’Istruzione, Università e Ricerca, 00153 Roma, Italy
*
Author to whom correspondence should be addressed.
Water 2020, 12(7), 2062; https://0-doi-org.brum.beds.ac.uk/10.3390/w12072062
Submission received: 23 June 2020
/
Revised: 15 July 2020
/
Accepted: 16 July 2020
/
Published: 21 July 2020
(This article belongs to the Special Issue Fluvial Geomorphology and River Management)
Abstract
:The Ionian coast of the Basilicata region, southern Italy, is characterized by a remarkable archaeological heritage, valuable crops, and national and international tourism, contributing significantly to the regional economy. In the last two decades, the area has been affected by the heavy recurrence of flooding events, which caused significant damage to agriculture, tourist infrastructure, and archaeological heritage. Both qualitative and quantitative analyses of pluviometric, hydrometric, and erosion/deposition dynamics of main rivers have been carried out in order to investigate the role played by natural factors, climate changes, and human activity. The results show that flooding events in the Metaponto plain were certainly caused by extreme rainy events, but man has also played an important role. The Metaponto plain has been involved in a reclamation consisting of the building of an extensive channel network, which provided better land cultivation, easy access to the beaches, and archaeological heritage protection. The human impact related to the absence of channel cleaning has proved to be the most relevant factor that greatly amplified the effects of low-intensity rainfall events, thus triggering flooding events.
1. Introduction
Mediterranean countries are sensitive to the combination of climate and land-use changes [1]. In the last few decades, the Mediterranean area has experienced an increase of both the frequency and the magnitude of floods and the extension of droughts which have led to huge geomorphic adjustments of river channels and coastal areas [2,3,4]. In addition to the direct consequences of climate change, there are many indirect consequences of different environmental changes resulting from human pressures [5,6]. In the last century, the development of new techniques in urban construction and the global anthropogenic impact have constituted the main geomorphological agent in controlling the environment [7]. It is now proved that anthropic interventions on slopes, rivers, and coastal environments, have deeply modified the natural environmental balance, favoring a paradoxical increase of events, thus triggering hydrogeological instability [8]. Changes in river flow regimes associated to global change are, therefore, ushering in a new era where there is a critical need to evaluate the hydro-geomorphological hazard of drainage basins from headwater to lowland areas. A key question is, how can our knowledge of these hazards associated to global change be improved? The growth of knowledge comes from integrated research that includes all physical conditions influencing the conveyance of water and sediments and, more in general, the river capacity (i.e., the amount of sediments) and competence (i.e., the ability to move grains of a given size), which in turn will influence the physical conditions of a given point in the river network.
In the Basilicata region of southern Italy, during the 20th century, the coastal environment and the fluvial valleys were affected by intense anthropization. The Ionian coastal area, known as the Metaponto plain, is today devoted to valuable crops (apricots, strawberries, etc.) thanks to the reclamation of the marsh areas and the channeling/filling of secondary channels. Currently, the agriculture represents the first source of both economic and employment wealth of the region. The archaeological ruins of both Greek and Roman ancient civilizations are also located in this area. Their relevance is so high that the Metaponto plain has recently been proposed as a UNESCO World Heritage Site. Moreover, the area is characterized by a strong tourist vocation. This has become relevant from an economic point of view in recent decades after the massive anthropization that has led to the building of many tourist villages and river ports at the mouth of the Basento and Agri rivers [9]. Unfortunately, from a geomorphological point of view, the Metaponto plain is particularly prone to suffer flooding [10,11]. Many of these are river flooding which happened because of persistent thunderstorms for extended periods. However, an important number of cases can be referred to flash floods, due to extreme rainfall occurred in few hours. In some cases, relatively shallow minor flooding due to the accumulation of excessive surface runoff has also been recorded. Data from the National Civil Protection revealed that 23 extreme hydrological events occurred from 1921 to 1999 in the Ionian belt, whilst only 19 events have been recorded from 2000 to the present day. These recurrent floods caused huge economic damages in the Basilicata, such as the flood events of autumn 2013 that produced about 45 million euros of damages, involving farms damages in the Metapontino area for at least 27 million euros. Furthermore, the last flood of November 2019 caused damages up to 46 million euros in the area.
Given the considerable weight of agriculture and tourism on the entire regional economy, the need for an in-depth study based on the causes of seasonal flooding becomes urgent. People should be able to define adequate territorial planning to restore the natural balance of the area in order to ensure its economic sustainability. A key question is how our knowledge of these hazards associated with global change can be improved. With the aim to answer to this question, we tried to better define the real rules of climatic change and human impact in triggering flooding every year analyzing both qualitative and quantitative pluviometric, hydrometric, and erosion/deposition dynamics of the area. Considering the geographical location of the Basilicata region in the Mediterranean area, this work can be considered of general interest since the problem addressed and described concerns almost all the coastal environments of the Mediterranean region.
2. Location and Background of the Metaponto Plain
2.1. Geographical Setting
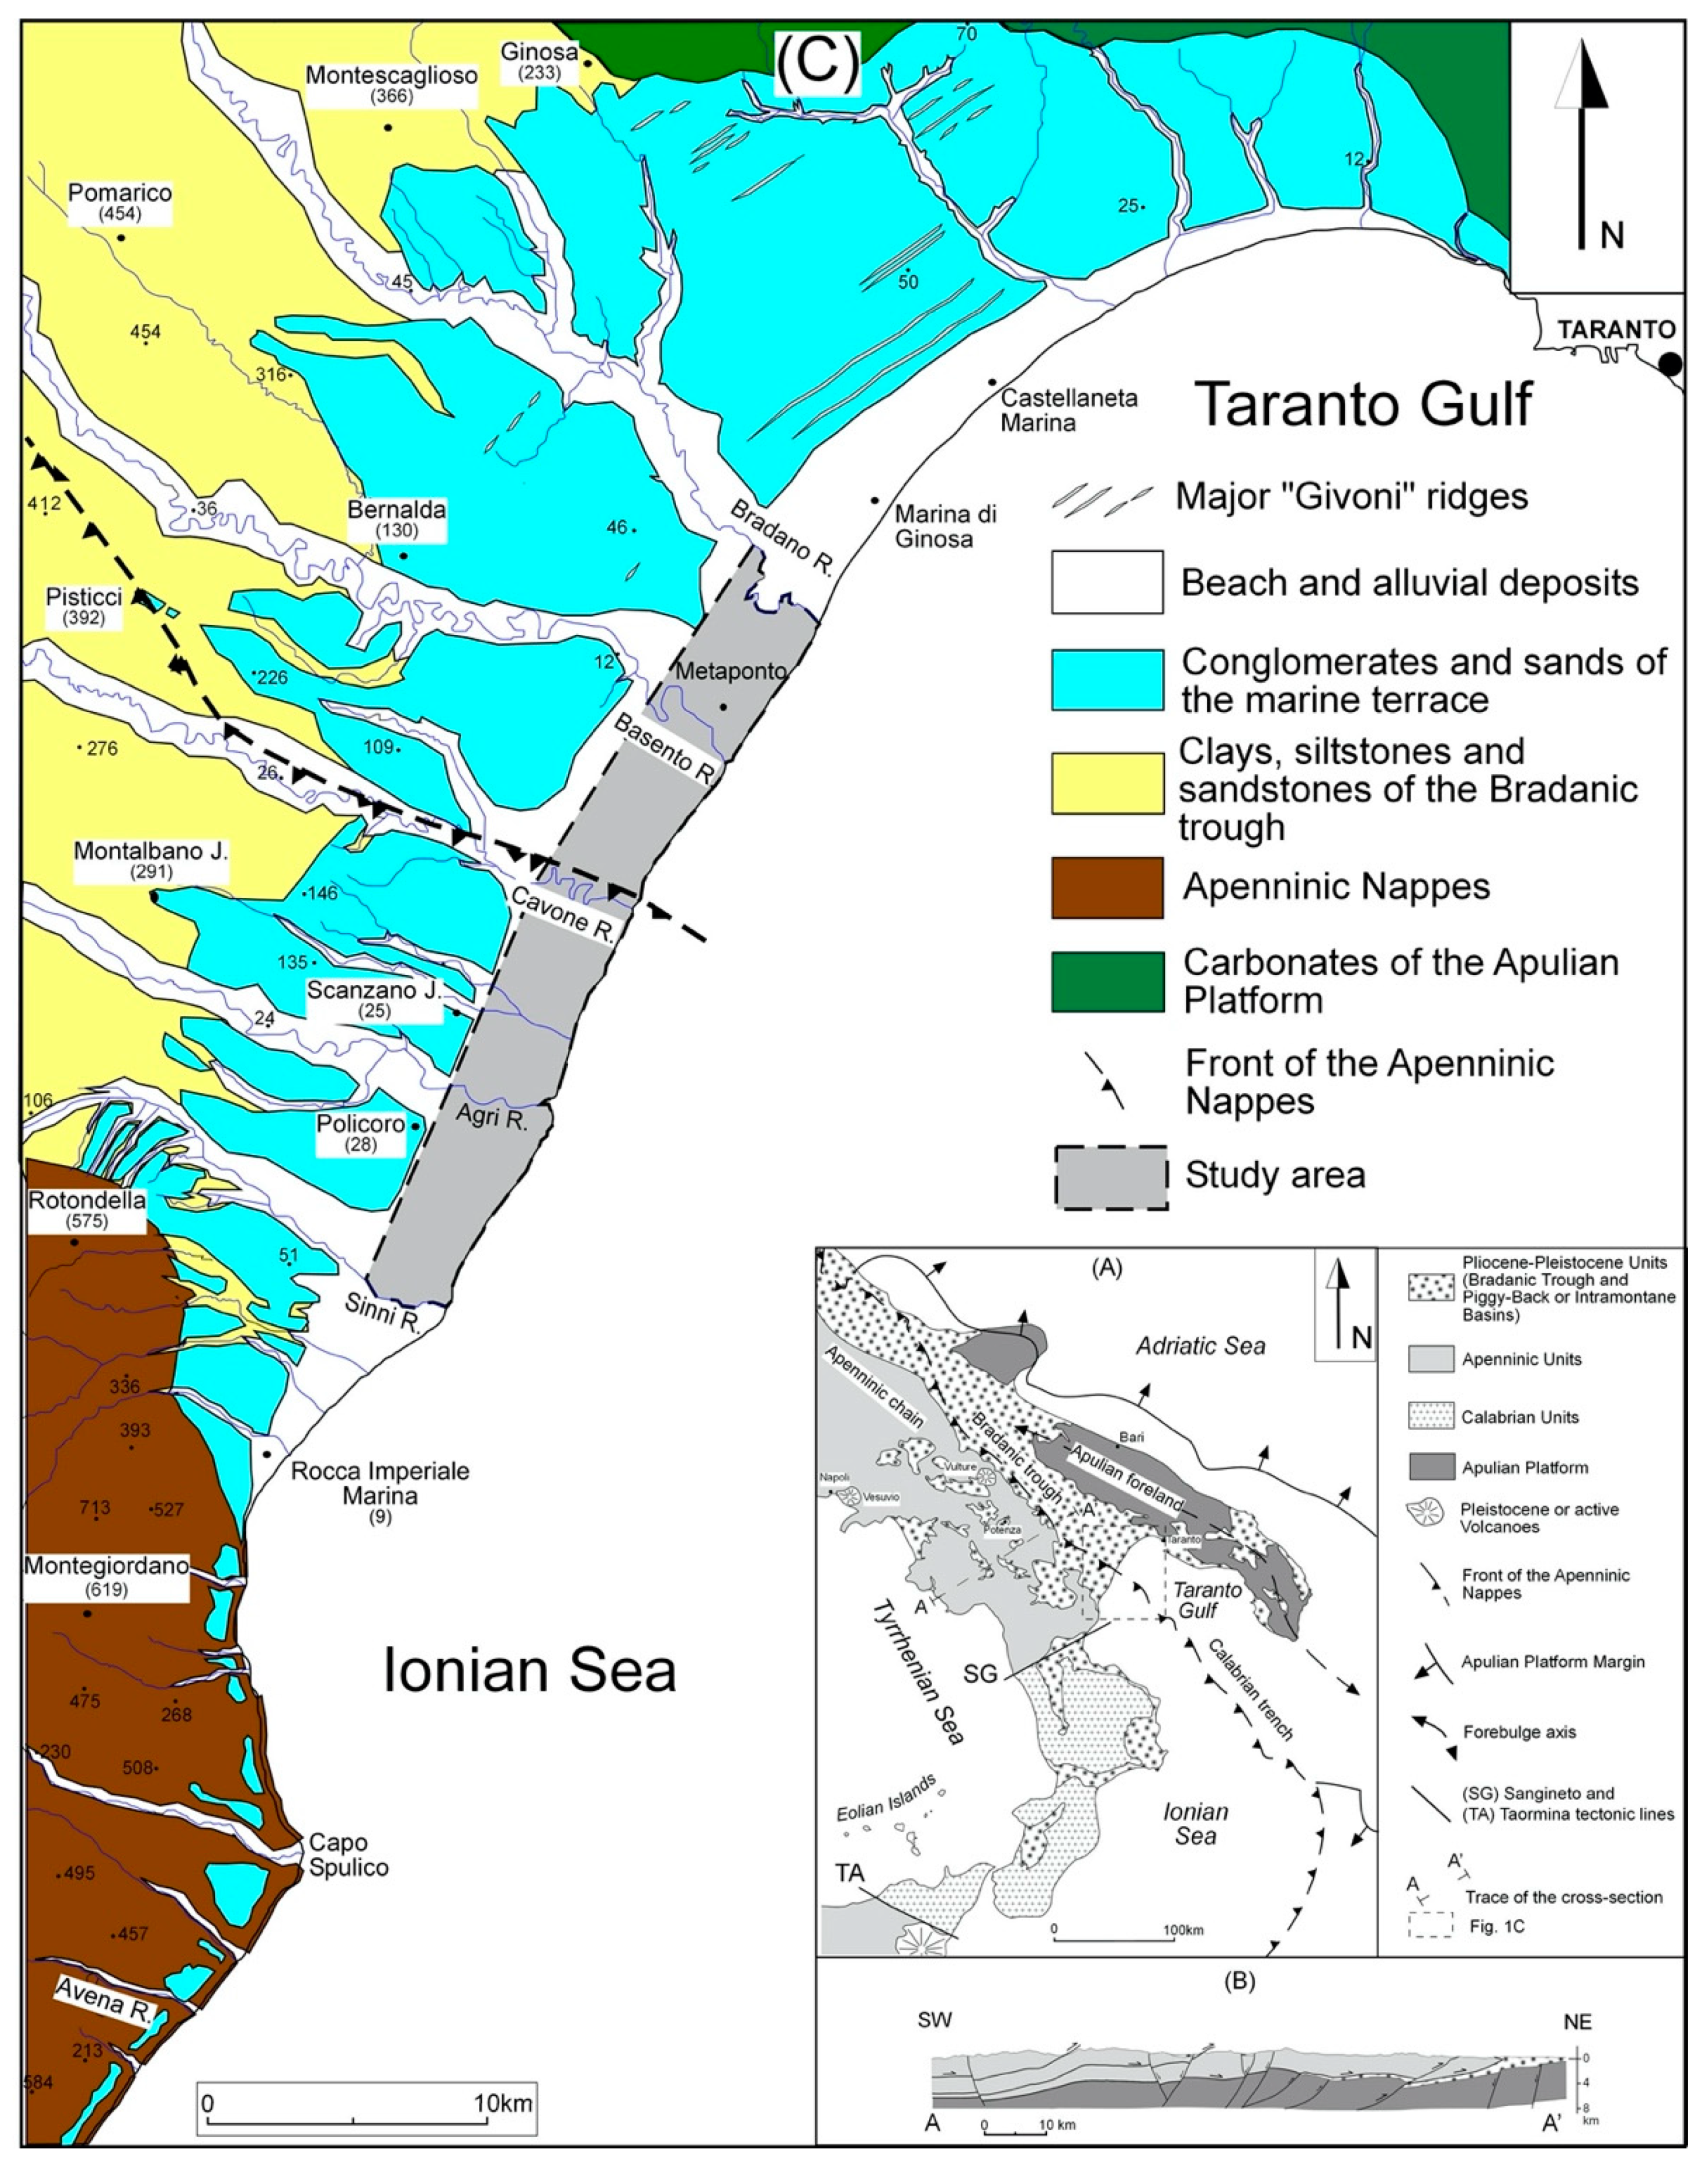
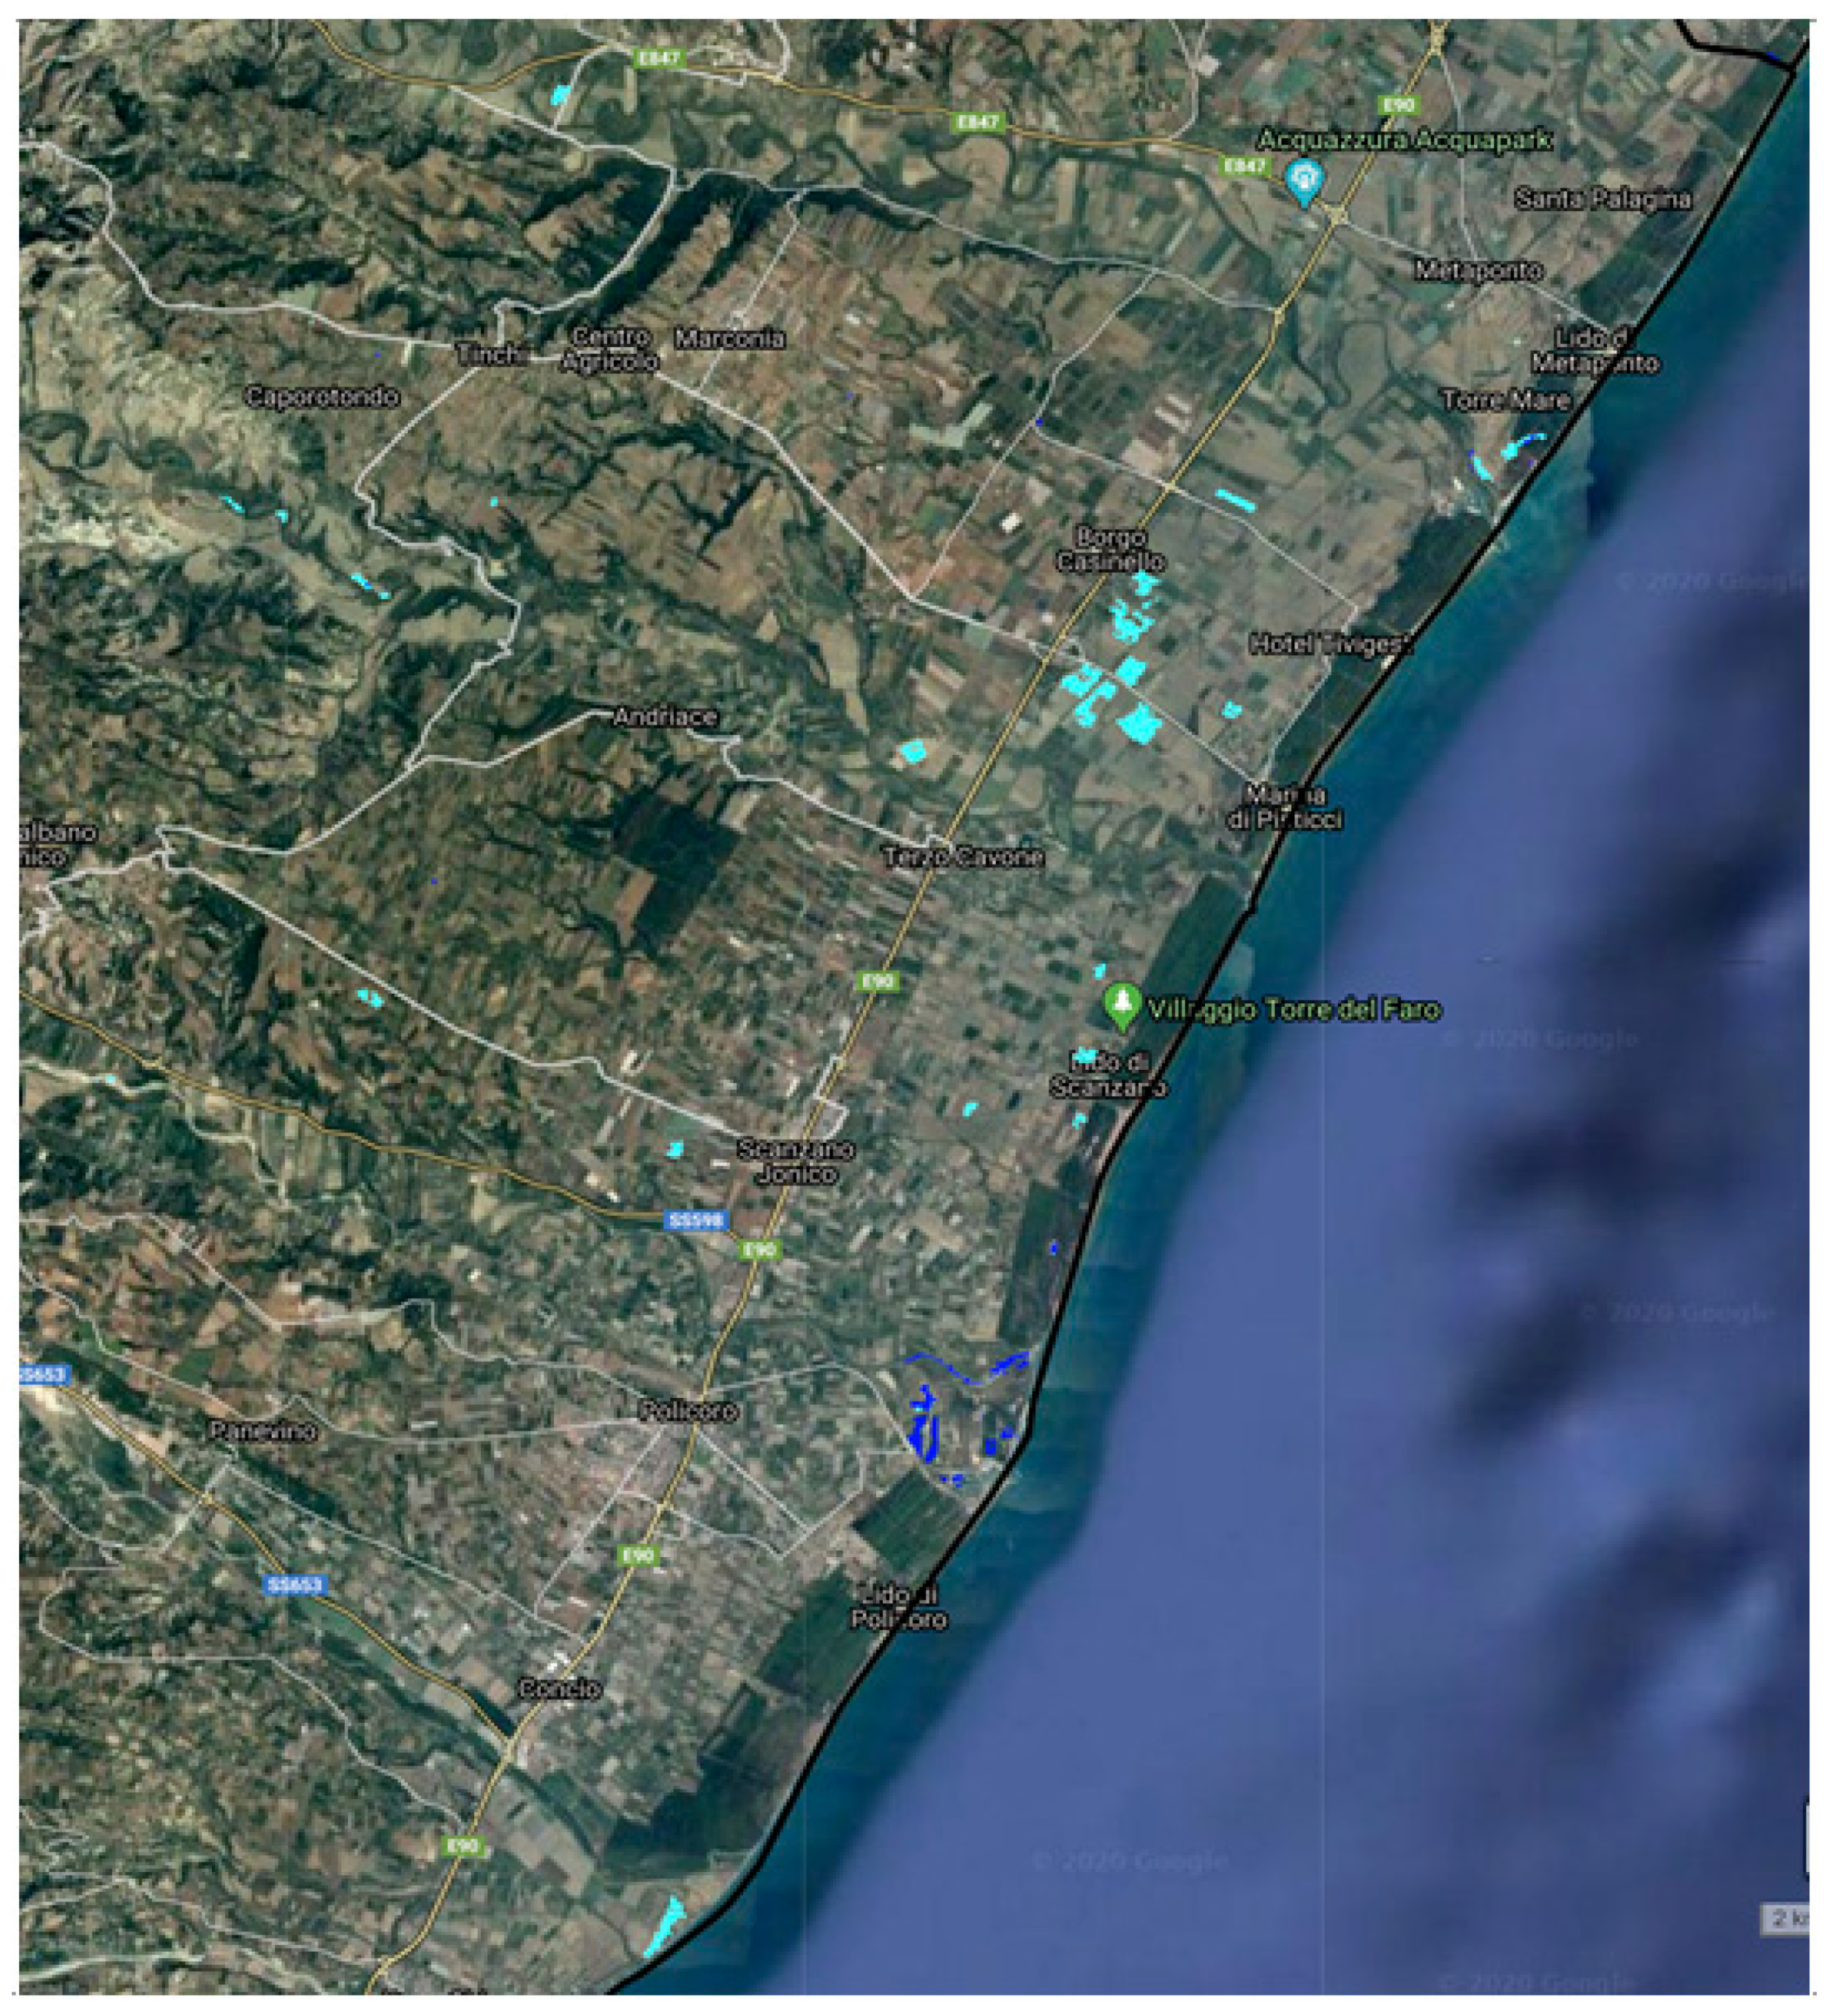
The study area is located in the south-eastern part of the Basilicata (Figure 1a). It is part of the so-called Metaponto coastal plain and covers a surface of about 125 km2. The plain is a NE–SW-oriented belt, enlarged about 4 km in width toward the hinterland, and of about 30 km in length measured parallel to the coastal line (Figure 1c). Moreover, the plain is slightly sloped by about 0.7% toward the Ionian Sea and shows a tilting toward the northeast [12], producing an elevation of about 30 m a.s.l. in the southern part and 18 m a.s.l. in the northern part. The study area is characterized by a semi-arid climate [13] due to the precipitation dynamics, which are mainly concentrated in multi-daily events, separated by very long dry spells [14,15]. The Metaponto coastal plain is transversally cuts by five main rivers flowing from NW to SE, in the Ionian Sea, and known as the Sinni, Agri, Cavone, Basento, and Bradano Rivers. Their final reaches are quite meandering, although, in many cases, the channels are rectified by human activities to furnish agriculture and tourist facilities. Three main villages are found in the study area: the first is located at Metaponto site in the northern sector and represents a relevant Greek archaeological site; both the second and the third sites of Scanzano Jonico and Policoro, which are placed in the southern sector, are mainly touristic areas. Furthermore, many beaches have numerous accommodation facilities for mass tourism, including small ports.
2.2. Geological and Geomorphological Settings
The study area is placed in the southeastern part of the Bradanic trough [16], which is located between the Apennine chain to the west and the Apulian foreland to the east [17] (Figure 1a). The Southern Apennines are an E-verging fold-and-thrust belt built during the deformation of the Mesozoic circum-Tethyan domains. The belt is composed of several tectonic units derived from different paleogeographic domains that are tectonically overlapped on the buried Apulian platform (Figure 1a,b). The most recent shortening occurred on the front range of the chain deforming the Pleistocene sediments and volcanics. Moreover, due to extensional tectonics, the orogeny is still active along the axis of the Apennine chain [18,19,20,21]. The Bradanic trough was filled by Pliocene–Pleistocene sedimentary successions constituted by a transgressive regressive clastic sequence of conglomerate, sand, and clay several thousand meters thick (Figure 1a–c) [22,23]. The sinking of the area occurred during the Early Pleistocene and was responsible for the deposition of marine clays, unconformably overlaid by Middle to Upper Pleistocene coarsening upward deposits, made up of marine to continental silt, sand, and conglomerate. The Bradanic trough is characterized by a medium- to low-relief landscape, featured by gently dipping surfaces, less than 3–5° of slope angle [12,24], separated by scarps, representing relics of Middle Pleistocene to Holocene staircase marine terraces, composed of conglomerate and sand deposits 10–15 m thick [25,26] (Figure 1c). Recently, integrated analysis of the drainage network, statistical properties of the landscape, morphostructural analysis, and evaluation of geomorphic indices in the whole Bradano Foredeep area have provided new constraints on the late Quaternary evolution of the area [27,28]. In particular, the study area is formed by two main lithostratigraphic units—the older are named “sandy-conglomeratic deposits of the regressive coastal prisms” of the Late Pleistocene and the younger are named “Metaponto plain deposits” of the Holocene [29,30,31]. Moreover, about 100 m thick marine deposits attributed to Middle Pleistocene are recognized below these two units by means of deep boreholes [29].
Close to the Ionian coastline, there is a sandy beach less than 100 meters large that passes, toward the hinterland, to NE–SW-oriented multiple coastal dune ridges. The ridges run parallel to the coastline and are separated by a small, elongated corridor of low swales, which hosted palustrine areas that were also active during historical times. The dune ridges locally named as “Givoni” are about 20 m high and are fixed by grasses or scrub vegetation [27,32]. Backward to the dune system, there is an alluvial plain formed by the flooding of the Agri, Cavone, Basento, and Bradano Rivers. In the fluvial valleys, the meandering sinuosity of channels increases toward the Sea, reaching its maximum value about 3 km before the mouths. Finally, at the mouth of the main rivers there are delta system features [28]. A coastal progradation occurred in the last 7–8 ky, as a consequence of the high values of sedimentary yields coming from rivers [9,33]. The fluctuation of the coastline from the last 3 ky until 1800–1900 has been reconstructed by lithic manufacts detected in the Basento River valley [34]. Starting from 1950 a constant transgression of the coastline around 2–6 m/y was measured in the whole Ionian area and was related to both human activities and climate changes [34]. Currently, the lowland sectors of the Ionian coastal plain are still affected by seasonal flooding along the main rivers, which occurred during high-magnitude rainfall events [33].
2.3. Human Activity
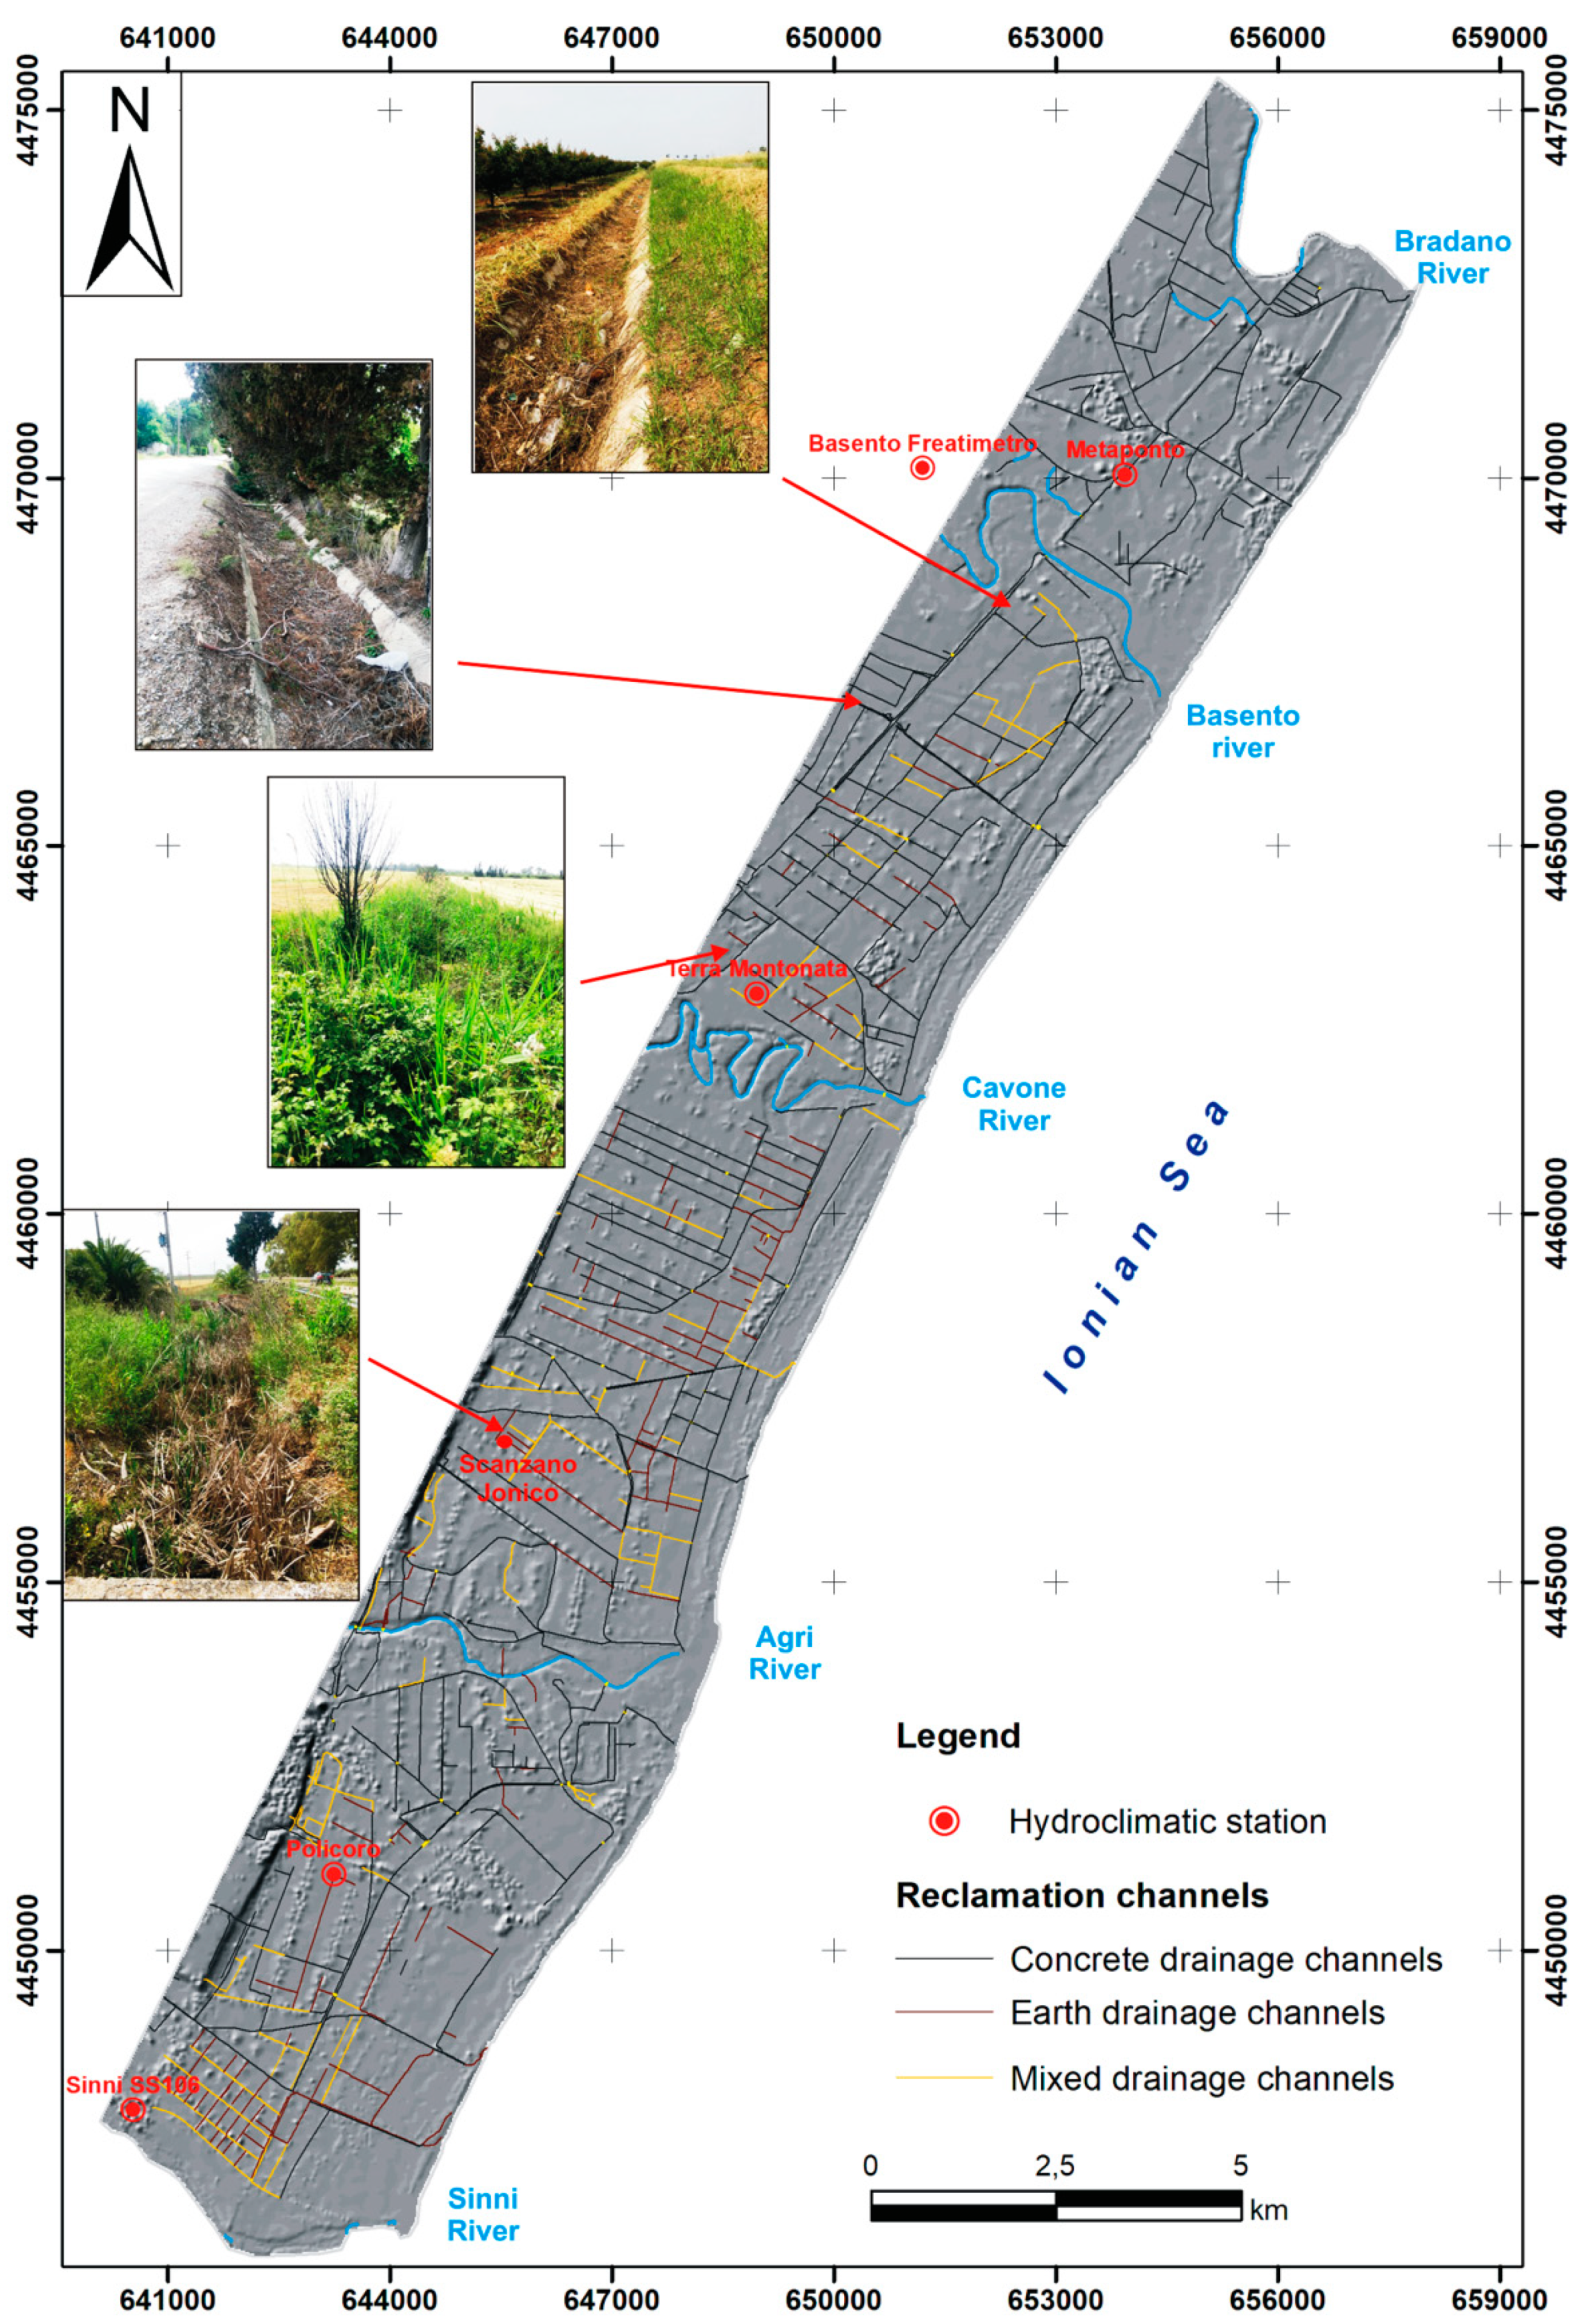
During the last century, the area was interested in a huge hydraulic reclamation, becoming the most prosperous agricultural area in the region. The reclamation took place in two different moments, placed before and after the end of the Second World War, respectively. It was carried out through a network of channels, which developed for approximately 1200 km (Figure 2). The fluvial network strictly follows the ground topography and consists of several orders of channels, of which the smaller ones immediately flow together and join into main channels, which flow into collectors that can run separately or into the water pump. The channels are made up of mainly concrete channels (46.6%), while 26.6% of them are made up of terrain (26.6%) and 26.8% of both materials (mixed channels). The 92.8% of channels are unburied and, only in very few cases, they consist of short siphons or very short delivery pipes of water-pumping plants (0.8%). The result of the hydraulic reclamation was the complete reclamation of an area of approximately 26,500 hectares, which currently houses a rich and intense irrigation agriculture, which was previously impossible.
3. Materials and Methods
The paper has been carried out in two different phases. The former was spent in recovering and cataloguing the flooding events from 1933 to 2019. The latter was based on a multitemporal analysis of pluviometric data, hydrometric data, and digital terrain models (DEMs of 1949, 1986, and 2013) corroborated with observations from field surveys in order to
- assess the role of precipitation on the rainfall floods occurred in the study area;
- assess the human impact.
Flooding information has been obtained through a deepened search of the literature, including national and local newspapers and journals, Internet blogs, scientific and technical literature journals [35,36], and national projects [37]. Information, collected and stored in the catalogue and related to each flooding event includes (1) the exact or approximate date of the flood; (2) the river basin where the flood took placel (3) the source of information; and (4) the daily rainfall (P1) and the previous cumulate rainfalls over three (P3), 15 (P15), and 30 (P30) days from the rain gauges of Metaponto and Policoro.
3.1. Precipitation Patterns
Daily pluviometric data from 1951 to 2019 relative to the station measure of Metaponto and Policoro sites have been obtained from the National Hydrographic Service and the Metapontum Agrobios. Changes in the precipitation patterns during the whole above-mentioned period, are computed considering five different climatological normal corresponding to the interval years of 1951–1980, 1961–1990, 1971–2000, 1981–2010, and 1990–2019. A climate normal is defined, by convention, as the arithmetic mean of a climatological element computed over three consecutive decades [38]. Furthermore, in each normal several indices, as recommended by the World Meteorological Organization, have been evaluated. First of all, the total annual precipitation (TP) and the mean amount of precipitation per wet day (precipitation intensity, hereafter PI) have been examined. To detect possible trends in daily precipitation extremes, we used the threshold of 90th percentile and examined the fraction of total precipitation from events > long-term 90th percentile (fraction of total from heavy events, PFL90) and the number of events > long-term 90th percentile (number of heavy events, PNL90). These indices account for short term heavy precipitation, possibly of a convective nature. Also, the greatest three-day total precipitation (P3M) and the greatest five-day total precipitation (P5M) have been examined. The multi-day amounts are particularly important since larger-scale impacts from heavy precipitation are mostly due to multi-day episodes, and five-day amounts are frequently considered measures of the occurrence of floods in Regional Climate Model studies [39,40]. At last, the mean dry spell lengths (days) (DSM), the maximum number of consecutive dry days (CDD), the mean wet spell lengths (days) (WSM), and the maximum number of consecutive wet days (CWD) have been calculated. Trend significance was tested employing the non-parametric Mann–Kendall trend test [41] by using the Excel template application MAKESENS Version 1.0 [42].
3.2. Dynamics of Erosion/Deposition Processes
To evaluate the human impact in the study area, in terms of erosion and deposition, we performed a multitemporal analysis by using DEMs applications. Contour lines and mass points of the area are available for the years 1949, 1986, 2013. The 1949 DEM was constructed from 10-m spaced contour lines, mass points and break lines (streams incision) acquired from the Istituto Geografico Militare Italiano. The algorithm used for spatial interpolation was the Topogrid ArcInfo command, which uses an iterative finite difference interpolation technique producing DEMs without losing the surface continuity of methods such as kriging or splines. The horizontal resolution given in the DEM has been of 10 m. The 1986 DEM was constructed from 10 m contour lines, mass points and drainage lines acquired from the Technical Cartography of Basilicata Region. They were built with a 10 m horizontal resolution in order to make a better comparison with the 1949 DEM. The 2013 DEM was extracted by 1 m contour lines, mass points, and drainage lines acquired from the Technical Cartography of Basilicata Region (https://rsdi.regione.basilicata.it/dbgt-ctr/). It has been built with a 10 m horizontal resolution to make a better comparison with the previous DEMs. The accuracy of the three DEMs was checked through a field survey using differential GPS, but a detailed analysis of the vertical errors among the different DEMs [43] has been neglected. Actually, the goal to be pursued is not a detailed assessment of erosion and accumulation rates. The aim is to show, particularly in qualitative terms, to what extent the anthropogenic or/and natural modification of the area has produced variations in soil consumption over the years. Both the erosion and deposition rates have been computed by progressive subtractions using the digital elevation models in a grid format (1986–1949; 2013–1986; 2013–1949). The subtraction of different DEMs produced a new grid with the altitude difference for each cell of the grid. A negative value in cells of the difference grid was interpreted as erosion, a positive value as filling or aggradation, and a very low or zero value as stable areas. Although this analysis is rather simple and coarse, we found that it is quite effective to provide immediate information that can easily be combined with field surveys.
4. Results
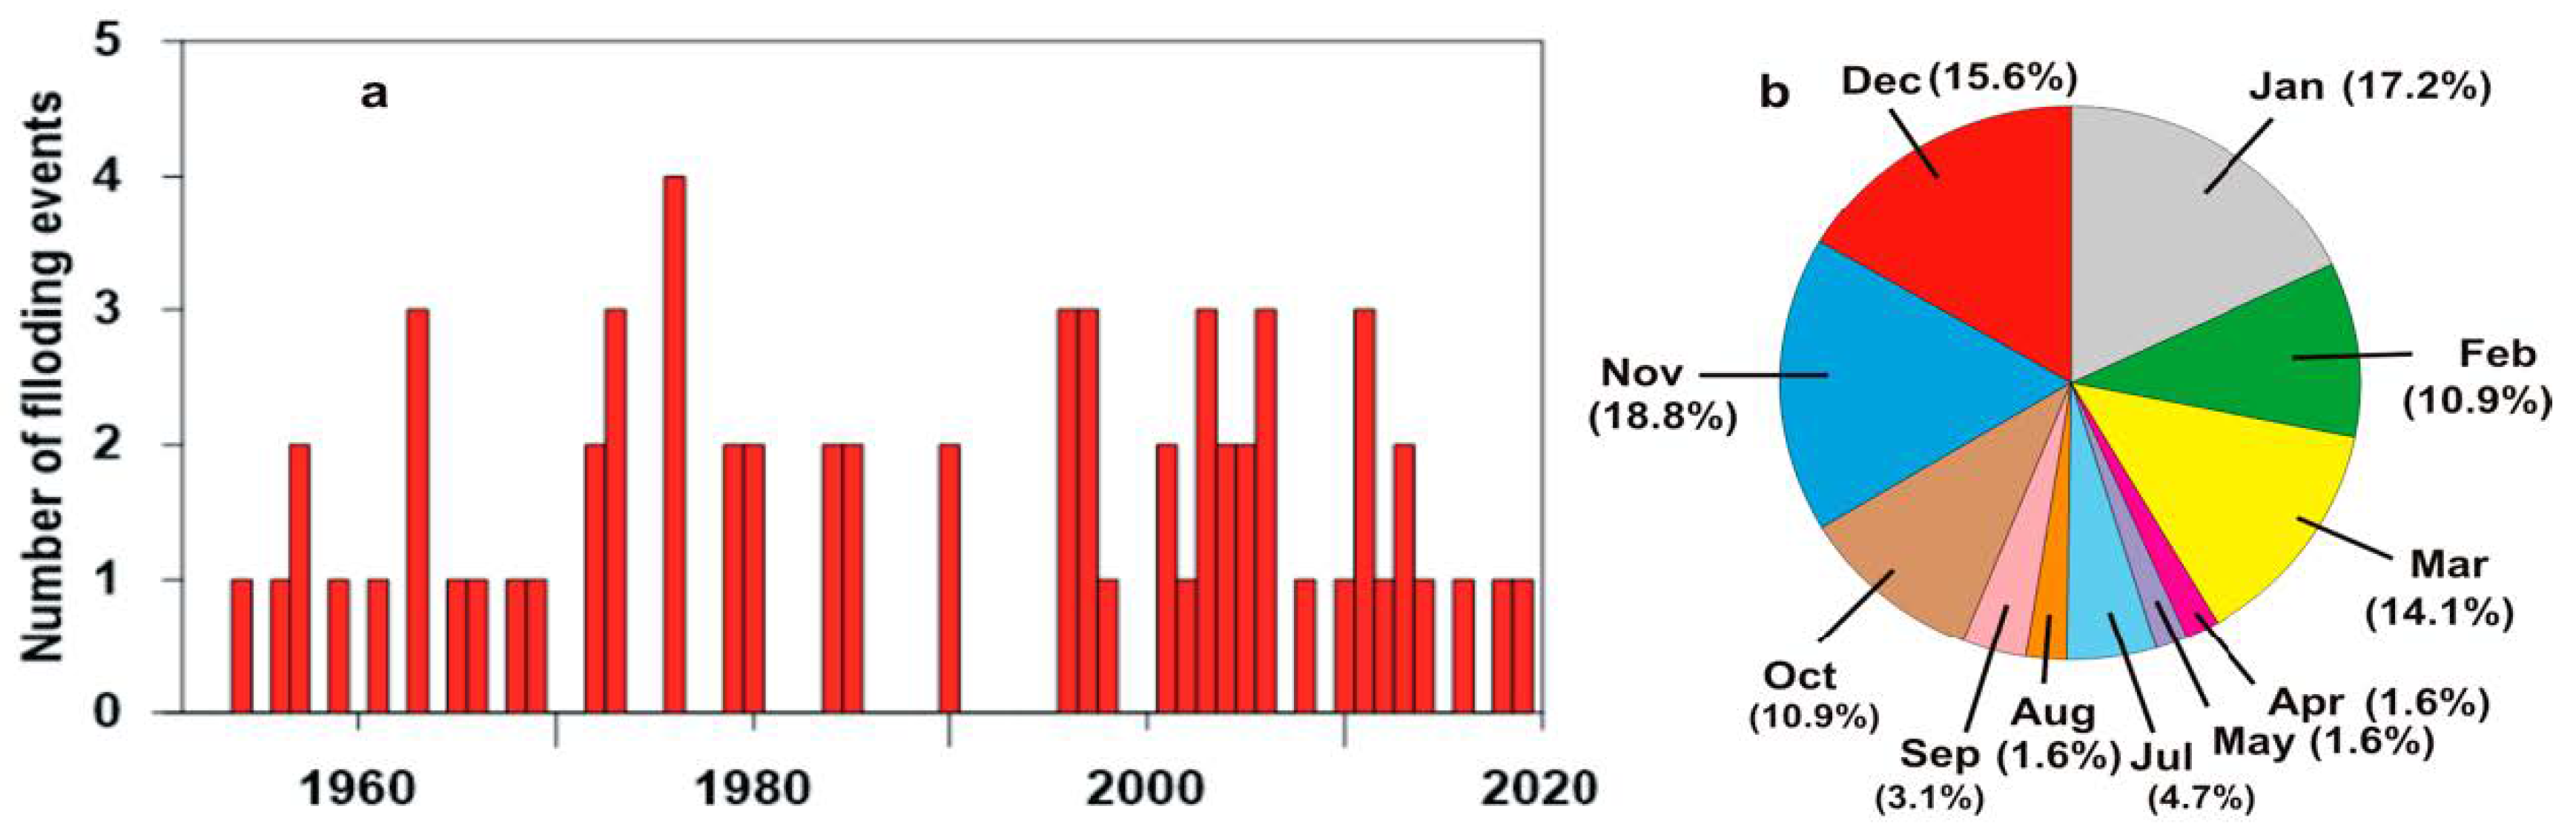
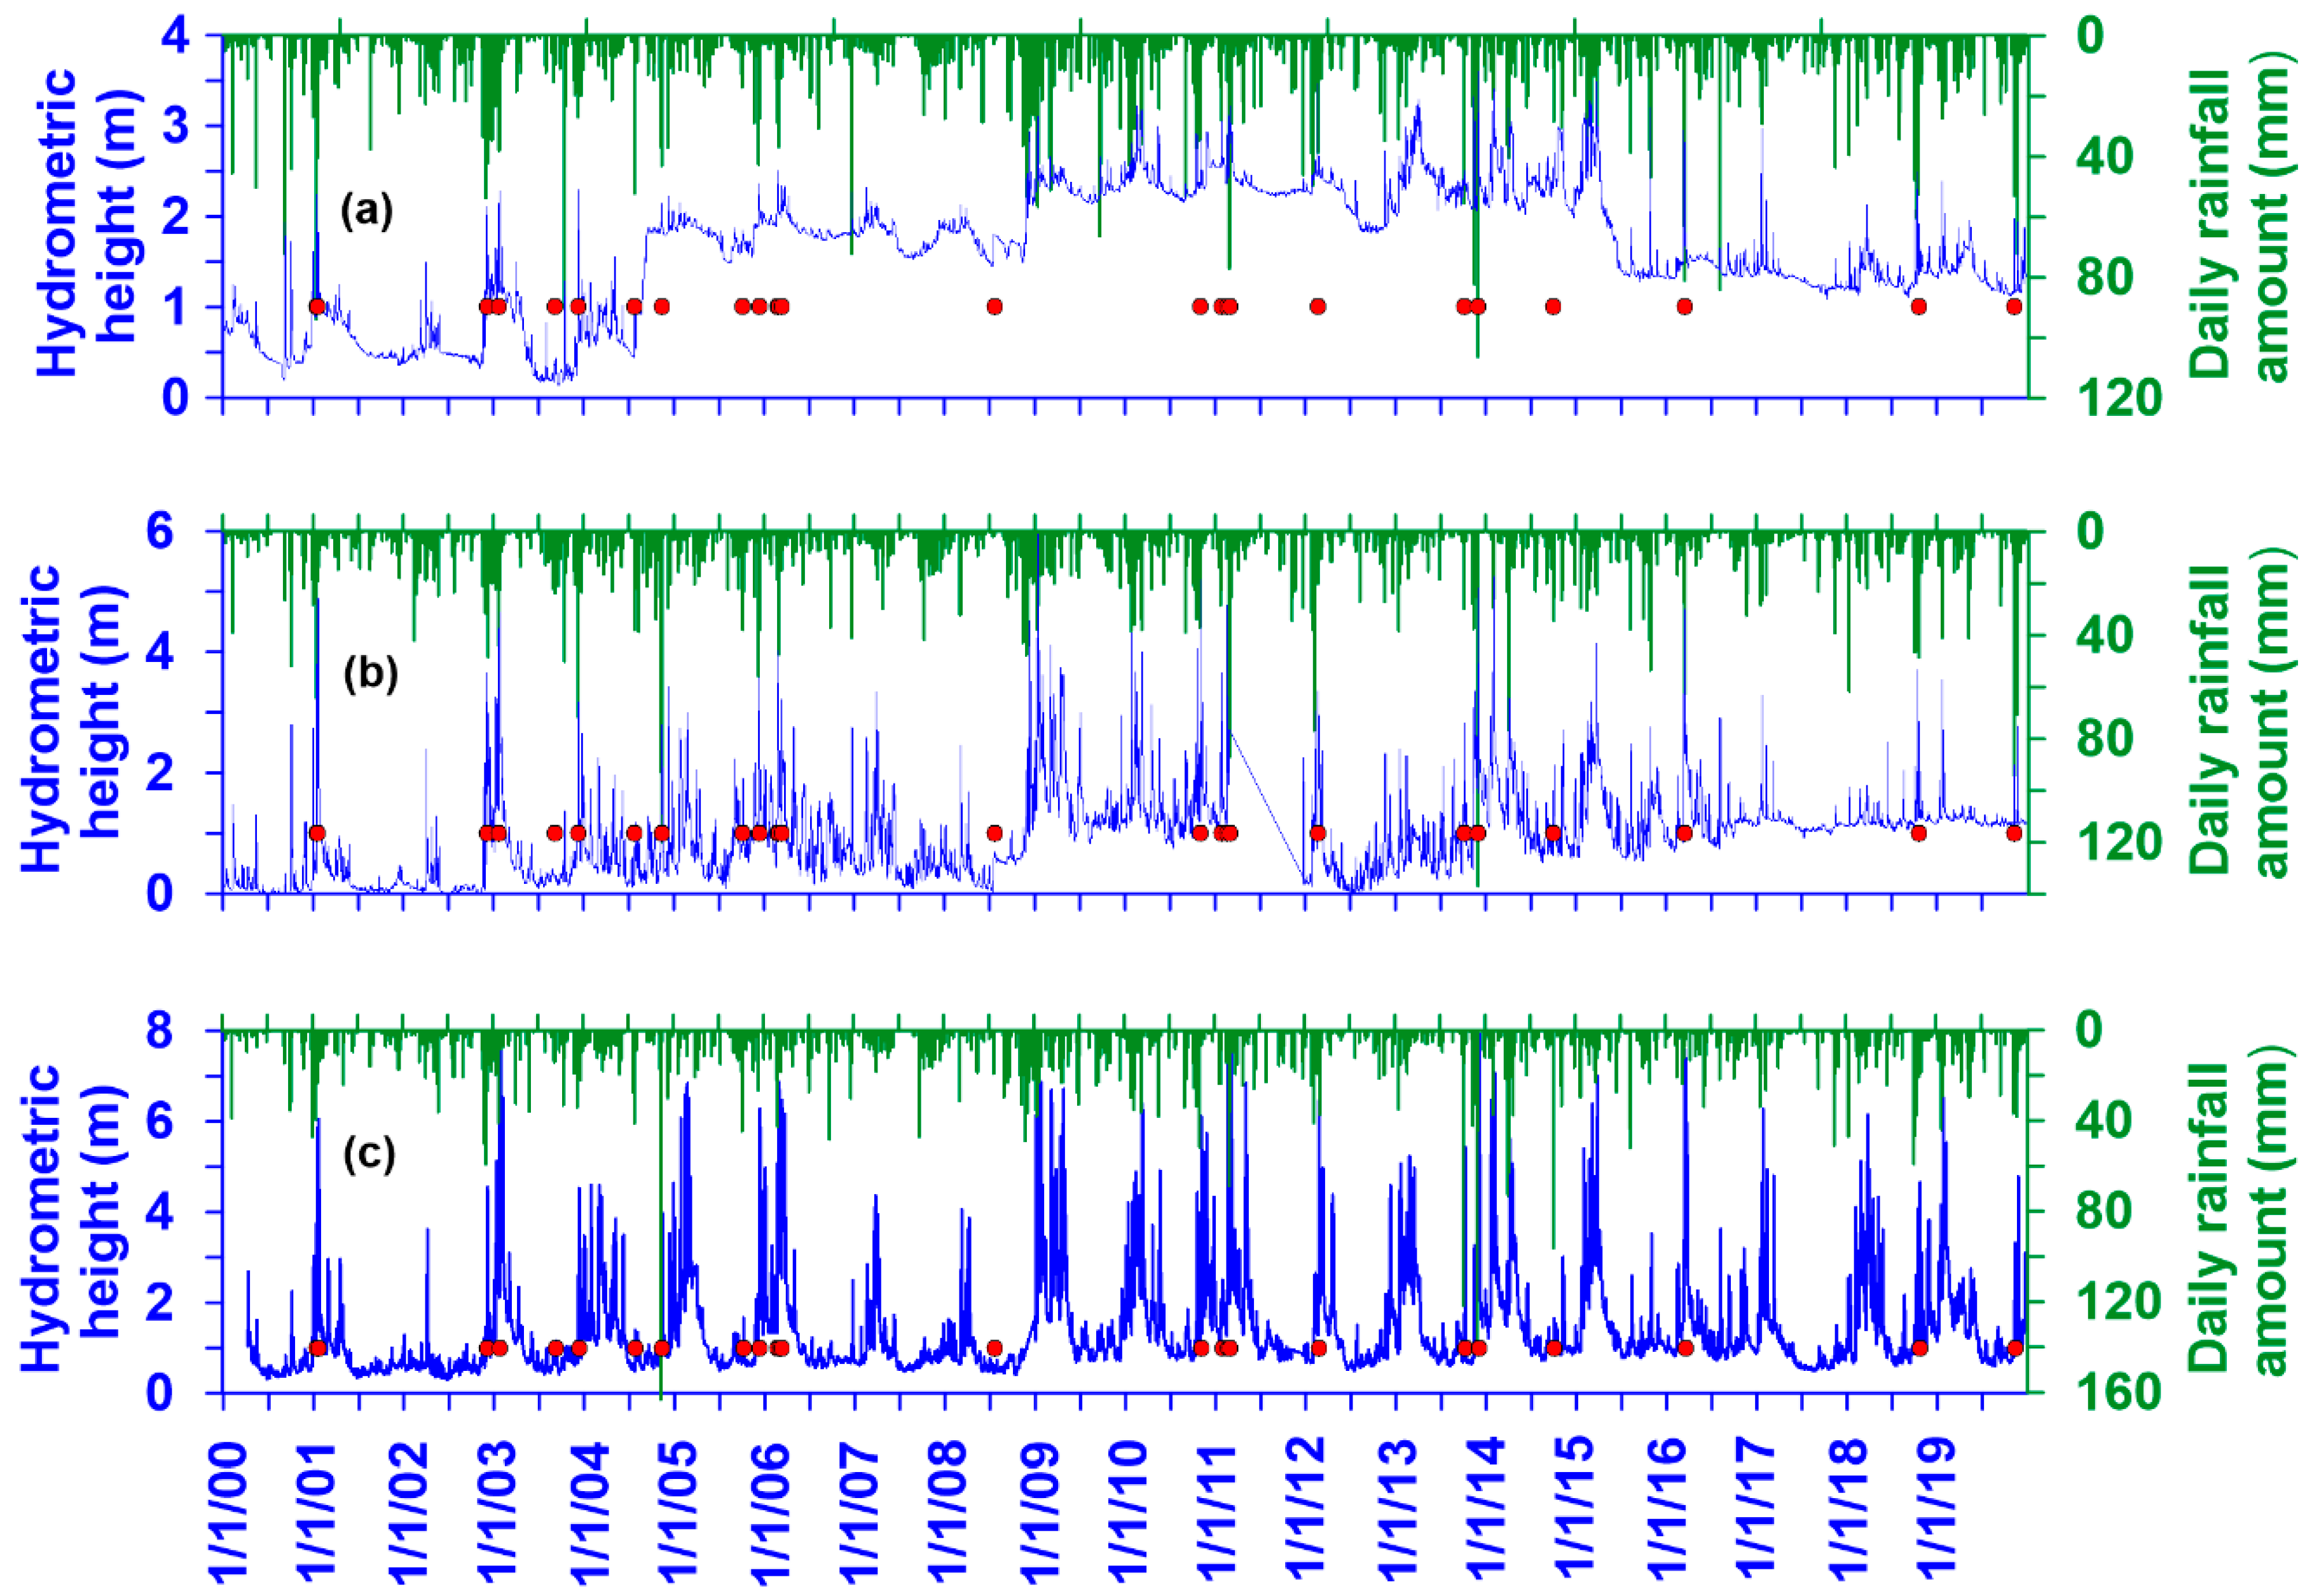
All the flooding information is organized in a catalogue form containing a list of 67 flooding events starting from 1933 to 2019 (Table 1). The majority of events (96%) were ranging from 1954 to 2019 (Figure 3a) and were characterized by strong seasonality. Many floods occurred from late Autumn to early Spring, although several events took place in July (Figure 3b). Furthermore, it can be observed that in the last two decades there has been a decrease in the flood return period, with consequent increase in the annual and intra-annual frequency of flash floods. As evidenced from the data reported in Table 1 several of the floods occurring in the last decades were caused by rainfall with moderate intensity (lower than 20 mm), even when they were concentrated in five consecutive days. Conversely, those which took place in the range of 1951–1980 years were often caused either by daily extreme events or by heavy fifteen days cumulates. The available data on both the daily pluviometric and hydrometric measures, included in the range of 2000–2019 years, are related to rain gauges of the three sites of the Basento water level indicator (freatimeter) (Basento river basin), of the Terra Montonata (Cavone river basin), and of the Sinni 106 (Sinni river basin). Thus, we considered the relationships between the daily precipitation and the hydrometric height in three out of the five streams flowing across the study area. Although we observed that the hydrometric height of the Basilicata rivers mainly depends on the precipitation occurred in the upper basin upstream rather than on localized heavy storms, we still consider it interesting to examine carefully this relationship, since it can let us deeply investigate the causes of flood initiation. The interaction between the daily precipitation (mm) and the hydrometric height of the Basento, Cavone, and Sinni rivers during the flooding events that occurred from 2000 to 2019 is shown in Figure 4. The analysis of the diagram of Figure 4 confirms the above-mentioned interpretation showing that there is not always a direct relationship between the flooding events and the peaks of the hydrometric heights.
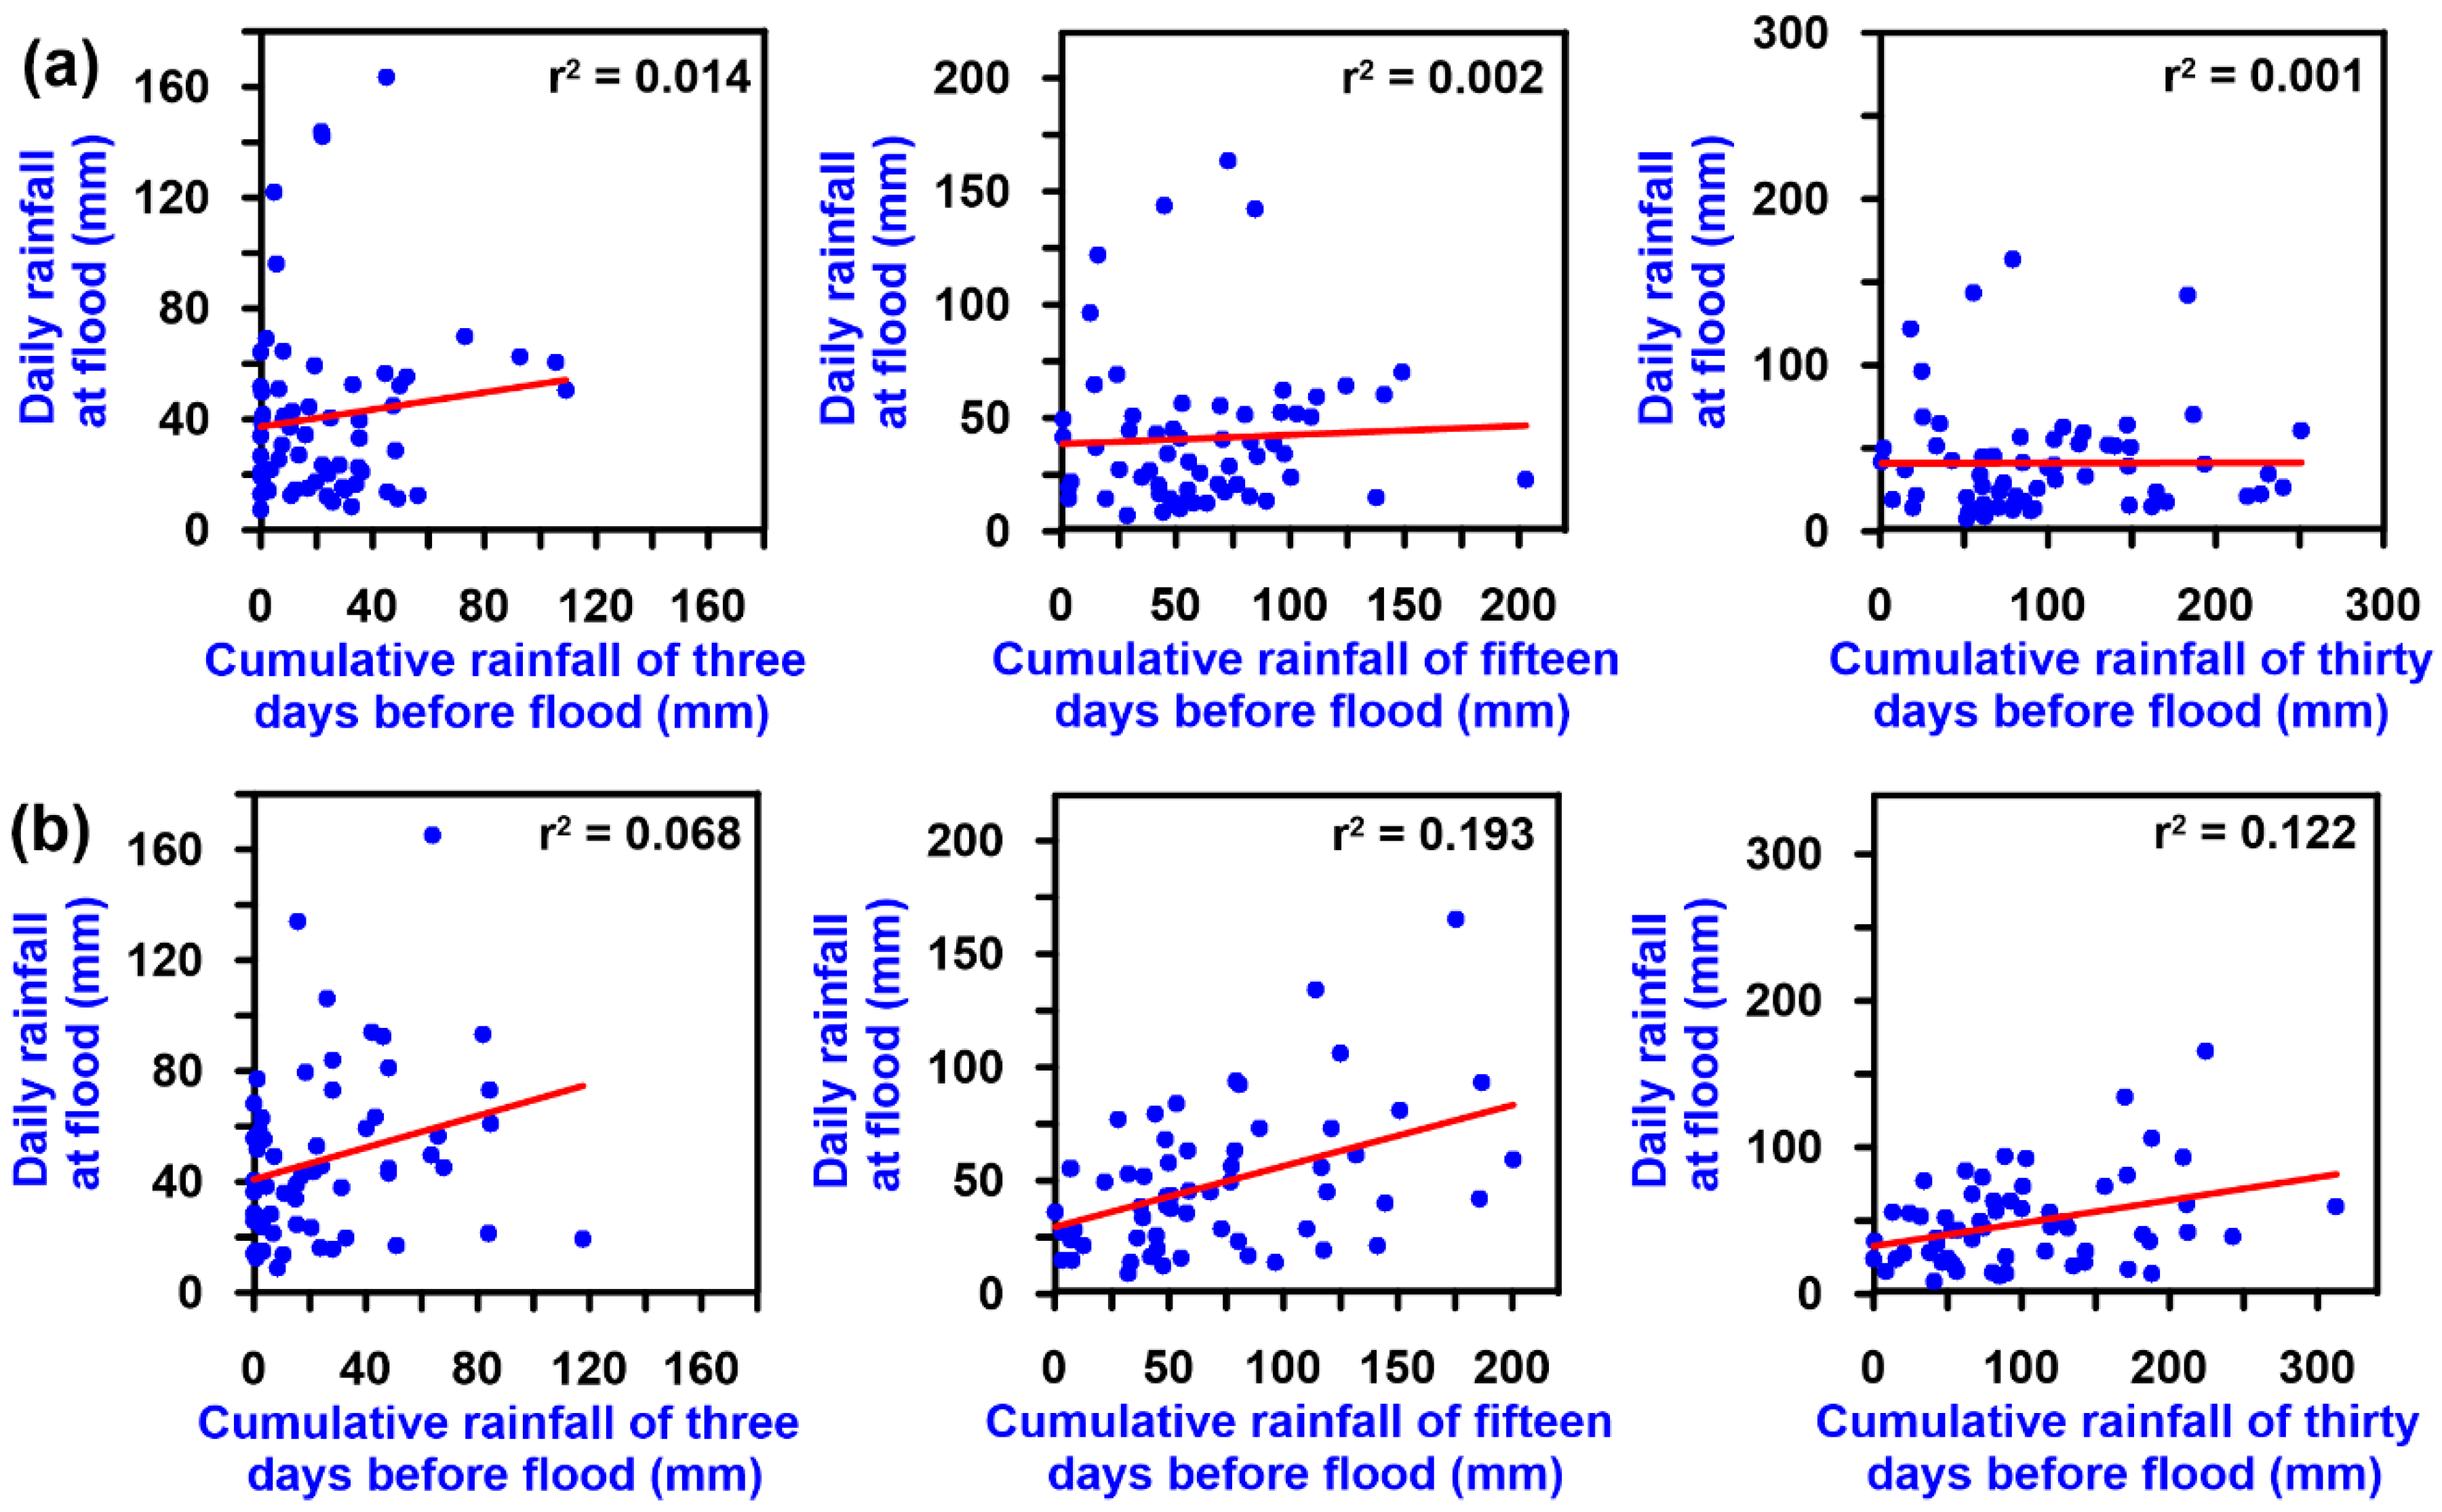
In several cases, although there are no high rainfall quantities and the hydrometric heights of the main rivers are relatively low, flooding occurs. Conversely, in many cases where huge precipitation and significant increases in the rivers hydrometric water levels occur, there are no flooding events. It might be due to the saturation of unsaturated zones of the coastal plain aquifer system. In the coastal plain four hydro-lithological units have been identified [44]. According to [44], the upper unit is made up of discontinuous clay and silty clays, which reach a maximum thickness of 10 m in the coastal sector between the Cavone River and the Sinni River. An intermediate more than 10 m thick sandy unit lies under the top unit and over a lower clayey unit. The lower unit is made up of silt and sand. Thus, the presence of two impermeable units makes it possible to saturate the aquifer in conditions of abundant previous rainfall. To verify the role of antecedent rainfall, the daily triggering precipitation versus the cumulated rainfall over three, 15, and 30 days before each flood event were plotted (Figure 5). The relationships are characterized by a very low value of r2, showing an uncertain correlation between trigger precipitation and antecedent precipitations. It means that many flood events are flash floods. Thus, it can be seen that most of the events are flash floods.
4.1. Pluviometric Dynamics
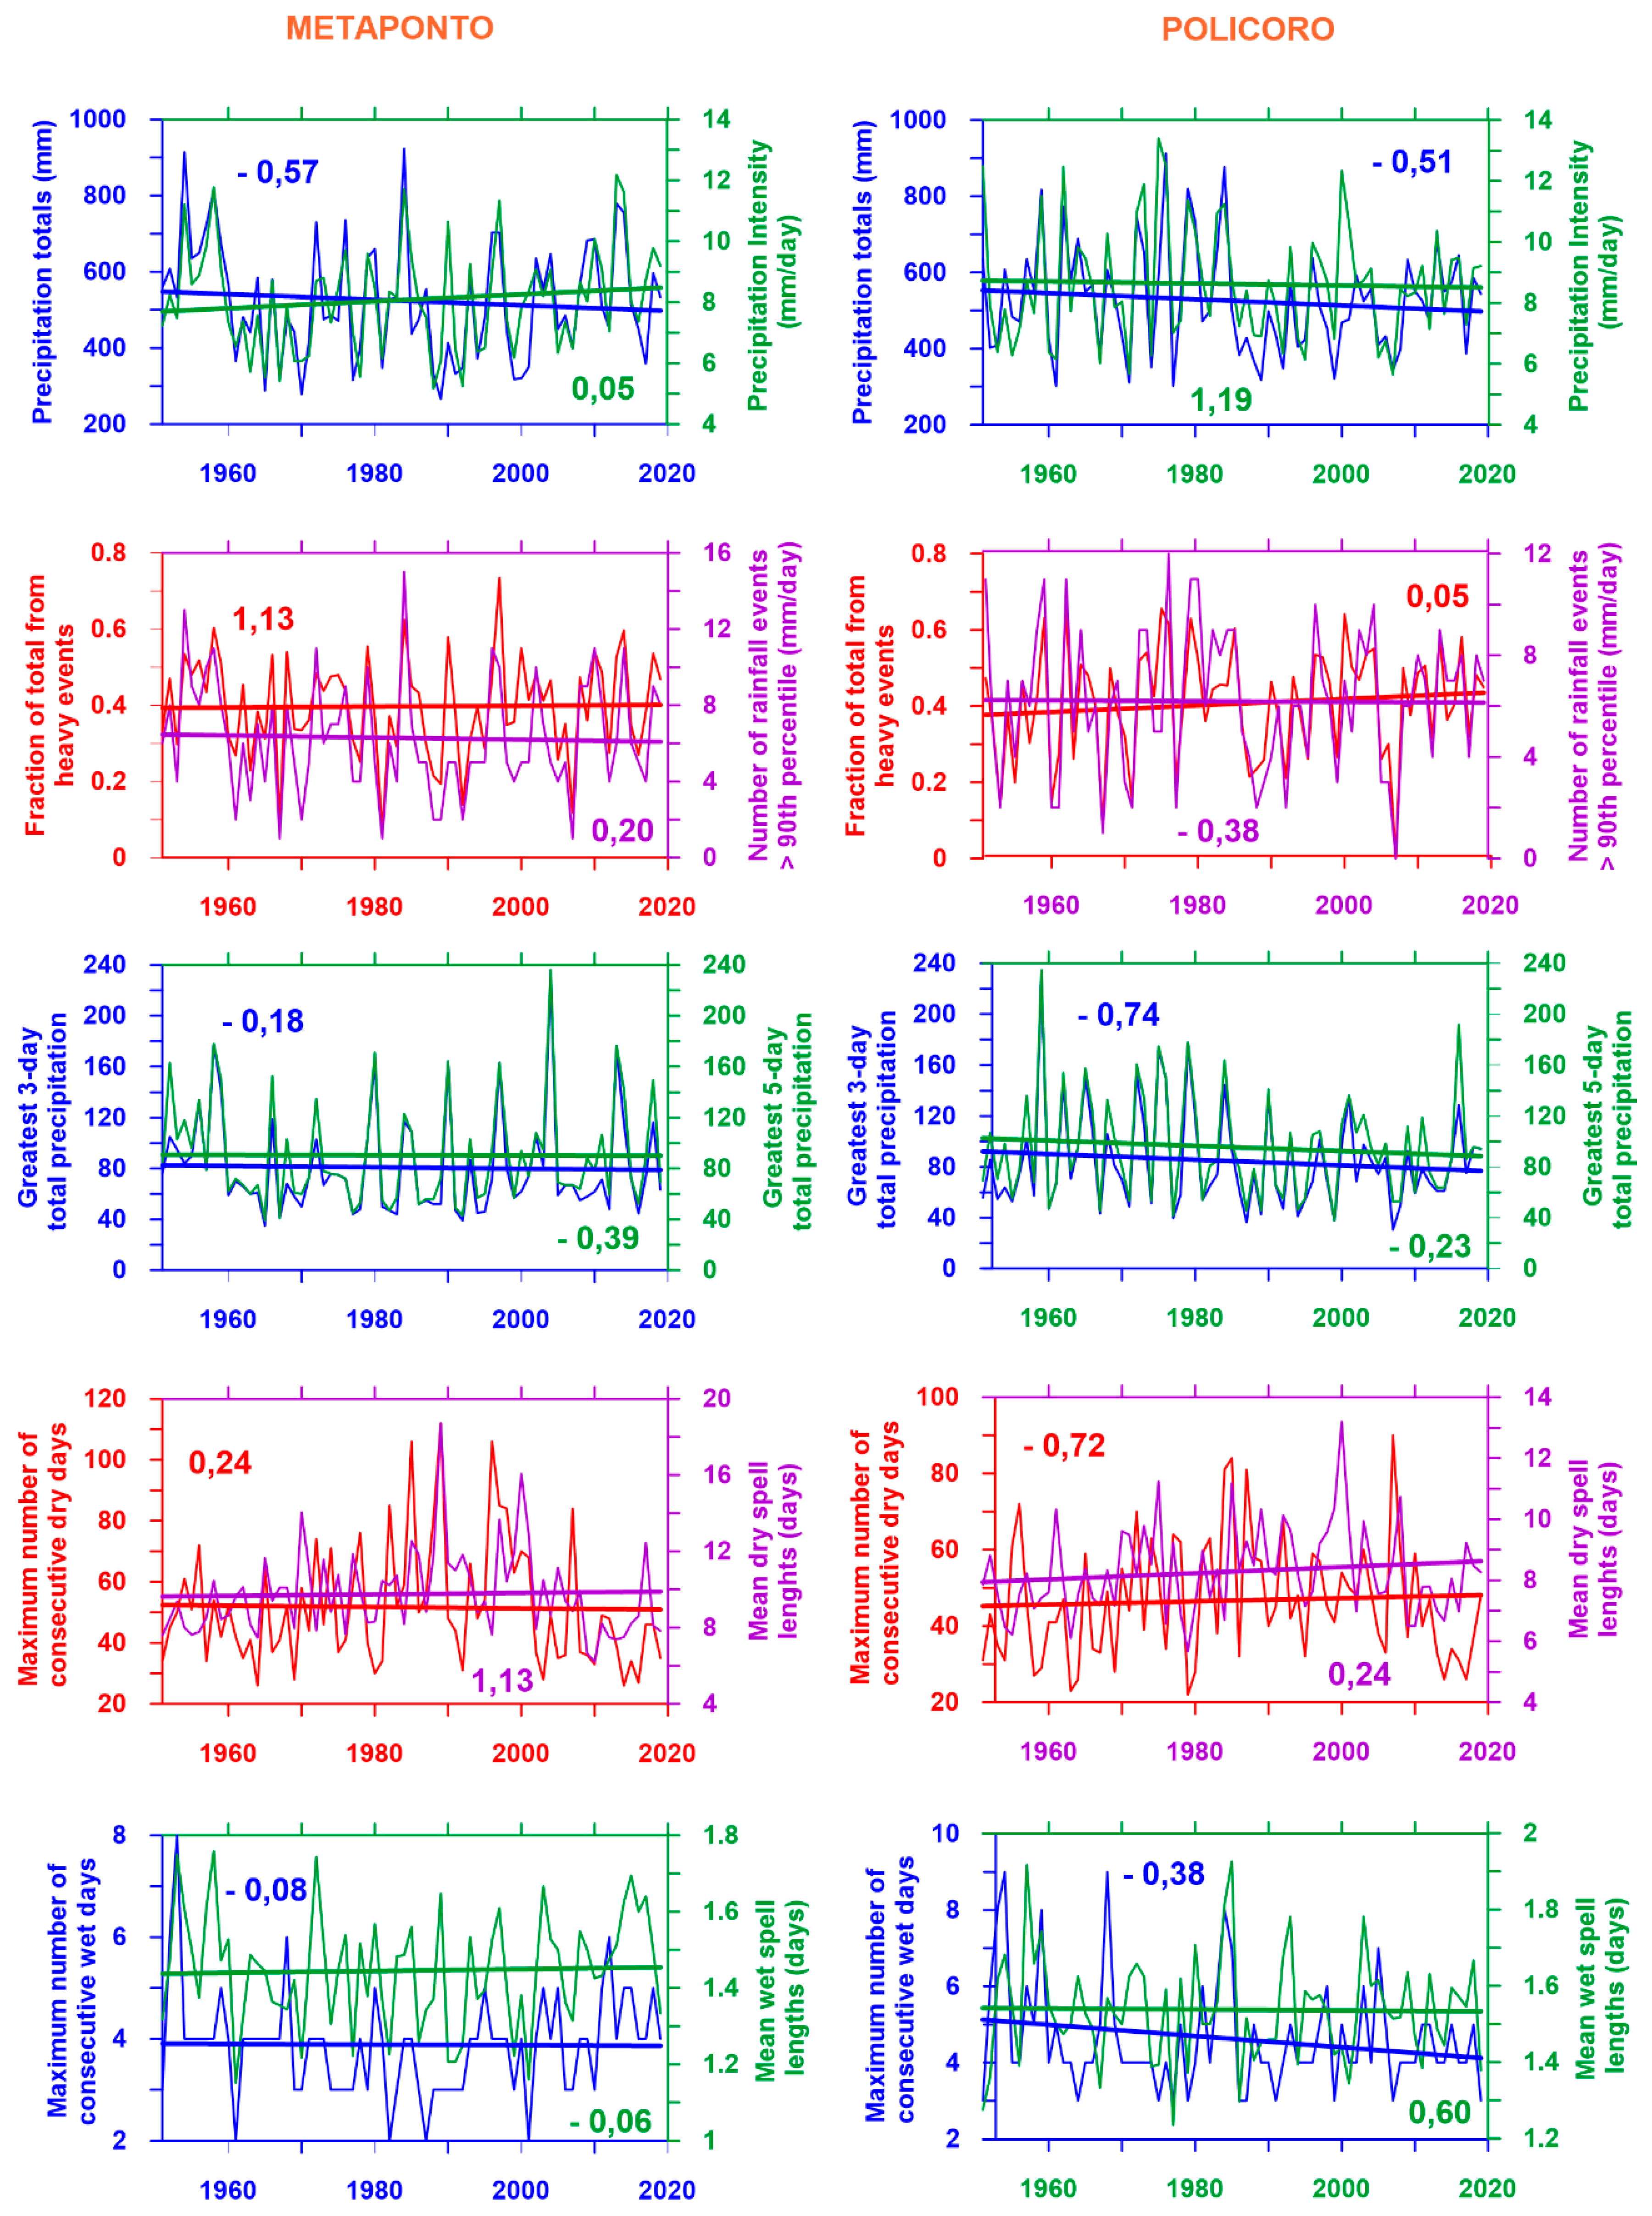
All the pluviometric indices were analyzed in both the Metaponto and Policoro rain gauges and the results are reported in Table 2. The analysis of precipitation indices has revealed some substantial changes in mean and extreme values in the past 60 years and a very interesting change in the pluviometric regime during the last climate normal 1990–2019. The Mann–Kendall test has been applied to total annual precipitation (TP) and precipitation intensity (PI) of the Metaponto and Policoro pluviometric stations to verify total precipitations and intensity trends during each of the years. The results show a downward trend of the total annual precipitation (TP) of both the stations from 1951 to 2019 (Figure 6). However, the analysis for normal shows that the trend reverses in the normal 1981–2010 and 1990–2019, indicating that the last two decades have generally been rainier, with a statistically significant positive trend in the last normal at Metaponto. These data confirm the previous results achieved by Piccarreta et al. [15] who pointed out a significant increasing trend in the rainfall regime of the Basilicata Region, starting from 2000.
The annual precipitation intensity (PI) shows a weak positive trend from 1951 to 2019 (Figure 6), which has been consolidated during the last normal 1990–2019 (Table 2). This upward trend was confirmed by the analyses of the extreme daily precipitation. The fraction of total rainfall extracted by the events exceeding the long-term 90th percentile rain amount (PFL90) in the range of 1951–2019 years shows a positive tendency, especially due to an increase in the last two climate normals (Table 2). Changes in the frequency of extreme daily precipitation were studied by analyzing the number of rainfall events from those greater than the long-term 90th percentile rainfall (PNL90). As shown in Figure 6 the PNL90 shows a weak negative trend in the Metaponto station in the period of 1951–2019, whereas it is quite stable for the Policoro station. Moreover, no significant changes occurred throughout the different normals (Table 2).
The normal analysis shows a strong consistency with that of the PI index, with the last normal 1991–2019 that has been characterized by a clear upward trend in both stations. The trends of the yearly greatest three-day (P3M) and five-day (P5M) rainfall totals were investigated and they showed a similar trend pattern in each station (Figure 6). At Metaponto, both P3M and P5M show a stable trend during the period 1951–2019, which became quite positive from 1990 according to the normal analysis (Table 2). At Policoro, both P3M and P5M show a weak downward trend during the period 1951–2019 which then turns into the last two normals 1981–2010 and 1990–2019 (Table 2).
The dry spell mean length (DSM) and the consecutive dry days (CDD) account for the evaluation of drought incidence (Figure 6). Although in the whole investigated period both indices show a stable or weakly positive trend, this reverses heavily in the last two normals, when it becomes a statistically significant downward trend (Table 2). The decrease in the length of the dry periods certainly began towards the end of the decade 2000–2010 and continued decidedly in recent years. The wet spell mean (WSM) remained stable both at Metaponto and Policoro from 1951 to 2019 (Figure 6). As already occurred for the other indices, also for the WSM, the last normal shows an important change of tendency, especially at Metaponto, thus evidencing a statistically significant upward trend. These data reflect an increase of the wet spell lengths occurred during the last twenty years, in each season. The consecutive wet day index (CWD) trend deviates from the WSM trend, although the normal analysis shows an upward trend, especially at Metaponto, in the last normals (Table 2).
4.2. Erosional and Depositional Activity of Rivers
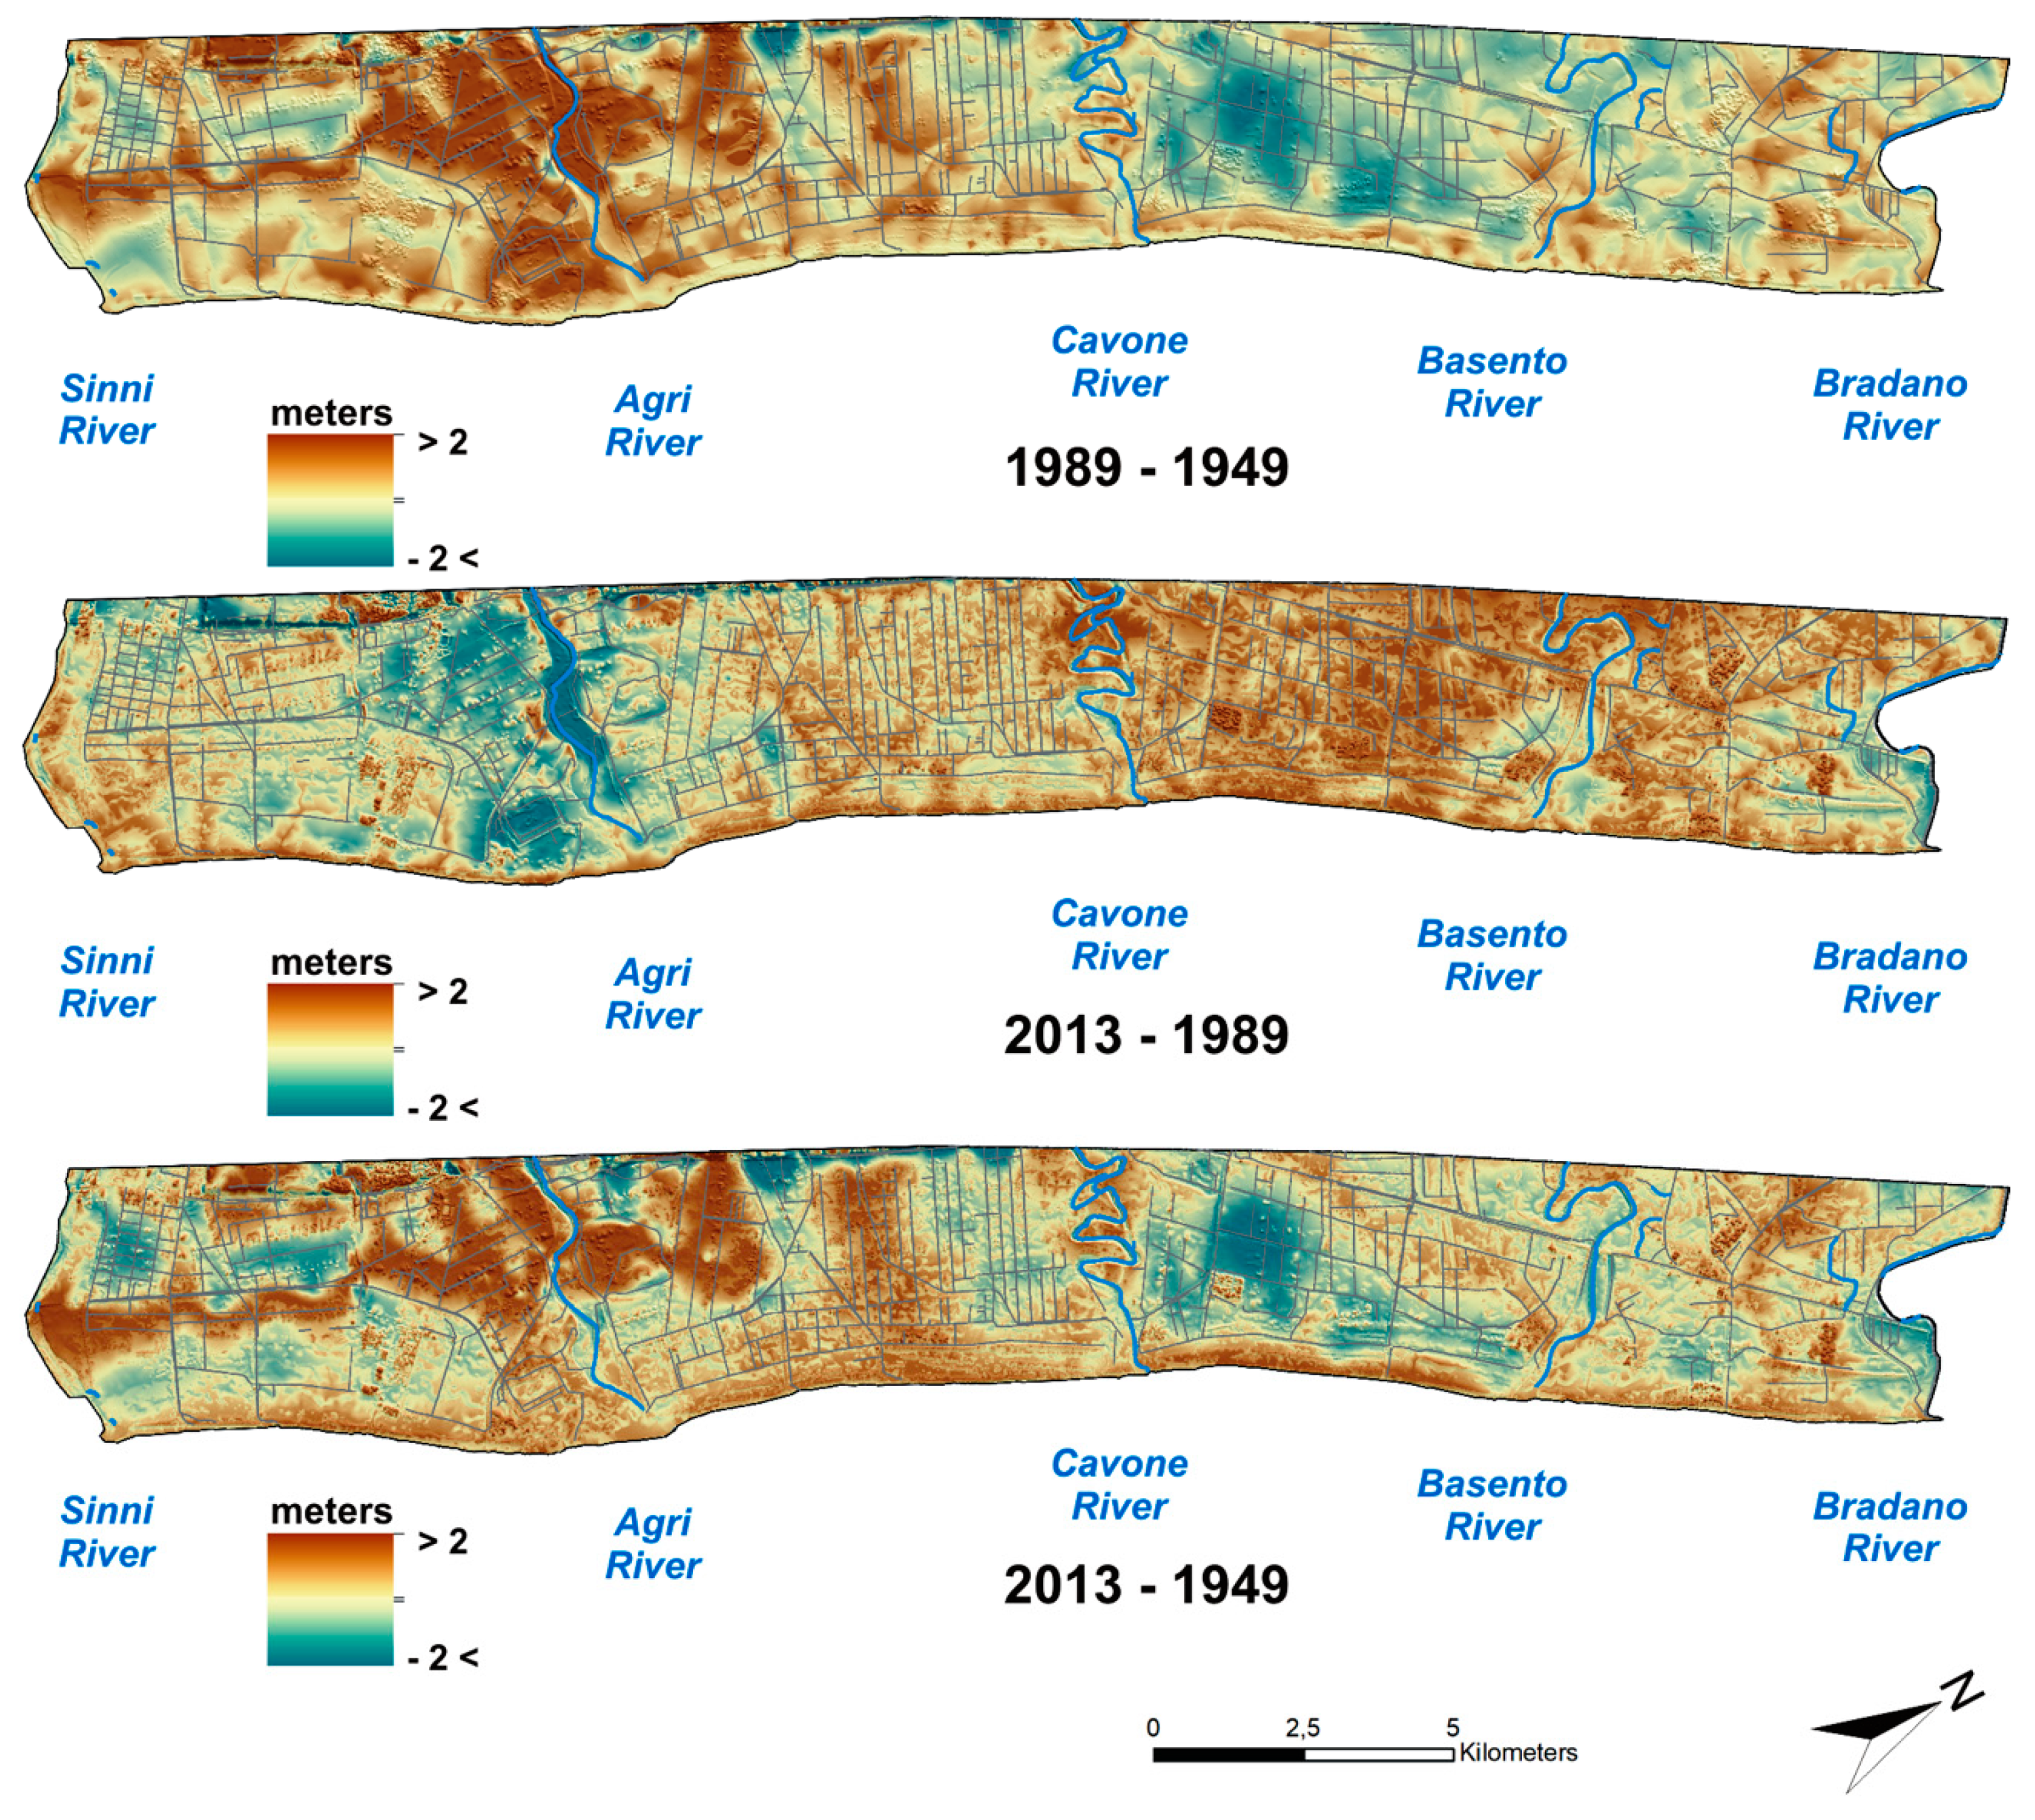
The altitude difference maps resulting from the subtraction of the 1949 and 1986 and of the 1986 and 2013 digital elevation models in the Metaponto plain are shown in Figure 7. Negative cell values indicate gross erosion whilst positive cell values suggest point to aggradation, and a very low or zero value indicates stable areas. The DEM difference maps show that the pattern of erosion and deposition within the study area is very different in the two analyzed periods. In the period 1949–1989, a strong erosion predominates between the Bradano and Cavone River mouths, whereas sedimentation prevails between the Cavone and Sinni river mouths. During this period, the hydraulic reclamation activity acted by the Reclamation Consortium was mainly concentrated. Furthermore, the analyzed strip area between the Bradano and Cavone Rivers was affected by many different works devoted to the creation of tourist villages, with huge ground movement produced by heavy machines.
Conversely, the area of the Agri and Sinni River mouths underwent major natural changes [9]. However, the most marked changes affected the mouth of the Agri River, which, after 1955, has shifted to the northeast as a consequence of the natural cutting of a meander belt that rectified its channel by about 1 km from its original place. Furthermore, an incoming of the sediment yield of about 50 m has been observed on the left of the Agri River mouth. Considering the interval of years from 1989 to 2013, an inversion of these phenomena has been found out in both the Agri and Sinni areas. Deposition of sediment clearly prevails in the area between the Bradano and Cavone River mouths, except in areas bordering the main river courses. A plausible explanation may derive from the incorrect soil management following the flooding events. On the basis of the information gathered from both newspapers and field surveys, it emerged that almost all the reclamation channels are completely filled with soil, on which dense vegetation is planted with reeds up to 3 m high (Figure 2). The maintenance of both the bottom and the banks of the reclamation channels is generally carried out with a frequency of 4/5 years, except in extraordinary events and without a precise calendar, depending on the vehicles and staff availability (http://bonificabasilicata.it) [45]. The cleaning operations involve the removal of sludge and soil which should be spilt away from the banks. However, many local governments complain that these materials are simply deposited along the margins, and then poured into the canals at the first effective rain. It often happens that these muds are left at the edges of the channels, so channels are filled up again with mud at the start of the first abundant rain. The areas adjacent both to the main course of the Agri River and to its mouth have been interested in the building of tourist villages and a tourist port. These activities produced a relevant mobilization of soils and caused a substantial erosion. In the coastal belt and in the inland areas, up to the Sinni River, the sediment accumulation is the prevalent process. Even in these areas, it is considered possible to attribute the accumulation of material to its coming from all the river floods and to the cleaning of drainage channels.
5. Discussion
The obtained results allow us to define many of the flood events as rainfall flooding due to bad drainage, even if there are cases where overflows can be recorded in the main river. However, these are often located at the mouth areas and therefore their contribution to the flooding of the plain seems to be generally negligible. Obviously, fluvial flooding (for example the disastrous ones of November 1959 and December 2013) caused by abundant and prolonged rainfall that led to the opening of the upstream dams and the breakdown of the banks with consequent flooding of the entire coastal plain were recorded. On the basis of the analyzed rainy and hydrometric data, it is not possible to attribute the flooding causes exclusively to the precipitation as the main factor of landscape changes. Although high-magnitude rainfall, often concentrated in multi-day events, caused widespread floods in several cases, the opposite is also true. In several cases, floods did not occur, even at intense rainfall events and with significant increases in the hydrometric level of the main rivers.
From the integrated analyses of precipitation fractions vs. hydrometric height and trigger rainfall vs. antecedent precipitations, it can be seen that most of the events are flash floods. As mentioned before, many of these floods have been caused by low to moderate intensity rainfall events. A plausible explanation can certainly refer to a possible saturation of unsaturated zone or to an accumulation of water in saturated zone reaching the ground level. However, on several occasions, modest trigger thresholds have been anticipated by a rather low amount of rainfall at thirty days. These data, combined with the poor relationship between triggering rainfall and antecedent precipitation, suggest that causes different from rainfall alone, can contribute heavily to the increase in the frequency of floods.
It seems that most of the recent floods are not due to the overflow of the main streams, but rather to the failure of the reclamation channels. Therefore, these are localized floods which interest more or less large areas far from the river belts (Figure 8). These data supported the idea that human activity could have interacted heavily. Among the possible anthropogenic causes we tend to exclude an incorrect reservoirs management and/or river tracks modification (channelization, straightening, re-sectioning.), since, except for the cases of fluvial flooding referable to extreme events of exceptional magnitude and duration, many of the events recorded are attributable to rainfall flooding due to bad drainage, which are also quite concentrated in intrafluvial areas. The multitemporal analyses of the DEM’s from 1949 to 2013, combined with field surveys and farmers’ reports, have clearly shown that bad land-management activities are often the real trigger factor. The areas affected by the reclamation channels, which should regiment the waters, have been the subject of accumulation of “fresh sediments” and muds, which have dammed them, also constituting a fertile base for the growth of perennial vegetation (reeds 3 m high, etc.). The maintenance of both the bottom and the banks of the reclamation channels is generally carried out with a frequency of 4/5 years, except in extraordinary events and without a precise calendar, but depending on the vehicles and staff availability (http://bonificabasilicata.it). The weak or sometimes absent cleaning operations of channels have greatly amplified the magnitude of low-intensity rainfall events. On the other hand, when the cleaning of channels was regularly carried out, no floods have been recorded during rough rainfall events.
6. Final Remarks
The Metaponto plain located in the Basilicata region of Southern Italy extends for about 24,000 hectares on a flat surface devoted to quality crops. It contributes to about 85% of the fruit and vegetable production of the entire region thus strongly helping its economic stability. Moreover, the area is characterized by a high tourist vocation due to the remarkable archaeological heritage and the numerous accommodation facilities. The recent increase in the annual and intra-annual frequency of alluvial episodes also in correspondence of moderate intensity rainfall events, has caused the loss of crops, damages to infrastructures and archaeological monuments. This has heavily weighed on the regional economy and the national/European economy in terms of compensation for natural disasters.
Although it would be a common opinion that this unusual increase in the periodicity of flood events is due to global climate change, we have found that human activity has also contributed to this process of depletion through carelessness and recklessness of territorial management. In particular, the occurrence of localized rainfall flash floods due to low/moderate intensity rainfall events, not anticipated by huge antecedent precipitations, has suggested that they have taken place due to bad drainage linked to the failure of the reclamation channels. This idea is supported by field survey observations, farmers’ reports, and multitemporal analyses of the DEMs from 1949 to 2013, which have clearly shown that bad land-management activities are often the real trigger factor. The Ionian area has always been subject to expansive flooding and consequent widespread swamping. The reclamation, through the articulated channels network, has initially favored the reduction of flood events and also has prevented the area from major damages due to the same floods. In fact, along the Ionian coast, the drainage channels are the only artificial drainage of the groundwater. In the past two decades, bad channel management has driven the system back to the situation it was. The areas affected by the reclamation channels, which should regiment the waters, are almost always filled with “fresh sediments” and muds, which have dammed them and have favored the growth of perennial vegetation (reeds 3 m high, etc.). Some channels have become orchards, and, more incredibly several bridges even stop the natural flow of water. The cleaning of both the bottom and the banks of the reclamation channels is generally carried out every four/five years, so as to greatly amplify the magnitude of low-intensity rainfall events. In these occasions, mud, vegetation refuse and waste of any kind (car tires, appliances etc.) which have been extracted, are deposited on the channel margins and not disposed of regularly.
The high frequency of extreme rainfall events should instead require the yearly cleaning of the reclamation channels. We consider the farmers’ role as crucial. A new agreement between farmers, Consortium and Institutions for the protection of the territory would be desirable. The farmers will not have to clean the canal, but they will be an active part in its management. They should report on the state of the canals to local administrations every three/four months, so as to allow a prompt intervention that could mitigate the action of natural events.
Author Contributions
Conceptualization, M.B., S.I.G., and M.P.; methodology, M.B., S.I.G., and M.P.; software, M.P.; investigation, M.B., S.I.G., and M.P.; resources, M.B. and S.I.G.; data curation, M.B., S.I.G., and M.P.; writing—original draft preparation, M.B., S.I.G., and M.P.; founding acquisition M.B. and S.I.G.; writing—review and editing, M.B., S.I.G., and M.P. All authors have read and agreed to the published version of the manuscript.
Funding
This research was funded by Mario Bentivenga, grant number RIL 2006, and by Salvatore Ivo Giano, grant number RIL 2015.
Conflicts of Interest
The authors declare no conflict of interest.
References
- Giorgi, F. Climate changes hot-spots. Geophys. Res. Lett. 2006, 33, L08707. [Google Scholar] [CrossRef]
- Llasat, M.C.; Llasat-Botija, M.; Prat, M.; Porcu, F.; Price, C.; Mugnai, A.; Lagouvardos, K.; Kotroni, V.; Katsanos, D.; Michaelides, S.; et al. High-impact floods and flash floods in Mediterranean countries: The flash preliminary database. Adv. Geosci. 2010, 23, 1–9. [Google Scholar] [CrossRef] [Green Version]
- Llasat, M.C.; Llasat-Botija, M.; Petrucci, O.; Pasqua, A.A.; Rossello’, J.; Vinet, F.; Boissier, L. Towards a database on societal impact of Mediterranean floods within the framework of the HYMEX project. Nat. Hazards Earth Syst. Sci. 2013, 13, 1337–1350. [Google Scholar] [CrossRef] [Green Version]
- Gaume, E.; Borga, M.; Llassat, M.C.; Maouche, S.; Lang, M.; Diakakis, M. Mediterranean extreme floods and flash floods. In The Mediterranean Region Under Climate Change: A Scientific Update; Research Institute Development: Marseille, France, 2016; pp. 133–144. [Google Scholar]
- Hooke, R. On the history of humans as geomorphic agents. Geology 2000, 28, 843–846. [Google Scholar] [CrossRef]
- Rivas, V.; Cendrero, A.; Hurtado, M.; Cabral, M.; Gimenez, J.; Forte, L.; del Rıo, L.; Cantù, M.; Becker, A. Geomorphic consequences of urban development and mining activities; an analysis of study areas in Spain and Argentina. Geomorphology 2006, 73, 185–206. [Google Scholar] [CrossRef]
- Cooper, A.H.; Brown, T.J.; Price, S.J.; Ford, J.R.; Waters, C.N. Humans are the most significant global geomorphological driving force of the 21st century. Anthr. Rev. 2018, 5, 222–229. [Google Scholar] [CrossRef] [Green Version]
- Sala, M. Floods triggered by natural conditions and by human activities in a mediterranean coastal environment. Geograf. Ann. Series A Phys. Geogr. 2003, 85, 3–4. [Google Scholar] [CrossRef]
- Aiello, A.; Canora, F.; Pasquariello, G.; Spilotro, G. Shoreline variations and coastal dynamics: A space-time data analysis of the Jonian littoral, Italy. Estuar. Coast. Mar. Sci. 2013, 129, 124–135. [Google Scholar] [CrossRef]
- De Musso, N.M.; Capolongo, D.; Refice, A.; Lovergine, F.P.; D’Addabbo, A.; Pennetta, L. Spatial evolution of the December 2013 Metaponto plain (Basilicata, Italy) flood event using multi-source and high-resolution remotely sensed data. J. Maps 2018, 14, 219–229. [Google Scholar] [CrossRef] [Green Version]
- Lacava, T.; Ciancia, E.; Faruolo, M.; Pergola, N.; Satriano, V.; Tramutoli, V. On the Potential of RST-FLOOD on Visible Infrared Imaging Radiometer Suite Data for Flooded Areas Detection. Remote Sens. 2019, 11, 598. [Google Scholar] [CrossRef] [Green Version]
- Giano, S.I.; Giannandrea, P. Late Pleistocene differential uplift inferred from the analysis of fluvial terraces (southern Apennines, Italy). Geomorphology 2014, 217, 89–105. [Google Scholar] [CrossRef]
- Piccarreta, M.; Capolongo, D.; Bentivenga, M.; Pennetta, L. Influenza delle precipitazioni e dei cicli umido-secco sulla morfogenesi calanchiva in un’area semi-arida della Basilicata (Italia meridionale). Geogr. Fis. Din. Quat. 2005, 7, 281–289. [Google Scholar]
- Piccarreta, M.; Capolongo, D.; Miccoli, M.N.; Bentivenga, M. Global change and long-term gully sediment production dynamics in Basilicata, southern Italy. Environ. Earth Sci. 2012, 67, 1619–1630. [Google Scholar] [CrossRef]
- Piccarreta, M.; Pasini, A.; Capolongo, D.; Lazzari, M. Changes in daily precipitation extremes in the Mediterranean from 1951 to 2010: The Basilicata region, southern Italy. Int. J. Climatol. 2013. [Google Scholar] [CrossRef]
- Migliorini, C. Cenno sullo studio e sulla prospezione petrolifera di una zona dell’Italia meridionale. In Proceedings of the 2nd Petroleum world Congress, Paris, France, 14–19 June 1937; pp. 1–11. [Google Scholar]
- Sella, M.; Turci, C.; Riva, A. Sintesi geopetrolifera della Fossa Bradanica (avanfossa della catena appenninica meridionale). Mem. Della Soc. Geol. Ital. 1988, 41, 87–107. [Google Scholar]
- Giano, S.I.; Lapenna, V.; Piscitelli, S.; Schiattarella, M. Nuovi dati geologici e geofisici sull’assetto strutturale dei depositi continentali quaternari dell’alta Val d’Agri (Basilicata). Il Quaternario 1997, 10, 589–594. [Google Scholar]
- Di Leo, P.; Giano, S.I.; Gioia, D.; Mattei, M.; Pescatore, E.; Schiattarella, M. Evoluzione morfotettonica quaternaria del bacino intermontano di Sanza (Appennino meridionale). Il Quaternario 2009, 22, 189–206. [Google Scholar]
- Bavusi, M.; Chianese, D.; Giano, S.I.; Mucciarelli, M. Multidisciplinary investigations on the Grumentum Roman acqueduct (Basilicata, Southern Italy). Ann. Geophyis. 2004, 47, 1791–1801. [Google Scholar]
- Giano, S.I.; Pescatore, E.; Agosta, F.; Prosser, G. Geomorphic evidence of Quaternary tectonics within an underlap fault zone of southern Apennines, Italy. Geomorphology 2018, 303, 172–190. [Google Scholar] [CrossRef]
- Casnedi, R. La Fossa Bradanica: Origini, Sedimentazione e Migrazione. Mem. Della Soc. Geol. Ital. 1988, 41, 439–448. [Google Scholar]
- Tropeano, M.; Sabato, L.; Pieri, P. The Quaternary «Post-turbidite» sedimentation in the South-Apennines Foredeep (Bradanic Trough-Southern Italy). Boll. Della Soc. Geol. Ital. 2002, 121, 449–454. [Google Scholar]
- Schiattarella, M.; Giano, S.I.; Gioia, D. Long-term geomorphological evolution of the axial zone of the Campania-Lucania Apennine, Southern Italy. Geol. Carpathica 2017, 68, 57–67. [Google Scholar] [CrossRef] [Green Version]
- Bruckner, H. Marine terrassen in Süditalien. Eine quartäremorphologische Studie über das Küstentiefland von Metapont. Düsseldorfer Geogr. Schr. 1980, 14, 235. [Google Scholar]
- Gioia, D.; Schiattarella, M.; Giano, S.I. Right-Angle Pattern of Minor Fluvial Networks from the Ionian Terraced Belt, Southern Italy: Passive Structural Control or Foreland Bending. Geosciences 2018, 8, 331. [Google Scholar] [CrossRef] [Green Version]
- Bentivenga, M.; Coltorti, M.; Prosser, G.; Tavarnelli, E. Recent extensional faulting in the Gulf of Taranto area: Implications for nuclear waste storage in the vicinity of Scanzano Jonico (Basilicata). Boll. Della Soc. Geol. Ital. 2004, 123, 391–404. [Google Scholar]
- Giannandrea, P.; Giano, S.I.; Sulpizio, R. Development of Pleistocene Fluvial Terraces on the Eastern Frontal Sector of the Southern Apennines Chain, Italy. Water 2019, 11, 1345. [Google Scholar] [CrossRef] [Green Version]
- Pescatore, T.; Pieri, P.; Sabato, L.; Senatore, M.R.; Gallicchio, S.; Boscaino, M.; Cilumbriello, A.; Quarantiello, R.; Capretto, G. Stratigrafia dei depositi pleistocenico-olocenici dell’area costiera di Metaponto compresa fra Marina di Ginosa ed il torrente Cavone (Italia meridionale): Carta geologica in scala 1:25.000. Il Quaternario 2009, 22, 307–324. [Google Scholar]
- Cilumbriello, A.; Tropeano, M.; Sabato, L. The Quaternary terraced marine-deposits of the Metaponto area (Southern Italy) in a sequence-stratigraphic perspective. Geoacta 2008, 1, 29–54. [Google Scholar]
- Tropeano, M.; Cilumbriello, A.; Sabato, L.; Gallicchio, S.; Grippa, A.; Longhitano, S.; Bianca, M.; Gallipoli, M.; Mucciarelli, M.; Spilotro, G. Surface and subsurface of the Metaponto Coastal Plain (Gulf of Taranto-Southern Italy): Present-day vs LGM-landscape. Geomorphology 2013, 203, 115–131. [Google Scholar] [CrossRef]
- Boenzi, F.; Palmentola, G.; Valduga, A. Caratteri geomorfologici dell’area del foglio Matera. Boll. Della Soc. Geol. Ital. Roma 1976, 45, 527–566. [Google Scholar]
- Pellicani, R.; Argentiero, I.; Fidelibus, M.D.; Motta Zanin, G.; Parisi, A.; Spilotro, G. Dynamics of the Basilicata Ionian coast: Human and natural drivers. Rend. Lincei. Sci. Fis. Nat. 2020, 31, 353–364. [Google Scholar] [CrossRef]
- Cocco, E.; Cravero, E.; Di Geronimo, S.; Mezzadri, G.; Parea, G.C.; Pescatore, T.; Valloni, R.; Vinci, A. Lineamenti geomorfologici e sedimentologici del litorale Alto Ionico (Golfo di Taranto). Boll. Della Soc. Geol. Ital. 1975, 94, 993–1052. [Google Scholar]
- Caloiero, D.; Mercuri, T. Le Alluvioni in Basilicata dal 1921 al 1980; Consiglio Nazionale delle Ricerche: Roma, Italy; Istituto per la Protezione Idrogeologica: Perugia, Italy, 1982; pp. 28–53. [Google Scholar]
- Clarke, M.L.; Rendell, H.M. Hindcasting extreme events: The occurrence and expression of damaging floods and landslides in Southern Italy. Land Degrad. Dev. 2006, 17, 365–380. [Google Scholar] [CrossRef]
- Guzzetti, F.; Cardinali, M.; Reichenbach, P. The AVI Project: A bibliographical and archive inventory of landslides and floods in Italy. Environ. Manag. 1994, 18, 623–633. [Google Scholar] [CrossRef]
- World Meteorological Organization (WMO). Calculation of Monthly and Annual 30-Year Standard Normals; WCDP, No. 10, WMO-TD/No. 341; WMO: Geneva, Switzerland, 1989. [Google Scholar]
- Christensen, J.H.; Christensen, O.B. Severe summertime flooding in Europe. Nature 2003, 421, 805–806. [Google Scholar] [CrossRef] [PubMed]
- Gao, X.; Pal, J.S.; Giorgi, F. Projected changes in mean and extreme precipitation over the Mediterranean region from a high resolution double nested RCM simulation. Geophys. Res. Lett. 2006, 33, L03706. [Google Scholar] [CrossRef]
- Kendall, M.G. Rank Correlation Methods, 4th ed.; Charles Griffin: London, UK, 1994. [Google Scholar]
- Salmi, T.; Määttä, A.; Anttila, P.; Ruoho-Airola, T.; Amnell, T. Detecting Trends of Annual Values of Atmospheric Pollutants by the Mann-Kendall Test and Sen’s Slope Estimates—The Excel Template Application Makesens; Publications on Air Quality No. 31; Finnish Meteorological Institute: Helsinki, Finland, 2002.
- Williams, R. DEMs of difference. Geomorphol. Tech. 2012, 2. [Google Scholar]
- Polemio, M.; Dragone, V.; Limoni, P.P.; Mitolo, D.; Santaloia, F. Caratterizzazione idrogeologica della piana di Metaponti, qualità e rischi di degrado delle acque sotterranee. Acque Sotter. 2003, 83, 49–64. [Google Scholar]
- Consorzio di Bonifica Della Basilicata. Manutenzione Ordinaria dei Canali Artificiali e delle Opere di Difesa. Available online: http://www.bonificabasilicata.it/Avvisi/10%20Ing_Gravino/00_Linee_guida_manutenzione%20_canali.pdf (accessed on 12 March 2020).
Figure 1.
(A) Geological sketch map of southern Italy; (B) SW–NE oriented geological cross section; (C) geological sketch map of the Taranto Gulf hinterland.
Figure 1.
(A) Geological sketch map of southern Italy; (B) SW–NE oriented geological cross section; (C) geological sketch map of the Taranto Gulf hinterland.

Figure 2.
Study area extracted from the Metaponto coastal plain. Channels networks and photos showing some examples of concrete, earth, and mixed drainages channels.
Figure 2.
Study area extracted from the Metaponto coastal plain. Channels networks and photos showing some examples of concrete, earth, and mixed drainages channels.

Figure 3.
Annual frequency of flood events from 1951 to 2019 (a) and flood seasonality (b).

Figure 4.
Daily hydrometric height (m) of Sinni River (a), Cavone River (b), and Basento River (c) versus daily rainfall (mm) from 1 January 2001 to 31 December 2019 at the Sinni SS106, Terra Montonata, and Basento Freatimetro hydroclimatic stations. Circles in red indicate flood events.
Figure 4.
Daily hydrometric height (m) of Sinni River (a), Cavone River (b), and Basento River (c) versus daily rainfall (mm) from 1 January 2001 to 31 December 2019 at the Sinni SS106, Terra Montonata, and Basento Freatimetro hydroclimatic stations. Circles in red indicate flood events.

Figure 5.
Daily triggering precipitation versus antecedent rainfalls over three, 15, and 30 days at Metaponto (a) and Policoro (b).
Figure 5.
Daily triggering precipitation versus antecedent rainfalls over three, 15, and 30 days at Metaponto (a) and Policoro (b).

Figure 6.
Pluviometric indices of Metaponto and Policoro rain gauges, 1951–2019. Bold colored numbers indicate the Z-value of the Mann–Kendall statistic. None of the trends is statistically significant.
Figure 6.
Pluviometric indices of Metaponto and Policoro rain gauges, 1951–2019. Bold colored numbers indicate the Z-value of the Mann–Kendall statistic. None of the trends is statistically significant.

Figure 7.
Erosion/deposition dynamics for the periods 1949–1989, 1989–2013, and 1949–2013. Reclamation channels were reported in gray color.
Figure 7.
Erosion/deposition dynamics for the periods 1949–1989, 1989–2013, and 1949–2013. Reclamation channels were reported in gray color.

Figure 8.
Flooding areas as indicated by the light blue pixels occurred in November 2019. The image was extracted from the Sentinel S1B satellite. Source: Centro funzionale centrale Basilicata.
Figure 8.
Flooding areas as indicated by the light blue pixels occurred in November 2019. The image was extracted from the Sentinel S1B satellite. Source: Centro funzionale centrale Basilicata.


Table 1.
Chronological listing of flood events in the Metaponto plain from 1933 to 2019 and antecedent rainfall conditions over three days (P3), 15 days (P15), and 30 days (P30) from the rain gauge of Metaponto (M) and Policoro (P).
Table 1.
Chronological listing of flood events in the Metaponto plain from 1933 to 2019 and antecedent rainfall conditions over three days (P3), 15 days (P15), and 30 days (P30) from the rain gauge of Metaponto (M) and Policoro (P).
| Date | River Basin | Source of Information | P1(M) | P3 (M) | P15(M) | P30(M) | P1(P) | P3 (P) | P15(P) | P30(P) |
|---|---|---|---|---|---|---|---|---|---|---|
| 21–22/2/1933 | Bradano, Basento | http://osservatoriometeolucano.altervista.org/ | ||||||||
| 28–29/11/1944 | Agri, Sinni | http://osservatoriometeolucano.altervista.org/ | ||||||||
| 7–8/11/1946 | Bradano, Basento, Cavone | http://osservatoriometeolucano.altervista.org/ | ||||||||
| 15/03/1954 | Bradano | Progetto AVI database | 17.4 | 36.8 | 88.8 | 178.0 | 13.8 | 19.6 | 47.2 | 94.0 |
| 25–27/2/1956 | Bradano | Progetto AVI database | 39.4 | 46.2 | 120.8 | 187.0 | 23.4 | 43.6 | 103.0 | 150.3 |
| 21–24/11/1957 | Agri, Reclamation channels | Progetto AVI database | 27.0 | 40.6 | 52.2 | 87.2 | 79.6 | 98.0 | 123.4 | 153.2 |
| 28/12/1957 | Basento | Progetto AVI database | 10.0 | 35.6 | 61.8 | 70.8 | 8.8 | 17.2 | 41.0 | 50.0 |
| 24–25/11/1959 | Bradano, Basento, Cavone, Agri, Sinni | Caloiero and Mercuri | 70.0 | 143.1 | 218.7 | 256.3 | 165.2 | 227.8 | 340.8 | 389.8 |
| 15–17/1/1961 | Basento, Cavone, Agri, Sinni | Progetto AVI database | 64.8 | 70.8 | 79.4 | 100.2 | 55.2 | 58.6 | 62.0 | 79.6 |
| 22/07/1963 | Agri | Progetto AVI database | 0.0 | 0.0 | 11.0 | 17.2 | 27.2 | 27.2 | 30.6 | 48.0 |
| 9–10/10/1963 | Basento | Progetto AVI database | 51.0 | 57.6 | 82.0 | 84.2 | 16.2 | 39.8 | 58.0 | 72.0 |
| 11–12/12/1963 | Reclamation channels | Progetto AVI database | 13.0 | 13.0 | 68.8 | 74.6 | 51.8 | 51.8 | 91.0 | 100.2 |
| 21–25/9/1965 | Basento | Progetto AVI database | 8.6 | 37.0 | 53.0 | 70.4 | 73.0 | 150.4 | 162.4 | 173.4 |
| 7–9/10/1966 | Basento | Progetto AVI database | 62.4 | 120.4 | 159.4 | 171.2 | 56.4 | 107.6 | 133.6 | 139.0 |
| 10–13/12/1968 | Basento, Sinni, Agri | http://www.evalmet.it/ | 33.2 | 68.6 | 119.0 | 154.4 | 73.2 | 100.2 | 194.4 | 218.0 |
| 3–6/3/1969 | Basento, Cavone, Sinni | http://www.evalmet.it/ | 20.3 | 43.7 | 63.0 | 72.0 | 24.6 | 40.0 | 60.6 | 74.4 |
| 15–20/1/1972 | Bradano, Basento, Cavone, Agri, Sinni | Caloiero and Mercuri | 21.4 | 104.2 | 168.0 | 192.0 | 16.2 | 153.2 | 185.2 | 212.0 |
| 20–25/1/1972 | Basento | Progetto AVI database | 22.6 | 57.6 | 225.6 | 249.6 | 7.8 | 50.2 | 235.0 | 262.2 |
| 30/12/1972–3/1/73 | Bradano, Basento, Agri | Progetto AVI database | 21.0 | 56.8 | 97.8 | 102.0 | 63.0 | 66.0 | 141.8 | 144.2 |
| 25–29/3/1973 | Basento, Cavone | Progetto AVI database | 13.6 | 28.8 | 103.0 | 105.4 | 21.4 | 36.4 | 162.4 | 163.8 |
| 05/08/1973 | Metaponto flooding | http://www.evalmet.it/ | 49.6 | 50.2 | 50.2 | 51.8 | 15.0 | 16.0 | 22.8 | 23.0 |
| 16/02/1976 | Basento | http://www.evalmet.it/ | 7.2 | 7.2 | 36.0 | 58.8 | 0.0 | 0.0 | 42.8 | 69.9 |
| 24/05/1976 | Basento | Progetto AVI database | 14.4 | 44.4 | 59.8 | 80.6 | 7.4 | 10.2 | 25.5 | 32.7 |
| 5–6/11/1976 | Basento, Cavone, Agri | Progetto AVI database | 14.8 | 31.8 | 105.0 | 176.4 | 134.2 | 149.7 | 203.1 | 278.4 |
| 18–20/11/1976 | Basento, Cavone, Agri | Progetto AVI database | 40.4 | 65.2 | 110.4 | 233.6 | 59.5 | 99.7 | 259.9 | 372.2 |
| 18–21/2/1979 | Bradano, Basento, Cavone, Agri, Sinni | http://www.evalmet.it/ | 34.0 | 34.0 | 79.2 | 93.6 | 68.2 | 68.2 | 115.6 | 135.2 |
| 5–6/11/1979 | Bradano, Basento, Agri | http://www.evalmet.it/ | 52.0 | 101.8 | 155.0 | 176.2 | 93.3 | 175.3 | 279.9 | 298.1 |
| 11–13/1/1980 | Basento, Cavone | http://www.evalmet.it/ | 143.7 | 165.1 | 188.7 | 197.3 | 83.8 | 112.0 | 137.0 | 144.2 |
| 22/12/1980 | Basento, Cavone, Agri, Sinni | http://www.evalmet.it/ | 12.6 | 36.6 | 70.0 | 91.2 | 21.2 | 24.4 | 31.6 | 67.8 |
| 13–15/11/1984 | Basento-Cavone | Progetto AVI database | 50.6 | 159.6 | 159.6 | 199.7 | 19.0 | 131.4 | 131.7 | 138.3 |
| 29–30/12/1984 | Cavone, Agri, Reclamation channels | Progetto AVI database | 60.5 | 155.5 | 201.5 | 311.5 | 61.0 | 143.4 | 192.6 | 272.8 |
| 15–17/1/1985 | Bradano, Basento | http://www.evalmet.it/ | 26.7 | 26.7 | 65.2 | 266.7 | 15.2 | 15.2 | 48.8 | 242.6 |
| 17–19/4/1985 | Bradano | Progetto AVI database | 11.5 | 55.5 | 60.5 | 64.4 | 43.2 | 89.0 | 92.0 | 99.7 |
| 16–17/11/1990 | Bradano, Basento | http://www.evalmet.it/ | 45.0 | 92.5 | 94.0 | 112.3 | 19.5 | 137.1 | 137.1 | 154.5 |
| 23–27/12/1990 | Basento, Cavone, Agri, Sinni | http://www.evalmet.it/ | 55.5 | 107.5 | 125.0 | 159.2 | 49.5 | 113.0 | 125.9 | 178.3 |
| 28–30/1/1996 | Cavone, Agri | Progetto AVI database | 30.8 | 32.6 | 86.3 | 135.1 | 58.0 | 59.2 | 106.6 | 157.4 |
| 07/02/1996 | Basento | Progetto AVI database | 38.6 | 39.0 | 131.8 | 134.9 | 55.6 | 55.6 | 172.0 | 173.4 |
| 11–15/3/1996 | Reclamation channels | http://www.evalmet.it/ | 25.6 | 25.8 | 86.0 | 119.2 | 25.6 | 25.6 | 70.0 | 114.8 |
| 31/10/1997 | Reclamation channels Agri | Progetto AVI database | 56.6 | 98.4 | 109.4 | 140.2 | 63.2 | 101.6 | 121.2 | 155.6 |
| 13/11/1997 | Reclamation channels, Cavone | Progetto AVI database | 64.2 | 64.4 | 162.0 | 199.8 | 28.8 | 28.8 | 105.4 | 158.4 |
| 23–24/11/1997 | Reclamation channels | Progetto AVI database | 34.2 | 35.2 | 131.6 | 259.6 | 35.8 | 35.8 | 93.0 | 208.4 |
| 24–27/03/1998 | Reclamation channels | http://www.evalmet.it/ | 16.4 | 49.6 | 59.2 | 78.2 | 37.8 | 69.0 | 88.8 | 104.2 |
| 13–14/01/2001 | Basento, Cavone | http://www.evalmet.it/ | 39.6 | 74.8 | 132.0 | 143.0 | 94.0 | 136.2 | 173.2 | 182.6 |
| 20–22/01/2001 | Bradano, Basento, Cavone, Agri, Sinni | http://www.evalmet.it/ | 22.2 | 22.2 | 100.4 | 164.4 | 40.2 | 40.2 | 179.0 | 222.4 |
| 5–12/12/2002 | Bradano, Basento, Cavone, Agri | http://www.evalmet.it/ | 59.2 | 61.0 | 170.6 | 180.2 | 44.8 | 46.2 | 163.6 | 176.2 |
| 24–25/01/2003 | Basento, Cavone, Agri | http://www.evalmet.it/ | 13.6 | 63.0 | 92.6 | 121.8 | 45.6 | 69.4 | 104.0 | 131.0 |
| 7–8/9/2003 | Reclamation channels | http://www.evalmet.it/ | 14.4 | 27.0 | 32.6 | 33.6 | 2.8 | 2.8 | 21.8 | 22.4 |
| 10–13/12/2003 | Basento, Cavone | http://www.evalmet.it/ | 28.8 | 73.6 | 100.2 | 102.6 | 33.8 | 48.4 | 72.0 | 76.4 |
| 26/07/2004 | Sinni, Reclamation channels | http://www.evalmet.it/ | 41.6 | 42.4 | 42.4 | 42.4 | 36.2 | 36.2 | 36.6 | 36.8 |
| 12–15/11/2004 | Bradano, Reclamation channels | http://www.evalmet.it/ | 163.4 | 208.4 | 236.0 | 241.0 | 43.6 | 64.4 | 94.0 | 97.0 |
| 7–8/10/2005 | Reclamation channels | http://www.evalmet.it/ | 44.6 | 52.6 | 74.2 | 105.2 | 19.8 | 24.8 | 64.4 | 73.6 |
| 10–13/12/2005 | Basento | http://www.evalmet.it/ | 23.6 | 50.2 | 57.8 | 94.2 | 19.2 | 74.2 | 89.0 | 140.6 |
| 23–24/2/2006 | Bradano, Basento | http://www.evalmet.it/ | 22.0 | 25.6 | 26.0 | 43.2 | 23.6 | 26.6 | 30.8 | 38.8 |
| 28/2–2/3/2006 | Bradano, Basento, Agri | http://www.evalmet.it/ | 42.8 | 53.4 | 84.2 | 85.4 | 38.4 | 42.0 | 76.2 | 81.0 |
| 12–13/3/2006 | Reclamation channels | http://www.evalmet.it/ | 18.4 | 19.2 | 72.8 | 103.6 | 12.4 | 13.2 | 58.8 | 93.2 |
| 22/07/2008 | Basento, Reclamation channels | http://www.evalmet.it/ | 19.2 | 19.2 | 22.2 | 26.4 | 0.0 | 0.0 | 0.0 | 0.6 |
| 2–4/11/2010 | Bradano, Basento, Cavone, Agri, Sinni | http://www.evalmet.it/ | 51.6 | 51.6 | 103.6 | 191.5 | 28.8 | 29.0 | 88.0 | 144.8 |
| 28/01/2011 | Sinni, Reclamation channels | http://www.evalmet.it/ | 12.2 | 36.0 | 66.0 | 66.4 | 15.6 | 43.6 | 71.0 | 71.6 |
| 18/02/2011 | Basento, Sinni | http://www.evalmet.it/ | 14.2 | 17.2 | 17.2 | 84.2 | 14.8 | 18.0 | 18.0 | 94.8 |
| 01/03/2011 | Bradano, Cavone, Agri | http://www.evalmet.it/ | 69.0 | 71.2 | 93.4 | 94.0 | 77.0 | 78.2 | 105.0 | 110.6 |
| 23–24/2/2012 | Basento, Cavone, Agri, Sinni | http://www.evalmet.it/ | 15.4 | 44.8 | 56.8 | 162.0 | 16.8 | 67.6 | 83.2 | 188.8 |
| 6–8/10/2013 | Bradano, Basento | http://www.evalmet.it/ | 122.0 | 127.0 | 137.8 | 139.8 | 55.4 | 58.4 | 62.4 | 68.0 |
| 30/11/2013–2/12/2013 | Bradano, Basento, Cavone, Agri, Sinni | http://www.evalmet.it/ | 142.0 | 162.2 | 194.0 | 325.0 | 106.2 | 131.6 | 148.8 | 294.4 |
| 4–5/10/2014 | Bradano, Basento, Cavone, Sinni | https://www.ilmetapontino.it/ | 96.2 | 101.8 | 108.8 | 121.2 | 4.8 | 6.2 | 8.8 | 38.0 |
| 16–18/03/2016 | Bradano, Basento, Cavone, Agri, Sinni | http://osservatoriometeolucano.altervista.org/ | 12.4 | 23.4 | 76.2 | 101.8 | 81.0 | 128.8 | 232.0 | 252.6 |
| 22–23/10/2018 | Cavone, Agri, Sinni | http://filippomele.blogspot.com/ | 20.8 | 20.8 | 88.8 | 239.2 | 14.0 | 14.0 | 110.0 | 202.0 |
| 11–12/11/2019 | Bradano, Basento, Cavone, Agri, Sinni | https://www.basilicata24.it/ | 37.0 | 41.2 | 51.8 | 51.8 | 52.8 | 69.0 | 84.8 | 84.8 |
Table 2.
Mann–Kendall trend test results (Z value) of the pluviometric indices for the Metaponto and Policoro rain gauge over the period 1951–2019. Bold number indicates statistically significant trend.
Table 2.
Mann–Kendall trend test results (Z value) of the pluviometric indices for the Metaponto and Policoro rain gauge over the period 1951–2019. Bold number indicates statistically significant trend.
| Metaponto | Policoro | |||||||||
|---|---|---|---|---|---|---|---|---|---|---|
| 1951–1980 | 1961–1990 | 1971–2000 | 1981–2010 | 1990–2019 | 1951–1980 | 1961–1990 | 1971–2000 | 1981–2010 | 1990–2019 | |
| TP | −1.50 | 0.20 | −1.48 | 1.75 | 2.23 | 0.54 | −1.00 | −1.39 | 0.07 | 1.71 |
| PI | −0.75 | 1.39 | −0.64 | 0.46 | 1.68 | 1.00 | −0.21 | −1.18 | −1.21 | 0.43 |
| PFL90 | −0.36 | 0.00 | −0.36 | 0.96 | 0.54 | 1.75 | −0.25 | −0.25 | 1.07 | 0.61 |
| PNL90 | −0.97 | −0.04 | −1.03 | 1.20 | 1.10 | 0.70 | −0.04 | −0.99 | −0.27 | 1.43 |
| P3M | −1.37 | 0.43 | −0.52 | 1.32 | 0.54 | 1.43 | −0.75 | −1.11 | 0.14 | 0.45 |
| P5M | −1.50 | 0.32 | 0.00 | 1.54 | 0.52 | 1.14 | −0.43 | −1.18 | 0.39 | 0.30 |
| CDD | 0.13 | 2.50 | 1.59 | −1.82 | −2.38 | 0.64 | 1.87 | −0.43 | −0.89 | −1.97 |
| DSM | 1.70 | 1.78 | 1.52 | −1.66 | −2.78 | 0.43 | 0.87 | 1.18 | −0.37 | −1.48 |
| CWD | −1.89 | −1.88 | 0.59 | 1.48 | 2.13 | −2.28 | 0.02 | 0.87 | −0.66 | 0.23 |
| WSM | −0.80 | 0.59 | −0.79 | 1.07 | 2.54 | −0.25 | −0.05 | −0.34 | 0.41 | −0.07 |
© 2020 by the authors. Licensee MDPI, Basel, Switzerland. This article is an open access article distributed under the terms and conditions of the Creative Commons Attribution (CC BY) license (http://creativecommons.org/licenses/by/4.0/).
Share and Cite
MDPI and ACS Style
Bentivenga, M.; Giano, S.I.; Piccarreta, M. Recent Increase of Flood Frequency in the Ionian Belt of Basilicata Region, Southern Italy: Human or Climatic Changes? Water 2020, 12, 2062. https://0-doi-org.brum.beds.ac.uk/10.3390/w12072062
AMA Style
Bentivenga M, Giano SI, Piccarreta M. Recent Increase of Flood Frequency in the Ionian Belt of Basilicata Region, Southern Italy: Human or Climatic Changes? Water. 2020; 12(7):2062. https://0-doi-org.brum.beds.ac.uk/10.3390/w12072062
Chicago/Turabian StyleBentivenga, Mario, Salvatore Ivo Giano, and Marco Piccarreta. 2020. "Recent Increase of Flood Frequency in the Ionian Belt of Basilicata Region, Southern Italy: Human or Climatic Changes?" Water 12, no. 7: 2062. https://0-doi-org.brum.beds.ac.uk/10.3390/w12072062
Note that from the first issue of 2016, this journal uses article numbers instead of page numbers. See further details here.