Article

Bioremediation of Aquaculture Wastewater with Algal-Bacterial Biofilm Combined with the Production of Selenium Rich Biofertilizer

1
Research & Development Institute of Northwestern Polytechnical University in Shenzhen, Shenzhen 518057, China
2
School of Civil and Environmental Engineering, Harbin Institute of Technology (Shenzhen), Shenzhen 518055, China
*
Author to whom correspondence should be addressed.
Submission received: 11 June 2020 / Revised: 19 July 2020 / Accepted: 20 July 2020 / Published: 21 July 2020
(This article belongs to the Section Wastewater Treatment and Reuse)

Abstract

:
The discharge of aquaculture wastewater and the excessive selenium in aquaculture effluent caused by selenium addition to aquatic feed are posing a serious risk for the marine environment. In this study, batch tests were carried out to investigate the feasibility of utilizing algal–bacterial biofilm for the treatment of selenium-rich aquaculture wastewater. The effects of four different types of commercial biofilm carriers on the attached growth of biofilms and the contaminant removal capacity were examined. The braided cotton biofilm carrier had the best performance on biofilm growth, while in an exponential growth period the dry weight density of the biofilm was above 2.0 g L−1. By utilizing the braided cotton carrier with a hydraulic retention time (HRT) of 6 days, the removal rate of N and P from the raw aquaculture wastewater was 88.5 ± 6.2% and 99.8 ± 0.2%, respectively. After that, the effects of different initial wastewater load ratios (IWLR) and HRT on the effluent quality of the treatment process were studied. The decrease in IWLR and the extension of HRT could improve the treatment performance. The effluent N, P and Se concentrations in the group with 50% IWLR and 6-day HRT were 0.75 ± 0.10 mg L−1, 0.015 ± 0.02 mg L−1, 35.2 ± 3.2 μg L−1, respectively, indicating an effective removal of the main contaminants. The algal–bacterial biofilm harvested from the batch test was rich in N, P and Se, where the Se content was 21.8 ± 3.4 mg kg−1, which has the potential to be used as an Se-rich biofertilizer.

1. Introduction

Global aquaculture has undergone tremendous growth since the middle of the 20th century, now providing approximately half of all food fish consumption, which is currently over 80 million tons [1]. China is the world’s largest producer of aquaculture products, but the enormous quantity of wastewater discharged from the intensive development of the aquaculture industry has caused severe environmental impacts [2]. For instance, the nutrient-rich effluent usually results in eutrophication events such as green tides, which could block vast areas of marine channels and then cause great economic losses [3]. More than 70% of antibiotics added to aquaculture systems are released into the water and accumulate in the sediment, while the public health risk of selective pressure posed on the aquatic microbial community remains unclear [4,5]. The widespread use of copper sulfate to prevent infections and algal overgrowth in aquaculture has resulted in heavy metal accumulation in the effluent and the receiving aquatic environment [6,7].
Apart from the issues caused by conventional contaminants, such as nitrogen, phosphorous, antibiotics, and heavy metals, the potential environmental impacts associated with the metalloid composition from aquaculture wastewater has received great concern in the recent decades. Selenium is an essential trace element for the well-being of human and animals [8,9]. Se deficiency may depress growth and appetite, as well as cause peroxidative damage to cell membranes and result in high mortality [10,11,12]. The supplementation of Se in fish feed has been well accepted, because in an intensive cultural system, Se from ambient water and the feedstock itself usually cannot supply the optimal level required by the cultured species. However, excessive Se may result in a series of physiological problems, such as reproductive failure, tissue destruction, and teratogenic deformities of organs (e.g., spine, head, mouth, and fins) [13,14]. The additive dose of Se in fish feed and consequent elevation of Se level in the aquaculture effluent should be carefully balanced, because once selenium contamination begins, a cascade of events is set into motion that could quickly lead to irreversible ecosystem disruption [15].
The guideline value for Se in drinking water was set at 40 μg L−1 by World Health Organization [16], and 10 μg L−1 in China, the European Union (EU), and the United States (US) [17,18,19]. For aquatic life, the Se limitation value is even lower. The highest concentration of selenium in surface water, to which an aquatic community can be exposed indefinitely without resulting in an unacceptable effect, is suggested to be 5.0 μg L−1 [20], meaning that the chronic discharge of Se containing wastewater, even if its Se concentration presents only a few micrograms per liter, may cause unpreventable adverse consequences to the aquatic environment. In recent decades, there has been little literature published on the management of Se contaminated aquaculture wastewater.
Biofilm processes are universally used in aquaculture wastewater treatment [21,22,23]. For instance, fixed bed biofilm systems (trickling biofilters) had been successfully developed for the removal of total ammonia nitrogen and chemical oxygen demand (COD) from aquaculture effluent, so that the water could be reused [24]. Microalgal biofilms have been shown to reduce the level of phosphate from 15 mg L−1 to undetectable limits within 24 h [25]. Li et al. [21] demonstrated the effectiveness of moving bed biofilm reactors for the removal of antibiotics from aquaculture wastewater, such as norfloxacin, ciprofloxacin, enrofloxacin, where the removal rates (28.4%, 32.9%, and 69.5%, respectively) were comparable to that in waste water treatment plant (WWTP). So far, although biofilm processes have been proved to be effective for the treatment of Se-laden wastewater from different sources, such as agriculture and mining [26,27], reports on the treatment of Se-excessive mariculture wastewater are rare. The present study explores the removal of conventional contaminants (such as N, P), and excessive selenium from aquaculture effluent, utilizing an algal–bacterial biofilm batch reactor (ABBR) as a bioremediation strategy. Considering the fact that selenium is a resource that has remarkable regional variation in distribution, the biofilm (after the treatment) is regarded as a Se-rich biomass, which could subsequently be harvested and utilized as a fertilizer for Se-biofortification purposes. The quality of the product was evaluated after the trial treatment. This is the first work conducting the management of Se-rich aquaculture wastewater using a biofilm method, which subsequently combines with the production of Se-rich biofertilizer.

2. Materials and Methods

Cultivation of an algal–bacterial biofilm in aquaculture wastewater was carried out at bench scale. The potential removal of N, P and selenium from aquaculture wastewater by an algal–bacterial biofilm was assessed through batch experiments. The quality of the Se-rich biofilm biomass was evaluated after the bioremediation test.

2.1. The Raw Aquaculture Wastewater

The aquaculture wastewater used in this study was from a fish and shrimp mixed culture pond in Foshan City, China, and was sampled on September 2019. The characteristics are showed in Table 1.

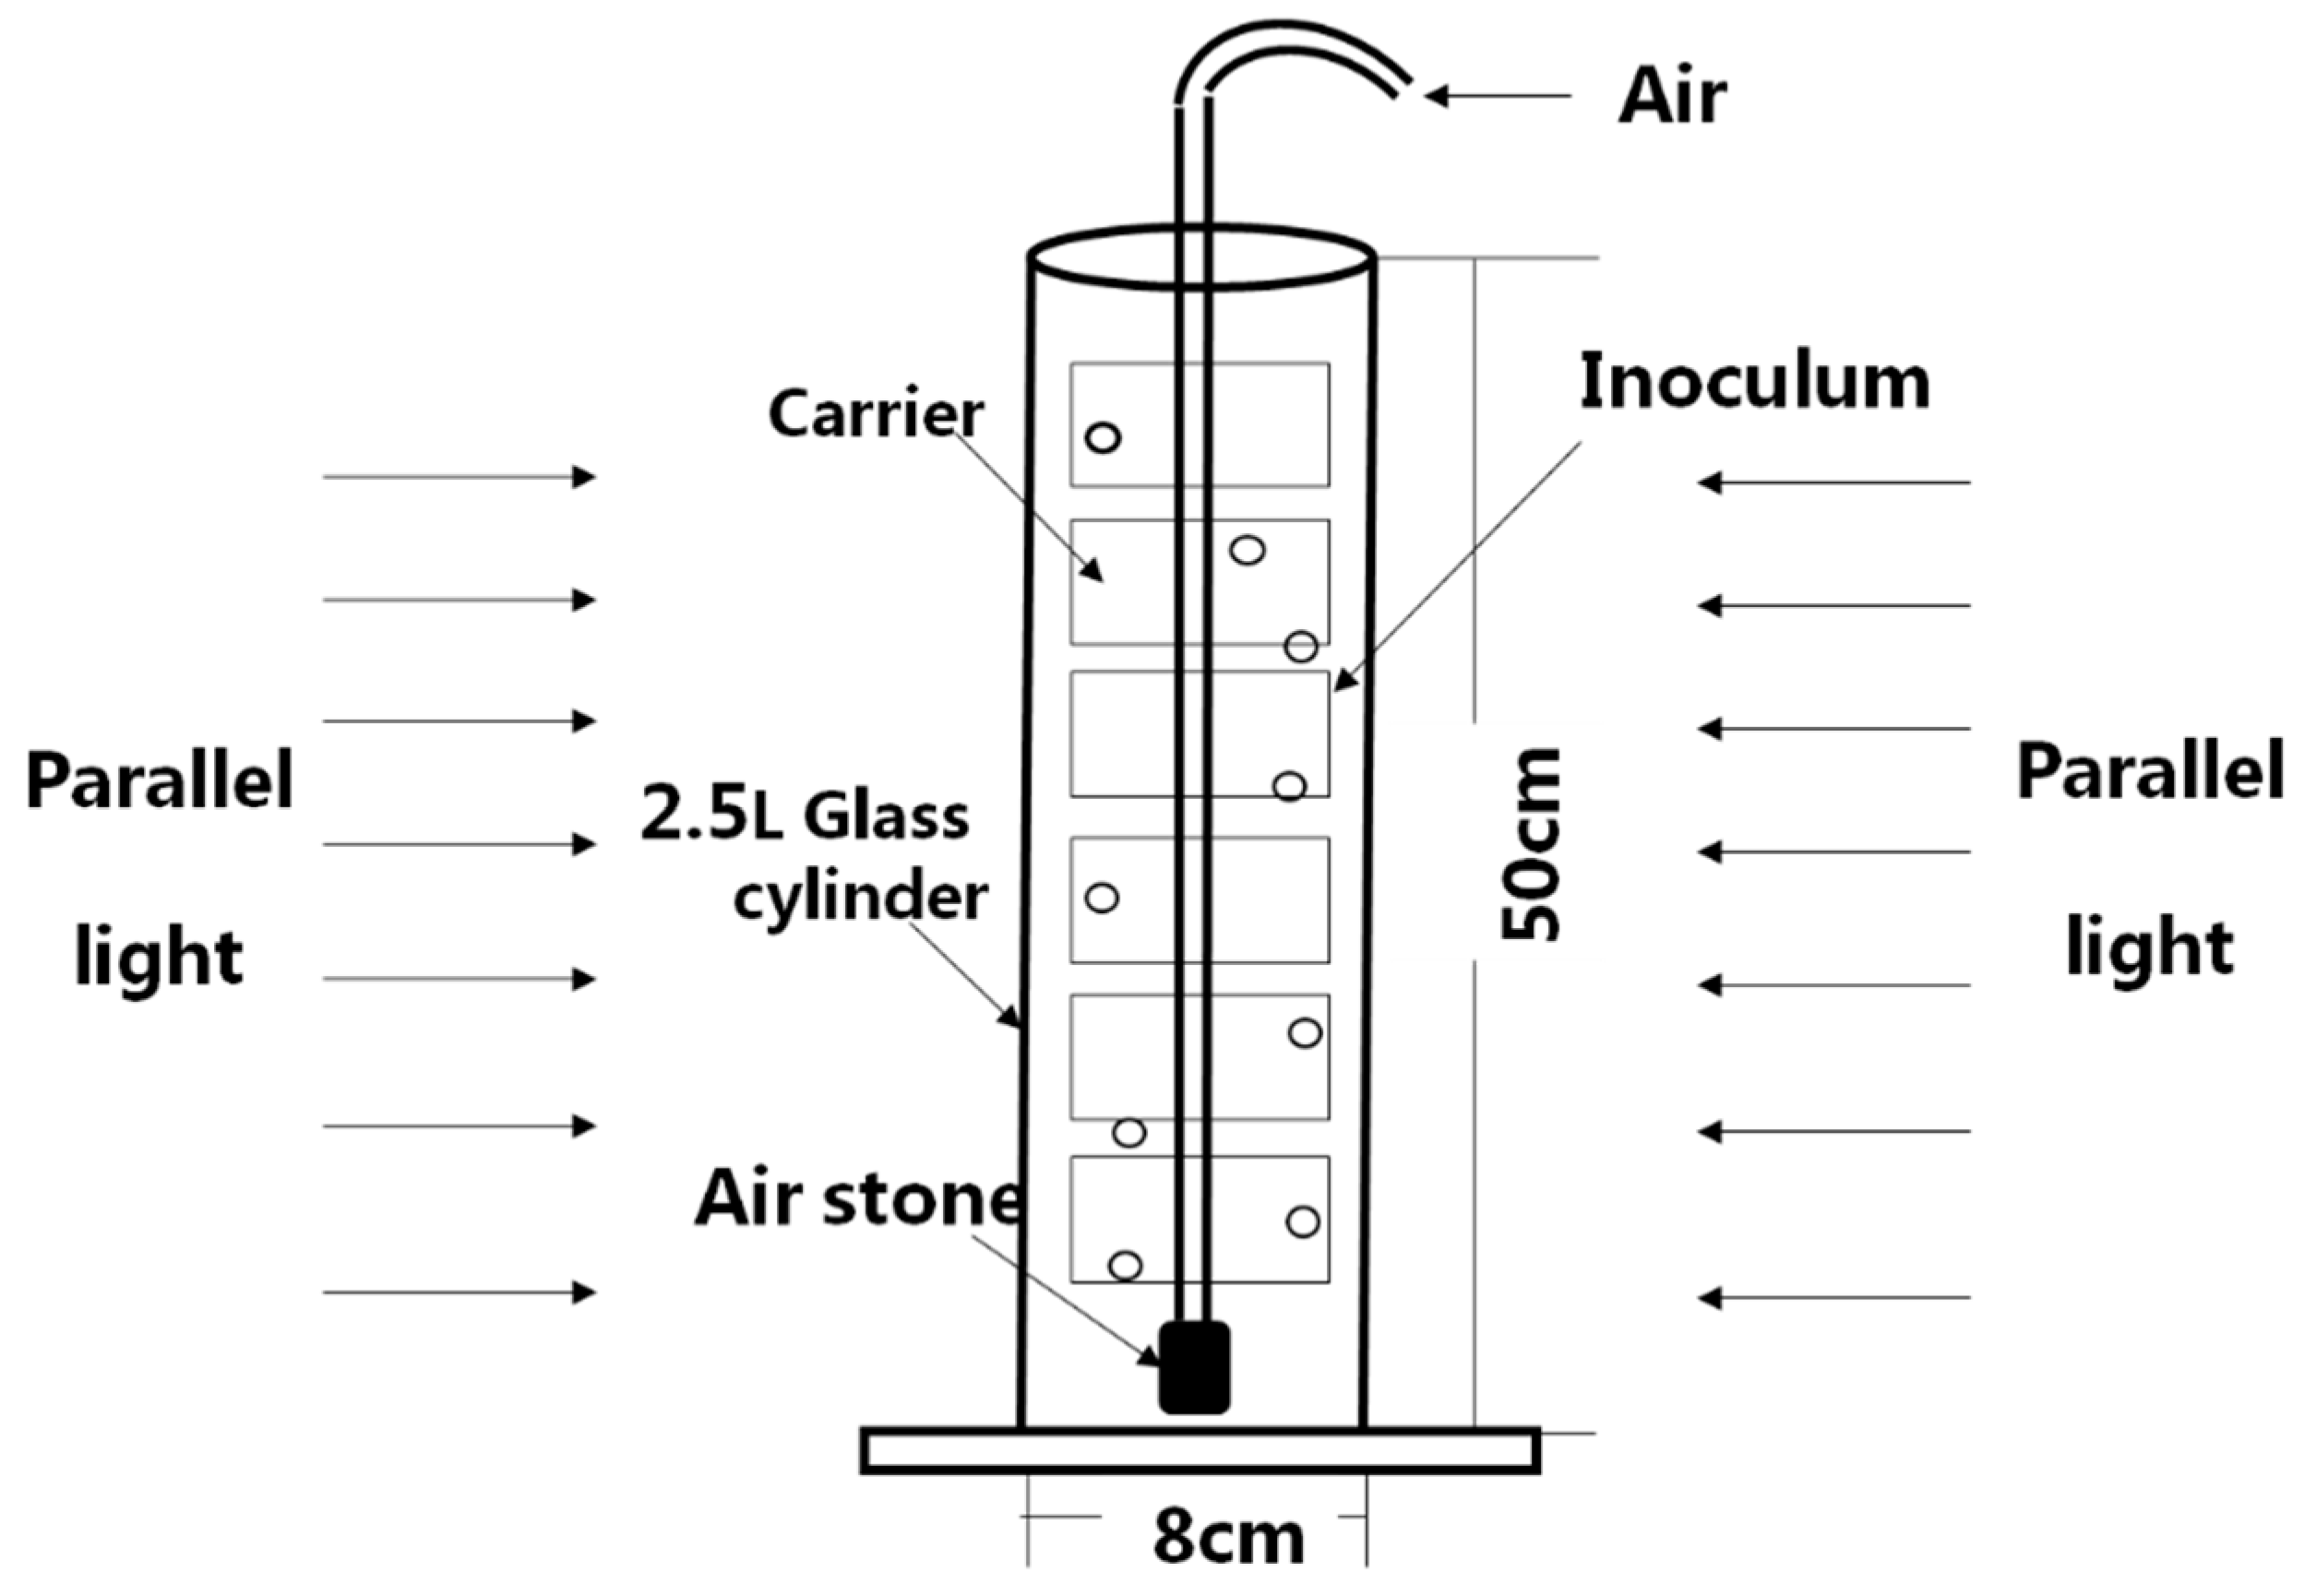
2.2. The Algal-Bacterial Biofilm Batch Reactor (ABBR)

A glass cylinder with an internal diameter of 8 cm, a length of 50 cm and a volume of 2.5 L was utilized in this experiment for the cultivation of the algal–bacterial biofilm and the bioremediation tests (Figure 1). During cultivation, the system was aerated with air at a rate of 50 mL min−1, while the working volume was 2 L. The culture was illuminated with florescent light (125 μmol m−2 s−1) at 25 ± 2.0 °C, and the dark light ratio was 12:12. Biofilm carriers were installed along the middle axle of the cylinder with a density of 4.5 g carrier per liter culture.

2.3. Cultivation of Algal-Bacterial Biofilm for Inoculation

Before the bioremediation tests, sediments from the coast along the Shenzhen Bay (113°58′ E, 22°31′ N) were collected and mixed with the aquaculture waster for the formation of the algal–bacterial biofilm. In this step, polyvinyl chloride (PVC) tubes were utilized as the initial biofilm carriers in the ABBR, and the first trial test was supplemented with double strength f/2 medium [28] and activated sludge from a municipal wastewater treatment plant. The culture was incubated for 60 days under the same environmental conditions described in Section 2.2, until the formation of an algal–bacterial biofilm with a thickness of nearly 1.5 mm on PVC tubes. To prepare the inoculum for the following tests, the biofilm was scraped from the PVC tubes and ground for homogenization.

2.4. Batch Experiments for Bioremediation

In the bioremediation tests, 3.0 g ground biofilm (fresh weight) was inoculated into each ABBR which contained 2 L aquaculture wastewater. The trials were conducted under the basic experimental conditions described in Section 2.2 for 30 days. The bioremediation test comprised two stages. In the first stage, the performance of four different commercial biofilm carriers (braided cotton, polypropylene brush, polystyrene foam and carbon fiber sponge) on the effects of biofilm formation, biomass density and the removal of contaminants was examined. In each ABBP, six pieces of biofilm carriers (1.5 ± 0.01 g each) were submerged in the wastewater and fastened along the middle axle of the reactor, while a hydraulic retention time of six days was used. The biofilm carrier corresponding to the highest biomass attached growth and contaminants removal efficiency was selected for the second stage test. In the second stage test, the impacts of hydraulic retention time (HRT) (3, 6, and 9 days) and initial wastewater load ratio (25%, 50%, and 100%, diluted by artificial seawater) on the removal of contaminants were investigated. The quality of the product of the bioremediation process (the Se-rich biofilm biomass) was analyzed at the end of the test. Each experimental group was replicated twice. The T test was carried out to analyze the significant differences between the data of different groups.

2.5. Sampling and Sample Analysis

During the first stage of the bioremediation test, the growth of the algal–bacterial biofilm was monitored every six days. For each sampling, 1.5 g (a piece) of the biofilm carrier was randomly taken from the ABBR. Then, the carrier was dried in the oven at 110 °C overnight. Dry mass was calculated based on the increased weight. After each 1.5 g of the biofilm carrier was taken from the reactor, to maintain a carrier density of 4.5 g L−1, the remaining culture volume of the system was reduced by 0.33 L. Liquid samples were filtered with 0.45 μm pore size membrane. Nitrogen, phosphorus, selenium concentration, COD, and pH were measured. At the end of the bioremediation test, the biomass of the algal–bacterial biofilm was carefully scraped from the last carrier and rinsed with distilled water. Then, the biomass was dried at 110 °C overnight, and 0.2 g dry algal biofilm solid was digested following a previous reported procedure [29]. After digestion, the Se and heavy metal content in the liquid was measured by the ion chromatography method. Nitrogen and phosphorus content in this study was monitored by flow injection analysis (FIA).

3. Results

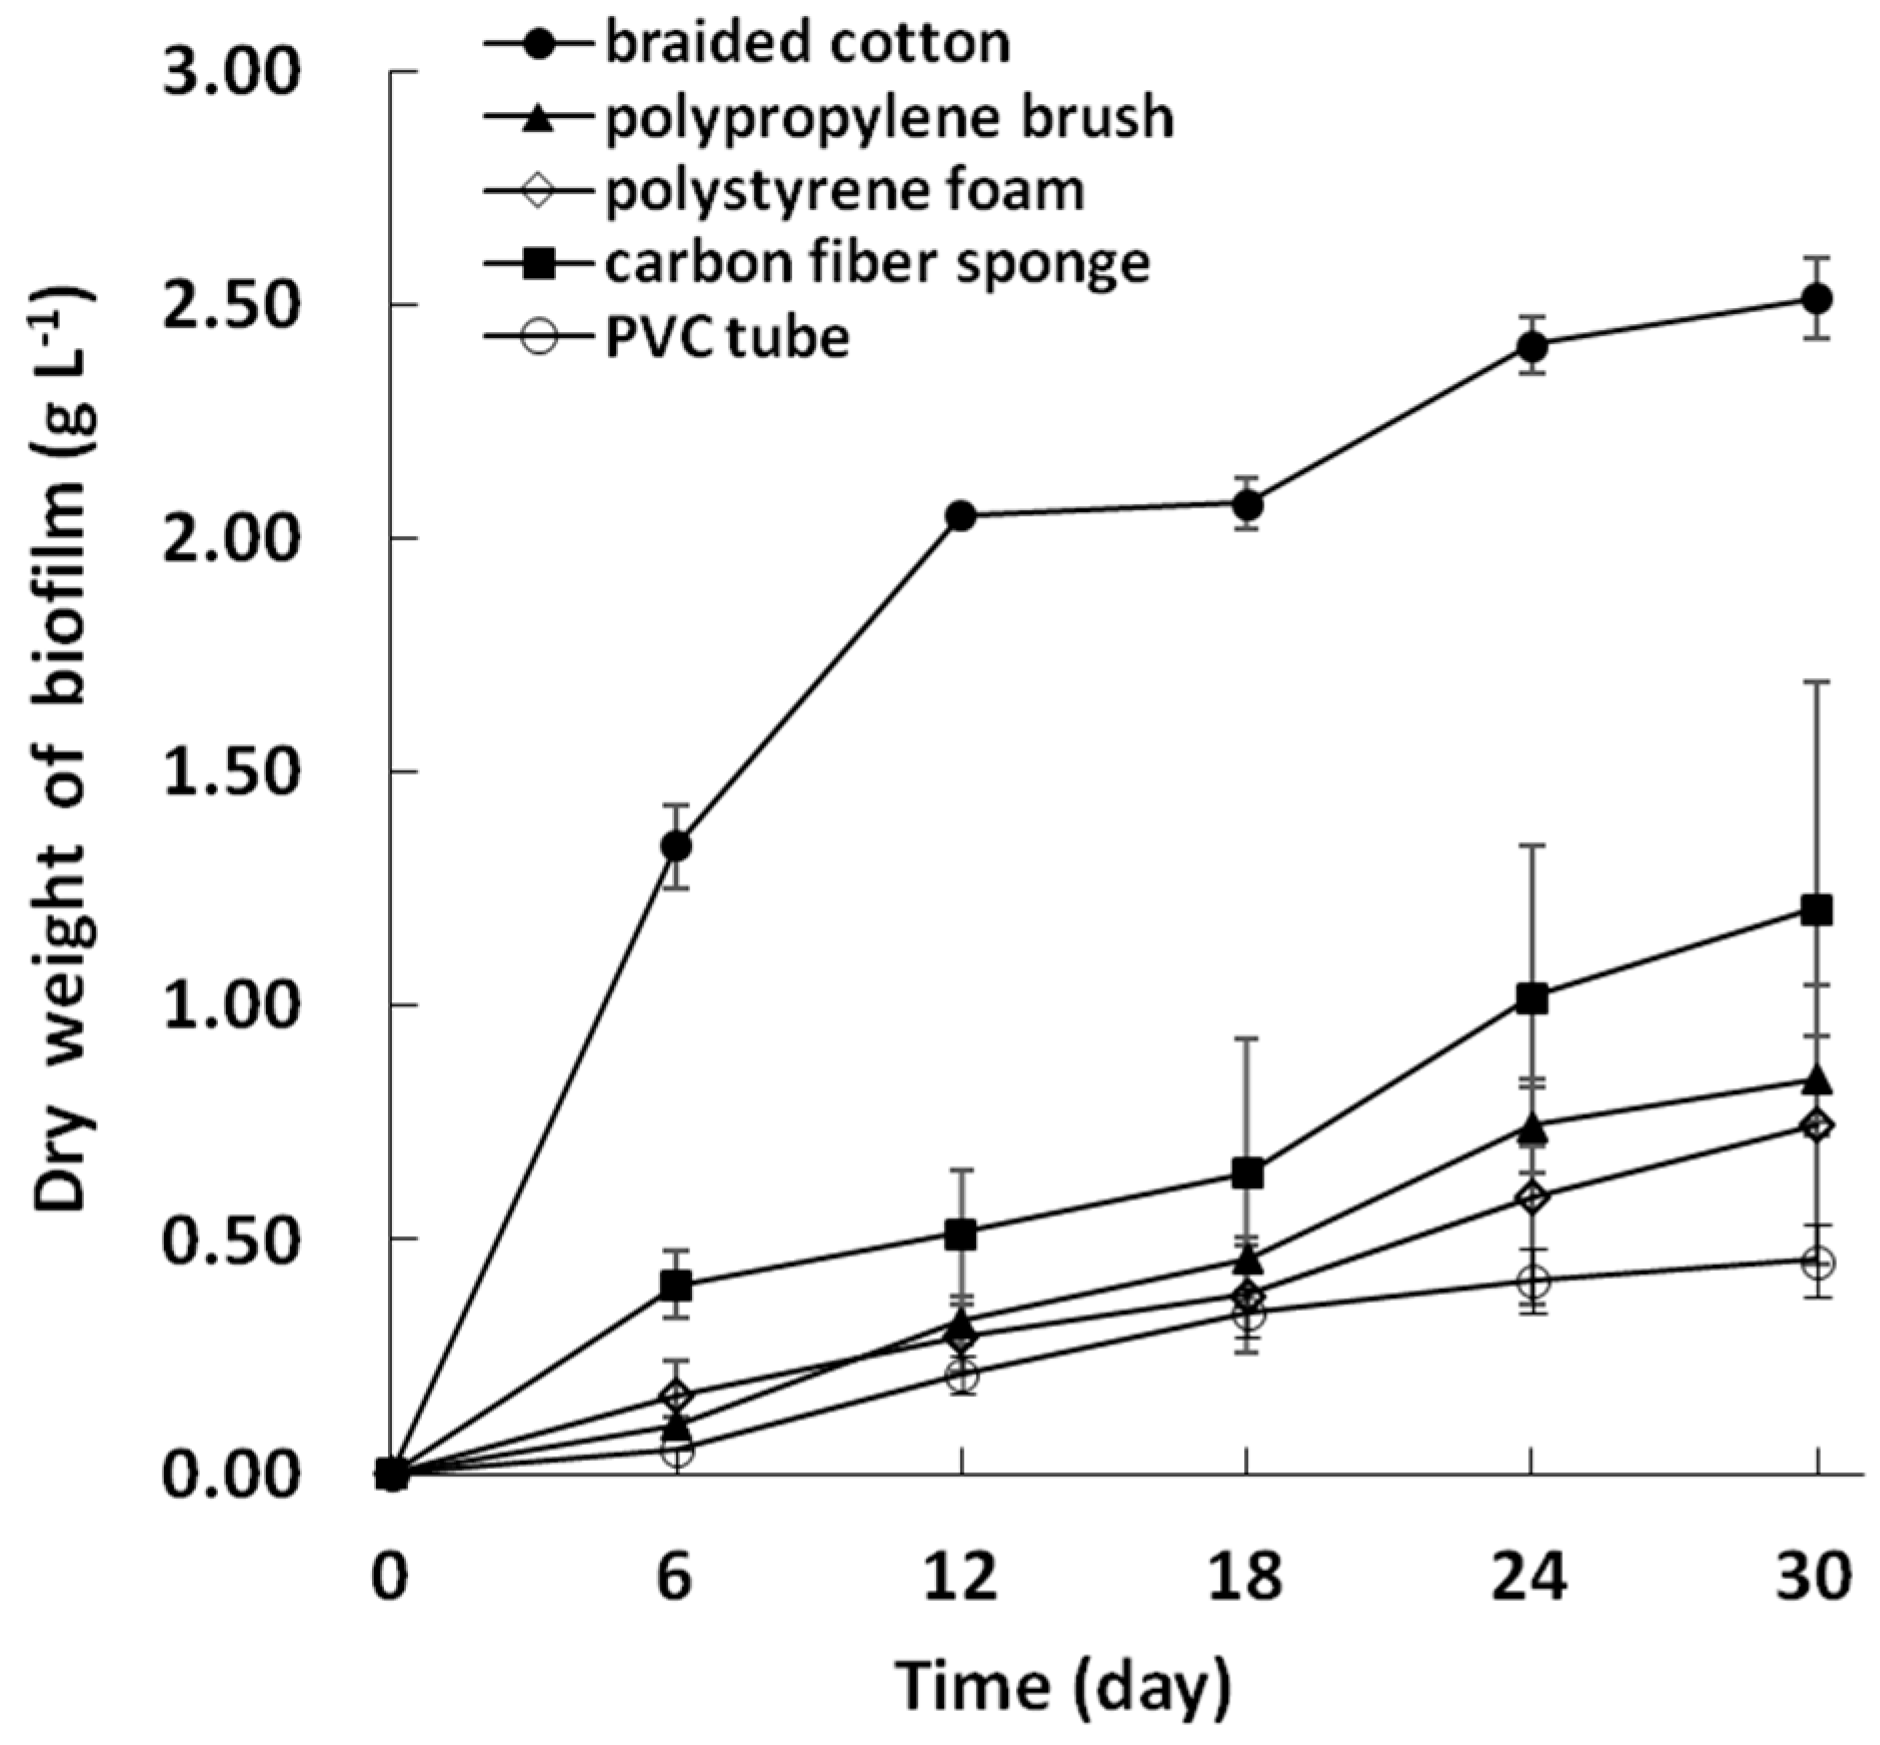
3.1. The Growth of Algal-Bacterial Biofilm on Different Carriers

In the first stage of the bioremediation test, four types of commercial biofilm carriers were tested for algal–bacterial biofilm formation. The growth curve is shown in Figure 2. The results show that the exponential growth phase of the biofilm was from Day 6 to 18, and after Day 24, the biofilm growth curve entered a stable phase. The biomass density of the algal–bacterial biofilm on four different commercial carriers was higher than that on the PVC pipes used for inoculation. For the braided cotton group, the dry weight density at Day 30 was around 2.52 ± 0.08 g L−1, which was more than twice that of other groups. The second most effective carrier was carbon fiber sponge, where the dry weight density of the biofilm at Day 30 was around 1.209 ± 0.485 g L−1. The maximum dry weight density of the rest two carriers was nearly 1.0 g L−1. The growth curve of the biofilm cultured on polystyrene brush and polypropylene foam board were very similar.

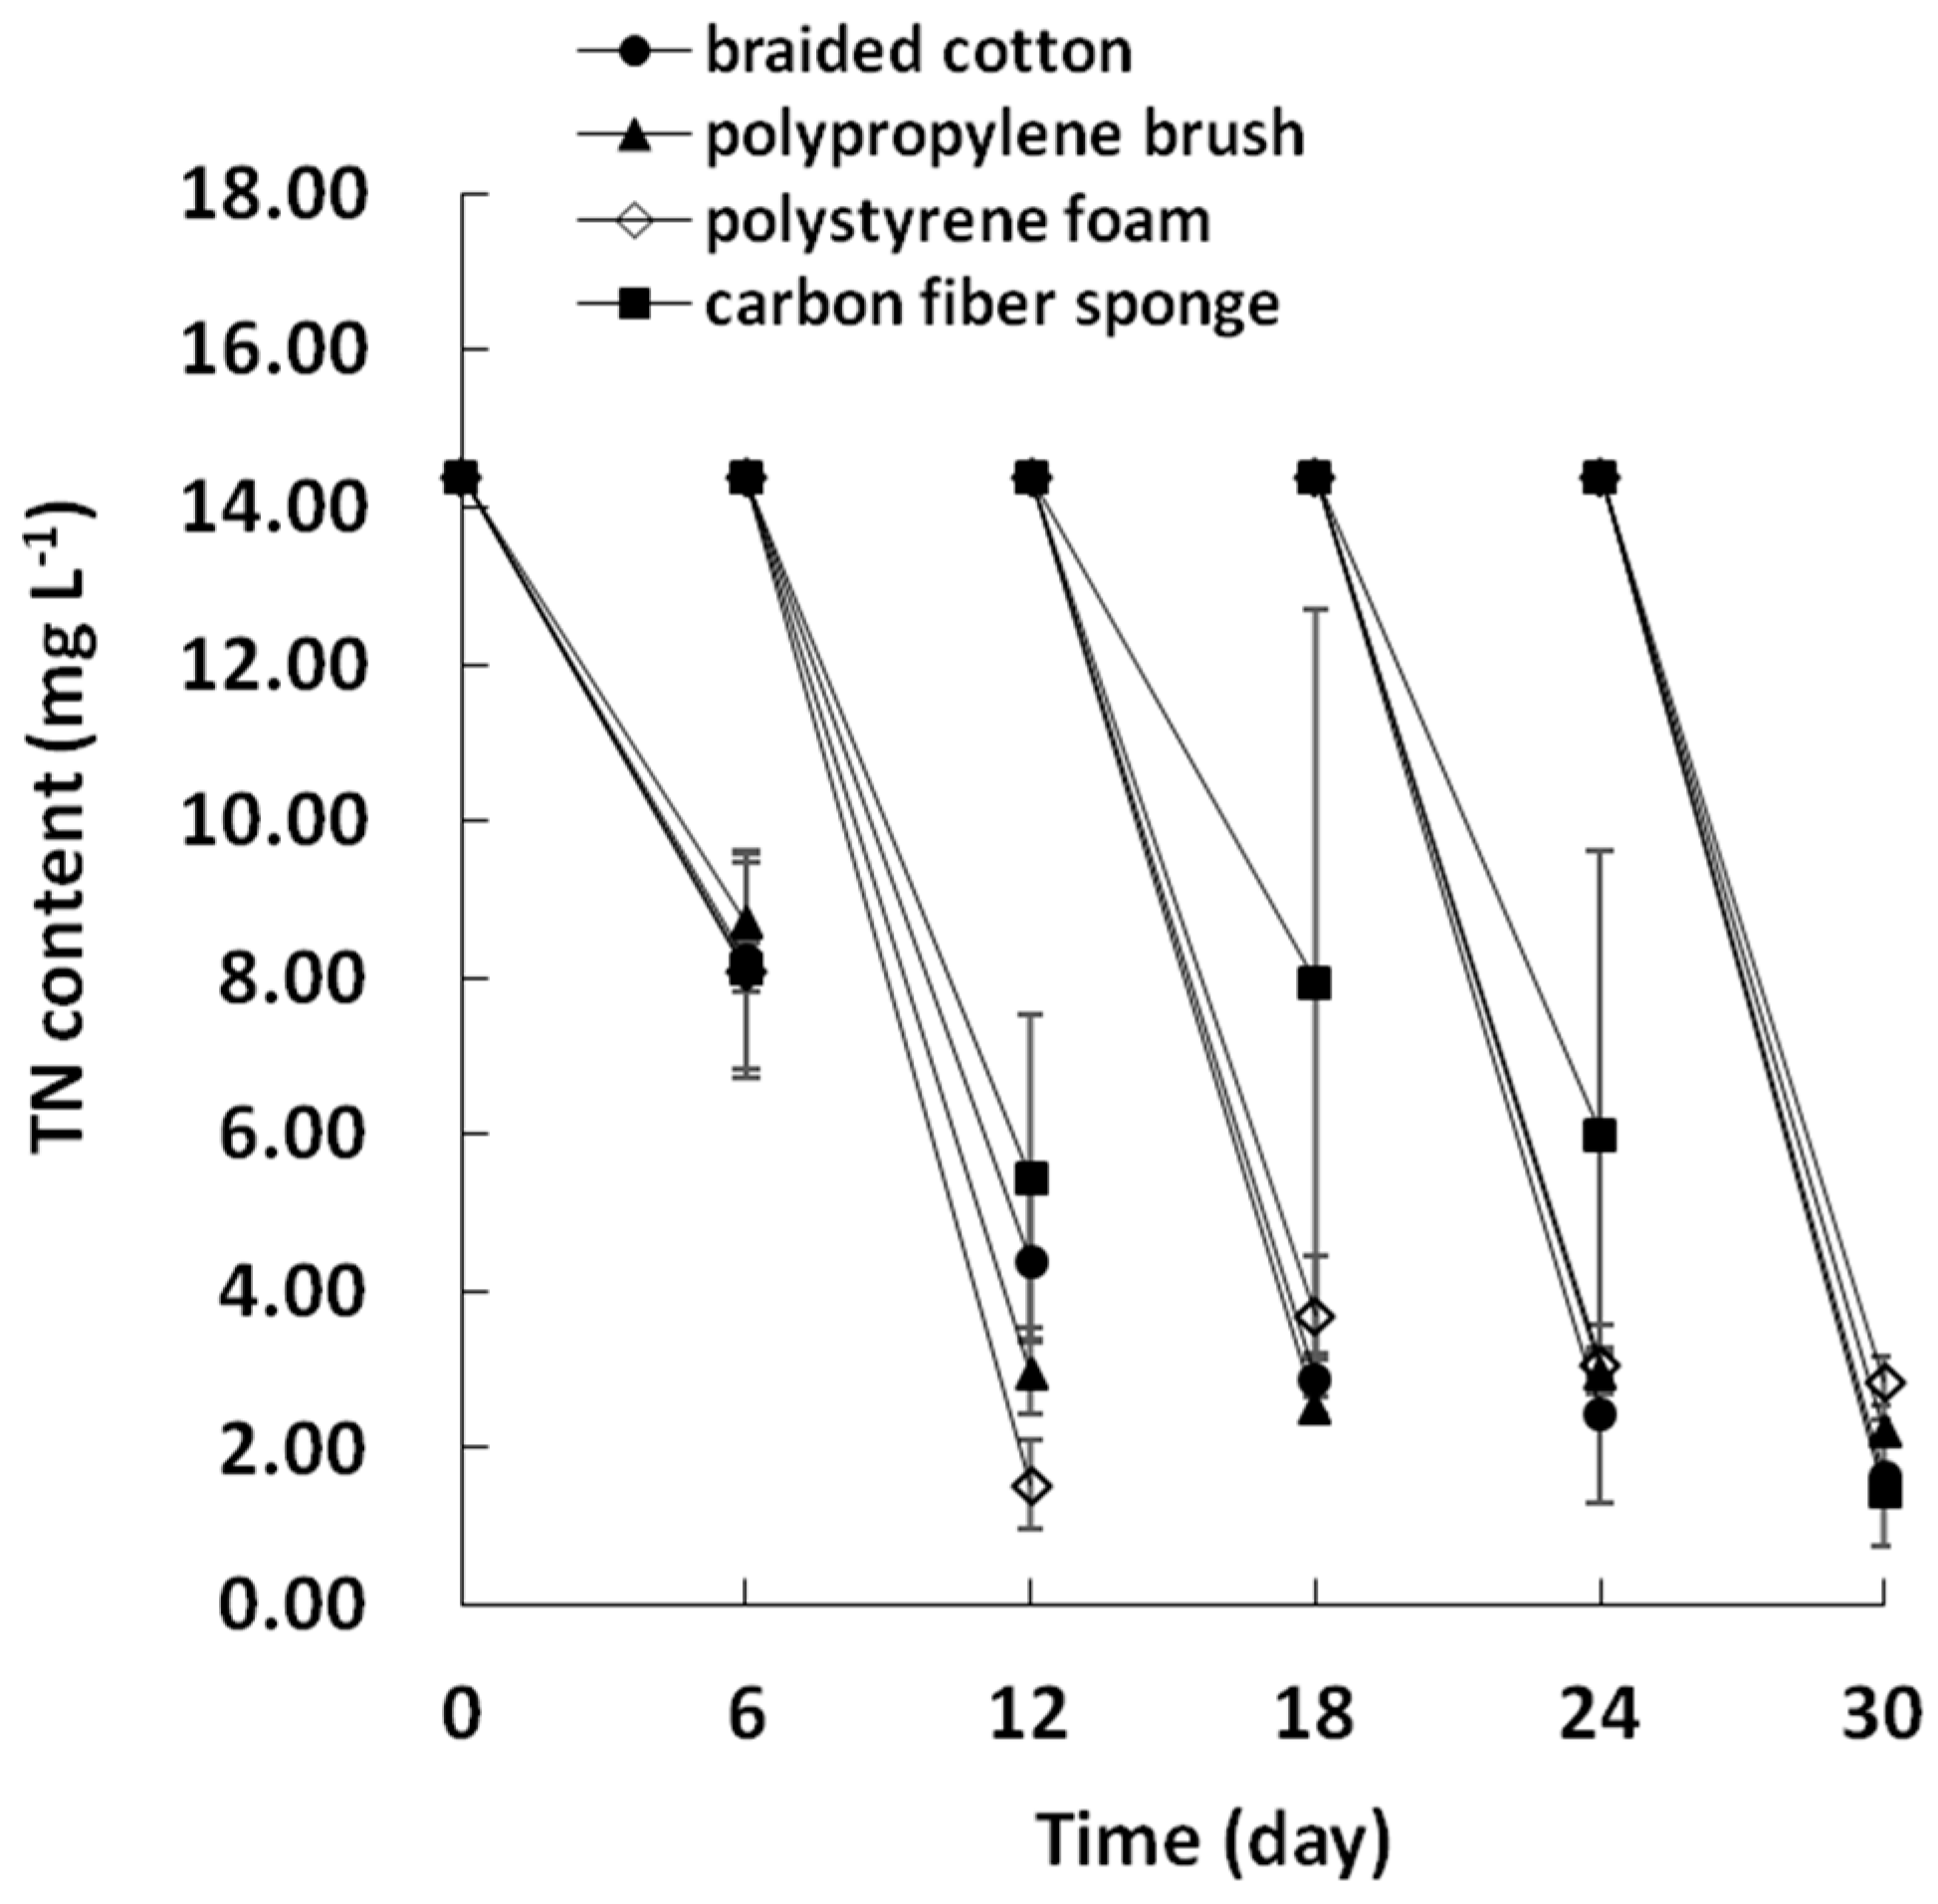
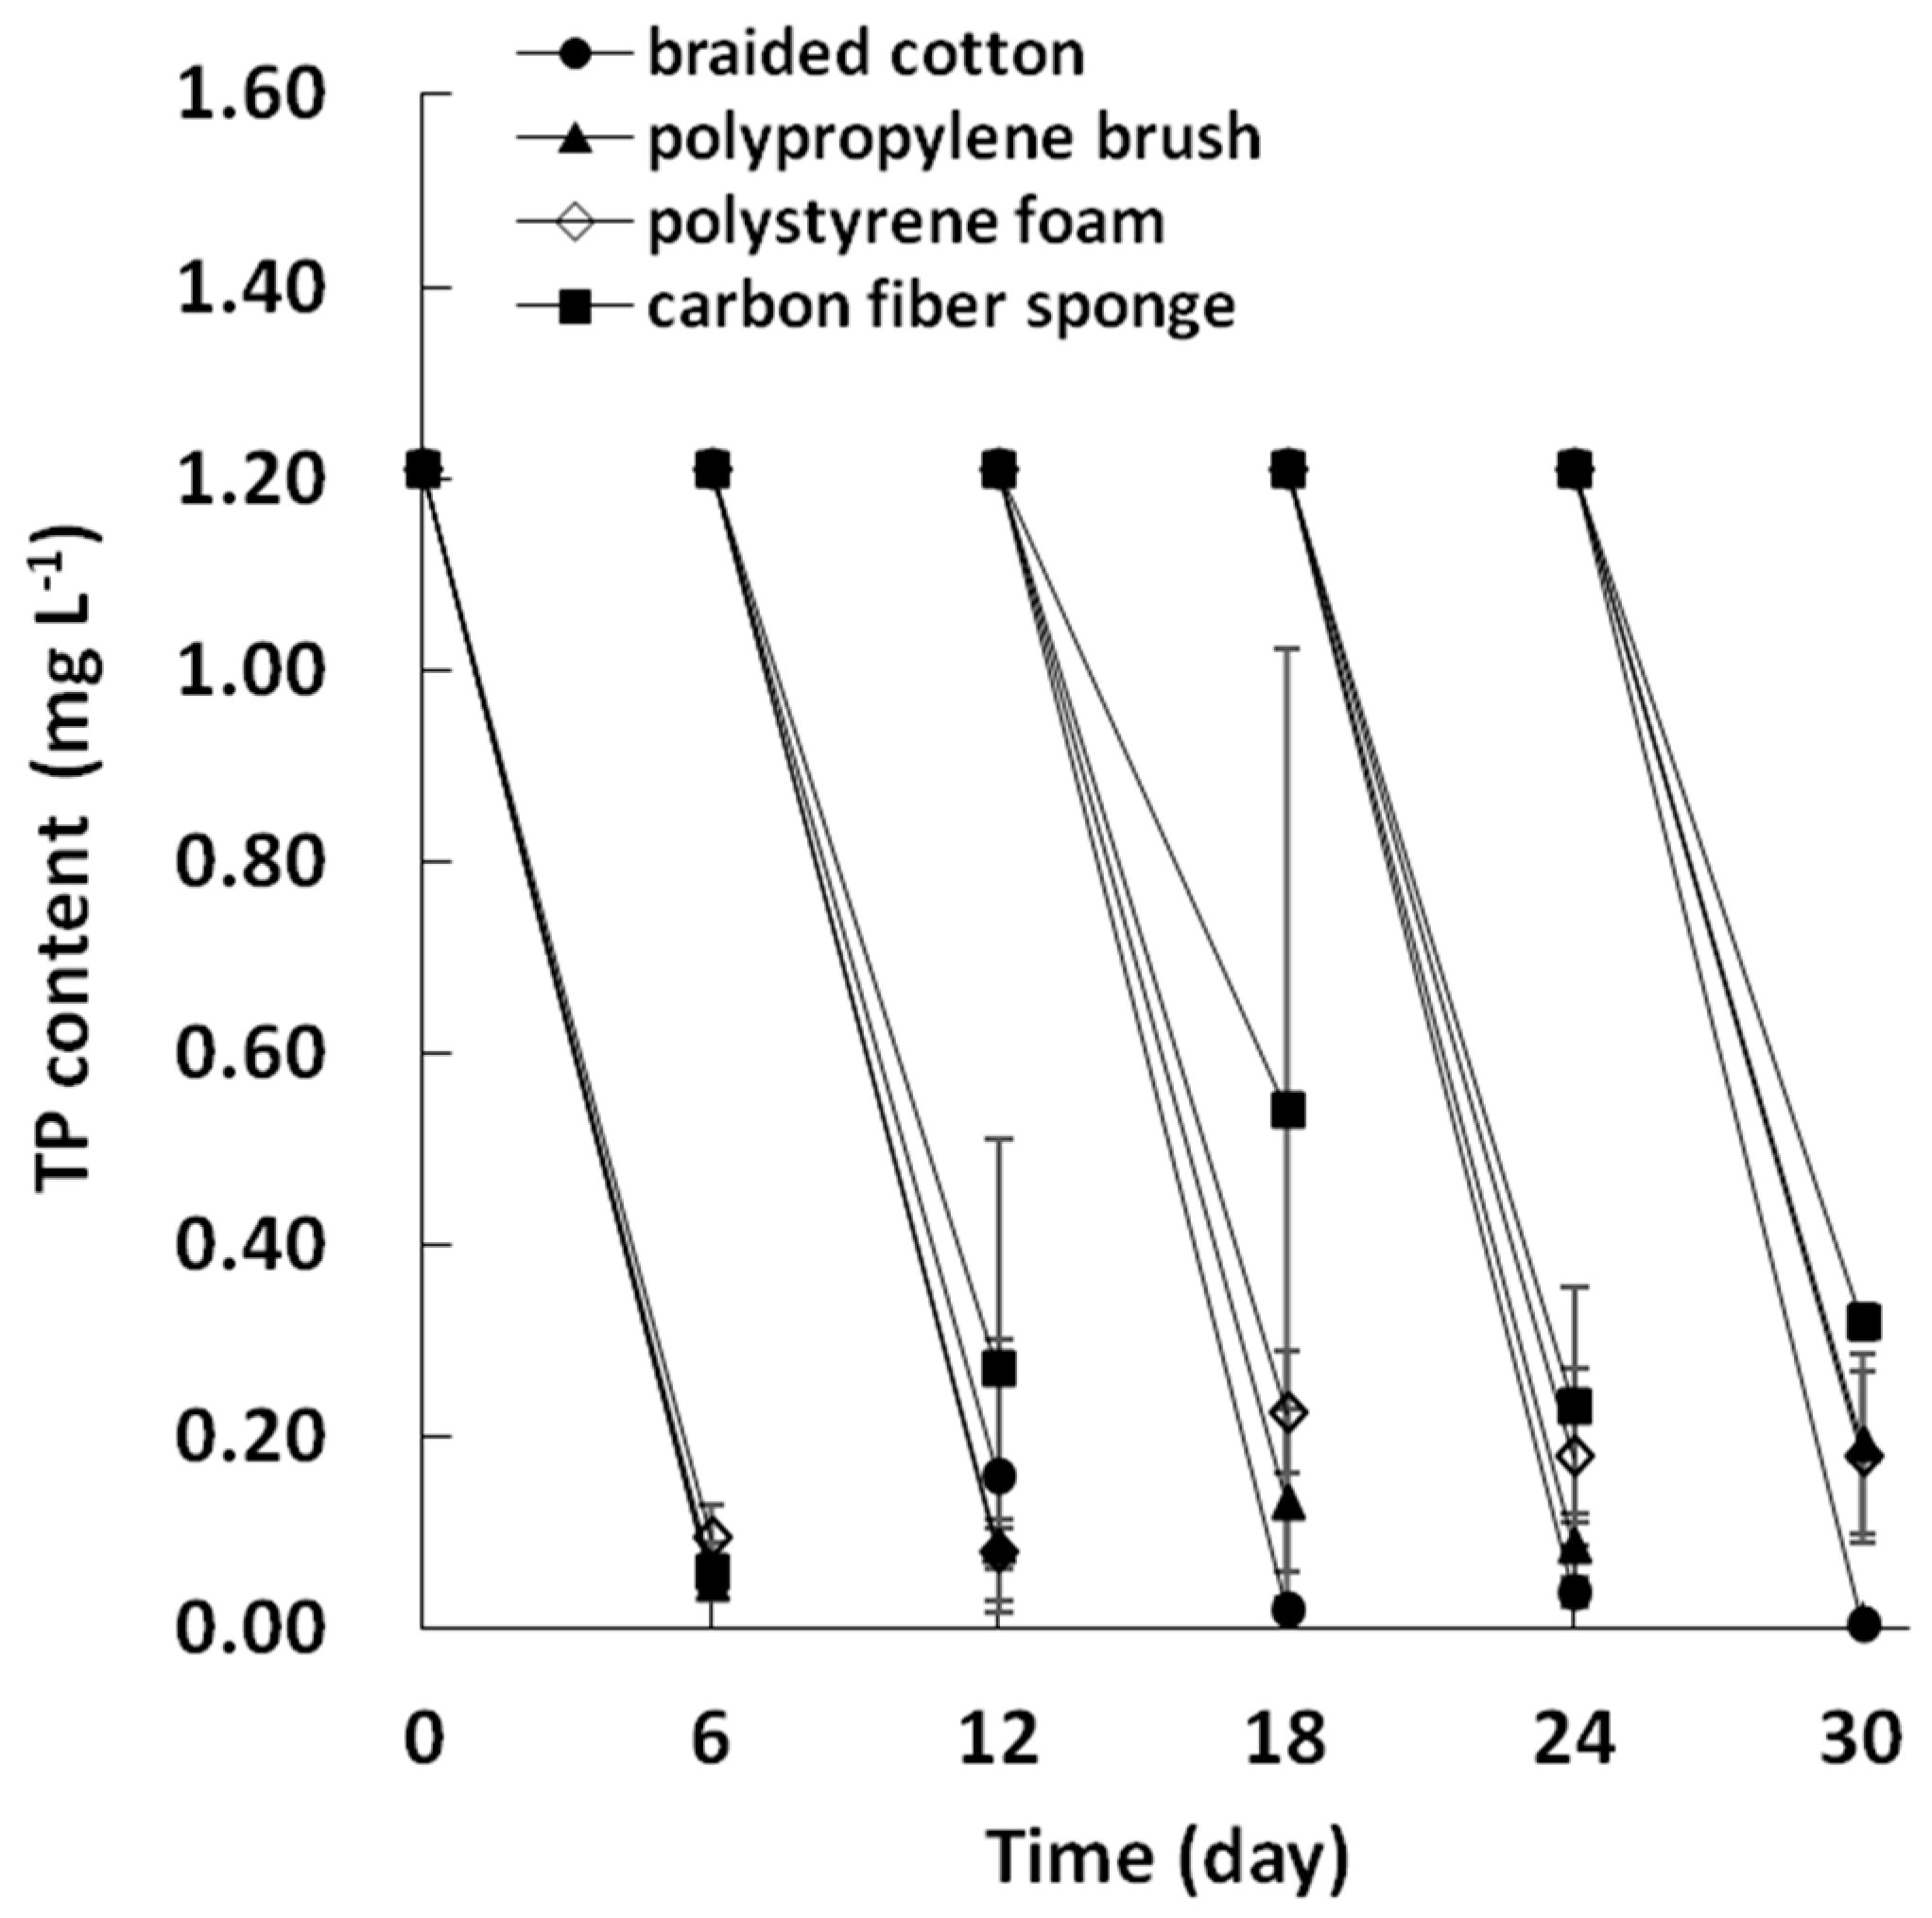
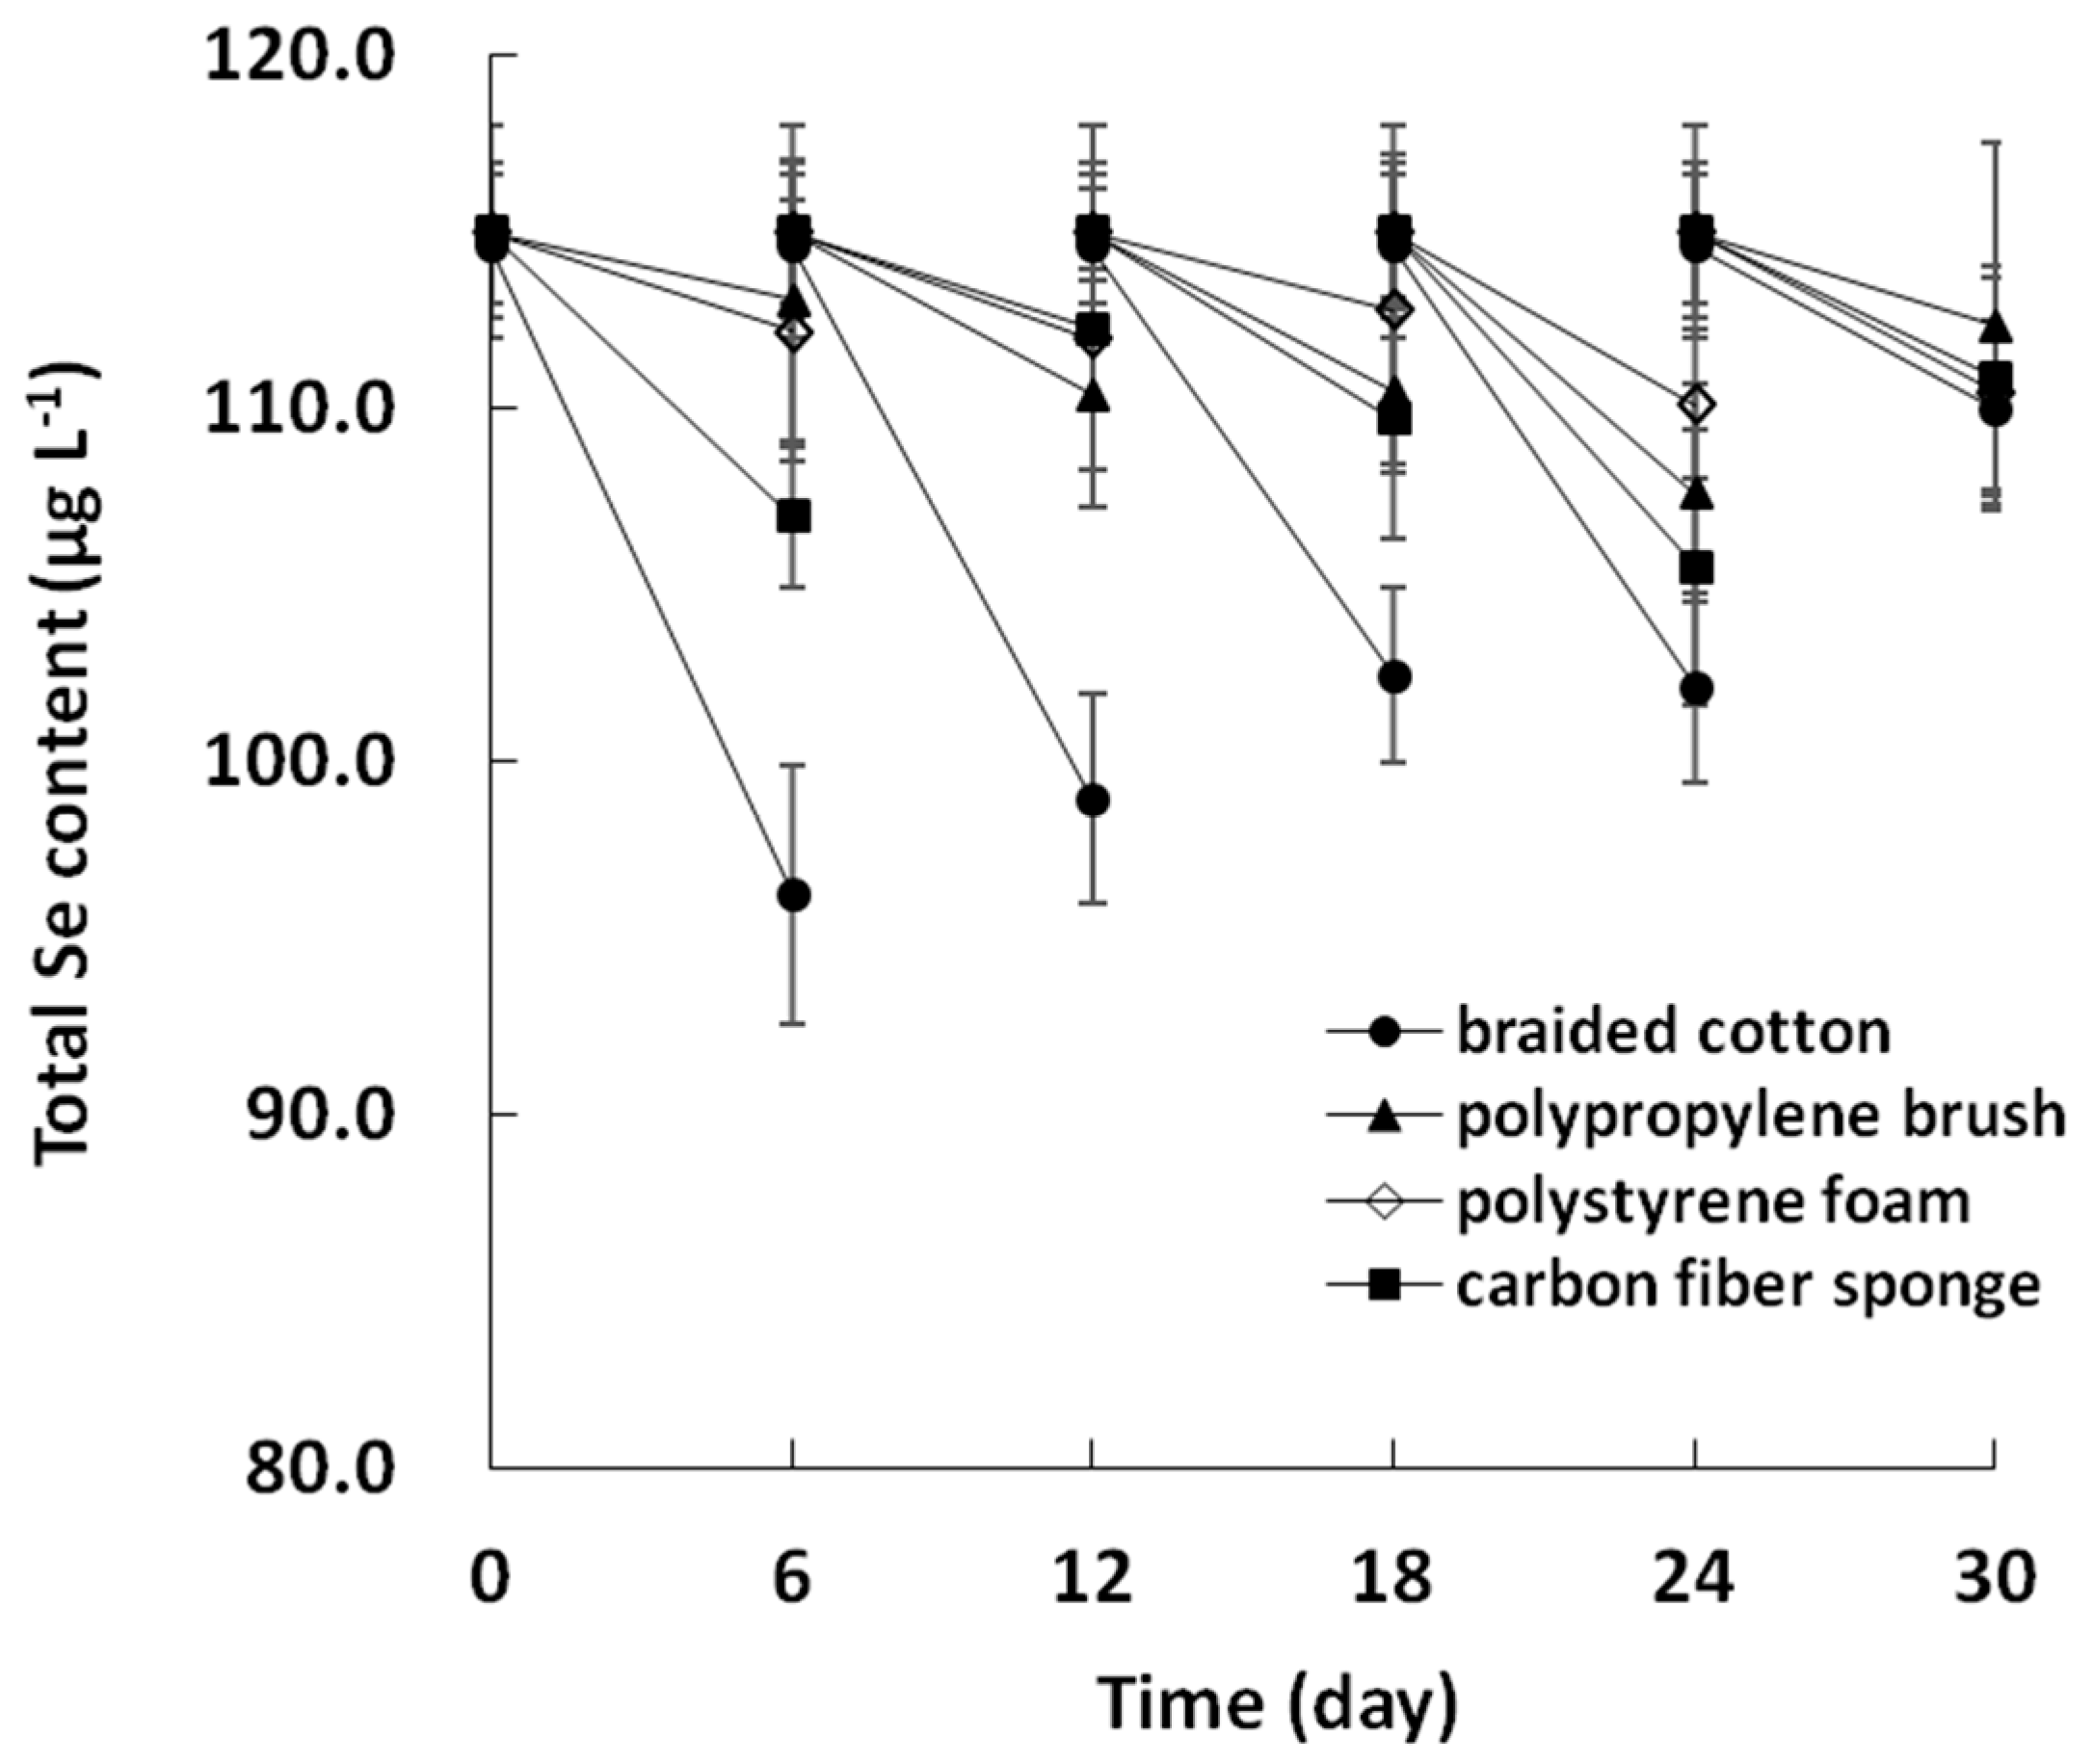
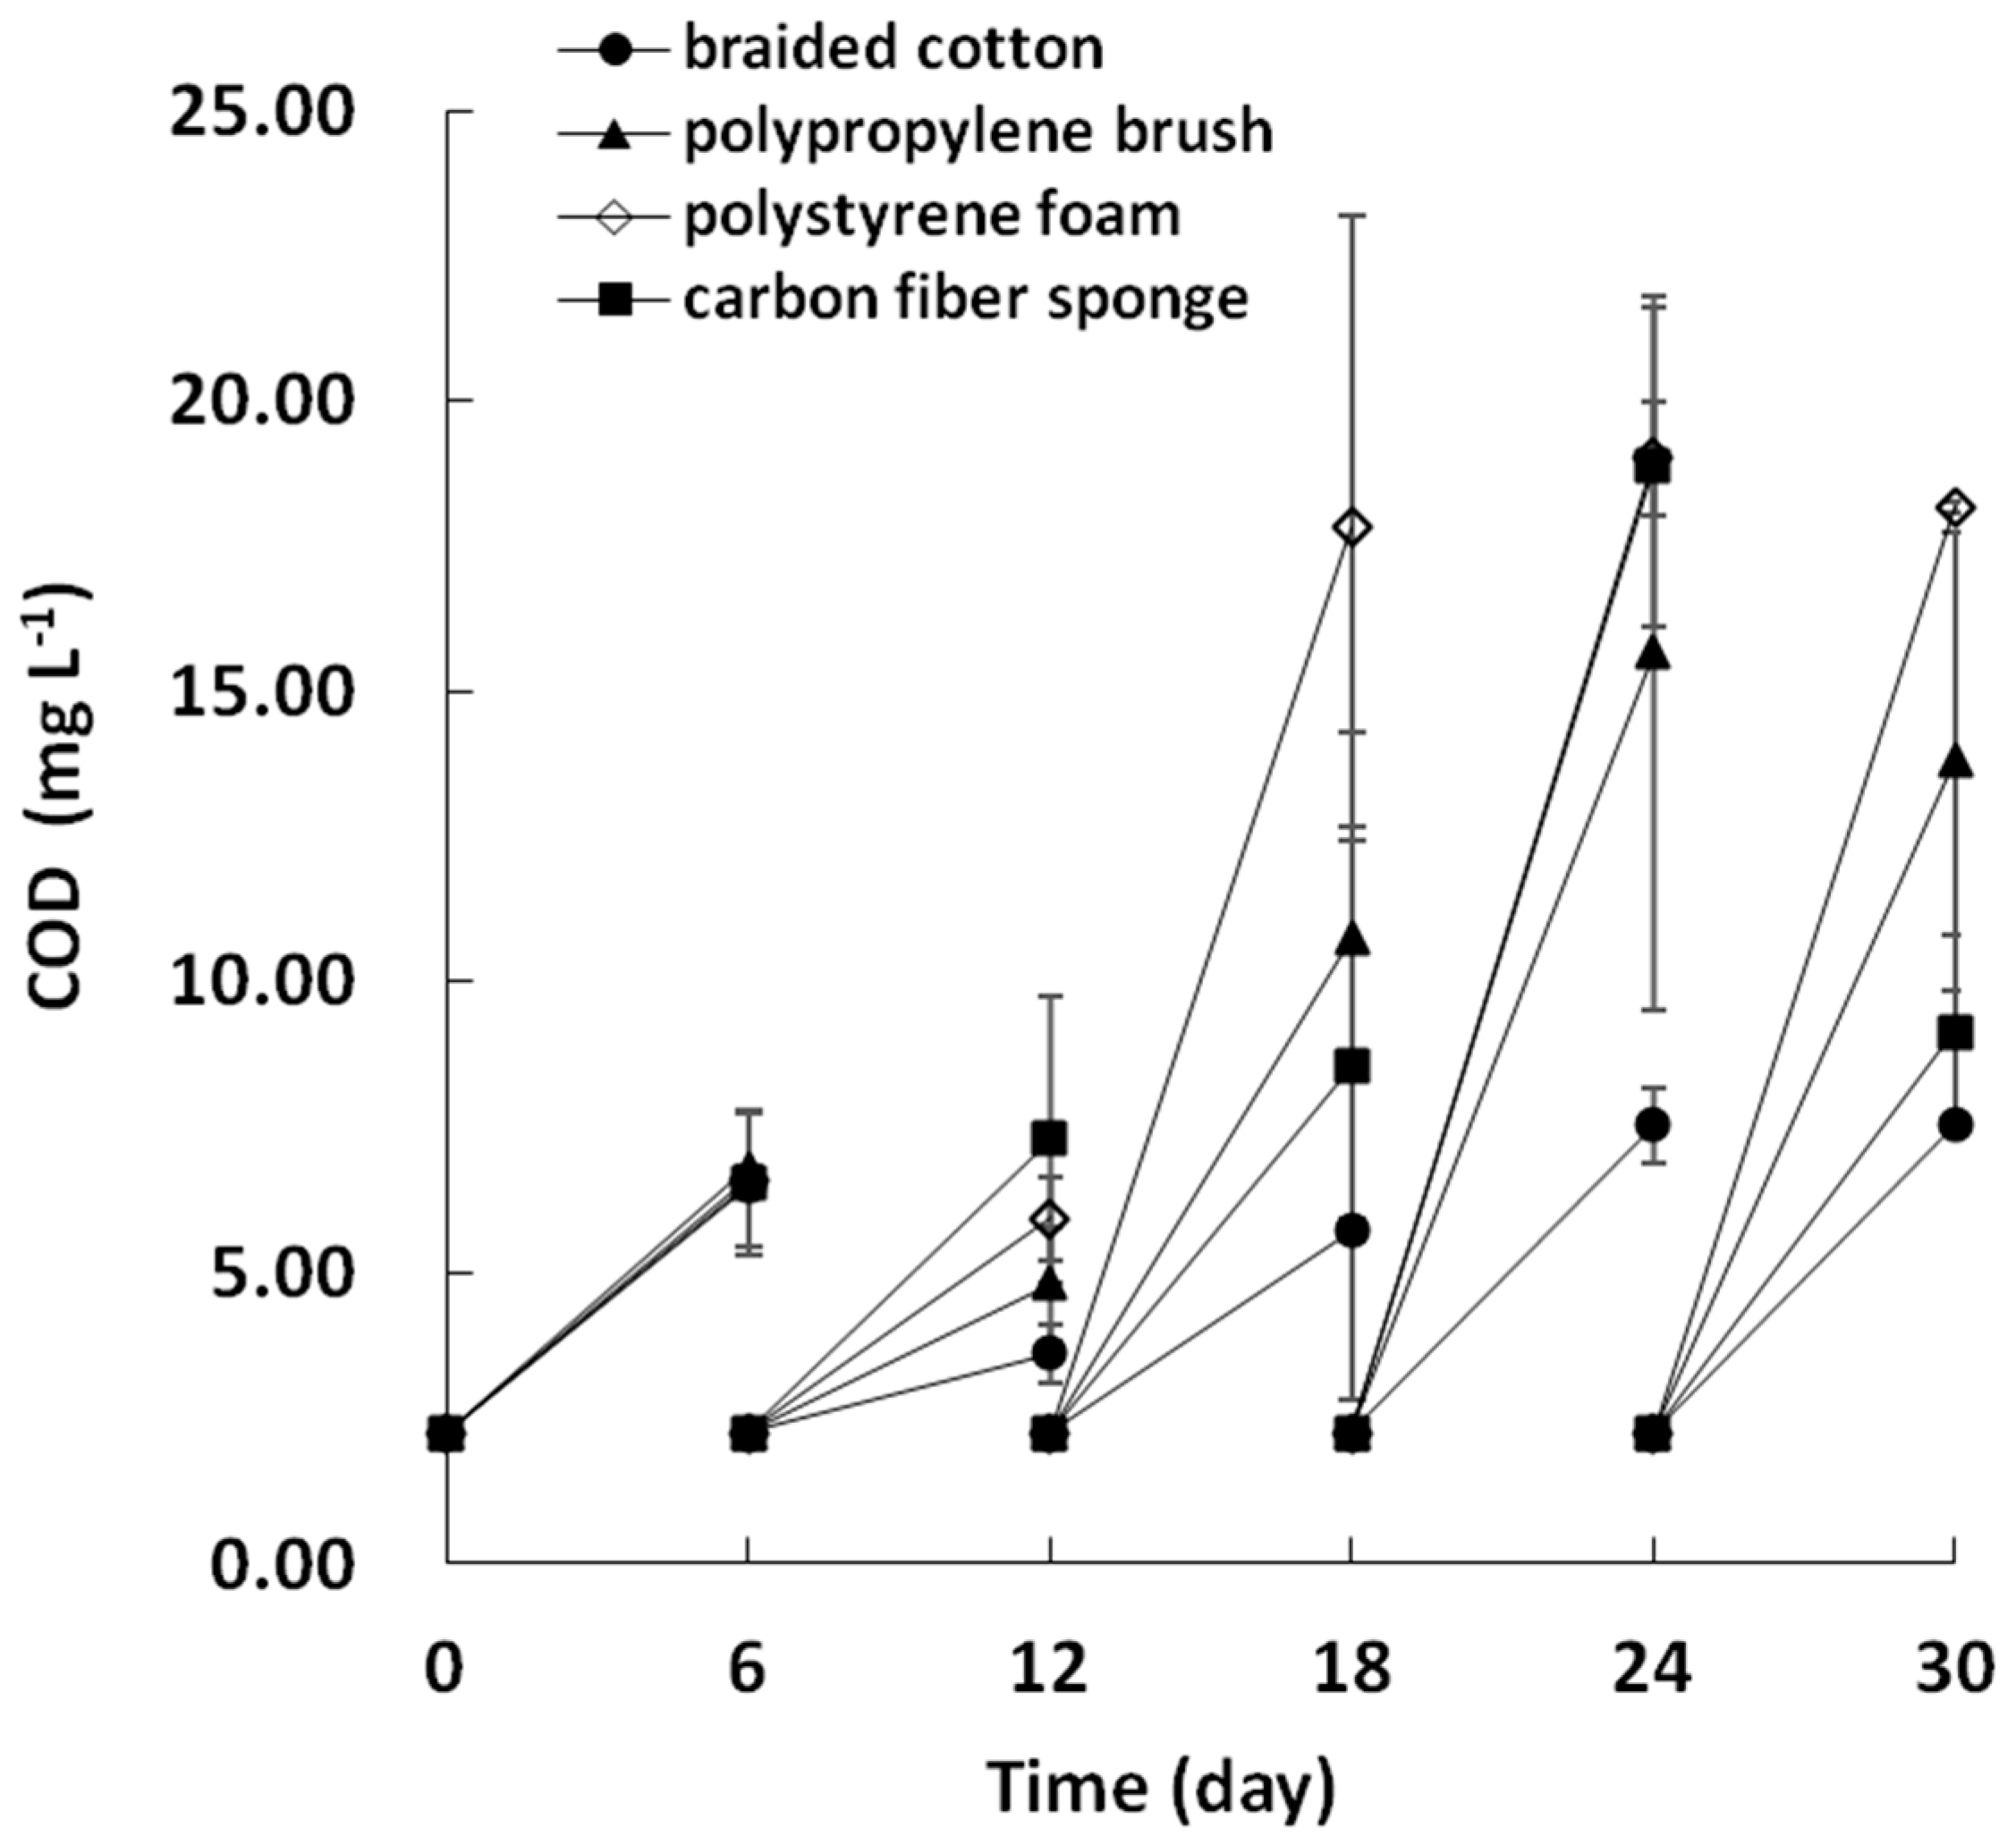
3.2. The Contaminants Removal of the Bioremediation Test with Different Biofilm Carriers

The concentration of contaminants in the effluent of the bioremediation test with four different biofilm carriers are shown in Figure 3, Figure 4, Figure 5 and Figure 6.
Figure 3 shows the removal of total nitrogen. In the treatment of Day 0~6, the total nitrogen of each experimental group decreased to around 8.1 mg L−1 on Day 6. Statistical analysis showed that there was no significant difference (p > 0.05) between the values of different groups. While the ABBR ran to the second treatment cycle, the total N in the polystyrene foam group was 1.56 ± 0.56 mg L−1, which was significantly lower than that of other groups (p < 0.05). At the end of the third treatment cycle (Day 18), the total N of three groups decreased to below 3.0 mg L−1, except for the carbon fiber sponge group. At Day 18 and Day 14, the effluent N values of the carbon fiber sponge group were 7.95 ± 4.75 and 6.02 ± 3.58 mg L−1, respectively. By the end of the test (Day 30), the effluent N concentration of all the four groups dropped to a value of around 2.0 mg L−1.
The removal of total phosphorus is shown in Figure 4. At Day 6, the effluent total P values of all groups were lower than 0.1 mg L−1. In the subsequent operation, the braided cotton group maintained a relatively stable removal performance on total P, with the average value of around 0.054 mg L−1 in the effluent. After Day 6, the effluent total P value of the carbon fiber sponge group was relatively higher than that of the other three groups, with large fluctuations in the data at Day 12 and Day 18 (0.270 ± 0.240 and 0.540 ± 0.481 mg L−1, respectively). Meanwhile, the average effluent total P in the group of polypropylene brush and polystyrene foam were 0.124 ± 0.050 and 0.166 ± 0.061 mg L−1, respectively (after Day 6), which was significantly higher than that of the braided cotton group (p < 0.05).
The removal of selenium in the first stage of bioremediation is shown in Figure 5. The effluent Se concentration of the braided cotton group was 96.2 ± 3.7 μg L−1 at Day 6, and 98.9 ± 3.0 μg L−1 at Day 12. There was no significant difference between the two data (p > 0.05), which was the lowest effluent Se value during the whole process. At Day 18 and Day 24, the effluent Se was similar (around 102.4 ± 2.5 μg L−1) in the braided cotton group, but the Se removal efficiency decreased significantly at Day 30, and the effluent Se level increased to 109.9 ± 2.5 μg L−1. For the other three experimental groups, the effluent Se concentration was close, with an average value of 111.2 ± 2.7 μg L−1 (p > 0.05).
The COD value of the effluent from the first stage of bioremediation is shown in Figure 6. The effluent COD of the braided cotton group was relatively stable, with a range from 3.6 to 7.5 mg L−1. After Day 18, apart from the group of braided cotton, the effluent COD of other three groups had increased significantly, with large standard deviations. At Day 24 in the polystyrene foam group, the effluent COD was 19.0 ± 0.9 mg L−1, which was around 10 times higher than that of the COD in the raw water.
The contaminant removal efficiency of applying different biofilm carriers for the treatment of aquaculture wastewater is displayed in Table 2. In general, for the experimental groups of different biofilm carriers, the removal efficiency of nitrogen was similar (Table 2). While taking the removal rates of phosphorus and selenium into consideration, the braided cotton group had a significant better integrative performance. Especially during the treatment cycle of Day 18~24, with a biofilm dry weight density of nearly 2.0 g L−1, the ABBR had a high removal rate of N, P, Se, which was 83.0 ± 7.8%, 97.0 ± 1.1%, and 11.2 ± 2.0%, respectively.

3.3. Effluent Quality under Different IWLR and HRT

The braided cotton carrier with an initial dry weight density of 2.0 g L−1 was applied in the second stage treatment tests, where the effect of different initial wastewater load ratio and hydraulic retention time on the effluent quality of the algal–biofilm biofilm process was investigated. As shown in Table 3, at 100% IWLR and 6-day HRT, the N, P, Se concentrations in effluent were 2.45 ± 0.25 mg L−1, 0.036 ± 0.01 mg L−1, 101.1 ± 4.2 μg L−1, respectively, which were significantly lower than those at 100% IWLR and 3-day HRT (N: 5.76 ± 0.78 mg L−1; P: 0.19 ± 0.02 mg L−1; Se: 109.2 ± 4.1 μg L−1) (p < 0.05). On the other hand, at same HRT, with the decrease in IWLR, the concentration of the contaminants in the effluent decreased significantly. For instance, when the initial wastewater load ratio was 50%, the concentrations of N, P, and Se in the effluent of the 6-day HRT group was lower than that of the 100% HRT group (p < 0.05), which were 0.75 ± 0.10 mg L−1, 0.015 ± 0.02 mg L−1, 35.2 ± 3.2 μg L−1, respectively. When the IWLR was 25%, the concentrations of N and Se in the experimental group with 9-day HRT were 0.27 ± 0.12 mg L−1 and 18.7 ± 2.2 μg L−1, which were significantly lower than the concentrations of N and Se in the experimental group with 50% IWLR (p < 0.05). In Table 3, the COD value of the effluent also decreased significantly with the decrease in IWLR. However, under the same IWLR, extending the hydraulic retention time would increase the COD in the effluent. In the experimental group with the HRT of 9 days, the effluent COD at 25%, 50% and 100% had an IWLR of 3.37 ± 0.52, 5.23 ± 0.75, and 7.96 ± 0.66 mg L−1, respectively.

3.4. The Elemental Composition of the Harvested Algal-Bacterial Biofilm

The elemental compositions of the biofilm are listed in Table 4. It can be seen that the biofilm is rich in nitrogen and phosphorus, in which the N content was around 6.5% and the P content was nearly 0.6%. The content of Se in the biofilm was 21.8 ± 3.4 mg kg−1, which was about 190 times that in the aquaculture wastewater. In addition to N, P, Se, the components of heavy metals and metalloids (As, Cr, Cd, Hg, Pb) that are often concerned in organic fertilizers were also investigated, among which Cd was not detected, and Pb content is higher than other heavy metals and metalloids. The contents of the concerned heavy metals and metalloids were lower than the national standard.

4. Discussion

4.1. Impacts of Carrier Types on the Growth of Algal-Bacterial Biofilm and Contaminants Removal

The interactions between the microbial cell wall and the biofilm carrier surface are mainly affected by interfacial interactions, such as repulsions/attractions and van der Waals forces [31]. In this study, the braided cotton carrier was superior to the other three commercial carriers in terms of biomass growth and contaminant removal. There have been many reports in previous studies that cotton seems to be a naturally fit material to be used as biofilm carriers. In general, this could be owing to three main following causes: (1) from a physical point of view, compared with other carriers, the braided cotton carrier has a larger specific surface area, which is conducive to retaining the bacteria and microalgae single cells from the ambient water body [32,33]. (2) The surface of the cotton material contains a variety of hydrophilic groups, which would form strong hydrogen bonds with the bacterial cell wall and reduce the chances of the biofilm falling off. It has been widely accepted that microorganisms secrete DNA, proteins, lipids, and lipopolysaccharides, known as extracellular polymer substances (EPS), indicating that the cell wall surface of bacteria usually contains a number of functional groups (e.g., eOH, eCOOH, eCHO). Hydrogen bonds can be formed between these functional groups on the cotton carrier surface and bacterial cell walls [31,34]. This would explain the lower effluent COD in the braided cotton group, compared with other carrier groups (Figure 6). In earlier studies, researchers observed that superhydrophobic surfaces could significantly reduce bacterial adhesion on the surface [35,36,37]. (3) Cotton material is a solid organic carbon source, which can be slowly used by the microbes in the biofilm community and is beneficial to the biofilm development [38,39,40,41].
Apart from braided cotton, the carbon fiber sponge group had a relatively better performance on biomass growth than polypropylene brush and polystyrene foam (Figure 2), which was probably owing to the high porosity of the sponge material. However, there were large error bars in the data of the carbon fiber sponge group, which indicated that the stability of biofilm attachment on such material was not as good as that of other experimental groups. In the polystyrene foam group, due to the lack of complex three-dimensional structure, the biofilm on the foam plate was easily peeled by the shear force of the system’s aeration bubbles, and the COD value in solution increased significantly (Figure 6). Generally, an ideal biofilm carrier should possess the following features: low cost, large specific surface area, excellent mechanical strength, stability, high biocompatibility, low density, resistance to biodegradation [39,42,43]. The braided cotton carrier used in this study had the best comprehensive performance in the bioremediation batch tests and was utilized in the second stage of the batch experiment.

4.2. The Removal of Nitrogen and Phosphorous by Algal-Bacterial Biofilm

In shallow water bodies where the water column receives enough light to support photosynthesis, algal–bacterial biofilms could dominate the carbon fixation and the assimilation of inorganic nutrients from the aquatic system [44], meaning that algal–bacterial biofilm could become a realistic strategy for the bioremediation of contaminated water bodies.
Previous studies have shown that the algal biofilm system has a good capability to remove nutrients such as nitrogen and phosphorus. In the first stage of the treatment experiment, the N removal efficiency of the effluent was around 40% from Day 0 to 6 (Table 2). This was probably owing to fact that the biomass density was relatively low in the early stage of the culture and the efficiency of N absorption and assimilation was insufficient. However, the removal rate of P (Table 2) by the ABBR system was relatively higher than that of N from the early stage of the treatment (Day 0~6, above 90%). A possible reason might be the differences in the absorption mechanism of nitrogen and phosphorus by the biofilm microorganisms. The addition of activated sludge before the treatment (Section 2.3) could introduce P accumulating bacteria to the system, and then enhanced the biofilm’s need on phosphorus under aerobic conditions.
Assimilation accounts for the largest percentage removal of N and P in algal–bacterial biofilm systems [45,46,47], followed by the chemical precipitation of P with calcium and magnesium ions and ammonia volatilization due to elevated pH values driven by algal photosynthesis [48]. The final removal capacity of N and P is usually dependent on the stoichiometric ratio of the two elements in the biofilm. The N and P content (dry weight basis) of algal cells from biofilm-based systems ranged from 2.9 to 7.5% for N and 0.3 to 2% P [49,50,51]. In this study, the N and P content of the algae biofilm was 6.5% and 0.6% (Table 4), respectively, and the ratio of N and P was about 11, which was similar to the ratio of N and P removed from the system (Figure 3 and Figure 4).

4.3. The Removal of Selenium by Algal-Bacterial Biofilm

The amount of Se accumulated by algal–bacterial biofilm (21.8 ± 3.4 mg kg−1) in this study was comparable to literature values reported for primary producers in Se contaminated field sites, which ranges from 1 to 10 mg kg−1 [52,53,54,55] to 567 mg kg−1 [56]. Overall, the accumulation of Se in algal–bacterial biofilms is affected by the community structure of the biofilm and the concentration and species of selenium in the environment. For instance, the enrichment of Se in algae seems to be highly variable. Under the given environmental Se concentration, the bioaccumulation of selenium in different species could have differences of several orders of magnitude [57]. Such difference is possibly a result of different cellular capacity to regulate Se uptake or different cellular demand for selenium [58]. There are different transport pathways for different Se species (Se (IV) vs. Se (VI)) to be accumulated by algae [59]. Se (VI) is taken up competitively through the sulphate pathway in microalgae [60,61], while there is evidence showing that Se (IV) can be taken up competitively via the phosphate transporter [62]. It has been revealed that Se content in biofilm was relatively stable, while a steady state has been established between the biofilm community and the circumstance [56], indicating that the removal of Se from wastewater could be regarded as positively correlated to the growth rate or biomass density of the biofilm. This would explain, in the early stage of batch treatment (Figure 5, Day 0~6, Day 6~12), the removal efficiency of selenium being relatively higher than that in the stable phase.

4.4. Effects of IWLR and HRT on the Bioremediation of Aquaculture Wastewater

Regardless of the source, Se-impacted waters usually contain no more than 100 μg Se L−1 [63]. Compared to the reported Se contaminated waters, the aquaculture wastewater in the current study had a relatively higher initial Se concentration (115 ± 5 μg L−1), meaning that an effective Se removal strategy was essential for operating the treatment. Normally, a lower initial wastewater load ratio or longer hydraulic retention time are beneficial for the treatment performance of a biofilm process, yet the concomitant cost is the corresponding reduction in treatment efficiency. At 100% IWLR, the concentrations of the main contaminants in the 6-day HRT effluent were N 2.45 ± 0.25 mg L−1, P 0.036 ± 0.01 mg L−1, Se 101.1 ± 4.2 μg L−1, where Se concentration was two times the limitation value (50.0 μg L−1) in the national seawater standard (Class IV) [64]. As a result, the effects of different IWLR and HRT on the treatment of selenium excess aquaculture wastewater were investigated. A general trend can be seen (Table 3) that reducing IWLR or elevating HRT could significantly result in lower levels of N, P, and Se in the effluent. At 50% IWLR and 6-day HRT, the concentrations of N, P, and Se in the effluent were 0.75 ± 0.10 mg L−1, 0.015 ± 0.02 mg L−1, 35.2 ± 3.2 μg L−1, respectively, where the concentration of P and Se were significantly lower than the limitation values in the national standard [64]. A similar performance was observed by previous researchers while using aquatic plants for the treatment of Se contaminated mining wastewater at 50% IWLR [65]. It has also been reported that a shorter HRT (2 days) was beneficial to the removal of nitrogen, while a longer HRT (6 days) system had a higher phosphorus removal rate, which was probably owing to the difference in system settings and operation modes [66]. It is worth noting that long-term differences on IWLR or HRT may alter the steady state of a treatment system and cause variation on the biofilm community, which could subsequently influence the treatment efficiency [67]. At 25% IWLR and 9-day HRT, the effluent Se concentration was 18.7 ± 2.2 μg L−1, which was not significantly lower (p > 0.05) than that at 25% IWLR and 6-day HRT (20.5 ± 3.5 μg L−1). This was possibly due to the lower IWLR that limits the growth of biofilm and thus the enrichment of Se in the biofilm.

4.5. The Potential of Algal–Bacterial Biofilms for Se-Enriched Biofertilizer

Algal–bacterial biofilms have potential to be used for a variety of bioproducts, including biofuels, bioplastics, nutraceuticals, animal feed, and fertilizers [68,69,70]. Selenium deficiency is an important issue of concern in many countries and regions. One potential use for the Se-enriched biofilm is to be developed into Se-rich organic fertilizer to supplement the Se content in crops in selenium-deficient areas. In most areas, the average content of Se in soil is around 1 mg kg−1, while in Se deficient areas, the average content of Se in soil is less than 0.4 mg kg−1 [71]. Previous studies on winter wheat and rice selenium enrichment showed that a Se application dose of 1–2 mg m−2 could effectively increase the selenium content in crops [29,72]. Plant roots can take up Se as selenate, selenite or organoselenium compounds, such as selenocysteine (SeCys) and selenomethionine (SeMet), but cannot take up colloidal elemental Se or metal selenides [73]. In this study, the selenium content in algal–bacterial biofilm harvested from the treatment test was 21.8 ± 3.4 mg kg−1, which was nearly 50 times the average Se content in soil in Se deficient areas, and the main Se species in biofilm were proved to be selenite and selenate [74]. From a Se content and biocompatibility point of view, the algal–bacterial biofilm in this study was regarded as feasible for the purpose of Se-rich fertilizer. Meanwhile, the contents of As, Cr, Cd, Hg, Pb (Table 4), which are commonly considered in organic fertilizer, were lower than the restrict values in the national standard [30], suggesting the safety of the algal–bacterial biofilm to be utilized as fertilizer. As selenium is not defined as a harmful element for fertilizer use, the limit value of Se is not given in the national standard for organic fertilizer [30].

5. Conclusions

This work investigated the potential of algal–bacterial biofilm for the treatment of Se-rich aquaculture wastewater. The hydrophilic braided cotton carrier had better compatibility with the biofilm derived from aquaculture wastewater, and could promote the growth of the algal–bacterial biofilm. In addition, the treatment experiment with the braided cotton carrier had higher removal efficiency of nitrogen and phosphorus than the other carrier materials used in this study. The removal of selenium from wastewater is associated with the growth of the biofilm. Compared with nitrogen and phosphorus, the Se content in the biofilm was relatively lower. To tackle the aquaculture wastewater with high Se concentration (115 ± 5.0 μg L−1), a practical strategy was to reduce the initial wastewater load ratio or to extend the hydraulic retention time. By conducting the treatment with lower initial wastewater load ratio (<50%) and longer hydraulic retention time (>6 days), the effluent N, P and Se levels could be significantly reduced. The algal–bacterial biofilm harvested from the treatment test was rich in N, P and Se, while the concerned heavy metal or metalloid contents were not over the national standard guideline values. From the perspective of a by-product, the biofilm biomass has the potential to be further utilized as a Se-enriched biofertilizer.

Author Contributions

Conceptualization, W.H. and X.Z.; Data curation, W.H., Y.M. and Y.W.; Formal analysis, W.H. and Y.M.; Funding acquisition, W.H. and X.Z.; Investigation, W.H. and Y.M.; Methodology, W.H. and Y.M.; Project administration, W.H. and X.Z.; Resources, W.H., Y.M. and X.Z.; Supervision, W.H., P.S. and X.Z.; Validation, X.Z.; Writing—original draft, W.H. and X.Z.; Writing—review & editing, W.H., Y.W., P.S. and X.Z. All authors have read and agreed to the published version of the manuscript.

Funding

This research was funded by the “Natural Science Foundation General Program of Guangdong (NSFGR) (2019A1515011740)”.

Acknowledgments

This study was carried out as part of the NSFGR project, managed by the Wei Han and Xu Zhou and supported by Shenzhen Engineering Laboratory of Microalgal Bioenergy, Harbin Institute of Technology and Shenzhen Key Laboratory of aerospace and special environment biomedical and Health Engineering, We thank Yufeng Mao, Minghao He, for providing historical documents and pre-experimental data. We thank Bacui Chen for her help in writing and correcting the manuscript.

Conflicts of Interest

The authors declare no conflict of interest.

References

  1. FAO. The State of World Fisheries and Aquaculture. 2018. Available online: http://www.fao.org/3/i9540en/I9540EN.pdf (accessed on 1 June 2020).
  2. Xiang, J. Mariculture-Related Environmental Concerns in the People’s Republic of China. In Ecological and Genetic Implications of Aquaculture Activities; Springer: Dordrecht, The Netherlands, 2007; pp. 219–228. [Google Scholar]
  3. Liu, D.; Keesing, J.K.; Xing, Q.; Shi, P. World’s largest macroalgal bloom caused by expansion of seaweed aquaculture in China. Mar. Pollut. Bull. 2009, 58, 888–895. [Google Scholar] [CrossRef] [PubMed]
  4. Liu, X.; Steele, J.C.; Meng, X. Usage, residue, and human health risk of antibiotics in Chinese aquaculture: A review. Environ. Pollut. 2017, 223, 161–169. [Google Scholar] [CrossRef] [PubMed]
  5. Cabello, F.C. Heavy use of prophylactic antibiotics in aquaculture: A growing problem for human and animal health and for the environment. Environ. Microbiol. 2006, 8, 1137–1144. [Google Scholar] [CrossRef] [PubMed]
  6. Huggett, D.B.; Schlenk, D.; Griffin, B.R. Toxicity of copper in an oxic stream sediment receiving aquaculture effluent. Chemosphere 2001, 44, 361–367. [Google Scholar] [CrossRef]
  7. Cao, J.S.; Wang, C.; Fang, F.; Lin, J.X. Removal of heavy metal Cu(II) in simulated aquaculture wastewater by modified palygorskite. Environ. Pollut. 2016, 219, 924–931. [Google Scholar] [CrossRef]
  8. Gobi, N.; Vaseeharan, B.; Rekha, R.; Vijayakumar, S.; Faggio, C. Bioaccumulation, cytotoxicity and oxidative stress of the acute exposure selenium in Oreochromis mossambicus. Ecotoxicol. Environ. Saf. 2018, 162, 147–159. [Google Scholar] [CrossRef]
  9. Pacitti, D.; Lawan, M.M.; Feldmann, J.; Sweetman, J.; Wang, T.Y.; Martin, S.A.M.; Secombes, C. Impact of selenium supplementation on fish antiviral responses: A whole transcriptomic analysis in rainbow trout (Oncorhynchus mykiss) fed supranutritional levels of Sel-Plex. BMC Genom. 2016, 17, 116. [Google Scholar] [CrossRef] [Green Version]
  10. Dawood, M.A.O.; Koshio, S.; Zaineldin, A.I.; Van Doan, H.; Ahmed, H.A.; Elsabagh, M.; Abdeldaim, M.M. An evaluation of dietary selenium nanoparticles for red sea bream (Pagrus major) aquaculture: Growth, tissue bioaccumulation, and antioxidative responses. Environ. Sci. Pollut. Res. 2019, 26, 30876–30884. [Google Scholar] [CrossRef]
  11. Huang, J.; Ren, F.; Jiang, Y.; Xiao, C.; Lei, X.G. Selenoproteins protect against avian nutritional muscular dystrophy by metabolizing peroxides and regulating redox/apoptotic signaling. Free Radic. Biol. Med. 2015, 83, 129–138. [Google Scholar] [CrossRef]
  12. Zheng, S.; Zhao, J.; Xing, H.; Xu, S. Oxidative stress, inflammation, and glycometabolism disorder-induced erythrocyte hemolysis in selenium-deficient exudative diathesis broilers. J. Cell. Physiol. 2019, 234, 16328–16337. [Google Scholar] [CrossRef]
  13. Watanabe, T.; Kiron, V.; Satoh, S. Trace minerals in fish nutrition. Aquaculture 1997, 151, 185–207. [Google Scholar] [CrossRef]
  14. Kim, J.; Kang, J. The selenium accumulation and its effect on growth, and haematological parameters in red sea bream, Pagrus major, exposed to waterborne selenium. Ecotoxicol. Environ. Saf. 2014, 104, 96–102. [Google Scholar] [CrossRef]
  15. Lemly, A.D. Aquatic selenium pollution is a global environmental safety issue. Ecotoxicol. Environ. Saf. 2004, 59, 44–56. [Google Scholar] [CrossRef] [Green Version]
  16. WHO. Guidelines for Drinking-Water Quality, 4th ed.; World Health Organization: Geneva, Switzerland, 2011. [Google Scholar]
  17. Commission, E. COUNCIL DIRECTIVE 98/83/EC of 3 November 1998 on the quality of water intended for human consumption. Off. J. Eur. Communities L 1998, 330, 32–54. [Google Scholar]
  18. NHCPRC. Sanitary Standard for Drinking Water (GB5749-2006). National Health Commission of the People’s Republic of China. 2006. Available online: http://www.nhc.gov.cn/xxgk/pages/viewdocument (accessed on 2 June 2020).
  19. USEPA. National Primary Drinking Water Regulations, List of Contaminants and Their (MCLs); EPA 816-F-09-0004; United States Environmental Protection Agency: Washington, DC, USA, 2009.
  20. USEPA. External Peer Review Draft—Aquatic Life Ambient Water Quality Criterion for Selenium—Freshwater 2014, EPA-820-F−14-005 2014; United States Environmental Protection Agency: Washington, DC, USA, 2014.
  21. Li, S.; Zhang, S.; Ye, C.; Lin, W.; Zhang, M.; Chen, L.; Li, J.; Yu, X. Biofilm processes in treating mariculture wastewater may be a reservoir of antibiotic resistance genes. Mar. Pollut. Bull. 2017, 118, 289–296. [Google Scholar] [CrossRef]
  22. Zhang, H.; Wang, H.; Jie, M.; Zhang, K.; Qian, Y.; Ma, J. Performance and microbial communities of different biofilm membrane bioreactors with pre-anoxic tanks treating mariculture wastewater. Bioresour. Technol. 2020, 295, 122302. [Google Scholar] [CrossRef]
  23. Natrah, F.M.I.; Bossier, P.; Sorgeloos, P.; Yusoff, F.M.; Defoirdt, T. Significance of microalgal–bacterial interactions for aquaculture. Rev. Aquacult. 2014, 6, 48–61. [Google Scholar] [CrossRef]
  24. Eding, E.H.; Kamstra, A.; Verreth, J.A.J.; Huisman, E.A.; Klapwijk, A. Design and operation of nitrifying trickling filters in recirculating aquaculture: A review. Aquacult. Eng. 2006, 34, 234–260. [Google Scholar] [CrossRef]
  25. Barnharst, T.J.; Rajendran, A.; Hu, B. Bioremediation of synthetic intensive aquaculture wastewater by a novel feed-grade composite biofilm. Int. Biodeterior. Biodegrad. 2018, 126, 131–142. [Google Scholar] [CrossRef]
  26. Tan, L.C.; Espinosaortiz, E.J.; Nancharaiah, Y.V.; Van Hullebusch, E.D.; Gerlach, R.; Lens, P.N.L. Selenate removal in biofilm systems: Effect of nitrate and sulfate on selenium removal efficiency, biofilm structure, and microbial community. J. Chem. Technol. Biotechnol. 2018, 93, 2380–2389. [Google Scholar] [CrossRef] [Green Version]
  27. Staicu, L.C.; Hullebusch, E.D.V.; Rittmann, B.E.; Lens, P.N.L. Industrial selenium pollution: Sources and biological treatment technologies. In Bioremediation of Selenium Contaminated Wastewater; Springer: Cham, Switzerland, 2017. [Google Scholar]
  28. Murashige, T.; Skoog, F. A Revised Medium for Rapid Growth and Bio Assays with Tobacco Tissue Cultures. Physiol. Plant. 1962, 15, 473–497. [Google Scholar] [CrossRef]
  29. Broadley, M.R.; Alcock, J.; Alford, J.; Cartwright, P.; Foot, I.; Fairweathertait, S.J.; Hart, D.J.; Hurst, R.; Knott, P.; Mcgrath, S.P. Selenium biofortification of high-yielding winter wheat (Triticum aestivum L.) by liquid or granular Se fertilisation. Plant Soil 2010, 332, 5–18. [Google Scholar] [CrossRef]
  30. MARAPRC. Standard for Organic Fertilizer (NY 525-2012). Ministry of Agriculture and Rural Affairs of the People’s Republic of China. 2012. Available online: http://www.moa.gov.cn/was5/web/search?searchword=ny+525-2012&channelid=233424&orderby=-DOCRELTIME (accessed on 28 May 2020).
  31. Renner, L.D.; Weibel, D.B. Physicochemical regulation of biofilm formation. MRS Bull. 2011, 36, 347–355. [Google Scholar] [CrossRef] [Green Version]
  32. Christenson, L.; Sims, R.C. Rotating algal biofilm reactor and spool harvester for wastewater treatment with biofuels by-products. Biotechnol. Bioeng. 2012, 109, 1674–1684. [Google Scholar] [CrossRef]
  33. Mantzorou, A.; Ververidis, F. Microalgal biofilms: A further step over current microalgal cultivation techniques. Sci. Total Environ. 2019, 651, 3187–3201. [Google Scholar] [CrossRef]
  34. Kang, S.; Choi, H. Effect of surface hydrophobicity on the adhesion of S. cerevisiae onto modified surfaces by poly (styrene-ran-sulfonic acid) random copolymers. Colloids Surf. B 2005, 46, 70–77. [Google Scholar] [CrossRef]
  35. Chavant, P.; Martinie, B.; Meylheuc, T.; Bellonfontaine, M.; Hebraud, M. Listeria monocytogenes LO28: Surface Physicochemical Properties and Ability to form Biofilms at Different Temperatures and Growth Phases. Appl. Environ. Microbiol. 2002, 68, 728–737. [Google Scholar] [CrossRef] [Green Version]
  36. Yuan, Y.; Hays, M.P.; Hardwidge, P.R.; Kim, J. Surface characteristics influencing bacterial adhesion to polymeric substrates. RSC Adv. 2017, 7, 14254–14261. [Google Scholar] [CrossRef] [Green Version]
  37. Feng, G.; Cheng, Y.; Wang, S.Y.; Borca-Tasciuc, D.A.; Worobo, R.W.; Moraru, C.I. Bacterial attachment and biofilm formation on surfaces are reduced by small-diameter nanoscale pores: How small is small enough? Npj Biofilms Microbiomes 2015, 1, 15022. [Google Scholar] [CrossRef]
  38. Feng, L.; Chen, K.; Han, D.; Zhao, J.; Lu, Y.; Yang, G.; Mu, J.; Zhao, X. Comparison of nitrogen removal and microbial properties in solid-phase denitrification systems for water purification with various pretreated lignocellulosic carriers. Bioresour. Technol. 2017, 224, 236–245. [Google Scholar] [CrossRef]
  39. Liu, Y.; Zhu, Y.; Jia, H.; Yong, X.; Zhang, L.; Zhou, J.; Cao, Z.; Kruse, A.; Wei, P. Effects of different biofilm carriers on biogas production during anaerobic digestion of corn straw. Bioresour. Technol. 2017, 244, 445–451. [Google Scholar] [CrossRef]
  40. Yang, X.; Jiang, Q.; Song, H.; Gu, T.; Xia, M. Selection and application of agricultural wastes as solid carbon sources and biofilm carriers in MBR. J. Hazard. Mater. 2015, 283, 186–192. [Google Scholar] [CrossRef]
  41. Reyesalvarado, L.C.; Camarillogamboa, A.; Rustrian, E.; Rene, E.R.; Esposito, G.; Lens, P.N.L.; Houbron, E. Lignocellulosic biowastes as carrier material and slow release electron donor for sulphidogenesis of wastewater in an inverse fluidized bed bioreactor. Environ. Sci. Pollut. Res. 2018, 25, 5115–5128. [Google Scholar] [CrossRef]
  42. Xu, S.; Jiang, Q. Surface modification of carbon fiber support by ferrous oxalate for biofilm wastewater treatment system. J. Clean. Prod. 2018, 194, 416–424. [Google Scholar] [CrossRef]
  43. Zhang, W.; Ruan, X.; Bai, Y.; Yin, L. The characteristics and performance of sustainable-releasing compound carbon source material applied on groundwater nitrate in-situ remediation. Chemosphere 2018, 205, 635–642. [Google Scholar] [CrossRef]
  44. Lowe, R.L. Periphyton Patterns in Lakes. Algal Ecol. 1996, 12, 57–76. [Google Scholar]
  45. Godos, I.D.; González, C.; Becares, E.; García-Encina, P.A.; MuOz, R. Simultaneous nutrients and carbon removal during pretreated swine slurry degradation in a tubular biofilm photobioreactor. Appl. Microbiol. Biotechnol. 2009, 82, 187–194. [Google Scholar] [CrossRef]
  46. Pizarro, C.; Kebede-Westhead, E.; Mulbry, W.W. Nitrogen and phosphorus removal rates using small algal turfs grown with dairy manure. J. Appl. Phycol. 2002, 14, 469–473. [Google Scholar] [CrossRef]
  47. Su, Y.; Mennerich, A.; Urban, B. Municipal wastewater treatment and biomass accumulation with a wastewater-born and settleable algal-bacterial culture. Water Res. 2011, 45, 3351–3358. [Google Scholar] [CrossRef]
  48. Wei, Q.; Hu, Z.; Li, G.; Xiao, B.; Sun, H. Removing nitrogen and phosphorus from simulated wastewater using algal biofilm technique. Front. Environ. Sci. Eng. China 2008, 2, 446–451. [Google Scholar] [CrossRef]
  49. Boelee, N.C.; Temmink, H.; Janssen, M.; Buisman, C.J.N.; Wijffels, R.H. Nitrogen and phosphorus removal from municipal wastewater effluent using microalgal biofilms. Water Res. 2011, 45, 5925–5933. [Google Scholar] [CrossRef] [PubMed]
  50. Kebedewesthead, E.; Pizarro, C.; Mulbry, W.; Wilkie, A.C. Production and nutrient removal by periphyton grown under different loading rates of anaerobically digested flushed dairy manure. J. Phycol. 2003, 39, 1275–1282. [Google Scholar] [CrossRef]
  51. Wilkie, A.C.; Mulbry, W. Recovery of dairy manure nutrients by benthic freshwater algae. Bioresour. Technol. 2002, 84, 81–91. [Google Scholar] [CrossRef]
  52. Andrahennadi, R.; Wayland, M.; Pickering, I.J. Speciation of Selenium in Stream Insects Using X-Ray Absorption Spectroscopy. Environ. Sci. Technol. 2007, 41, 7683–7687. [Google Scholar] [CrossRef] [PubMed]
  53. Muscatello, J.R.; Belknap, A.M.; Janz, D.M. Accumulation of selenium in aquatic systems downstream of a uranium mining operation in northern Saskatchewan, Canada. Environ. Pollut. 2008, 156, 387–393. [Google Scholar] [CrossRef] [PubMed]
  54. Orr, P.L.; Guiguer, K.R.; Russel, C.K. Food chain transfer of selenium in lentic and lotic habitats of a western Canadian watershed. Ecotoxicol. Environ. Saf. 2006, 63, 175–188. [Google Scholar] [CrossRef] [PubMed]
  55. Fan, T.W.M.; Teh, S.J.; Hinton, D.E.; Higashi, R.M. Selenium biotransformations into proteinaceous forms by foodweb organisms of selenium-laden drainage waters in California. Aquat. Toxicol. 2002, 57, 65–84. [Google Scholar] [CrossRef]
  56. Markwart, B.; Liber, K.; Xie, Y.; Raes, K.; Hecker, M.; Janz, D.M.; Doig, L.E. Selenium oxyanion bioconcentration in natural freshwater periphyton. Ecotoxicol. Environ. Saf. 2019, 180, 693–704. [Google Scholar] [CrossRef]
  57. Baines, S.B.; Fisher, N.S. Interspecific differences in the bioconcentration of selenite by phytoplankton and their ecological implications. Mar. Ecol. Prog. Ser. 2001, 213, 1–12. [Google Scholar] [CrossRef]
  58. Stewart, R.; Grosell, M.; Buchwalter, D.; Fisher, N.; Wang, W.-X. Bioaccumulation and trophic transfer of selenium. In Ecological Assessment of Selenium in the Aquatic Environment; CRC Press: Boca Raton, FL, USA, 2010; pp. 93–139. [Google Scholar]
  59. Wallschläger, D.; Feldmann, J. Formation, occurrence, significance, and analysis of organoselenium and organotellurium compounds in the environment. Met. Ions Life Sci. 2010, 7, 319–364. [Google Scholar] [PubMed]
  60. Fisher, N.S.; Wente, M. The release of trace elements by dying marine phytoplankton. Deep Sea Res. Part I 1993, 40, 671–694. [Google Scholar] [CrossRef]
  61. Lo, B.P.; Elphick, J.R.; Bailey, H.C.; Baker, J.A.; Kennedy, C.J. The effect of sulfate on selenate bioaccumulation in two freshwater primary producers: A duckweed (Lemna minor) and a green alga (Pseudokirchneriella subcapitata). Environ. Toxicol. Chem. 2016, 34, 2841–2845. [Google Scholar] [CrossRef] [PubMed]
  62. Hopper, J.L.; Parker, D.R. Plant availability of selenite and selenate as influenced by the competing ions phosphate and sulfate. Plant Soil 1999, 210, 199–207. [Google Scholar] [CrossRef]
  63. Maher, W.; Roach, A.; Doblin, M.; Fan, T.; Wallschlager, D. Environmental Sources, Speciation, and Partitioning of Selenium. In Ecological Assessment of Selenium in the Aquatic Environment; CRC Press: Boca Raton, FL, USA, 2010; pp. 47–92. [Google Scholar]
  64. MEEPRC. Sea Water Quality Standard (GB 3097–1997). Ministry of Ecology and Environment of the People’s Republic of China. 1997. Available online: http://www.mee.gov.cn/ywgz/fgbz/bz/bzwb/shjbh/shjzlbz/199807/t19980701_66499.shtml (accessed on 26 May 2020).
  65. Miranda, A.F.; Muradov, N.; Gujar, A.; Stevenson, T.; Nugegoda, D.; Ball, A.S.; Mouradov, A. Application of aquatic plants for the treatment of selenium-rich mining wastewater and production of renewable fuels and petrochemicals. J. Sustain. Bioenergy Syst. 2014, 4, 97–112. [Google Scholar] [CrossRef] [Green Version]
  66. Shayan, S.I.; Agblevor, F.A.; Bertin, L.; Sims, R.C. Hydraulic retention time effects on wastewater nutrient removal and bioproduct production via rotating algal biofilm reactor. Bioresour. Technol. 2016, 211, 527–533. [Google Scholar] [CrossRef] [Green Version]
  67. Nogueira, R.; Melo, L.F.; Purkhold, U.; Wuertz, S.; Wagner, M. Nitrifying and heterotrophic population dynamics in biofilm reactors: Effects of hydraulic retention time and the presence of organic carbon. Water Res. 2002, 36, 469–481. [Google Scholar] [CrossRef] [Green Version]
  68. Pulz, O.; Gross, W. Valuable products from biotechnology of microalgae. Appl. Microbiol. Biotechnol. 2004, 65, 635–648. [Google Scholar] [CrossRef]
  69. Spolaore, P.; Joanniscassan, C.; Duran, E.; Isambert, A. Commercial applications of microalgae. J. Biosci. Bioeng. 2006, 101, 87–96. [Google Scholar] [CrossRef] [PubMed] [Green Version]
  70. Mata, T.M.; Martins, A.A.; Caetano, N.S. Microalgae for biodiesel production and other applications: A review. Renew. Sustain. Energy Rev. 2010, 14, 217–232. [Google Scholar] [CrossRef] [Green Version]
  71. Lavu, R.V.S.; De Schepper, V.; Steppe, K.; Majeti, P.N.V.; Tack, F.; Du Laing, G. Use of selenium fertilizers for production of Se-enriched Kenaf (Hibiscus cannabinus): Effect on Se concentration and plant productivity. J. Plant Nutr. Soil Sci. 2013, 176, 634–639. [Google Scholar] [CrossRef]
  72. Chen, L.; Yang, F.; Xu, J.; Hu, Y.; Hu, Q.; Zhang, Y.; Pan, G. Determination of selenium concentration of rice in china and effect of fertilization of selenite and selenate on selenium content of rice. J. Agric. Food Chem. 2002, 50, 5128–5130. [Google Scholar] [CrossRef] [PubMed]
  73. White, P.J.; Broadley, M.R. Biofortification of crops with seven mineral elements often lacking in human diets—Iron, zinc, copper, calcium, magnesium, selenium and iodine. New Phytol. 2009, 182, 49–84. [Google Scholar] [CrossRef] [PubMed]
  74. Templeton, A.S.; Trainor, T.P.; Spormann, A.M.; Brown, G.E. Selenium speciation and partitioning within Burkholderia cepacia biofilms formed on α-Al2O3 surfaces. Geochim. Cosmochim. Acta 2003, 67, 3547–3557. [Google Scholar] [CrossRef]
Figure 1. Schematic of algal-bacterial biofilm batch reactor.
Water 12 02071 g001
Figure 2. The biomass density of algal–bacterial biofilm in the algal–bacterial biofilm batch reactor (ABBR) with different biofilm carriers. (Error bars represent the standard deviation, N = 2).
Water 12 02071 g002
Figure 3. Total nitrogen concentration in the bioremediation test with different biofilm carriers (Error bars represent the standard deviation, N = 2).
Water 12 02071 g003
Figure 4. Total phosphorous concentration in the bioremediation test with different biofilm carriers (Error bars represent the standard deviation, N = 2).
Water 12 02071 g004
Figure 5. Total selenium concentration in the bioremediation test with different biofilm carriers (Error bars represent the standard deviation, N = 2).
Water 12 02071 g005
Figure 6. COD value in the bioremediation test with different biofilm carriers (Error bars represent the standard deviation, N = 2).
Water 12 02071 g006
Table 1. Characteristics of the raw aquaculture wastewater.
ParameterUnitContent
Total dissolved solidmg L−134,870
pH 8.1
Total Nmg L−114.5
Total Pmg L−11.21
Total Seμg L−1115
CODmg L−12.25
Chloridemg L−119,400
Namg L−110,790
Kmg L−1387
Camg L−1415
Mgmg L−11293
Almg L−10.001
Asμg L−14.61
Cdμg L−10.004
Crμg L−1127
Hgμg L−10.017
Pbμg L−123.6
Table 2. The removal efficiency of N, P, Se in the bioremediation test with different biofilm carriers.
ElementNPSe
Treatmentabcdabcdabcd
Day 0–642.8 ± 9.6%39.5 ± 6.1%43.8 ± 9.5%43.4 ± 2.1%96.0 ± 1.0%96.2 ± 1.2%92.2 ± 2.9%95.0 ± 2.3%16.3 ± 3.2%1.7 ± 3.5%2.5 ± 3.2%7.0 ± 1.7%
Day 6–1269.5 ± 7.1%79.3 ± 3.9%89.3 ± 3.9%62.1 ± 14.4%86.8 ± 11.7%93.0 ± 1.8%93.4 ± 0.5%77.7 ± 19.8%14.0 ± 2.6%4.0 ± 2.8%2.6 ± 1.7%2.4 ± 3.5%
Day 12–1879.9 ± 1.6%82.4 ± 0.8%74.3 ± 5.1%44.8 ± 32.9%98.3 ± 0.8%89.3 ± 8.2%81.4 ± 5.3%55.4 ± 39.7%10.9 ± 2.1%3.9 ± 2.0%1.9 ± 3.8%4.6 ± 3.0%
Day 18–2483.0 ± 7.8%79.3 ± 2.1%78.7 ± 1.0%58.2 ± 24.9%97.0 ± 1.1%92.8 ± 2.8%85.2 ± 7.6%80.8 ± 10.1%11.2 ± 2.0%6.4 ± 2.7%4.3 ± 1.8%8.3 ± 3.4%
Day 24–3088.5 ± 6.2%84.6 ± 0.9%80.2 ± 2.2%89.8 ± 1.3%99.8 ± 0.2%84.2 ± 7.7%85.3 ± 7.4%73.7 ± 1.5%4.4 ± 2.2%2.3 ± 4.5%3.9 ± 2.8%3.6 ± 2.7%
a: braided cotton; b: polypropylene brush; c: polystyrene foam; d: carbon fiber sponge.
Table 3. Effluent quality of the second stage bioremediation test under different hydraulic retention time and initial wastewater load ratio.
ContaminantsN aP aSe bCOD a
IWLR25%50%100%25%50%100%25%50%100%25%50%100%
Inlet3.57 ± 0.077.21 ± 0.1414.40 ± 0.260.34 ± 0.010.63 ± 0.021.21 ± 0.0328.1 ± 2.356.4 ± 3.1114.0 ± 5.00.57 ± 0.091.12 ± 0.172.25 ± 0.34
Effluent
HRT 3d1.07 ± 0.172.21 ± 0.365.76 ± 0.780.08 ± 0.030.110 ± 0.030.19 ± 0.0223.5 ± 3.442.3 ± 4.1109.2 ± 4.11.03 ± 0.142.11 ± 0.354.61 ± 0.24
HRT 6d0.33 ± 0.150.75 ± 0.102.45 ± 0.250.010 ± 0.030.015 ± 0.020.036 ± 0.0120.5 ± 3.535.2 ± 3.2101.1 ± 4.23.24 ± 0.224.64 ± 0.237.53 ± 0.66
HRT 9d0.27 ± 0.120.32 ± 0.171.95 ± 1.070.006 ± 0.020.009 ± 0.030.029 ± 0.0118.7 ± 2.230.1 ± 2.194.3 ± 2.33.37 ± 0.525.23 ± 0.757.96 ± 0.66
a: mg L−1; b: μg L−1.
Table 4. Contents of elements in algal-bacterial biofilm harvested from the bioremediation test.
ElementContent (mg kg−1)LOF (mg kg−1)
N65,200 ± 1300
P6130 ± 462
S4360 ± 158
Se21.8 ± 3.4
As0.2 ± 0.215
Cd0 ± 03
Cr6.2 ± 0.4150
Hg0.1 ± 0.12
Pb28.5 ± 5.250
LOF: Limits for organic fertilizer use [30].

