Evaluation of the Gulf of Aqaba Coastal Water, Jordan
by
 , , , ,
Ahmed A. Al-Taani
1,2,* ,
,
Maen Rashdan
2 ,
,
Yousef Nazzal
1,
Fares Howari
1,
Jibran Iqbal
1,
Abdulla Al-Rawabdeh
2 ,
,
Abeer Al Bsoul
3 and
Safaa Khashashneh
2 1
College of Natural and Health Sciences, Zayed University, Abu Dhabi 144534, UAE
2
Department of Earth and Environmental Sciences, Yarmouk University, Irbid 21163, Jordan
3
Department of Chemical Engineering, Al-Balqa Applied University, As-Salt 19117, Jordan
*
Author to whom correspondence should be addressed.
Water 2020, 12(8), 2125; https://0-doi-org.brum.beds.ac.uk/10.3390/w12082125
Submission received: 7 July 2020
/
Revised: 19 July 2020
/
Accepted: 21 July 2020
/
Published: 27 July 2020
(This article belongs to the Special Issue Assessing Water Quality by Statistical Methods)
Abstract
:(1) Background: The Gulf of Aqaba (GoA) supports unique and diverse marine ecosystems. It is one of the highest anthropogenically impacted coasts in the Middle East region, where rapid human activities are likely to degrade these naturally diverse but stressed ecosystems. (2) Methods: Various water quality parameters were measured to assess the current status and conditions of GoA seawater including pH, total dissolved solids (TDS), total alkalinity (TA), Cl−, NO3−, SO42−, PO43−, NH4+, Ca2+, Mg2+, Na+, K+, Sr, Cd, Co, Cr, Cu, Fe, Mn, Pb, and Zn. (3) Results: The pH values indicated basic coastal waters. The elevated levels of TDS with an average of about 42 g/L indicated highly saline conditions. Relatively low levels of inorganic nutrients were observed consistent with the prevalence of oligotrophic conditions in GoA seawater. The concentrations of Ca2+, Mg2+, Na+, K+, Sr, Cl−, and SO42− in surface layer varied spatially from about 423–487, 2246–2356, 9542–12,647, 513–713, 9.2–10.4, 22,173–25,992, and 317–407 mg/L, respectively. The average levels of Cd, Co, Cr, Cu, Fe, Mn, Pb and Zn ranged from 0.51, 0.38, 1.44, 1.29, 0.88, 0.38, and 6.05 µg/L, respectively. (4) Conclusions: The prevailing saline conditions of high temperatures, high evaporation rates, the water stratification and intense dust storms are major contributing factors to the observed seawater chemistry. The surface distribution of water quality variables showed spatial variations with no specific patterns, except for metal contents which exhibited southward increasing trends, closed to the industrial complex. The vast majority of these quality parameters showed relatively higher values compared to those of other regions.
1. Introduction
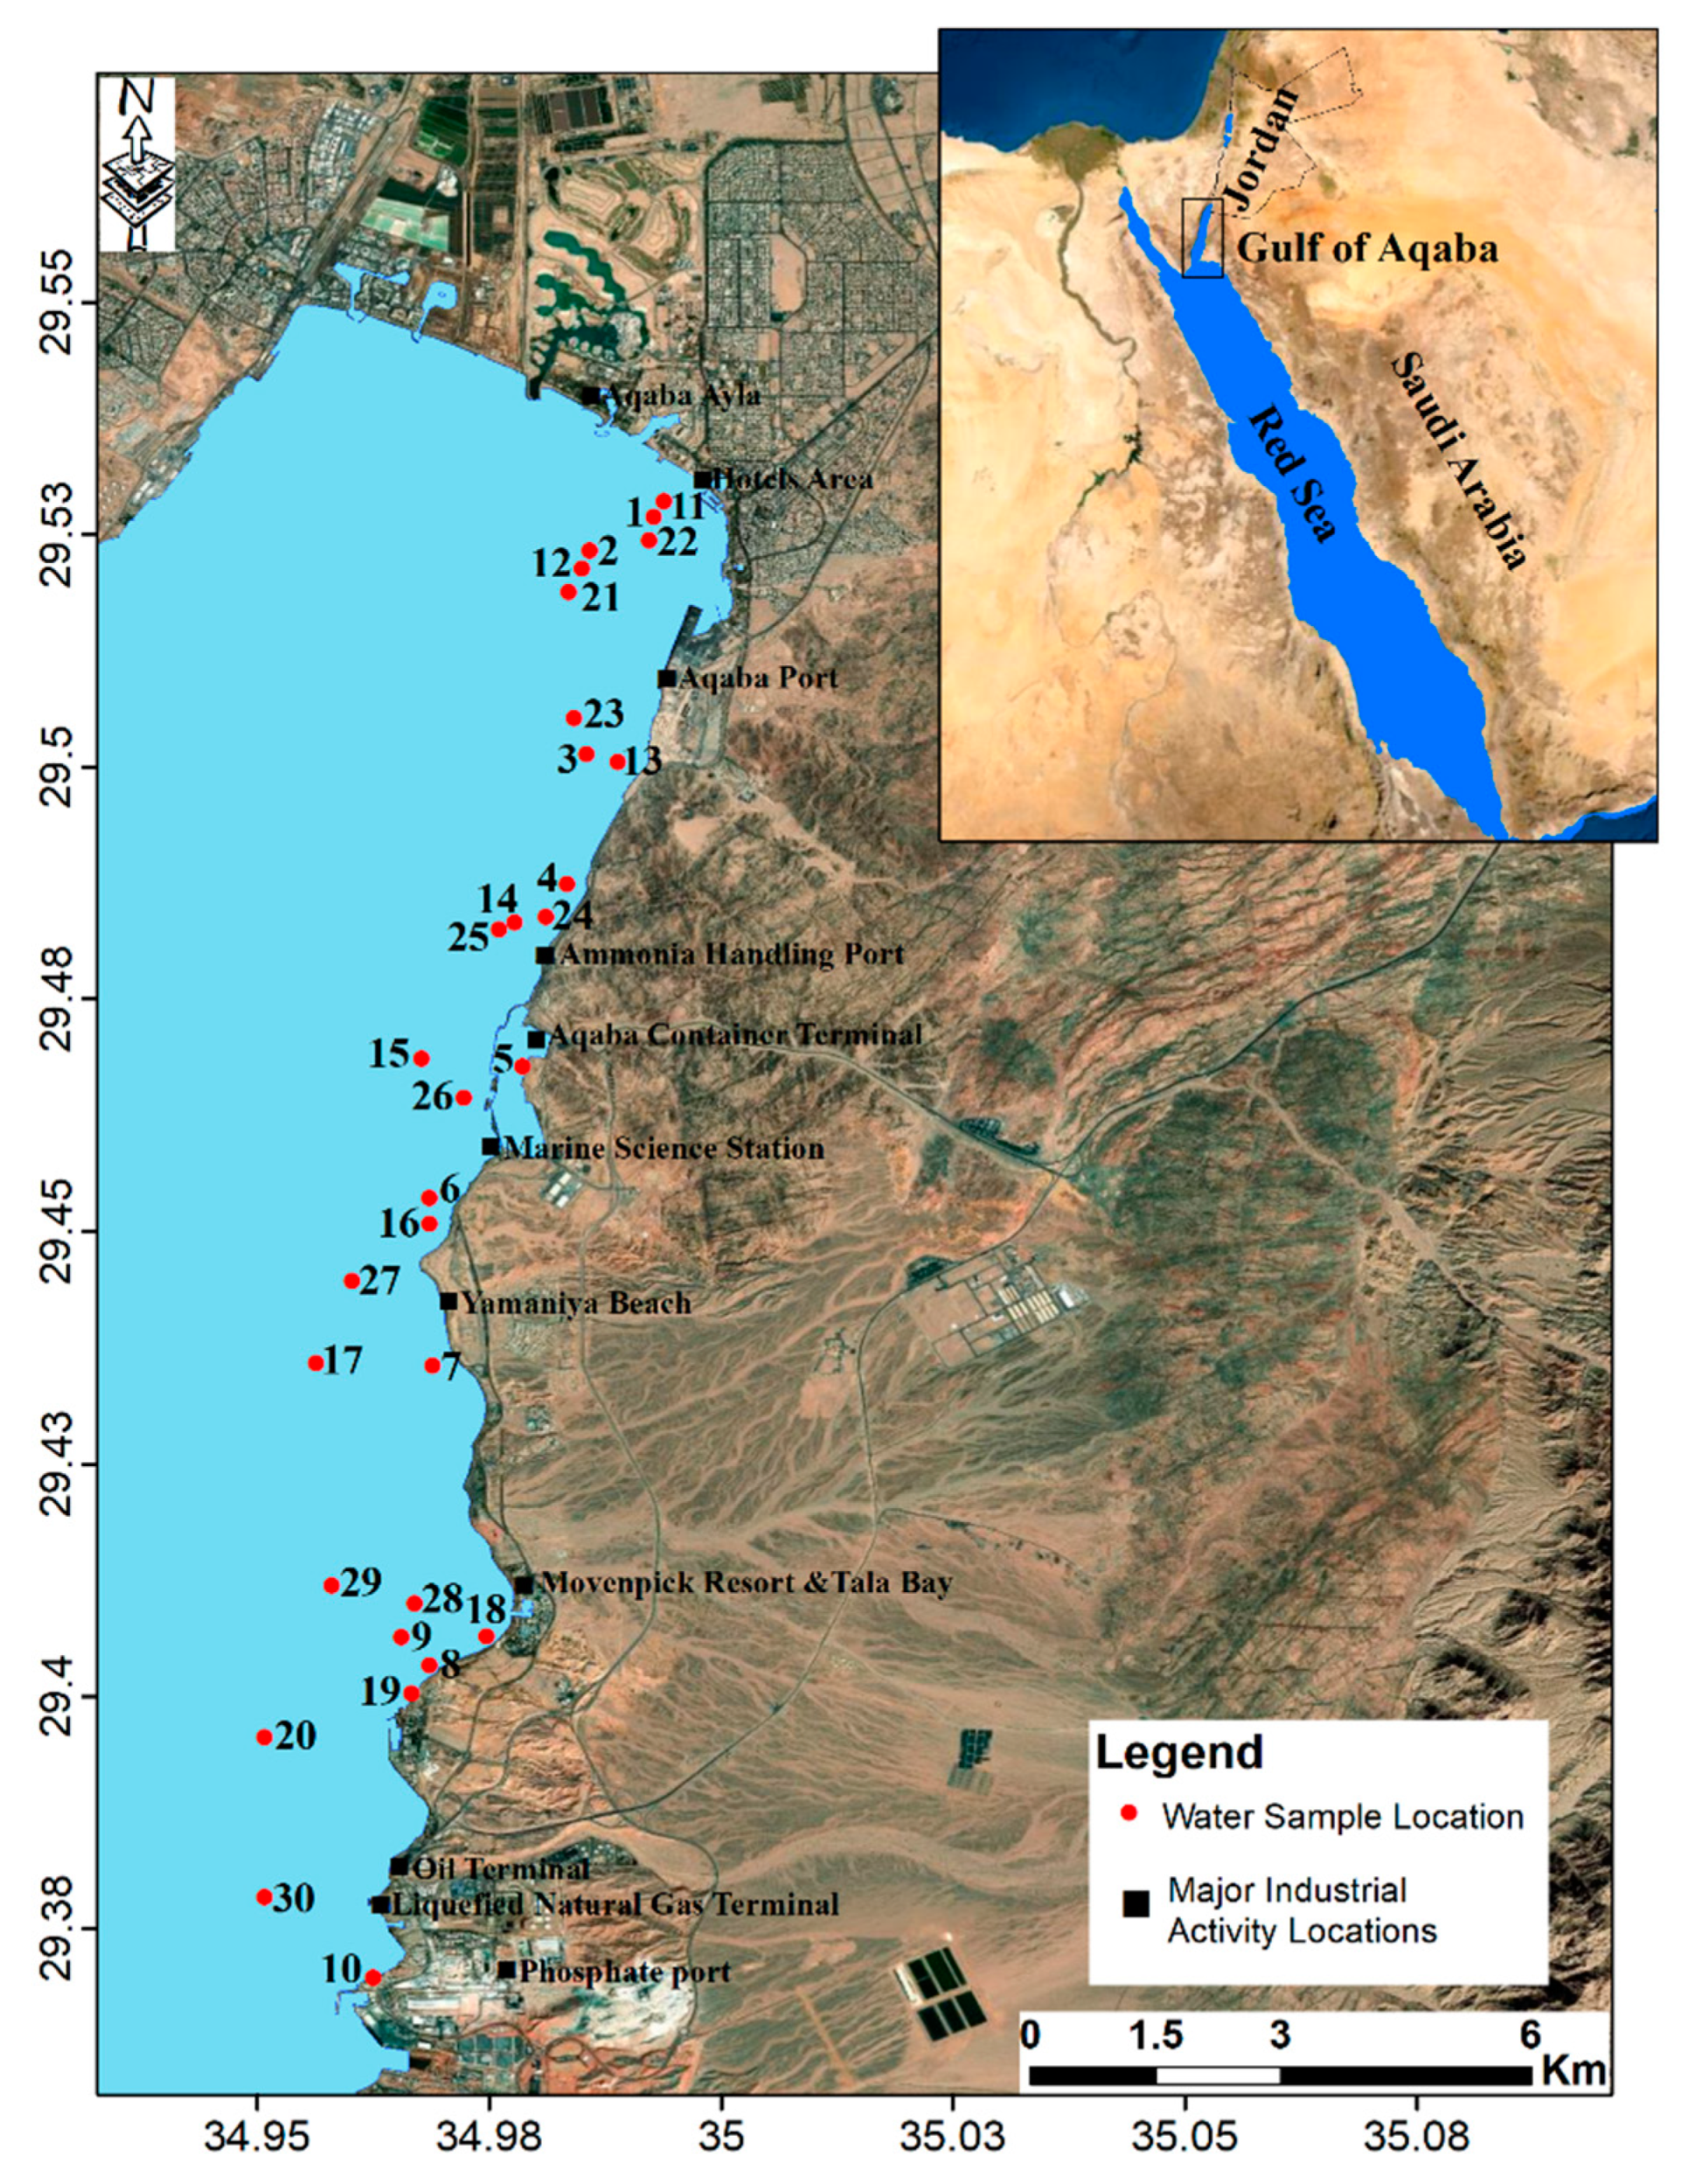
The Gulf of Aqaba (GoA) is the upper northeastern segment of the Red Sea [1]. It is a partially-isolated, narrow and deep coastal water body. The Strait of Tiran connects GoA with the Red Sea (Figure 1). Despite the extreme environmental conditions, the GoA supports unique aquatic ecosystems and biodiversity, and is a habitat for one of the world’s richest coral communities [2,3].
The GoA is one of the high anthropogenically impacted coasts in the Middle East region [4]. The expansion in economic and industrial activities in the Gulf’s bordering countries have contributed to the degradation of naturally stressed coastal and marine ecosystems. They are subjected to various impacts and sources of pollution including dredging and reclamation activities, coastal construction development, industrial waste, ports, oil spills, and domestic sewage, among others [5].
GoA is the only marine port for Jordan, and is highly vulnerable to pollution, where all marine-related activities are concentrated within a few kilometers of the coast (27 km). In addition, many economic, industrial, and recreational activities are taking place along the Jordanian coastline, many of which are of potential environmental impacts [6,7,8,9]. Additionally, the region plans to have a number of large coastal projects (such as the Red-Dead Sea conduit, new resorts, and ports relocation), which will certainly accelerate the degradation cycle of existing environmental conditions and threaten these unique marine communities [7]. Signs of human impacts were reported [10,11,12].
In addition to human impacts, the GoA is subject to regular dust storm events that contribute metals and other chemicals to the GoA coastal water [8,9]. Aeolian dust flux to GoA is likely to influence seawater chemistry [13], where atmospheric dry deposition in the GoA is considered an important external source of trace metals [8,9,14,15,16]. The mineral dust rate on GoA region is one of the highest on Earth [8,9,13,17]. It is believed that the frequency of dust storm events will become more common in the GoA, due to increase in regional aridity and dust fluxes [18,19].
The relatively small volume and absence of significant wave action along with the low rate of water circulation and renewal (between GoA and the Red Sea), render the Gulf particularly vulnerable to pollution. The residence time of water in the Gulf averaged 1–3 years [20,21].
The growing concern over the sustainability of these unique aquatic ecosystems of GoA has recently gained momentum and became a priority issue in Jordan. The impact of intense and widespread human activities from the Gulf’s bordering countries poses imminent threats to GoA coast, which requires a proper monitoring plan. The objective of the present study is to assess the current status of surface water quality along the coastal region of the Jordanian GoA coast. It also intends to evaluate the spatial distribution of a variety heavy metals and to identify potential sources of contamination. This assessment will help develop a sustainable management plan for coastal water resources.
2. Materials and Methods
2.1. Description of Study Area
The GoA is the Red Sea’s northeastern extension. It is a partially-enclosed, narrow and deep coastal water body. The Strait of Tiran connects the Red Sea to the GoA (Figure 1). The GoA extends approximately 180 km southward with a width ranging from 5–25 km (the average of 16 km maximum), and a maximum depth of about 1800 m (the average is about 800 m). Only 27 km of the eastern coast belong in Jordan, and the remaining coastline, unpopulated, and largely underdeveloped, lie in the Saudi territory.
The GoA is influenced by prevailing subtropical conditions with extremely high temperatures, high evaporation rate (about 400 cm/year) and negligible rainfall (of less than 2.2 cm/year) [22]. Surface water flow in the Gulf is nonexistent or limited solely during rare intense rainstorms occurring as flash floods in winter. The average water temperature in the upper 200 m varies seasonally from 20 °C in winter to 28 °C in summer, whereas the average air temperature ranges between 32.20 ± 3.16 °C in summer and 17.60 ± 3.46 °C in winter [23]. The maximum sea level of 154.30 cm was recorded in 2013 [23].
These conditions result in a high salinity in surface water layer, ranging from 40.3 to 40.8‰ in winter and from 40.5 to 46.6‰ in summer [9,24,25,26]. The surface coastal water of the GoA is extremely oligotrophic, because of its nutrient-poor water originating from the Red Sea surface waters through the Straits of Tiran. The surface water is shallow with stable thermocline throughout the year, except in wintertime, when a wind-driven convective mixing occurs between the deep (nutrient-rich) and surface waters. Water stratification occurs in spring. However, the oceanographic characteristics of extensive solar irradiance, high transparency, deep sunlight penetration, and warm water created unique aquatic ecosystems and biodiversity, with one of the world’s richest coral communities [2,3].
The northerly wind, with a high speed and activity during summertime, is the prevailing wind direction and is responsible for the majority of aeolian deposition events in the region. However, Khamaseen winds blowing in springtime account for most sand and dust storms in southern Jordan and the adjacent areas [27]. They deliver dust from the interior of the Sahara Desert in north Africa.
2.2. Sampling and Analysis
Surface water samples were collected in September 2017 from 30 different locations along the coastal areas of GoA, Jordan (from north to south), sampling sites are presented in Figure 1. Coastal water samples were collected in 1-L precleaned polyethylene containers pre-rinsed with 10% HCl and 2 mL of HNO3, Samples were labeled and measured in the field for pH, electrical conductivity (EC, mS/cm at 25 °C), and total dissolved solids (TDS) using pH-meter (Sensions 5, HACH portable case), and EC/TDS-meter (ECOSCAN-hand held series, EUTECH instruments). Water samples were kept refrigerated at 4 °C and transported to a water laboratory (Yarmouk University, Jordan) for subsequent chemical analyses. Sample preparation and analysis followed APHA [28] procedures.
In the laboratory, all samples were filtered by Whatman filter paper (No. 42) and analyzed for total alkalinity (TA), Cl−, NO3−, SO42−, PO43−, NH4+, Ca2+, Mg2+, Na+, K+, Cd, Co, Cr, Cu, Fe, Mn, Pb, Sr, and Zn, as follows: 50 mL of filtered samples were used to determine the concentrations of Na+, K+, Ca2+, Mg2+, and Cd, Co, Cr, Fe, Mn, Pb, Sr, Zn using flame atomic absorption spectrophotometer FAAS (NOVAA 300 Analytica JENA AJ with detection limits varying from 0.001–0.02 µg/L. Each sample was analyzed in duplicate. The accuracy and precision of the analytical method was evaluated by the analysis of a reference material (NASS-5), with recoveries ranging between 98.02–104.01%. A total of 5 mL of filtered samples was used to measure NH4+, Cl−, NO3−, SO42−, PO43− by ion chromatography (IC) (Dionex ICS 1600, Thermoscientific). A total of 25 mL of filtered samples were titrated with 0.02 N H2SO4, using phenolphthalein and methyl orange as indicators to determine total alkalinity (TA) of the water samples. There are two pH endpoints corresponding to the above indicators at 8.3 and at 4.3. TA was calculated using the following equation:
TA = (volume of acid used * normality of acid * 50,000)/volume of sample.
The average ionic mass balance for water quality data was −0.02% indicating a high level of accuracy.
3. Results and Discussion
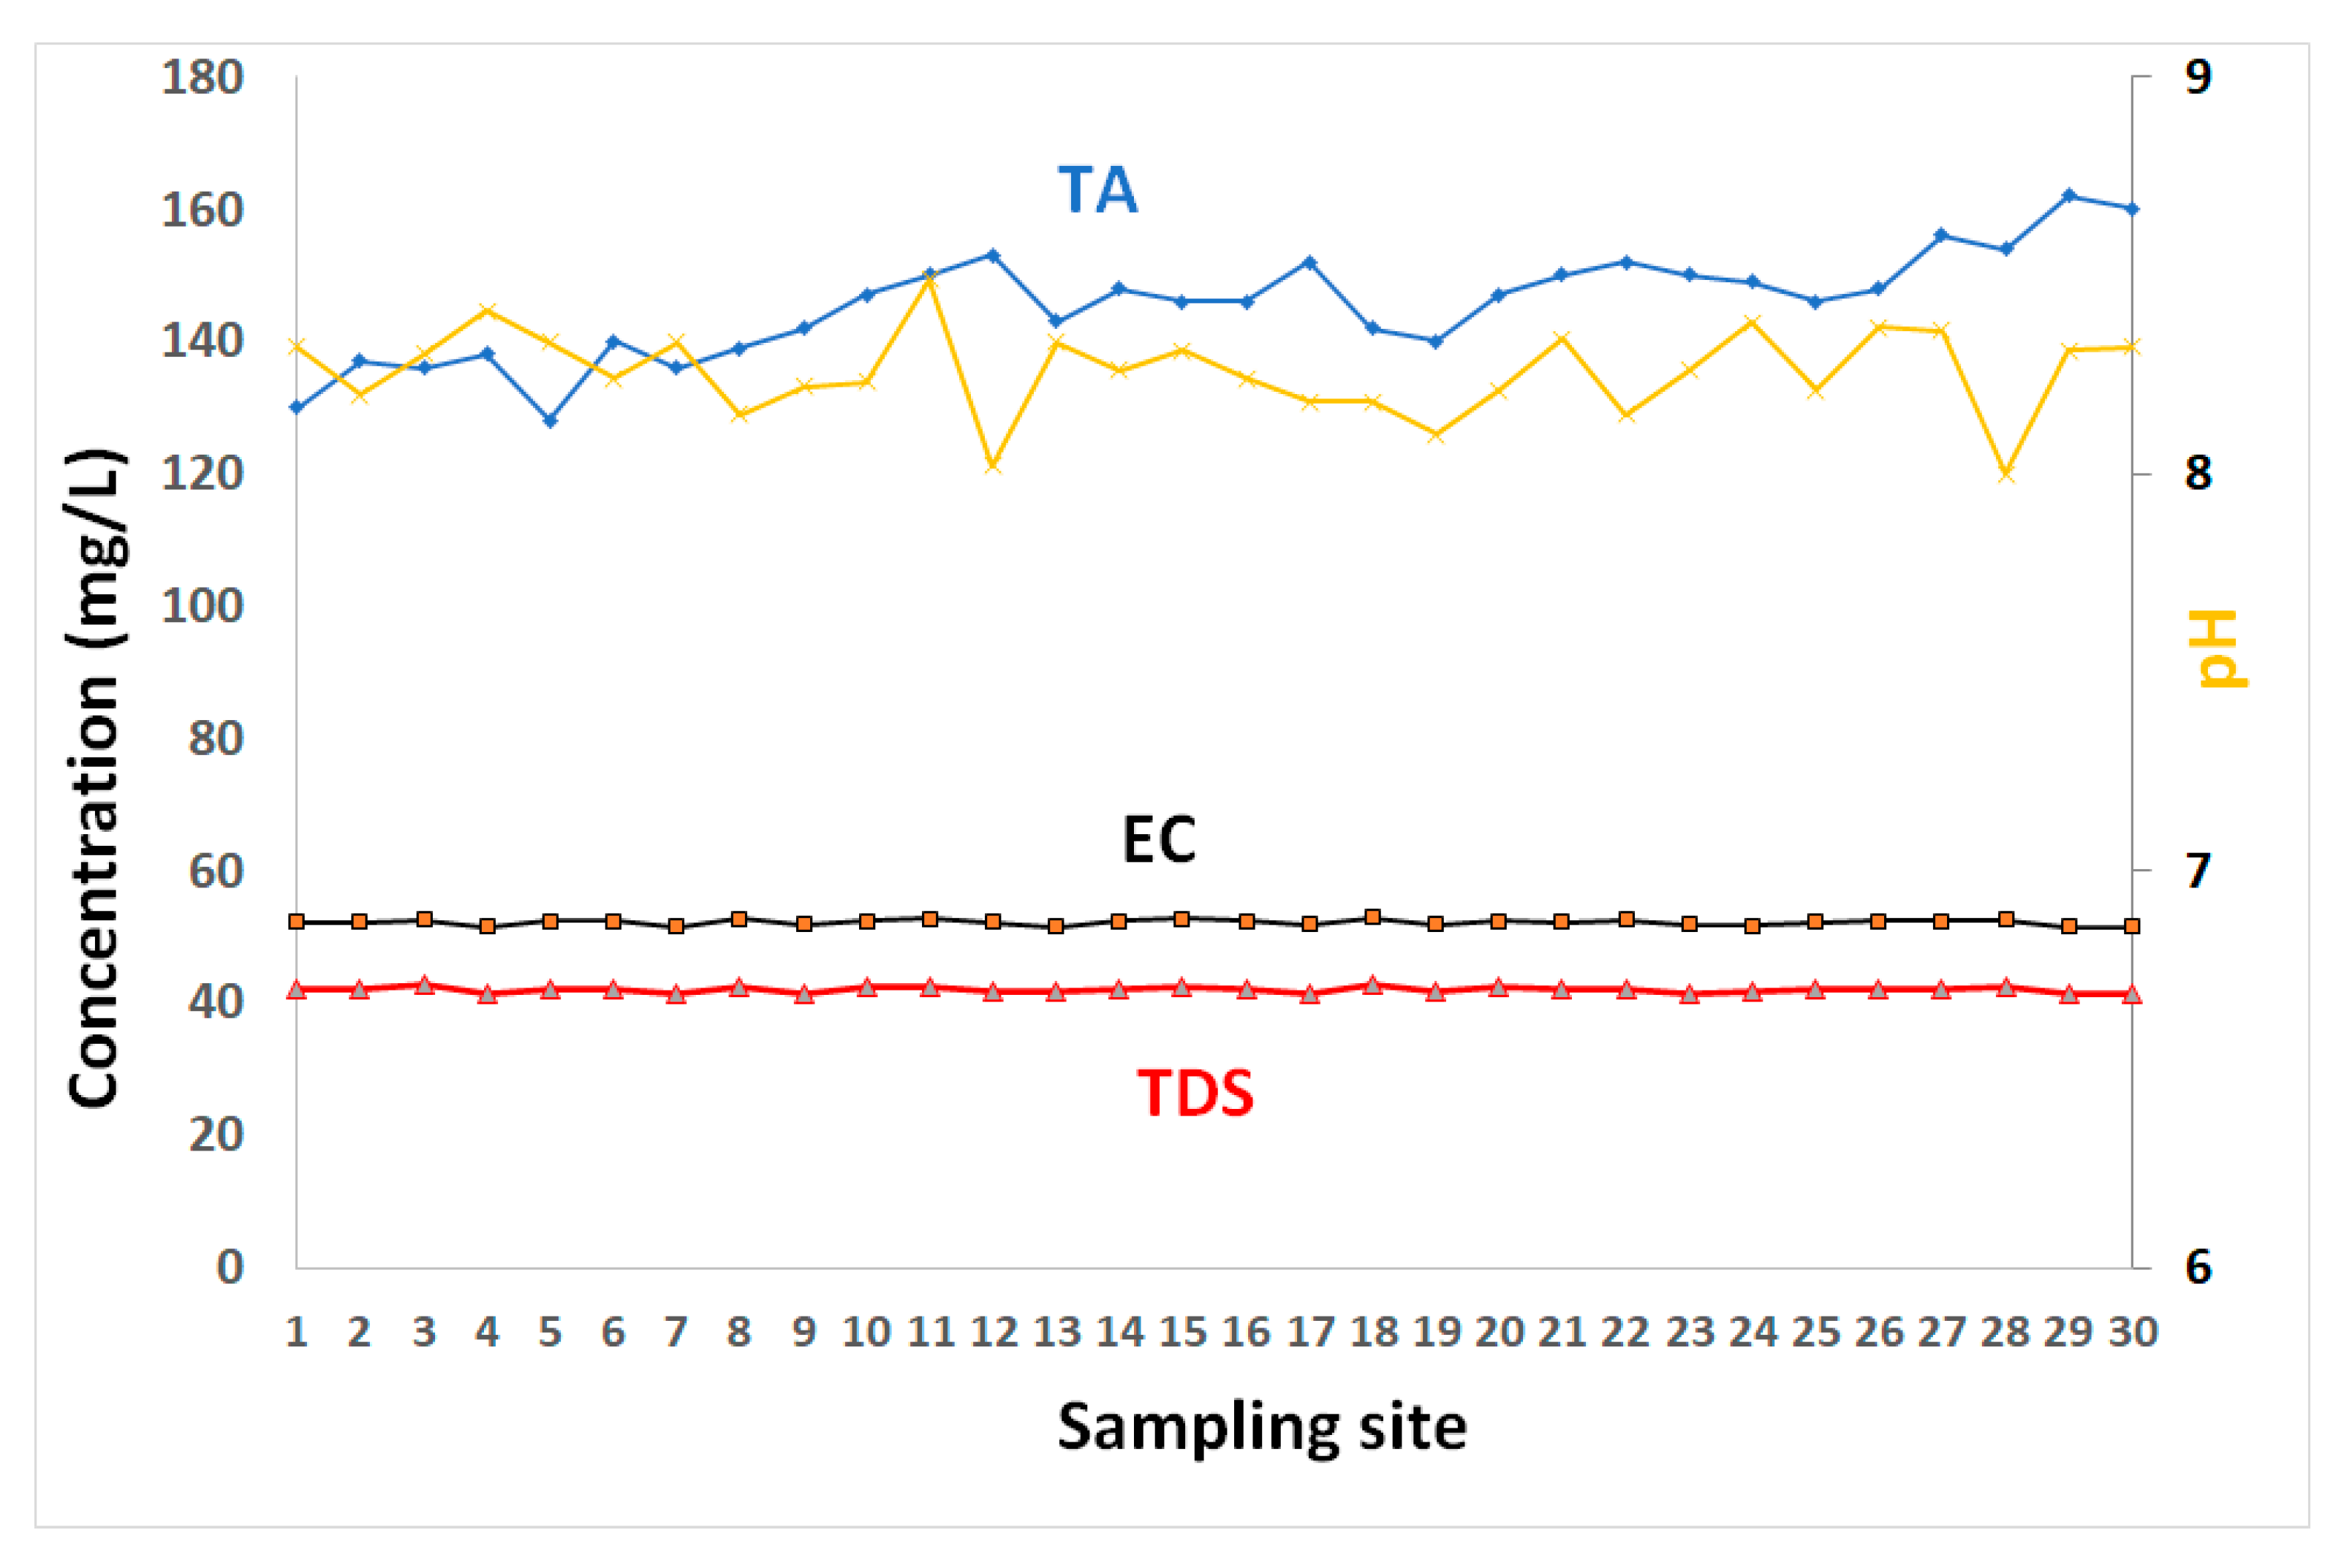
The results of dissolved metals and physicochemical properties of coastal water are tabulated in Table 1, and presented in Figure 2, Figure 3, Figure 4 and Figure 5. The pH values of surface water layer ranged between 8 and 8.49, with a mean value of 8.26 (Table 1 and Figure 2). They indicate a slightly basic coastal water. They showed a slight spatial variability with no distinct trends. This is likely related to the calcium carbonate buffering capacity of water [23].
In addition, these pH values are probably attributable to low growth levels, and production of algal biomass that would contribute organic acids to coastal water when decomposed. While the weather conditions of high temperatures and abundant sunlight allow phytoplankton to grow in abundance, our sampling campaign coincided with a period of nutrient-depleted and stratified water, where photosynthetic activity was at its lowest levels. Manasreh et al. [23] recorded the lowest chlorophyll-a levels in summertime and highest during winter. Microbial decomposition of dead phytoplankton, algae and other flora, produces humic substances, organic acids and amino acids that raise the seawater acidity. Additionally, higher temperature during summertime will reduce dissolved CO2 levels in coastal water and increases the pH value.
TA (total alkalinity) concentrations ranged between 128 and 162 mg/L, with an average value of 146 mg/L. These high values are consistent with the coastal water’s buffering capacity (due to high contents of calcium carbonates) of the GoA’s water. The TDS varied from about 41.22–42.74 g/L with an average of 41.95 g/L. EC varied from 51.42 to 52.87 mS/cm with average of 52.17 mS/cm. Similar values of TDS were reported along the Saudi GoA with an average of 41.4 g/L [9].
The spatial pattens of TDS in water showed insignificant variations (Figure 2). The elevated levels of TDS indicate highly saline conditions in the GoA and are primarily attributable to its geographic location in a subtropical desert region, with very high evaporation rates, very low precipitation, and negligible freshwater input. Manasreh et al. [23] reported an evaporation of 2 m/year in the GoA with an increasing salinity toward the north. In addition to these salinity raising factors, the high TDS values are linked to water stratification and poor water circulation during the sampling period. These factors created unique environmental conditions of higher temperature, evaporation, and salinity than average, compared to the average range for oceans. Lack of input of freshwater into the coastal water contributes to high salinity water. A negligible supply of terrigenous sediments into the water results in clear water conditions with high transparency.
Higher water density is often observed in summertime in response to high salinity (due to poor water mixing). From July–August, a stratified water column dominates with thermocline and pyncnocline, occurring at about 250 m in 2013 and near 350 m in 2014 and 2015 [23]. The northwards currents drag warm and saline waters to GoA from the Red Sea [25,29]. The flow of surface water from the Red Sea to the GoA is triggered by the high evaporation rate, where the flowing water offsets the evaporation loss [30]. The GoA surface seawater temperature is 2 °C lower than that of the Red Sea, where the flowing water brings heat that increases temperature, evaporation rates and salinity of surface seawater layer.
In addition, the TDS values become higher in August, corresponding to the summer season, a period of high dust storm events. The atmospheric dust input is an significant source of salts (and metals) to GoA water [8,9]. The GoA is located in a desert-belt region with frequent dust storms, where Negev and Sinai Deserts are in the west and the Arabian Desert is in east. It is believed that large quantities of dust aerosols delivered to GoA is originated from adjacent deserts [31]. Dust deposition will significantly influence the composition of GoA seawater, where the deposition rate of dust in GoA is one of the highest on Earth [13] ranging between 28 g/m2/year in the northwestern part [13] to about 34.68 g/m2/year in Aqaba city at the northeastern corner of GoA [8]. TDS was significantly correlated with Ca2+, Mg2+, Na+, Sr and Cl− with r = 0.86, 0.88, 0.81 and 0.70, respectively (Table 2). These ions are major contributors to seawater salinity.
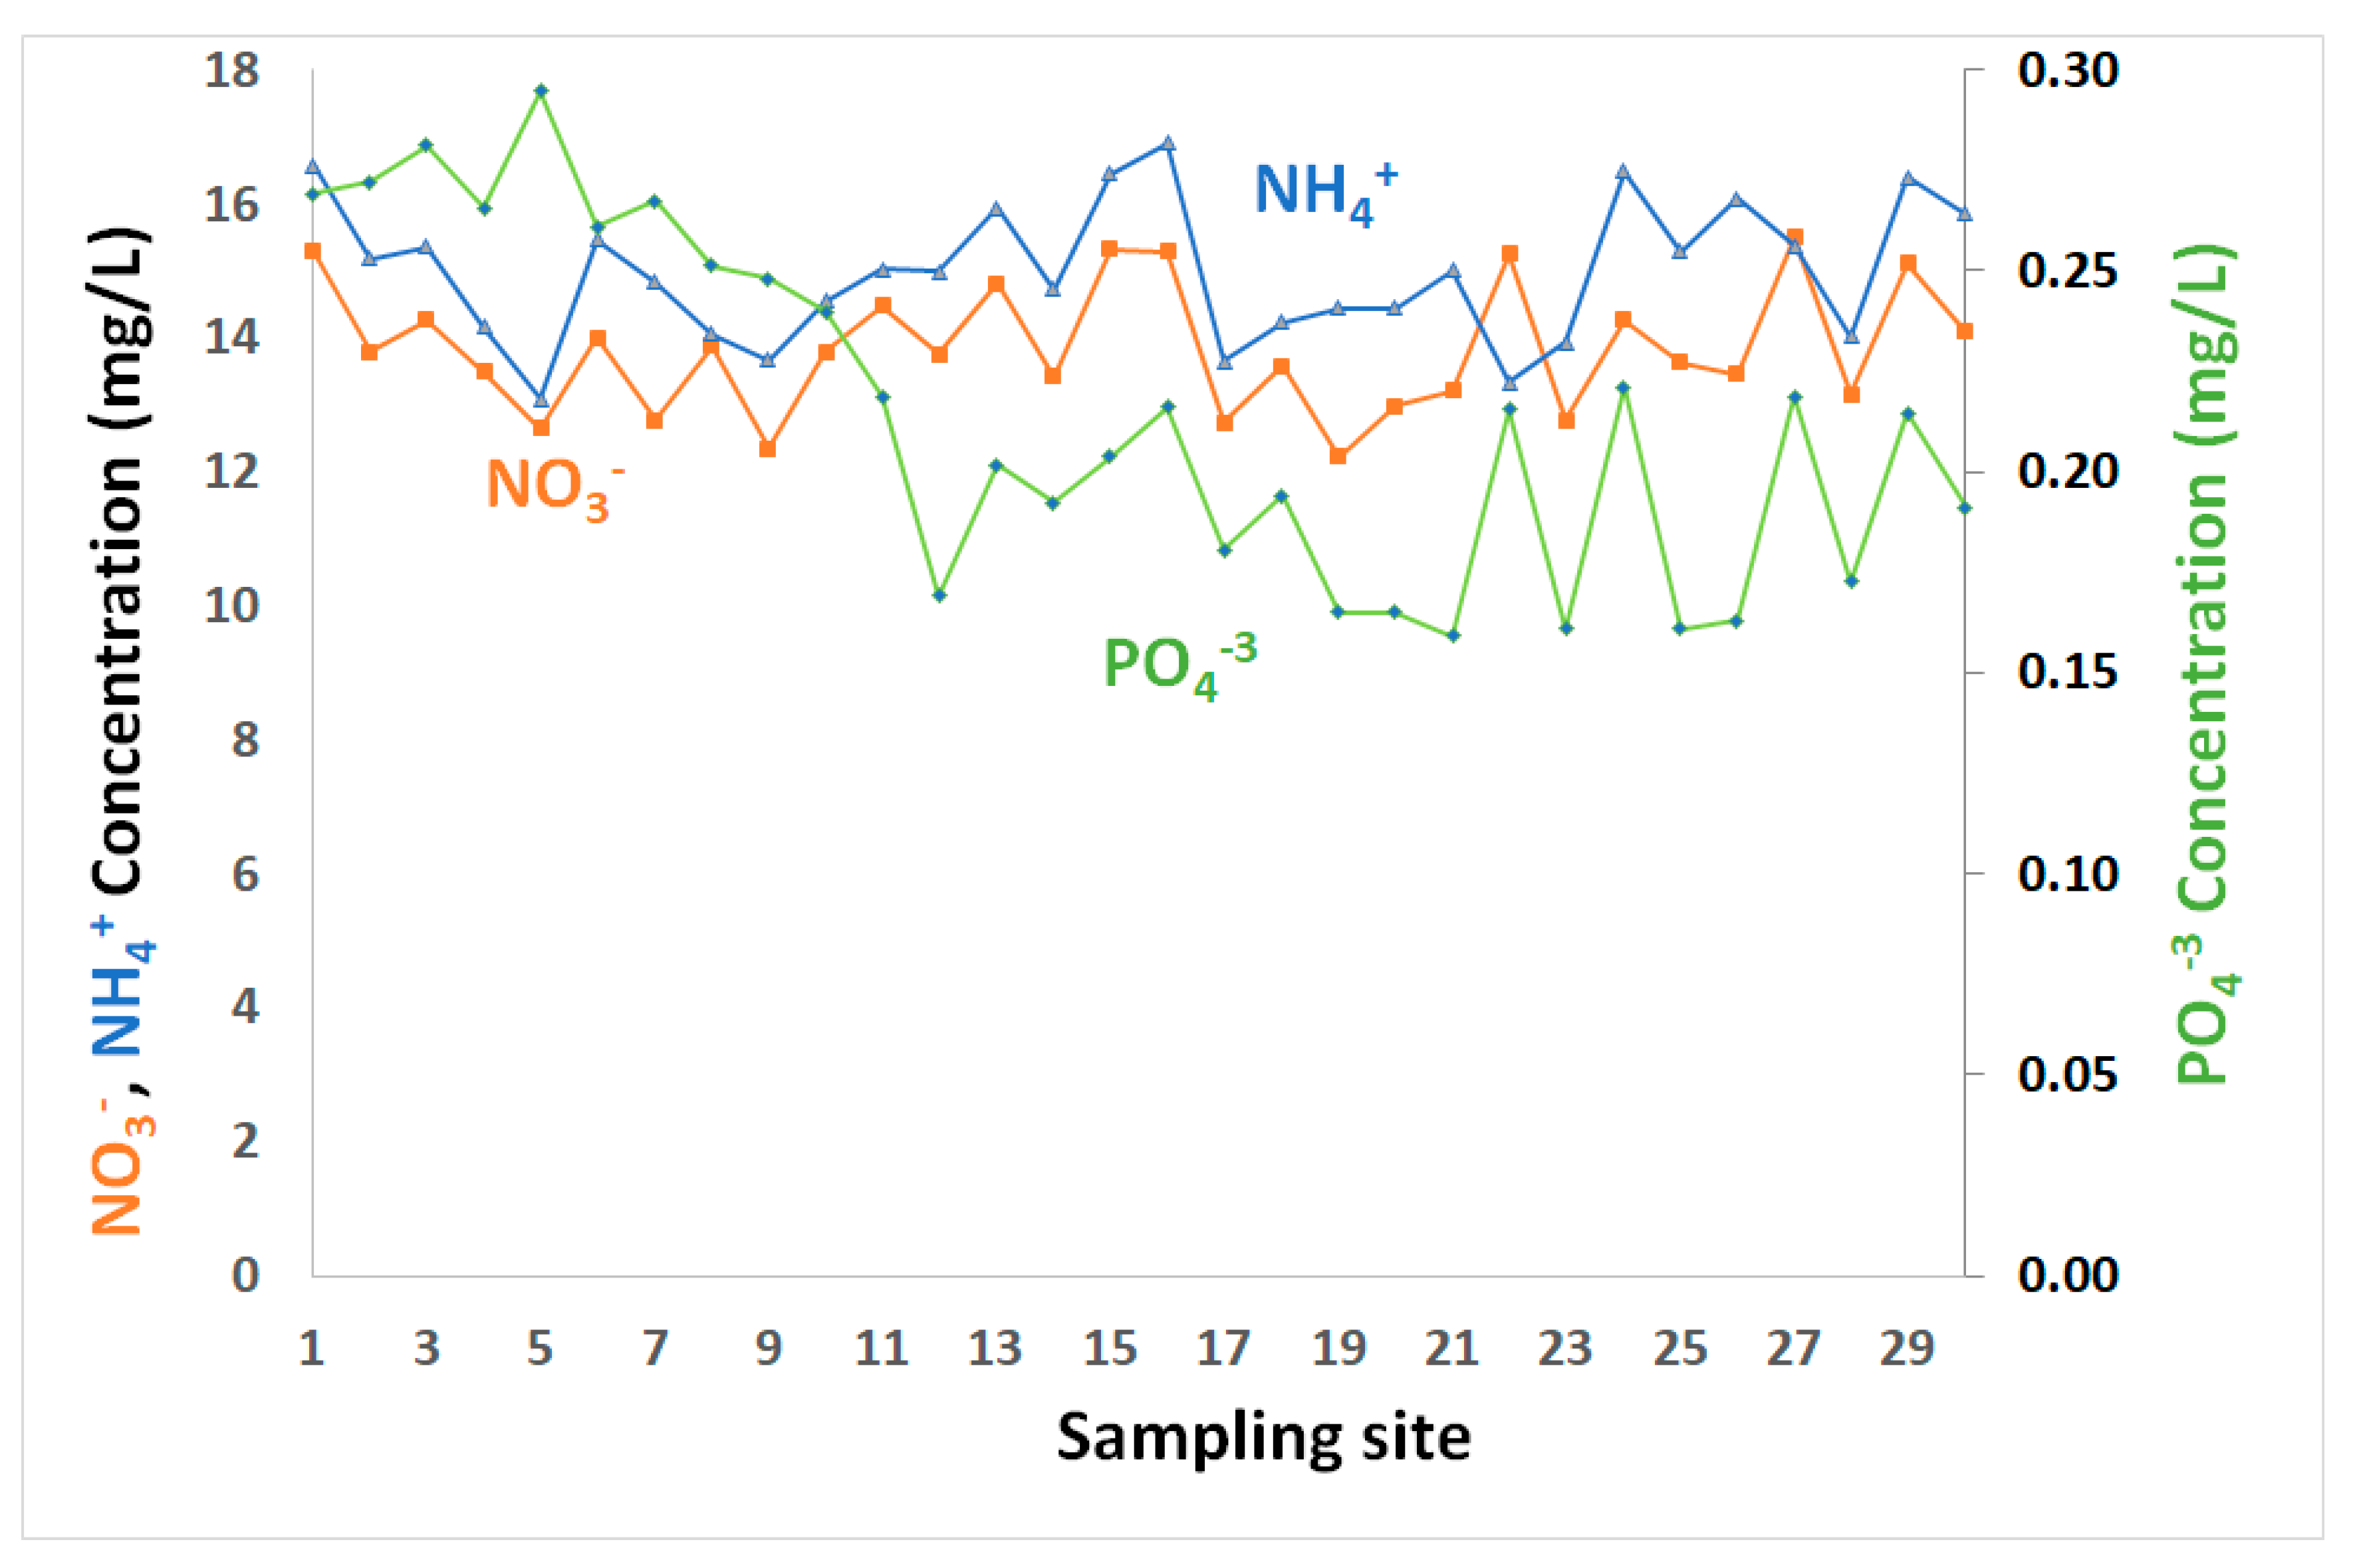
Inorganic nutrients (nitrate, ammonium, phosphate) are minor constituents of seawater, but are essential for marine ecosystem productivity and growth. Relatively low levels of inorganic nutrients (NH4+, PO43−, NO3−) (Table 1 and Figure 3) were observed in surface water layer, consistent with the findings of others [23,32,33,34,35]. The coastal water in GoA is in extremely oligotrophic conditions, with very limited nutrients supplied to Gulf’s water through terrestrial runoff.
Nitrates are present in all water samples, where the concentrations increased slightly in some locations, although not all. NO3− concentrations ranged between 12.22 mg/L up to 15.50 mg/L, with overall mean and median levels of about 13.85 and 13.78 mg/L, respectively (Table 1 and Figure 3). Ammonium levels fluctuated from 13.08 and 16.91 mg/L, with mean and median values of about 15 mg/L (Table 1 and Figure 3). While the nutrient levels generally varied, their variations showed no spatial trends. Nitrate and ammonium showed relatively similar ups and downs and were significantly correlated with r = 0.65 (Table 2).
Nitrate is the major nitrogen species in the oxic zone, while ammonium dominates in the anoxic zone. The nitrification is a kinetic reaction and is dependent on several water conditions such as salinity, pH, and Eh [36,37]. However, the coexistence of nitrate and ammonium can trigger or slow down nitrogen conversion like nitrification or denitrification [38]. The coexistence of NH4+ and NO3− may result from poor mixing in groundwater, especially in locations where both nitrogen species are released from active pollution sources [39,40]. The GoA waters are well oxygenated with redox indicators of oxidizing conditions [9]. Manasreh et al. [23] observed that the GoA water is well-ventilated due to the annual water mixing with complete saturation (100%).
This suggests that the presence of high NH4+ levels could be associated with leaks from sewer system and/or because of water discharged from fish farm or fertilizer plume. Phosphate varied from 0.16–0.29 mg/L, with an average of 0.21 mg/L (Table 1 and Figure 3). Relatively higher concentrations were observed in the northern GoA, in close proximity to the phosphate terminal, where deposition of dust containing phosphate during loading/unloading activities may contribute phosphates to seawater. While phosphate showed low levels, it is the limiting nutrient for phytoplankton growth. Weak correlations between phosphate and both ammonium and nitrate were observed with r = −0.02 and 0.18, respectively (Table 2).
Aeolian deposits can provide important nutrients which stimulate the primary productivity in marine ecosystems [41,42,43,44], especially in oligotrophic water [45], like the GoA [10,20]. However, they can also deliver various contaminants that negatively impact the aquatic biodiversity.
Similar observations were reported by Badran [46], where phosphate and nitrate levels in surface water varied seasonally, with the lowest in summer and the highest in winter. The sampling period was concurrent with water stratification, and the concentrations of nutrients in surface water layer were low. In the winter season, winds drive convective mixing of deep (nutrient-rich) and surface waters, where nitrate and other nutrients are injected into the euphotic zone, resulting in seasonal plankton blooms [47]. The highest productivity (chlorophyll-a) is expected during the winter season, which declines to minimum levels in summertime [23].
Water stratification and high sunlight irradiation during summertime further draw down the inorganic nutrients in the surface water by enhancing primary productivity at the subsurface water layer (50–75 m) [34]. During photosynthesis, phytoplankton assimilate nutrients, and it is the availability of inorganic nitrogen that often limits the rate of primary production in the sea [32]. Nutrients uptake within the euphotic zone in oligotrophic water body results in a considerable depletion of their levels. Phytoplankton communities in oligotrophic waters are likely to survive by utilizing recycled nutrients [48,49].
Nutrient levels in the southern Red Sea are greater than its northern and central regions. The inflow of surface water from the Red Sea to GoA (to compensate for the high evaporation loss) is a contributing factor to lower levels of nutrients observed in GoA seawater (oligotrophic water). In late summer, an increase of 25% in nutrient levels is observed in the southern Red Sea compared to the central region, due to the inflow of nutrient-rich waters from the Gulf of Aden to the southern area of the Red Sea [50]. The highest levels of phosphate in the southern Red Sea are usually observed in October, following upwellings in the Arabian Sea.
In addition to water mixing, it is likely that nitrate and other nutrients are associated with atmospheric deposition, as this area experiences frequent dust storms. Rare flash floods carrying terrigenous sediments can be a minor contributor to nitrate and phosphate in coastal water. Dust from the phosphate terminal in the GoA provides further evidence of contribution of aeolian dust to coastal water. Fish farming and wastewater discharges may be important sources of nitrate and phosphate, as water samples were collected adjacent to the coastlines closer to touristic, industrial and other human facilities.
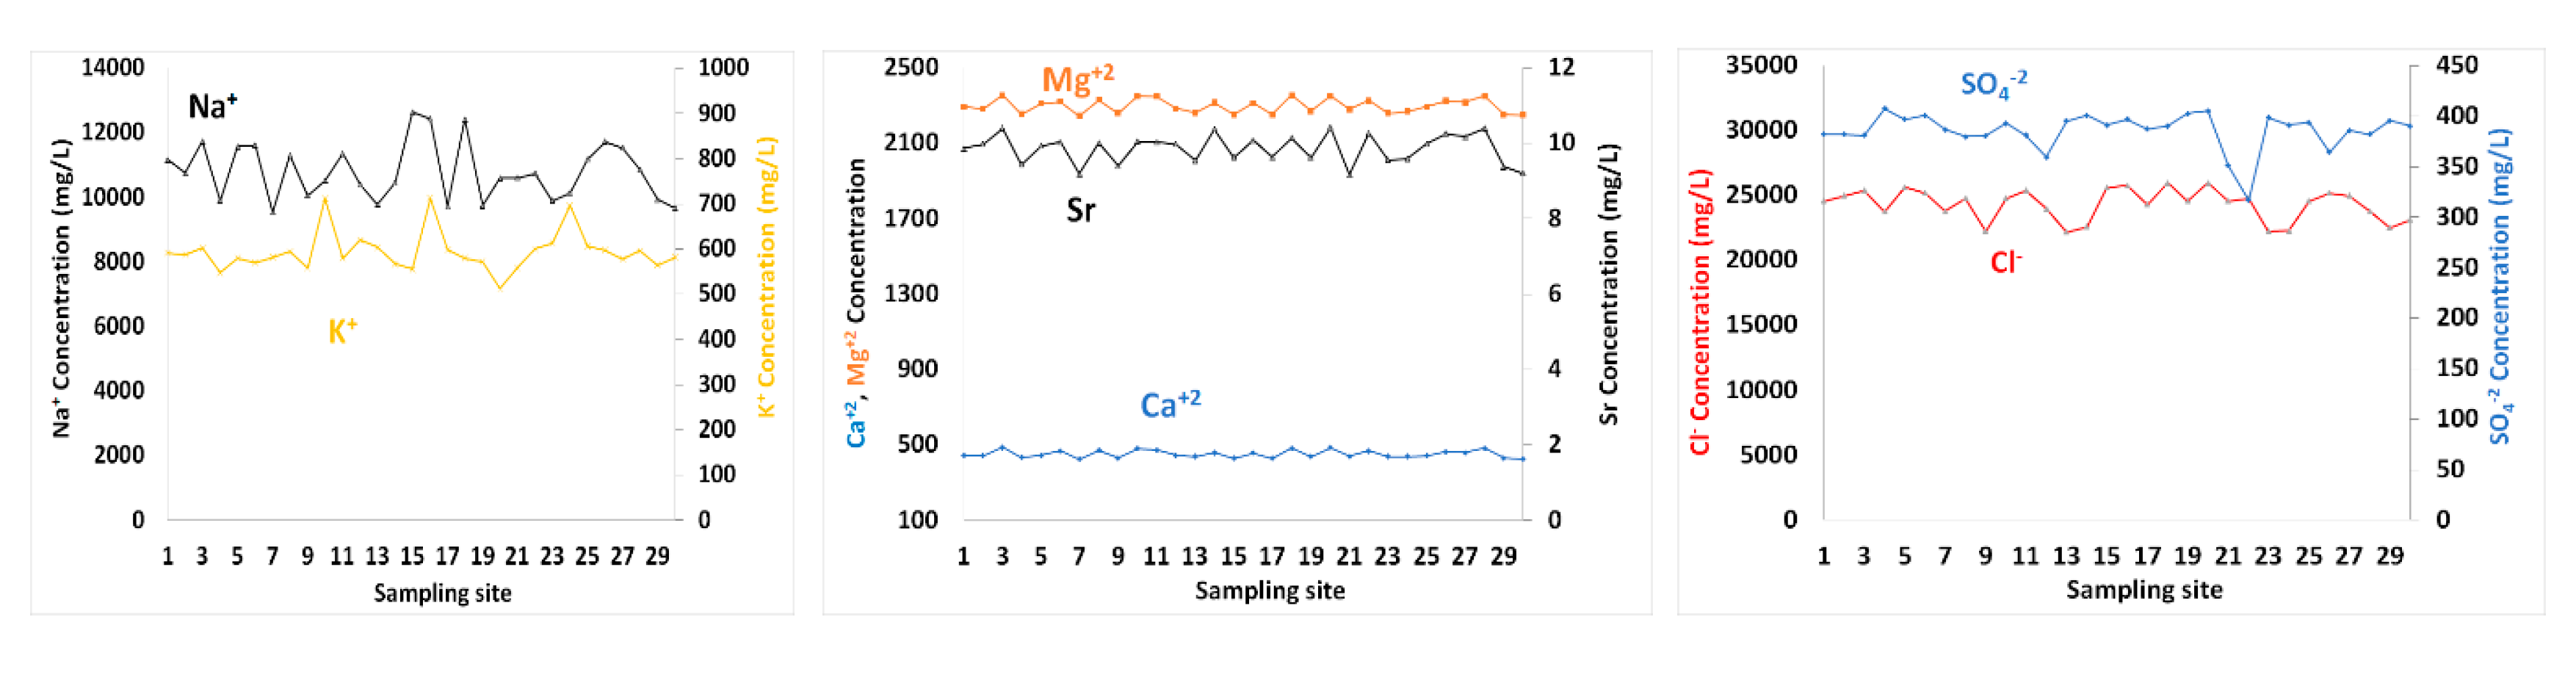
Sr content in seawater ranged between 9.17 and 10.42 mg/L (Table 1). The concentrations of Ca2+, Mg2+, Na+ and K+ in surface seawater layer varied from 423.32–486.99, 2246.2–2355.9, 9541.5–12,646.9 and 512.84–712.91 mg/L, respectively (Table 1). High temperature and evaporation rates are main contributors to high levels of ions, among others. The spatial distributions of Ca2+, Mg2+ and Sr in surface water exhibited relatively similar patterns with no trends. Ca2+ was positively correlated with Mg2+, Sr, and Na+ with correlation coefficients of 0.97, 0.85, and 0.52, respectively. The correlation coefficients between Mg2+ and Sr was 0.87, and between Mg2+ and Na+ is 0.59. The K+ levels in seawater was not significantly correlated with any cation tested.
Cl− exhibited spatial changes in surface water, with concentrations ranging from 22,172.88–25,991.94 mg/L. The SO4-2 values in seawater samples varied between 316.99 and 407.45 mg/L. Cl was correlated with Ca2+, Mg2+ and Na+ with correlation coefficients of 0.54, 0.60 and 0.74, respectively. Similar to K+, the SO42− content showed no significant correlations with any other ions of seawater. TDS values were well correlated with Cl−, Ca2+, Mg2+, Na+ and Sr, with r = 0.70, 0.86, 0.88, 0.81 and 0.81, respectively. Whereas salinity was neither correlated with SO42− nor with K+. Dust deposition to GoA is also an important contributor to TDS and other ions.
Table 3 compares seawater chemistry of the GoA (northernmost Red Sea) analyzed in this study relative to other regions of the Red Sea. Relatively elevated levels of pH, TA, Cl−, NO3−, PO43−, NH4+, Mg2+ and K were observed for GoA, compared to the central and northern Red Sea. Whereas SO42−, TDS, Ca, and Na showed values that are comparable to or lower than those for other parts of the Red Sea water.
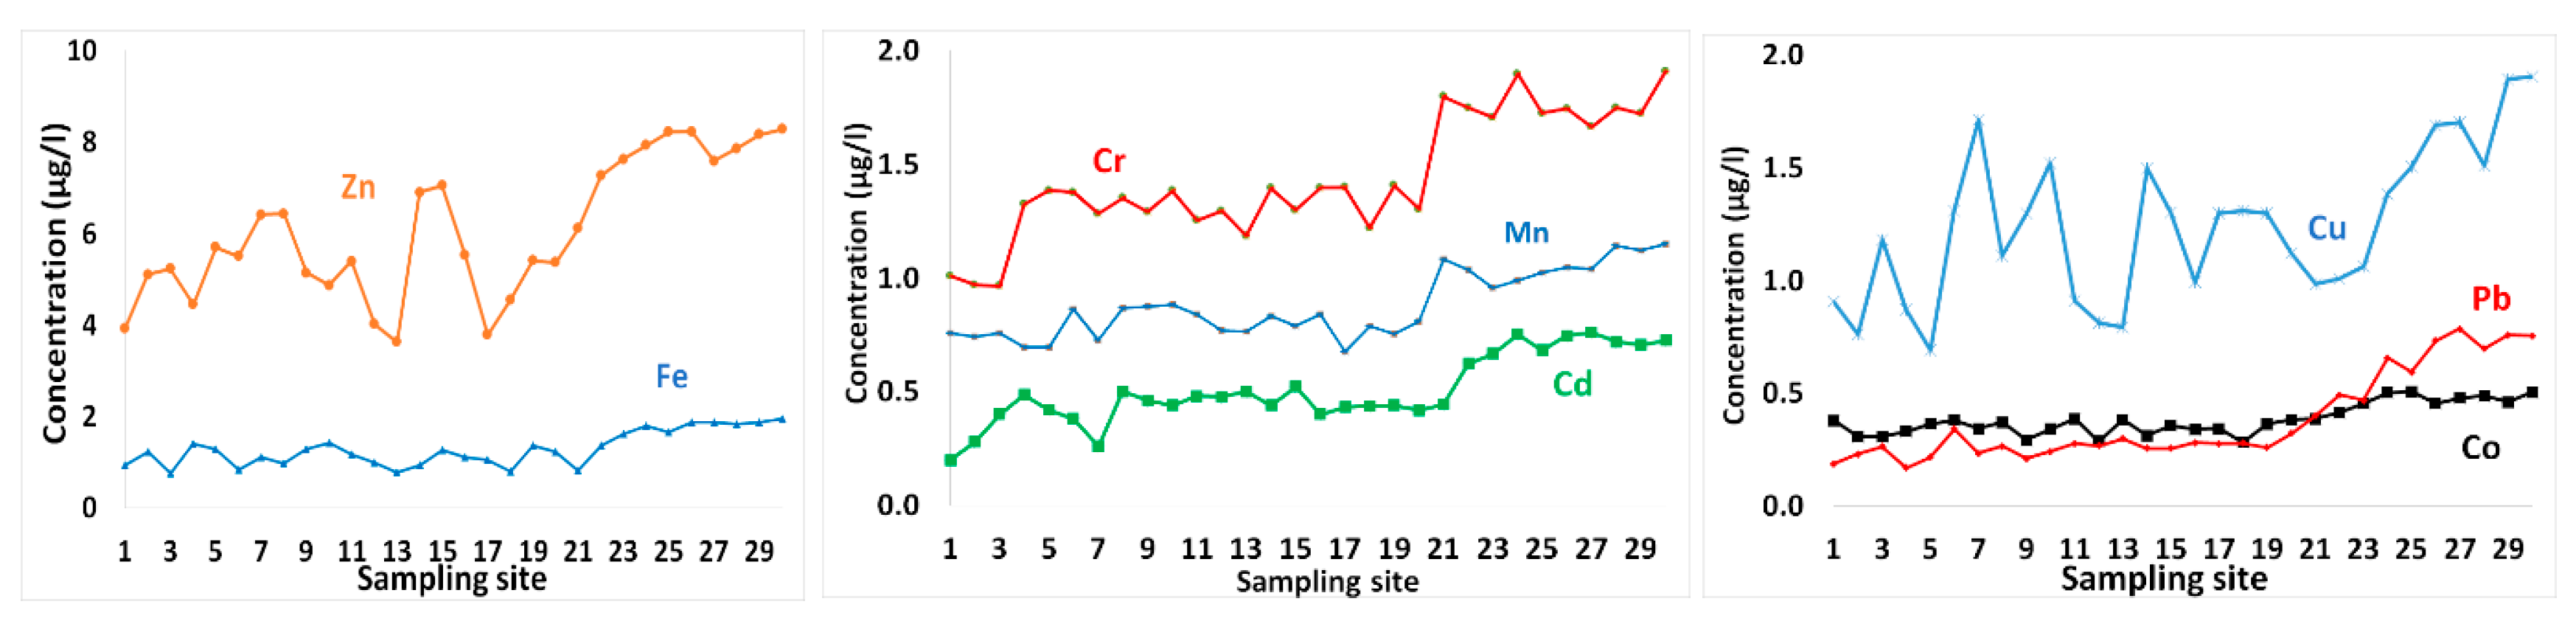
The concentrations of metals in surface seawater layer are shown in Table 1 and presented in Figure 5. Zn showed the highest concentration, with an average concentration of 6.05 µg/L. Other metals that followed were in the order Cr > Fe > Cu > Mn > Cd > Pb = Co (Table 1, Figure 5).
Spatial variability of metals contents in seawater samples exhibited increasing trends toward the south (Figure 5), where the industrial complex is located. Potential impacts from heavy metals are commonly confined to areas in the vicinity of urban or industrialized regions on the coastal edge. However, these levels of metals also suggest that they have probably been derived from multiple sources, including a geogenic origin.
Al-Taani et al. [9] reported high levels of dissolved oxygen, with redox values indicating oxidizing conditions in the coastal water GoA, which may favor immobilization of some metals with relatively low levels in seawater samples. Zn in seawater varied from 3.63–8.28 µg/L with an average of 6.05 µg/L (Table 1 and Figure 5). These values are higher than those reported for the Saudi GoA [9], the offshore surface seawater of Red Sea [53], the average oceanic concentration [54], and the Mediterranean surface seawater [55] (Table 4).
In addition, atmospheric dry deposition is the primary external source of trace metals to GoA [14]. Aeolian dry fluxes of certain trace elements (e.g., Cd, Pb, Cu and Zn) to the ocean water may surpass those of riverine sources [56,57]. Aeolian dust of Zn to GoA ranges between 1.68 mg/m2/year (in Eilat city at the northwestern corner; [31]) and 4.02 mg/m2/year (in Aqaba city in northeastern region; [8]). High concentrations of Zn were observed GoA seawater ranging from 5.71–11.55 μg/L [58] in the vicinity of Industrial Complex.

Table 4.
Comparison of selected metals (µg/L) in surface seawater of GoA relative to other regions.
| Cd | Co | Cr | Cu | Fe | Mn | Pb | Zn | |
|---|---|---|---|---|---|---|---|---|
| Present study | 0.51 | 0.38 | 1.44 | 1.24 | 1.29 | 0.88 | 0.38 | 6.05 |
| Saudi GoA [9] | 0.03 | 0.236 | 0.957 | 6.183 | 15.255 | 0.259 | 0.202 | 3.323 |
| Offshore surface seawater, northern Red Sea [53] | 0.53 | 0.15 | - | 0.11 | 1.58 | 0.11 | 0.36 | 0.22 |
| Oceanic concentration [54] | 0.07 | 0.005 a | 0.33 | 0.12 | 0.04 | 0.01 | 0.001 | 0.4 |
| Mediterranean surface seawater [55] | 0.42 b | 1 c | 3.4 d | 0.2 e | 0.056–0.336 f | 0.11–0.19 f | 0.05 g | 0.17 |
Fe contents of seawater varied from 0.75–1.94 µg/L with a mean value of 1.29 µg/L. These concentrations of Fe showed spatial variability in surface water layer with generally greater values in the southern GoA (Figure 5). During the stratified summer, surface water becomes enriched in Fe [13], but the winter mixing of surface and deep water layers, decreases these Fe levels. The average concentration of Fe measured in the present study is relatively comparable to that for the Red sea offshore seawater [53], but higher than the averages for oceanic concentration [54] and the Mediterranean seawater [68] (Table 4). Higher concentrations of Fe were observed in the Saudi GoA with about 15.25 μg/L, suggesting that atmospheric dry deposition in this area is more intense. It is believed that Fe is probably derived from crustal sources. The average dry flux of Fe to the GoA waters varied from about 216 mg/m2/year [31] to 440 mg/m2/year [8].
Cr levels varied from 0.96–1.91 µg/L with average value about 1.44 µg/L (Table 1). These values are higher than those observed in the Saudi GoA seawater [9], the mean oceanic level [54], but less than those for the Mediterranean Sea [63,64] (Table 3). The spatial pattern of Cr suggests that these high levels of Cr at the southern end of GoA are most likely related to discharge of brine water from desalination plant [68]. In addition to the industrial wastewater, mineral dust from fertilizer and cement factories remain potential sources of Cr to GoA seawater. atmospheric aerosol deposition to GoA fluctuated between 0.96 mg/m2/year in Eilat city [31], and about 1.42 mg/m2/year in Aqaba city [8].
Mn content in southern water samples exhibited higher values relative to the northern part of GoA (Table 1 and Figure 5), and it is likely to originate form anthropogenic emissions [31]. The Mn contents in surface seawater ranged between 0.68 and 1.15 µg/L, with an average of 0.88 µg/L, which is three times as much as that measured for the Saudi GoA [9]. These values are also greater than those reported for the offshore water of Red Sea [53], the average oceanic concentration, and those for the Mediterranean Sea [67] (Table 4). Windblown dust of Mn to the uppermost eastern GoA (Elat city) averaged 5.28 mg/m2/year [31], whereas, in the northernmost extension, a mean value of 10.29 mg/m2/year was reported [8]. In addition, Mn is probably related to desalination plants in the neighboring cities (Eilat, Taba and Haql) [3,9], where various heavy metals, including Mn, may be released with the discharged water of thermal desalination plants, depending on the metal alloys used [68,69].
Cd concentrations in seawater ranged between 0.2 and 0.76 µg/L, with an average of 0.51 µg/L (Table 1). Similarly, elevated levels of Cd were found in the southern GoA (Figure 5), where industrial activities are concentrated. Comparable levels of Cd have been reported by Shriadah et al. [53] for the northern Red Sea (offshore seawater), but higher than those for the average oceanic levels of about 0.07 μg/L [54]. Additionally, the average Cd content in surface seawater measured in the present study is greater than those for Saudi GoA and the Mediterranean Sea (Table 4).
In addition to desalination plants, the anthropogenically derived Cd (and other metals such as Pb and Co) is likely related to the discharge of cooling water and sewage in the southern GoA [26,70,71]. The average concentration of Cd from atmospheric dust varied from 0.012 mg/m2/year in Eilat city [31] to 0.04 mg/m2/year in Aqaba city [8].
Co content in surface seawater exhibited little spatial variations, with relatively higher levels were observed in the southern portion of GoA (Figure 5). Co ranged from 0.28–0.51 µg/L, with average Co values of about 0.38 µg/L (Table 1). Lower average Co contents were reported for the northern Red Sea offshore water [53] and for the Saudi GoA [9]. Co occurs in seawater at concentrations below 0.005 μg/L [59,60]. However, higher average value has been detected in the surface water of Mediterranean Sea [62]. Potential sources of Co in GoA seawater are likely similar to those of Co [9]. Dust particles collected from GoA region showed an average of 0.1 mg/m2/year [31].
Relatively elevated levels of Cu were detected in seawater samples, varying from 0.69–1.91 µg/L, with greater values observed for the southern sampling sites (Figure 5). These values are higher than the average ocean level [54] and the offshore water of Red Sea [53] (Table 3). An average Cu value of 0.2 μg/L was reported for the Mediterranean Sea [67,68]. However, elevated levels of Cu were detected in the Saudi GoA (at the Jordan–Saudi border). The atmospheric dry deposition flux of Cu to GoA region ranged from 0.38 mg/m2/year in Eilat [31] to 0.68 mg/m2/year in Aqaba city [8]. Elevated concentrations of Cu have been reported in Jordanian GoA water, in the range of 0.74–2.28 μg/L [58], and are higher than those measured in this study.
Pb levels in seawater samples varied from 0.17–0.79 µg/L, with a spatial pattern of increasing levels in the southern part of GoA. The average Pb value of 0.38 µg/L is comparable to those measured in offshore surface water sites of Red Sea [53], but higher than those reported for the Saudi GoA [9], the average ocean, and the Mediterranean surface seawater (Table 3). Pb is of anthropogenic origin, mainly from fossil fuel burning [72]. Elevated concentrations of Pb were found in the Jordanian GoA water ranging between 0.73 and 1.43 μg/L [56]. GoA receives high dry flux of Pb varying from 0.8 mg/m2/year in Eilat [31] to about 1.42 mg/m2/year in Aqaba city [8]. All metals tested were significantly correlated (Table 2) indicating that they may have been derived from similar sources.
4. Conclusions
GoA is a place for rich and diverse marine ecosystems. It is highly vulnerable to pollution, wherehuman activities in the bordering countries are intense, with high potential for water contamination. This requires cross-border collaboration to protect these naturally diverse but stressed ecosystems. This study intended to ascertain the seawater quality conditions along the eastern coast of GoA, Jordan. The sampling campaign coincided with a period of low levels of inorganic nutrients, low rates of algal growth with reduced microbial decomposition of dead algal cells. In addition to prevailing saline conditions of high temperatures and high evaporation rates, the water stratification and intense dust storms are the major contributing factors to the observed seawater chemistry. The surface distribution of water quality variables showed spatial variations with no specific patterns, except for metal contents, which exhibited southward increasing trends, closed to the industrial complex. The vast majority of these quality parameters showed relatively higher values compared to those of other regions.
Author Contributions
Conceptualization, A.A.A.-T. and M.R.; methodology, J.I.; software, A.A.-R.; validation, F.H., Y.N.; formal analysis, S.K.; investigation, A.A.A.-T.; resources, A.A.B.; data curation, Y.N.; writing—original draft preparation, A.A.A.-T.; writing—review and editing, F.H.; visualization, A.A.-R.; supervision, A.A.A.-T.; project administration, M.R. All authors have read and agreed to the published version of the manuscript.
Funding
This research received no external funding.
Conflicts of Interest
The authors declare no conflict of interest.
References
- Batayneh, A.T.; Al-Taani, A. Integrated resistivity and water chemistry for evaluation of groundwater quality of the Gulf of Aqaba coastal area in Saudi Arabia. Geosci. J. 2015, 20, 403–413. [Google Scholar] [CrossRef]
- Dullo, W.-C.; Gektidis, M.; Golubic, S.; Heiss, G.A.; Kampmann, H.; Kiene, W.; Kroll, D.K.; Kuhrau, M.L.; Radtke, G.; Reijmer, J.G.; et al. Factors controlling holocene reef growth: An interdisciplinary approach. Facies 1995, 32, 145–188. [Google Scholar] [CrossRef] [Green Version]
- Al-Rousan, S.A.; Al-Shloul, R.N.; Al-Horani, F.A.; Abu-Hilal, A.H. Heavy metal contents in growth bands of Porites corals: Record of anthropogenic and human developments from the Jordanian Gulf of Aqaba. Mar. Pollut. Bull. 2007, 54, 1912–1922. [Google Scholar] [CrossRef]
- Al-Taani, A.; Batayneh, A.; Mogren, S.; Nazzal, Y.; Ghrefat, H.; Zaman, H.; Elawadi, E. Groundwater Quality of Coastal Aquifer Systems in the Eastern Coast of the Gulf of Aqaba, Saudi Arabia. J. Appl. Sci. Agric. 2013, 8, 768–778. [Google Scholar]
- Batayneh, A.T.; Ghrefat, H.; Zumlot, T.T.; Elawadi, E.; Mogren, S.; Zaman, H.; Al-Taani, A.A.; Nazzal, Y.; Elwahaidi, M.; Elwaheidi, M. Assessing of Metals and Metalloids in Surface Sediments along the Gulf of Aqaba Coast, Northwestern Saudi Arabia. J. Coast. Res. 2014, 31, 163–176. [Google Scholar] [CrossRef]
- Al-Rousan, S.; Al-Moghrabi, S.; Pätzold, J.; Wefer, G. Environmental and biological effects on the stable oxygen isotope records of corals in the northern Gulf of Aqaba, Red Sea. Mar. Ecol. Prog. Ser. 2002, 239, 301–310. [Google Scholar] [CrossRef]
- Al-Rousan, S.; Al-Taani, A.A.; Rashdan, M. Effects of pollution on the geochemical properties of marine sediments across the fringing reef of Aqaba, Red Sea. Mar. Pollut. Bull. 2016, 110, 546–554. [Google Scholar] [CrossRef]
- Al-Taani, A.A.; Rashdan, M.; Khashashneh, S. Atmospheric dry deposition of mineral dust to the Gulf of Aqaba, Red Sea: Rate and trace elements. Mar. Pollut. Bull. 2015, 92, 252–258. [Google Scholar] [CrossRef]
- Al-Taani, A.A.; Batayneh, A.; Nazzal, Y.; Ghrefat, H.; Elawadi, E.; Zaman, H. Status of trace metals in surface seawater of the Gulf of Aqaba, Saudi Arabia. Mar. Pollut. Bull. 2014, 86, 582–590. [Google Scholar] [CrossRef]
- Batayneh, A.; Elawadi, E.; Zaman, H.; Al-Taani, A.A.; Nazzal, Y.; Ghrefat, H. Environmental Assessment of the Gulf of Aqaba Coastal Surface Waters, Saudi Arabia. J. Coast. Res. 2014, 30, 283–290. [Google Scholar] [CrossRef]
- Batayneh, A.; Zumlot, T.; Ghrefat, H.; Nazzal, N.; Qaisy, S.; Zaman, H.; Elawadi, E.; Mogren, S.; Bahkaly, I.; Al-Taani, A. Hydro chemical Facies and Ionic Ratios of the Coastal Groundwater Aquifer of Saudi Gulf of Aqaba: Implication for Seawater Intrusion. J. Coast. Res. 2014, 30, 75–87. [Google Scholar] [CrossRef]
- Al-Trabulsy, H.; Khater, A.; Habbani, F. Heavy elements concentrations, physiochemical characteristics and natural radionuclides levels along the Saudi coastline of the Gulf of Aqaba. Arab. J. Chem. 2013, 6. [Google Scholar] [CrossRef] [Green Version]
- Chase, Z.; Paytan, A.; Johnson, K.S.; Street, J.; Chen, Y. Input and cycling of iron in the Gulf of Aqaba, Red Sea. Glob. Biogeochem. Cycles 2006, 20. [Google Scholar] [CrossRef] [Green Version]
- Chase, Z.; Beck, A.; Biller, D.; Bruland, K.; Measures, C.; Sañudo-Wilhelmy, S. Evaluating the impact of atmospheric deposition on dissolved trace-metals in the Gulf of Aqaba, Red Sea. Mar. Chem. 2011, 126, 256–268. [Google Scholar] [CrossRef]
- El-Radaideh, N.; Al-Taani, A.A.; Al Khateeb, W.M. Status of sedimentation in King Talal Dam, case study from Jordan. Environ. Earth Sci. 2017, 76, 132. [Google Scholar] [CrossRef]
- El-Radaideh, N.; Al-Taani, A.A.; Al Khateeb, W.M. Characteristics and quality of reservoir sediments, Mujib Dam, Central Jordan, as a case study. Environ. Monit. Assess. 2017, 189, 143. [Google Scholar] [CrossRef]
- Yusuf, N.E.; Al-Taani, A.A.; Al-Fukaha, F.W.; Al-Shereideh, S.A. Sediments Transport across the Fringing Reef in the Gulf of Aqaba, Red Sea and the Implications on Live Corals. Basic Sci. Eng. 2011, 20, 35–52. [Google Scholar]
- Tegen, I.; Werner, M.; Harrison, S.P.; Kohfeld, K.E. Relative importance of climate and land use in determining present and future global soil dust emission. Geophys. Res. Lett. 2004, 31. [Google Scholar] [CrossRef] [Green Version]
- Woodward, S.; Roberts, D.L.; Betts, R.A. A simulation of the effect of climate change–induced desertification on mineral dust aerosol. Geophys. Res. Lett. 2005, 32. [Google Scholar] [CrossRef]
- Klinker, J.; Reiss, Z.; Kropach, C.; Levanon, I.; Harpaz, H.; Halicz, E.; Assaf, G. Observation on the circulation pattern in the Gulf of Aqaba, Red Sea. Isr. J. Earth Sci. 1976, 25, 85–103. [Google Scholar]
- Hulings, N.C. Currents in the Jordan Gulf of Aqaba. Dirasat 1979, 6, 21–33. [Google Scholar]
- Reiss, Z.; Hottinger, L. The Gulf of Aqaba, Ecological Micropaleontology, 1st ed.; Springer: Berlin/Heidelberg, Germany, 1984; ISBN 978-3-642-69787-6. [Google Scholar]
- Manasrah, R.; Abu-Hilal, A.; Rasheed, M. Physical and Chemical Properties of Seawater in the Gulf of Aqaba and Red Sea BT-Oceanographic and Biological Aspects of the Red Sea; Rasul, N.M.A., Stewart, I.C.F., Eds.; Springer: Cham, Switzerland, 2019; pp. 41–73. ISBN 978-3-319-99417-8. [Google Scholar]
- Manasrah, R.; Al-Zibdah, M.; Al-Ougaily, F.; Yusuf, N.; Al-Najjar, T. Seasonal changes of water properties and current in the northernmost Gulf of Aqaba, Red Sea. Ocean Sci. J. 2007, 42, 103–116. [Google Scholar] [CrossRef] [Green Version]
- Manasrah, R.; Mohammad, B.; Lass, H.; Fennel, W. Circulation and winter deep-water formation in the northern Red Sea. Oceanologia 2004, 46, 5–23. [Google Scholar]
- Abu-Hilal, A.; Badran, M.; de Vaugelas, J. Distribution of trace elements in Callichirus laurae burrows and nearby sediments in the gulf of Aqaba, Jordan (Red Sea). Mar. Environ. Res. 1988, 25, 233–248. [Google Scholar] [CrossRef]
- Abed, A.; Al Kuisi, M.; Abul Khair, H. Characterization of the Khamaseen (Spring) Dust in Jordan. Atmos. Environ. 2009, 43, 2868–2876. [Google Scholar] [CrossRef]
- APHA Standard Methods for Examination of Water and Wastewater, 18th ed.; American Public Health Association: Washington, DC, USA, 1998; pp. 45–60.
- Genin, A.; Lazar, B.; Brenner, S. Vertical mixing and coral death in the Red Sea following the eruption of Mount Pinatubo. Nature 1995, 377, 507–510. [Google Scholar] [CrossRef]
- Murray Stephen, P.; Hecht, A.; Babcock, A. Marine research. J. Mar. Res. 1984, 42, 265–287. [Google Scholar]
- Chen, Y.; Paytan, A.; Chase, Z.; Measures, C.; Beck, A.J.; Sañudo-Wilhelmy, S.A.; Post, A.F. Sources and fluxes of atmospheric trace elements to the Gulf of Aqaba, Red Sea. J. Geophys. Res. Atmos. 2008, 113. [Google Scholar] [CrossRef] [Green Version]
- Ryther, J.H.; Dunstan, W.M. Nitrogen, Phosphorus, and Eutrophication in the Coastal Marine Environment. Science 1971, 171, 1008–1013. [Google Scholar] [CrossRef] [Green Version]
- Badran, M.I.; Al Zibdah, M.K. Quality standard codes of reference of Jordanian coastal waters of the Gulf of Aqaba, Red Sea. Chem. Ecol. 2005, 21, 337–350. [Google Scholar] [CrossRef]
- Manasrah, R.; Alsaad, L.; Trabeen, K.; Rasheed, M.; Al-Absi, E.; Dixon, L.K.; Al-Sawalmih, A. Physical and chemical properties of seawater during 2013–2015 in the 400 m water column in the northern Gulf of Aqaba, Red Sea. Environ. Monit. Assess. 2020, 192, 188. [Google Scholar] [CrossRef] [PubMed]
- Al-Rshaidat, M.M.D.; Segonds-Pichon, A.; Salem, M. Chlorophyll-nutrient relationships of an artificial inland lagoon equipped with seawater replenishment system in the Northern Red sea (Gulf Of Aqaba). J. Mar. Sci. Eng. 2020, 8, 147. [Google Scholar] [CrossRef] [Green Version]
- Chen, S.; Ling, J.; Jean-paul, B. Nitrification kinetics of biofilm as affected by water quality factors. Aquac. Eng. 2006, 34, 179–197. [Google Scholar] [CrossRef]
- Al-Taani, A.A.; Al-Qudah, K.A. Investigation of desert subsoil nitrate in Northeastern Badia of Jordan. Sci. Total Environ. 2013, 442, 111–115. [Google Scholar] [CrossRef] [PubMed]
- Masserini, R.T.J. Ammonium, Nitrate, and Nitrite in the Oligotrophic Ocean: Detection Methods and Usefulness as Tracers; University of South Florida: Tampa, FL, USA, 2005. [Google Scholar]
- Clark, I.; Timlin, R.; Bourbonnais, A.; Jones, K.; Lafleur, D.; Wickens, K. Origin and Fate of Industrial Ammonium in Anoxic Ground Water—15N Evidence for Anaerobic Oxidation (Anammox). Groundw. Monit. Remediat. 2008, 28, 73–82. [Google Scholar] [CrossRef]
- Sbarbati, C.; Colombani, N.; Mastrocicco, M.; Aravena, R.; Petitta, M. Performance of different assessment methods to evaluate contaminant sources and fate in a coastal aquifer. Environ. Sci. Pollut. Res. 2015, 22. [Google Scholar] [CrossRef]
- Jickells, T.; An, Z.; Andersen, K.; Baker, A.R.; Bergametti, G.; Brooks, N.; Cao, J.; Boyd, P.; Duce, R.; Hunter, K.; et al. Global Iron Connections Between Desert Dust, Ocean Biogeochemistry, and Climate. Science 2005, 308, 67–71. [Google Scholar] [CrossRef] [Green Version]
- Dulac, F.; Moulin, C.; Lambert, C.E.; Guillard, F.; Poitou, J.; Guelle, W.; Quetel, C.R.; Schneider, X.; Ezat, U. Quantitative Remote Sensing of African Dust Transport to the Mediterranean. In The Impact of Desert Dust Across the Mediterranean; Springer: Berlin/Heidelberg, Germany, 1996; pp. 25–49. ISBN 978-94-017-3354-0. [Google Scholar]
- Bergametti, G.; Remoudaki, E.; Losno, R.; Steiner, E.; Chatenet, B.; Buat-Menard, P. Source, transport and deposition of atmospheric phosphorus over the Northwestern Mediterranean. J. Atmos. Chem. 1992, 14, 501–513. [Google Scholar] [CrossRef]
- Bishop, J.K.B.; Davis, R.E.; Sherman, J.T. Robotic observations of dust storm enhancement of carbon biomass in the North Pacific. Science 2002, 298, 817–821. [Google Scholar] [CrossRef] [Green Version]
- Duce, R.A.; LaRoche, J.; Altieri, K.; Arrigo, K.R.; Baker, A.R.; Capone, D.G.; Cornell, S.; Dentener, F.; Galloway, J.; Ganeshram, R.S.; et al. Impacts of Atmospheric Anthropogenic Nitrogen on the Open Ocean. Science 2008, 320, 893–897. [Google Scholar] [CrossRef] [Green Version]
- Badran, M.I. Dissolved Oxygen, Chlorophyll a and Nutrients: Seasonal Cycles in Waters of the Gulf of Aquaba, Red Sea. Aquat. Ecosyst. Health Manag. 2001, 4, 139–150. [Google Scholar] [CrossRef]
- Al-Qutob, M.; Häse, C.; Tilzer, M.; Lazar, B. Phytoplankton drive nitrite dynamics in the Gulf of Aqaba, Red Sea. Marine Ecology Progress Series. Mar. Ecol. Prog. Ser. 2002, 239, 233–239. [Google Scholar] [CrossRef]
- Eppley, R.W.; Renger, E.H.; Venrick, E.L.; Mullin, M.M. A Study Of Plankton Dynamics and Nutrient Cycling in the Central Gyre of the North Pacific Ocean. Limnol. Oceanogr. 1973, 18, 534–551. [Google Scholar] [CrossRef]
- Kiefer, D.A.; Atkinson, A.C. Cycling of nitrogen by plankton: A hypothetical description based upon efficiency of energy conversion. J. Mar. Res. 1984, 42, 655–675. [Google Scholar] [CrossRef]
- Thiel, H.; Weikert, H.; Karbe, L. Risk assessment for mining metalliferous muds in the deep Red Sea. Ambio 1986, 15, 34–41. [Google Scholar]
- Abdel-Aal, E.A.; Farid, M.E.; Hassan, F.S.M.; Adila, E.M. Desalination of Red Sea water using both electrodialysis and reverse osmosis as complementary methods. Egypt. J. Pet. 2015, 24, 71–75. [Google Scholar] [CrossRef] [Green Version]
- Al-Moubaraki, A.; Al-Judaibi, A.; Asiri, M. Corrosion of C-Steel in the Red Sea: Effect of Immersion Time and Inhibitor Concentration. Int. J. Electrochem. Sci. 2015, 10, 4252–4278. [Google Scholar]
- Shriadah, M.A.; Okbah, M.A.; El-Deek, M.S. Trace Metals in the Water Columns of the Red Sea and the Gulf of Aqaba, Egypt. Water Air Soil Pollut. 2004, 153, 115–124. [Google Scholar] [CrossRef]
- Broecker, W.S.; Peng, T.H. Tracers in the Sea. In The Lamont-Doherty Geological Observatory; Columbia University: New York, NY, USA, 1982; pp. 45–60. [Google Scholar]
- Tankere, S.P.C.; Statham, P.J. Distribution of dissolved Cd, Cu, Ni and Zn in the Adriatic Sea. Mar. Pollut. Bull. 1996, 32, 623–630. [Google Scholar] [CrossRef]
- Guerzoni, S.; Chester, R.; Dulac, F.; Herut, B.; Loÿe-Pilot, M.-D.; Measures, C.; Migon, C.; Molinaroli, E.; Moulin, C.; Rossini, P.; et al. The role of atmospheric deposition in the biogeochemistry of the Mediterranean Sea. Prog. Oceanogr. 1999, 44, 147–190. [Google Scholar] [CrossRef]
- Koçak, M.; Kubilay, N.; Herut, B.; Nimmo, M. Dry atmospheric fluxes of trace metals (Al, Fe, Mn, Pb, Cd, Zn, Cu) over the Levantine Basin: A refined assessment. Atmos. Environ. 2005, 39, 7330–7341. [Google Scholar] [CrossRef]
- Marine Science Station (MSS). Environmental Appraisal of the Jordanian Coast of the Gulf of Aqaba; Unpublished Report; MSS: Aqaba, Jordan, 1999; p. 88. [Google Scholar]
- Danielsson, L.-G. Cadmium, cobalt, copper, iron, lead, nickel and zinc in Indian Ocean water. Mar. Chem. 1980, 8, 199–215. [Google Scholar] [CrossRef]
- Millero, F.J. Chemical Oceanography, 2nd ed.; CRC Press: New York, NY, USA, 1996; ISBN1 0849384230. ISBN2 9780849384233. [Google Scholar]
- El-Moselhy, K.; Hamed, M. Impact of land-based activities on hydrographic conditions and levels of heavy metals in water and sediments along the Mediterranean coast of Egypt. Egypt. J. Aquat. Res. 2006, 32, 63–82. [Google Scholar]
- Migon, C.; Nicolas, E. The trace metal recycling component in the North-western Mediterranean. Mar. Pollut. Bull. 1998, 36, 273–277. [Google Scholar] [CrossRef]
- Emelyanov, E.M.; Shimkus, K.M. Geochemistry and Sedimentology of the Mediterranean Sea. Geochem. Sedimentol. Mediterr. Sea 1986. [Google Scholar] [CrossRef]
- Furness, R.W.; Rainbow, P.S. (Eds.) Heavy Metals in the Marine Environment; CRC Press: Boca Raton, FL, USA, 1990. [Google Scholar]
- Laumond, F.; Copin-Montegut, G.; Courau, P.; Nicolas, E. Cadmium, copper and lead in the western Mediterranean Sea. Mar. Chem. 1984, 15, 251–261. [Google Scholar] [CrossRef]
- Boyle, E.A.; Chapnick, S.D.; Bai, X.X.; Spivack, A. Trace metal enrichments in the Mediterranean Sea. Earth Planet. Sci. Lett. 1985, 74, 405–419. [Google Scholar] [CrossRef]
- Saager, P.M.; Schijf, J.; de Baar, H.J.W. Trace-metal distributions in seawater and anoxic brines in the eastern Mediterranean Sea. Geochim. Cosmochim. Acta 1993, 57, 1419–1432. [Google Scholar] [CrossRef] [Green Version]
- Höpner, T.; Lattemann, S.; Hoepner, T.; Lattemann, S. Chemical Impacts from Seawater Desalination Plants—A Case Study of the Northern Red Sea. Desalination 2002, 152, 133–140. [Google Scholar] [CrossRef]
- Höpner, T. A procedure for environmental impact assessments (EIA) for seawater desalination plants. Desalination 1999, 124. [Google Scholar] [CrossRef]
- Abu-Hilal, A.H.; Badran, M.M. Effect of pollution sources on metal concentration in sediment cores from the Gulf of Aqaba (red sea). Mar. Pollut. Bull. 1990, 21, 190–197. [Google Scholar] [CrossRef]
- Abu-Hilal, A. Observations on heavy metal geochemical association in marine sediments of the Jordan Gulf. of Aqaba. Mar. Pollut. Bull. 1993, 26, 85–90. [Google Scholar] [CrossRef]
- El-Radaideh, N.; Al-Taani, A. Geo-environmental study of heavy metals of the agricultural highway soils, NW Jordan. Arab. J. Geosci. 2018, 11. [Google Scholar] [CrossRef]
Figure 1.
Location map of the Gulf of Aqaba (GoA) and sampling sites.

Figure 2.
The electrical conductivity (EC), total dissolved solids (TDS), and pH of GoA coastal water.
Figure 2.
The electrical conductivity (EC), total dissolved solids (TDS), and pH of GoA coastal water.

Figure 3.
NO3−, NH4+ and PO43− in coastal water of the GoA, Jordan.

Figure 4.
The spatial distributions of Na+, K+, Mg2+, Sr, Ca2+, SO42− and Cl− concentrations in surface seawater of GoA, Jordan.
Figure 4.
The spatial distributions of Na+, K+, Mg2+, Sr, Ca2+, SO42− and Cl− concentrations in surface seawater of GoA, Jordan.

Figure 5.
Metal contents in surface seawater in GoA, Jordan.

Table 1.
Characteristics of surface seawater layer, GoA, Jordan.
| S.N. | pH | EC | TDS | TA | Cl− | NO3− | SO42− | PO43− | NH4+ | Ca2+ | Mg2+ | Na+ | K+ | Sr | Cd | Co | Cr | Cu | Fe | Mn | Pb | Zn |
|---|---|---|---|---|---|---|---|---|---|---|---|---|---|---|---|---|---|---|---|---|---|---|
| mS/cm | g/L | mg/L | µg/L | |||||||||||||||||||
| 1 | 8.32 | 52.27 | 41.97 | 130 | 24,592.68 | 15.29 | 382.26 | 0.27 | 16.57 | 442.45 | 2295.70 | 11,165.80 | 591.78 | 9.88 | 0.20 | 0.38 | 1.01 | 0.91 | 0.94 | 0.76 | 0.19 | 3.93 |
| 2 | 8.20 | 52.12 | 41.89 | 137 | 24,992.25 | 13.80 | 382.12 | 0.27 | 15.19 | 443.91 | 2283.90 | 10,759.90 | 587.75 | 9.98 | 0.28 | 0.31 | 0.97 | 0.76 | 1.23 | 0.74 | 0.23 | 5.10 |
| 3 | 8.30 | 52.48 | 42.74 | 136 | 25,392.13 | 14.26 | 381.29 | 0.28 | 15.35 | 486.99 | 2355.90 | 11,736.90 | 602.31 | 10.40 | 0.40 | 0.31 | 0.96 | 1.18 | 0.75 | 0.76 | 0.26 | 5.23 |
| 4 | 8.41 | 51.56 | 41.34 | 138 | 23,72.94 | 13.50 | 407.45 | 0.26 | 14.15 | 433.9 | 2253.90 | 9891.20 | 547.82 | 9.44 | 0.49 | 0.33 | 1.32 | 0.87 | 1.40 | 0.70 | 0.17 | 4.45 |
| 5 | 8.33 | 52.40 | 42.10 | 128 | 25,632.05 | 12.65 | 396.85 | 0.29 | 13.08 | 444.76 | 2312.40 | 11,571.90 | 579.97 | 9.93 | 0.42 | 0.37 | 1.38 | 0.69 | 1.29 | 0.70 | 0.22 | 5.70 |
| 6 | 8.24 | 52.41 | 42.15 | 140 | 25,192.19 | 14.01 | 401.12 | 0.26 | 15.46 | 468.79 | 2320.90 | 11,610.50 | 570.23 | 10.03 | 0.38 | 0.38 | 1.38 | 1.31 | 0.84 | 0.86 | 0.34 | 5.51 |
| 7 | 8.33 | 51.42 | 41.22 | 136 | 23,792.62 | 12.78 | 386.94 | 0.27 | 14.83 | 423.32 | 2246.20 | 9541.50 | 581.90 | 9.19 | 0.26 | 0.34 | 1.28 | 1.71 | 1.11 | 0.73 | 0.23 | 6.41 |
| 8 | 8.15 | 52.74 | 42.34 | 139 | 24,792.31 | 13.88 | 379.78 | 0.25 | 14.06 | 470.41 | 2330.20 | 11,309.00 | 594.68 | 10.02 | 0.50 | 0.37 | 1.35 | 1.11 | 0.97 | 0.87 | 0.27 | 6.44 |
| 9 | 8.22 | 51.90 | 41.41 | 142 | 22,253.10 | 12.35 | 380.60 | 0.25 | 13.67 | 432.60 | 2258.90 | 10,065.40 | 558.09 | 9.40 | 0.46 | 0.29 | 1.29 | 1.30 | 1.28 | 0.87 | 0.21 | 5.14 |
| 10 | 8.23 | 52.42 | 42.34 | 147 | 24,792.31 | 13.80 | 392.86 | 0.24 | 14.55 | 480.36 | 2350.30 | 10,520.90 | 711.29 | 10.04 | 0.44 | 0.34 | 1.38 | 1.52 | 1.41 | 0.88 | 0.24 | 4.87 |
| 11 | 8.49 | 52.68 | 42.34 | 150 | 25,392.13 | 14.48 | 381.29 | 0.22 | 15.02 | 473.00 | 2349.10 | 11,358.90 | 580.34 | 10.03 | 0.48 | 0.39 | 1.25 | 0.91 | 1.16 | 0.84 | 0.28 | 5.40 |
| 12 | 8.02 | 52.13 | 41.78 | 153 | 23,992.56 | 13.75 | 359.81 | 0.17 | 14.98 | 444.55 | 2284.60 | 10,394.50 | 619.86 | 9.97 | 0.48 | 0.29 | 1.30 | 0.81 | 1.00 | 0.77 | 0.27 | 4.02 |
| 13 | 8.33 | 51.48 | 41.54 | 143 | 22,172.88 | 14.82 | 395.20 | 0.20 | 15.93 | 438.58 | 2261.00 | 9784.60 | 604.60 | 9.55 | 0.50 | 0.38 | 1.19 | 0.79 | 0.78 | 0.76 | 0.30 | 3.63 |
| 14 | 8.26 | 52.29 | 42.10 | 148 | 22,593.46 | 13.41 | 400.98 | 0.19 | 14.72 | 459.73 | 2315.50 | 10,456.20 | 567.31 | 10.37 | 0.44 | 0.31 | 1.39 | 1.50 | 0.94 | 0.83 | 0.26 | 6.90 |
| 15 | 8.31 | 52.69 | 42.42 | 146 | 25,591.75 | 15.33 | 391.07 | 0.20 | 16.44 | 429.90 | 2251.70 | 12,646.90 | 555.55 | 9.62 | 0.52 | 0.36 | 1.30 | 1.30 | 1.26 | 0.79 | 0.26 | 7.05 |
| 16 | 8.24 | 52.40 | 42.10 | 146 | 25,792.00 | 15.29 | 396.85 | 0.22 | 16.91 | 458.40 | 2313.50 | 12,437.90 | 712.91 | 10.08 | 0.40 | 0.34 | 1.40 | 0.99 | 1.12 | 0.84 | 0.28 | 5.52 |
| 17 | 8.18 | 51.89 | 41.34 | 152 | 24,292.47 | 12.73 | 387.35 | 0.18 | 13.65 | 429.54 | 2251.60 | 9724.70 | 598.42 | 9.64 | 0.43 | 0.34 | 1.40 | 1.30 | 1.05 | 0.68 | 0.28 | 3.78 |
| 18 | 8.18 | 52.87 | 42.70 | 142 | 25,991.94 | 13.58 | 390.52 | 0.19 | 14.24 | 483.88 | 2354.80 | 12,420.90 | 579.69 | 10.15 | 0.44 | 0.28 | 1.22 | 1.31 | 0.80 | 0.79 | 0.28 | 4.54 |
| 19 | 8.10 | 51.91 | 41.62 | 140 | 24,592.37 | 12.22 | 402.91 | 0.16 | 14.44 | 439.57 | 2270.70 | 9745.90 | 572.09 | 9.62 | 0.44 | 0.36 | 1.41 | 1.30 | 1.37 | 0.76 | 0.26 | 5.40 |
| 20 | 8.21 | 52.45 | 42.34 | 147 | 25,991.32 | 12.99 | 405.53 | 0.16 | 14.44 | 484.87 | 2350.90 | 10,592.90 | 512.84 | 10.42 | 0.42 | 0.38 | 1.30 | 1.12 | 1.22 | 0.81 | 0.32 | 5.37 |
| 21 | 8.34 | 52.15 | 41.92 | 150 | 24,592.37 | 13.20 | 351.27 | 0.16 | 15.00 | 441.12 | 2280.10 | 10,608.90 | 559.62 | 9.17 | 0.44 | 0.39 | 1.80 | 0.99 | 0.82 | 1.08 | 0.40 | 6.11 |
| 22 | 8.15 | 52.51 | 42.24 | 152 | 24,792.31 | 15.24 | 316.99 | 0.22 | 13.33 | 468.72 | 2327.10 | 10,740.70 | 600.64 | 10.27 | 0.62 | 0.41 | 1.75 | 1.01 | 1.36 | 1.03 | 0.49 | 7.26 |
| 23 | 8.26 | 51.83 | 41.48 | 150 | 22,253.41 | 12.78 | 398.64 | 0.16 | 13.92 | 438.41 | 2259.00 | 9889.90 | 612.91 | 9.56 | 0.67 | 0.46 | 1.70 | 1.06 | 1.62 | 0.96 | 0.47 | 7.63 |
| 24 | 8.38 | 51.69 | 41.62 | 149 | 22,293.09 | 14.26 | 391.34 | 0.22 | 16.48 | 438.21 | 2269.30 | 10,147.90 | 695.98 | 9.58 | 0.75 | 0.50 | 1.90 | 1.38 | 1.79 | 0.99 | 0.66 | 7.93 |
| 25 | 8.21 | 52.14 | 41.99 | 146 | 24,592.37 | 13.63 | 393.82 | 0.16 | 15.29 | 444.22 | 2295.40 | 11,180.10 | 606.13 | 9.99 | 0.68 | 0.51 | 1.73 | 1.50 | 1.66 | 1.02 | 0.59 | 8.22 |
| 26 | 8.37 | 52.44 | 42.22 | 148 | 25,191.57 | 13.46 | 364.49 | 0.16 | 16.08 | 463.92 | 2325.70 | 11,720.90 | 597.54 | 10.26 | 0.75 | 0.46 | 1.74 | 1.69 | 1.87 | 1.05 | 0.73 | 8.23 |
| 27 | 8.36 | 52.40 | 42.12 | 156 | 24,991.01 | 15.5 | 386.11 | 0.22 | 15.38 | 460.75 | 2317.40 | 11,536.90 | 577.79 | 10.18 | 0.76 | 0.48 | 1.66 | 1.70 | 1.87 | 1.04 | 0.79 | 7.58 |
| 28 | 8.00 | 52.57 | 42.46 | 154 | 23,792.62 | 13.16 | 381.84 | 0.17 | 14.01 | 483.45 | 2352.20 | 10,865.90 | 596.38 | 10.40 | 0.72 | 0.49 | 1.75 | 1.51 | 1.82 | 1.14 | 0.70 | 7.86 |
| 29 | 8.31 | 51.55 | 41.34 | 162 | 22,533.01 | 15.12 | 395.61 | 0.21 | 16.40 | 430.51 | 2252.60 | 9934.20 | 564.46 | 9.37 | 0.71 | 0.46 | 1.72 | 1.89 | 1.88 | 1.12 | 0.76 | 8.17 |
| 30 | 8.32 | 51.43 | 41.28 | 160 | 23,152.82 | 14.09 | 390.24 | 0.19 | 15.86 | 425.14 | 2249.70 | 9681.40 | 581.45 | 9.21 | 0.72 | 0.50 | 1.91 | 1.91 | 1.94 | 1.15 | 0.76 | 8.28 |
| Mean | 8.26 | 52.17 | 41.95 | 146 | 24,326.40 | 13.85 | 385.77 | 0.21 | 14.98 | 452.13 | 2298.01 | 10,801.44 | 594.08 | 9.86 | 0.51 | 0.38 | 1.44 | 1.24 | 1.29 | 0.88 | 0.38 | 6.05 |
| Min | 8.00 | 51.42 | 41.22 | 128 | 22,172.88 | 12.22 | 316.99 | 0.16 | 13.08 | 423.32 | 2246.20 | 9541.50 | 512.84 | 9.17 | 0.20 | 0.28 | 0.96 | 0.69 | 0.75 | 0.68 | 0.17 | 3.63 |
| Max | 8.49 | 52.87 | 42.74 | 162 | 25,991.94 | 15.50 | 407.45 | 0.29 | 16.91 | 486.99 | 2355.90 | 12,646.90 | 712.91 | 10.42 | 0.76 | 0.51 | 1.91 | 1.91 | 1.94 | 1.15 | 0.79 | 8.28 |
| STD | 0.11 | 0.42 | 0.44 | 8.06 | 1211.19 | 0.96 | 18.22 | 0.04 | 1.034 | 20.03 | 38.05 | 891.41 | 44.03 | 0.38 | 0.15 | 0.07 | 0.27 | 0.34 | 0.37 | 0.14 | 0.20 | 1.49 |
| Median | 8.26 | 52.28 | 42.05 | 146.50 | 24,592.53 | 13.78 | 390.38 | 0.21 | 14.99 | 444.39 | 2295.55 | 10,674.80 | 584.83 | 9.98 | 0.47 | 0.38 | 1.38 | 1.30 | 1.25 | 0.84 | 0.28 | 5.61 |
| Co. Var | 0.01 | 0.01 | 0.01 | 0.05 | 0.05 | 0.068 | 0.05 | 0.27 | 0.07 | 0.04 | 0.02 | 0.08 | 0.07 | 9.86 | 0.51 | 0.38 | 1.44 | 1.24 | 1.29 | 0.88 | 0.38 | 6.05 |
Table 2.
Correlation matrices for surface water quality parameters.
| Cl− | NO3− | SO42− | PO43− | NH4+ | Ca2+ | Mg2+ | Na+ | K+ | Cd | Co | Cr | Cu | Fe | Mn | Pb | Sr | Zn | pH | EC | TDS | TA | |
|---|---|---|---|---|---|---|---|---|---|---|---|---|---|---|---|---|---|---|---|---|---|---|
| 1.00 | 0.14 | −0.11 | 0.14 | −0.03 | 0.54 | 0.60 | 0.74 | −0.07 | −0.33 | −0.25 | −0.32 | −0.23 | −0.27 | −0.26 | −0.24 | 0.52 | −0.21 | −0.05 | 0.74 | 0.70 | −0.31 | Cl− |
| 1.00 | −0.20 | 0.18 | 0.65 | 0.10 | 0.11 | 0.42 | 0.25 | 0.16 | 0.21 | −0.01 | 0.01 | 0.04 | 0.22 | 0.24 | 0.17 | 0.12 | 0.29 | 0.19 | 0.25 | 0.23 | NO3− | |
| 1.00 | 0.10 | 0.16 | −0.13 | −0.15 | −0.08 | −0.05 | −0.12 | −0.03 | −0.22 | 0.15 | 0.06 | −0.32 | −0.16 | −0.12 | −0.11 | 0.18 | −0.24 | −0.18 | −0.21 | SO42− | ||
| 1.00 | −0.02 | 0.01 | 0.06 | 0.15 | 0.06 | −0.49 | −0.36 | −0.53 | −0.24 | −0.27 | −0.43 | −0.42 | −0.01 | −0.30 | 0.30 | 0.02 | 0.05 | −0.65 | PO43− | |||
| 1.00 | −0.18 | −0.18 | 0.24 | 0.28 | 0.09 | 0.26 | 0.03 | 0.23 | 0.11 | 0.20 | 0.28 | −0.12 | 0.18 | 0.38 | −0.14 | −0.03 | 0.16 | NH4+ | ||||
| 1.00 | 0.97 | 0.52 | 0.11 | −0.01 | −0.10 | −0.16 | −0.06 | −0.19 | 0.07 | −0.01 | 0.85 | −0.05 | −0.24 | 0.77 | 0.86 | −0.03 | Ca | |||||
| 1.00 | 0.59 | 0.12 | −0.05 | −0.09 | −0.16 | −0.08 | −0.18 | 0.07 | −0.02 | 0.87 | −0.04 | −0.18 | 0.82 | 0.88 | −0.10 | Mg | ||||||
| 1.00 | 0.09 | −0.07 | −0.13 | −0.21 | −0.14 | −0.20 | −0.05 | −0.06 | 0.57 | 0.04 | 0.05 | 0.83 | 0.81 | −0.22 | Na | |||||||
| 1.00 | 0.11 | 0.10 | 0.15 | −0.01 | 0.11 | 0.08 | 0.08 | 0.11 | 0.01 | −0.07 | 0.01 | 0.06 | 0.08 | K | ||||||||
| 1.00 | 0.79 | 0.83 | 0.50 | 0.80 | 0.78 | 0.88 | 0.01 | 0.76 | 0.05 | −0.11 | −0.07 | 0.72 | Cd | |||||||||
| 1.00 | 0.80 | 0.48 | 0.77 | 0.78 | 0.88 | −0.09 | 0.78 | 0.18 | −0.20 | −0.14 | 0.51 | Co | ||||||||||
| 1.00 | 0.52 | 0.72 | 0.84 | 0.82 | −0.20 | 0.79 | 0.03 | −0.22 | −0.23 | 0.69 | Cr | |||||||||||
| 1.00 | 0.57 | 0.57 | 0.65 | −0.11 | 0.64 | 0.04 | −0.19 | −0.14 | 0.51 | Cu | ||||||||||||
| 1.00 | 0.66 | 0.80 | −0.10 | 0.75 | 0.09 | −0.26 | −0.26 | 0.53 | Fe | |||||||||||||
| 1.00 | 0.88 | −0.03 | 0.80 | 0.00 | −0.04 | 0.01 | 0.71 | Mn | ||||||||||||||
| 1.00 | 0.01 | 0.81 | 0.07 | −0.15 | −0.08 | 0.71 | Pb | |||||||||||||||
| 1.00 | 0.00 | −0.32 | 0.76 | 0.81 | −0.07 | Sr | ||||||||||||||||
| 1.00 | 0.11 | −0.04 | 0.00 | 0.50 | Zn | |||||||||||||||||
| 1.00 | −0.22 | −0.16 | −0.09 | pH | ||||||||||||||||||
| 1.00 | 0.94 | −0.14 | EC | |||||||||||||||||||
| 1.00 | −0.16 | TDS | ||||||||||||||||||||
| 1.00 | TA |
Table 3.
Comparison of water quality parameters in different regions of the Red Sea and GoA.
| pH | EC | TDS | TA | Cl− | NO3− | SO42− | PO43− | NH4+ | Ca | Mg | Na | K | |
|---|---|---|---|---|---|---|---|---|---|---|---|---|---|
| mS/cm | g/L | mg/L | mg/L | ||||||||||
| Present study (northernmost Red Sea) | 8.26 | 52.17 | 41.95 | 146 | 24,326.4 | 13.85 | 385.77 | 0.21 | 14.98 | 452.13 | 2298.01 | 10,801.44 | 594.08 |
| Northern Red Sea (Egypt) [51] | 7.7 | 60.3 | 42 | 98 | 23,607 | 12.4 | 1260 | 0.39 | 738 | 1570 | 12,339 | 287 | |
| Central Red Sea (Jeddah, Saudi) [52] | 8.1 | 72.55 | 43.55 | 128 | 22,336 | 1 | 2440 | <0.13 | - | 496 | 1512 | 11,920 | - |
© 2020 by the authors. Licensee MDPI, Basel, Switzerland. This article is an open access article distributed under the terms and conditions of the Creative Commons Attribution (CC BY) license (http://creativecommons.org/licenses/by/4.0/).
Share and Cite
MDPI and ACS Style
Al-Taani, A.A.; Rashdan, M.; Nazzal, Y.; Howari, F.; Iqbal, J.; Al-Rawabdeh, A.; Al Bsoul, A.; Khashashneh, S. Evaluation of the Gulf of Aqaba Coastal Water, Jordan. Water 2020, 12, 2125. https://0-doi-org.brum.beds.ac.uk/10.3390/w12082125
AMA Style
Al-Taani AA, Rashdan M, Nazzal Y, Howari F, Iqbal J, Al-Rawabdeh A, Al Bsoul A, Khashashneh S. Evaluation of the Gulf of Aqaba Coastal Water, Jordan. Water. 2020; 12(8):2125. https://0-doi-org.brum.beds.ac.uk/10.3390/w12082125
Chicago/Turabian StyleAl-Taani, Ahmed A., Maen Rashdan, Yousef Nazzal, Fares Howari, Jibran Iqbal, Abdulla Al-Rawabdeh, Abeer Al Bsoul, and Safaa Khashashneh. 2020. "Evaluation of the Gulf of Aqaba Coastal Water, Jordan" Water 12, no. 8: 2125. https://0-doi-org.brum.beds.ac.uk/10.3390/w12082125
Note that from the first issue of 2016, this journal uses article numbers instead of page numbers. See further details here.