Assessing Potable Water Quality and Identifying Areas of Waterborne Diarrheal and Fluorosis Health Risks Using Spatial Interpolation in Peshawar, Pakistan

 , , and
Abstract
:1. Introduction
2. Study Area and Data Collection
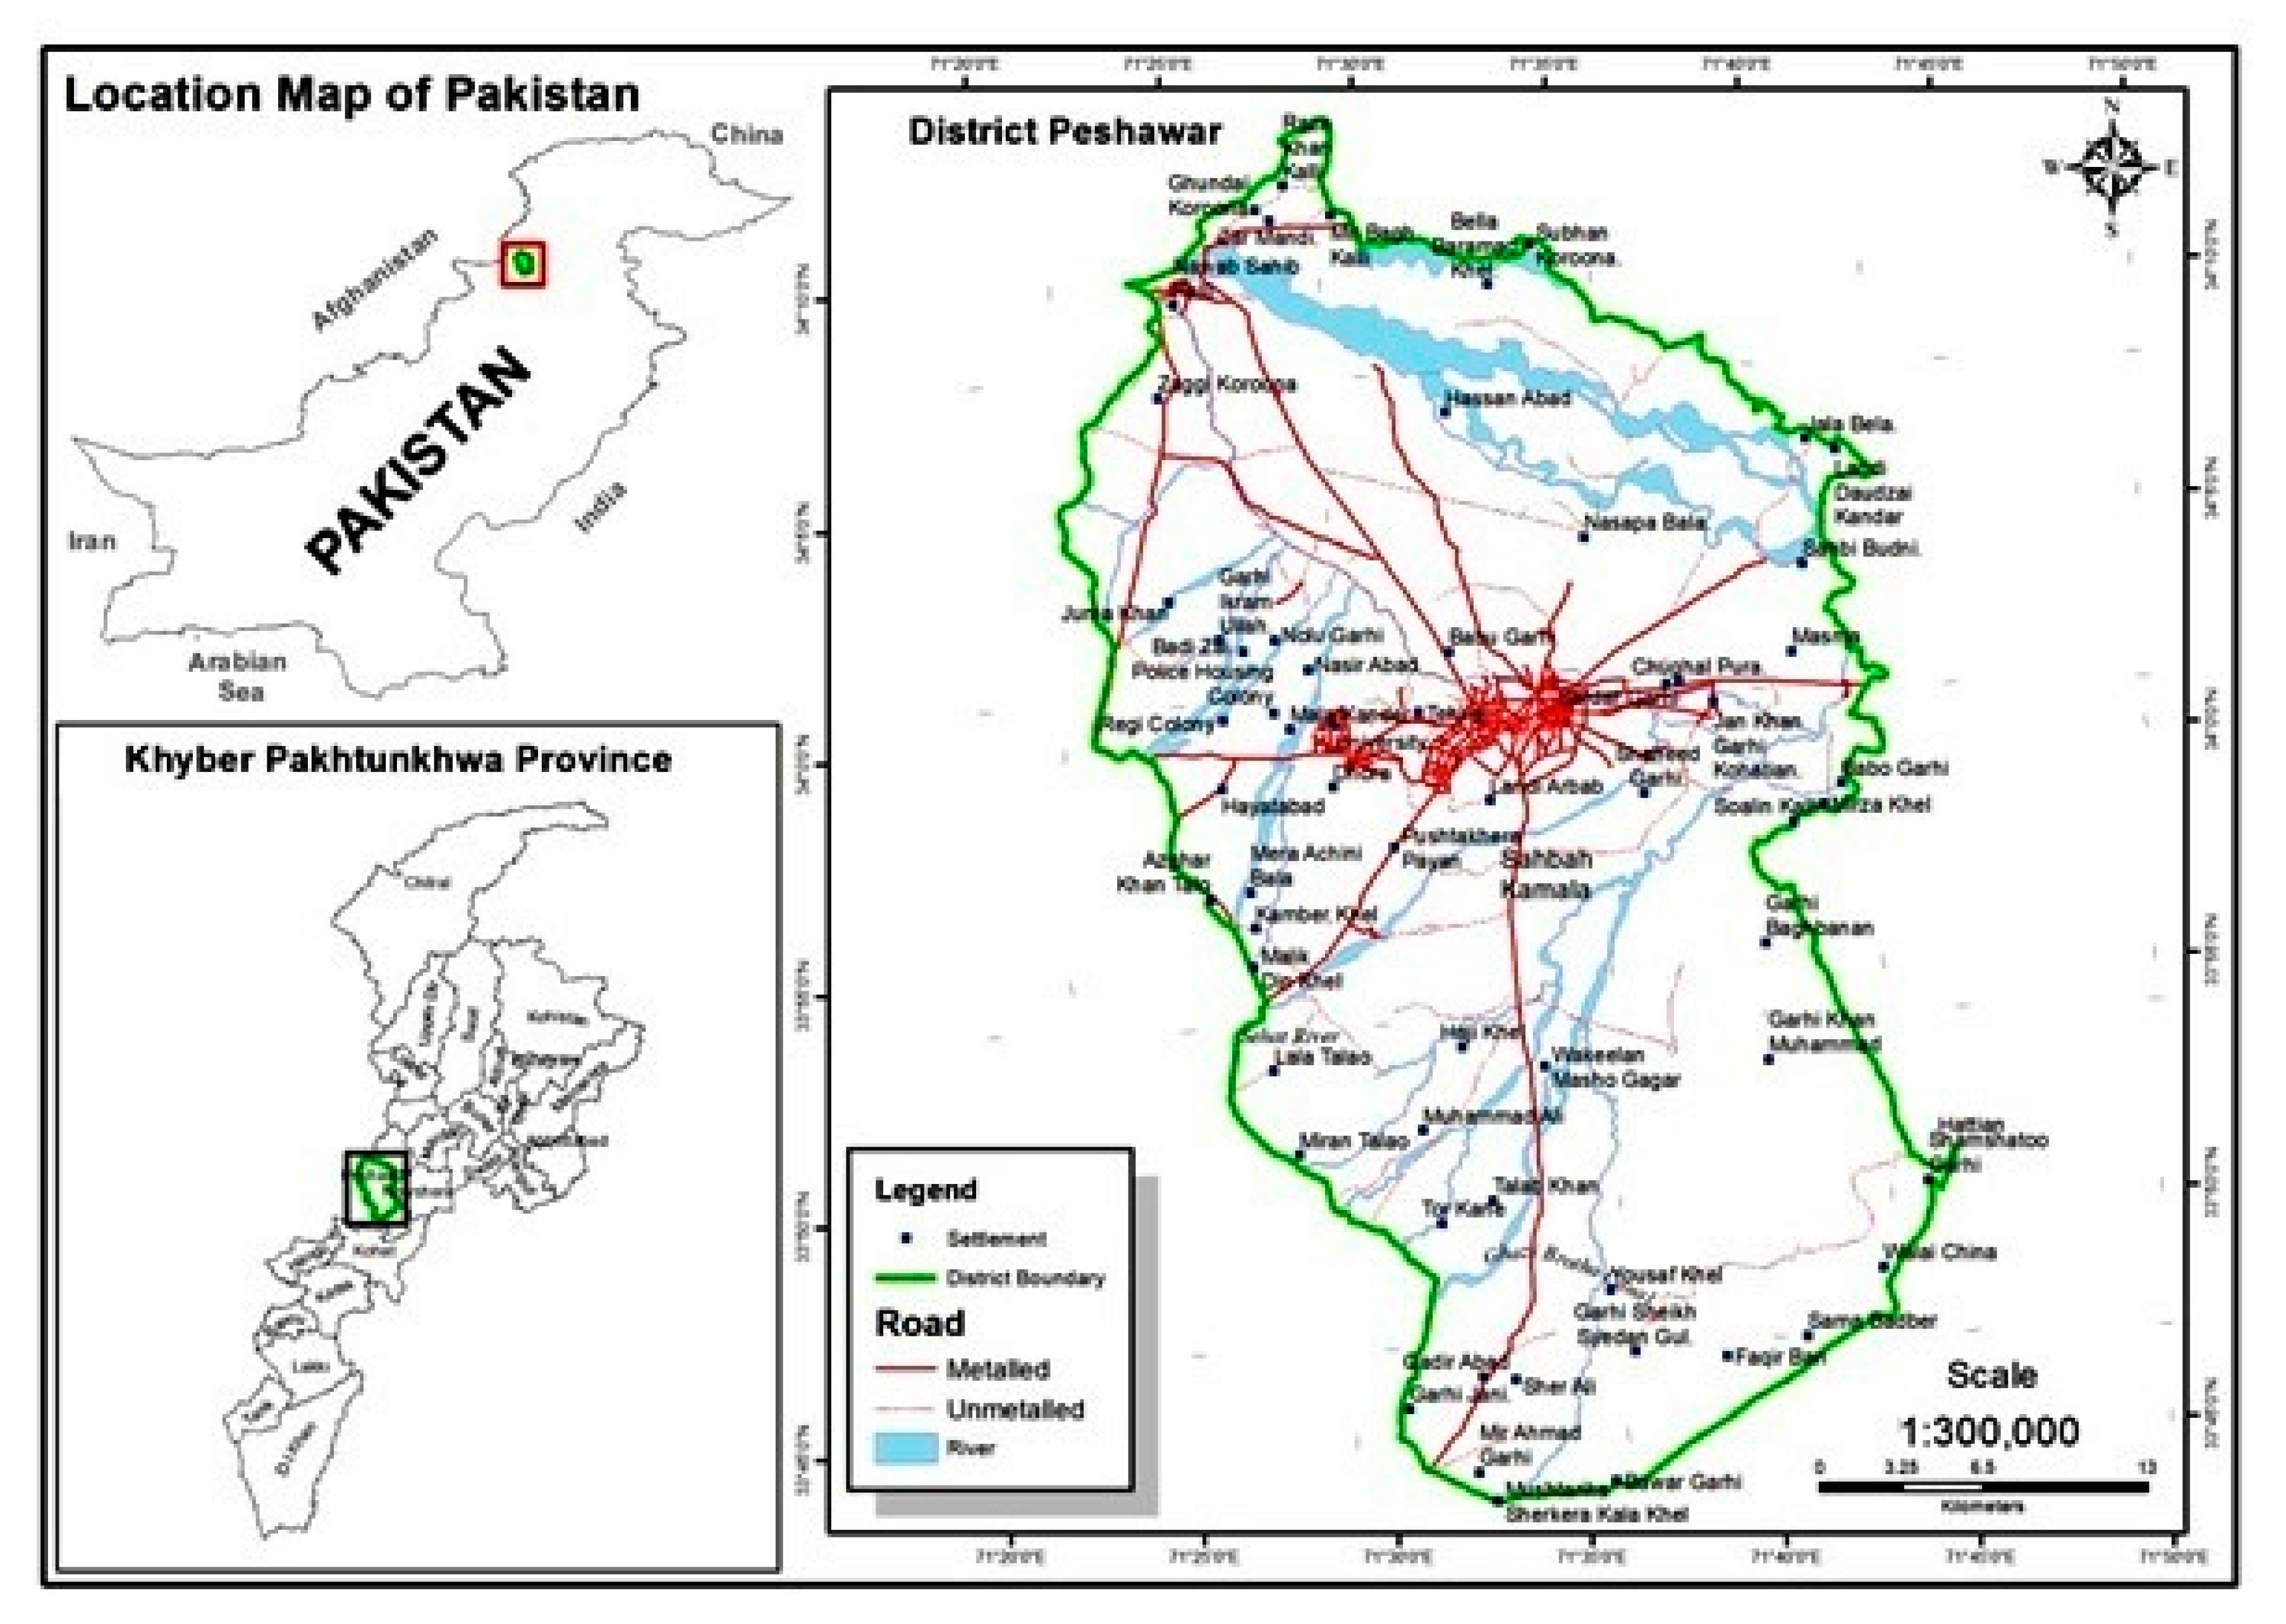
2.1. Study Area
2.2. Sampling and Data Collection
2.3. Parameters Tested
3. Methods
4. Results and Discussion
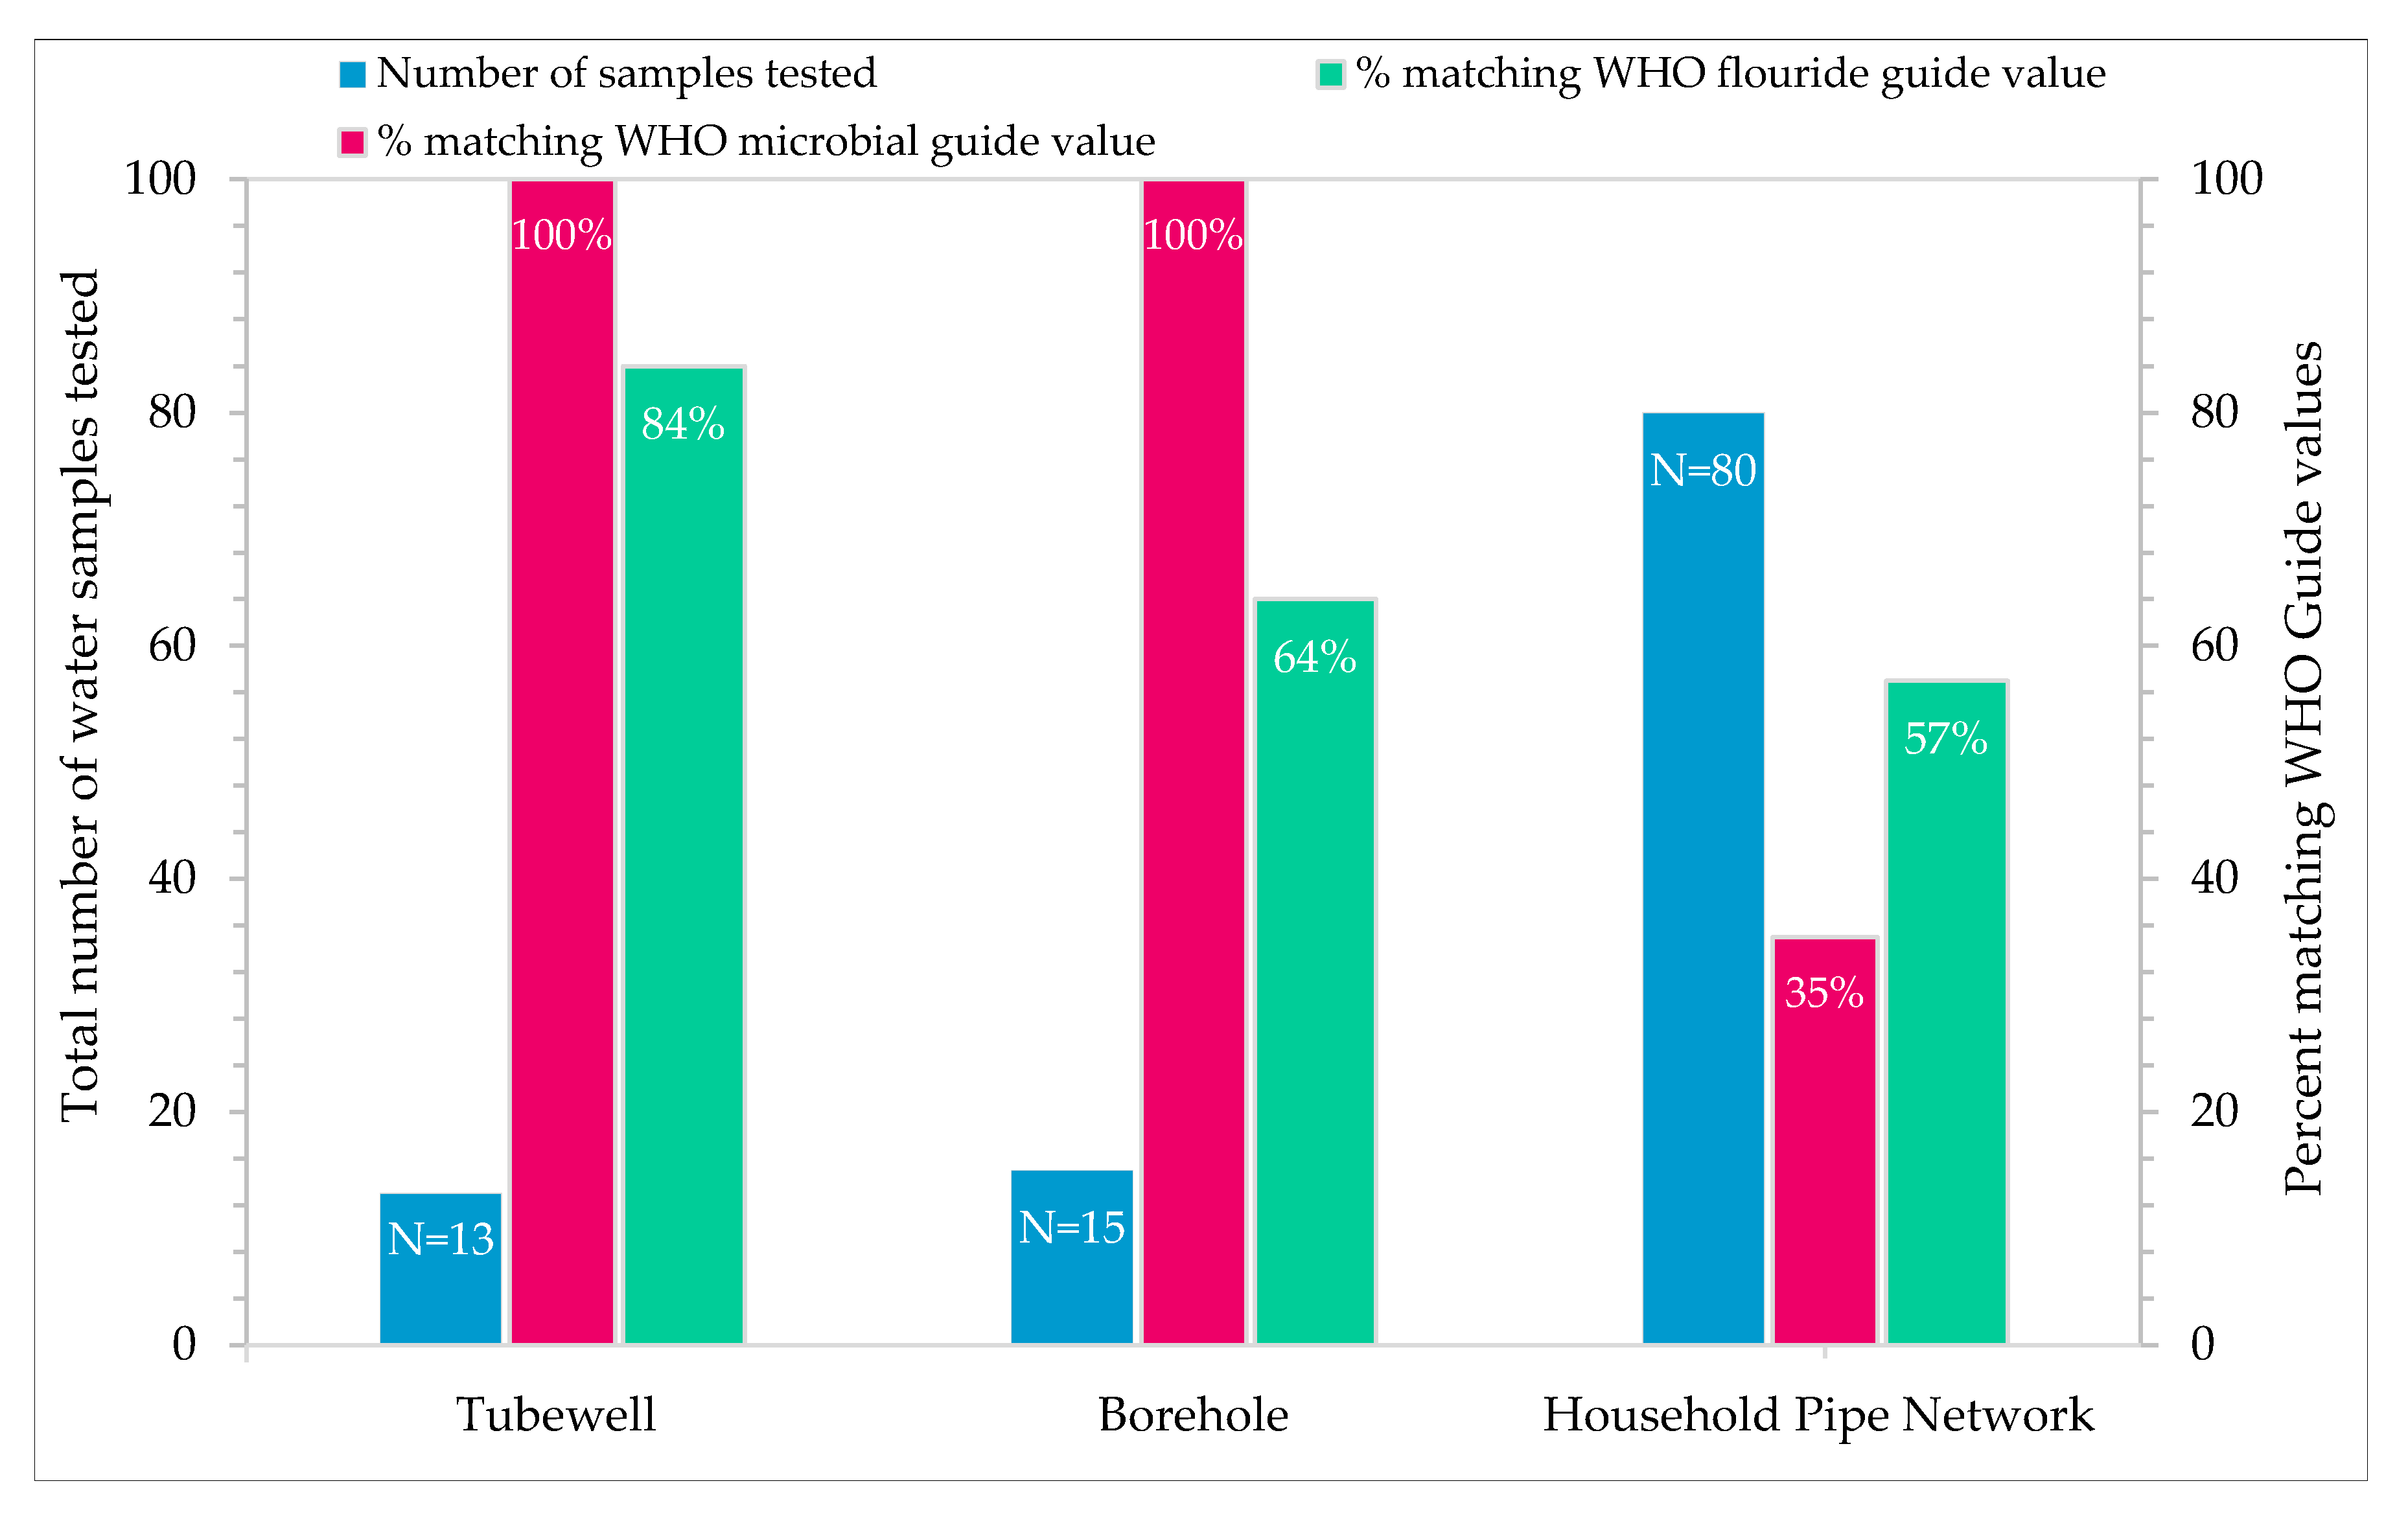
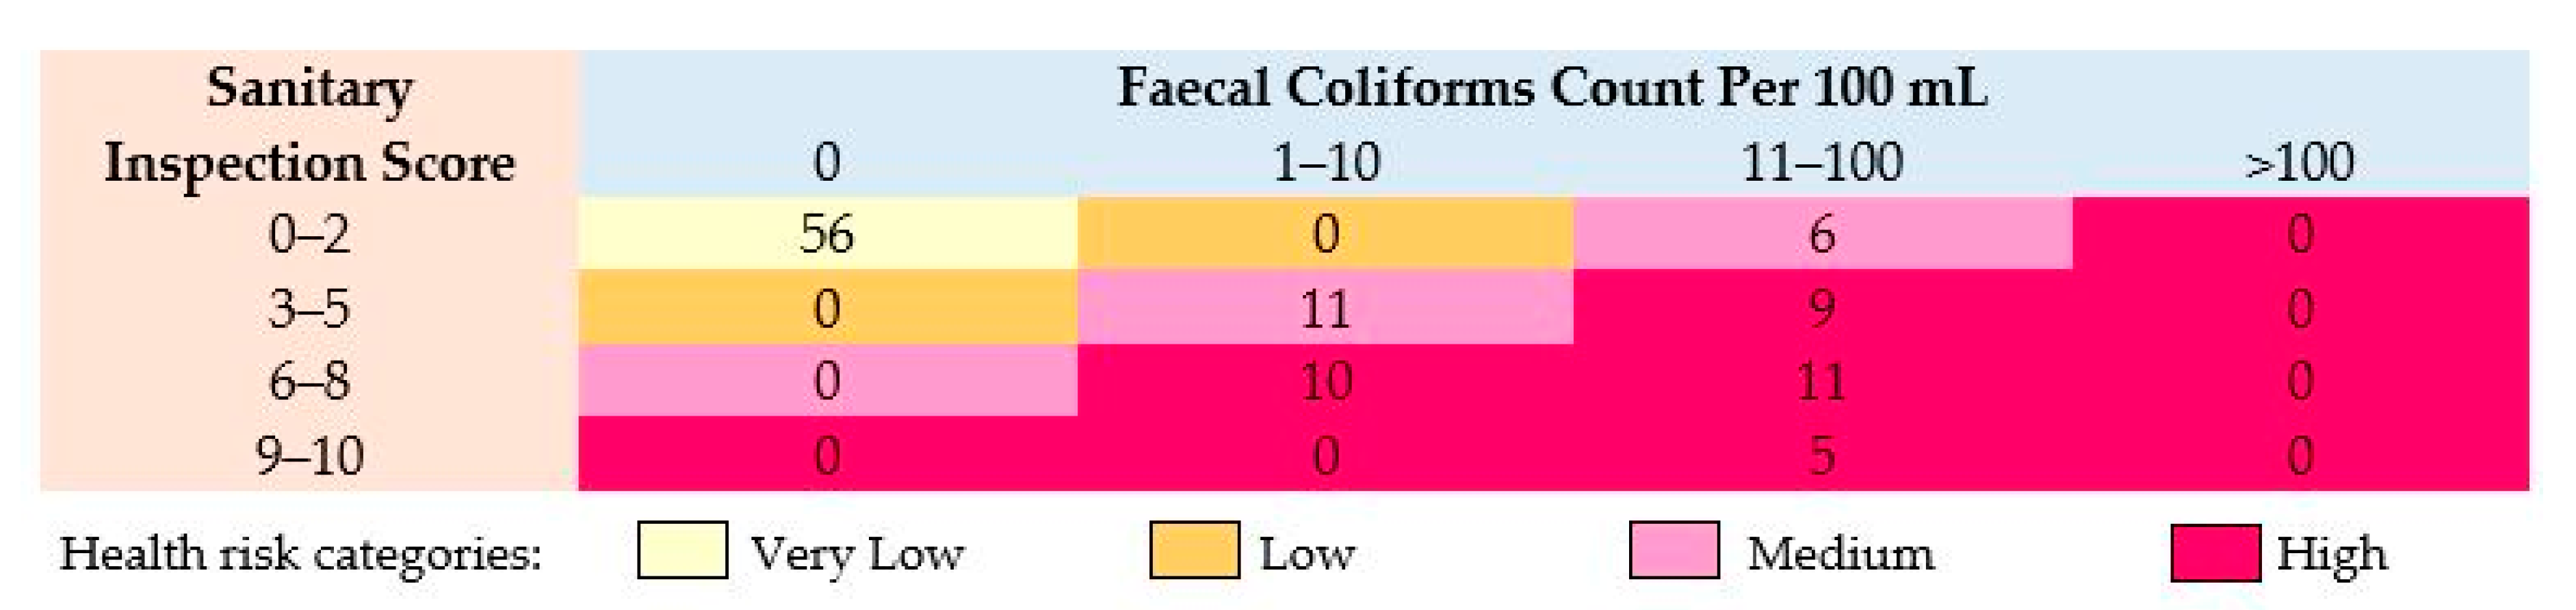
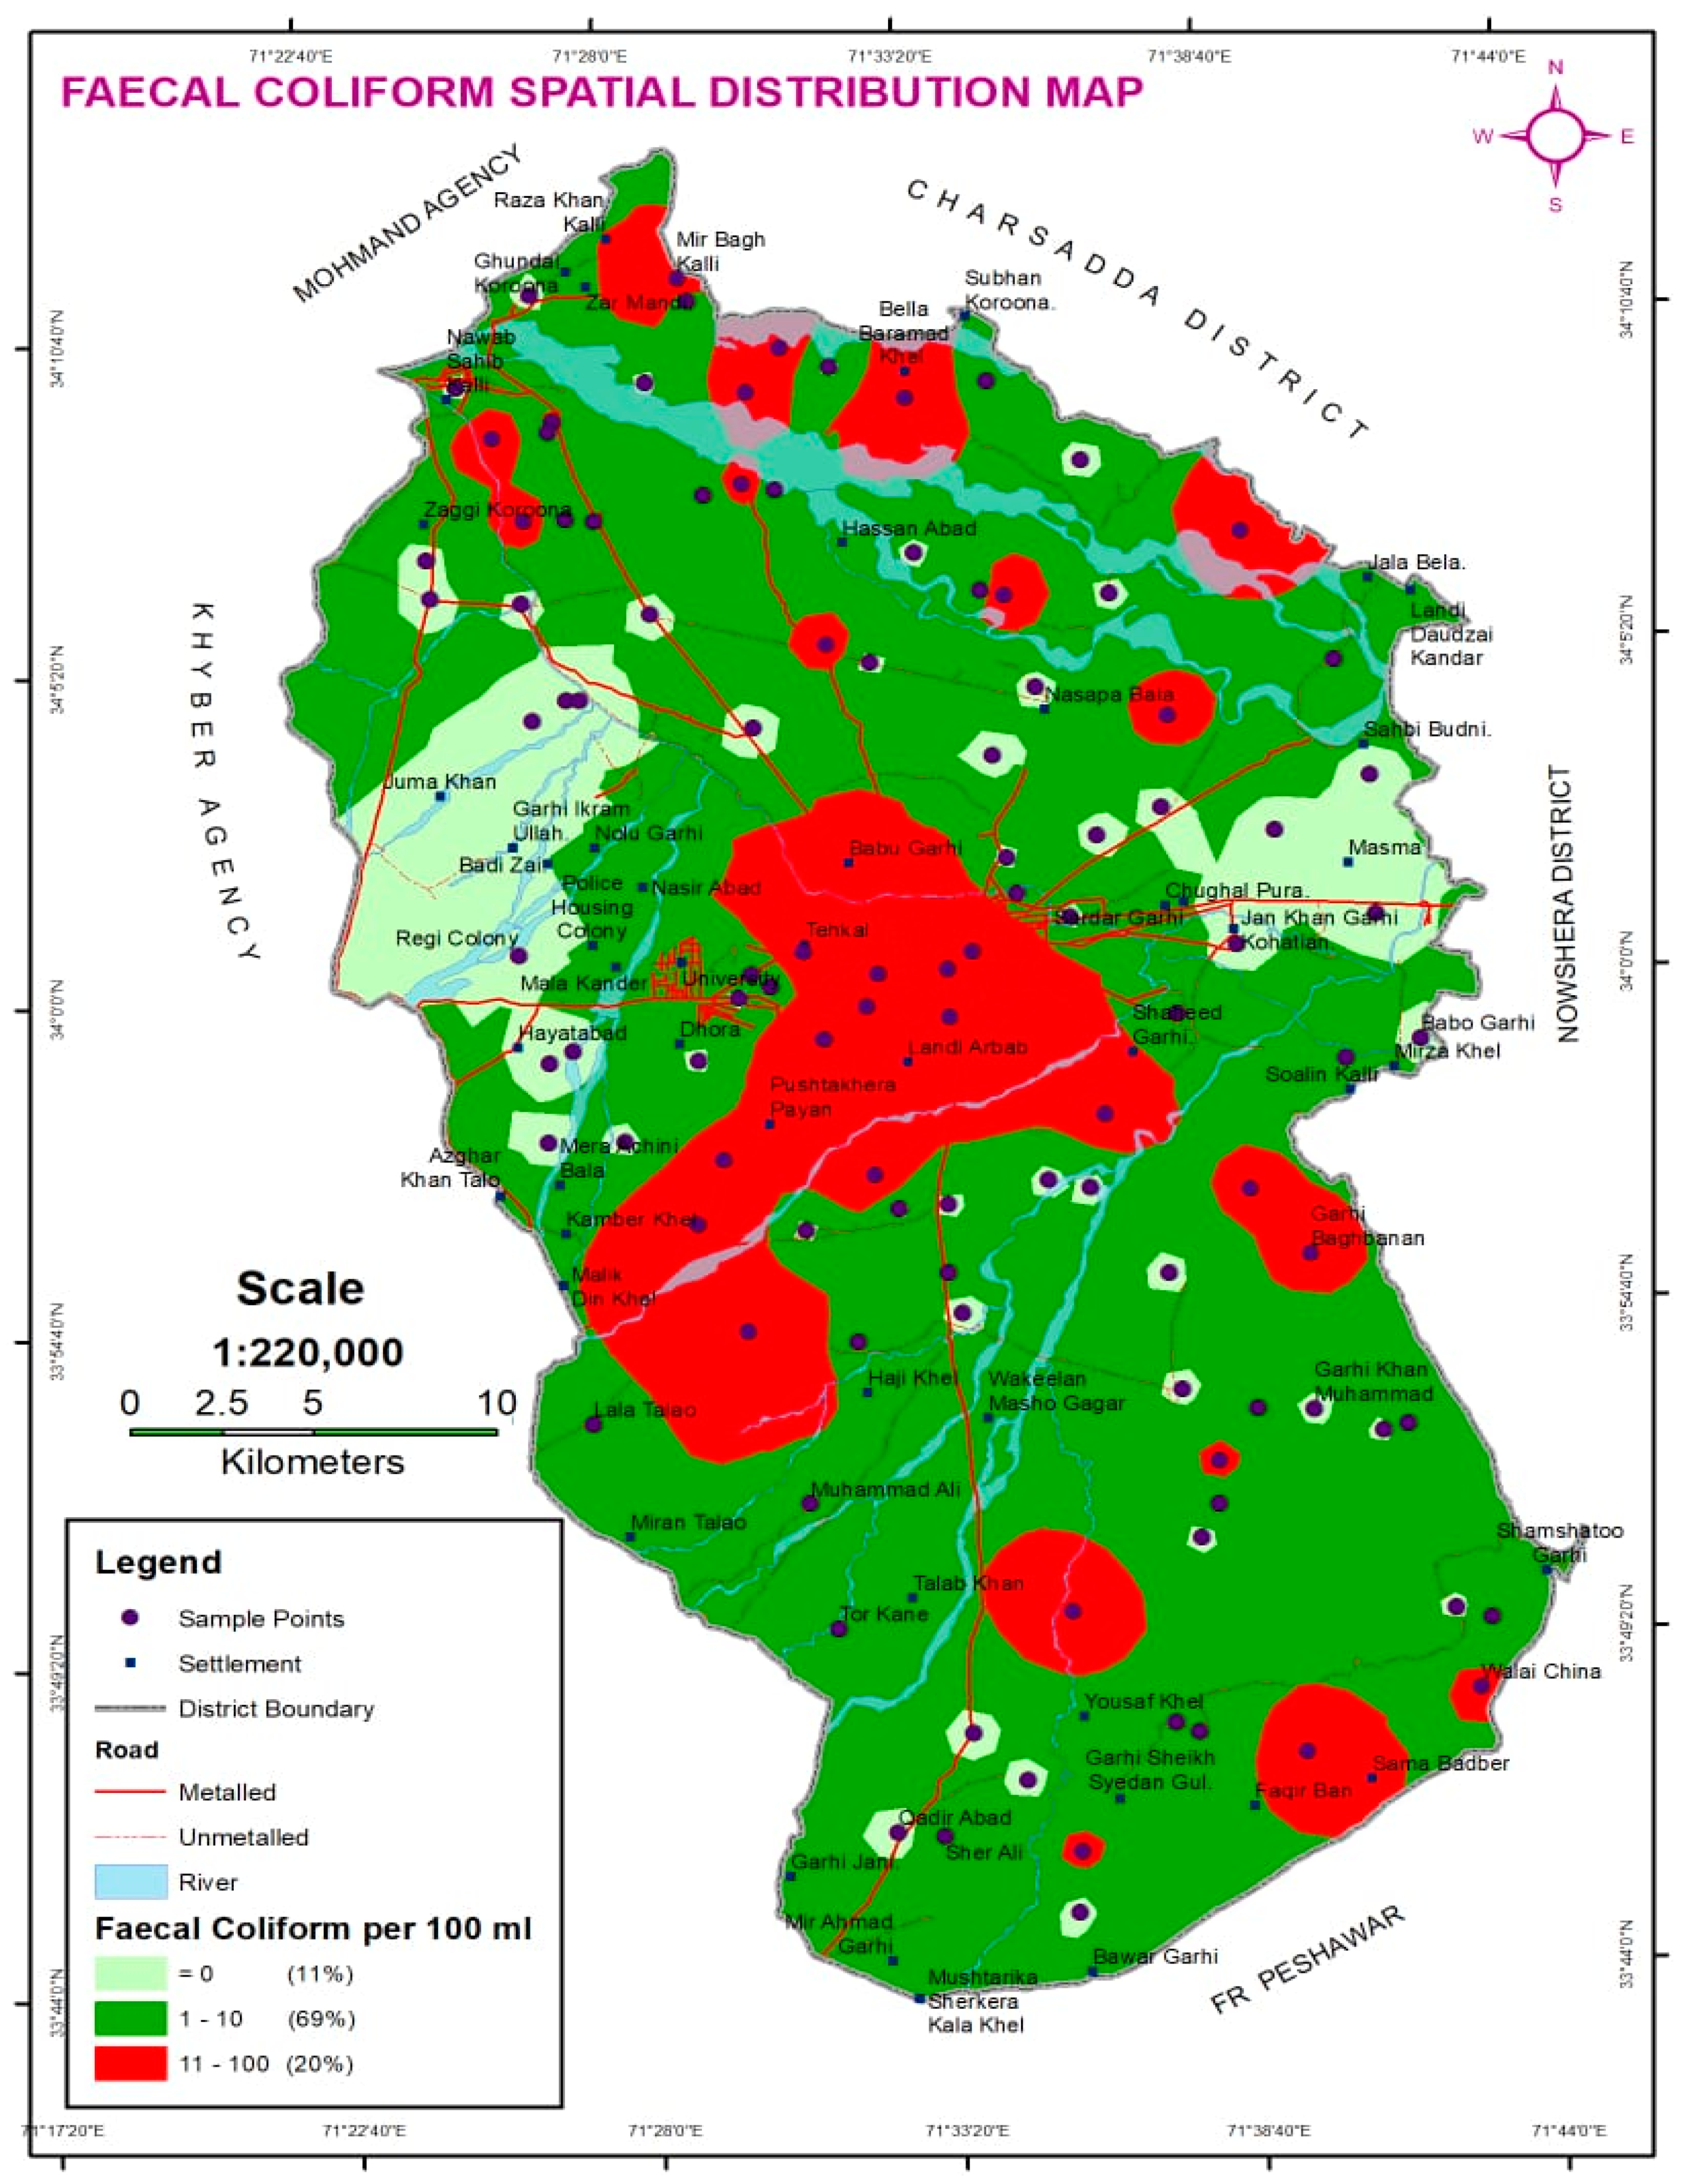
4.1. Bacteriological Parameter-Faecal Coliforms
4.2. Physico-Chemical Parameters
5. Conclusions
Author Contributions
Funding
Acknowledgments
Conflicts of Interest
References
- World Health Organization. W.H.O Guidelines for Drinking-Water Quality: First Addendum to the Fourth Edition; World Health Organization: Geneva, Switzerland, 2017. [Google Scholar]
- Kazi, T.G.; Arain, M.B.; Jamali, M.K.; Jalbani, N.; Afridi, H.I.; Sarfraz, R.A.; Baig, J.A.; Shah, A.Q. Assessment of water quality of polluted lake using multivariate statistical techniques: A case study. Ecotoxicol. Environ. Saf. 2009, 72, 301–309. [Google Scholar] [CrossRef] [PubMed]
- Wang, X.; Zhang, F. Effects of land use/cover on surface water pollution based on remote sensing and 3D-EEM fluorescence data in the Jinghe Oasis. Sci. Rep. 2018, 8, 13099. [Google Scholar] [CrossRef] [PubMed]
- Xu, G.; Li, P.; Lu, K.; Tantai, Z.; Zhang, J.; Ren, Z.; Wang, X.; Yu, K.; Shi, P.; Cheng, Y. Seasonal changes in water quality and its main influencing factors in the Dan River basin. Catena 2019, 173, 131–140. [Google Scholar] [CrossRef]
- Gorgoglione, A.; Gregorio, J.; Ríos, A.; Alonso, J.; Chreties, C.; Fossati, M. Influence of Land Use/Land Cover on Surface-Water Quality of Santa Lucía River, Uruguay. Sustainability 2020, 12, 4692. [Google Scholar] [CrossRef]
- Bakather, O.Y.; Fard, A.K.; Ihsanullah; Khraisheh, M.; Nasser, M.S.; Atieh, M.A. Enhanced Adsorption of Selenium Ions from Aqueous Solution Using Iron Oxide Impregnated Carbon Nanotubes. Bioinorg. Chem. Appl. 2017, 2017, 1–12. [Google Scholar] [CrossRef] [Green Version]
- Asmaly, H.A.; Abussaud, B.; Saleh, T.A.; Bukhari, A.A.; Laoui, T.; Shemsi, A.M.; Gupta, V.K.; Atieh, M.A. Evaluation of micro- and nano-carbon-based adsorbents for the removal of phenol from aqueous solutions. Toxicol. Environ. Chem. 2015, 97, 1164–1179. [Google Scholar] [CrossRef]
- Centers for Disease Control and Prevention (CDC). Global Water, Sanitation, and Hygiene WASH. Available online: http://www.cdc.gov/healthywater/global/ (assessed on 11 May 2019).
- Bartram, J.; Brocklehurst, C.; Fisher, M.B.; Luyendijk, R.; Hossain, R.; Wardlaw, T.; Gordon, B. Global monitoring of water supply and sanitation: History, methods and future challenges. Int. J. Environ. Res. Public Health 2014, 11, 8137–8165. [Google Scholar] [CrossRef] [PubMed] [Green Version]
- Rossi, E.M.; Gerhard, M.I.; Zanella, M.S.; Bogo, M.; Scapin, D.; Oro, D. Assessment of microbiological quality of water wells in rural properties of the city of West of Santa Catarina, Brazil. Resour. Environ. 2012, 2, 164–168. [Google Scholar] [CrossRef]
- Mohsin, M.; Safdar, S.; Asghar, F.; Jamal, F. Assessment of drinking water quality and its impact on residents health in Bahawalpur city. Int. J. Humanit. Soc. Sci. 2013, 3, 114–128. [Google Scholar]
- Moropeng, R.C.; Budeli, P.; Mpenyana-Monyatsi, L.; Momba, M.N.B. Dramatic reduction in diarrhoeal diseases through implementation of cost-effective household drinking water treatment systems in Makwane Village, Limpopo Province, South Africa. Int. J. Environ. Res. Public Health 2018, 15, 410. [Google Scholar] [CrossRef] [Green Version]
- Schwarzenbach, R.P.; Egli, T.; Hofstetter, T.B.; Von Gunten, U.; Wehrli, B. Global water pollution and human health. Annu. Rev. Environ. Resour. 2010, 35, 109–136. [Google Scholar] [CrossRef]
- Bartram, J.; Cairncross, S. Hygiene, sanitation, and water: Forgotten foundations of health. PLoS Med. 2010, 7, e1000367. [Google Scholar] [CrossRef] [PubMed] [Green Version]
- Ramírez-Castillo, F.Y.; Loera-Muro, A.; Jacques, M.; Garneau, P.; Avelar-González, F.J.; Harel, J.; Guerrero-Barrera, A.L. Waterborne pathogens: Detection methods and challenges. Pathogens 2015, 4, 307–334. [Google Scholar] [CrossRef] [PubMed]
- Ochoa, T.J.; Salazar-Lindo, E.; Cleary, T.G. Management of Children with Infection-Associated Persistent Diarrhea. In Proceedings of the Seminars in Pediatric Infectious Diseases; Elsevier: Amsterdam, The Netherlands, 2004; Volume 15, pp. 229–236. [Google Scholar]
- Aliabadi, N.; Pham, H.; Curns, A.T.; Rha, B.; Tate, J.E.; Parashar, U.D. Diarrhea-Associated Mortality in Children Less Than 5 Years of Age in the United States, 2005–2016. Pediatric Infect. Dis. J. 2019, 38, e153–e154. [Google Scholar] [CrossRef] [PubMed]
- Diarrhoea Remains a Leading Killer of Young Children, Despite the Availability of a Simple Treatment Solution The United Nations Children’s Fund, UNICEF. Available online: https://data.unicef.org/topic/child-health/diarrhoeal-disease/ (assessed on 17 May 2019).
- Alhamlan, F.S.; Al-Qahtani, A.A.; Al-Ahdal, M.N. Recommended advanced techniques for waterborne pathogen detection in developing countries. J. Infect. Dev. Ctries. 2015, 9, 128–135. [Google Scholar] [CrossRef] [Green Version]
- Daud, M.K.; Nafees, M.; Ali, S.; Rizwan, M.; Bajwa, R.A.; Shakoor, M.B.; Arshad, M.U.; Chatha, S.A.S.; Deeba, F.; Murad, W.; et al. Drinking Water Quality Status and Contamination in Pakistan. BioMed. Res. Int. 2017, 2017, 7908183. [Google Scholar] [CrossRef]
- Deeba, F.; Abbas, N.; Butt, M.; Irfan, M. Ground water quality of selected areas of Punjab and Sind Provinces, Pakistan: Chemical and microbiological aspects. Ground water quality of selected areas of Punjab and Sind Provinces, Pakistan: Chemical and microbiological aspects. Chem. Int. 2019, 5, 241–246. [Google Scholar]
- Shahid, S.U.; Iqbal, J.; Khan, S.J. A comprehensive assessment of spatial interpolation methods for the groundwater quality evaluation of Lahore, Punjab, Pakistan. NUST J. Eng. Sci. 2017, 10, 1–13. [Google Scholar]
- Ali, U.; Batool, A.; Ghufran, M.A. Assessment of heavy metal contamination in the drinking water of muzaffarabad, Azad Jammu and Kashmir, Pakistan. Int. J. Hydro. 2019, 3, 331–337. [Google Scholar]
- Huang, G.H.; Xia, J. Barriers to sustainable water-quality management. J. Environ. Manag. 2001, 61, 1–23. [Google Scholar] [CrossRef]
- Ministry of Planning, Development and Reform Pakistan Millennium Development Goals Report; Planning Commission: Islamabad, Pakistan, 2013; pp. 1–195.
- Ali, A.; Intikhab, A.Q.; Shawar, D. Low-Cost filter for flood affected areas of Pakistan. Electron. J. Environ. Agric. Food Chem. 2011, 10, 2945–2950. [Google Scholar]
- Tahir, M.A.; Rasheed, H. Fluoride in the drinking water of Pakistan and the possible risk of crippling fluorosis. Drink. Water Eng. Sci. Discuss. 2012, 5, 495–514. [Google Scholar] [CrossRef]
- Ayyaz, A.K.; Whelton, H.; O’Mullane, D. A map of natural fluoride in drinking water in Pakistan. Int. Dent. J. 2002, 52, 291–297. [Google Scholar] [CrossRef] [PubMed]
- Opinya, G.N.; Pameijer, C.H.; Gron, P. Analysis of Kenyan drinking water. East Afr. Med. J. 1987, 64, 194–201. [Google Scholar]
- Chang, H. Spatial analysis of water quality trends in the Han River basin, South Korea. Water Res. 2008, 42, 3285–3304. [Google Scholar] [CrossRef]
- Shrestha, S.; Kazama, F. Assessment of surface water quality using multivariate statistical techniques: A case study of the Fuji river basin, Japan. Environ. Model. Softw. 2007, 22, 464–475. [Google Scholar] [CrossRef]
- Cheronomelly, K.; Mutua, F. Groundwater quality assessment using GIS and remote sensing: A case study of Juja location, Kenya. Am. J. Geogr. Inf. Syst. 2016, 5, 12–23. [Google Scholar]
- Programme, U.N.D. Human Development Report 2006: Beyond Scarcity: Power, Poverty and the Global Water Crisis; Palgrave Macmillan: New York, NY, USA, 2006. [Google Scholar]
- Pacheco Castro, R.; Pacheco Ávila, J.; Ye, M.; Cabrera Sansores, A. Groundwater quality: Analysis of its temporal and spatial variability in a karst aquifer. Groundwater 2018, 56, 62–72. [Google Scholar] [CrossRef]
- Pande, C.B.; Moharir, K. Spatial analysis of groundwater quality mapping in hard rock area in the Akola and Buldhana districts of Maharashtra, India. Appl. Water Sci. 2018, 8, 106. [Google Scholar] [CrossRef] [Green Version]
- Nasir, M.S.; Nasir, A.; Rashid, H.; Shah, S.H.H. Spatial variability and long-term analysis of groundwater quality of Faisalabad industrial zone. Appl. Water Sci. 2017, 7, 3197–3205. [Google Scholar] [CrossRef] [Green Version]
- Aleem, M.; Shun, C.J.; Li, C.; Aslam, A.M.; Yang, W.; Nawaz, M.I.; Ahmed, W.S.; Buttar, N.A. Evaluation of groundwater quality in the vicinity of Khurrianwala industrial zone, Pakistan. Water 2018, 10, 1321. [Google Scholar] [CrossRef] [Green Version]
- Javed, S.; Ali, A.; Ullah, S. Spatial assessment of water quality parameters in Jhelum city (Pakistan). Environ. Monit. Assess. 2017, 189, 119. [Google Scholar] [CrossRef] [PubMed]
- Hussain, Y.; Dilawar, A.; Ullah, S.F.; Akhter, G.; Martinez-Carvajal, H.; Hussain, M.B.; Aslam, A.Q. Modelling the spatial distribution of arsenic in water and its correlation with public health, central Indus Basin, Pakistan. J. Geosci. Environ. Prot. 2016, 4, 18. [Google Scholar] [CrossRef] [Green Version]
- Ahmad, M.; Ahmad, N.; Rahman, Z.U.; Ali, S. Bacteriological Assessment of the Potable Water Quality in the Urban Informal Settlement Centers of District Bannu, Khyber Pakhtunkhwa. In Proceedings of the First International Conference on “Emerging Trends in Engineering, Management and Scineces” (ICETEMS-2014), Peshawar, Pakistan, 28–30 December 2014. [Google Scholar]
- Ahmad, M.; Ahmad, N. Potable water quality characteristics of the rural areas of District Hangu, Khyber Pakhtunkhwa-Pakistan. Int. J. Multidiscip. Sci. Eng. 2012, 3, 7–9. [Google Scholar]
- Ali, J. Peshawar: Oldest living City in South Asia. Dawn 2018. Available online: https://www.dawn.com/news/880603/peshawar-oldest-living-city-in-south-asia (accessed on 10 May 2020).
- Clesceri, L.S. Standard Methods: For the Examination of Water and Wastewater, 20th ed.; American Public Health Association, American Water Works Association, Water Pollution Control Federation, American Public Health Ass: Washington, WA, USA, 1998; ISBN 978-0-87553-235-6. [Google Scholar]
- Mohapatra, L. Spatio-Temporal Analysis and Modelling of Water Quality in Mahanadi River Basin. Ph.D. Thesis, The National Institute of Technology, Rourkela, Odisha, India, 2017. [Google Scholar]
- ESRI, ArcGIS 10.5. Using ArcGIS Spatial Analyst; Software User Guide ESRI: Redlands, CA, USA, 2015. [Google Scholar]
- Zahid, M.; Chen, Y.; Khan, S.; Jamal, A.; Ijaz, M.; Ahmed, T. Predicting Risky and Aggressive Driving Behavior among Taxi Drivers: Do Spatio-Temporal Attributes Matter. Int. J. Environ. Res. Public Health 2020, 17, 3937. [Google Scholar] [CrossRef]
- Zahid, M.; Chen, Y.; Jamal, A.; Al-Ahmadi, H.M.; Al-Ofi, A.K. Adopting Machine Learning and Spatial Analysis Techniques for Driver Risk Assessment: Insights from a Case Study. Int. J. Environ. Res. Public Health 2020, 17, 5193. [Google Scholar] [CrossRef]
- Naeem, M.; Danish, Z.; Sufian, M.; Saleem, W. Bacteriological analysis of drinking water in urban areas of district Peshawar, Khyber Pakhtunkhwa. J. Med. Sci. 2017, 25, 107–109. [Google Scholar]
- Kahlown, M.A.; Tahir, M.A.; Rasheed, H. Water Quality Status of Pakistan; Pakistan Council of Research in Water Resources (PCRWR): Islamabad, Pakistan, 2007.
- Liu, B.; Reckhow, D.A.; Li, Y. A two-site chlorine decay model for the combined effects of pH, water distribution temperature and in-home heating profiles using differential evolution. Water Res. 2014, 53, 47–57. [Google Scholar]
- Zabed, H.; Suely, A.; Faruq, G.; Sahu, J.N. Water quality assessment of an unusual ritual well in Bangladesh and impact of mass bathing on this quality. Sci. Total Environ. 2014, 472, 363–369. [Google Scholar] [CrossRef]
- Fertilizer Use by Crop in Pakistan, Land and Plant Nutrition Management Service, Land and Water Development Division; Food and Agriculture Organization of the United Nations: Rome, Italy, 2004.
- Arif, M.; Hussain, I.; Hussain, J.; Sharma, M.K.; Kumar, S.; Bhati, G. GIS-Based inverse distance weighting spatial interpolation technique for fluoride distribution in south west part of Nagaur district, Rajasthan. Cogent Environ. Sci. 2015, 1, 1038944. [Google Scholar] [CrossRef]
- Kurttio, P.; Gustavsson, N.; Vartiainen, T.; Pekkanen, J. Exposure to natural fluoride in well water and hip fracture: A cohort analysis in Finland. Am. J. Epidemiol. 1999, 150, 817–824. [Google Scholar] [CrossRef] [PubMed] [Green Version]


| Sanitary Inspection Score | 0–2 | 3–5 | 6–8 | 9–10 |
|---|---|---|---|---|
| 1. Drainage channel contain stagnant water within 2 m of the borehole | ||||
| 2. The cover of the storage tank unhygienic (unclean) | ||||
| 3. Concrete floor around the borehole have any cracks that could let water in | ||||
| Note: Health risk categories | Very Low (0–2) | Low (3–5) | Medium (6–8) | High (9–10) |
| Parameter | Method | Detection Limit |
|---|---|---|
| Turbidity | Turbidity meter | 0.1 |
| pH | pH/°C/mV meter | 0.01 |
| Temperature | 0.1 | |
| Fluoride | Photometer | 0.05 |
| Faecal Coliform | Membrane filtration (MF) method | 1 |
| Parameter | Unit | Range | Mean ± SD | COV | WHO Recommended Range | % Matching WHO Limits | |
|---|---|---|---|---|---|---|---|
| Min | Max | ||||||
| Temperature | °C | 22.5 | 29.6 | 26.56 ± 1.91 | 0.07 | - | - |
| pH | - | 7.2 | 8.21 | 7.86 ± 0.24 | 0.03 | 6.5–8.5 | 100 |
| Turbidity | NTU | 0.19 | 3.04 | 2.17 ± 0.91 | 0.42 | <5 | 100 |
| Fluoride | mg/L | 0.1 | 2.5 | 1.03 ± 0.69 | 0.67 | <1.5 | 68 |
| Faecal Coliforms | CFU/100 mL | 0 | 48 | 7.5 ± 11.3 | 1.50 | 0 | 52 |
| Parameter | No of Grade | Grade | Total Tested Samples | Percentage Covered Study Area | Range |
|---|---|---|---|---|---|
| Faecal Coliform | 3 | Guideline compliment | 56 | 11 | 0 per 100 mL |
| Tolerable region | 21 | 69 | 1–10 per 100 mL | ||
| Need for treatment region | 31 | 20 | 11–100 per 100 mL | ||
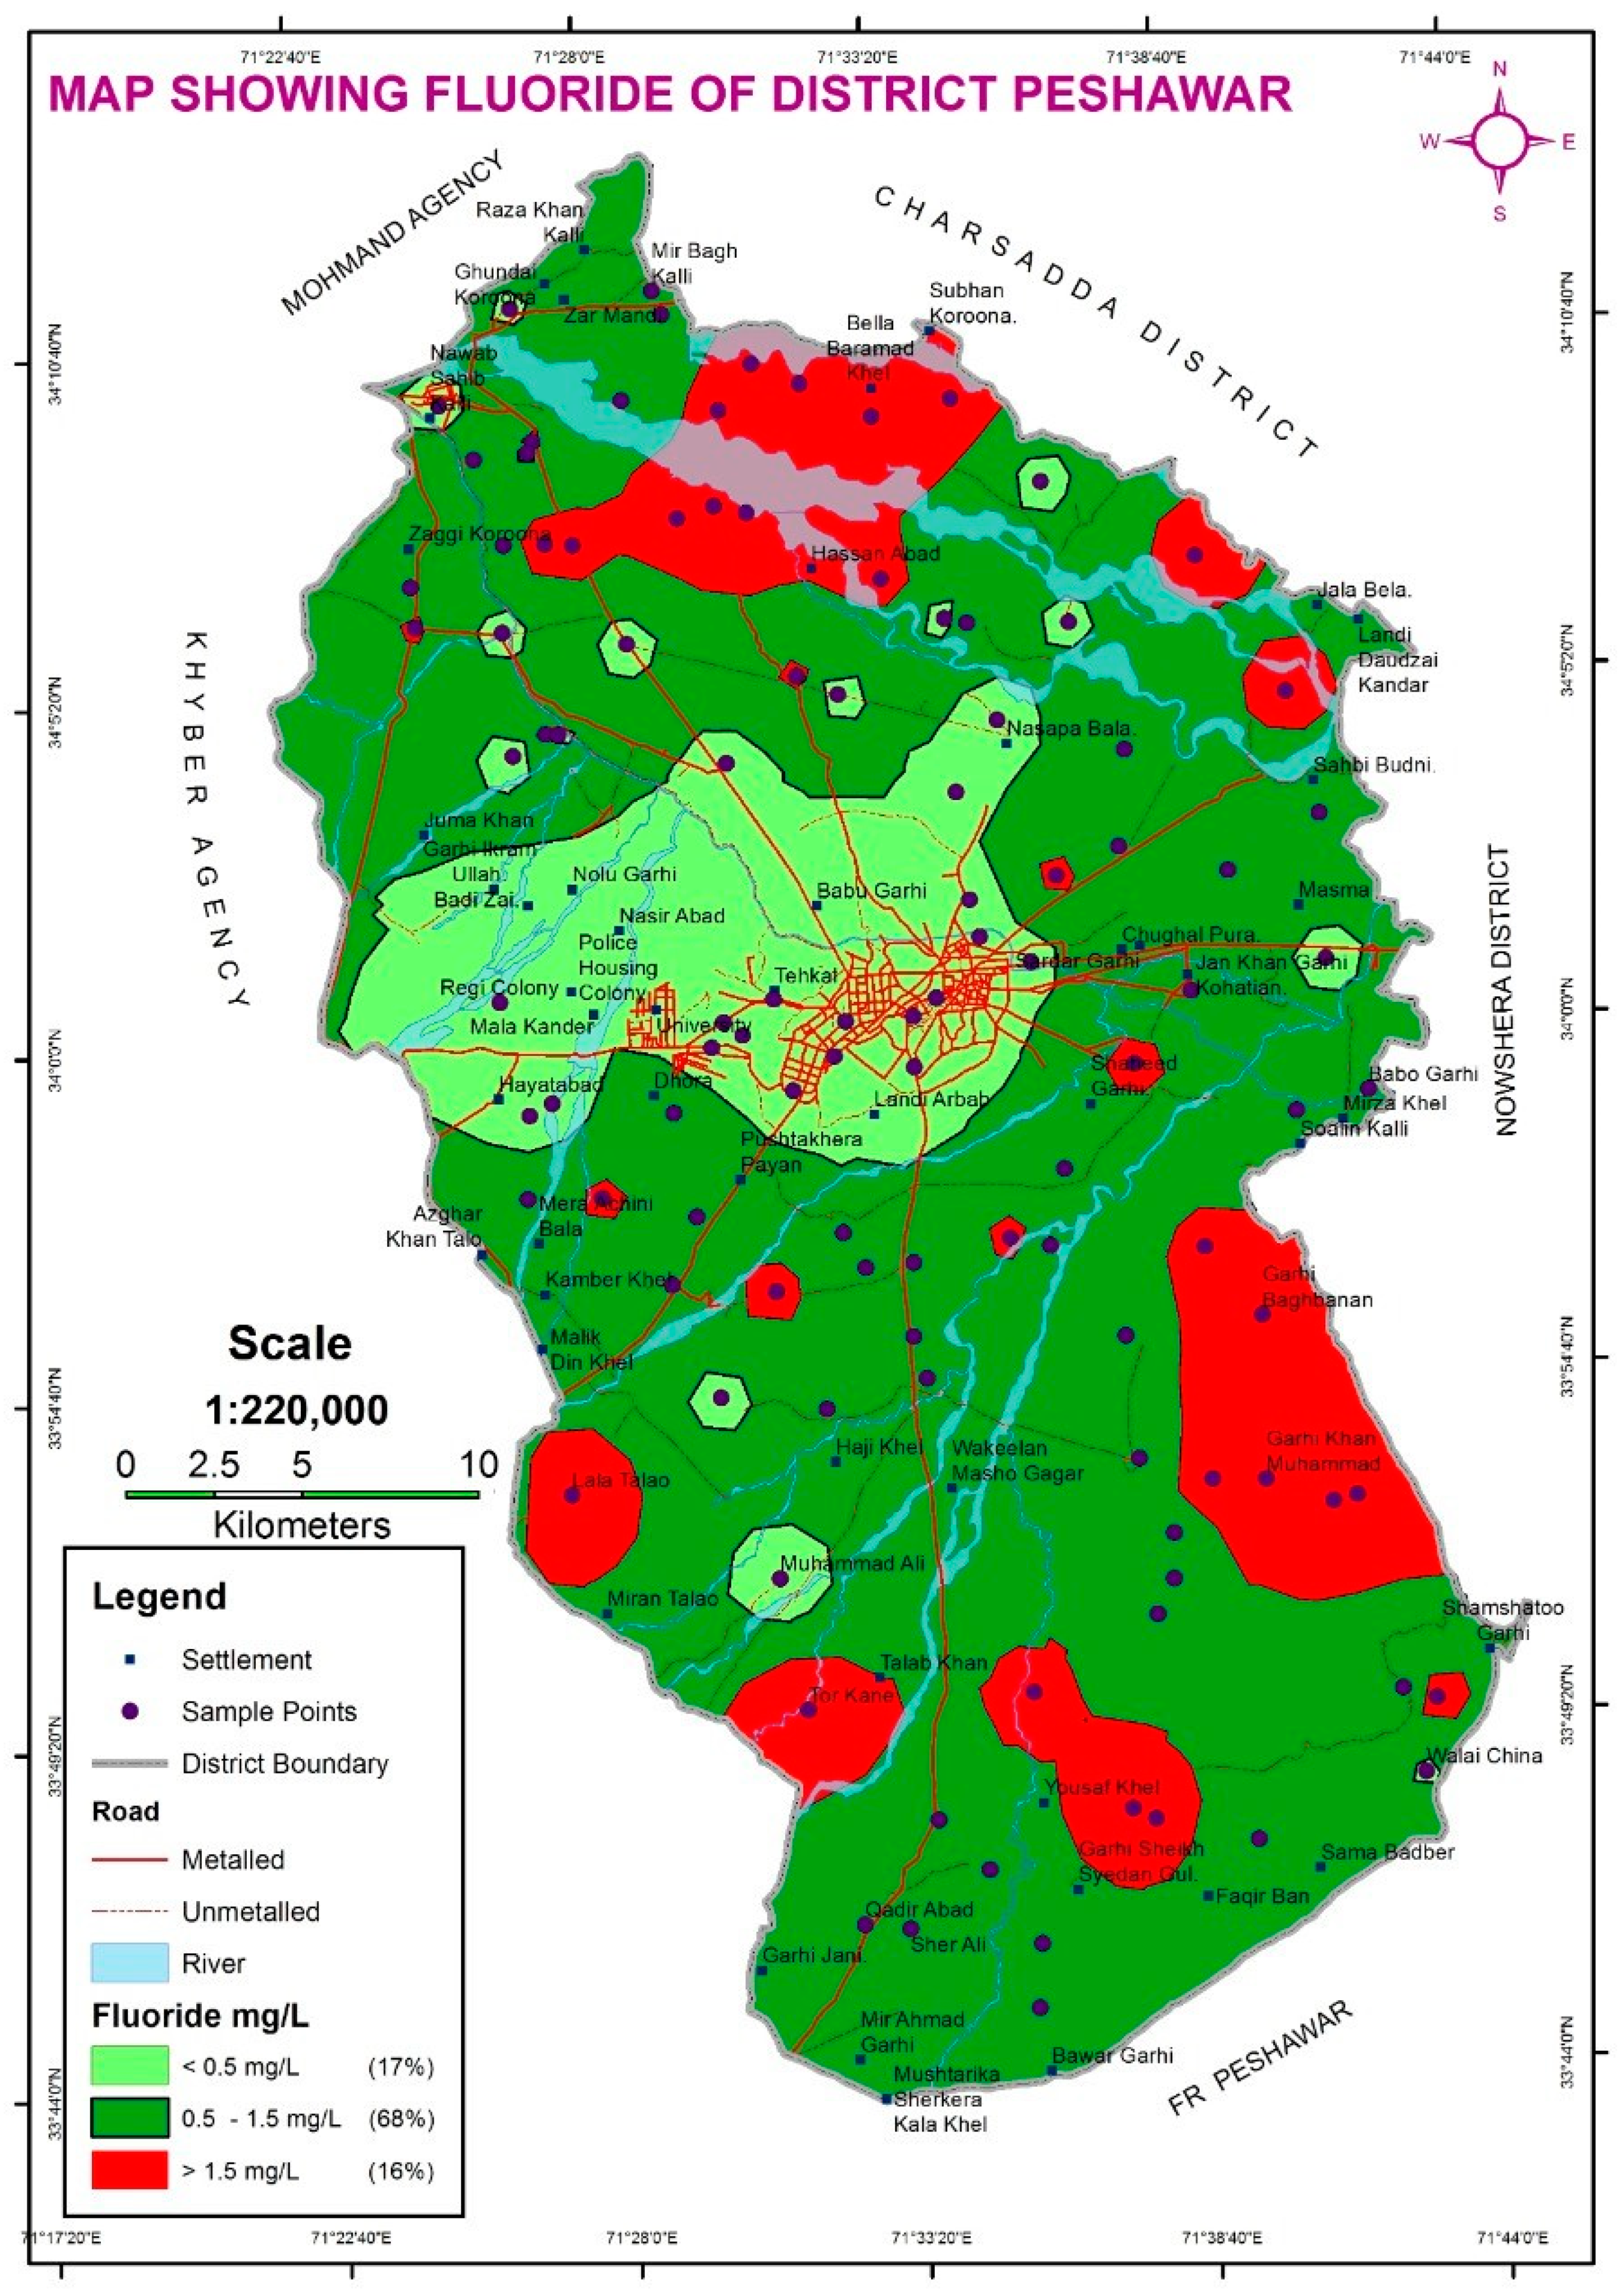
| Fluoride | 3 | Need for treatment region | 33 | 17 | <0.5 mg/L |
| Guideline compliment | 41 | 68 | 0.5–1.5 mg/L | ||
| Need for treatment region | 34 | 16 | >1.5 mg/L |
© 2020 by the authors. Licensee MDPI, Basel, Switzerland. This article is an open access article distributed under the terms and conditions of the Creative Commons Attribution (CC BY) license (http://creativecommons.org/licenses/by/4.0/).
Share and Cite
Ahmad, M.; Jamal, A.; Tang, X.-W.; Al-Sughaiyer, M.A.; Al-Ahmadi, H.M.; Ahmad, F. Assessing Potable Water Quality and Identifying Areas of Waterborne Diarrheal and Fluorosis Health Risks Using Spatial Interpolation in Peshawar, Pakistan. Water 2020, 12, 2163. https://0-doi-org.brum.beds.ac.uk/10.3390/w12082163
Ahmad M, Jamal A, Tang X-W, Al-Sughaiyer MA, Al-Ahmadi HM, Ahmad F. Assessing Potable Water Quality and Identifying Areas of Waterborne Diarrheal and Fluorosis Health Risks Using Spatial Interpolation in Peshawar, Pakistan. Water. 2020; 12(8):2163. https://0-doi-org.brum.beds.ac.uk/10.3390/w12082163
Chicago/Turabian StyleAhmad, Mahmood, Arshad Jamal, Xiao-Wei Tang, Mohammed A. Al-Sughaiyer, Hassan M. Al-Ahmadi, and Feezan Ahmad. 2020. "Assessing Potable Water Quality and Identifying Areas of Waterborne Diarrheal and Fluorosis Health Risks Using Spatial Interpolation in Peshawar, Pakistan" Water 12, no. 8: 2163. https://0-doi-org.brum.beds.ac.uk/10.3390/w12082163