Static Liquefaction Capacity of Saturated Undisturbed Loess in South Jingyang Platform

1
Department of Architecture and Civil Engineering, Xi’an Technological University, Xi’an 710021, China
2
Key Laboratory of Western China’s Mineral Resource and Geological Engineering, Ministry of Education, Department of Geological Engineering and Surveying of Chang’an University, Xi’an 710054, China
3
Department of Architecture and Civil Engineering, Xi’an University of Science and Technology, Xi’an 710054, China
*
Authors to whom correspondence should be addressed.
Water 2020, 12(8), 2298; https://0-doi-org.brum.beds.ac.uk/10.3390/w12082298
Submission received: 15 June 2020
/
Revised: 10 August 2020
/
Accepted: 11 August 2020
/
Published: 16 August 2020
(This article belongs to the Special Issue Soil–Water Conservation, Erosion, and Landslide)
Abstract
:According to a previous geological investigation, high-speed and long-distance loess landslides in the South Jingyang platform in Shaanxi Province are closely related to the static liquefaction of loess. Considering the typical loess landslides in this area, isotropic consolidated undrained (ICU) triaxial tests and scanning electron microscopy analyses were conducted in this study. The main conclusions are as follows: (1) The stress-strain curves indicate strong strain softening under different confining pressures. The pore water pressure increases significantly and then remains at a high level; (2) The liquefaction potential index (LPI) shows an increasing trend followed by stabilization; the larger the LPI is, the smaller the state parameter (Ψ) is. The steady-state points of the loess are in the instability region; however, the steady-state strength is not zero; (3) Based on the ICU test results, the average pore diameter decreases; the shape ratio remains essentially unchanged; and the fractal dimension and roundness show different trends. The proportions of the macropore and mesopore decrease; that of the small pore increases slightly; and that of the micropore increases significantly; (4) The compression deformation of the highly spaced pores causes rapid strain hardening. A rapid strain softening results from the pore throat blockage at the beginning of particle rearrangement and reorganization. A stable strain softening is related to the agglomeration blocking of the reconstructed pore throat in the gradually stable stage of particle rearrangement and reorganization.
1. Introduction
The phenomenon of static liquefaction was first discovered by Terzaghi and Peck [1] when they performed an experiment on saturated silty fine sand. The phenomenon was described as follows: saturated silty fine sand with uniform viscous liquid properties appears under a very small disturbance action; this was termed “spontaneous liquefaction”. Subsequently, many scholars [2,3,4] have reported this phenomenon. They proposed that this phenomenon should be distinguished from the liquefaction of saturated sand under a dynamic load, and they studied it separately. Therefore, a more accurate conceptual description of “static liquefaction” was gradually formed. In other words, the stress-strain curve of the material element or the sample shows an obvious strain softening characteristic in the static loading process. This indicates that the deviator stress can only maintain a very low shear strength after reaching the peak value. When the external load continues to act, the soil shows strong instability. With the further cognition of the phenomenon of static liquefaction, many scholars [5,6,7] began to understand the influence of static liquefaction on the loss of the soil resistance, and performed detailed analysis of engineering disasters resulting from static liquefaction. Several laboratory tests were also conducted, and their results have provided a clear understanding of the mechanism of static liquefaction.
Due to the characteristics of loess, such as being porous, having weak cementation, and water sensitivity, it is prone to cause slope instability due to static liquefaction under the saturated condition. According to analyses of the characteristics of the loess landslides in the South Jingyang platform, Shaanxi Province, the loess landslides are closely related to static liquefaction of the saturated loess. Relevant scholars have carried out systematic research on the static liquefaction typical characteristics of loess landslides in this region. Leng et al. [8] speculated that the movement mechanism of the landslide was related to the liquefaction of loess, considering the water accumulation at the toe of the slope and the unique properties of the slip soil after the occurrence of the landslide in this area. In the process of shearing, the loess liquefaction led to a sharp decrease in the shear strength of the displaced landslide materials. Through a field investigation of the Western Miaodian and Zhaitou landslides and using a digital elevation model, Peng et al. [9] found that the static liquefaction of the sliding surface was caused by the loss of shear resistance and bond strength. Xu [10] conducted scores of field investigations and measurements of the loess landslides in the South Jingyang platform. It was determined that the shear opening of the flow landslides was low, and most of the landslides were in the loess saturated zone on the edge of the plateau and were caused by a rise in the groundwater level. The mechanism for these kinds of loess landslides is related to the static liquefaction of the saturated loess at the bottom. In addition, the slope of the flow slip (about 12°) is much lower than the internal friction angle of the saturated loess, which also preliminarily confirms loess liquefaction in the process of flowing. According to Li et al. [11], the pore water pressure produced by the undrained shear at the bottom of the sliding body in the loess tableland area is much higher than the pore water pressure inside the sliding body. Therefore, shearing occurred at the bottom. The high pore water pressure liquefied the bottom material, which resulted in a large difference between the driving force and resistance.
The phenomenon and mechanism of loess static liquefaction depends on the systematic experimental analysis. Therefore, relevant scholars have carried out laboratory experimental research and analyzed the mechanism of loess static liquefaction. For example, Ma et al. [12] determined that surface water infiltration led to water accumulation at the bottom of the loess layer through isotropic consolidated undrained (ICU) and ring shear tests. The loess in this layer was highly liquefied: a high pore water pressure was generated rapidly, and a deviatoric stress reached the maximum value under low deformation. Zhuang et al. [13] conducted ring shear tests on saturated loess in this region and determined that the pore water pressure and shear resistance immediately rose to the maximum value after shearing. Thereafter, the pore water pressure was maintained near the maximum value; however, half of the shear resistance was lost after a small shear displacement. The effective stress path showed that the saturated loess was prone to liquefaction under the undrained shear action. This indicates that the loess landslide had liquefied during the sliding process. Yan et al. [14] conducted ICU tests on the loess in this area and determined that it was easy to form a saturated softening zone on the top of the paleosol layer (relative aquiclude) at the toe of the slope. The relative sliding between the loess particles at this location can increase the pore water pressure sharply and reduce the effective stress. After reaching the steady state, the saturated loess was in a low-confining-pressure unstable state and was prone to plastic flow. Li and Jin [15] used the global digital systems (GDS) triaxial apparatus to conduct isotropic/anisotropic consolidated undrained (ICU/ACU) compression tests and constant-shear-drained (CQD) triaxial tests of the undisturbed loess in the Dongfeng landslide for the South Jingyang platform. The results showed that the stress-strain mode of the soil displayed a strong strain softening type, and the starting friction angle of the soil failure was far less than the steady-state friction angle. When the stress path passed through the instability area, incomplete drainage shear shrinkage failure occurred, which is a typical static liquefaction phenomenon. Liu et al. [16] carried out undrained monotonic triaxial shear tests on saturated undisturbed loess samples taken from Heping Town, Yuzhong County, Lanzhou City. They found that loess samples with confining pressure of 100 kPa and 150 kPa exhibited complete static liquefaction characterized by that the pore water pressure reached the level of the initial confining pressure and the effective confining pressure decreased to zero. Wang et al. [17] also determined that the final pore pressures in the undrained triaxial compression tests were as great as 65% of the initial confining pressures. Besides, through effective stress path passing through flow liquefaction line (FLL), it can be concluded that the loess is susceptible to flow liquefaction failure. Pei et al. [18] conducted a series of consolidated undrained triaxial compression tests on undisturbed loess obtained from the source area of Shibeiyuan landslide. The tests revealed that although the confining pressures were different (≤200 kPa), the effective stress decreased with the accumulation of excess pore pressure and the steady state strength decreased continuously to zero. Xu et al. [19,20] carried out ICU tests on undisturbed loess retrieved from the backwall of a loess landslide in Heifangtai plateau, Lanzhou City, Gansu Province. The loess reached peak shear strength with an axial strain of <2%, accompanied by a sharp increase in pore pressure and followed by monotonic strain softening. The results showed that the saturated loess had strong liquefaction potential. Based on the study of the mechanical behavior of the static liquefaction of the saturated loess, the mechanism of the static liquefaction of loess has been clearly summarized as follows: ① the explosion of the pore water pressure; ② the effective stress drops sharply, even to zero; ③ and the occurrence of flow plastic deformation. However, the internal mechanism is still unclear, such as: ① an unclear understanding of the mechanism of the explosion of the pore water pressure in the process of static liquefaction; ② incomplete cognition of the relationship between the occurrence of static liquefaction and the change in the internal structure of the saturated loess; and ③ the essence of the sudden drop in the strength of the saturated loess due to static liquefaction, which can result in a sharp drop in the effective stress. However, the mechanism of the sudden drop in strength that is caused by the loess structure is not clear. Therefore, analyzing the internal mechanism of loess liquefaction and scientifically understanding the three typical characteristics of static liquefaction from multiple perspectives are the key work in the next stage.
In view of the above shortcomings, we carried out the ICU tests under different confining pressures for the saturated undisturbed loess. In addition, scanning electron microscopy was performed before and after the ICU tests. The stress-strain characteristics of the saturated undisturbed loess were studied. The variation trend of the pore water pressure and of the corresponding mechanical mechanism was also analyzed. Finally, the evolution process and internal mechanism of static liquefaction were determined.
2. Development Characteristics of the Landslide and the Correlation Analysis with Static Liquefaction
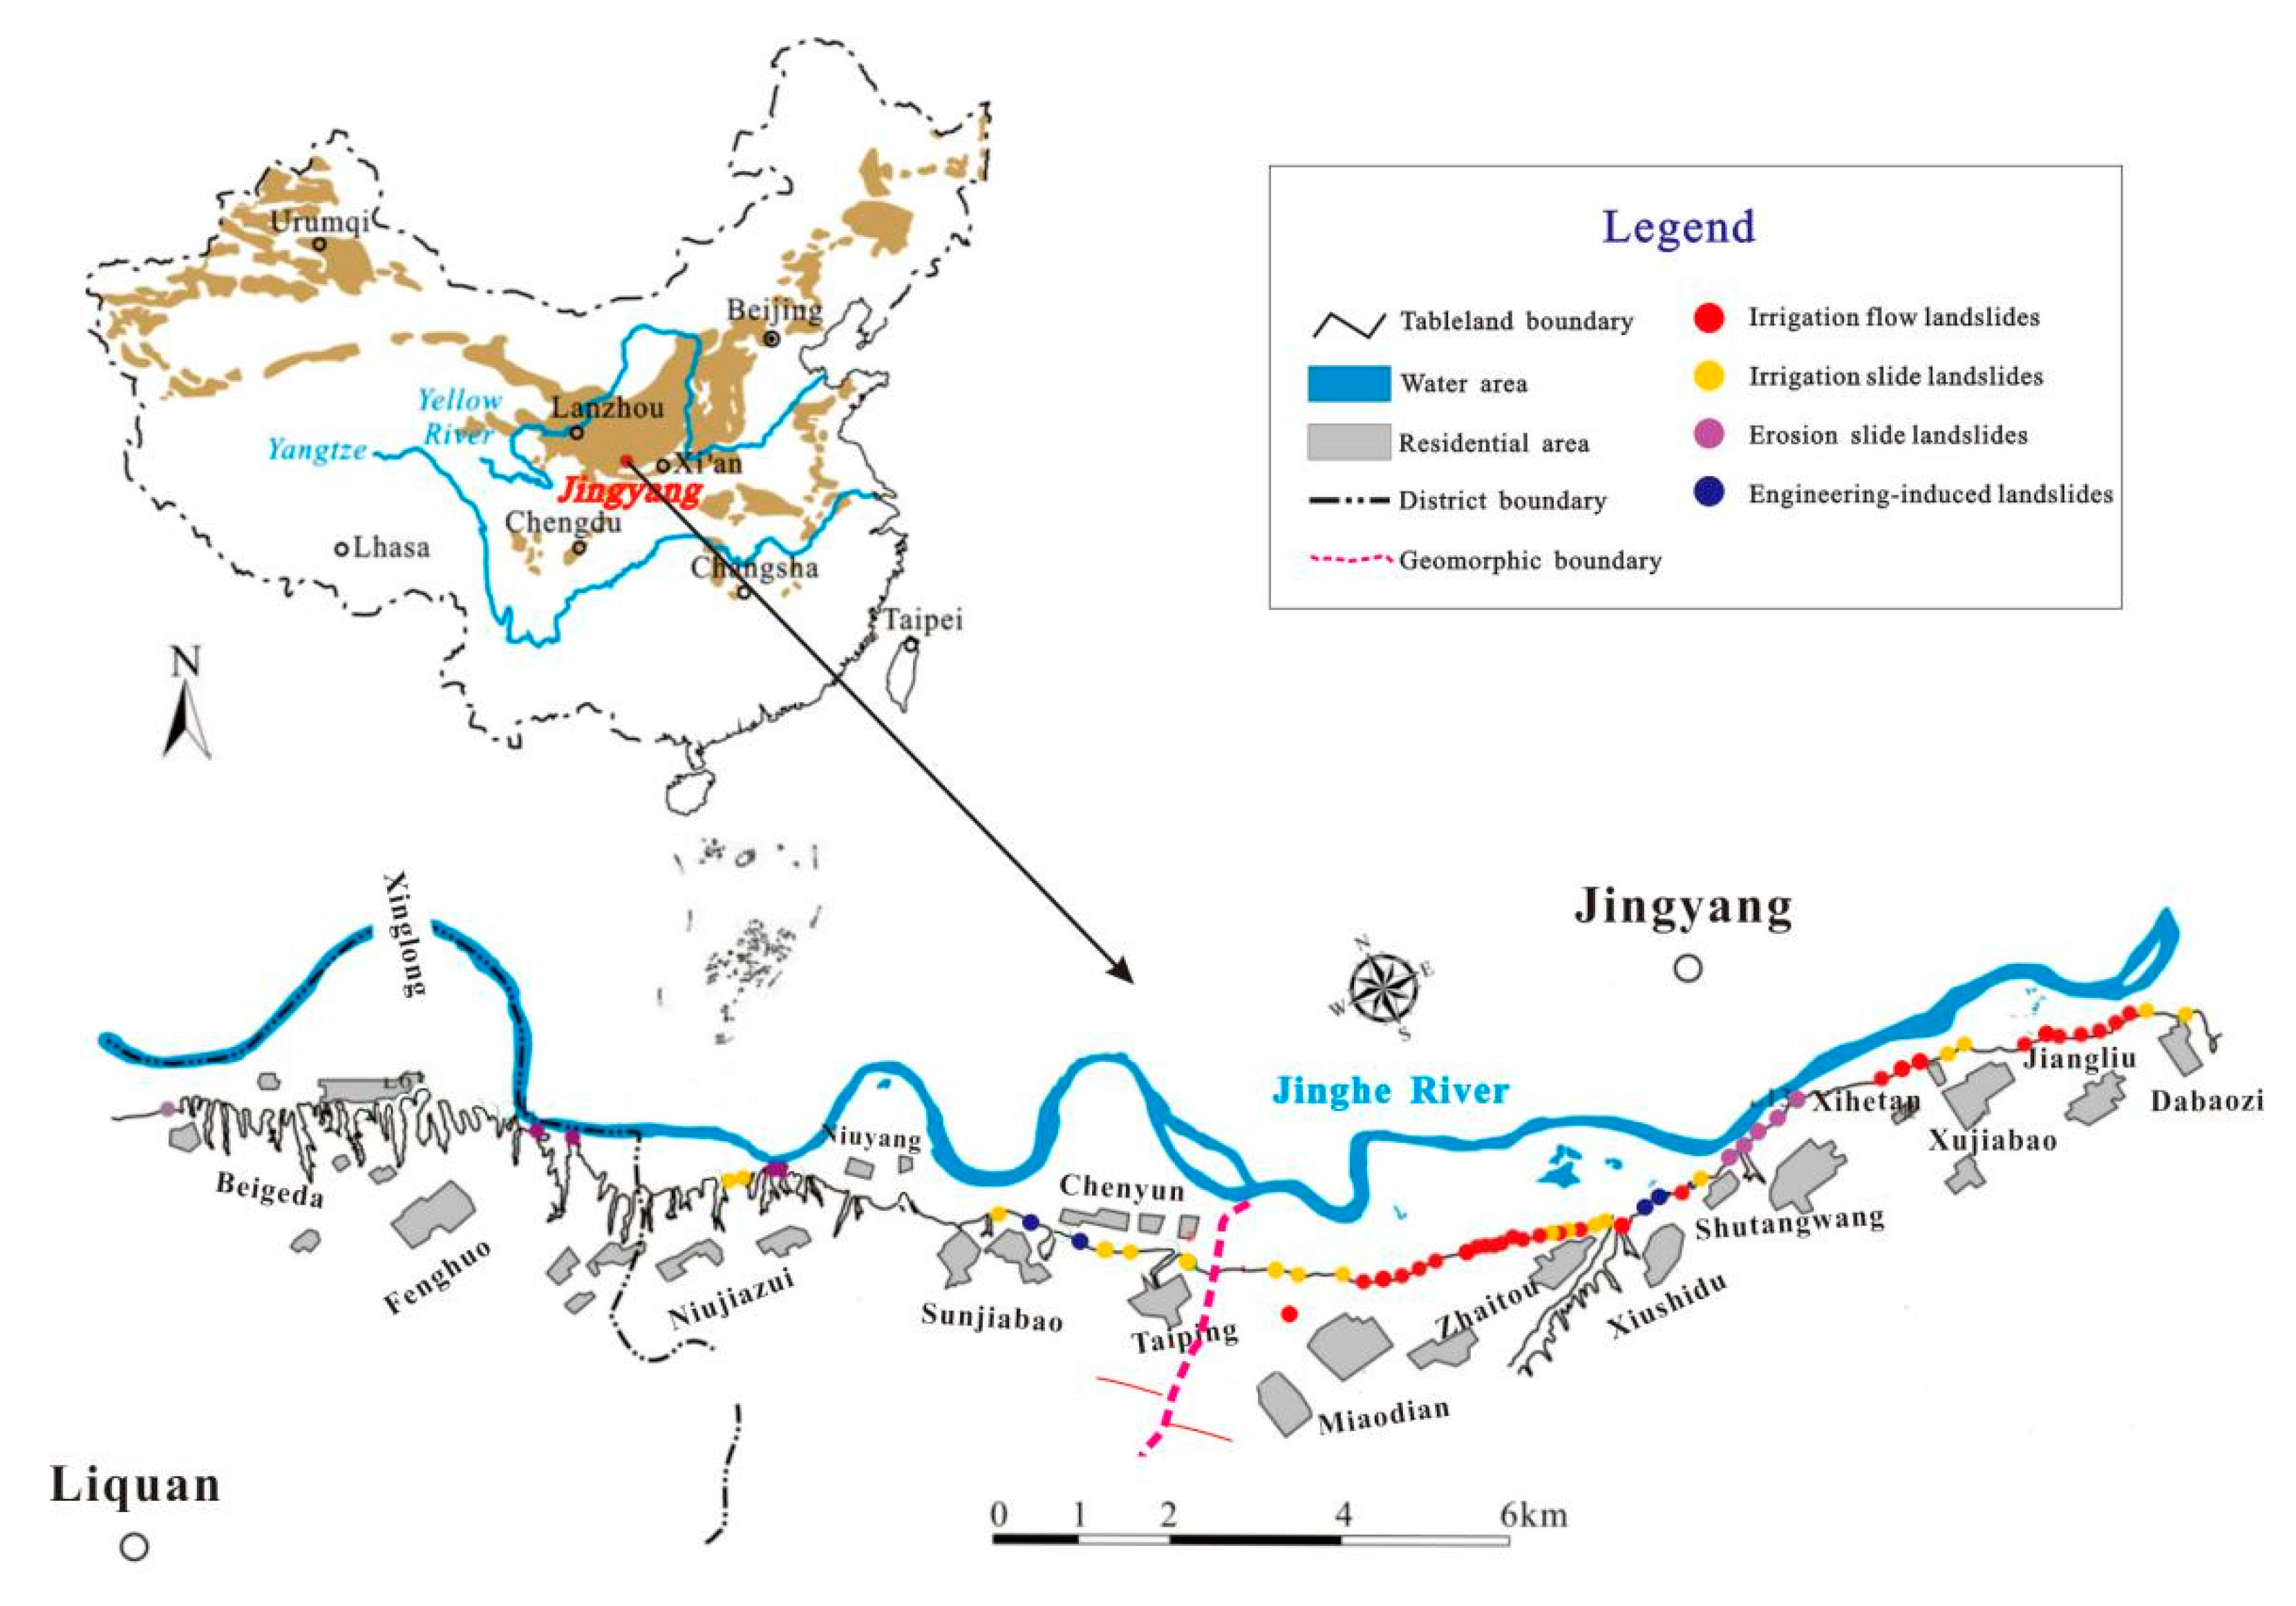
The South Jingyang platform is located in the South Bank of the Jinghe River, Jingyang County, Shaanxi Province. The platform is 30–90 m higher than the Jinghe River, and the altitude is 450–500 m. It is almost parallel to the flow direction of the Jinghe River and is distributed in a belt. The South Jingyang platform presents the east–west extension trend as a whole; the total extension is 28 km; and it mainly spans the Taiping, Jiangliu, and Gaozhuang administrative townships [21]. Under the influence of the buried fault of the Jinghe River, the quaternary loess was uplifted and was deposited on the south of the Jinghe River, and the loess platform was formed [22]. It has been affected by large-scale agricultural irrigation since 1980. As of April 2018, there have been 92 loess landslides on the South Jingyang platform. Among them, sliding had occurred multiple times for 17 landslides, which have caused serious casualties and property losses [23]. Based on the triggering factors and landslide movement characteristics, loess landslides in the study area can be classified into four types [22]: irrigation flow landslides, irrigation slide landslides, erosion slide landslides, and engineering-induced landslides (Figure 1). In previous studies, 92 landslides have been investigated, which include 35 irrigation flow landslides, 37 irrigation slide landslides, 15 erosion slide landslides, and 5 engineering induced landslides (artificial loading, cutting slope toe, engineering disturbance, etc.). The statistical results show that the number of irrigation flow landslides and the irrigation slide landslides in the study area is equivalent, which accounts for 38.04% and 40.22% respectively, which is far more than erosion slide landslides and engineering induced landslides (only 21.73% in total). The irrigation flow landslides largely slide out from the Middle Pleistocene (Q2) loess layer at the slope toe. Since the water content of the slope toe and the silt (or sand gravel) layer at the terrace is large, the soil near the sliding surface can produce high pore water pressures during movement. This makes the soil in the sliding zone liquefy. Even if the terrace slide bed is gentle, it still presents significant high-speed and long-distance characteristics. The plane shape of the sliding mass is primarily semicircular or circular, and the sliding distance is generally 200–300 m. The volume is mostly between hundreds of thousands of square meters to one million square meters, which indicates that these landslides are a medium-sized landslide. The shear opening of irrigation slide landslides is relatively high and is predominantly in the unsaturated loess layer. The irrigation slide landslides are associated with the reduction of suction (shear strength) of the loess matrix caused by the infiltration of surface water such as farmland irrigation. From the perspective of landslide evolution, sliding occurs mainly in the second and third stages of the landslide, while some of the sliding, which results from the deep buried groundwater level, occurs in the first stage.
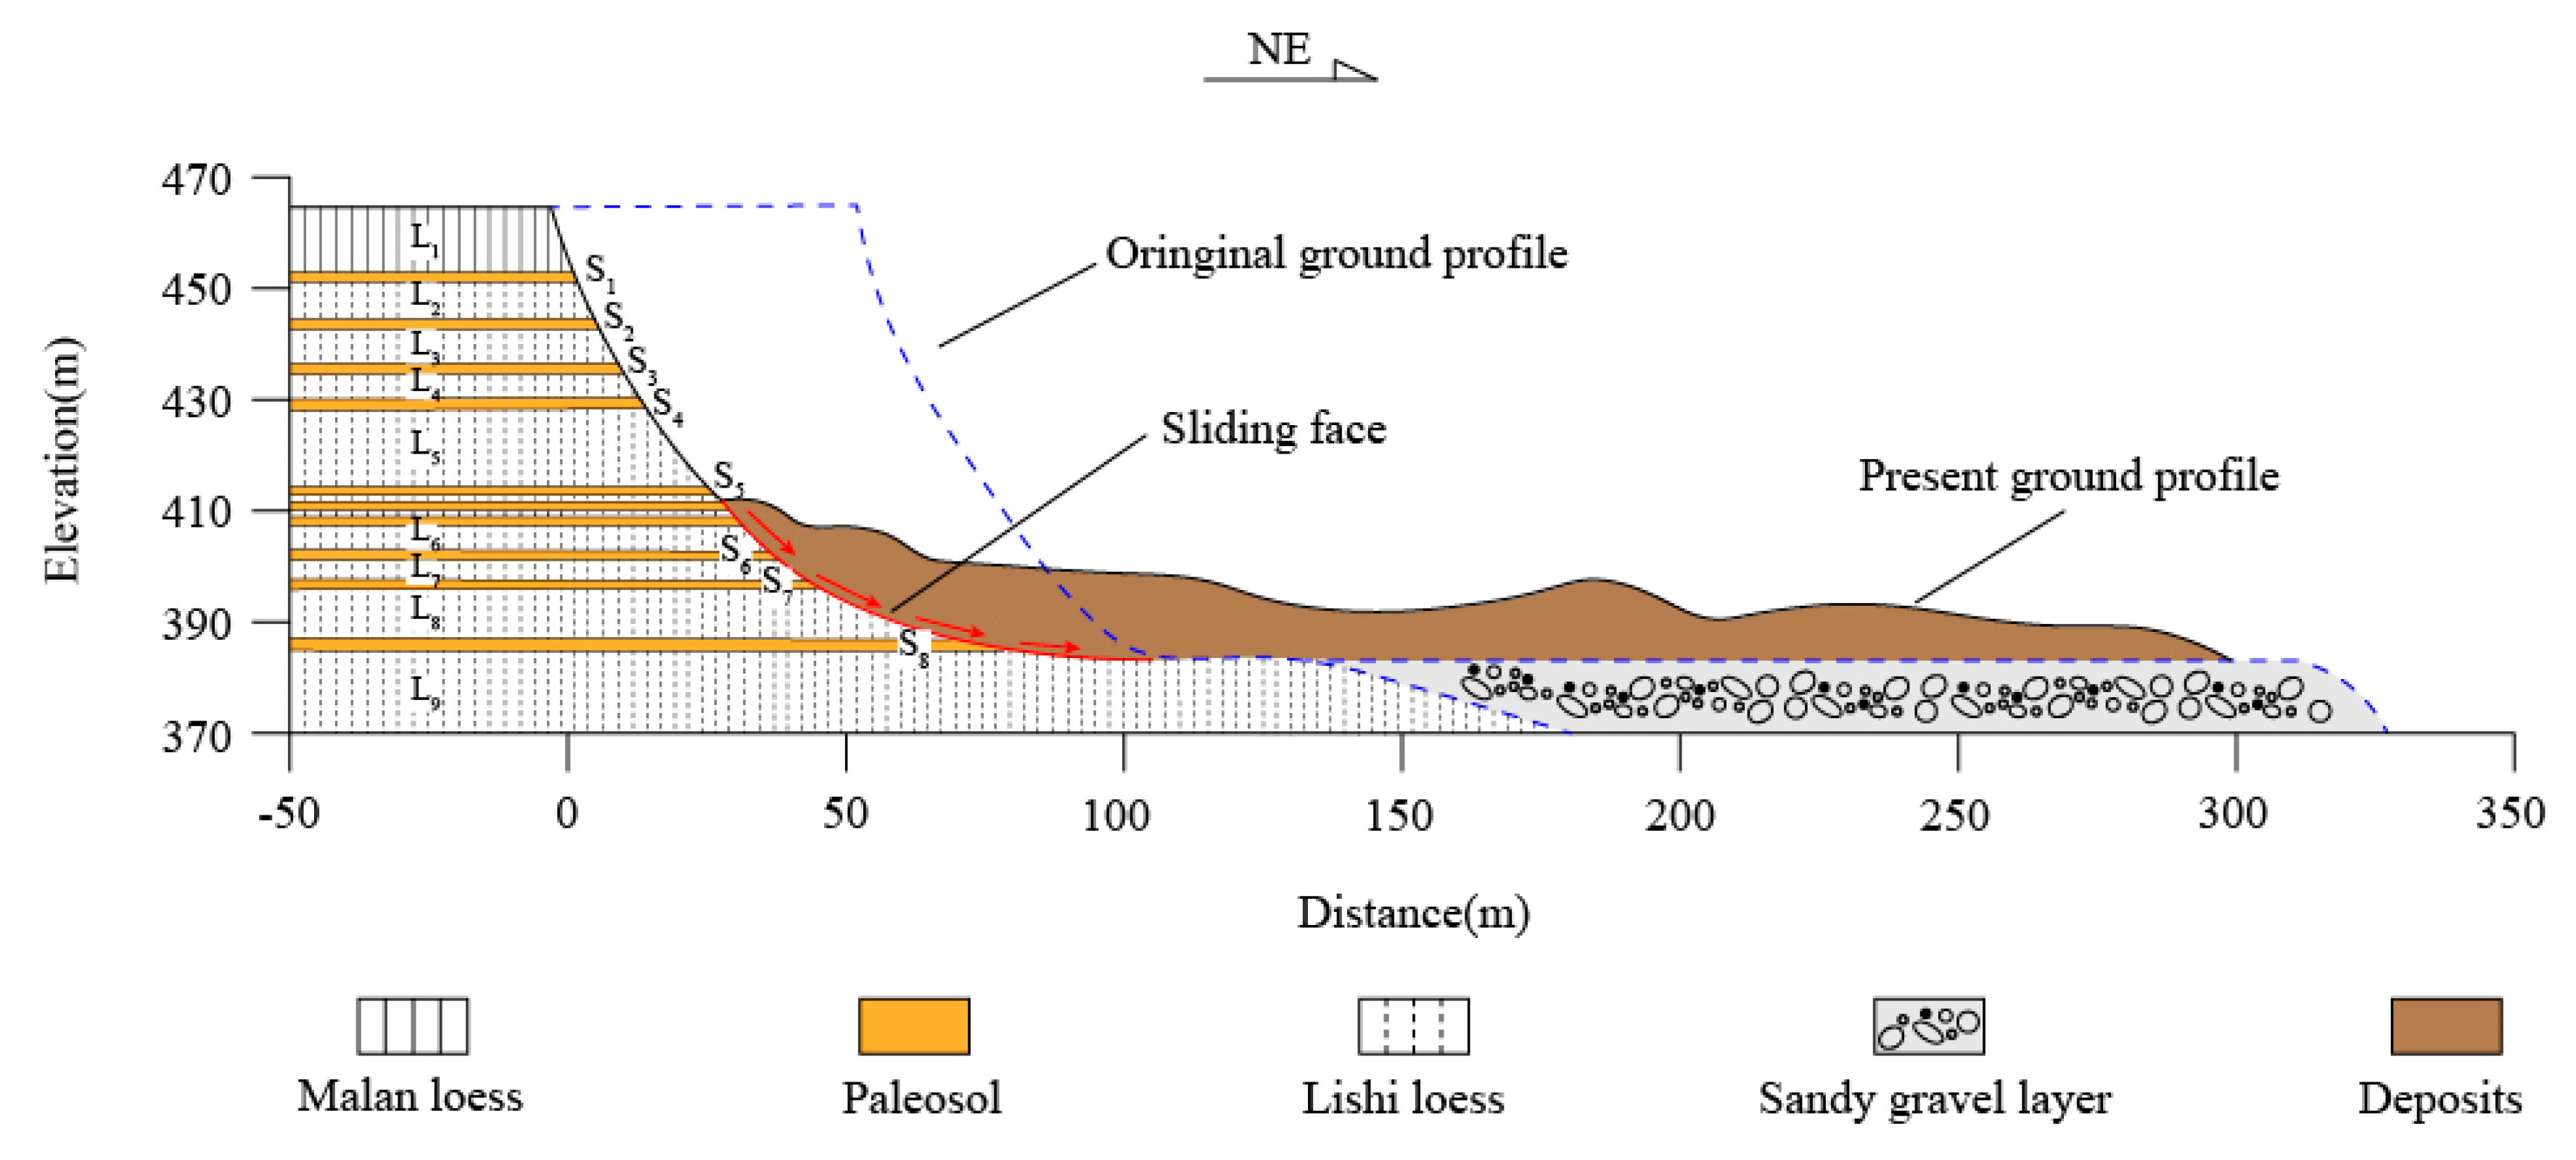
The geological structure of the loess slope exhibits different types of structural planes, including joint fissures and weak planes. In the South Jingyang platform, the joint fissures are mainly the fissures on the edge of the platform, and the weak planes are mainly the loess-paleosol interface. According to a field geological structure survey, fissures within 7 m from the edge of the platform are intensively developed; most of these are unloading fissures. The fissures appear along the top of the platform or are near the steep slope, and they continue to extend and penetrate under the unloading effect. However, due to the cutting action of the steep cliff, the extended length of these fissures is often small. Fissures more than 15 m away from the edge of the platform are primarily collapsible fractures and are predominantly at the top of the platform. Under the action of uneven collapsibility, they extend deeply [12,14]. Although the number of collapsible fissures is less than unloading fissures, the plane extension length and joint opening are larger. Collapsible fissures are the dominant channel for the surface water to infiltrate the loess slope [12,24,25], which can cause the surface water to quickly invade the inside of the landslide body and to accelerate the rise of the groundwater level [21]. The South Jingyang platform presents typical interbedded sequence characteristics of the loess-paleosol [14], and the loess-paleosol contact interface is significant (Figure 2). However, because it is influenced by the tension of the fissures on the edge of the platform, the S1–S5 paleosol layer often breaks, which can easily cause water infiltration. Paleosol has a lower infiltration rate and water-holding capacity than loess does [26] and can be regarded as a natural aquiclude in comparison with loess [14]. The accumulation of surface water near the interface of a certain loess-paleosol is enhanced by the infiltration-promoting effect of the fissures on the edge of the platform. This causes the bottom of the Lishi loess to be saturated, which produces the saturated softening layer. Therefore, liquefaction may occur at the loess-paleosol interface, after which the saturated softening layer becomes the bottom sliding surface of the landslide [27].
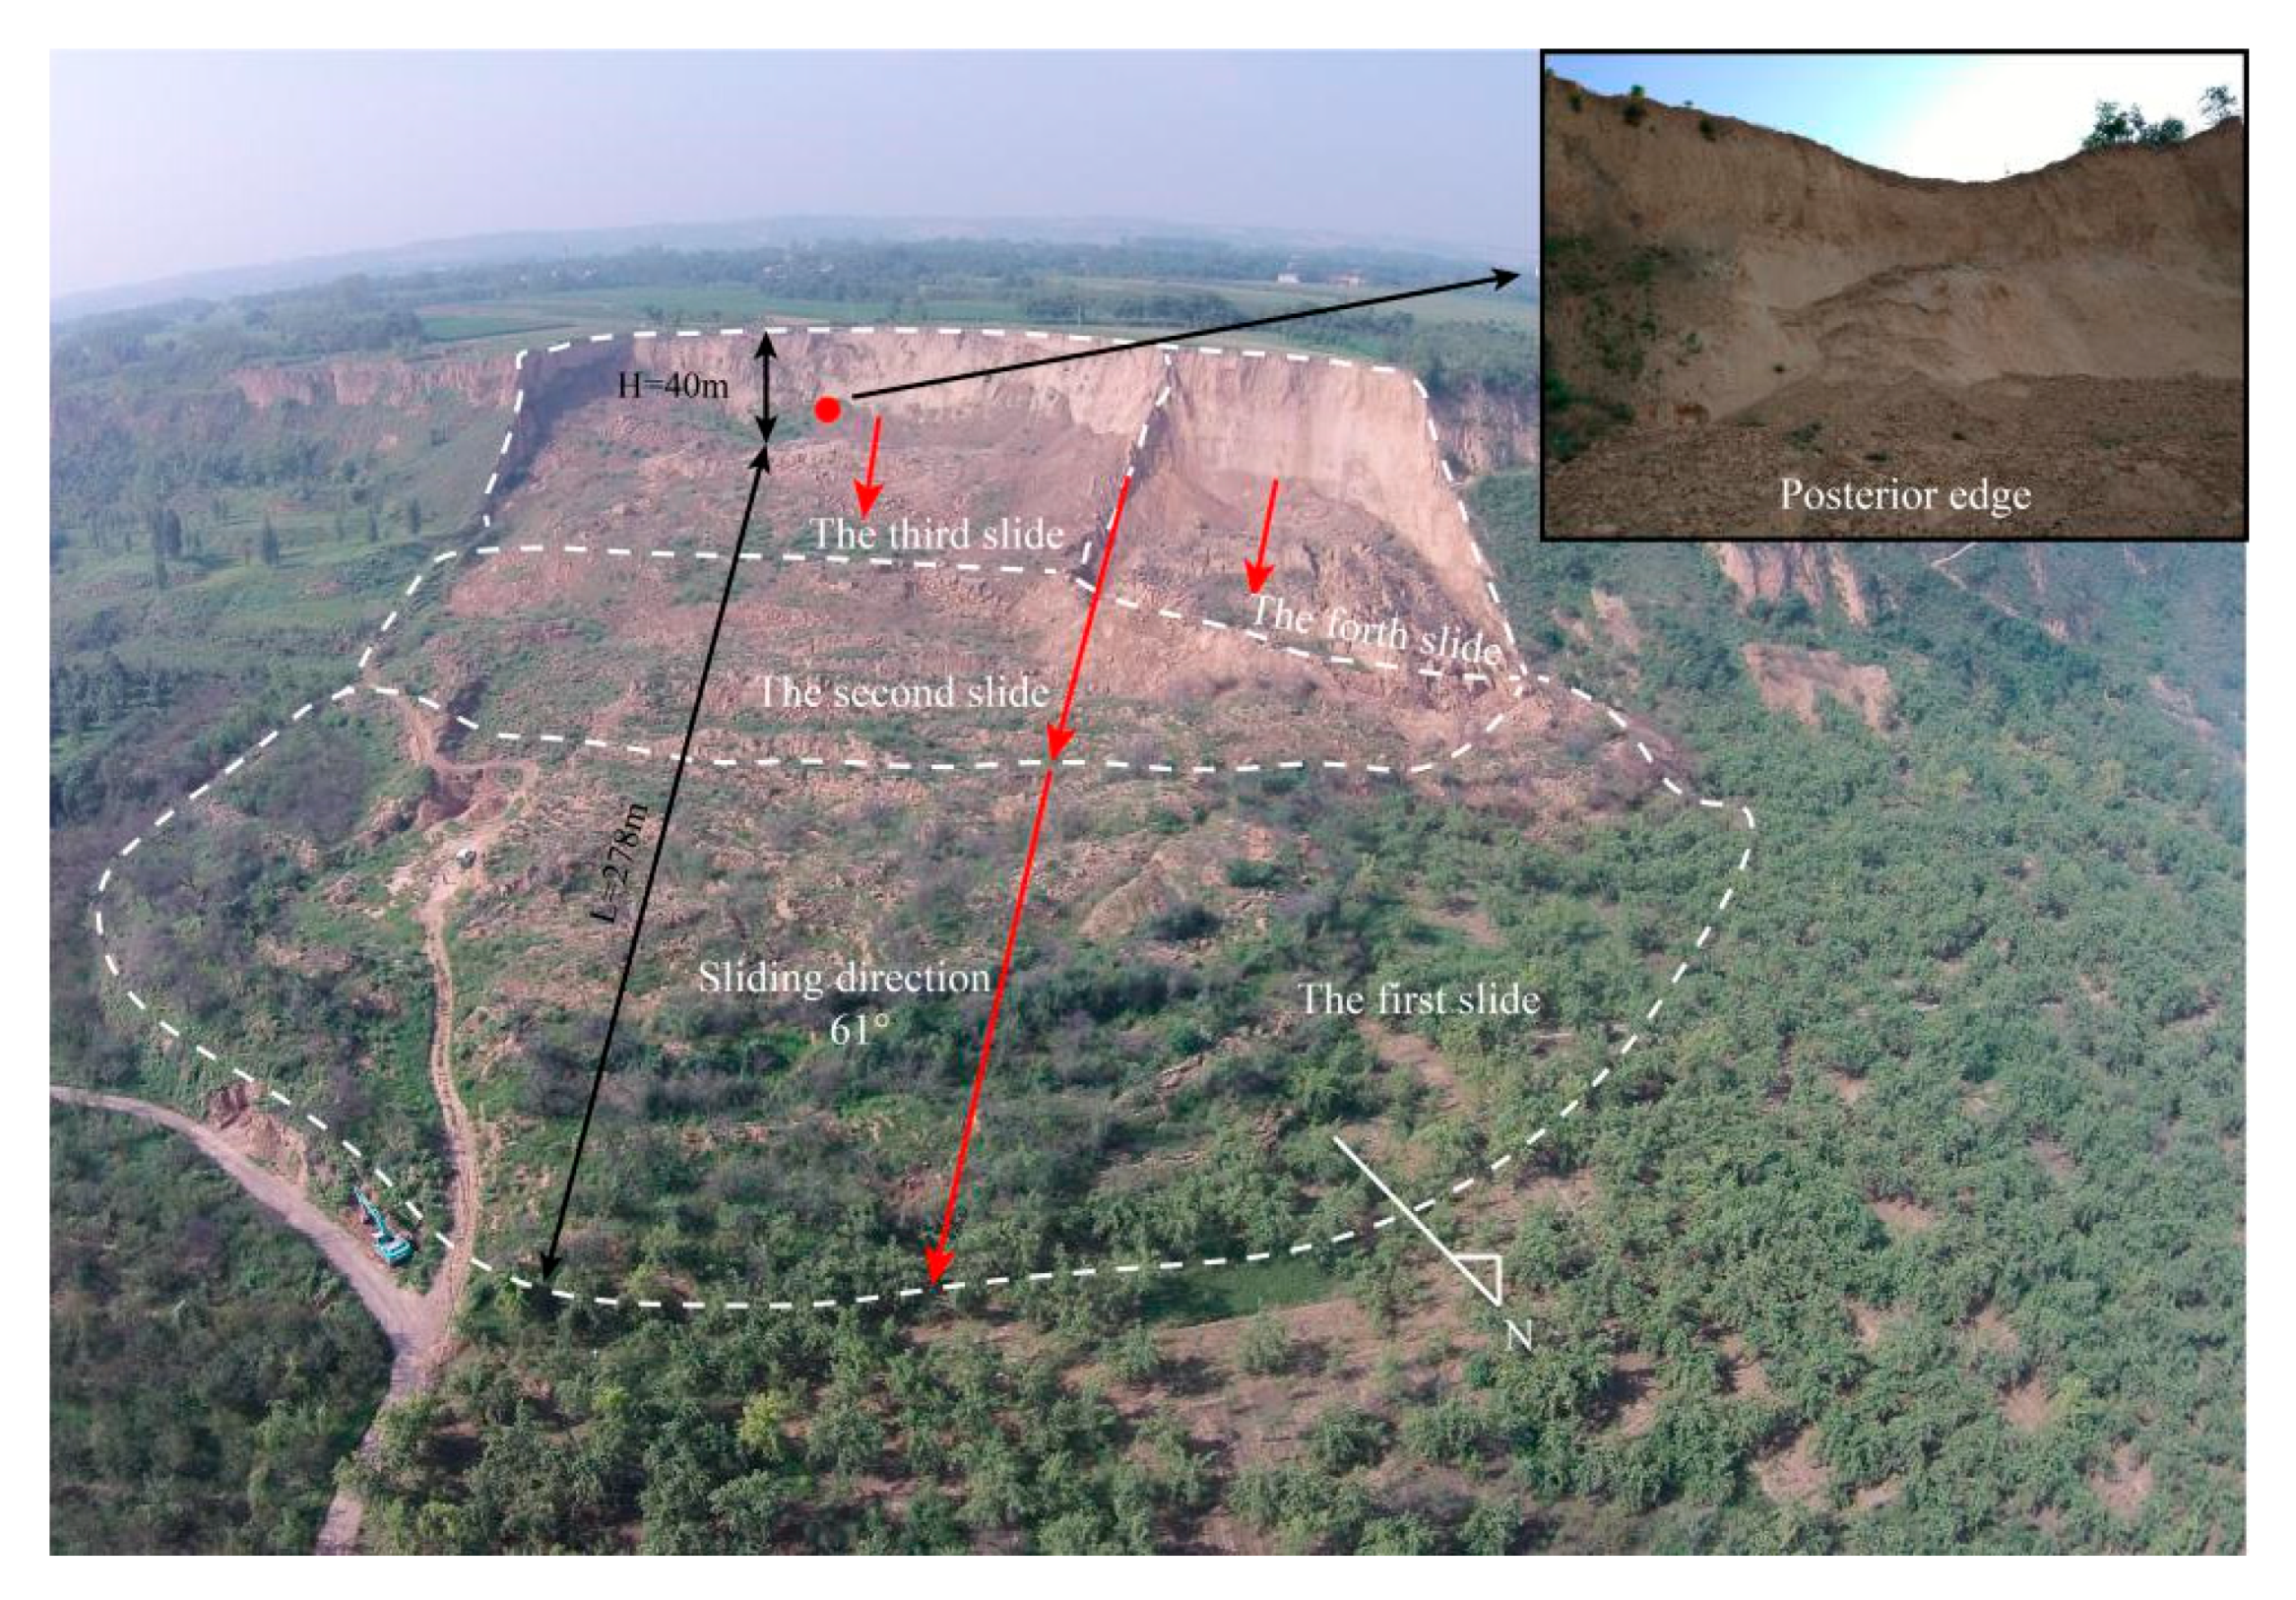
At about 10:00 AM on 26 July 2014, a large-scale loess landslide occurred in Hetan village, Western Miaodian. This can be regarded as the first large-scale landslide because of the long-time interval from the Western Miaodian landslide in 1987. In fact, four landslides occurred on 26–28 May 2015 and 7–8 August 2015. However, with the increase in the sliding sequence, the volume in the landslide decreased gradually [12]. This indicates that the landslide that occurred on July 26, 2014 had a triggering effect. The main sliding direction of the landslide was NE61°, which is slightly different from that of the 1987 landslide (NE48°). A giant sliding body with a sliding distance of 278 m and a total volume of about 50 × 104 m3 was formed (Figure 3). The posterior wall of the landslide was about 40 m high and 222 m wide, and it was characterized by a typical concave ring chair. The top 10–15 m was vertical and was controlled by the Late Pleistocene (Q3) and Q2 loess vertical joints. There were five paleosol layers that were exposed, and the landslide started from the vicinity of the fifth paleosol layer; moreover, the water retention effect of the paleosol layer was significant. In addition, the sliding surface of the posterior wall was smooth, and the water content was high.
3. Experimental Samples and Process
Based on the above investigation and analysis, the occurrence of landslides in this region is closely related to static liquefaction. In order to further analyze the evolution process and the typical characteristics of the static liquefaction of loess in this region, a static liquefaction test was conducted. In addition, because the thickness of the Holocene (Q4) loess (generally ≤ 5 m), Late Pleistocene (Q3) Malan loess (generally < 10 m), and other new loess were not large, these were mainly located at the top of the loess slope. Their failure mode was mainly a tensile fracture, and shear liquefaction was unlikely to occur. Although the Middle Pleistocene (Q2) Lishi loess (10–70 m) was the main component of the loess slope in the study area, shear failure and sliding were the main failure modes in this layer. Therefore, the Q2 loess was selected for the ICU tests.
3.1. Experimental Samples
The undisturbed loess samples were acquired from the Zhaitou (ZT) and Shutangwang (STW) landslide. Among them, the ZT loess samples were obtained from the adit of the posterior wall of the landslide. The sampling location is about 21 m away from the top of the platform, and the corresponding stratum number is L2. The ZT loess samples were yellow-brown, slightly wet, and have slightly dense uniform soil. The samples were mainly composed of silt particles. In addition, needle pores, a small amount of snail shell fragments, and concretions were found in the samples. The STW loess samples were obtained from the surface of the posterior wall of the landslide. The sampling location is about 17 m away from the top of the platform, and the corresponding stratum number is L2. The STW loess samples were light yellow-brown and dry, and its other characteristics were like those of the ZT loess samples. The ZT and STW loess consisted of Q2 Lishi loess.
The physical properties of the samples were determined by referring to the relevant provisions of the standard for the soil test method (GB/T 50123-1999) [28]. The water content was measured using the drying method; the density was measured using the round knife method; and the dry density value was obtained via conversion. The specific gravity was measured using the pycnometer method, and the liquid limit and plastic limit water content were determined using the combined liquid plastic limit method. The basic physical properties of the two loesses are shown in Table 1.
It can be observed from Table 1 that the physical properties of the ZT and STW Q2 loess were close except for the water content. ZT loess samples were procured from the adit, while the STW loess samples were procured from the surface of the slope. Due to the water evaporation at the surface loess, the measured water content of the STW loess samples was relatively low. The liquid index of the two loess was less than zero and the plasticity index was low. This indicates that their plasticity in the natural state was low.
In addition, a laser particle size analyzer was used to analyze the grading of two Q2 loess samples, and a semi quantitative analysis of their mineral compositions was performed using an X-ray diffractometer. The selected diffraction angle was 0.5–30°. The specific results are presented in Table 2.
As shown in Table 2, the particle composition of the ZT and STW Q2 loess were quite similar, with the proportion of the silt being the most, clay being the second, and fine sand being the least. Meanwhile, the corresponding mineral composition and content were highly similar. The highest content was quartz and carbonate, which constituted the main components of the cement and the skeleton of the loess. Clay minerals mainly consisted of illite, chlorite, and a relatively small amount of kaolinite. The hydrophilic characteristics of illite and chlorite were obvious, which makes it easy for the clay minerals to agglomerate and to form tuberculosis under water saturation conditions. The above mineral composition objectively revealed the typical structural characteristics of the loess in the area.
3.2. Experimental Process
In view of the typical characteristics of the static liquefaction phenomenon of the South Jingyang platform landslide: the pore water of the saturated loess caused by the groundwater immersion cannot be discharged in time during the shear process, which caused the pore water pressure to continue rising and to maintain a high level. Therefore, to accurately reflect the stress state of the saturated loess during the sliding of the loess slope, isotropic consolidated undrained (ICU) triaxial tests were conducted on ZT and STW loess. In addition, to further explore the internal mechanism of the static liquefaction of loess in this area and finding the internal relationship between the static liquefaction and the microstructure characteristics directly, it is necessary to observe and analyze the microstructure of the ZT and STW loess before and after the ICU tests. The specific experimental process is as follows:
- (1)
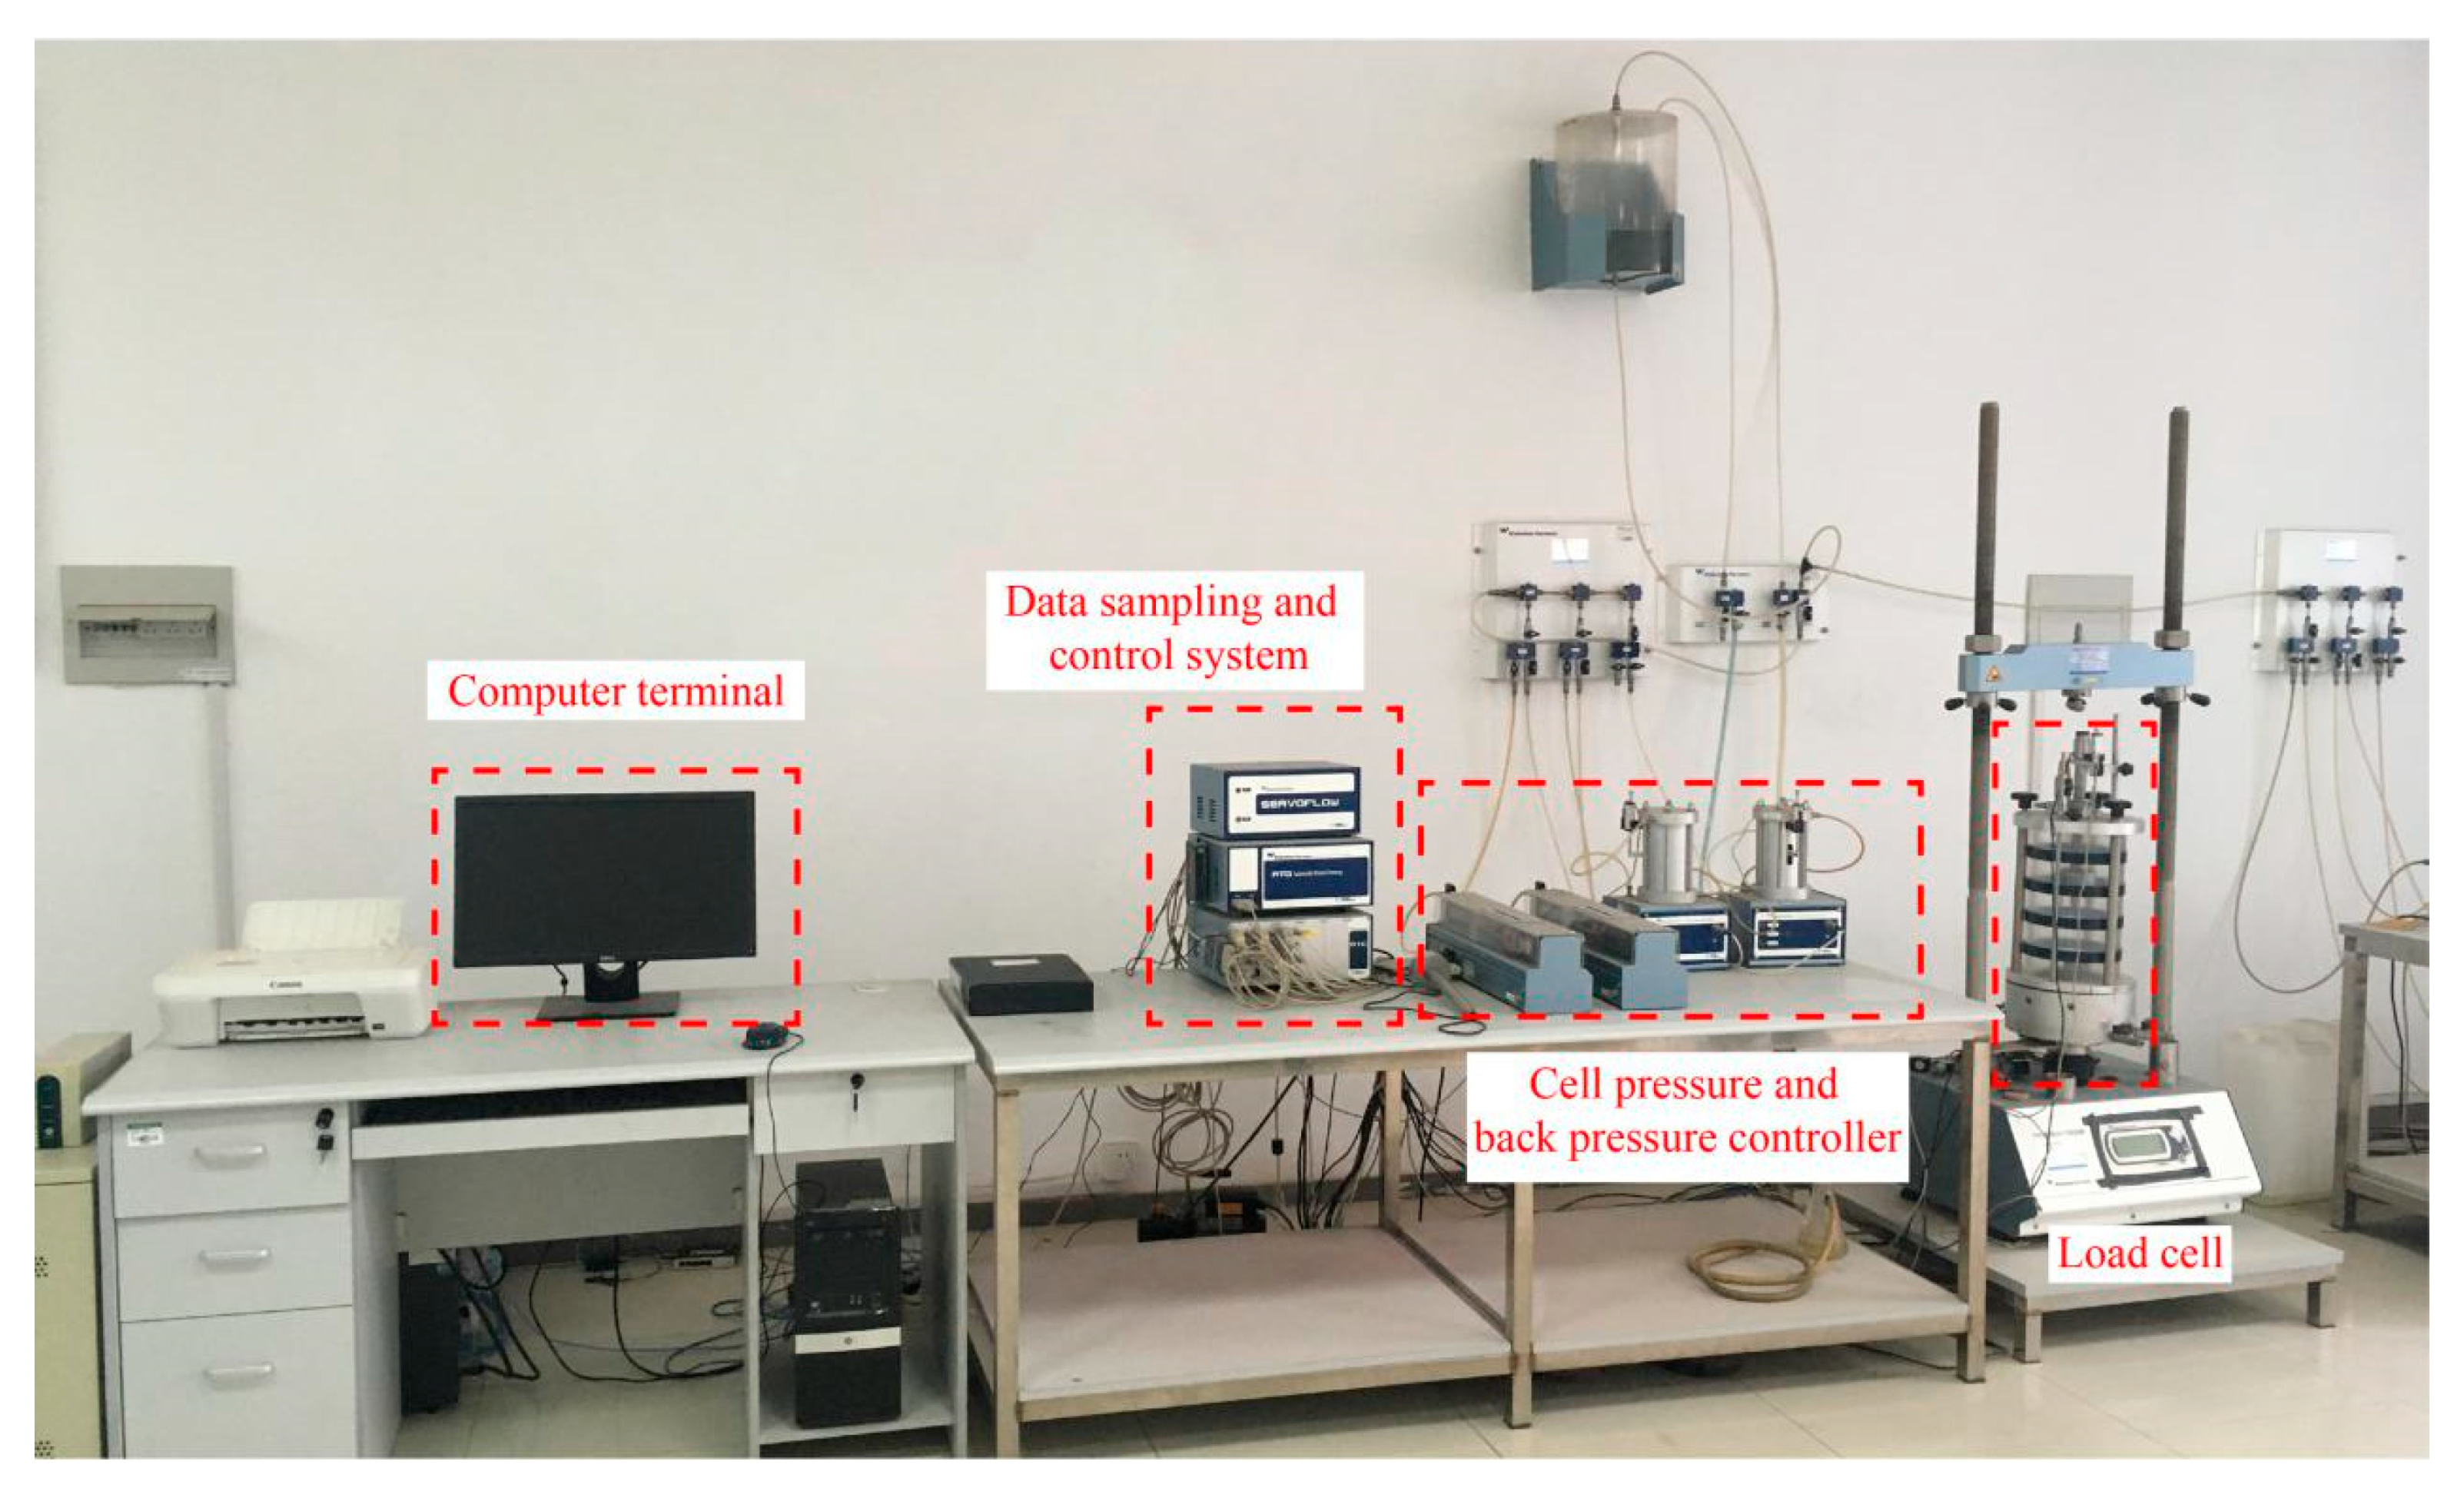
- The undisturbed loess samples were molded into Φ50 mm × 100 mm cylinders according to the requirements of the standard for the soil test method (GB/T 50123-1999) [28]; and these cylinders were placed in the load cell of the Wykeham Farrance (WF, Wykeham Farrance, Milan, Italy) stress path triaxial apparatus (Figure 4). After connecting the pressure sensor, pore water pressure sensor, cell pressure controller, and the back pressure controller with the corresponding port of the load cell, the WF stress path triaxial apparatus was used to carry out the back pressure saturation treatment on the undisturbed loess. ① A 50 kPa cell pressure was applied to the samples, and the back pressure was set at 10 kPa lower than the cell pressure to prevent structural damage of the samples caused by the pore water pressure, which is higher than the confining pressure. After the back pressure inflow was stable, the back pressure was kept constant for 6–8 h to make the water gradually infiltrate the samples. ② Under the premise of ensuring that the cell pressure was 10 kPa higher than the back pressure, the cell pressure and back pressure were applied to the samples step by step. Each stage was increased by 50 kPa and it remained for 6–8 h before conducting the next stage. ③ When the B value was higher than 0.95, the samples were considered to be saturated. Multiple tests showed that the undisturbed loess samples generally required an applied back pressure that ranged from 190 to 240 kPa, and in 1–2 days to ensure that the soil sample reached the saturation state.
- (2)
- To reflect the discrepancy in the static liquefaction characteristics of the undisturbed loess under the different confining pressures (σc′), four confining pressures (150 kPa, 250 kPa, 350 kPa, and 450 kPa, corresponding to the numbers 1–4, respectively, for the ZT and STW loess) were selected. After the saturation of the loess (B ≥ 0.95), the cell pressure and back pressure (the cell pressures were 150 kPa, 250 kPa, 350 kPa, and 450 kPa higher than the back pressure) were set appropriately to ensure that the sample would be isotropically consolidated under four confining pressures. When the confining pressure attained the set value and remained stable, the drainage valve was opened to start the consolidation. In the consolidation process, the pore water pressure and volumetric strain changed rapidly at first and then it tended to be gradually stable. When the pore water pressure dissipated to more than 95% and the volumetric strain remained stable, the consolidation was completed.
- (3)
- After the back pressure saturation and isotropic consolidation, undrained triaxial tests were conducted with a 0.1 mm/min shear rate, according to the relevant provisions of the standard for the soil test methods (GB/T 50123-1999) [28]. To observe the strength change characteristics after the peak value more clearly, a 25% axial strain was taken as the termination condition of these tests.
- (4)
- For preparing the cylindrical samples for the ICU tests, cube samples with a side length of 1–2 cm had to be fabricated. Freeze-drying and section gold spraying treatments were performed successively on the cube samples. Then, the samples were placed under a field emission scanning electron microscope (JSM-7610F) and observed under different magnifications (500× and 2000×). The 500× magnification was used for observing the overall pore structure of the section, and 2000× magnification was used for observing of the occurrence and contact arrangement of the different particles. Five areas were randomly scanned at each magnification.
4. Results
4.1. Macroscopic Characteristics Analysis of the Shear Failure and Static Liquefaction
At first, the stress-strain characteristics under the different confining pressures were studied to obtain the liquefaction potential index (LPI) evolution process of the undisturbed loess. Moreover, the variation law of the pore water pressure and the influence of the confining pressures on the pore water pressure were analyzed. Finally, the evolution process of the static liquefaction was determined.
4.1.1. Stress-Strain Characteristics Analysis
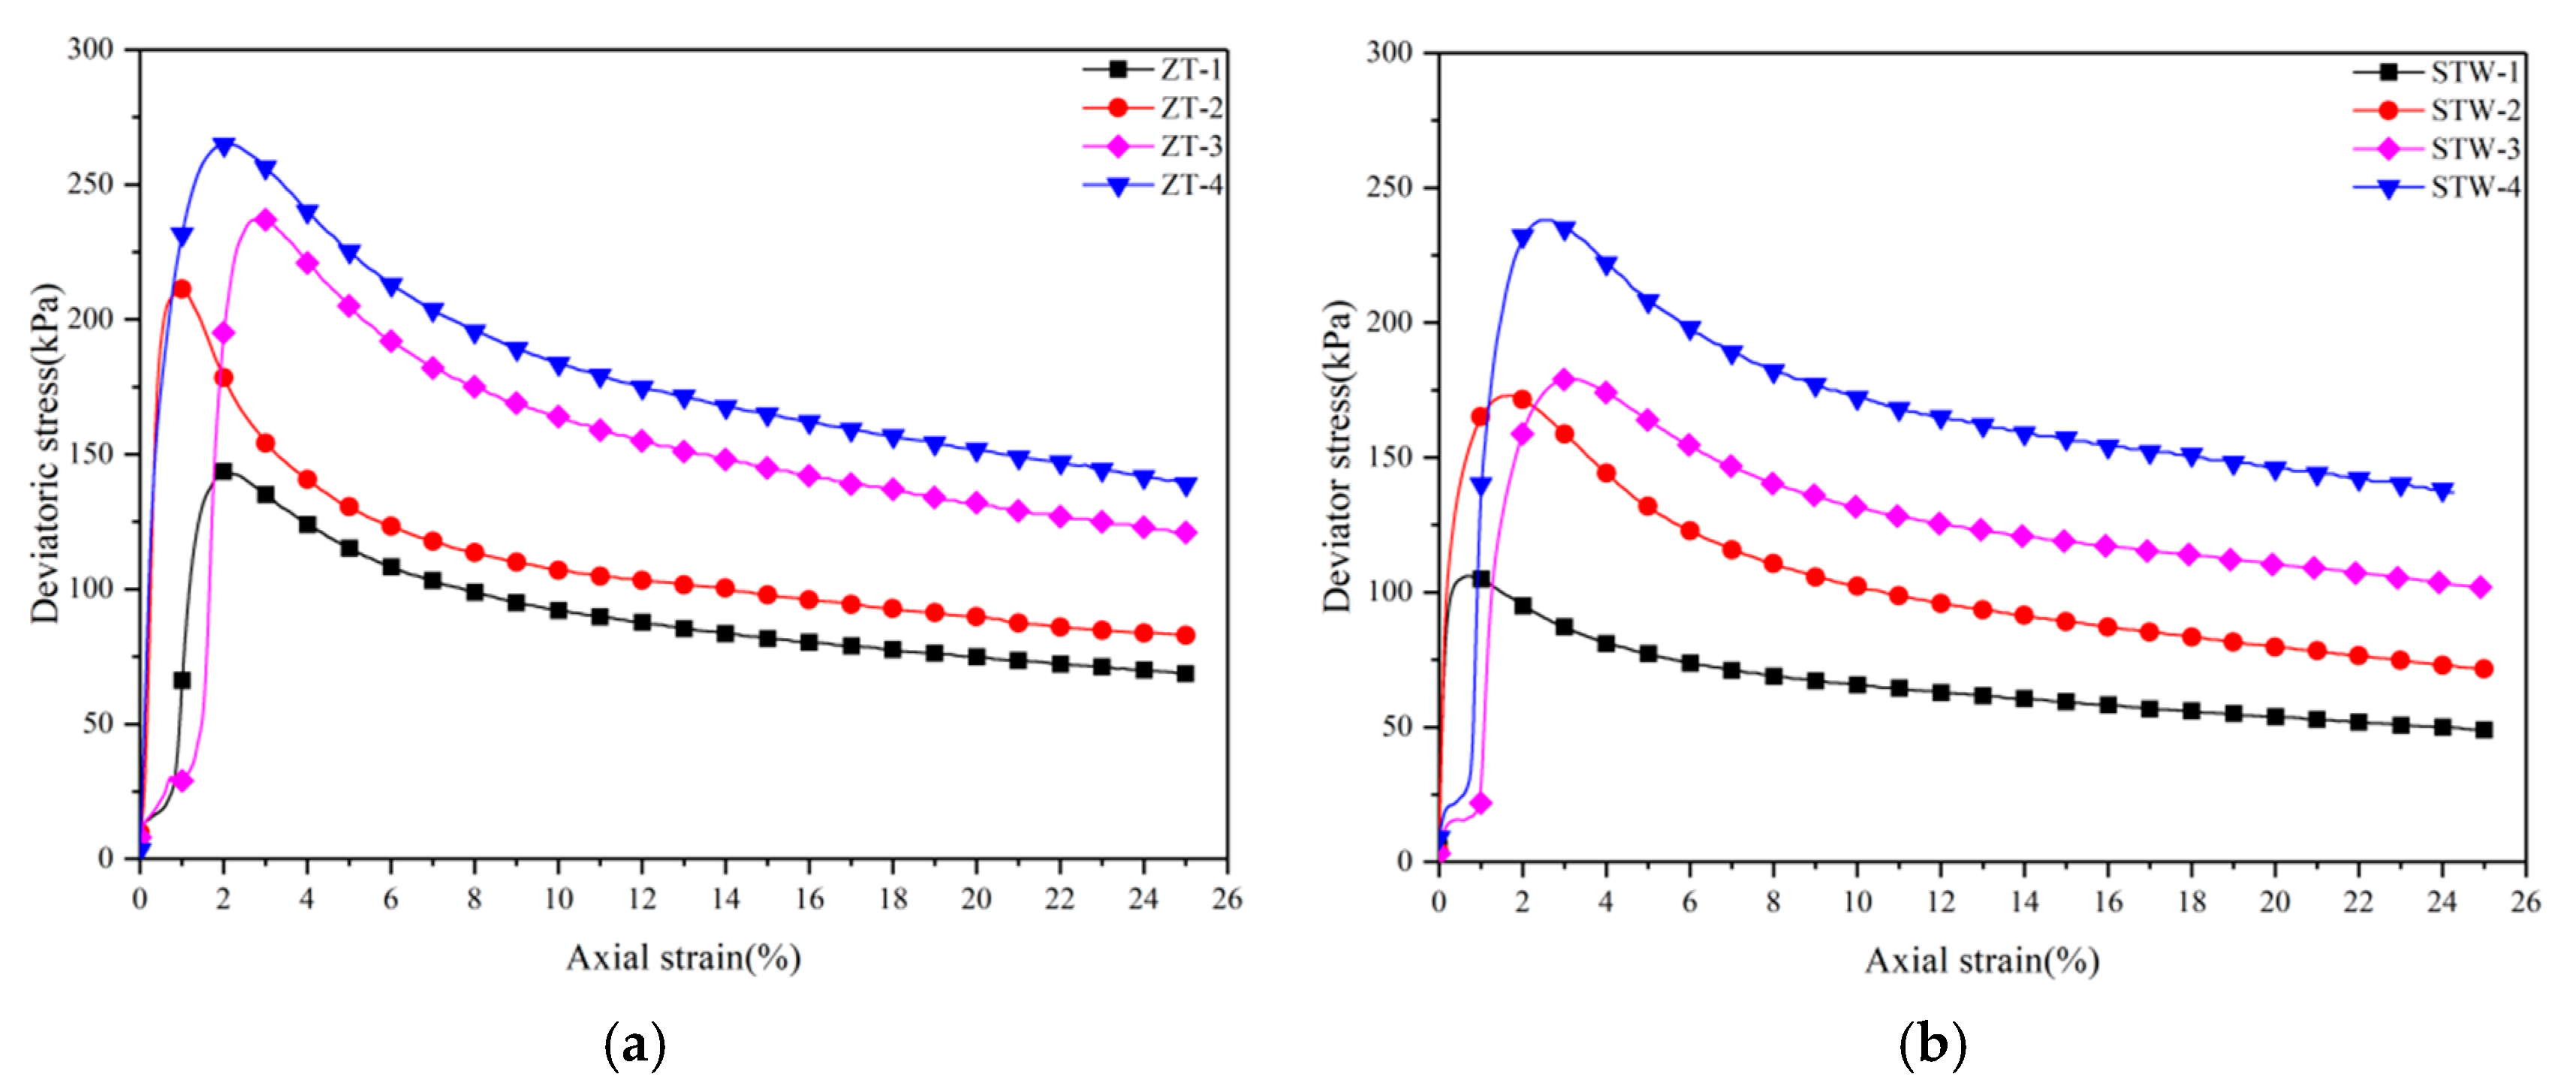
Based on the experimental data from the ICU tests, the stress-strain curves of the ZT and STW undisturbed loess under the confining pressures of 150 kPa, 250 kPa, 350 kPa, and 450 kPa were plotted (Figure 5).
It can be observed from Figure 5 that the stress-strain curves of the ZT and STW loess under the different confining pressures had a similar change in the trends, and all of them present obvious strain softening characteristics [12]. The stress-strain curves can be divided into three stages.
- (1)
- Rapid strain hardening stage: At the initial stage of loading, when the axial strain is very small (εa < 3%), the deviator stress rises rapidly and reaches the peak value. The stress-strain curve of this stage is close to the straight line. The larger the confining pressure is, the greater the deviator stress peak value is. The stress-strain curves in this stage indicate that the internal spaced pore structure is compressed under the action of the external load, and that the contact between the particles is closer [29].
- (2)
- Rapid strain softening stage: When the peak strength is reached, the deviator stress decreases sharply, and the corresponding axial strain is about 1–3%. This indicates that the spaced pore structure may be damaged after compression with the increase in strain, and the ability to resist deformation is evidently weakened. There is a strain threshold (εap) between the compression and the failure of the pore structure, which reflects that the structural loess requires a certain compression deformation to undergo structural failure. The stress-strain curves of the ZT and STW loess show that εap is always in a certain range (generally between 1 and 3%). The stress-strain curves of the undisturbed loess in the South Jingyang platform provide similar results [9,12,15,30].
- (3)
- Stable strain softening stage: When the axial strain reaches a certain value (εa = 10–15%), the stress tends to be stable with an increase in the strain. This shows that the strength of the soil structure softens after it has been destroyed. The clay aggregates, which are inlaid with the large framework of the silt particles, may gradually fall into the pore throat channel; this results in the reorganization of the loess structure [16]. With the continuous increase in the strain, the reorganization process of the loess structure tends to be stable, and its initial structure is completely destroyed under the action of the shear stress. In addition, the new orientation arrangement has statistically reached a stable state [31]. Therefore, in the ICU tests of the saturated undisturbed loess, when the axial strain reaches 10–15%, the loess is considered to undergo steady-state deformation. When the loess reaches a steady state, its shear resistance is known as the steady-state strength [32]. Compared with its peak strength, the steady-state strength is about 0.4–0.6. Therefore, there is the possibility of static liquefaction. The above structural changes can also find the corresponding intuitive evidence in the later microstructure morphology analysis.
4.1.2. Variation Analysis of the Pore Water Pressure
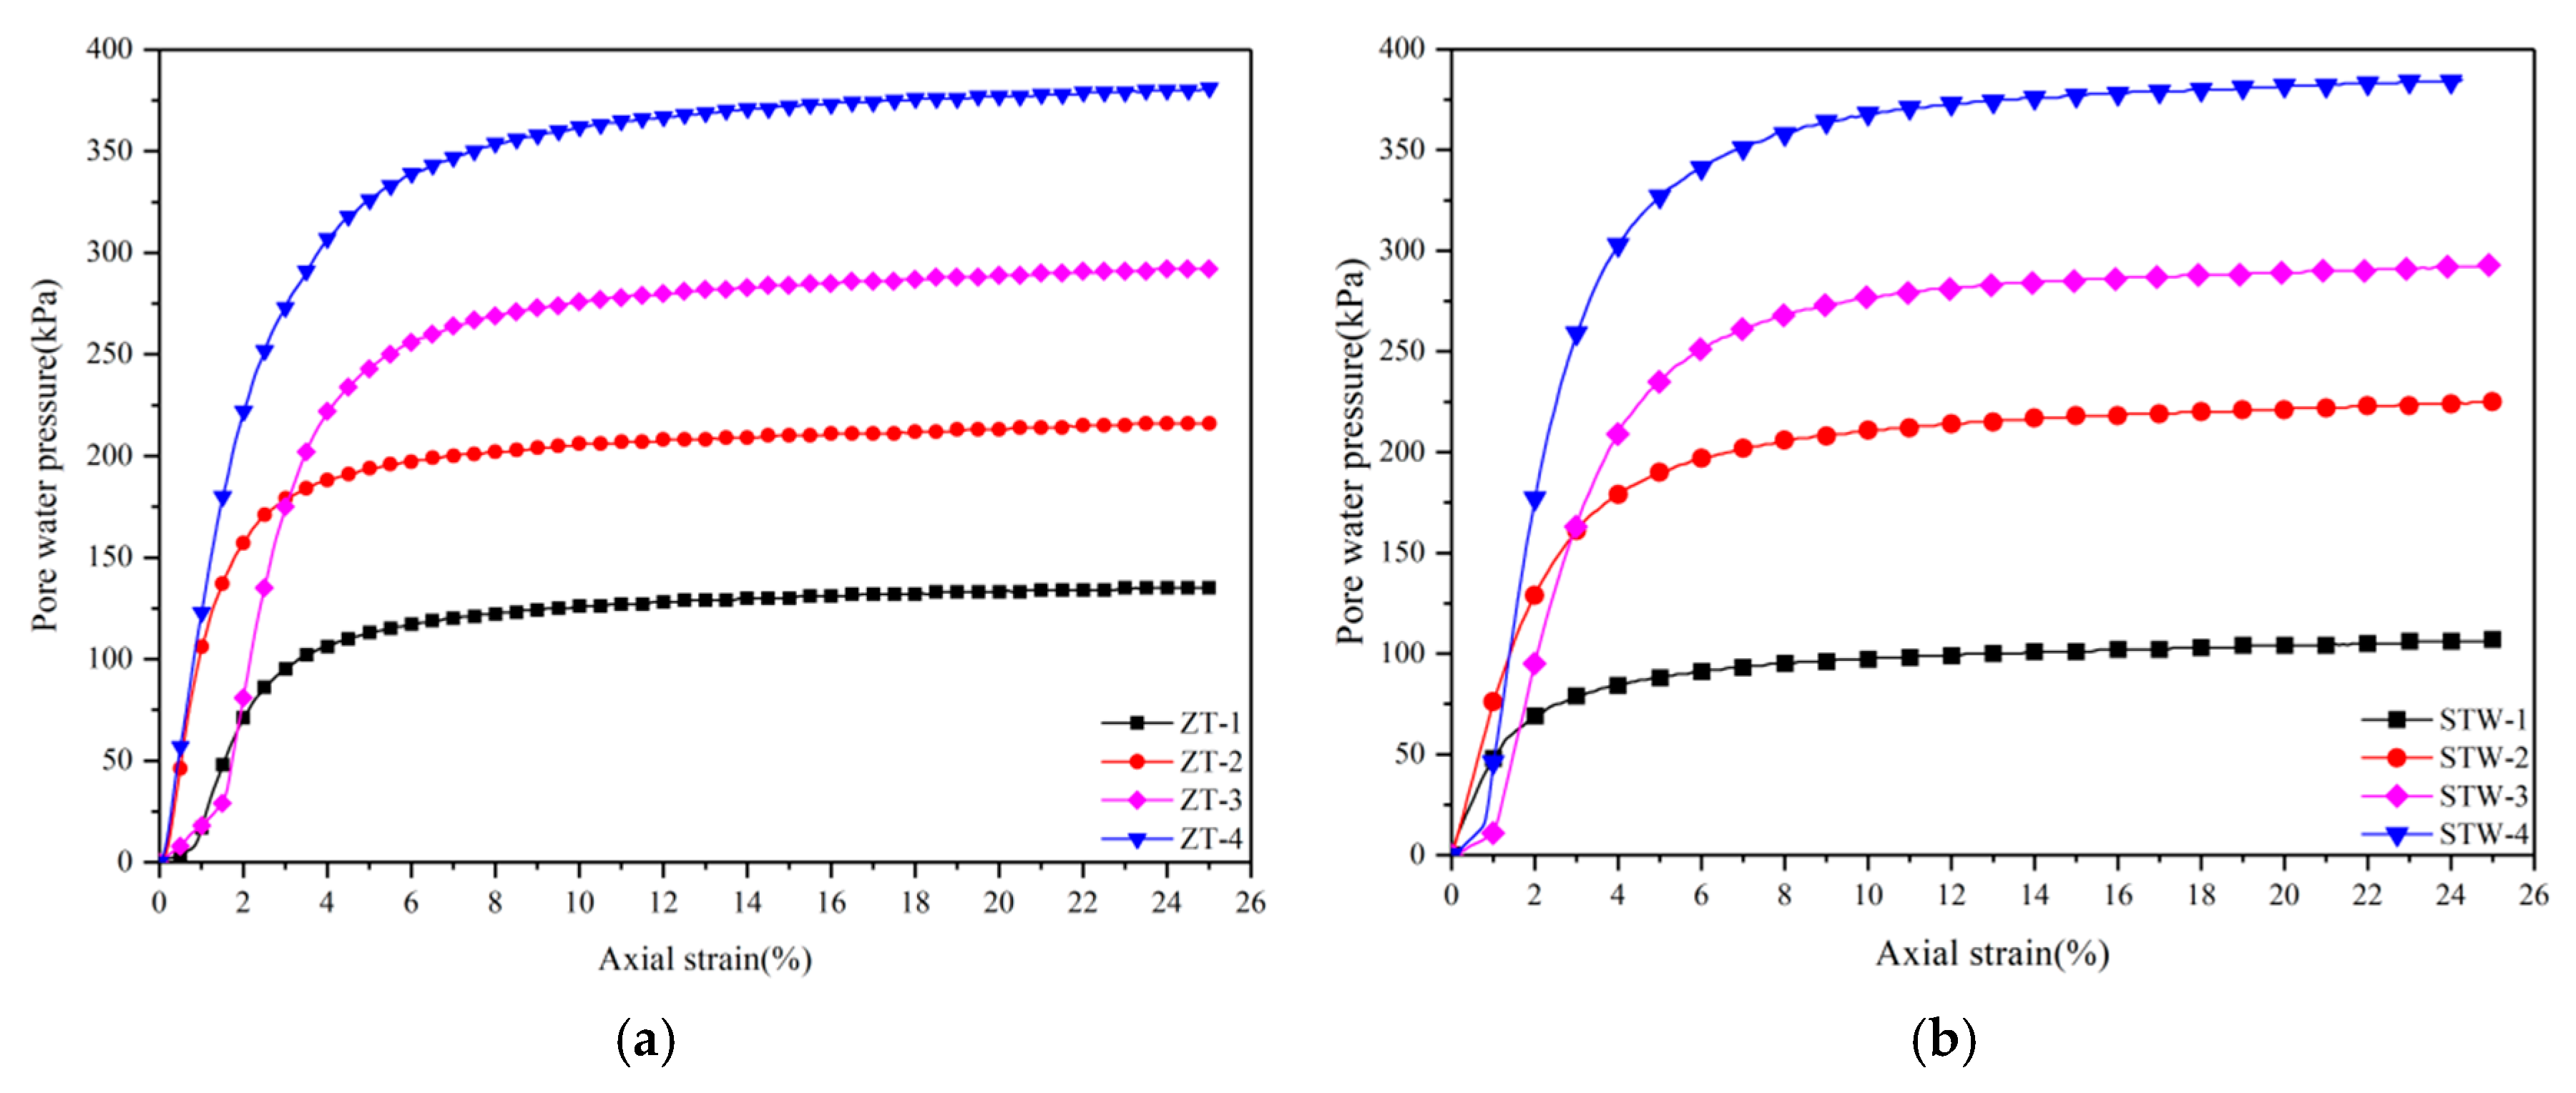
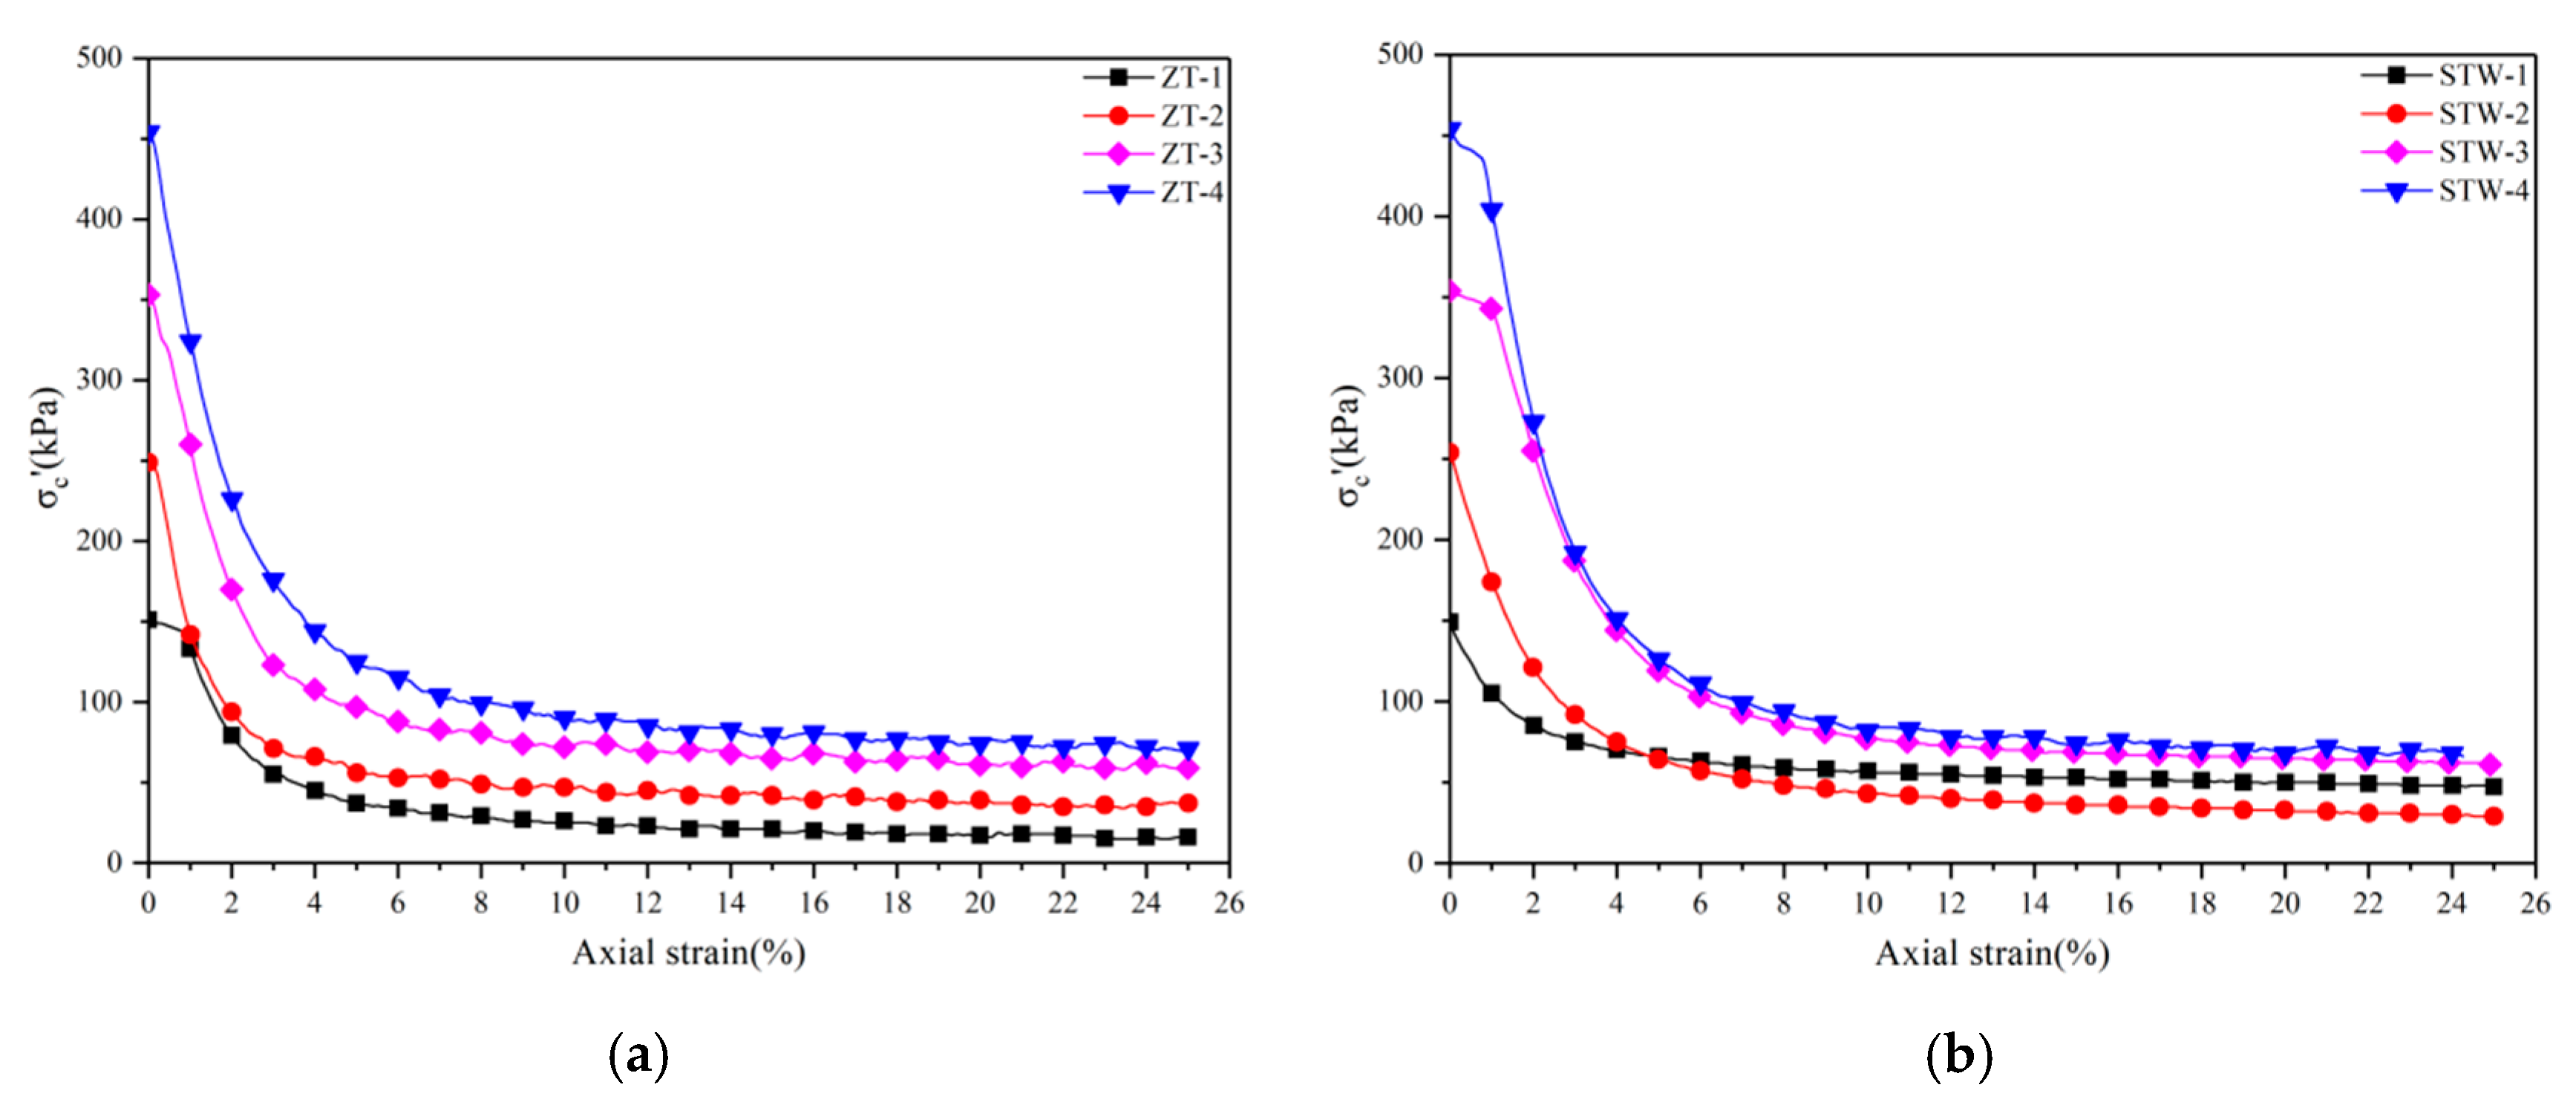
Based on the ICU tests data, the pore water pressure-strain curves and effective confining pressure-strain curves of the ZT and STW loess were plotted, as shown in Figure 6 and Figure 7.
According to Figure 6, the pore water pressure curves of the ZT and STW loess exhibited almost the same change trend and were mainly divided into two stages: (1) Sharp rise stage: at the beginning of loading (the axial strain εa was less than 3%), the pore water pressure rose rapidly, close to the confining pressure level. (2) Stable stage: after reaching the curve inflection point, the increment of the pore pressure was very small with the increase in the strain, and it tended to be gradually stable. The inflection point of the curve can be considered as the critical point of the pore water pressure change and is closely associated with the structural yield stress being reached [33]. Under the undrained condition, the pore water pressure rose rapidly. Accompanied by the particle rearrangement, the spaced pore structure collapses, structural failure of the loess structure begins, and the effective stress gradually transfers to the pore water pressure [16]. When the collapse of the structure tended to end, the clay aggregates slipped and squeezed into the pore throat, which seriously hindered the discharge of the pore water. As a result, the pore water pressure remains at a relatively high level. The variation trend is accurately captured through the microstructure morphology analysis.
It can be observed from Figure 7 that under the different confining pressures, the effective confining pressure of the ZT and STW loess decreased sharply when the axial strain was less than 3%, and it tended to be gradually stable with the increase in the axial strain. The effective confining pressure of the ZT loess in the steady state increased with the increase in the initial confining pressure. Under the confining pressure of 250 kPa, the pore pressure of the STW loess increased more; hence, the effective confining pressure was the lowest in the steady state. Under the other confining pressure conditions, the effective confining pressure of the STW loess in the steady state also increased with the increase in the initial confining pressure. Combined with Figure 6 and Figure 7, it is not difficult to determine that when the axial strain was less than 3%, the effective confining pressure decreased with the increase in the pore water pressure, and the pore water pressure and the effective confining pressure tend to be stable with the increase in the axial strain. Although the effective confining pressure at the end of the shear was a lower value (20–100 kPa), it did not reach zero. This means that the loess had not reached complete static liquefaction; however, it had decreased significantly in comparison to the initial confining pressure. At this point, the loess was in a very unstable state and had a strong flow plastic characteristic [14].
4.2. Analysis of the Microstructure Characteristics before and after the ICU Tests
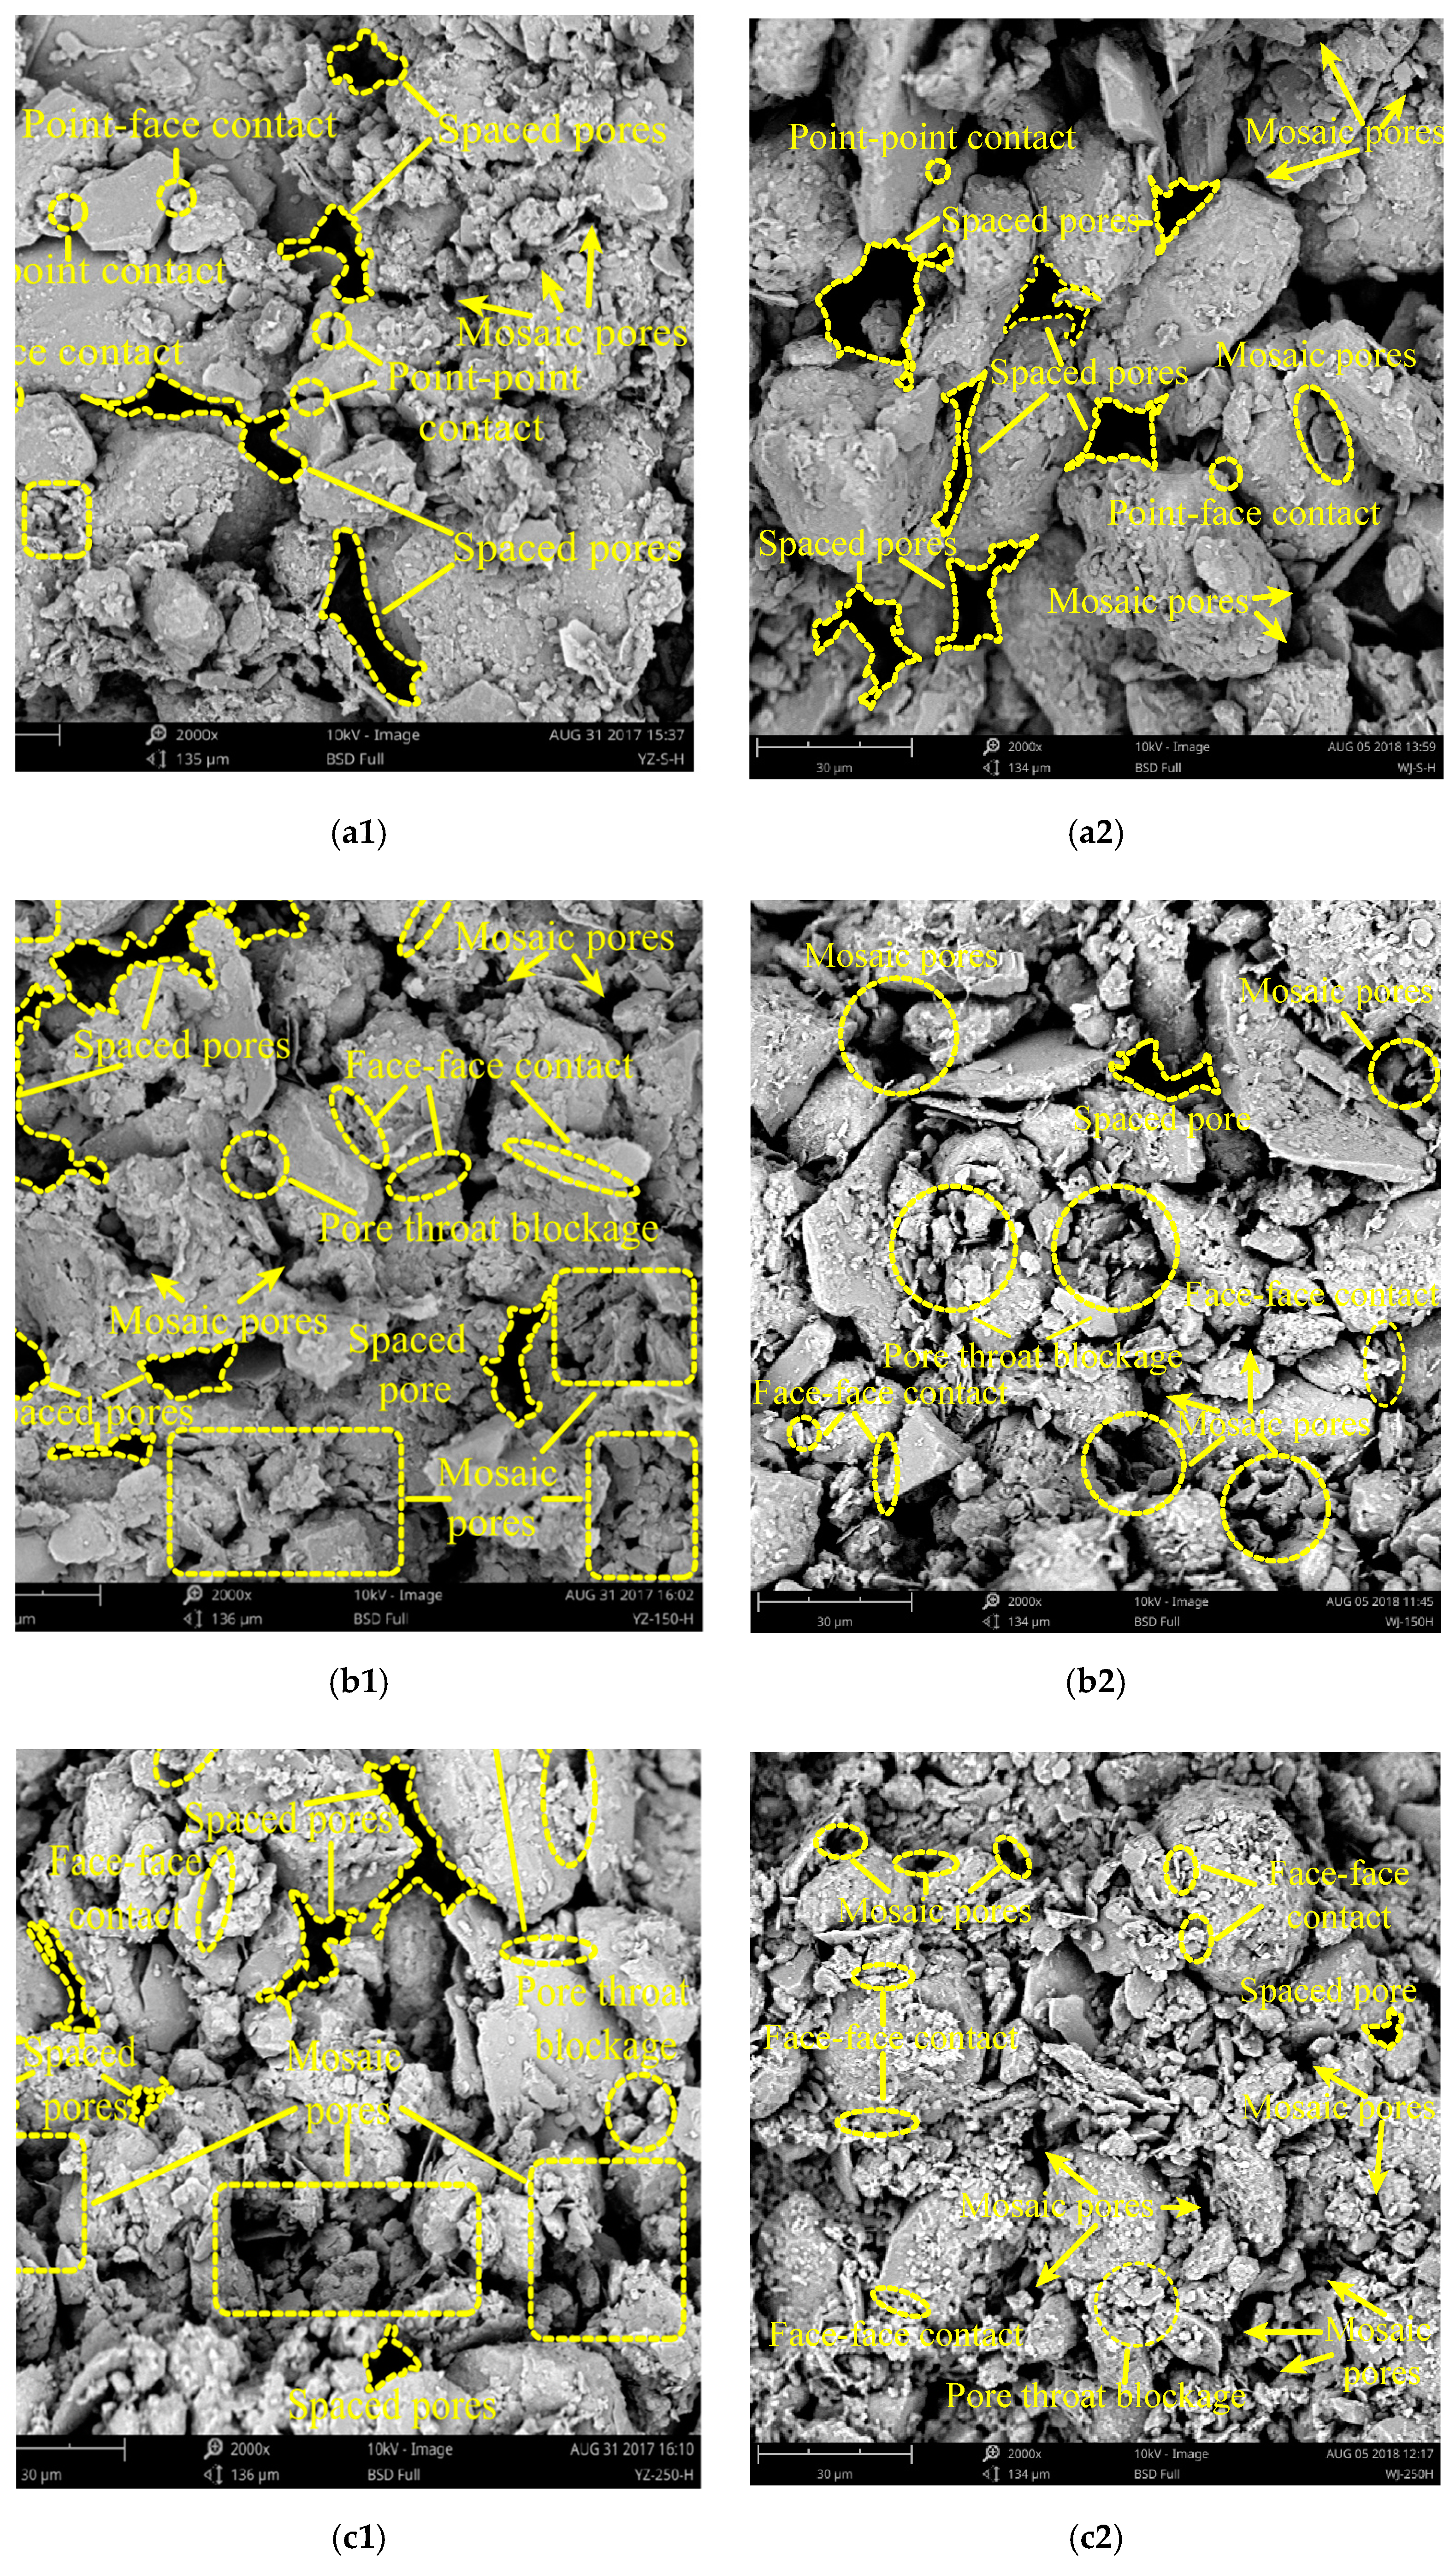
Based on the aforementioned analysis of the ICU test results for the loess under the different confining pressures, the ZT and STW loess samples show prominent strain softening characteristics. After reaching the peak value, the partial stress decreased significantly; the pore water pressure increased sharply and remained high; and the effective confining pressure decreased rapidly. As a result, the ZT and STW loess have the possibility of static liquefaction. In order to find the relationship between the static liquefaction and the microstructure characteristics and to understand the internal mechanism of the static liquefaction in this area more clearly, the scanning electron microscope (SEM) images captured before and after the ICU tests were analyzed in this section.
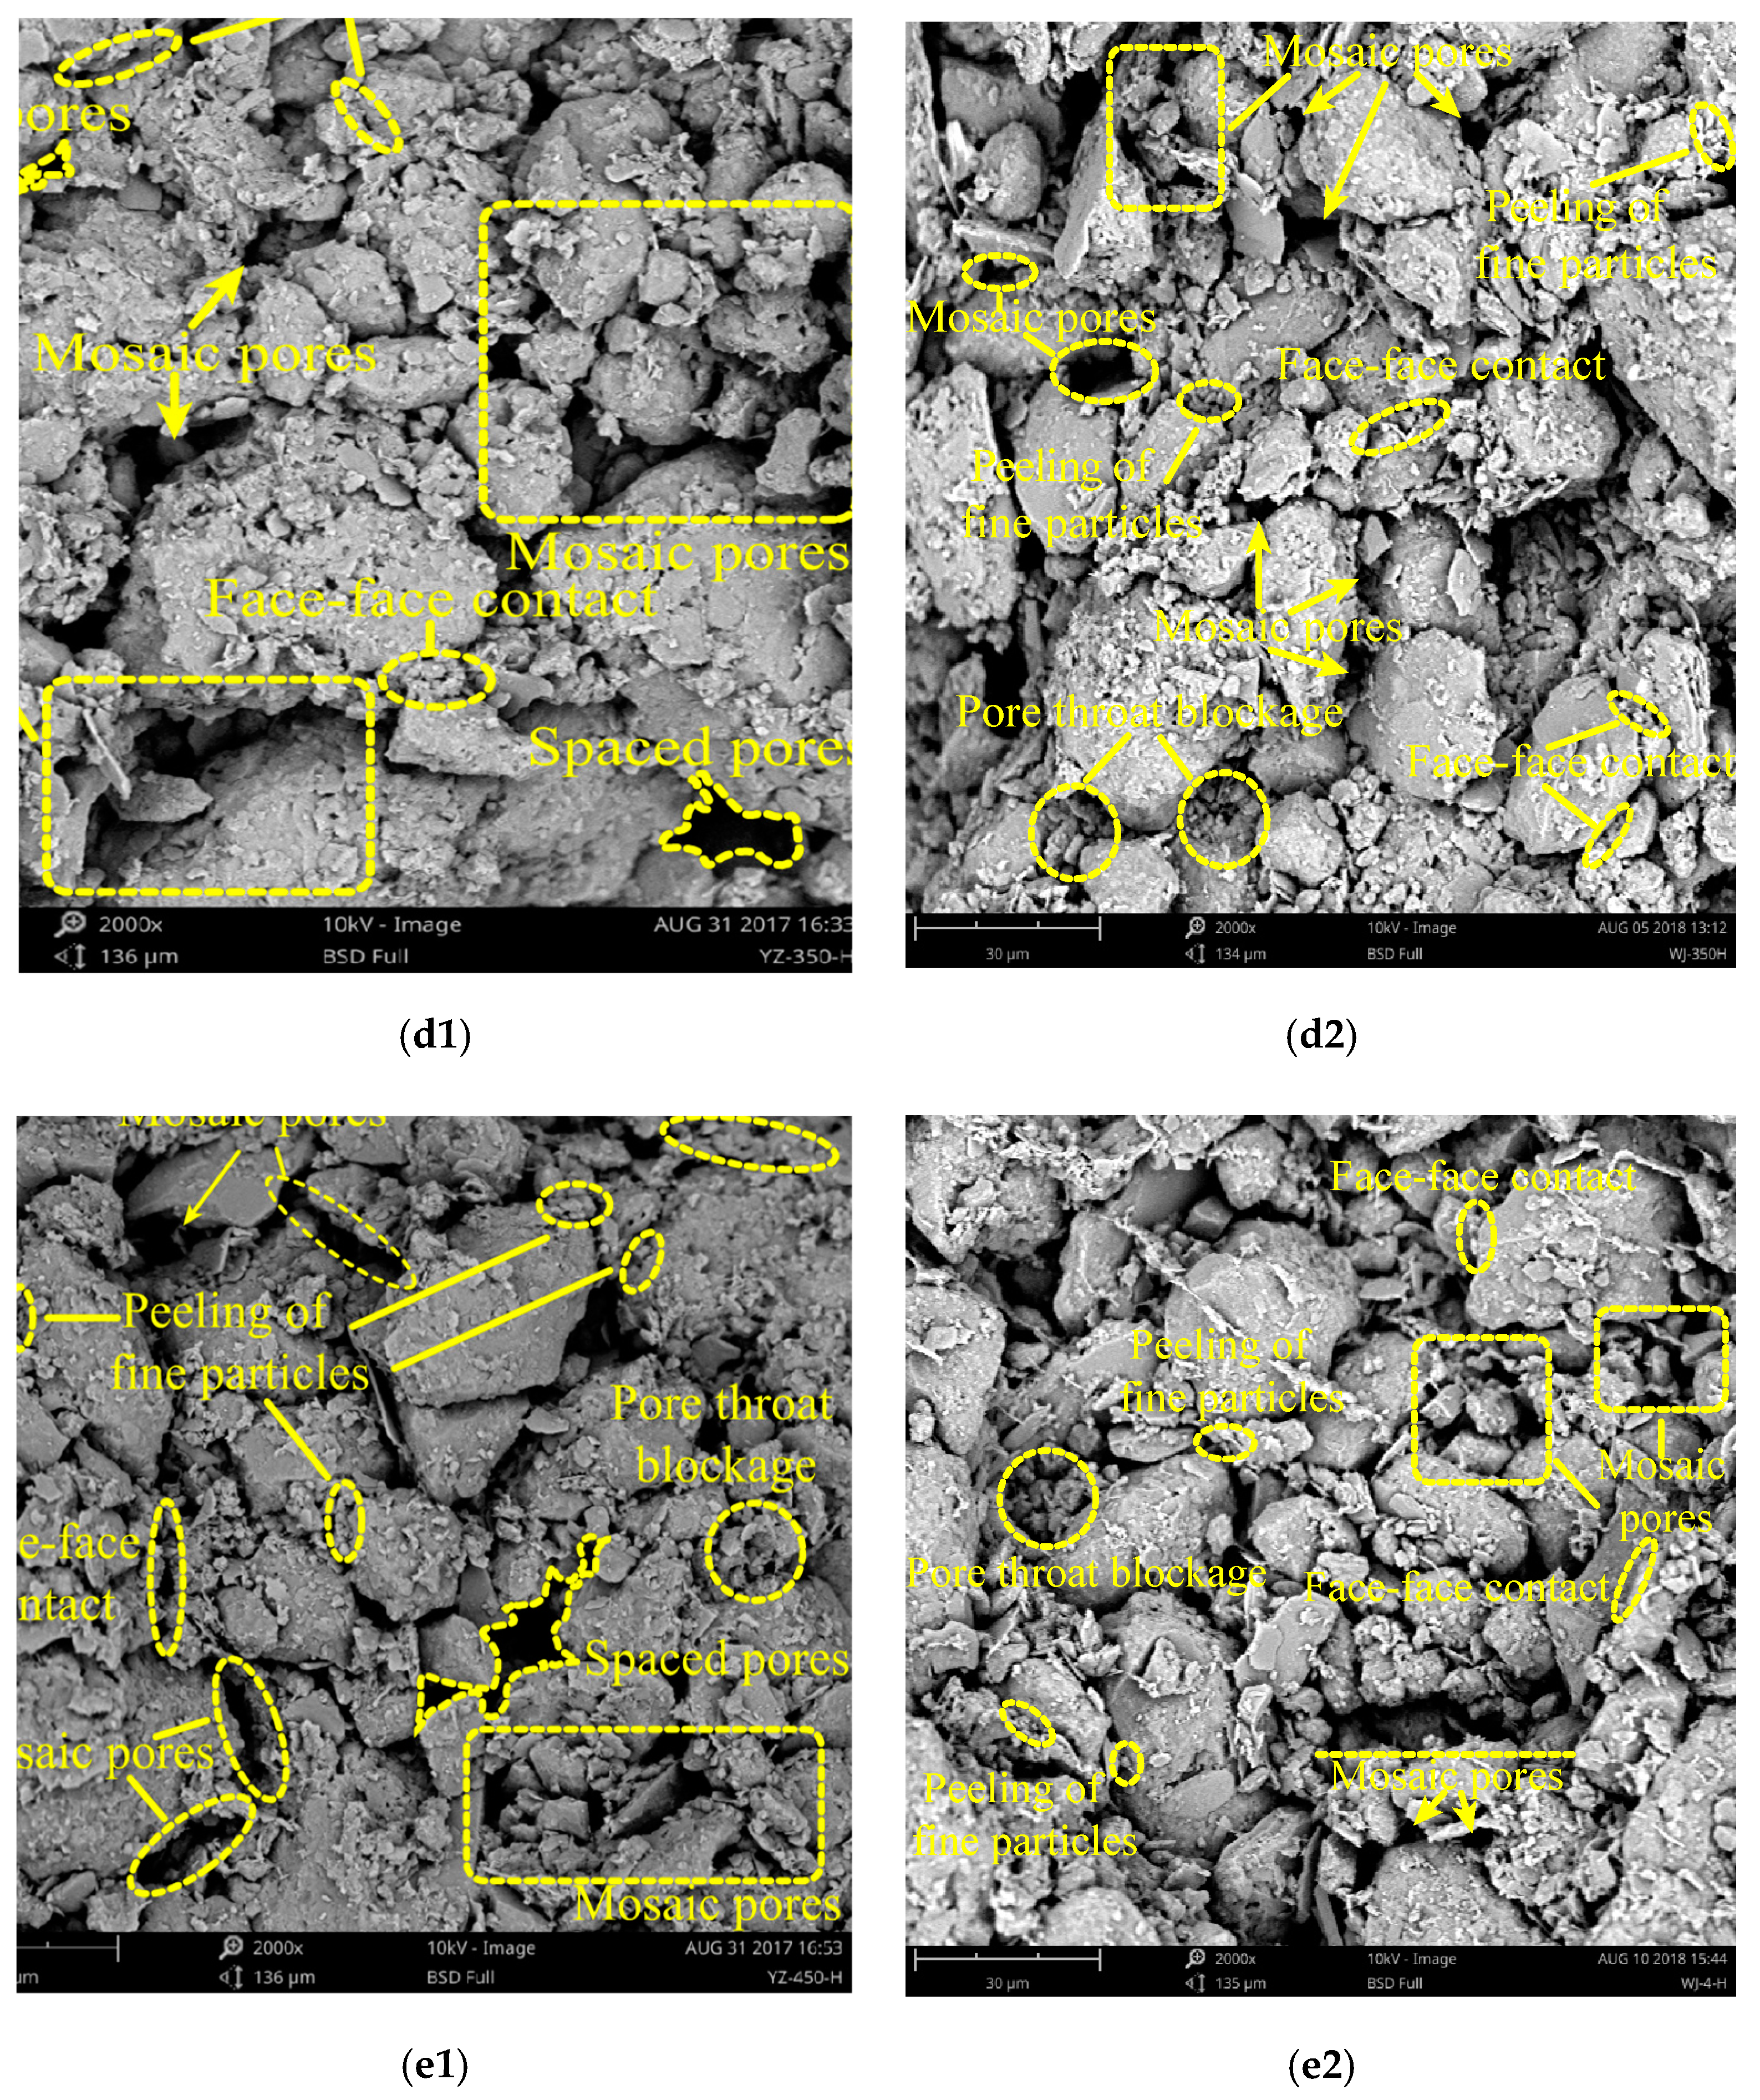
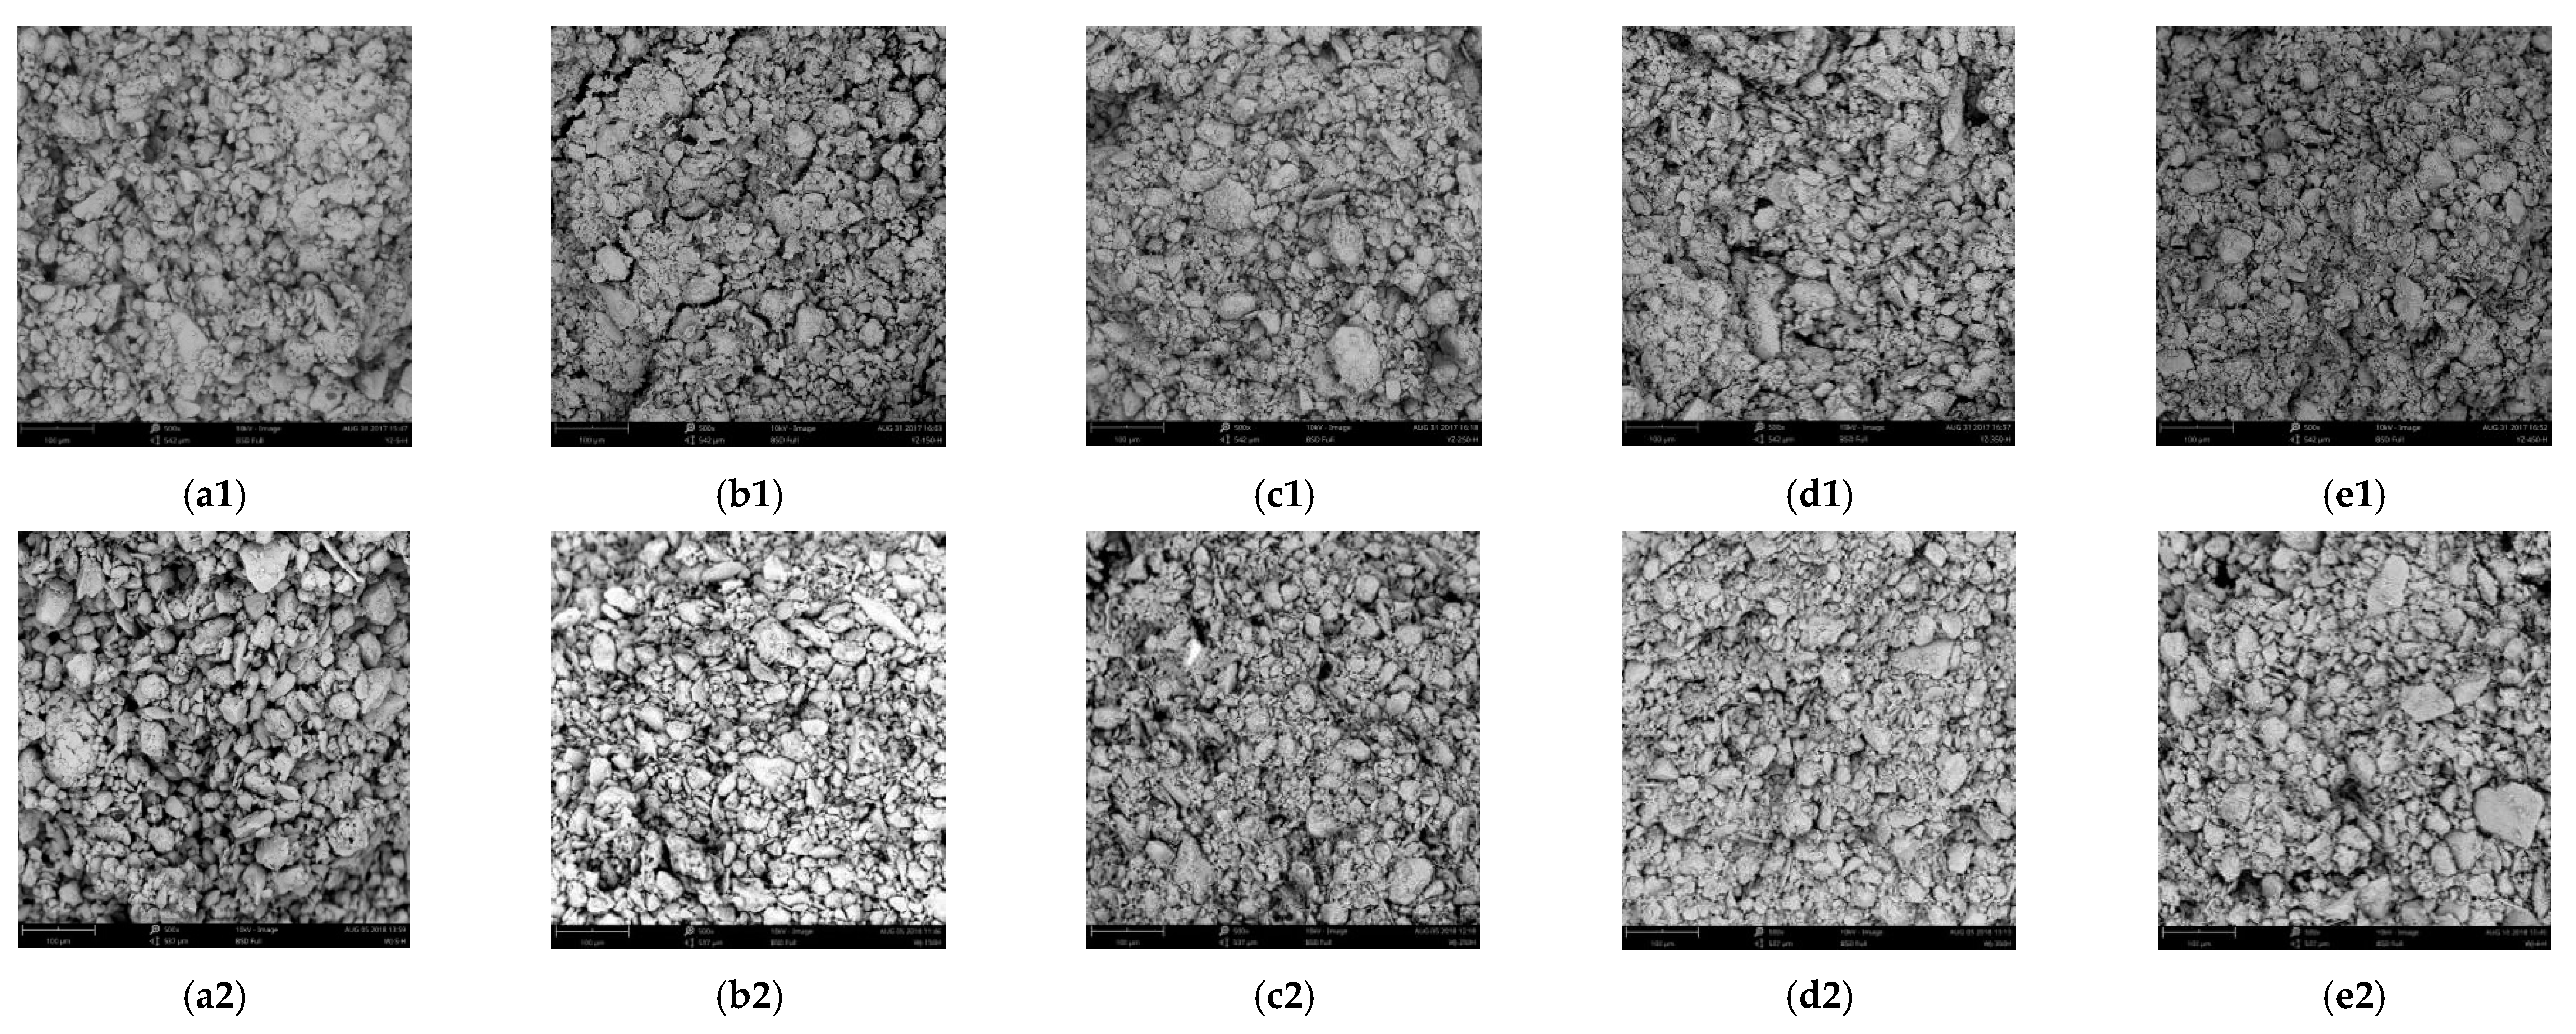
In Figure 8 and Figure 9(a1,a2) are SEM images of loess after the back pressure saturation treatment on the triaxial apparatus. Therefore, according to the experimental process, the SEM images of (a1) and (a2) reflect the micromorphology of loess before consolidated undrained triaxial tests. Moreover, (b)–(e) in Figure 8 and Figure 9 are the SEM images of loess after consolidated undrained triaxial tests under different confining pressures. Through a comparative analysis of the microstructure changes before and after the ICU tests under the different confining pressures (Figure 8 and Figure 9), the following results were determined. (1) Before the ICU tests, there were a large number of scattered spaced pores between the loess particles, which was confirmed to the microstructure characteristics of the loess [34]. After the ICU tests, the original pore throat channel of the spaced pores between the loess coarse particles was filled by fine particles, which can be also observed in the previous study [9]. Therefore, the pore throat channel was blocked, the boundary shape of the pore throat channel tended to be more complicated, and the intergranular pores were gradually dominated by mosaic pores. (2) Before the ICU tests, the contact between the coarse particles was mainly point-point and point-face. After the ICU tests, the appearance of fine particles, such as clay aggregates, in the contact position of the particles destroyed the contact state between the coarse particles of the loess. This resulted in the contact state between the coarse particles gradually transforming to face-face. The face-face contact relation mentioned in here includes direct face-face contact and indirect face-face contact [35,36]. (3) Under the confining pressures of 350 kPa and 450 kPa, the edges of the coarse particles peeled off from the fine particles. The same phenomenon was found in another study [37]. This indicates that the spaced framework formed by overlapping of the coarse particles becomes fully contacted under the compression deformation; however, the framework structure cannot bear a greater load. At the contact point of the coarse particles, the cracks would appear due to the stress concentration and they develop towards the inside of the particles, which gradually produces fragmentation.
5. Discussion
5.1. Analysis of Capacity of Static Liquefaction
The stress-strain curves, pore water pressure-strain curves, and the effective confining pressure-strain curves of the ZT and STW loess under the different confining pressures were analyzed. The loess under the different confining pressures shows prominent strain softening characteristics, but the deviator stress at the end of the shear was not zero. In addition, the pore water pressure rose rapidly under a small deformation (εa < 3%), and the effective confining pressure decreased with the increase in the pore water pressure and it reached a lower value (20–100 kPa) at the end of the shear. Therefore, the saturated undisturbed loess may undergo static liquefaction under the undrained shear action; however, the possibility of static liquefaction still needs further discussion.
5.1.1. Analysis Change Characteristics of the LPI
To further understand the effect of the confining pressure on the liquefaction resistance of the saturated undisturbed loess, the previous concept of the liquefaction potential index (LPI) was used for the analysis. Ng. C [38] defined the LPI as follows:
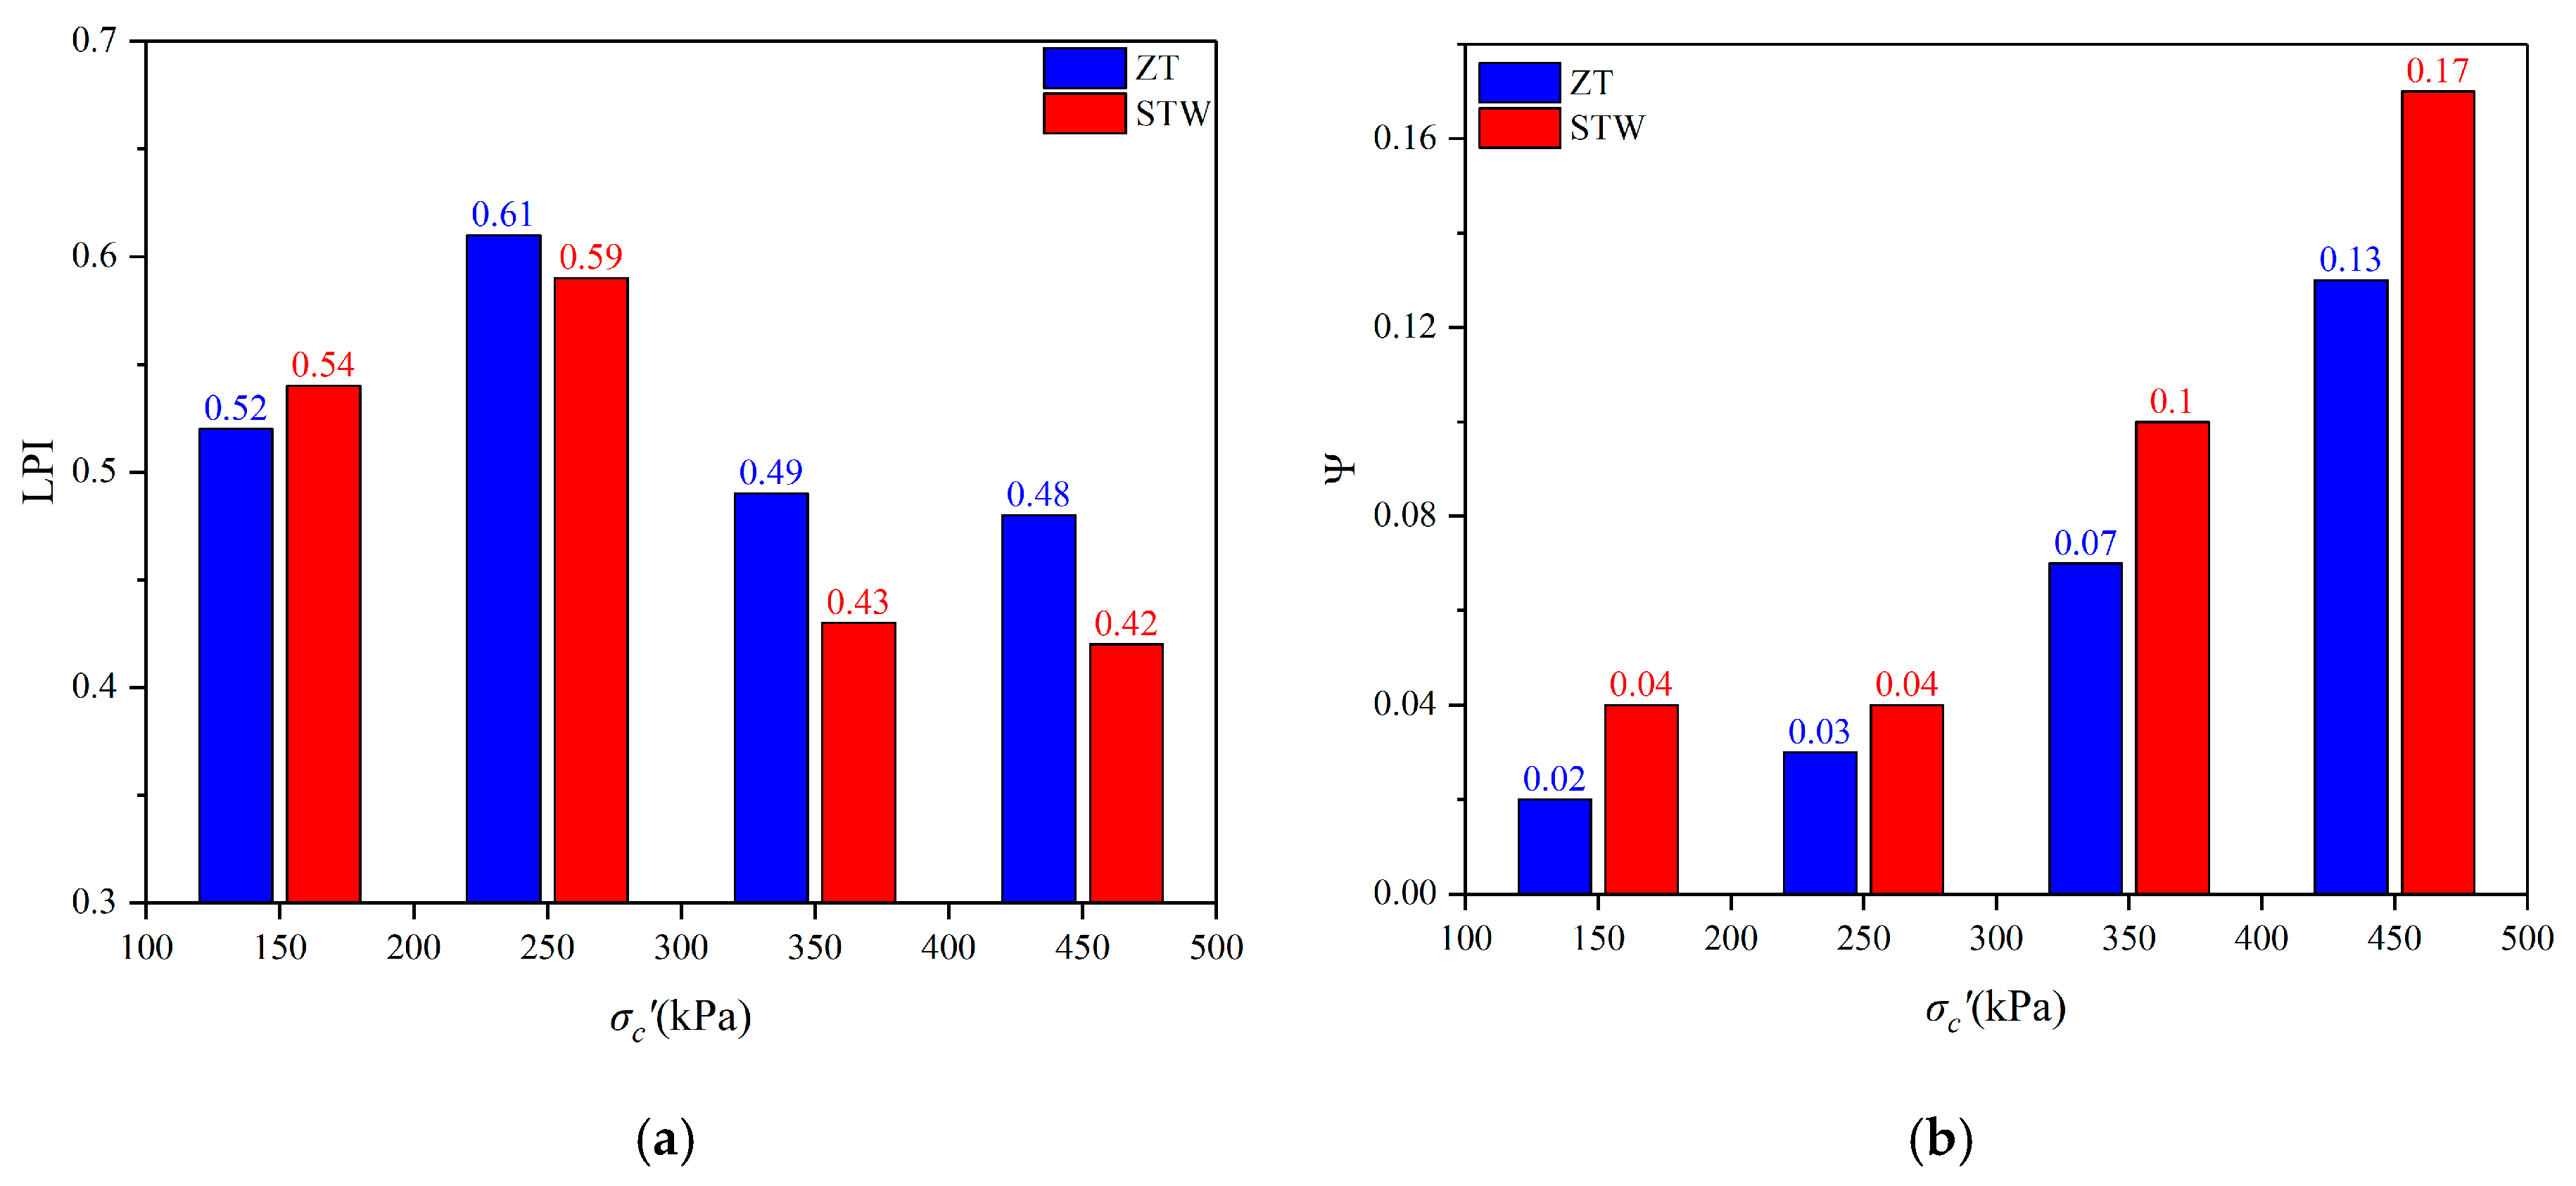
where qmax is the peak shear stress, and qmin is the quasi-steady shear stress. This parameter is similar to the brittleness index (IB) proposed by Bishop (1967) [39] for the strain softening materials. It can be used to characterize the degree of reduction in the deviatoric stress of the saturated undisturbed loess under the different confining pressures; thus, it reflects more accurately the ability of the loess to resist the static liquefaction. When the LPI = 1, this indicates that there is complete static liquefaction of the soil. When the LPI = 0, this indicates that there is no static liquefaction of the soil. When 0 < LPI < 1, this indicates that the soil has a certain static liquefaction potential and the ability to resist static liquefaction weakens with the increase in the LPI. According to Formula (1), the LPI of the ZT and STW loess under the confining pressures of 150 kPa, 250 kPa, 350 kPa, and 450 kPa is calculated, and the results are shown in Figure 10a.
Been [40] defined the state parameter (ψ) as follows:
where e0 and ess are the void ratios in the initial and steady states, respectively, for the same effective mean normal stress. When ψ > 0, the soil is in a “loose” state, and the undrained shear can cause shear shrinkage. The larger the state parameter ψ is, the more obvious the shear shrinkage behavior of soil is and the stronger the liquefaction capacity is. According to Formula (2), the ψ of the ZT and STW loess for the confining pressures of 150 kPa, 250 kPa, 350 kPa, and 450 kPa were calculated, and the results are shown in Figure 10b.
It can be observed from Figure 10a that the LPIs of the ZT and STW loess were almost equal under the different confining pressures and range between 0.4 and 0.6. In addition, with the increase in the confining pressure, no clear monotonic change rule; this is similar to the results of previous ICU tests on saturated undisturbed loess in the South Jingyang platform [9,12,30]. At first, with the increase in the confining pressure from 150 to 250 kPa, the LPI shows an upward trend. At this point, the LPIs of the ZT and STW loess were 0.61 and 0.59, respectively. Then, with the increase in the confining pressure from 250 to 350 kPa, the LPI decreased to some extent. Finally, with the increase in the confining pressure from 350 to 450 kPa, the LPI remained unchanged. It can be determined from Figure 10b that ψ of the ZT and STW loess increased with the increase in the confining pressure from 250 to 450 kPa; however, it remained unchanged with the increase in the confining pressure from 150 to 250 kPa. Moreover, for a confining pressure of 150 kPa and 250 kPa, the LPI was larger; yet ψ was smaller. When the confining pressure was 350 kPa and 450 kPa, the LPI was smaller, but ψ was larger.
Furthermore, the possibility of static liquefaction existed in different layers and the buried depth of the undisturbed loess. In addition, there was no obvious relationship between static liquefaction and confining pressure. In fact, according to the research on the buried depth of the sliding surface of the loess landslides in the South Jingyang platform, it is determined that there is no clear loess stratigraphic unit for the sliding of the high-speed and long-distance loess landslide; however, there is a prominent sliding face for the conventional sand landslides [41,42]. Although no prominent sliding face was observed in the loess landslides of the South Jingyang platform, the loess-paleosol of the South Jingyang platform presents typical interbedded sequence characteristics. Therefore, an evident water retention effect was easily produced at the paleosol interface. This is because the paleosol layer was equivalent to a relatively dense aquiclude. Some landslides in this area do have the possibility of sliding along the paleosol layer [12,24], but the specific formation was not regular.
5.1.2. Analysis of the Stress Path Evolution
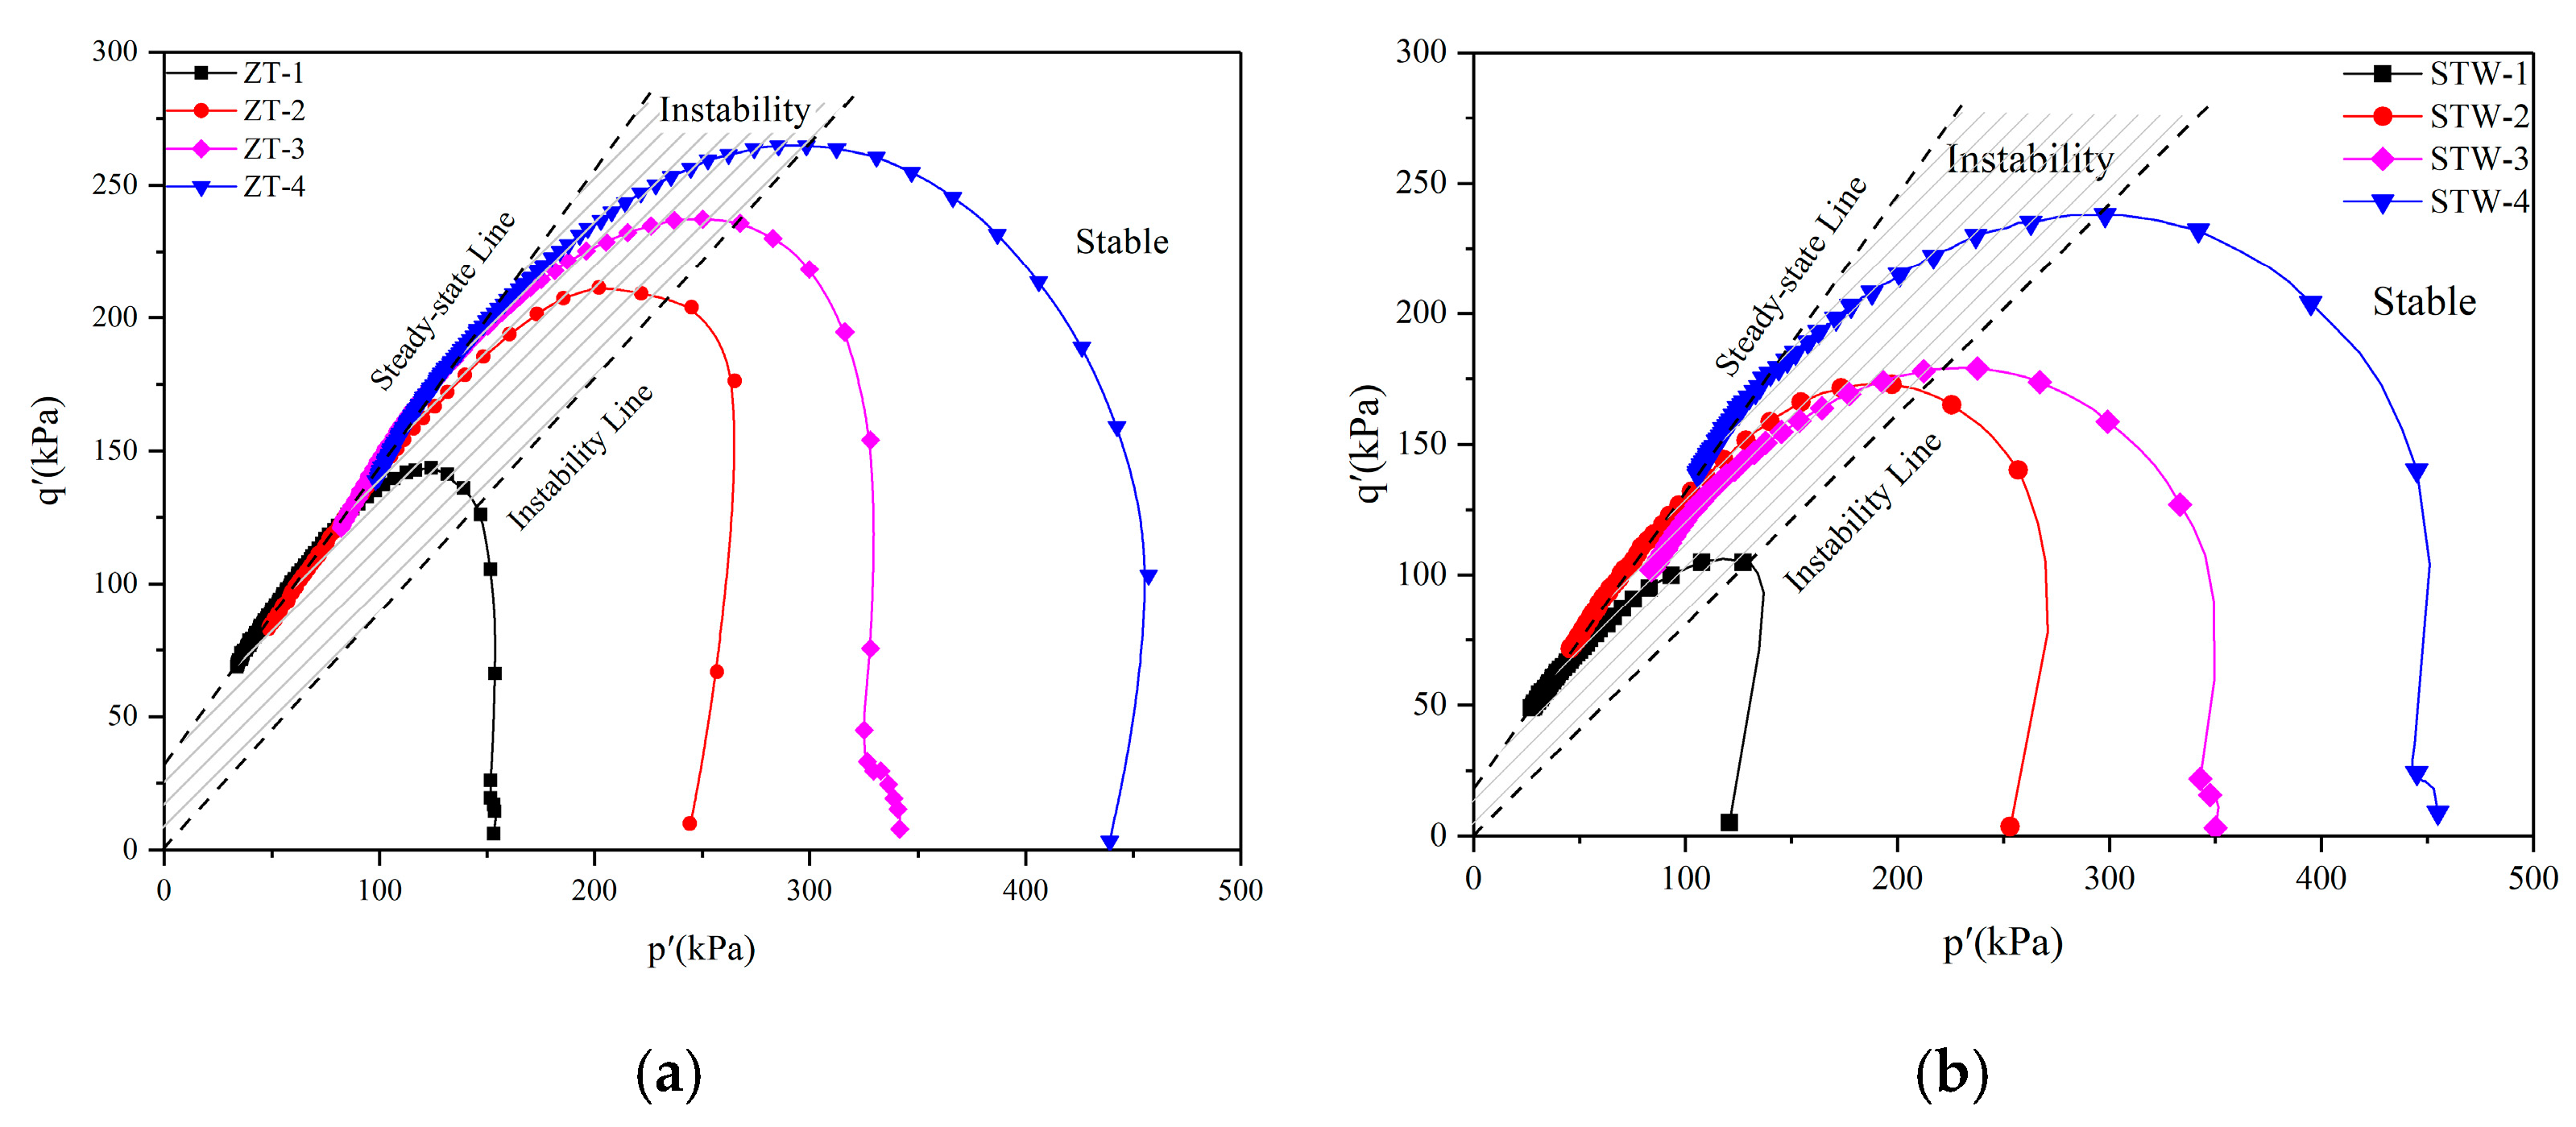
The stress-strain curves and the pore pressure-strain curves of the ZT and STW loess indicate that the loess exhibited strong strain softening, and the pore water pressure remained relatively high. For the post peak state description and the steady-state evaluation of this kind of strain softening soil, the potential liquefaction state can be well recognized. Based on previous studies [43,44,45], the stability of the ZT and STW loess was evaluated by establishing a steady state line and an instability line. The stress paths of the ZT and STW loess were plotted using the experimental data from the ICU tests; the abscissa is the effective average stress p′ = 1/3(σ1′ + 2σ3′) (MPa), and the ordinate is the deviator stress q′ = σ1′ − σ3′ (MPa), as shown in Figure 11.
Figure 11 shows that the ZT and STW loess under the different confining pressures all have shear shrinkage phenomenon. With the increase in the confining pressure, the peak point of the effective stress path gradually increased. In addition, after the effective stress path of the ZT and STW loess reached the peak point, they all reached the steady state with an increase in the strain. The stress path was divided into the stable region and instability regions by the instability and steady-state lines. If the soil stress path entered the instability region between the instability line and the steady-state line, the soil was very likely to undergo static liquefaction. If the soil stress path is in the stable region below the instability line, static liquefaction of the soil is unlikely to occur [43,44,46]. Accordingly, it can be concluded that static liquefaction of the ZT and STW loess is more likely to occur under different confining pressures.
For the purpose of making the steady-state line pass through the steady-state points of the loess as much as possible, after trying to draw the steady-state lines, it was determined that this effect can be achieved when the steady-state line is a straight line without passing through the origin. Based on the stress path that from the ICU tests of the loess, some scholars [17,47] observed that the steady-state line is a straight line that does not pass through the origin. Although the uniqueness of the steady-state line of sand is controversial [48,49], most of it is a straight line that passes through the origin [43,44,45]. Loess still has cohesion in the steady-state stage [50], while the cohesion of sand is usually negligible. In addition, the macroscopic mechanical behavior of loess is the result of the coupling effect of the particle cementation strength and the friction strength. After overcoming the cementation strength between the loess particles, the greater the friction strength between the particles, the weaker the strain softening phenomenon [50]. The friction strength between the particles depends on the shape, size, and the relative position of the particles after structural reorganization [51]. The difference in the friction strength between the particles results in a different static liquefaction phenomenon after the peak value for the loess and sand; however, both display shear shrinkage characteristics.
5.2. Correlation Analysis of the Macro and Micro Characteristics of Static Liquefaction
Through the analysis of the mechanical behavior of ICU tests and the structural evolution, the following conclusions can be obtained. (1) The most obvious feature of the static liquefaction is that the pore water pressure rises sharply and it remains high. (2) The stable-state points fall into the instability region; however, the steady-state strength is not zero, which reflects that there is still a certain residual strength, and it should belong to incomplete static liquefaction. Furthermore, the typical characteristics of static liquefaction are all derived from the change in the loess internal structure [52,53]. As demonstrated from the comparison of the SEM images of the loess before and after the ICU tests (Figure 8), significant changes had taken place in the internal morphology; however, a quantitative analysis of the changes in the pore structure is still needed to accurately understand the relationship between the changes in the macroscopic mechanical behavior and the changes in the microstructure.
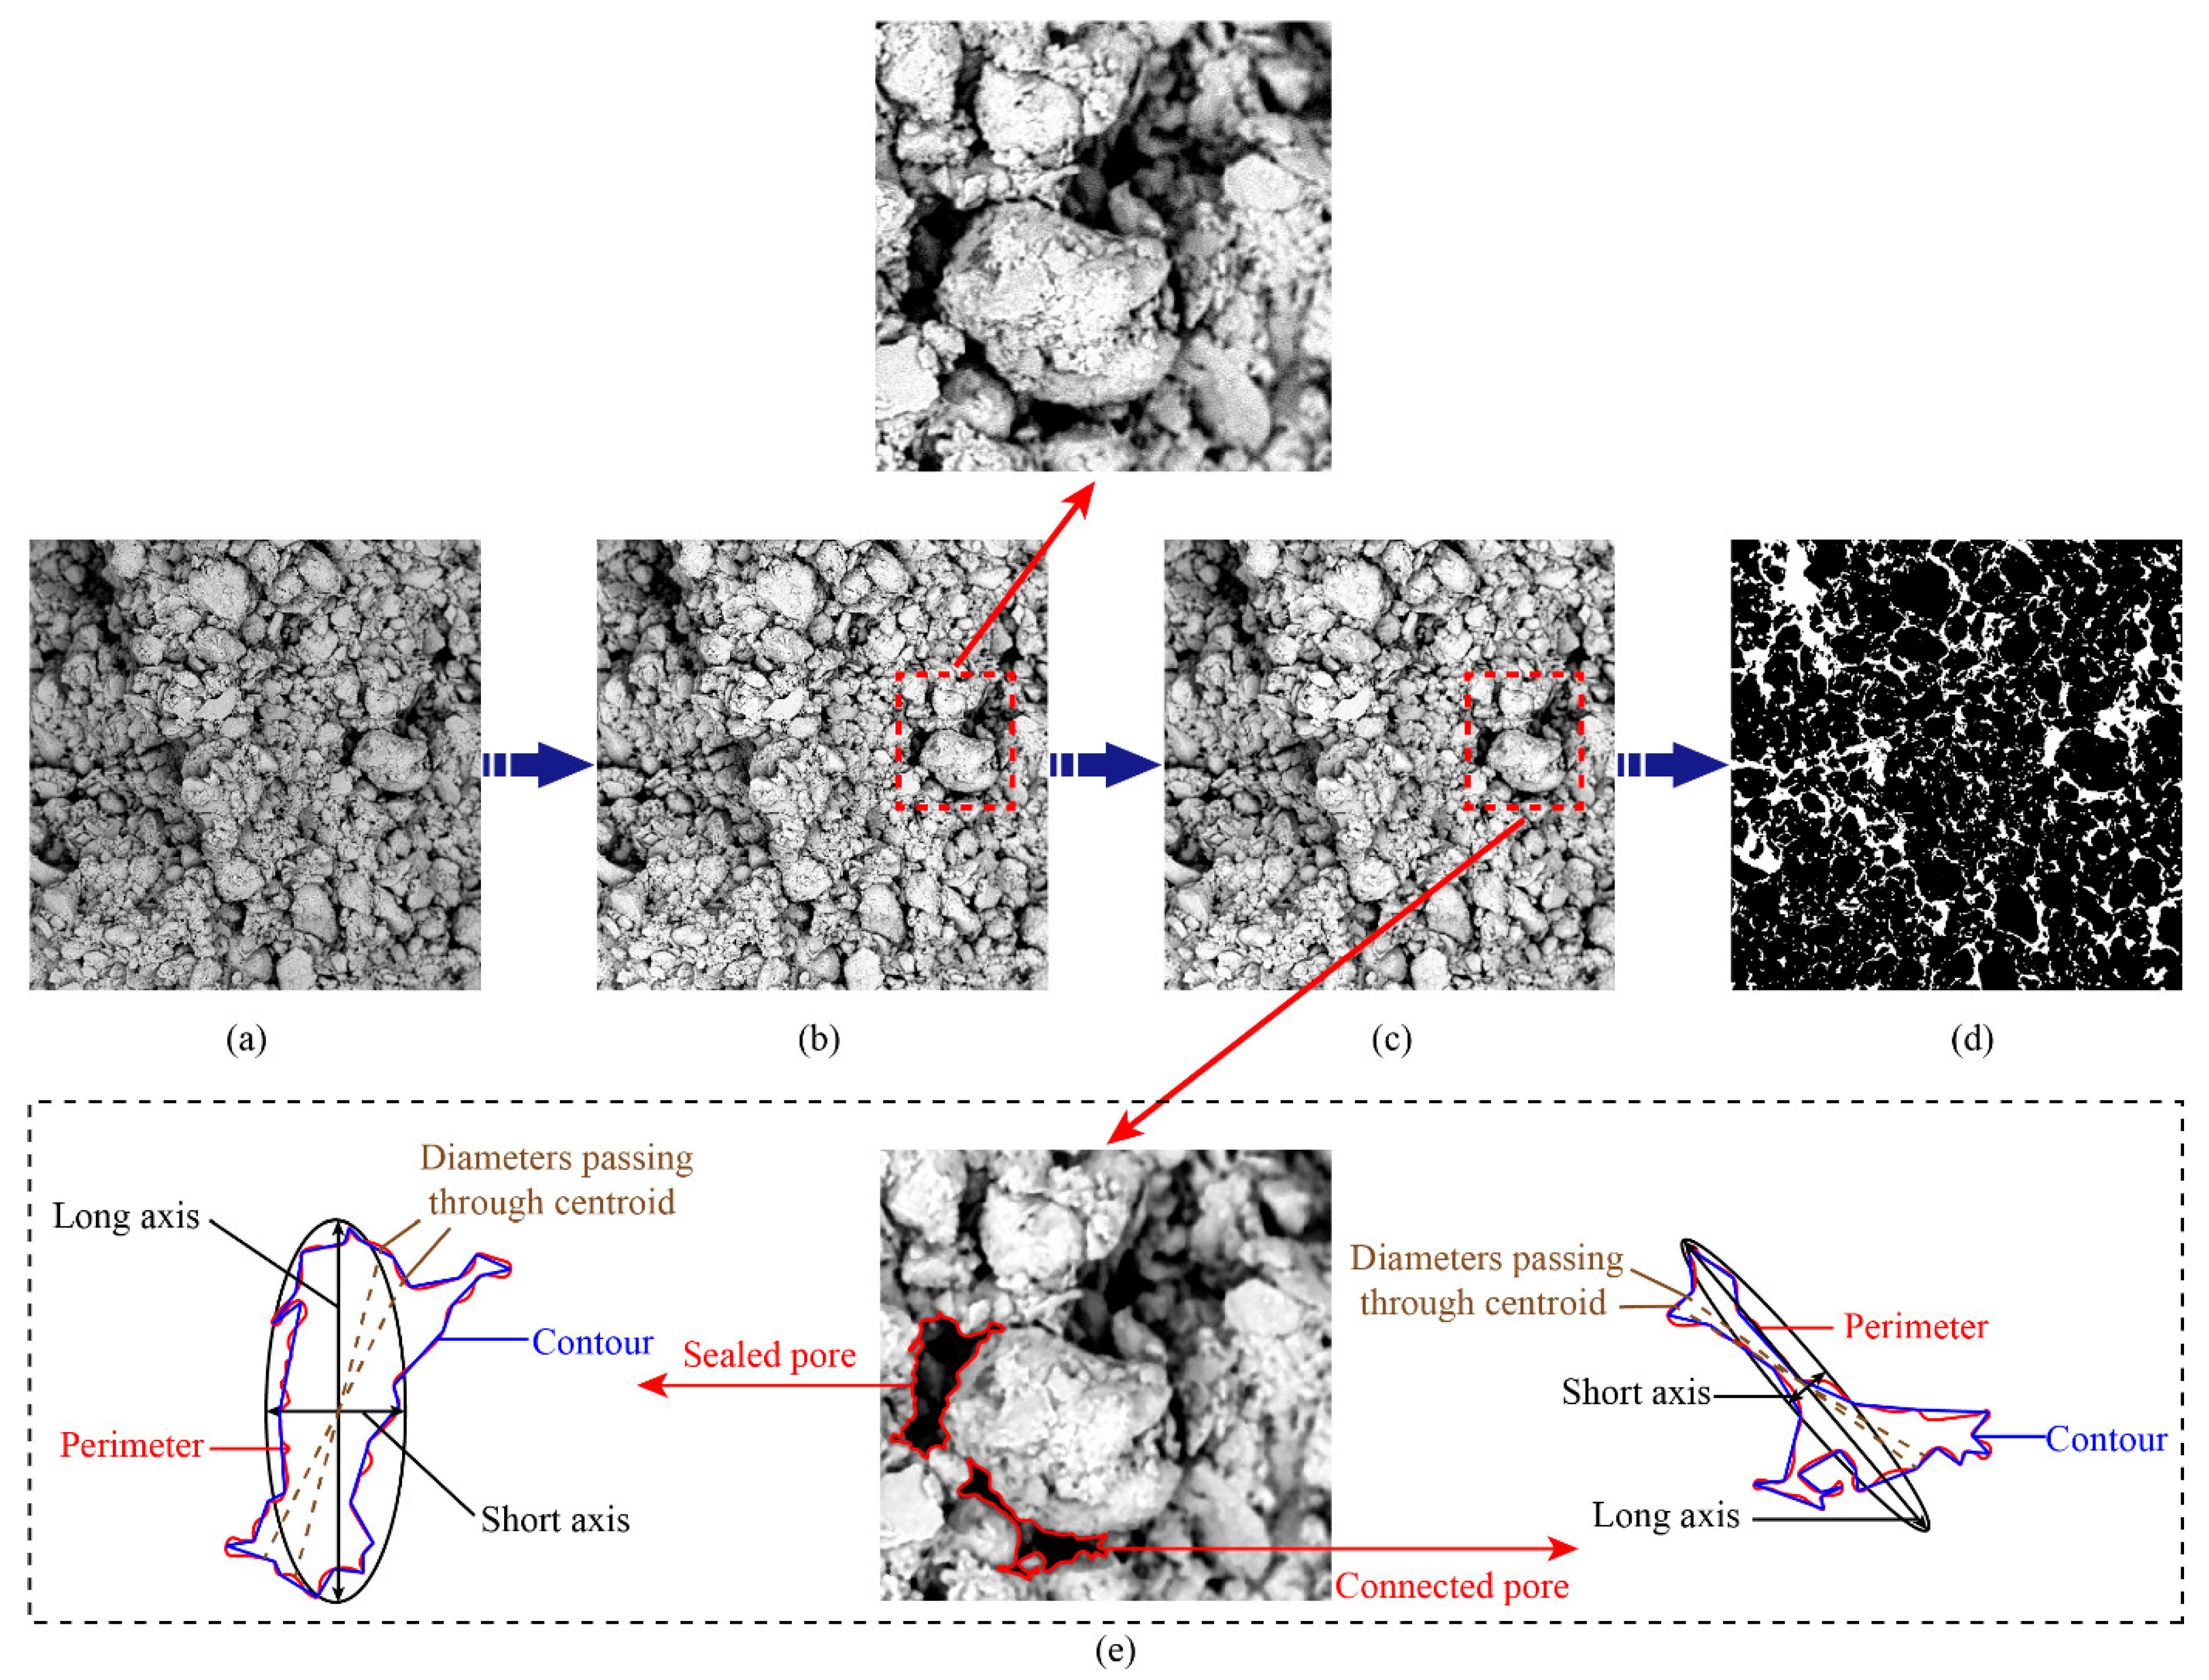
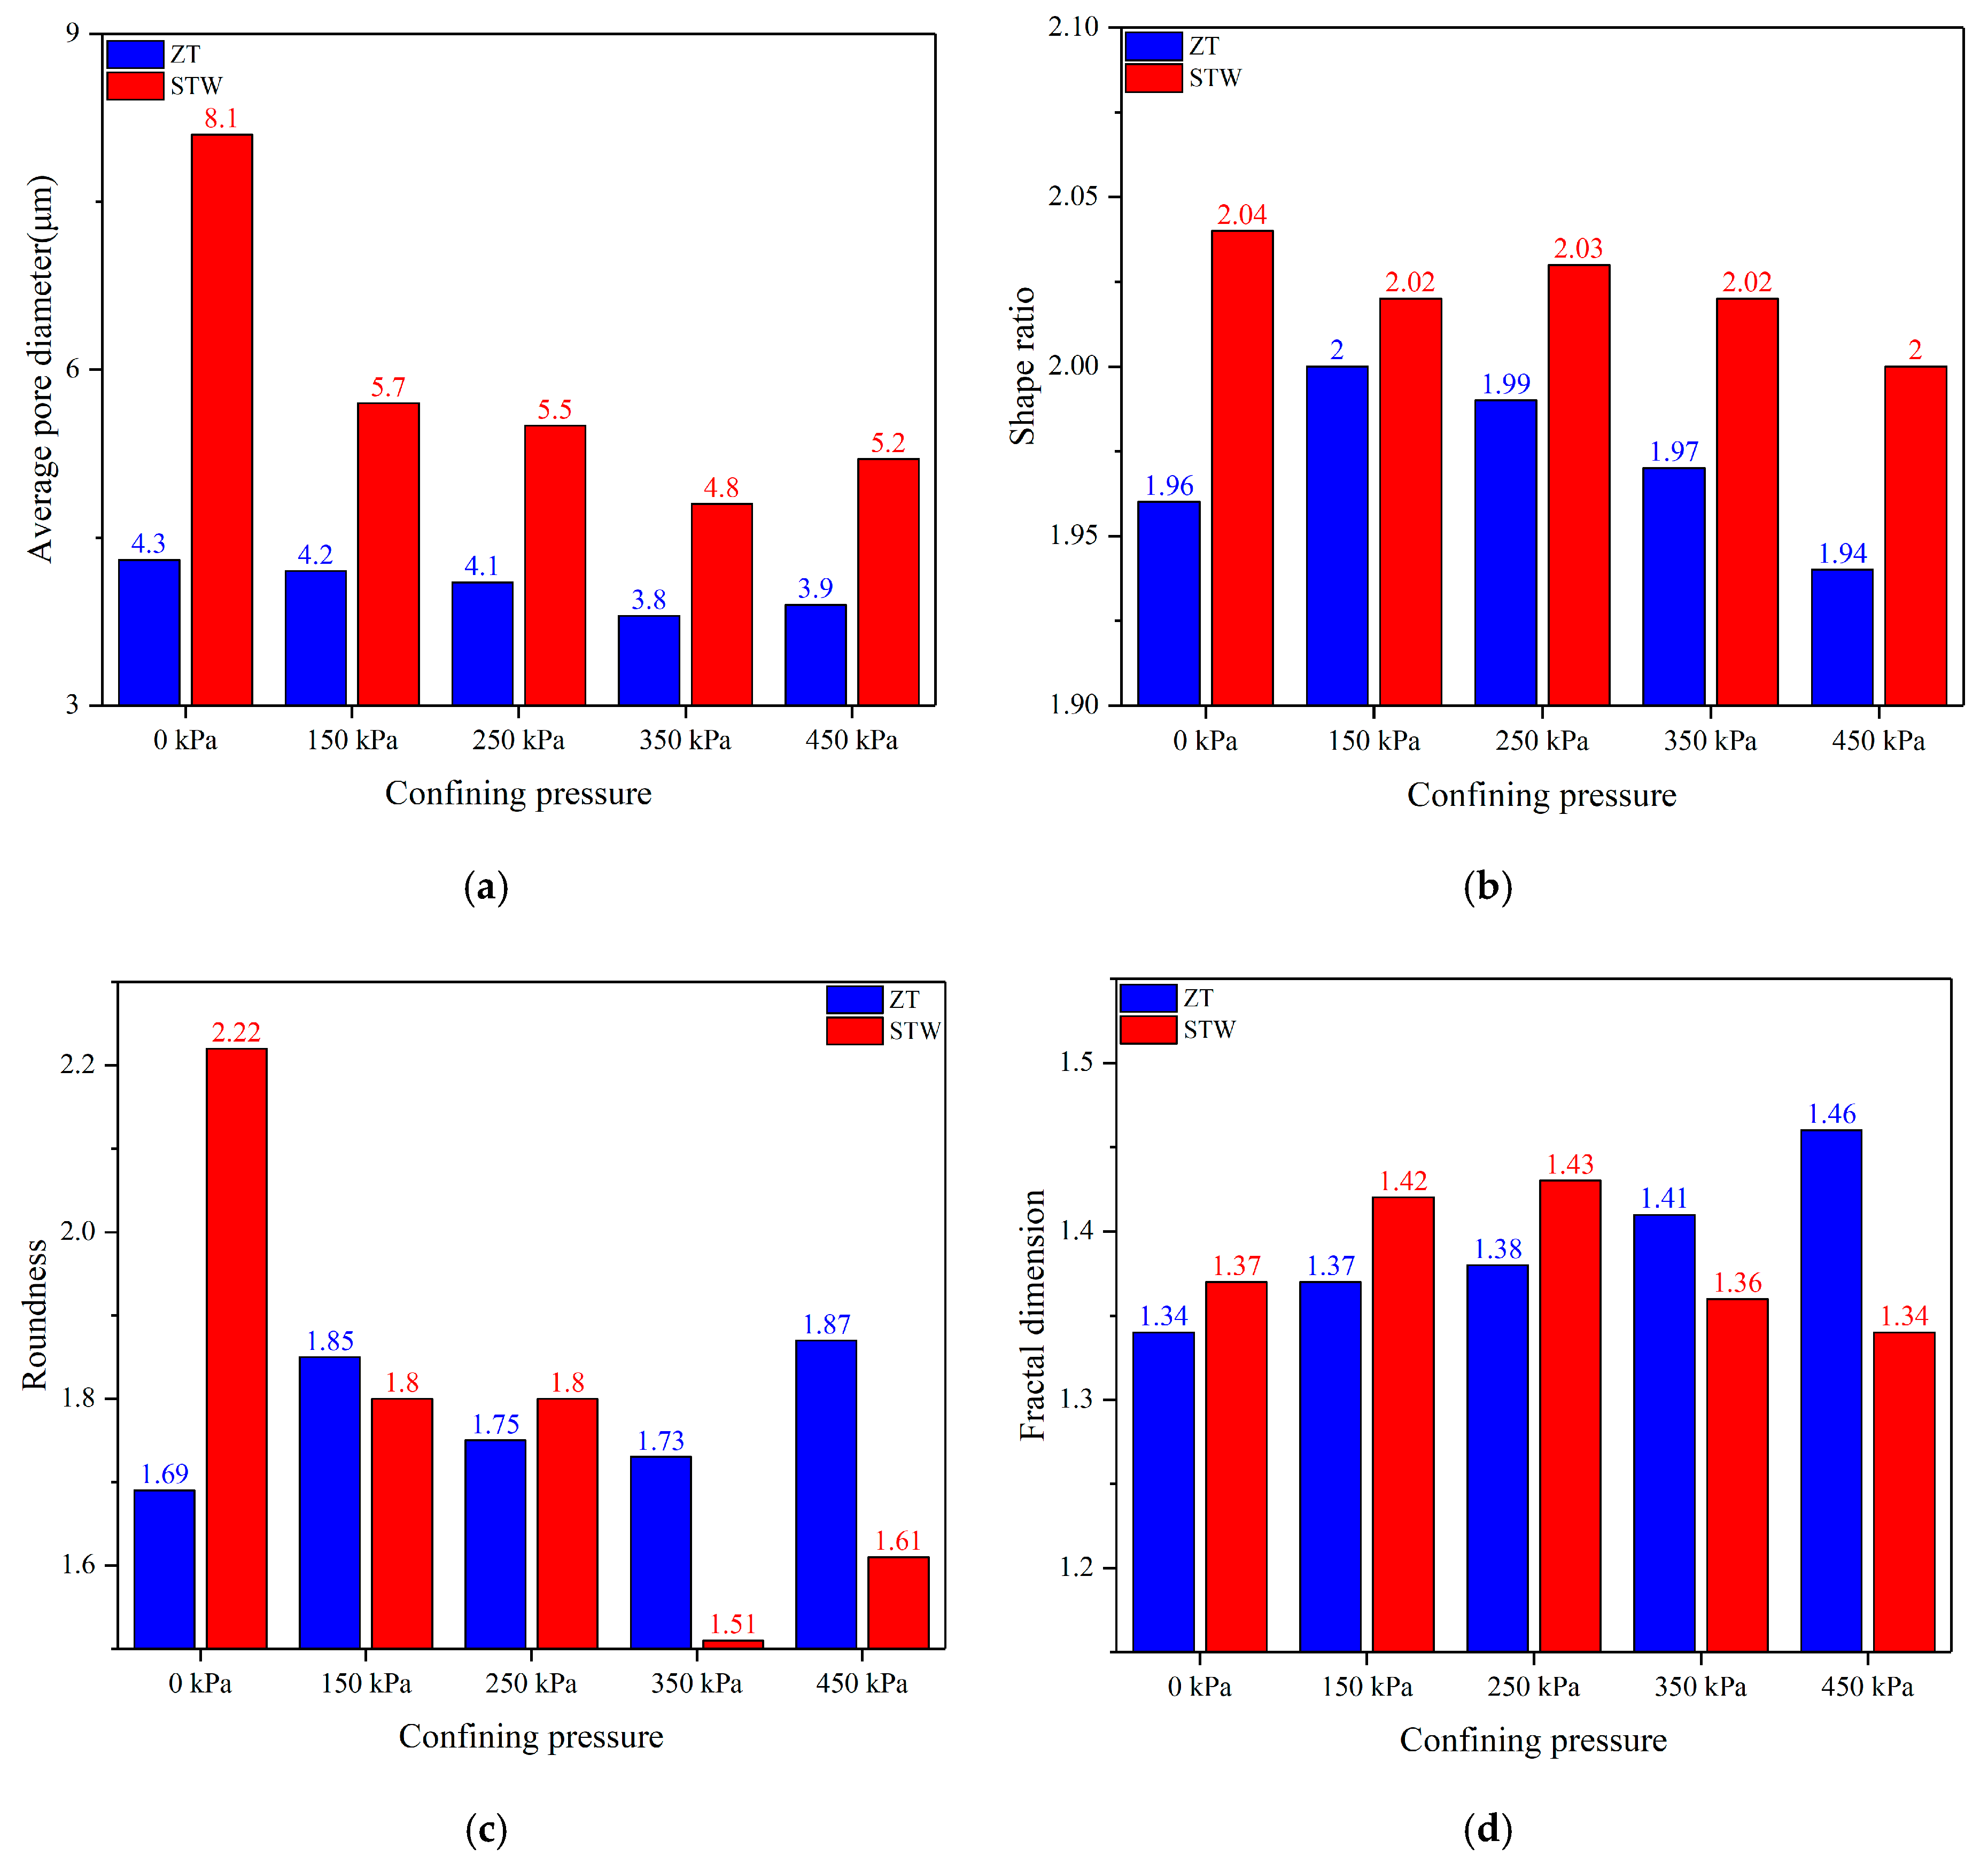
To further analyze the changes in the pore structure of the loess before and after the ICU tests, image analysis software (Image-pro Plus (IPP, Media Cybernetics Inc. Rockville, MD, USA)) was used to process the SEM images at 500 times magnification (Figure 9). This software can effectively distinguish the image from the background by threshold segmentation of the original SEM image, and then it obtains the determined value by performing a statistical analysis of the corresponding quantitative parameters. The specific operation flow is as follows. (1) Each of the original SEM images is uniformly corrected (including improving the image brightness and contrast, using the median filter to denoise the image to accurately define the pore boundary, using image binary processing technology to accurately identify the pore structure, etc.). Among them, the median filter is a noise reduction method that the middle value of the gray of the neighbor pixels replaces the gray value of the central pixel, and is mainly used to eliminate mutational noise points and improve image quality. The above uniform corrections of SEM images are shown in Figure 12. (2) The quantitative parameters were selected for the statistical analysis, among which, the quantitative parameters involved in this study include the average pore diameter, shape ratio, roundness, and the pore contour fractal dimension. The concepts related to the quantitative parameters are described as follows, and the conceptual graph (Figure 12e) is shown for understanding adequately. (3) The quantitative characterization of the pore structure is achieved through the above parameters, and the detailed results are illustrated in Figure 13.
- (1)
- Average pore diameter (μm): it is the average length of diameters (brown lines in Figure 12) measured at 2degree intervals and passing through the centroid of pore.
- (2)
- Shape ratio: it is the ratio of the long axis to the short axis of ellipse equivalent to the pore, and the long axis and short axis are showed in Figure 12. The larger the shape ratio is, the more the pore shape resembles a long strip; the smaller the shape ratio, the more equiaxed the pore is. When the shape ratio is 1, the pore is square-shaped or circular [54].
- (3)
- Roundness: R = 4πA/P2, where P is the perimeter of the pore and A is the pore area. The perimeter is the length of the red contour, and the pore area is the white area inside the red contour (Figure 12). This index can better reflect the plane shape characteristics of the pore; the larger the roundness value is, the closer the pore is to the circle [55].
- (4)
- Fractal dimension: it is used to describe the fractal characteristics of the pores, and it reflects the irregularity of the contact boundary between the pores and the solid particles in loess [56]. The calculation of the pore contour (blue contour in Figure 12) fractal dimension is based on the “silt-island” method, proposed by Mandelbrot [57]: lgP = D/2 × lgA + C where P is the perimeter of the pore; A is the pore area; and C is a constant. The pore contour fractal dimension can be determined by plotting the scatter map in the lgP − lgA double logarithmic coordinate and performing a linear regression analysis. The larger the pore contour fractal dimension, the more complex the pore contour.
It can be observed from Figure 13 that after the ICU tests, the average pore diameter decreased and the shape ratio was basically unchanged; however, the roundness and pore contour fractal dimension shows two different trends: the roundness and the pore contour fractal dimension of the ZT loess increased after the ICU tests. After the ICU tests, the roundness of the STW loess decreased, and the pore contour fractal dimension increased or decreased. It can be inferred that a large deformation (e.g., crushing, rotating, sliding, etc.) occurred in the aggregate spaced pore structure formed by overlapping of the coarse particles inside the loess; this resulted in the sudden and interlocking initial structural damage. The deformation of the pore structure essentially involves particle arrangement and reorganization [46,58]. In addition, the differences in the shape ratio, roundness, and pore contour fractal dimension before and after the ICU tests reflect the uncertainty rearrangement and reorganization of the particles. However, the difference in the average pore diameter before and after the ICU tests shows that the fine particle aggregates can enter the original pore throat in the process of rearrangement and reorganization of the particles. This can be observed intuitively in Figure 8b–e and is also verified by other studies [9,17,57]. At the beginning of the particles rearrangement and reorganization, the water transport channel formed by spaced pores is blocked to a certain extent. Hence, the macroscopic mechanical behavior is characterized by a rapid decrease in the deviatoric stress after the peak stress and a slow increase in the pore water pressure (rapid strain softening stage). Subsequently, the process of particle rearrangement and reorganization tends to be stable, and the migration and agglomeration of fine particles under the action of pore water pressure continue [26]. The synergistic effect of particle rearrangement and reorganization and the pore water pressure causes the agglomeration blocking of the reconstructed pore throat. Therefore, the macroscopic mechanical behavior shows that the deviatoric stress gradually tended to shift to the steady-state stage, and the pore water pressure was maintained at a high level (stable strain softening stage). In addition, the macroscopic mechanical behavior of the loess before reaching the peak strength displayed a rapid increase in the deviatoric stress and the pore water pressure (rapid strain hardening stage). It is reasonable to speculate that the widespread spaced pore structure in loess often requires a certain compression deformation to ensure full contact and the formation of a force chain [59]. This deformation process can also compress the pore water transport channel.
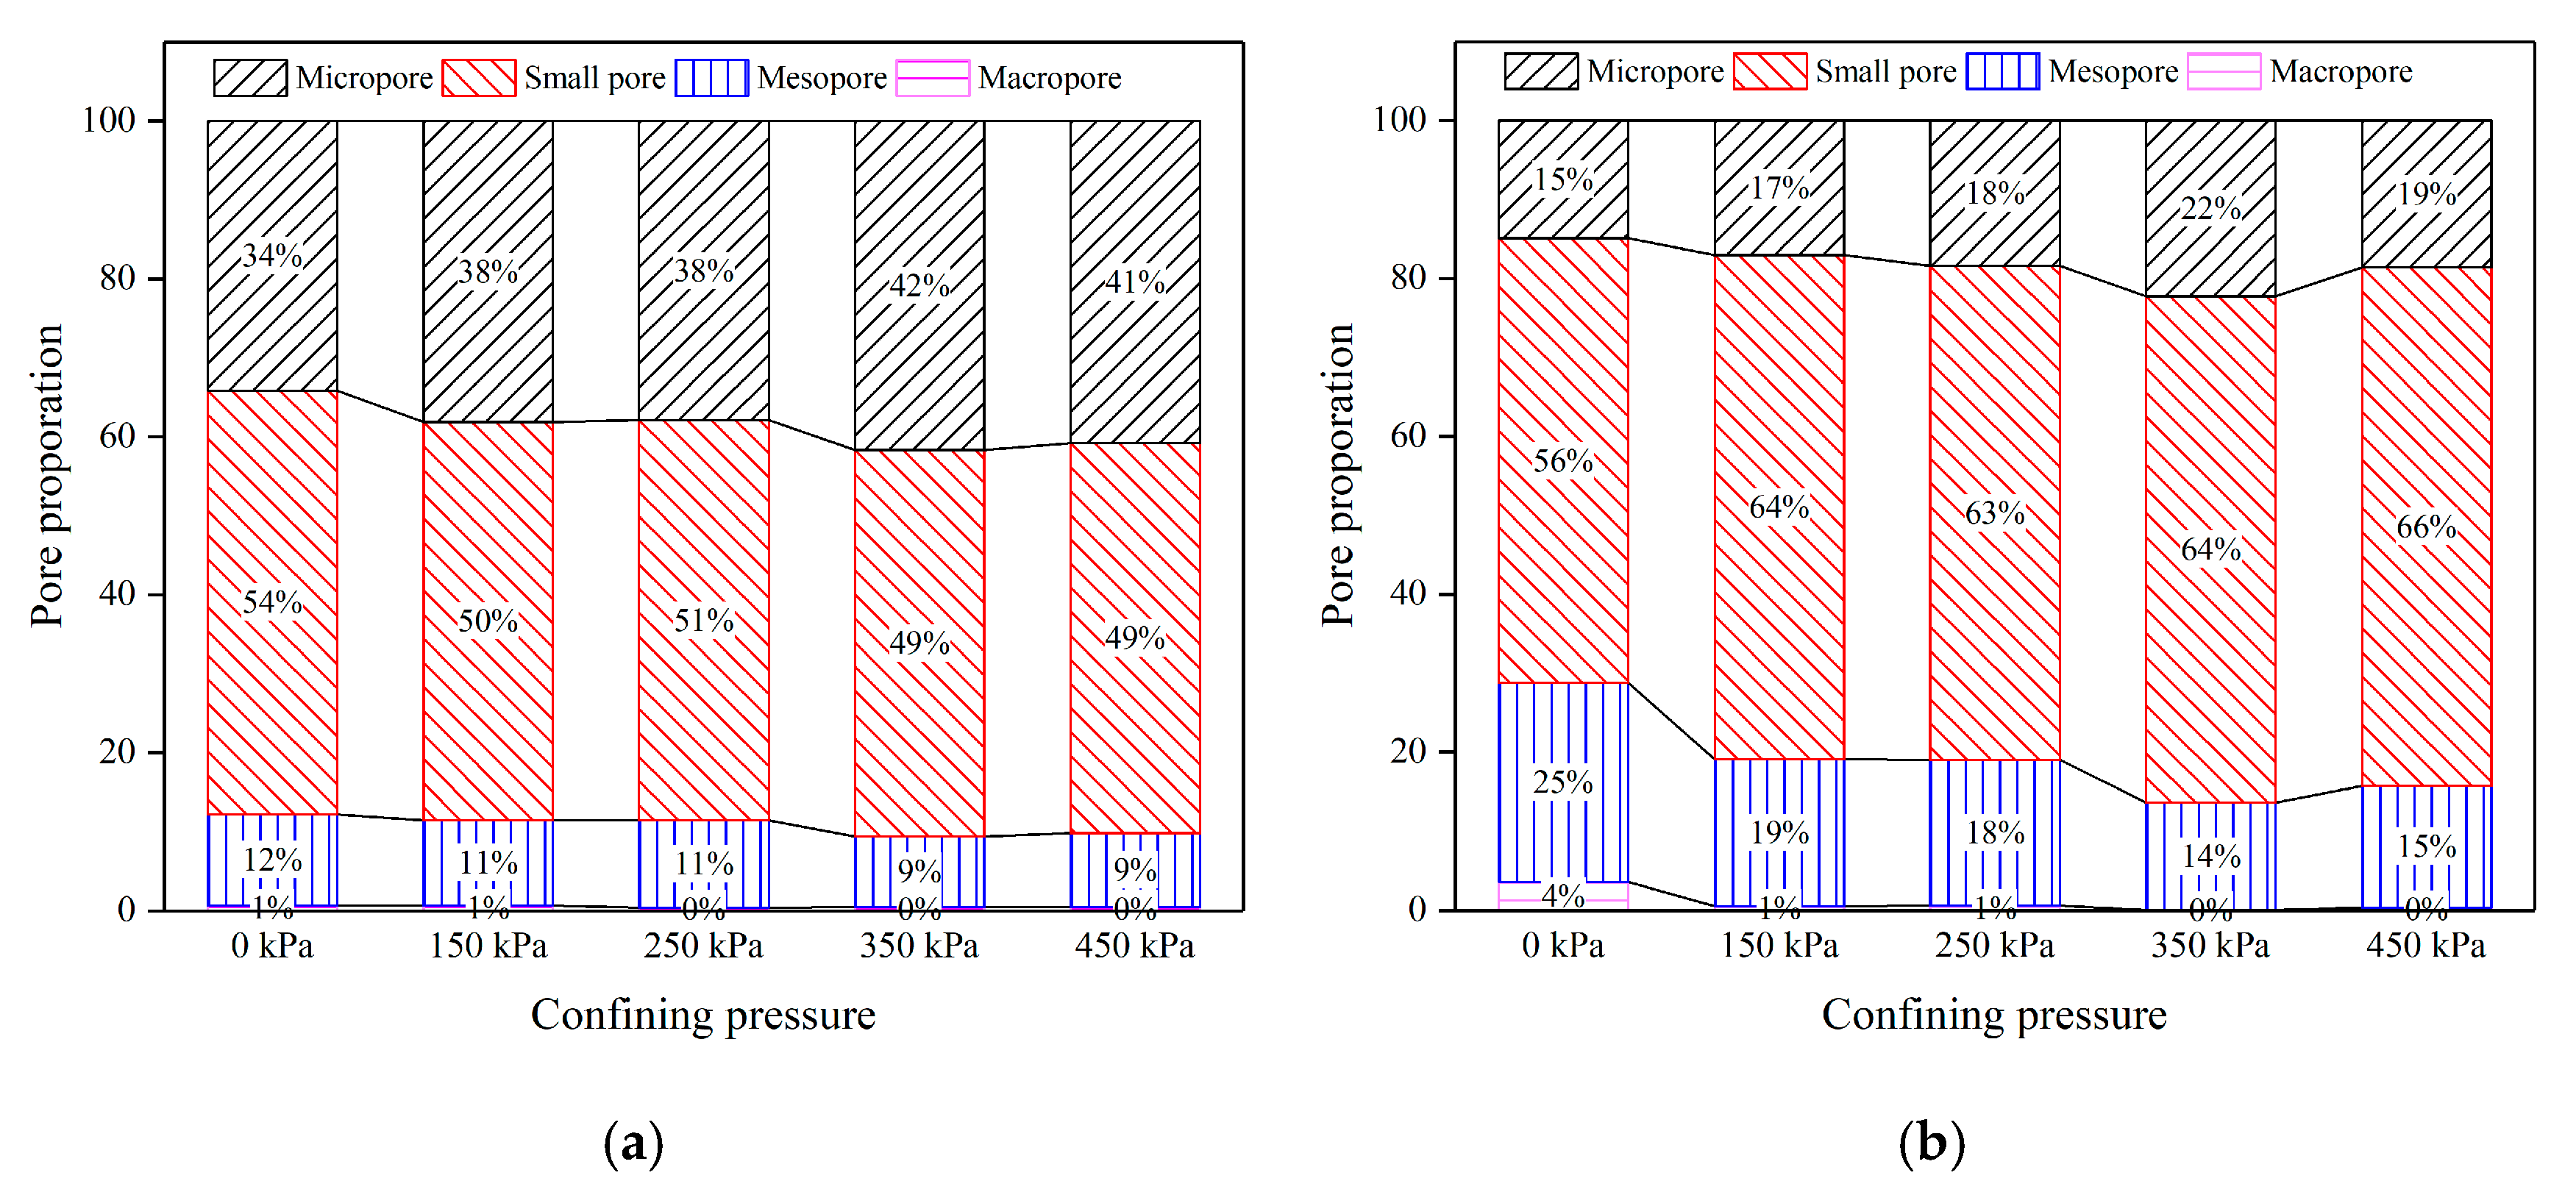
Based on the different pore diameter ranges of the loess (macropore > 32 μm, mesopore 8–32 μm, small pore 2–8 μm, and micropore < 2 μm) proposed by Lei [60], and the IPP was used to perform a statistical analysis on the different pore proportion, the detailed results are presented in Figure 14. As illustrated in Figure 14, after the ICU tests, the different pore proportion change characteristics of the ZT and STW loess were as follows: the macropore and mesopore decreased, the small pore increased slightly, and the micropore increased significantly. The micropores are mainly cement pores; the small pores are mainly mosaic pores and a small amount of cement pores; the mesopores are mainly spaced pores and some mosaic pores; and the macropores mainly includes root holes, wormholes, and fractures [60]. This shows that during the particles reorganization, the intergranular pores are gradually filled by fine particles such as clay aggregates; thus, resulting in an increase in the proportion of the micropore and small pore, which is also illustrated by the decrease in the average pore diameter and Figure 8b–e after the ICU tests. After the ICU tests, most of the above pore structure quantitative parameters (e.g., average pore diameter, shape ratio, roundness, pore contour fractal dimension, and the proportion of the different pores) did not show an obvious monotonic change law with the increase in the confining pressure. The static liquefaction characteristics of the loess come from the change in the internal structure of the loess, which again reflects that there was no clear relationship between the confining pressure and the static liquefaction of the loess in the South Jingyang platform.
The characteristics of the two grain phases (the gain composition was mainly silt and clay) of the ZT and STW loess shown in Table 2 and the pore proportions shown in Figure 14 indicate that the spaced structure formed by the accumulation and overlapping of silt constituted the entire structural framework of the loess. As the particle size of clay was sufficiently small compared with that of silt, the van der Waals force and repulsive force between the clay counteracted the filling effect due to gravity in the relatively loose silt skeleton structure. Therefore, the clay forms relatively closed agglomerates through agglomeration [46]; however, the high content of clay rendered the clay aggregates inlaid or resulted in the filling of the pores or contact areas in the spaced structure (Figure 8 and Figure 9). Therefore, the structure of the loess, which is composed of silt and is filled with clay aggregates, was similar to that of sand, which is composed of coarse grains and is filled with fine grains such as silt [44]. According to a hypothetical model of the interaction between fine grains and coarse grains proposed by Lade and Yamamuro [44], when the fine grains occupy the pores between the coarse grains, they only increase the material density and have negligible influence on the behavior of the soil. When the fine grains occupy the location near the contact of the coarse particles, under the isotropic shear action, the fine grains tend to slide into the pores between the coarse grains. This promotes the rearrangement of the coarse particle structure, it increases the volume shrinkage of the soil, and it produces a greater liquefaction potential under the undrained condition. Therefore, the structure characteristics of the loess provides better structural conditions for the occurrence of static liquefaction phenomenon, which makes it easy to have a structural reorganization under the action of an external load. Clay aggregates would enter the spaced structure that is composed of overlapping silt and hinders the dissipation of pore water [9,17,57].
6. Conclusions
According to the stress-strain curves, pore water pressure-strain curves, and the regions of the stress path, the static liquefaction of the loess in the South Jingyang platform is incomplete. Through a comparative analysis of the microstructure characteristics before and after the ICU tests, the evolution process and internal mechanism of the static liquefaction were revealed. The main conclusions are as follows:
- (1)
- The stress-strain curves of the ZT and STW loess show the characteristics of the strong strain softening under the different confining pressures, and there were stages of rapid strain hardening, rapid strain softening, and stable strain softening. The pore water pressure under the different confining pressures increased rapidly to the effective confining pressure level after a small axial strain (εa < 3%). By having a continuous shear, it was always near this level; hence, its change also presents phased characteristics: a sharp rise stage and a stable stage. The effective confining pressure decreased with an increase in the pore water pressure and then it remained stable. Afterwards, it reached a lower value (20–100 kPa) at the end of the shear.
- (2)
- The LPI of the ZT and STW loess shows a trend of first increasing and then stabilizing with the increase in the confining pressure. The larger LPI was, the smaller ψ was, which reflected that the loess in different layers and buried depths had the ability of static liquefaction. The steady-state points of the saturated loess were the instability region. However, the steady-state strength was not zero, which indicates that there was a certain residual strength and it belonged to the incomplete static liquefaction.
- (3)
- After the ICU tests, the average pore diameter of the ZT and STW loess decreased, and the shape ratio essentially remained unchanged. The pore contour fractal dimension and the roundness show two different trends. The change in the proportion of the different pores is as follows: the macropore and mesopore decreased, the small pore increased slightly, and the micropore increased significantly. However, most of the above pore structure quantitative parameters did not show a monotonous change rule with the increase in the confining pressures.
- (4)
- When εa < 3%, the compression of the spaced pore structure in the loess resulted in full contact and the formation of a force chain, and it compressed the pore water transport channel. The macroscopic mechanical behavior shows rapid strain hardening. When εa = 1–3%, the deformation of the spaced pore structure occurred significantly, that is, the process of particle arrangement and recombination. At the beginning of this process, fine aggregates could enter the original pore throat channel, which caused the water transport channel formed by the spaced pore to be blocked to a certain extent. The macroscopic mechanical behavior shows rapid strain softening. When εa = 10–15%, the gradually stable rearrangement and reorganization of the particles and the migration and agglomeration of finer grains under the effect of the pore water pressure caused agglomeration blocking of the reconstructed pore throat. The macroscopic mechanical behavior indicates stable strain softening.
Author Contributions
Writing—Original Draft Preparation, R.-X.Y.; Funding Acquisition, J.-B.P.; Writing—Review and Editing, R.-X.Y. and J.-Y.Z.; Data Curation, S.-k.W. All authors have read and agreed to the published version of the manuscript.
Funding
This work was supported by the Major Program of National Natural Science Foundation of China (Grant No. 41790441), the National Natural Science Foundation of Shaanxi Province, China (Grant No. 2018JQ5124), and the Foundation of Key Laboratory of Western Mineral Resources and Geological Engineering of Ministry of Education, Chang’ an University (Grant No. 300102268503).
Acknowledgments
We thank the entire team for their efforts to improve the quality of the article. At the same time, we would like to thank editor for his timely handling of the manuscripts.
Conflicts of Interest
The authors declare no conflict of interest.
References
- Terzaghi, K.; Peck, R.B. Soil Mechanics in Engineering Practice, 2nd ed.; John Wiley & Sons: Hoboken, NJ, USA, 1967; Chapter 2; p. 108. ISBN 0471852732. [Google Scholar]
- Castro, G. Liquefaction of Sands; Harvard Soil Mechanics Series No. 81; Harvard University: Cambridge, MA, USA, 1969. [Google Scholar]
- Kramer Steven, L.; Seed, H.B. Initiation of soil liquefaction under static loading conditions. J. Geotech. Eng. 1988, 114, 412–430. [Google Scholar] [CrossRef]
- Mróz, Z.; Boukpeti, N.; Drescher, A. Constitutive model for static liquefaction. Int. J. Geomech. 2003, 3, 133–144. [Google Scholar] [CrossRef]
- Konrad, J.M.; Watts, B.D. Undrained shear strength for liquefaction flow failure analysis. Can. Geotech. J. 1995, 32, 783–794. [Google Scholar] [CrossRef]
- McKenna, G.; Luternauer, J.; Kostaschuk, R. Large-scale mass-wasting events on the Fraser River delta front near Sand Heads, British Columbia. Can. Geotech. J. 1992, 29, 151–156. [Google Scholar] [CrossRef]
- Olson Scott, M.; Stark Timothy, D.; Walton William, H.; Castro, G. 1907 static liquefaction flow failure of the North Dike of Wachusett Dam. J. Geotech. Geoenviron. Eng. 2000, 126, 1184–1193. [Google Scholar] [CrossRef]
- Leng, Y.; Peng, J.; Wang, Q.; Meng, Z.; Huang, W. A fluidized landslide occurred in the Loess Plateau: A study on loess landslide in South Jingyang tableland. Eng. Geol. 2018, 236, 129–136. [Google Scholar] [CrossRef]
- Peng, J.; Zhuang, J.; Wang, G.; Dai, F.; Zhang, F.; Huang, W.; Xu, Q. Liquefaction of loess landslides as a consequence of irrigation. Q. J. Eng. Geol. Hydrogeol. 2018, 51, 330–337. [Google Scholar] [CrossRef]
- Xu, L.; Dai, F.-C.; Min, H.; Kwong, A.K.L. Loess landslide types and topographic features at South Jingyang Plateau, China. Diqiu Kexue-Zhongguo Dizhi Daxue Xuebao/Earth Sci.-J. China Univ. Geosci. 2010, 35, 155–160. [Google Scholar]
- Li, T.; Wang, P.; Xi, Y. The Mechanisms for Initiation and Motion of Chinese Loess Landslides; Springer: Berlin/Heidelberg, Germany, 2013; pp. 105–122. [Google Scholar]
- Ma, P.; Peng, J.; Wang, Q.; Zhuang, J.; Zhang, F. The mechanisms of a loess landslide triggered by diversion-based irrigation: A case study of the South Jingyang Platform, China. Bull. Eng. Geol. Environ. 2019, 78, 4945–4963. [Google Scholar] [CrossRef]
- Zhuang, J.; Peng, J.; Wang, G.; Javed, I.; Wang, Y.; Li, W. Distribution and characteristics of landslide in Loess Plateau: A case study in Shaanxi province. Eng. Geol. 2018, 236, 89–96. [Google Scholar] [CrossRef]
- Yan, R.-X.; Peng, J.-B.; Huang, Q.-B.; Chen, L.-J.; Kang, C.-Y.; Shen, Y.-J. Triggering Influence of Seasonal Agricultural Irrigation on Shallow Loess Landslides on the South Jingyang Plateau, China. Water 2019, 11, 1474. [Google Scholar] [CrossRef] [Green Version]
- Li, H.J.; Jin, Y.L. Initiation analysis of an irrigation-induced loess landslide. Appl. Mech. Mater. 2012, 170–173, 574–580. [Google Scholar] [CrossRef]
- Liu, W.; Chen, W.; Wang, Q.; Wang, J.; Lin, G. Effect of pre-dynamic loading on static liquefaction of undisturbed loess. Soil Dyn. Earthq. Eng. 2020, 130, 105915. [Google Scholar] [CrossRef]
- Wang, G.; Zhang, D.; Furuya, G.; Yang, J. Pore-pressure generation and fluidization in a loess landslide triggered by the 1920 Haiyuan earthquake, China: A case study. Eng. Geol. 2014, 174, 36–45. [Google Scholar] [CrossRef] [Green Version]
- Pei, X.; Zhang, X.; Guo, B.; Wang, G.; Zhang, F. Experimental case study of seismically induced loess liquefaction and landslide. Eng. Geol. 2017, 223, 23–30. [Google Scholar] [CrossRef]
- Xu, L.; Dai, F.C.; Tham, L.G.; Tu, X.B.; Min, H.; Zhou, Y.F.; Wu, C.X.; Xu, K. Field testing of irrigation effects on the stability of a cliff edge in loess, North-West China. Eng. Geol. 2011, 120, 10–17. [Google Scholar] [CrossRef]
- Xu, L.; Dai, F.C.; Gong, Q.M.; Tham, L.G.; Min, H. Irrigation-induced loess flow failure in Heifangtai platform, North-West China. Environ. Earth Sci. 2012, 66, 1707–1713. [Google Scholar] [CrossRef]
- Peng, J.; Qiao, J.; Leng, Y.; Wang, F.; Xue, S. Distribution and mechanism of the ground fissures in Wei River Basin, the origin of the Silk Road. Environ. Earth Sci. 2016, 75, 718. [Google Scholar] [CrossRef]
- Peng, J.; Wang, G.; Wang, Q.; Zhang, F. Shear wave velocity imaging of landslide debris deposited on an erodible bed and possible movement mechanism for a loess landslide in Jingyang, Xi’an, China. Landslides 2017, 14, 1503–1512. [Google Scholar] [CrossRef]
- Peng, J.; Ma, P.; Wang, Q.; Zhu, X.; Zhang, F.; Tong, X.; Huang, W. Interaction between landsliding materials and the underlying erodible bed in a loess flowslide. Eng. Geol. 2018, 234, 38–49. [Google Scholar] [CrossRef]
- Zhuang, J.-Q.; Peng, J.-B. A coupled slope cutting—A prolonged rainfall-induced loess landslide: A 17 october 2011 case study. Bull. Eng. Geol. Environ. 2014, 73, 997–1011. [Google Scholar] [CrossRef]
- Tu, X.B.; Kwong, A.K.L.; Dai, F.C.; Tham, L.G.; Min, H. Field monitoring of rainfall infiltration in a loess slope and analysis of failure mechanism of rainfall-induced landslides. Eng. Geol. 2009, 105, 134–150. [Google Scholar] [CrossRef]
- Derbyshire, E.; Dijkstra, T.A.; Smalley, I.J.; Li, Y. Failure mechanisms in loess and the effects of moisture content changes on remoulded strength. Quat. Int. 1994, 24, 5–15. [Google Scholar] [CrossRef]
- Xu, L.; Dai, F.C.; Tu, X.B.; Javed, I.; Woodard, M.J.; Jin, Y.L.; Tham, L.G. Occurrence of landsliding on slopes where flowsliding had previously occurred: An investigation in a loess platform, North-West China. Catena 2013, 104, 195–209. [Google Scholar] [CrossRef]
- GB/T50123-1999. Standard for Soil Test Method; China Planning Press: Beijing, China, 1999. [Google Scholar]
- Wang, H.N.; Ni, W.K.; Liu, G.Y. Ct images analysis of damage process in loess under triaxial conditions. Adv. Mater. Res. 2011, 243–249, 3175–3181. [Google Scholar] [CrossRef]
- Jiang, M.; Hu, H.; Peng, J.; Leroueil, S. Experimental study of two saturated natural soils and their saturated remoulded soils under three consolidated undrained stress paths. Front. Archit. Civ. Eng. China 2011, 5, 225–238. [Google Scholar] [CrossRef]
- Mandelbrot, B.B.; Passoja, D.E.; Paullay, A.J. Fractal character of fracture surfaces of metals. Nature 1984, 308, 721–722. [Google Scholar] [CrossRef]
- Poulos, S.J. Steady state of deformation. J. Geotech. Eng. Div. 1981, 107, 553–562. [Google Scholar]
- Wang, Y.; Xie, W.; Gao, G. Effect of different moisture content and triaxial test methods on shear strength characteristics of loess. E3S Web Conf. 2019, 92, 07007. [Google Scholar] [CrossRef]
- GAO, G.-R. Classification of microstructures of loess in China and their collapsibility. Sci. Sin. 1981, 24, 962. [Google Scholar]
- Li, P.; Vanapalli, S.; Li, T. Review of collapse triggering mechanism of collapsible soils due to wetting. J. Rock Mech. Geotech. Eng. 2016, 8, 256–274. [Google Scholar] [CrossRef]
- Fang, X.; Shen, C.; Li, C.; Wang, L.; Chen, Z. Quantitative analysis of microstructure characteristics of Pucheng loess in Shaanxi Province. Yanshilixue Yu Gongcheng Xuebao Chin. J. Rock Mech. Eng. 2013, 32, 1917–1925. [Google Scholar]
- Wang, F.W.; Sassa, K.; Wang, G. Mechanism of a long-runout landslide triggered by the August 1998 heavy rainfall in Fukushima Prefecture, Japan. Eng. Geol. 2002, 63, 169–185. [Google Scholar] [CrossRef]
- Ng, C.W.W.; Fung, W.; Cheuk, C.Y.; Zhang, L. Influence of stress ratio and stress path on behavior of loose decomposed granite. J. Geotech. Geoenviron. Eng. 2004, 130. [Google Scholar] [CrossRef]
- Bishop, A.W. Progressive failure with special reference to the mechanism causing it. In Proceedings of the Geotechnical Conference; Norwegian Geotechnical Institute: Oslo, Norway, 1968; pp. 142–150. [Google Scholar]
- Been, K.; Jefferies, M.G. A state parameter for sands. Géotechnique 1985, 35, 99–112. [Google Scholar] [CrossRef]
- Sladen, J.; D’Hollander, R.; Krahn, J.; Mitchell, D. Back analysis of the nerlerk berm liquefaction slides. Can. Geotech. J. 1985, 22, 579–588. [Google Scholar] [CrossRef]
- Been, K.; Conlin, B.; Crooks, J.; Fitzpatrick, S.; Jefferies, M.; Rogers, B.; Shinde, S. Back analysis of the Nerlerk berm liquefaction slides: Discussion. Can. Geotech. J. 2011, 24, 170–179. [Google Scholar] [CrossRef]
- Vaid, Y.P.; Chung, E.K.F.; Kuerbis, R.H. Stress path and steady state. Can. Geotech. J. 1990, 27, 1–7. [Google Scholar] [CrossRef]
- Lade, P.; Yamamuro, J. Effects of nonplastic fines on static liquefaction of sands. Can. Geotech. J. 1997, 34, 918–928. [Google Scholar] [CrossRef]
- Sladen, J.; D’Hollander, R.; Krahn, J. The liquefaction of sands, a collapse surface approach. Can. Geotech. J. 1985, 22, 564–578. [Google Scholar] [CrossRef]
- Lade, P.V.; Yamamuro, J.A. Evaluation of static liquefaction potential of silty sand slopes. Can. Geotech. J. 2011, 48, 247–264. [Google Scholar] [CrossRef]
- Zhou, Y.-X.; Zhang, D.-X.; Luo, C.-Y.; Chen, J. Experimental research on steady strength of saturated loess. Yantu Lixue/Rock Soil Mech. 2010, 31, 1486–1490. [Google Scholar]
- Ishihara, K. Liquefaction and flow failure during earthquakes. Géotechnique 1993, 43, 351–451. [Google Scholar] [CrossRef]
- Konrad, J.M. Undrained response of loosely compacted sands during monotonic and cyclic compression tests. Géotechnique 1993, 43, 69–89. [Google Scholar] [CrossRef]
- Tian, K.-L.; Wang, P.; Zhang, H.-L. Discussion on stress-strain relation of intact loess considering soil structure. Yantu Lixue Rock Soil Mech. 2013, 34, 1893–1898. [Google Scholar]
- Shen, Y.; Yang, H.; Xi, J.; Yang, Y.; Wang, Y.; Wei, X. A novel shearing fracture morphology method to assess the influence of freeze–thaw actions on concrete–granite interface. Cold Reg. Sci. Technol. 2020, 169, 102900. [Google Scholar] [CrossRef]
- Hu, R.L.; Yeung, M.R.; Lee, C.F.; Wang, S.J. Mechanical behavior and microstructural variation of loess under dynamic compaction. Eng. Geol. 2001, 59, 203–217. [Google Scholar] [CrossRef]
- Wang, Q.; Wang, L.M.; Wang, J.; Ma, H.P.; Zhong, X.M.; Wang, N.; Wang, J. Laboratory study on the liquefaction properties of the saturation structural loess. Appl. Mech. Mater. 2012, 170–173, 1339–1343. [Google Scholar] [CrossRef]
- Xie, X.; Qi, S.; Zhao, F.; Wang, D. Creep behavior and the microstructural evolution of loess-like soil from Xi’an area, China. Eng. Geol. 2018, 236, 43–59. [Google Scholar] [CrossRef]
- Li, X.A.; Hong, B.; Wang, L.; Li, L.; Sun, J. Microanisotropy and preferred orientation of grains and aggregates (POGA) of the Malan loess in Yan’an, China: A profile study. Bull. Eng. Geol. Environ. 2020, 79, 1893–1907. [Google Scholar] [CrossRef]
- Zhao, S.; Zhao, Y.; Wu, J. Quantitative analysis of soil pores under natural vegetation successions on the Loess Plateau. Sci. China Earth Sci. 2010, 53, 617–625. [Google Scholar] [CrossRef]
- Zhang, X.-C.; Huang, R.-Q.; Xu, M.; Pei, X.-J.; Han, X.-S.; Song, L.-J.; Zhang, F.-Y. Loess liquefaction characteristics and its influential factors of Shibeiyuan landslide. Yantu Lixue Rock Soil Mech. 2014, 35, 801–810. [Google Scholar]
- Li, P.; Xie, W.; Pak, R.Y.S.; Vanapalli, S.K. Microstructural evolution of loess soils from the Loess Plateau of China. Catena 2019, 173, 276–288. [Google Scholar] [CrossRef]
- Liu, Z.; Liu, F.; Ma, F.; Wang, M.; Bai, X.; Zheng, Y.; Yin, H.; Zhang, G. Collapsibility, composition, and microstructure of loess in China. Can. Geotech. J. 2016, 53, 673–686. [Google Scholar] [CrossRef] [Green Version]
- Lei, X.-Y. Pore type of loess in China and collapsibility. Sci. China Ser. B 1987, 17, 1309–1316. [Google Scholar]
Figure 1.
The loess landslides distribution in the South Jingyang platform.

Figure 2.
The profile of loess-paleosol contact interface in the South Jingyang platform.

Figure 3.
Development characteristics of the “7.26” high-speed and long-distance landslide in Hetan village, Western Miaodian.
Figure 3.
Development characteristics of the “7.26” high-speed and long-distance landslide in Hetan village, Western Miaodian.

Figure 4.
Wykeham Farrance (WF) stress path triaxial apparatus.

Figure 5.
Stress-strain curves of the ZT and STW loess. (a) ZT. (b) STW.

Figure 6.
Pore water pressure-strain curves of the ZT and STW loess. (a) ZT. (b) STW.

Figure 7.
Effective confining pressure-strain curves of the ZT and STW loess. (a) ZT. (b) STW.

Figure 8.
SEM images (2000×) of the ZT and STW loess before and after the isotropic consolidated undrained (ICU) tests. (a1) Saturated (ZT). (a2) Saturated (STW). (b1) 150 kPa (ZT). (b2) 150 kPa (STW). (c1) 250 kPa (ZT). (c2) 250 kPa (STW). (d1) 350 kPa (ZT). (d2) 350 kPa (STW). (e1) 450 kPa (ZT). (e2) 450 kPa (STW).


Figure 9.
SEM images (500×) of the ZT and STW loess before and after the ICU tests. (a1) Saturated (ZT). (a2) Saturated (STW). (b1) 150 kPa (ZT). (b2) 150 kPa (STW). (c1) 250 kPa (ZT). (c2) 250 kPa (STW). (d1) 350 kPa (ZT). (d2) 350 kPa (STW). (e1) 450 kPa (ZT). (e2) 450 kPa (STW).
Figure 9.
SEM images (500×) of the ZT and STW loess before and after the ICU tests. (a1) Saturated (ZT). (a2) Saturated (STW). (b1) 150 kPa (ZT). (b2) 150 kPa (STW). (c1) 250 kPa (ZT). (c2) 250 kPa (STW). (d1) 350 kPa (ZT). (d2) 350 kPa (STW). (e1) 450 kPa (ZT). (e2) 450 kPa (STW).

Figure 10.
Measurement index of the liquefaction capacity. (a) liquefaction potential index (LPI). (b) ψ.
Figure 10.
Measurement index of the liquefaction capacity. (a) liquefaction potential index (LPI). (b) ψ.

Figure 11.
The stress paths of the ZT and STW loess. (a) ZT. (b) STW.

Figure 12.
SEM images correction process. (a) Original SEM images. (b) Improving brightness and contrast. (c) Median filter. (d) Binary processing. (e) Quantitative parameters of different types pore structure.
Figure 12.
SEM images correction process. (a) Original SEM images. (b) Improving brightness and contrast. (c) Median filter. (d) Binary processing. (e) Quantitative parameters of different types pore structure.

Figure 13.
The quantitative parameters of the ZT and STW loess before and after the ICU tests. (a) Average pore diameter. (b) Shape ratio. (c) Roundness. (d) Pore contour fractal dimension.
Figure 13.
The quantitative parameters of the ZT and STW loess before and after the ICU tests. (a) Average pore diameter. (b) Shape ratio. (c) Roundness. (d) Pore contour fractal dimension.

Figure 14.
Different pore proportion of the ZT and STW loess before and after the ICU tests. (a) ZT. (b) STW.
Figure 14.
Different pore proportion of the ZT and STW loess before and after the ICU tests. (a) ZT. (b) STW.


Table 1.
Basic physical properties of the Zhaitou (ZT) and Shutangwang (STW) loess.
| Samples | Water Content (%) | Dry Density (g/cm3) | Void Ratio | Specific Gravity (g·cm−3) | Liquid Limit (%) | Plastic Limit (%) | Liquid Index | Plastic Index |
|---|---|---|---|---|---|---|---|---|
| ZT | 17 | 1.44 | 0.88 | 2.71 | 25.3 | 19.61 | −0.46 | 5.73 |
| STW | 9.8 | 1.43 | 0.89 | 2.72 | 24.4 | 20.35 | −2.59 | 4.08 |
Table 2.
The particle and mineral composition of the ZT and STW loess.
| Samples | Particle Size(%) | Mineral Composition(%) | |||||||
|---|---|---|---|---|---|---|---|---|---|
| Clay (≤5 μm) | Silt (5–75 μm) | Fine Sand (75–250 μm) | Quartz | Carbonate | Illite | Kaolinite | Chlorite | Others | |
| ZT | 22.6 | 74.1 | 3.3 | 29 | 23 | 20 | 5 | 14 | 9 |
| STW | 10.6 | 82.2 | 7.2 | 31 | 20 | 19 | 3 | 17 | 10 |
© 2020 by the authors. Licensee MDPI, Basel, Switzerland. This article is an open access article distributed under the terms and conditions of the Creative Commons Attribution (CC BY) license (http://creativecommons.org/licenses/by/4.0/).
Share and Cite
MDPI and ACS Style
Yan, R.-X.; Peng, J.-B.; Zhang, J.-Y.; Wang, S.-k. Static Liquefaction Capacity of Saturated Undisturbed Loess in South Jingyang Platform. Water 2020, 12, 2298. https://0-doi-org.brum.beds.ac.uk/10.3390/w12082298
AMA Style
Yan R-X, Peng J-B, Zhang J-Y, Wang S-k. Static Liquefaction Capacity of Saturated Undisturbed Loess in South Jingyang Platform. Water. 2020; 12(8):2298. https://0-doi-org.brum.beds.ac.uk/10.3390/w12082298
Chicago/Turabian StyleYan, Rui-Xin, Jian-Bing Peng, Jin-Yuan Zhang, and Shao-kai Wang. 2020. "Static Liquefaction Capacity of Saturated Undisturbed Loess in South Jingyang Platform" Water 12, no. 8: 2298. https://0-doi-org.brum.beds.ac.uk/10.3390/w12082298
Note that from the first issue of 2016, this journal uses article numbers instead of page numbers. See further details here.