Article

Implications of Nutrient Enrichment and Related Environmental Impacts in the Pearl River Estuary, China: Characterizing the Seasonal Influence of Riverine Input

1
Institute of Estuarine and Coastal Research, School of Marine Engineering and Technology, Sun Yat-sen University, Guangzhou 510275, China
2
Guangdong Provincial Engineering Research Center of Coasts, Islands and Reefs, Guangzhou 510006, China
3
Southern Laboratory of Ocean Science and Engineering, Zhuhai 519000, China
4
Section of Safety and Security Science, Delft University of Technology, 2628 BX Delft, The Netherlands
*
Author to whom correspondence should be addressed.
Current address: Institute of Estuarine and Coastal Research, School of Marine Engineering and Technology, Sun Yat-sen University, Zhuhai 519000, China.
Submission received: 6 October 2020 / Revised: 11 November 2020 / Accepted: 16 November 2020 / Published: 19 November 2020
(This article belongs to the Special Issue Pollution in Estuaries and Coastal Marine Waters)

Abstract

:
The Pearl River estuary is an ecologically dynamic region located in southern China that experiences strong gradients in its biogeochemical properties. This study examined the seasonality of nutrient dynamics, identified related environmental responses, and evaluated how river discharge regulated nutrient sink and source. The field investigation showed significant differences of dissolved nutrients with seasons and three zones of the estuary regarding the estuarine characteristics. Spatially, nutrients exhibited a clear decreasing trend along the salinity gradient; temporally, their levels were obviously higher in summer than other seasons. The aquatic environment was overall eutrophic, as a result of increased fluxes of nitrogen and silicate. This estuary was thus highly sensitive to nutrient enrichment and related pollution of eutrophication. River discharge, oceanic current, and atmospheric deposition distinctly influenced the nutrient status. These factors accordingly may influence phytoplankton that are of importance in coastal ecosystems. Phytoplankton (in terms of chlorophyll) was potentially phosphate limited, which then more frequently resulted in nutrient pollution and blooms. Additionally, the nutrient sources were implied according to the cause–effect chains between nutrients, hydrology, and chlorophyll, identified by the PCA-generated quantification. Nitrogen was constrained by marine-riverine waters and their mutual increase-decline trend, and a new source was supplemented along the transport from river to sea, while a different source of terrestrial emission from coastal cities contributed to phosphate greatly.

1. Introduction

Riverine nutrient input (e.g., N, P, and Si) and their effects on the aquatic environment in the river-estuary-shelf systems have received an increasing amount of attention over the past few decades [1,2]. Nutrient levels have been significantly increased under the combination of natural changes and human activities in medium- and large-scale estuaries worldwide, stimulating the pollution of eutrophication and affecting biological responses [3,4]. Moreover, any changes in riverine nutrient input and their forms can cause alterations of the associated marine community and might shape the ecological stability [1,5]. River discharge provides abundant nutrients and other biogeochemical properties in the plume along the salt water of an estuary that stimulates phytoplankton growth [6]. The effective management of these inputs on estuarine coastal waters requires extensive monitoring of nutrient transportation through the river-estuary-shelf systems and can provide a realistic estimate of inputs o the open seas [7,8].
Estuaries, as the seaward continuum between lands and oceans, generally have enriched levels of nutrients mainly derived from river discharge, atmosphere, and ocean as well, which regulates phytoplankton production in coastal marine ecosystems [9,10,11,12]. Excess nutrients from farmlands entering into coastal ecosystems as organic and inorganic compounds pose a major threat to the ecological stability of this environment [13]. Waters in estuaries are specifically characterized by the interaction between fresh water and marine water [14]; correspondingly, the roles of associated indicators (e.g., salinity, sediment) on nutrients have raised the need to understand the biogeochemical responses and environmental impacts [15,16].
Over the past decades, the increased anthropogenic nutrients have caused many estuarine systems to shift drastically from nutrient-limiting to nutrient-surplus conditions [17]. Unbalanced loading of any one of these nutrients can lead to changes in the nutrient ratios, creating either Si-, P-, or N-limitation [18]. In addition, the nutrient concentrations and molar ratios are well known to strongly affect phytoplankton communities [19]. The case study of pollutant-enriched Pearl River estuary (PRE), displayed in Figure 1, examines nutrient-related pollution and the river’s ecological response. Extensive studies have been carried out in this estuary, including the characterization of hydrographic properties [20], nutrient dynamics [2,21], biological features [4,22,23], and their relationships [24,25]. The seasonal dynamics of nutrients are significant [24,26]: in the dry season, the thermocline can effectively block the vertical exchanges of nutrients, and then confine the phytoplankton at a shallow surface layer [27]. During a flood season, nutrient input from riverine inflows largely enriches the estuary, and high-salinity water induced by the upwelling winds from the ocean also partially contributes to the nutrient enrichment [28]. The estuarine biogeochemical processes of nutrients vary spatiotemporally, and highly depend on the specific properties of estuarine systems [29,30]. These distinguished processes are involved with the nutrient requirements for primary producers; related environmental pollution with economic impacts are associated with nutrient over-enrichment. However, the importance of estuarine processes for determining the spatiotemporal variations of nutrient characteristics has scarcely been documented. Knowledge of how riverine nutrient inputs influence coastal ecosystems that are different from either the upstream or open sea environments is still being developed. In light of the above discussion, the objectives of this field investigation are designed to (1) assess the seasonality of nutrients and related ecosystem responses in this large-scale estuary; (2) capture the seasonal trends of influencing factors that contribute to eutrophication including dissolved nutrients, chlorophyll a, and dissolved oxygen; and (3) identify factors (e.g., salinity, suspended particulate matter, and river discharge) that influence nutrient enrichment.

2. Materials and Methods
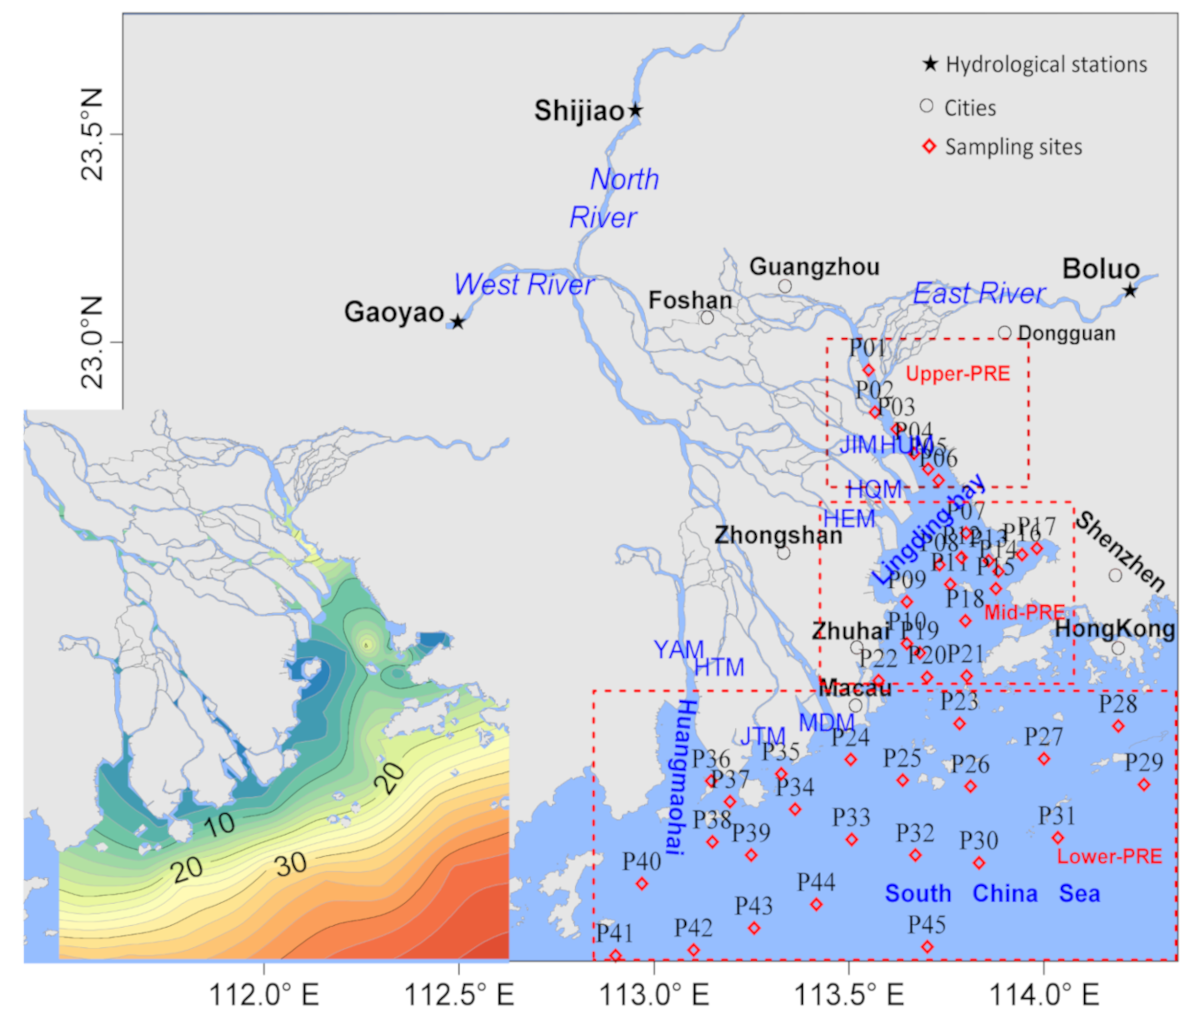
2.1. Study Site

The Pearl River estuary, located in south China, is particularly known for strong interactions between oceanic currents and fresh waters, forming a very complicated estuarine system. Seasonal variation in hydrology occurs in both the flood (April to September) and dry seasons (October to March) [21]. Moreover, 80% of all freshwater discharge is in the flood season [31]. Waters of the Pearl River system, consisting of river networks and estuaries, enter into the South China Sea via eight gates (at Humen, Jiaomen, Hongqimen, Hengmen, Modaomen, Jitimen, Hutiaomen, and Yamen). The case study area was divided into different zones according to the estuarine dynamics of interactions between seawater currents and freshwater inflow: upper-PRE (<10‰), middle-PRE (10–20‰), and lower-PRE (>20‰).
The Pearl River has the second highest freshwater discharge of rivers in China (333.8 Km 3 /year), only behind the Changjiang River (951.3 Km 3 /year). The monthly and yearly variations in freshwater discharge and sediment load are displayed in Figure 2. The seasonal variation in hydrology in 2016 is significant; the monthly water discharge was 40.3 Km 3 (April–September) and 18.2 Km 3 (January–March, October–December) in the flood and dry seasons, respectively, with the corresponding monthly sediment loads of 3.6 Mt and 0.8 Mt. The annual water discharge and sediment load over the past two decades (1997–2016) were 281.8 Km 3 /year and 34.9 Mt/year, respectively.

2.2. Sample Collection and Analysis

Four surveys were conducted in the PRE in 2016 (February, May, August, and November). The sampling site locations, named P01–45, are presented in Figure 1. All the sampling sites were designed in four seasons. Physicochemical observations included dissolved oxygen (DO), chemical oxygen demand (COD), salinity, suspended particulate matter (SPM), ammonium (NH 4 ), nitrate (NO 3 ), nitrite (NO 2 ), phosphorus (PO 4 ), silicate (SiO 4 ), total nitrogen (TN), and total phosphorus (TP). One biological variable, phytoplankton chlorophyll (Chla), was measured. Additionally, the following discussion related to DIN was the sum of NH 4 , NO 3 , and NO 2 ; DIP and DSi were intended to PO 4 and SiO 4 , respectively. The summary of water quality parameters in the surface water of the PRE was presented in Table 1.
Water samples were collected in Niskin bottles mounted on a rosette sampler according to the specification of marine monitoring (GB17378-2007). Surface samples were collected when the water depth was less than 5 m; samples at surface and bottom layers were collected when the water depth was at 5–15 m; six layers were collected when the depth was larger than 15 m. Physical factors (salinity and water depth) were measured in situ with a Conductivity–Temperature–Depth/Pressure Profiler (CTD, Sea-bird Electronics, Bellevue, WA, USA). Water samples for dissolved nutrients were first filtered in situ using a 0.45 µm cellulose acetate filter. Saturated HgCl 2 solution was added to the filtrates, and these processed water samples were stored at −20 °C until shipping back to the laboratory for further analysis. The concentrations of SPM were weighed (gravimetric analysis). The concentrations of nutrients, DO, COD, and chlorophyll a were determined according to the requirements of “the specification for marine monitoring–Part 4: Seawater analysis” (GB 17378.4-2007). The nutrient concentrations were determined by colorimetry. The DO was calculated by the iodometry method, and the COD was calculated by the alkaline permanganate method. For the biological property (chlorophyll a), 2–5 L water samples were extracted at each site; and 3 mL of MgCO 3 solution was added and the mixed samples were then filtered through a 47 mm diameter Whatman GF/C. The concentrations of chlorophyll a were calculated after 14–24 h sedimentation in the laboratory, and were determined spectrophotometrically.

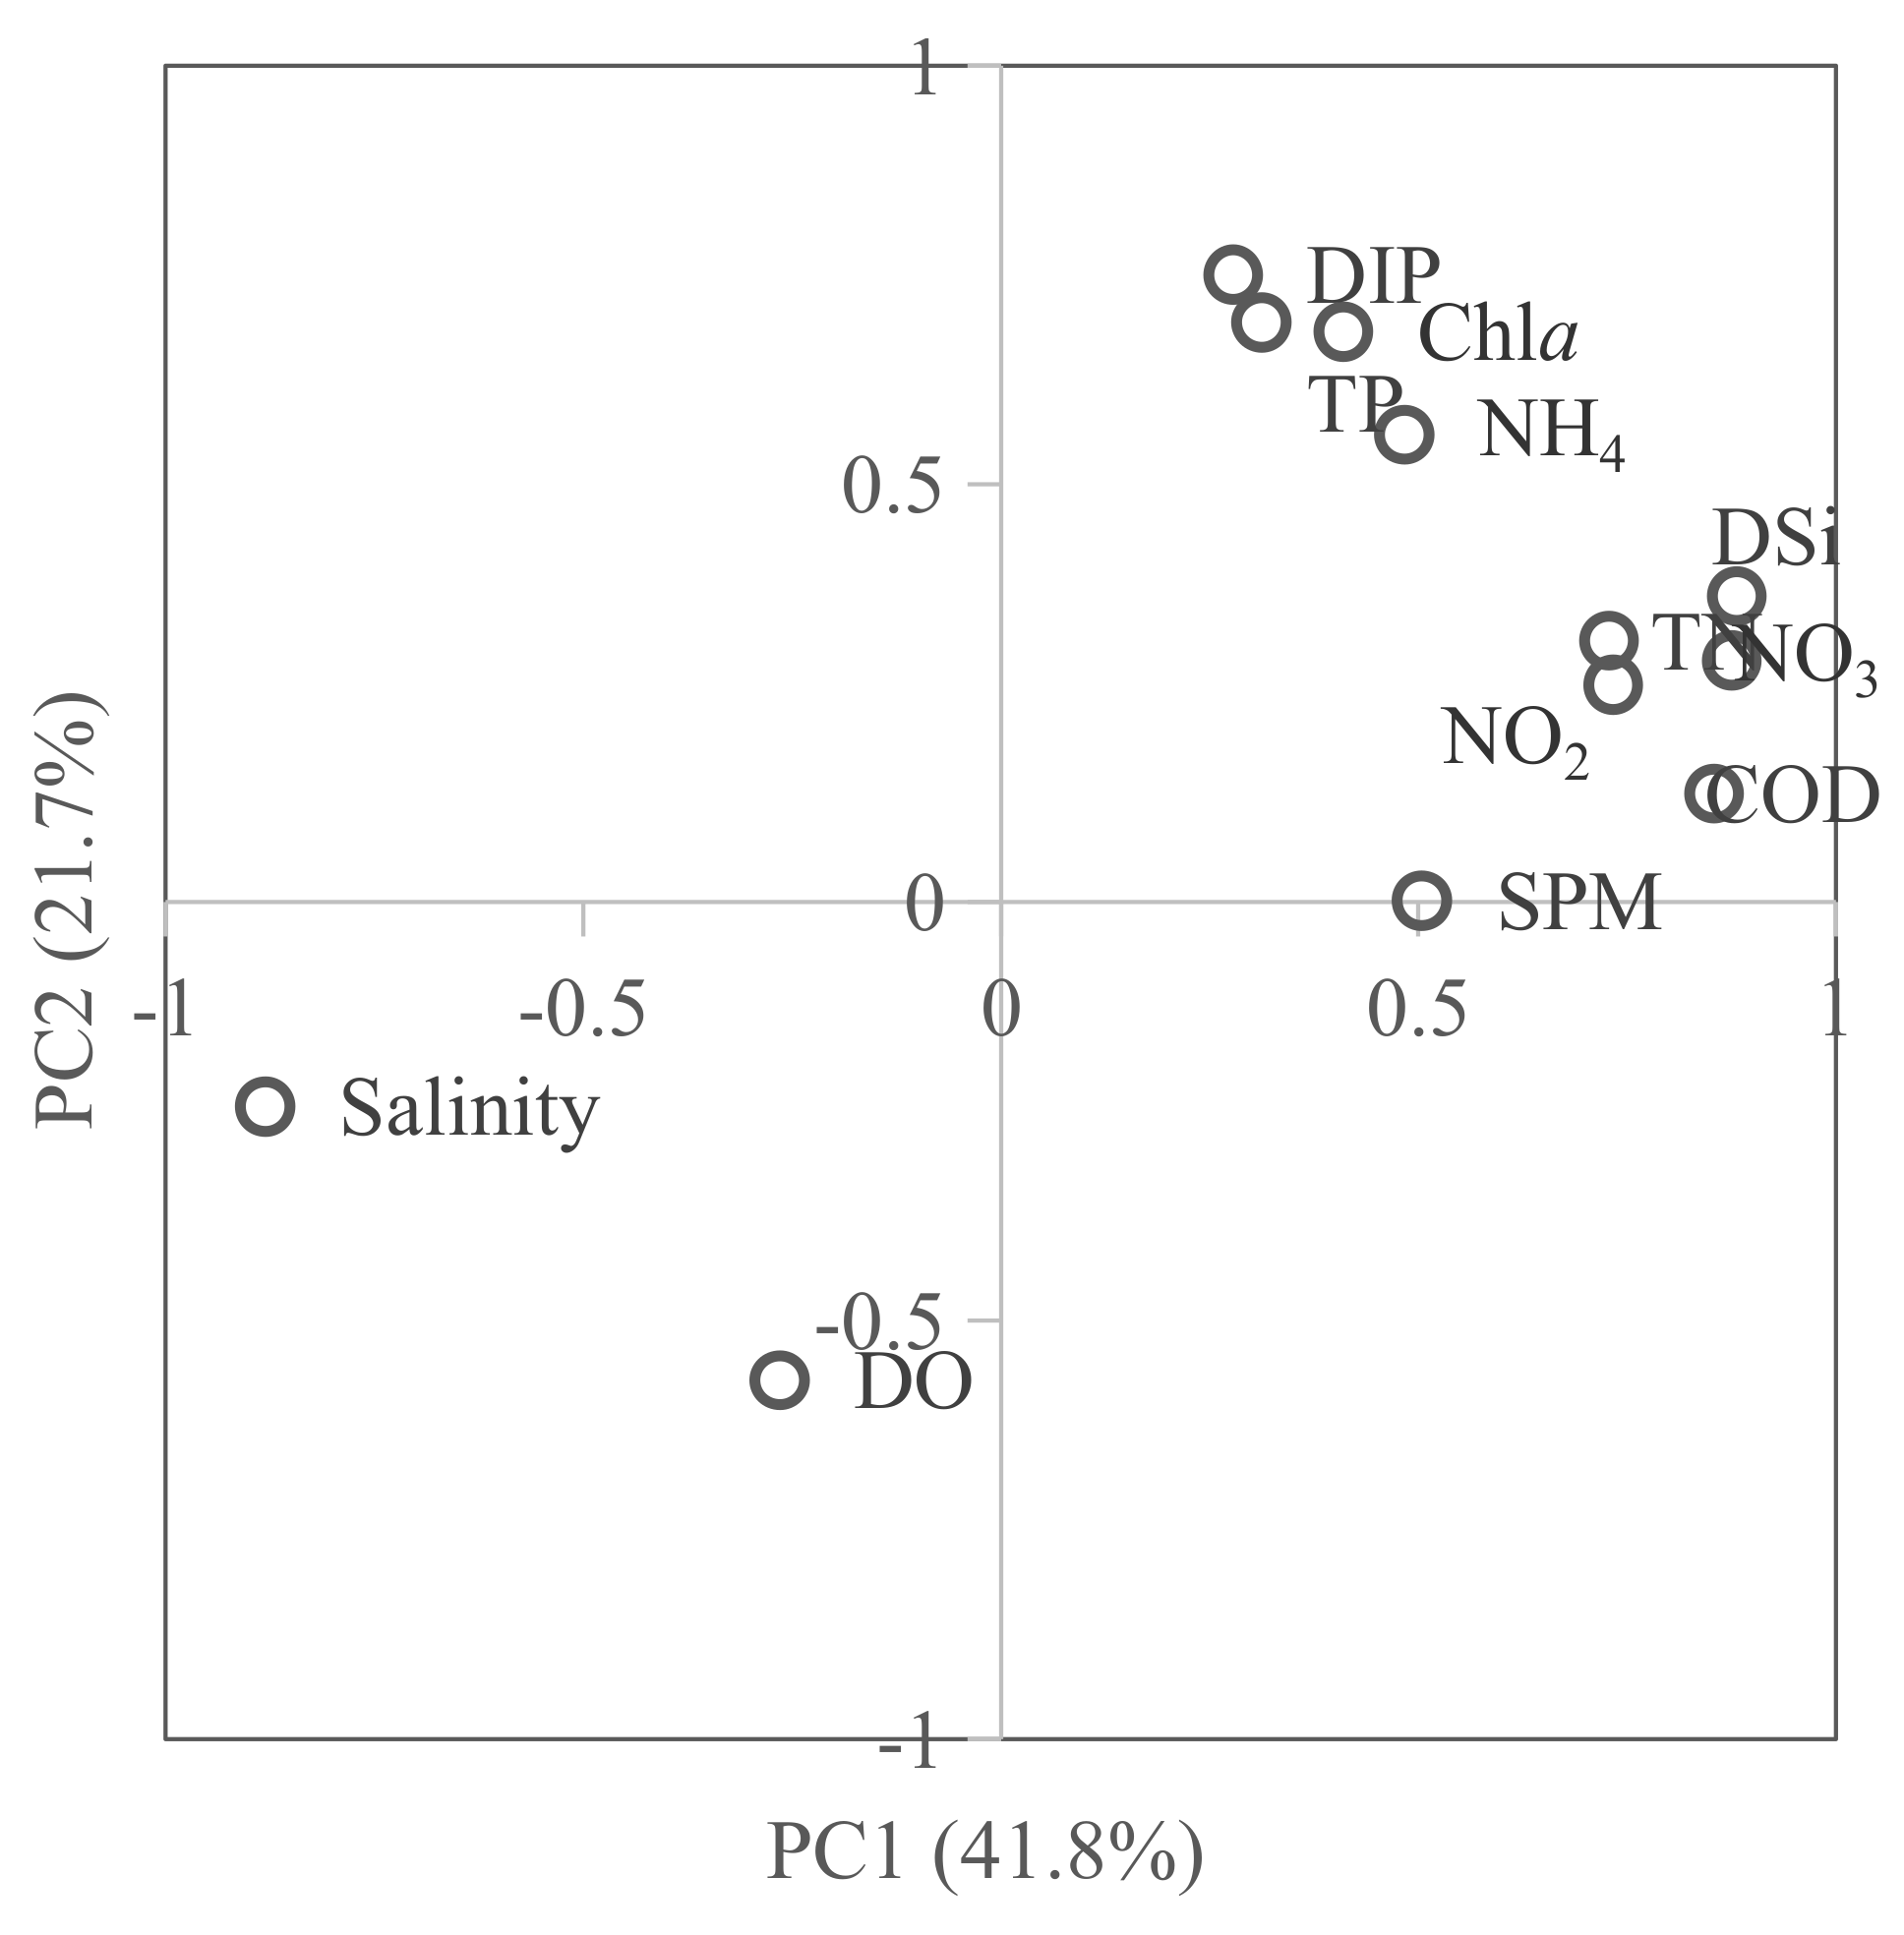
2.3. Statistical Analysis

Horizontal distributions of observed nutrients were plotted with Golden Software Surfer 13 (Golden Software, Inc., Golden, CO, USA). Correlations between variables were tested with Pearson correlation. Analysis of variance (ANOVA) was used to examine whether nutrient concentrations differed spatially among stations in various water quality and phytoplankton chlorophyll. The dilution-mixing process of oceanic current on dissolved nutrients was discussed through the interplay between salinity and nutrients. The role of suspended sediment on the dissolved nutrients was investigated by the regression analysis. Principal component analysis (PCA) was introduced to test the strength of the linear associations between chlorophyll and associated environmental variables [32,33]. Principal components (PCs) with eigenvalues greater than 1 were extracted. The data were standardized before PCA because the variables had different units and inconsistency. A method of varimax rotation (Kaiser normalization) generated more meaningful representations of the underlying PCs. The data preparations for PCA, linear regression, and Pearson correlation analyzes were conducted using the statistical package IBM SPSS Statistics 26.
To evaluate water quality in the estuary, eutrophication level (E) was introduced to identify the nutrient-related pollution [16], E = DIN × DIP × COD × 10 6 /4500. Water bodies were classified as slight eutrophic when the eutrophication was larger than 1 (E > 1), moderately eutrophic when 1 < E < 5, and severely eutrophic when E > 5. In addition, a two end-member mixing model was performed to differentiate the physically induced alterations in dissolved nutrients (DIN, DIP, DSi) from the biological uptake in this estuary system, as used in the previous studies of [26,29,34]. The model was based on mass balance equations for potential salinity and the fractions of freshwater and seawater, as follows in Equations (1) and (2):
F 1 + F 2 = 1 ;
S 1 F 1 + S 2 F 2 = S i n s i t u
where S i n s i t u represents the salinity in the field samples; F 1 and F 2 are the fractions of the freshwater and seawater, respectively; while S 1 and S 2 denote the corresponding salinity levels of the two end-members.
The conservative nutrient concentrations of DIN (N*), DIP (P*), and DSi (Si*) predicted by the two end-member model were calculated using Equations (3) to (5), respectively:
N * = D I N 1 F 1 + D I N 2 F 2
P * = D I P 1 F 1 + D I P 2 F 2
S i * = D S i 1 F 1 + D S i 2 F 2
where DIN 1 , DIN 2 , DIP 1 , DIP 2 , DSi 1 , and DSi 2 are the corresponding concentrations of the two end-members for DIN, DIP, and DSi. The deviations between the predicted values and field observations were defined as Δ s, which reflected the amounts of nutrient input (negative) or removal (positive) associated with biological uptake, calculated using Equations (6) to (8):
Δ D I N = N * D I N i n s i t u
Δ D I P = P * D I P i n s i t u
Δ D S i = S i * D S i i n s i t u
Note that the freshwater end-members were obtained by averaging salinity, DIN, DIP, and DSi in the upper PRE (sampling sites P01–06). The seawater end-members were based on the averaging values in the lower PRE (sampling sites P23–45).

3. Results and Discussion

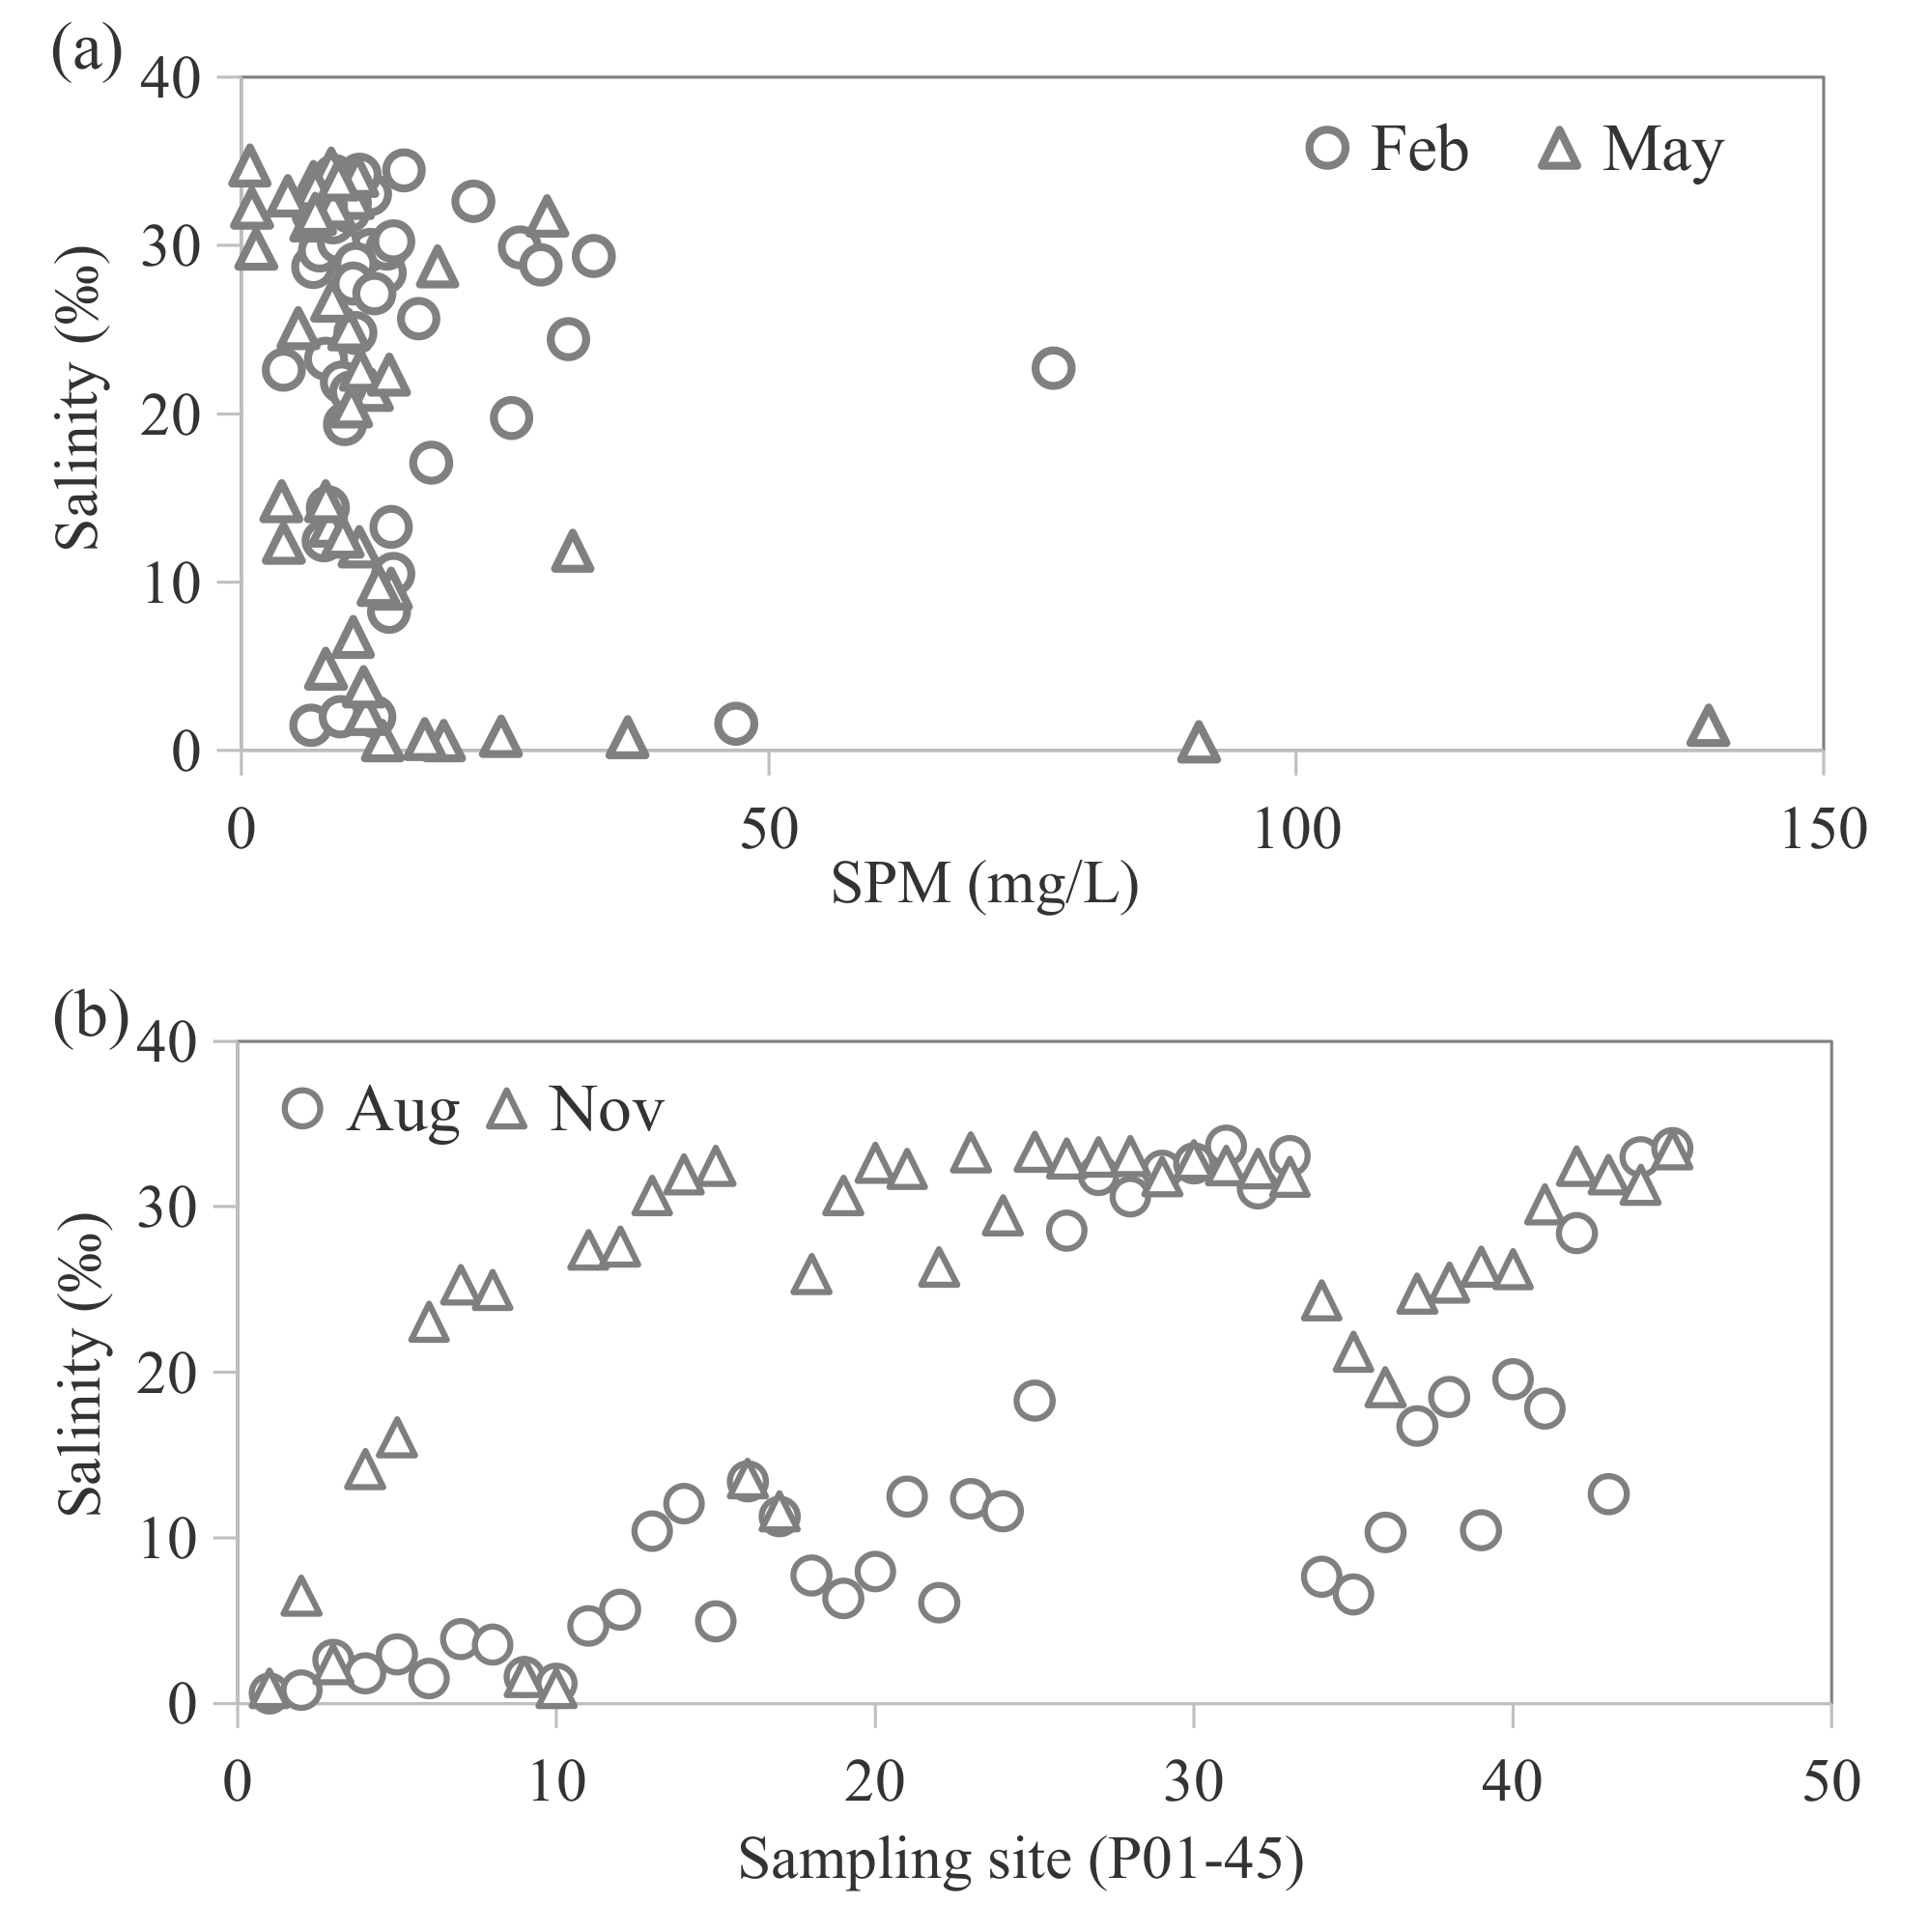
3.1. Variations in Hydrographic Properties

The basic statistics of water quality indicators were presented in Table 1. The variable of DO ranged from 1.9 to 10.48 mg/L (6.5 ± 1.39 mg/L) in the entire area, and COD varied at 0.19–3.36 mg/L (1.16 ± 0.65 mg/L). The interaction between marine waters and river inflow was concerned in this study. Accordingly, salinity and SPM were mainly discussed. Salinity levels fluctuated widely during the study period (Figure 3). Surface salinity was higher in the dry season (e.g., February and November) than in the flood season (e.g., May and August): a range of 1.50–34.46‰ (N = 180) was observed in February (mean ± SD, 23.93 ± 9.64‰), 0.52–34.75‰ in May (19.71 ± 12.77‰), 0.60–33.68‰ in August (14.11 ± 11.28‰), and 0.90–33.44‰ in November (24.93 ± 9.86‰). Bottom salinity levels showed a relatively small difference, with mean values of 26.46‰, 25.15‰, 21.23‰, and 27.87‰ in four seasons (N = 168), respectively. Across the study site, salinity decreased from the ocean to upper estuary. Horizontally, the salinity levels in the east zone were higher than the west part. The layering efficiency (LE; LE = Δ S/S0) was a useful tool for describing the degree of water mixing. In which, Δ S indicated the salinity difference between the surface layer and the bottom layer and S0 was the vertically averaged salinity. The LE ranged at 0.0005–1.46 in this study. Most of LE values fluctuated between 0.01 and 1, suggesting a partial mixing in this case, and when the LE values larger than 1 indicated a high mixing.
The mean concentrations of SPM in February and May were 16.2 mg/L and 14.8 mg/L, respectively. Unfortunately, SPM samples in August and November were missing in this case. In-depth variation of SPM was found: 4.0–77.8 mg/L in February (15.32 ± 12.55 mg/L) and 0.8–139.1 mg/L in May (15.84 ± 23.41 mg/L). A turbid zone (TZ) with high SPM concentrations was found near the west shoal [16]. In February and May, weak marine currents not only reduced the sediment re-suspension at the bottom layer, but also favored the settlement process.

3.2. Nutrient Dynamics in the Aquatic Environment

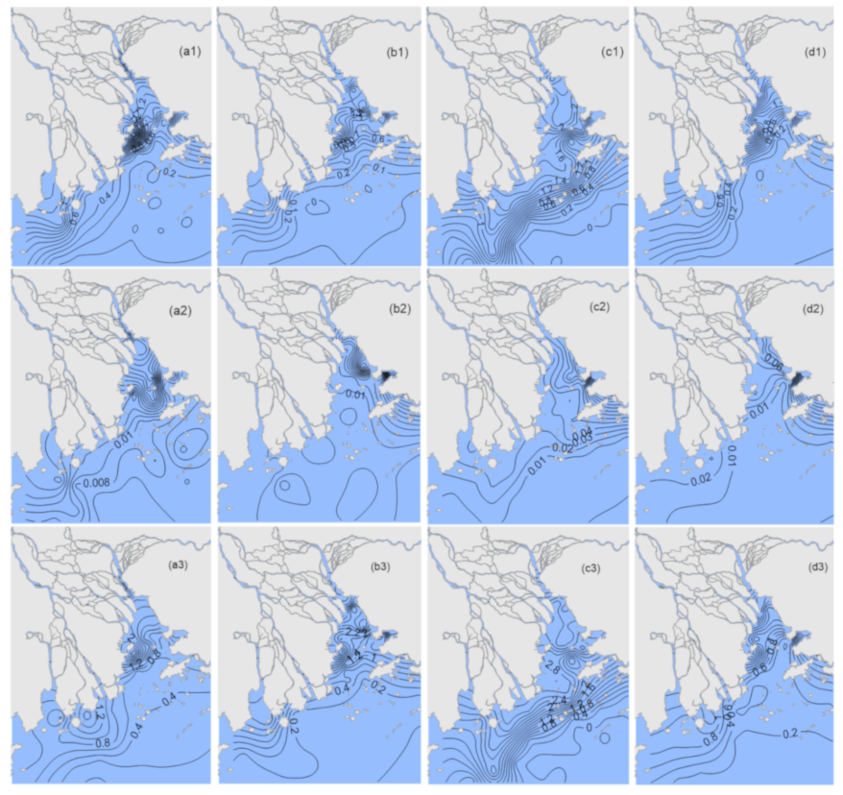
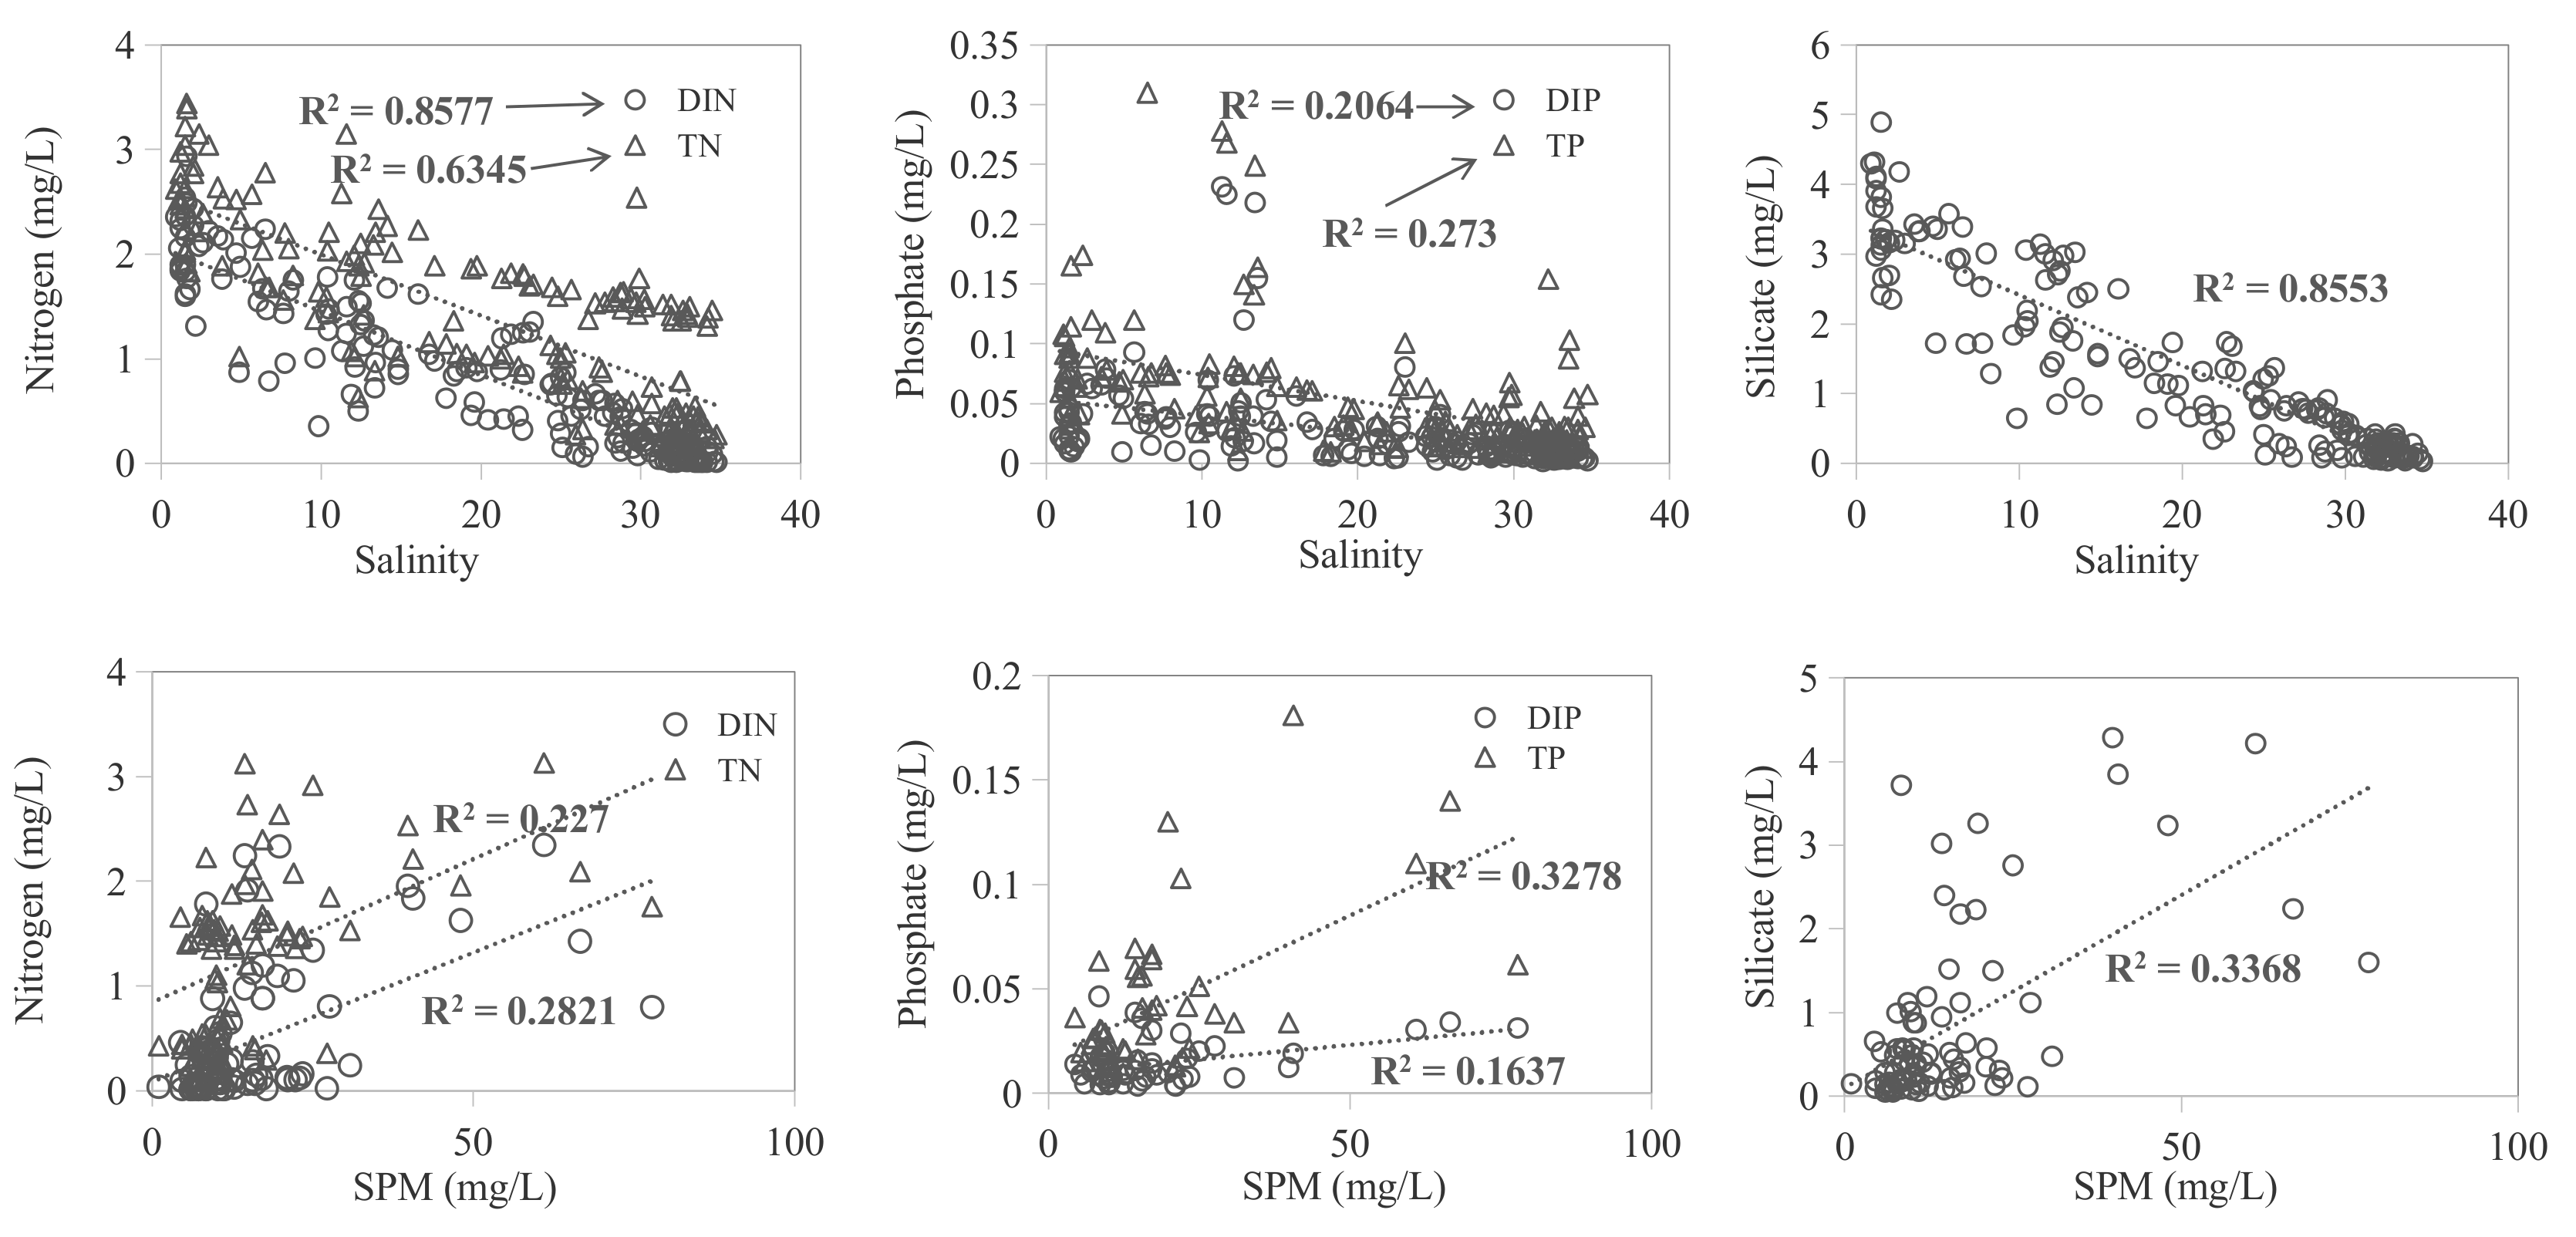
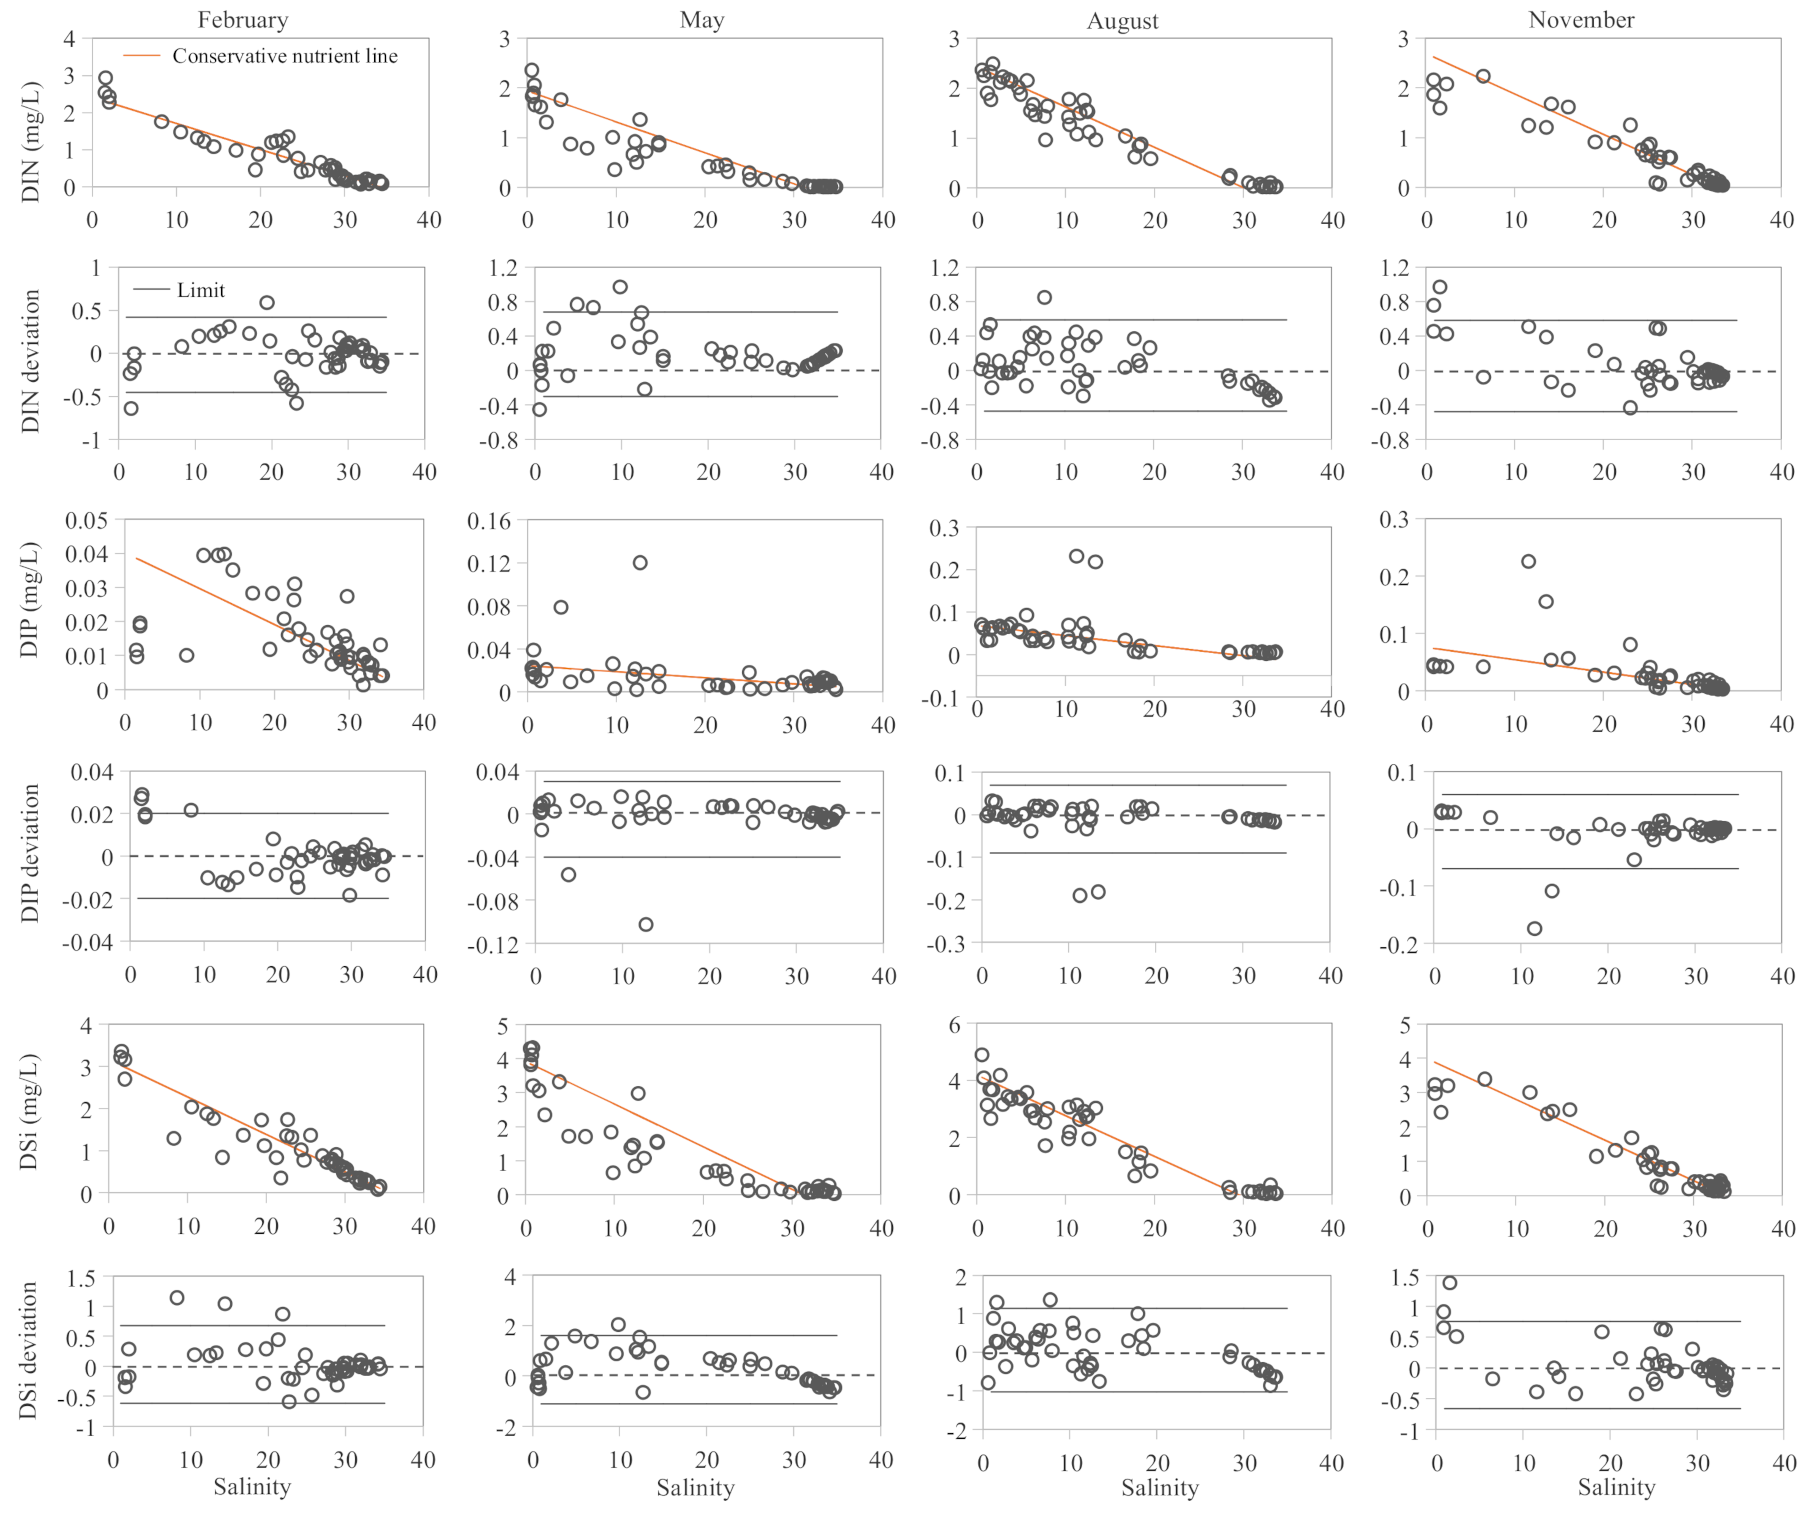
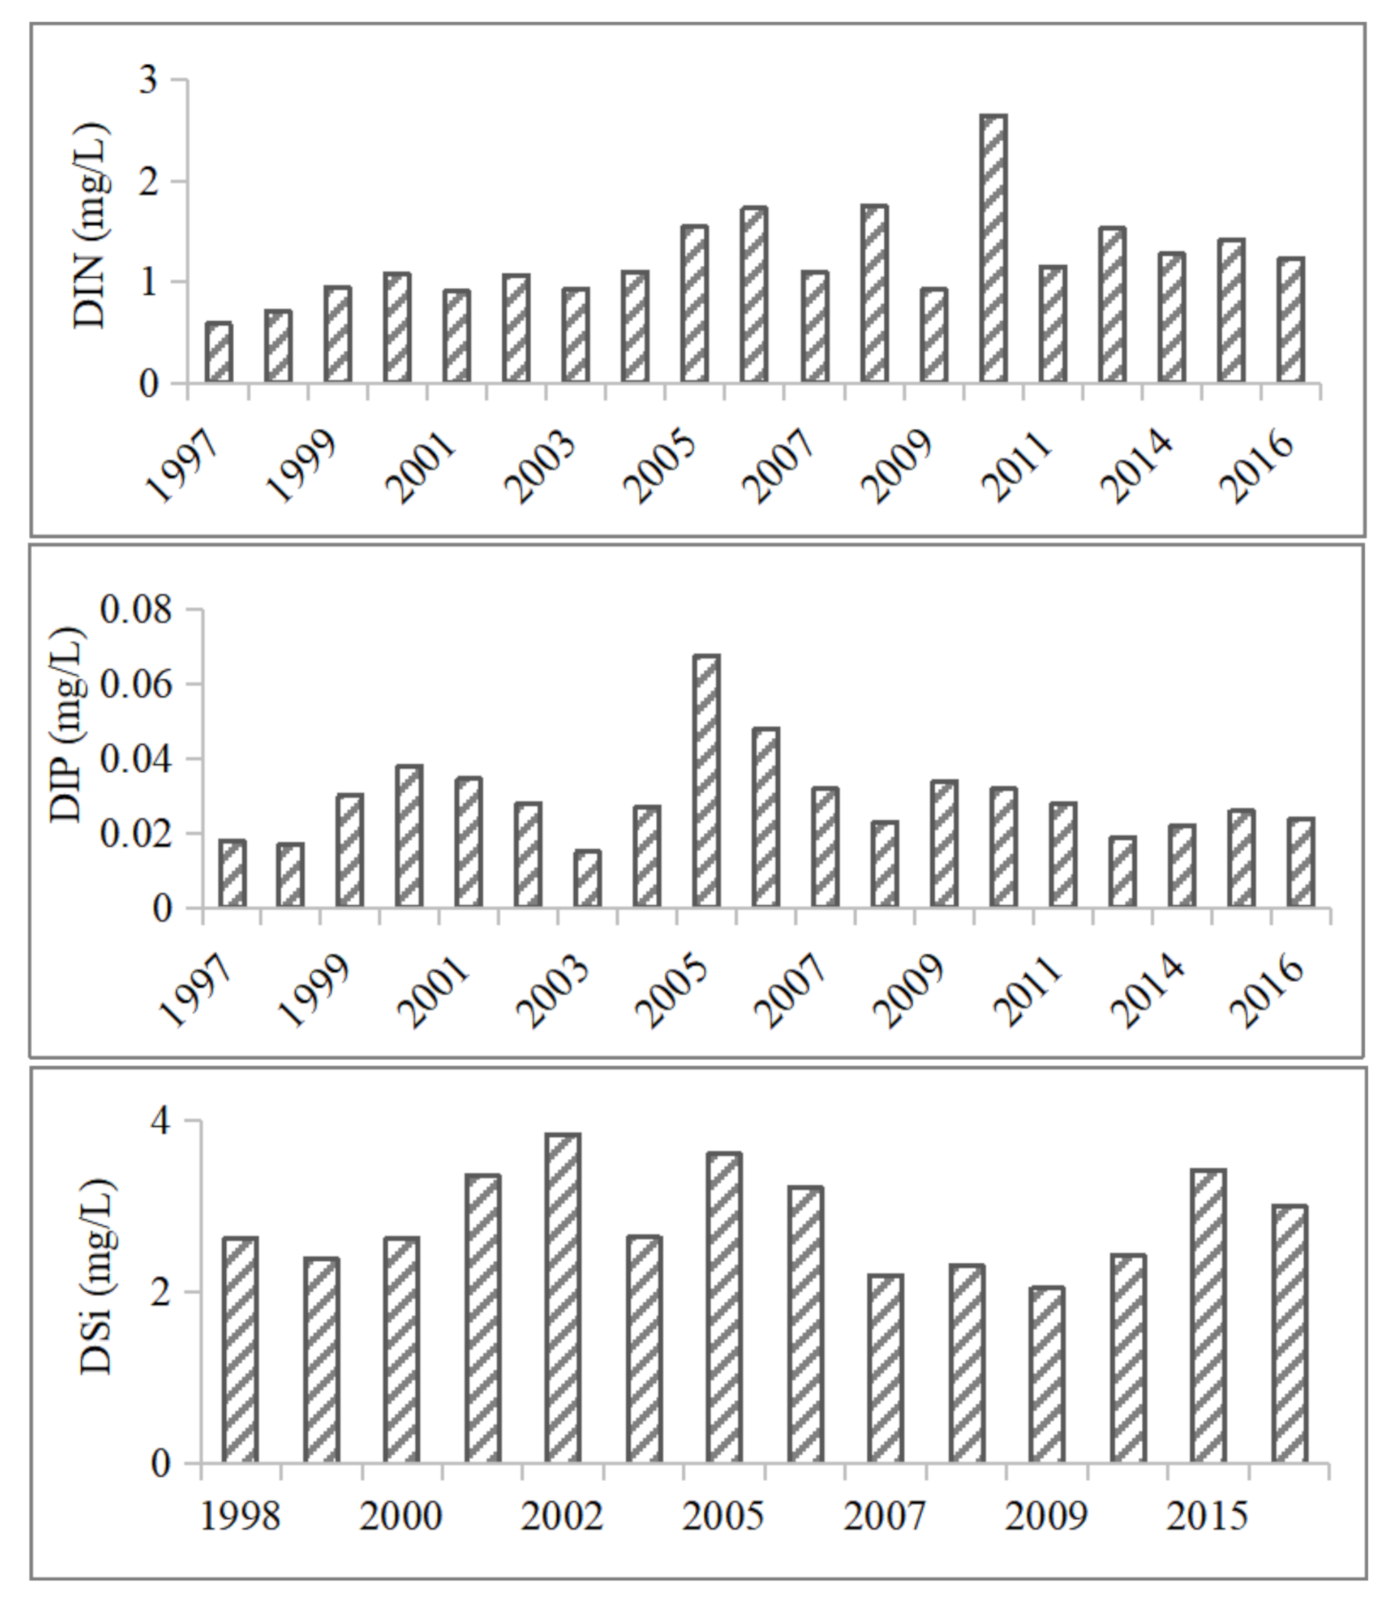
3.2.1. Nutrient Distributions

The PRE was characterized by nutrient enrichment. Dissolved nutrient concentrations such as DIN, DIP, and DSi showed significant variability, temporally and spatially. Nutrients exhibited a clear decreasing trend along the salinity gradient.
The DIN ranged from 0.012–2.938 mg/L in the entire study area (N = 345), with a mean value of 0.700 mg/L (Figure 4). Vertically, DIN concentrations decreased over the water depth: 0.012–2.938 mg/L (0.803 ± 0.763 mg/L; N = 180) for the surface waters and 0.013–2.346 mg/L (0.588 ± 0.692 mg/L; N = 165) for the bottom samples. Over the entire study site, DIN exhibited a decreasing trend from the river channel to the ocean sea; higher values were concentrated in the upper PRE, with a mean value of 1.75 mg/L; the concentrations in the west were relatively much higher. Over time, depth-averaged DIN varied from 0.075–2.635 mg/L (0.671 ± 0.667 mg/L), 0.012–2.352 mg/L (0.537 ± 0.665 mg/L), 0.030–2.337 mg/L (1.086 ± 0.769 mg/L), and 0.043–2.244 mg/L (0.568 ± 0.639 mg/L) in February, May, August, and November, respectively.
By weight, NO 3 was the predominant composition of DIN in the entire area, as discussed from previous studies [23,35], and in-depth levels ranged from 0.004–2.025 mg/L (0.554 ± 0.580 mg/L). It is believed that NO 3 originated from fertilizers which were extensively used in the Pearl River basin. Mean values of NO 3 were 0.49 mg/L, 0.44 mg/L, 0.86 mg/L, and 0.42 mg/L in February, May, August, and November, respectively, of which, NO 3 accounted for 67–84%, 57–86%, and 43–79% in the upper-, middle-, and lower-PRE, respectively.
The phosphate levels were much lower (Figure 4). The DIP ranged from 0.002–0.231 mg/L (0.024 ± 0.034 mg/L; N = 348) in the entire study area. The DIP concentrations varied from 0.001–0.231 mg/L (0.025 ± 0.034 mg/L; N = 180) for the surface samples, and 0.002–0.083 mg/L (0.018 ± 0.017 mg/L; N = 168) for the bottom waters. Mean values were 0.014 mg/L, 0.014 mg/L, 0.042 mg/L, and 0.027 mg/L in February, May, August, and November, respectively. In addition, higher DIP levels (>0.03 mg/L) were detected in the east zone, be different when compared with DIN trends. The DSi ranged from 0.039–4.905 mg/L (mean 1.219 ± 1.211 mg/L; N = 348) in the entire area (Figure 4). The surface DSi was moderately higher than the bottom, 0.031–4.89 mg/L (1.331 ± 1.273 mg/L) and 0.047–4.92 mg/L (1.019 ± 1.178 mg/L), respectively. Seasonal variation in DSi was also detected: 0.069–3.31 mg/L, 0.039–4.305 mg/L, 0.101–4.905 mg/L, and 0.12–3.555 mg/L in four seasons, respectively. Over the entire site, the level in the river channel was higher than at sea. In the upper PRE, DSi varied from 0.176–4.905 mg/L; in the middle PRE, it ranged from 0.138–3.45 mg/L; and in the lower PRE, it ranged from 0.039–3.95 mg/L.
The PRE was regarded as having severely polluted waters caused by rapid industrialization and urbanization of the last few decades, compared with levels in some other estuarine systems. The DIN levels in this area were higher than in some large estuaries in China, such as the Yangtze [36,37] and Yellow River estuaries [38]. Compared with many coastal waters worldwide, nutrient concentrations were still relatively high in the PRE, such as the Cross River [39], Caeté estuary [3], and Cochin estuary [40,41]. The DIP level in our study was higher than in the Yellow River estuary [38], and was lower than that in the Yangtze estuary [37], which received superfluous P from agricultural or urban waste water. These higher levels of nutrients have raised the urgent need to pay more attention for managing riverine input.

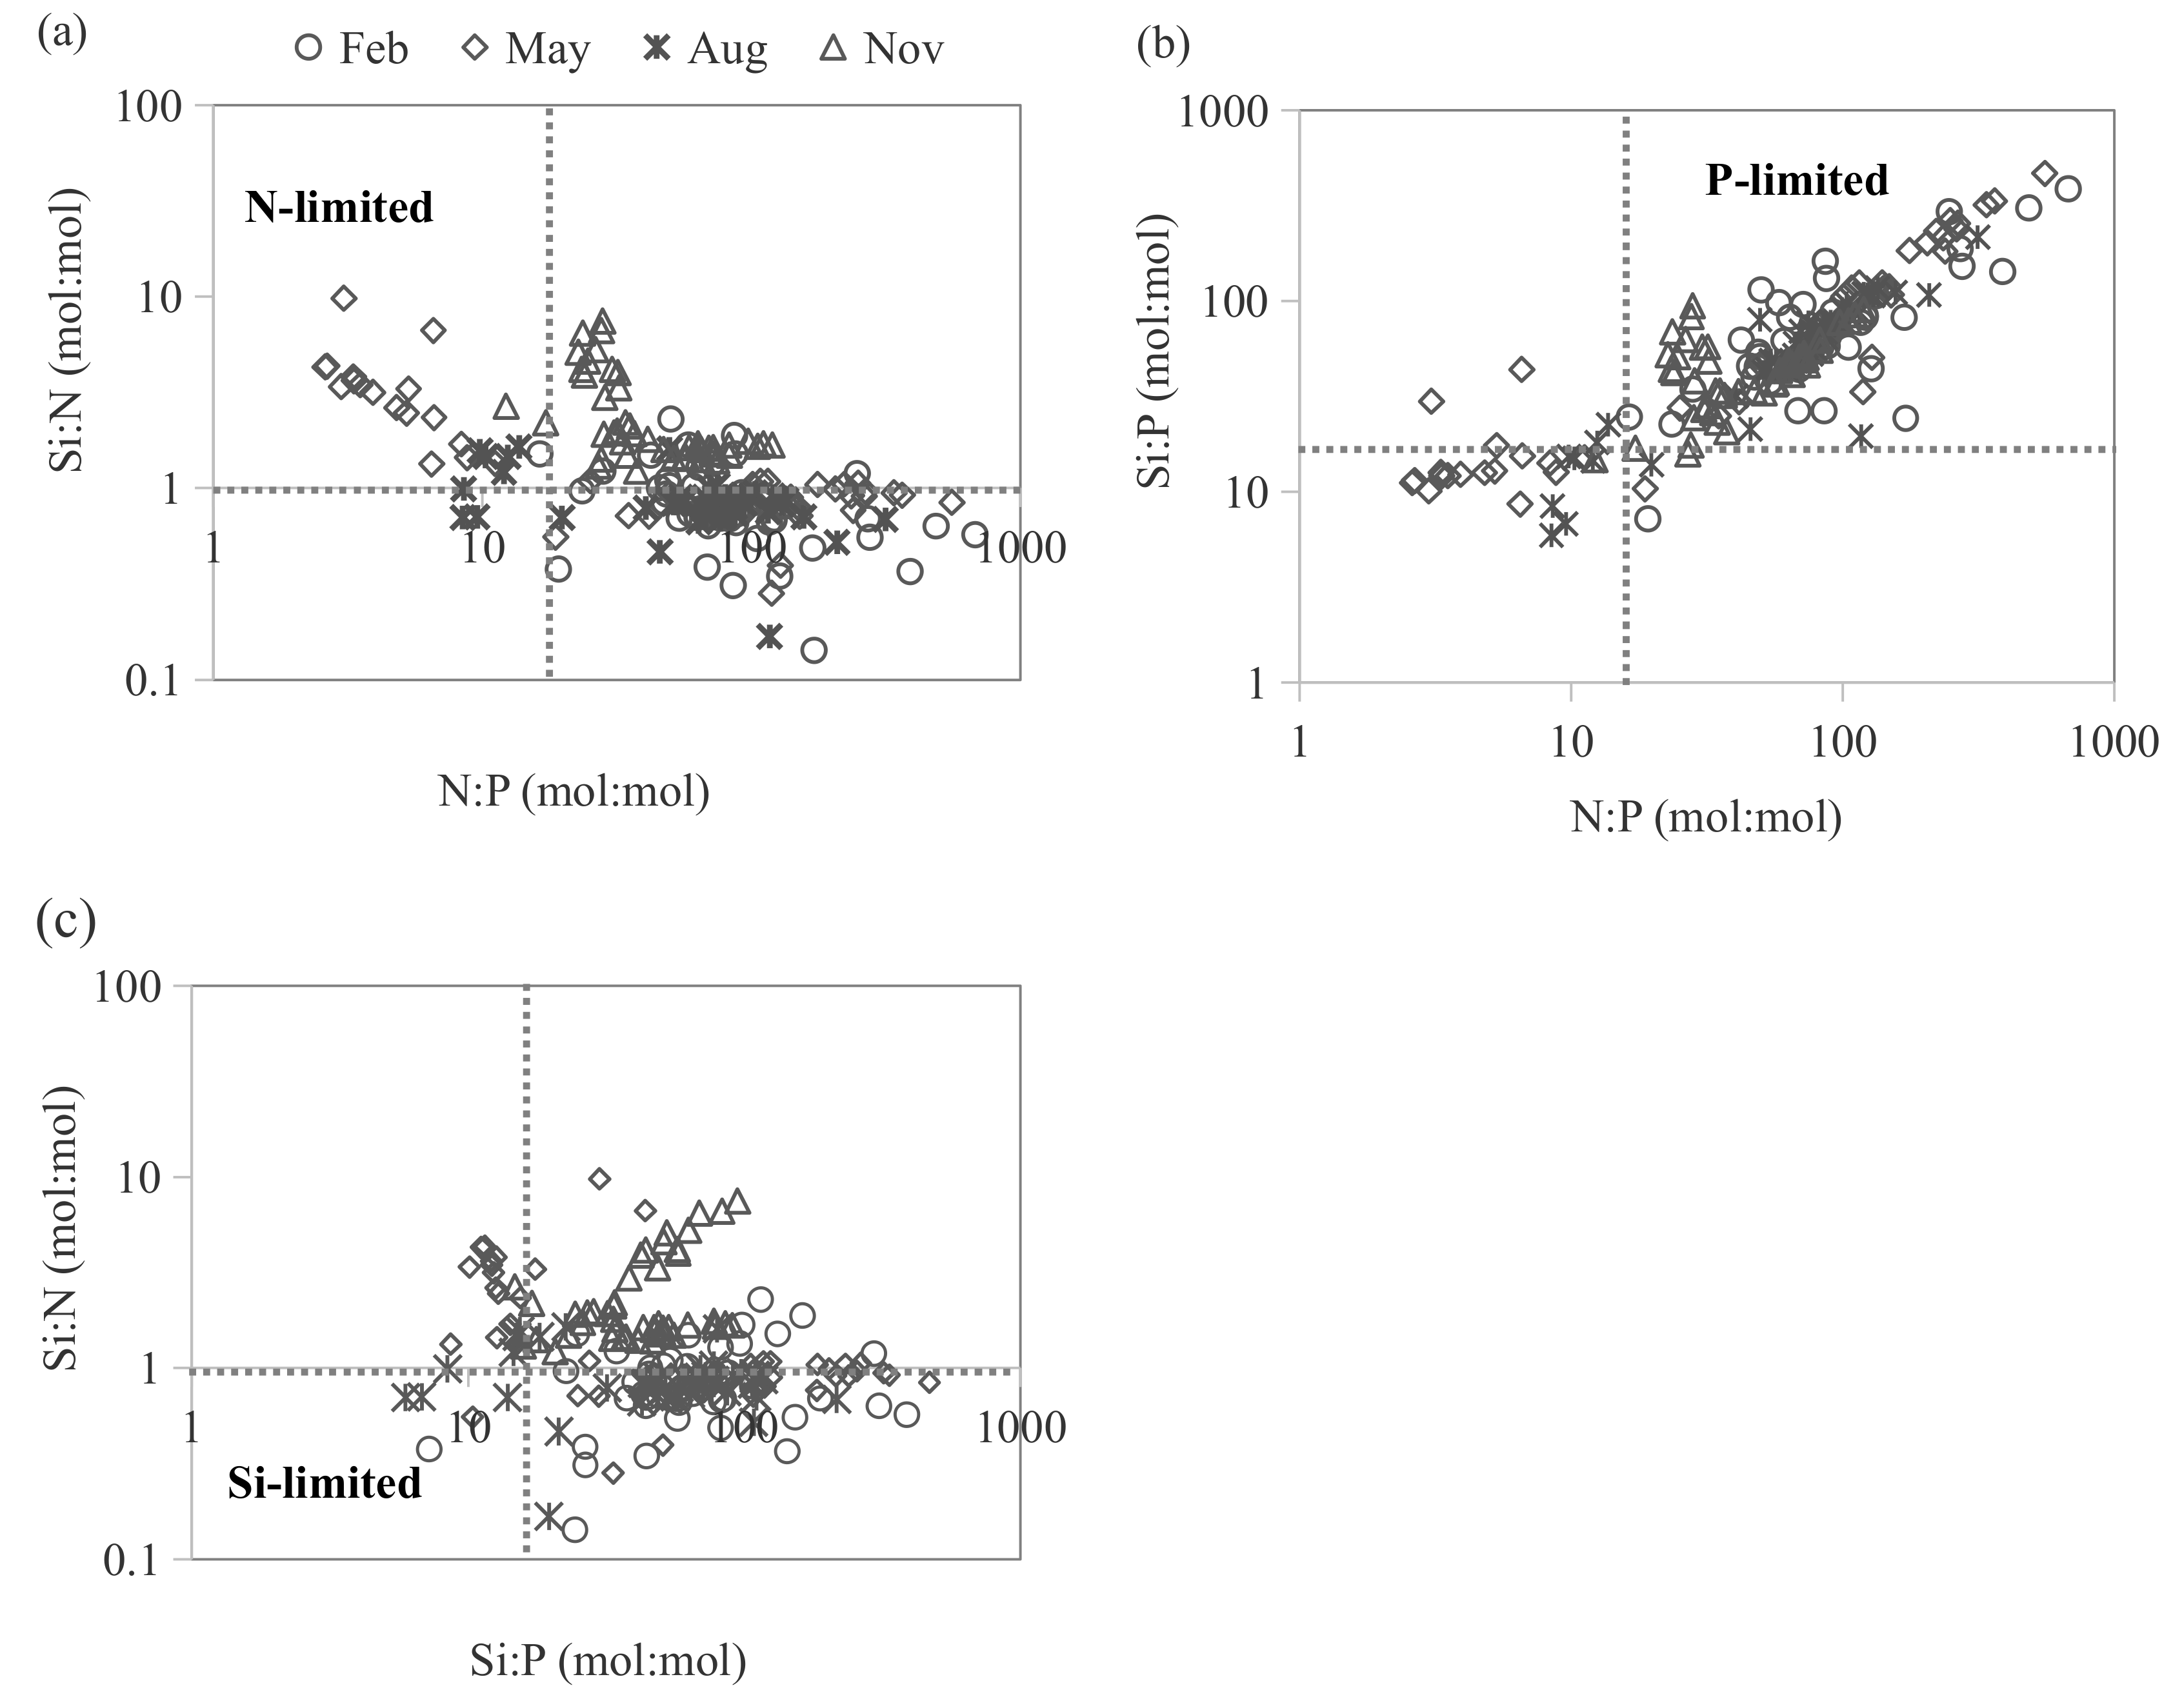
3.2.2. Nutrient Ratios (mol:mol) in the Water Column

The nutrient ratios (N:P, Si:N, and Si:P) are depicted in Figure 5. The N:P ratio was 76.33 in the entire estuary. A significant difference of N:P in February, May, August, and November was discovered, with mean ratios of 102.89, 87.97, 65.49, and 47.99, respectively (p < 0.05). Across the study site, the molar ratios decreased from the river channel to open sea. In the upper estuary, the mean ratios were 175.77, 188.50, 64.56, and 77.51 in four seasons, respectively; in the middle estuary, the corresponding ratios were 128.59, 121.94, 72.05, and 45.86; and in the lower estuary, the ratios were 68.70, 40.33, 61.92, and 41.30, accordingly.
The average Si:N ratio was 1.46 in the entire estuary. The ratios decreased significantly in upper, middle, and lower zones of this estuary: 1.82, 1.08, and 0.99, respectively. In February, the Si:N ratio ranged from 0.14–2.77 (mean 0.59); in May, it ranged from 0.28–9.79 (mean 1.96); in August, it varied from 0.17–3.83 (mean 1.14); and in November, it ranged from 0.54–7.46 (mean 1.84). The average Si:P ratio was 66.93 in the entire study area. In the upper PRE, the Si:P ratio significantly changed over time (p < 0.05): 122.57, 190.18, 57.80, and 58.38 in February, May, August, and November, respectively. In the middle- and lower PRE, the Si:P ratio decreased. The molar ratios of Si:P exhibited a similar trend as the N:P.

3.3. Biological Variable (In Terms of Chlorophyll)

The phytoplankton chlorophyll was at a relatively higher level in this estuary and averaged 3.14 μ g/L (N = 348) in 2016 in the estuary (February, 1.81 ± 1.28 μ g/L; May, 4.04 ± 3.73 μ g/L; August, 4.60 ± 3.85 μ g/L; and November, 2.74 ± 2.96 μ g/L). The in-depth chlorophyll varied from 0.31–16.34 μ g/L (mean 3.30 ± 3.29 μ g/L) in the entire estuary. One-way analysis of variance showed a significant difference among seasons and sites (p < 0.05).

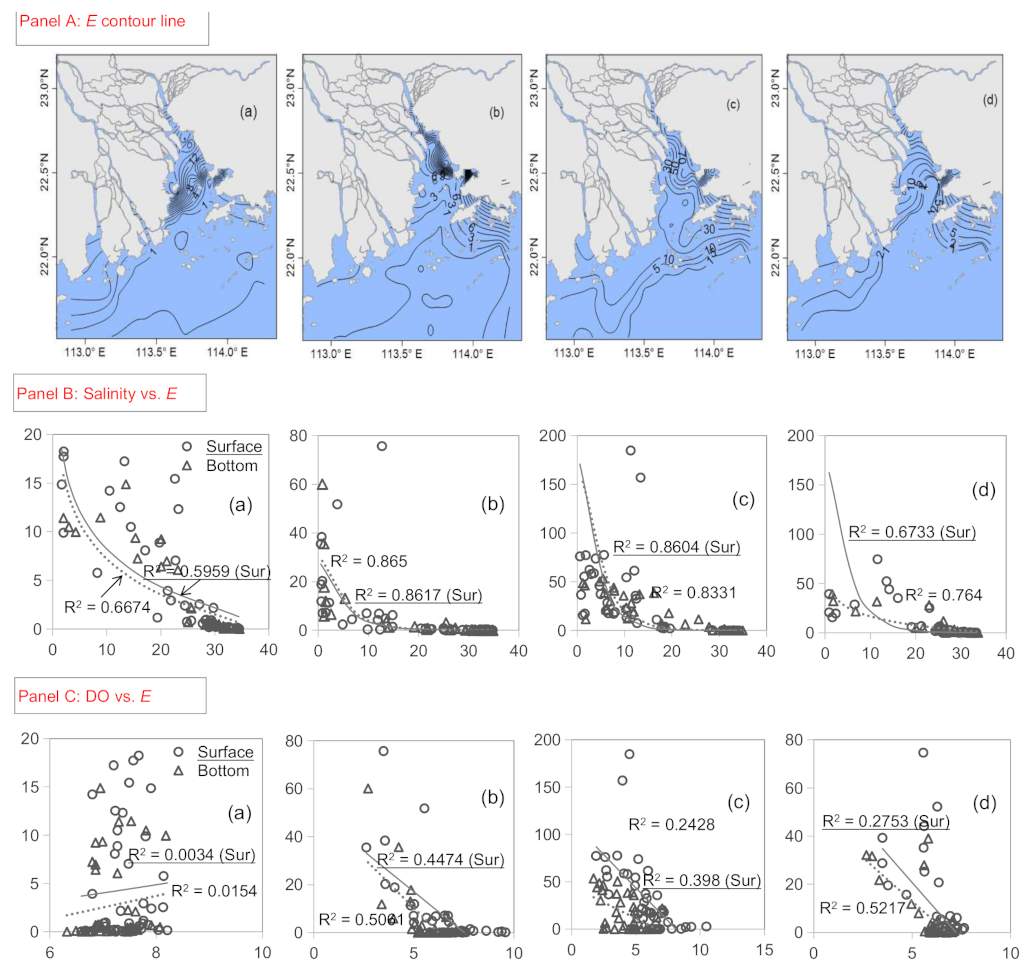
3.4. Cause–Effect Chains of Nutrient Distributions

3.4.1. Hydrological Factors

River discharge, oceanic current, and atmosphere deposition distinctly co-influenced the spatiotemporal distribution of nutrient input in estuary [21,42]. Strong interactions between sea and river reduced the residence time of dissolved nutrients in the water column, and would promote the vertical exchange, which then resulted in a change of phytoplankton distribution [43]. In the winter, the mixing of weak freshwater and strong marine current diluted the nutrient concentration; in the summer, the mixing of weak marine current and strong river flow carried more nutrients. Nutrients were thus largely controlled by the interactions of fresh-marine waters. Figure 6 plots the linkage between nutrient concentrations and hydrological parameters in the estuary.
Salinity levels in the present study were significantly negatively correlated with the concentrations of dissolved nutrients (Table 2), as discussed in other studies [4,25]. Considering the in-depth analysis, the Pearson correlations between salinity and various dissolved nutrients were significant: R = −0.65, −0.93, −0.49, −0.45, and −0.93 for NO 2 , NO 3 , NH 4 , PO 4 , and SiO 4 in the surface waters (N = 180 for each variable; p < 0.01, two-tailed); R = −0.77, −0.94, −0.50, −0.69, and −0.93 in the bottom layer (N = 157 for each variable; p < 0.01, two-tailed), respectively. Moreover, the influence of salinity on nitrogen and silicate was stronger than that on phosphorus. The salinity gradient showed a high level of mixing occurred in winter but only partial mixing occurred in summer. In the PRE, most nutrients and other pollutants originated from land-based sources and were discharged to the sea; few were carried by saltwater. High-salinity waters were generally correlated with lower nutrient concentrations caused by the mixing-diluting process, although some nutrients were desorbed from sediment particles when the marine current interacted strongly with the freshwater inflow [44].
The low-salinity waters in the upper- and middle-PRE was generally distinguished by having higher DIN concentrations. Therefore, the linear correlations showed that the variations in nutrient concentrations were strongly linked with the diluting-mixing processes. However, moderate but insignificant correlations implied that new nutrient sources were supplied along the way to open sea, such as the decomposition of organic matter in the water column, desorption from the sediments, storms, and emissions from the coastal cities. These nutrient inputs from the external sources also changed the nutrient concentrations and forms and may have influenced the phytoplankton biomass [24,26,45].
The destination of nutrients was either dissolved in the waters, or adsorbed onto the suspended sediments. The correlation coefficients between SPM and nutrients were shown as: R = 0.53 for DIN, R = 0.48 for TN, R = 0.40 for DIP, R = 0.57 for TP, and R = 0.58 for DSi (N = 84 for each pair). Over time, their correlations were shown as statistically significant for nitrogen (DIN: R = 0.79; TN: R = 0.75) and silicate (R = 0.78) in May, while the role was relatively stronger for phosphorus in February (DIP:R = 0.46; TP:R = 0.53). The influence of SPM on silicate was stronger than that on nitrogen and phosphorus because its strong adsorption capacity onto the SPM [46]. In particular, DIP was potentially absorbed onto the iron oxide and then consolidated. SPM thus played a fundamental ecological role as a result of its adsorption and desorption onto the nutrients in the estuarine ecosystems [46,47]. Generally, P adsorption capacity increased when SPM concentrations increased. In summer, strong marine–river dynamics promoted the re-suspension of sediment so that more nutrients were desorbed and then dissolved in the water column. In winter, weak runoff was accompanied with less sediment load, and then lower levels of nutrients were detected in the estuary. Generally, most of the phosphorus species derived from the riverine input were related to suspended particulate matter [26]. Desorption of phosphorus species from suspended sediment and bacterial decomposition have also increased the DIP concentrations [25]. The benthic re-suspension of interstitial water at the sediment–water interface might also have contributed considerably to the DIP concentrations.

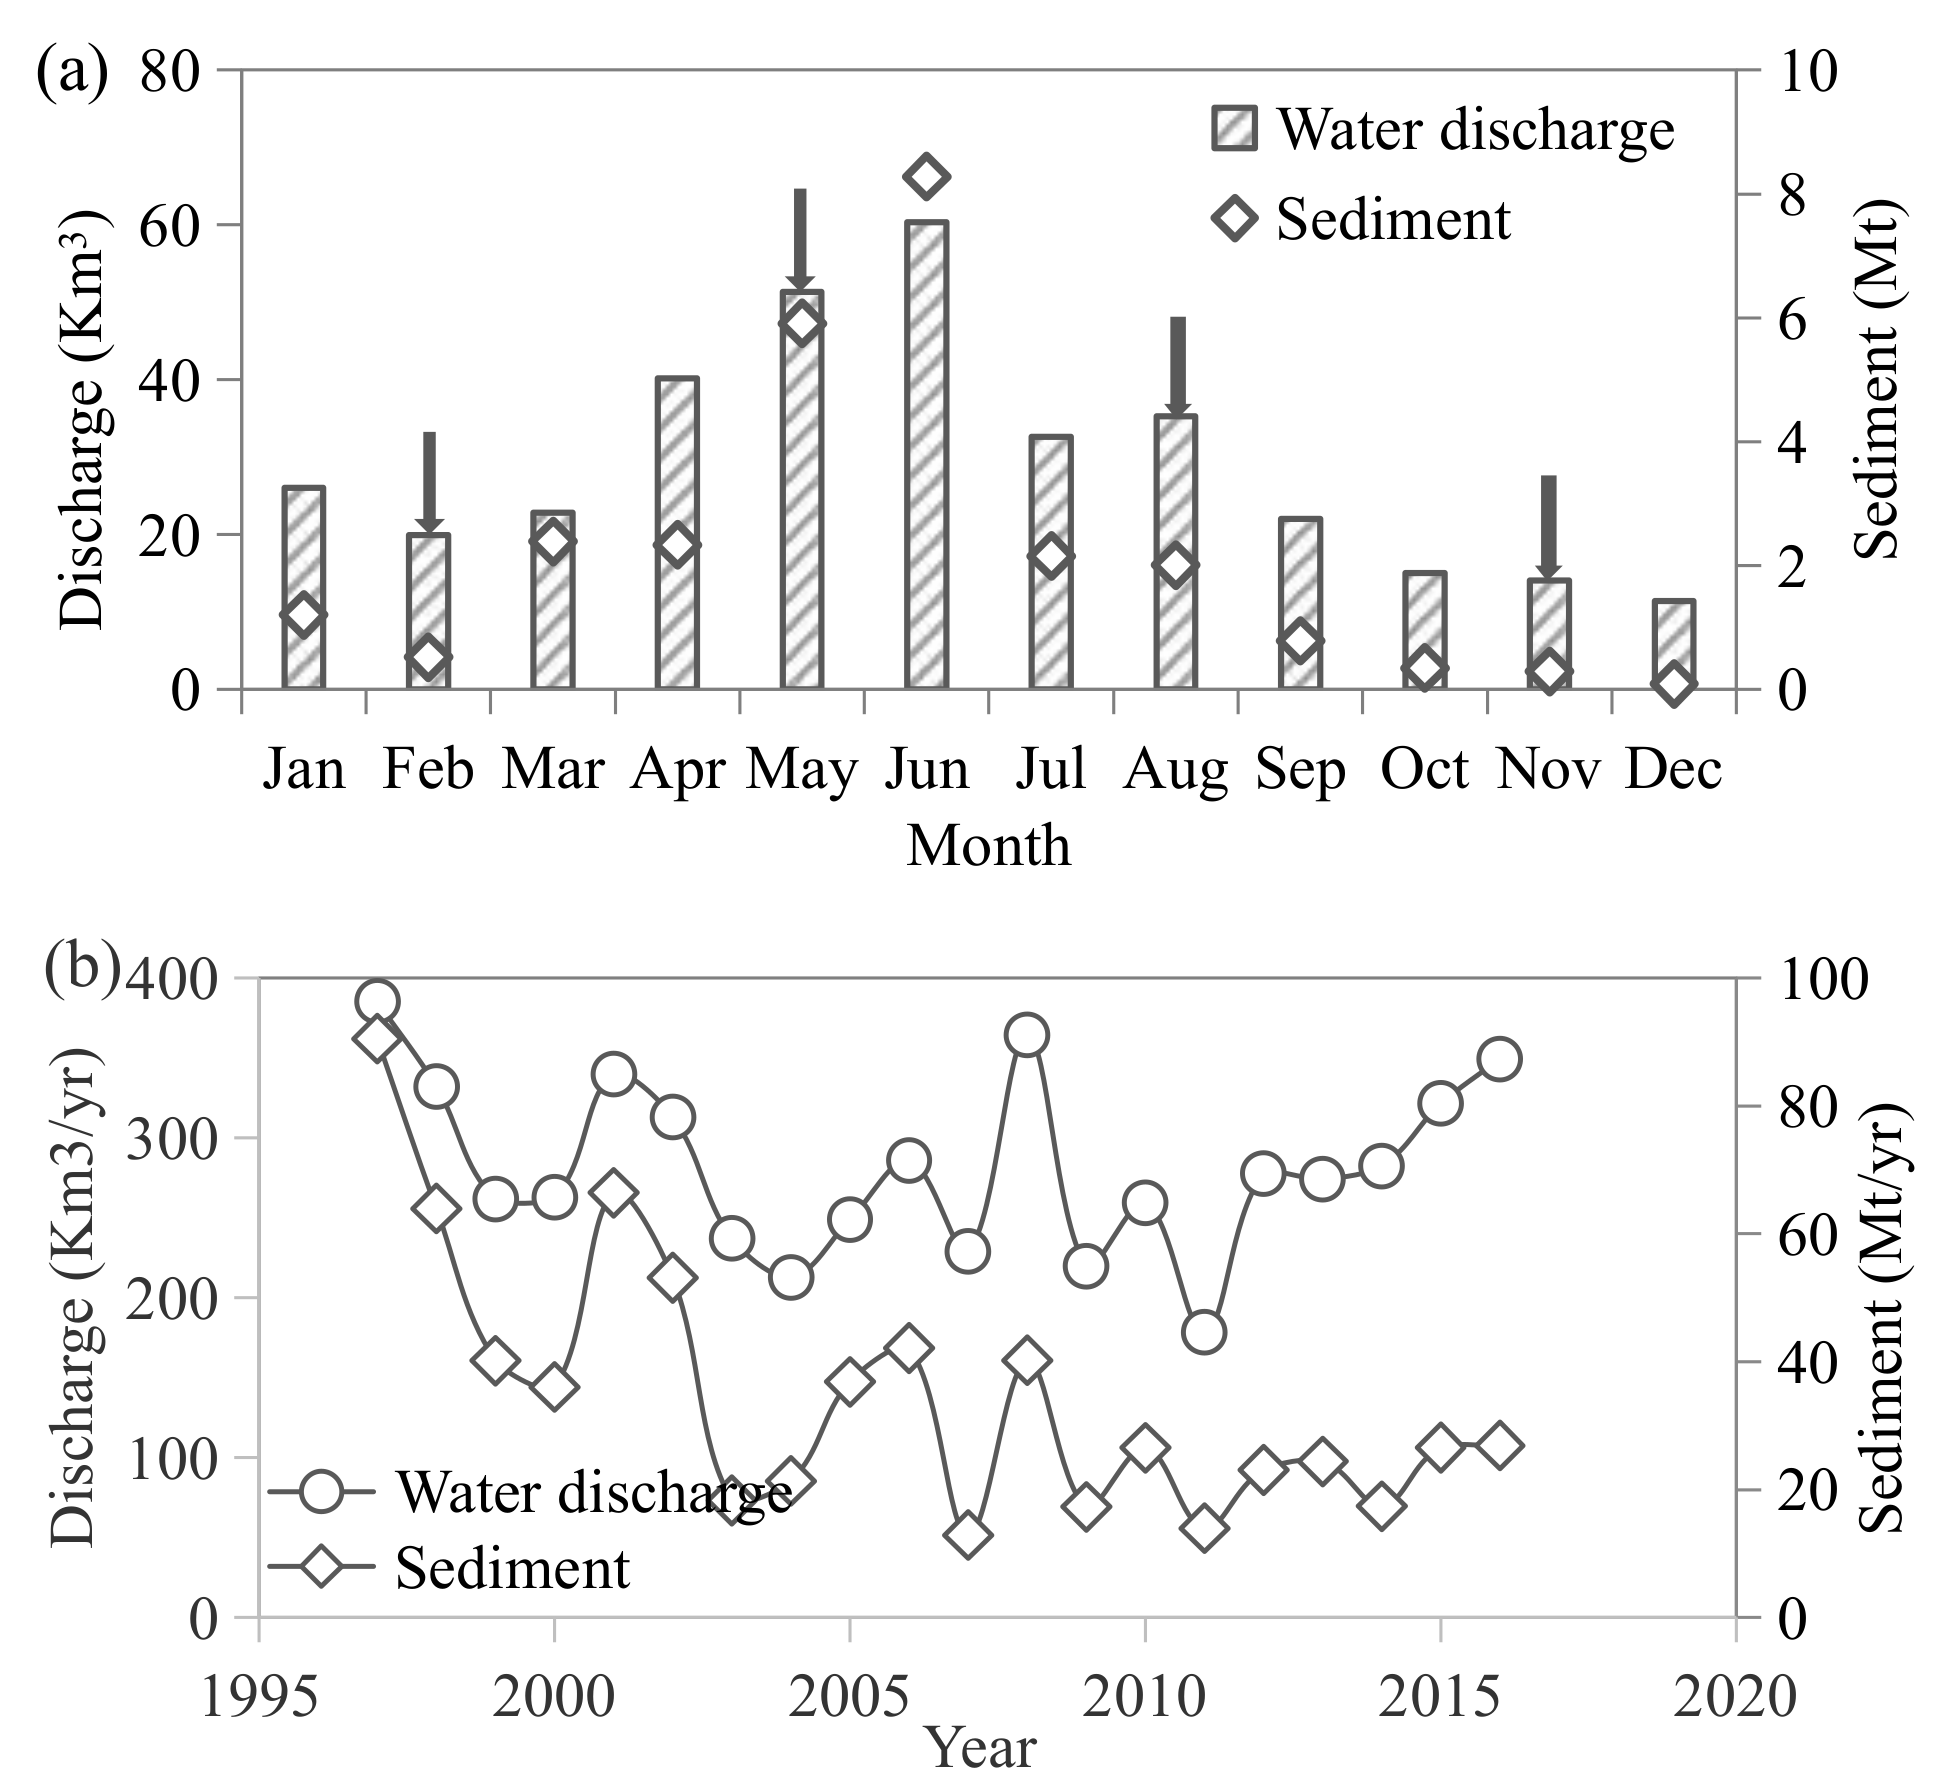
3.4.2. Effects of the Pearl River Discharge

Seasonal change in the Pearl River discharge significantly impacted both the hydrographic factors and nutrient dynamics in the PRE. Variations in nutrient dynamics were largely modulated by biological uptake processes, combined with the effects of physical mixing. The plot of nutrient deviation against salinity identified the physical mixing and other biological response (Figure 7). The details of two end-member mixing model results were provided in Supplementary Materials (Tables S1–S4). The levels of nutrient deviation also showed the degree of nutrient activities. The limit of each deviation was calculated using the 95% confidence interval ( α = 0.05), mean value ( μ ), and standard deviation ( σ ): lower limit = μ n * σ ; upper limit = μ + n * σ (n = 1.96 when α = 0.05). The deviations of nutrients beside the limit lines might indicated the extreme values. It is observed that the main activity of DIN showed removal in the estuary according to the conservative values in February, May, and August. In November, removal and production of DIN equally dominated. Among these, the DIN removal during the dry season (as in February, November) was mainly caused by the estuarine mixing with the reduction of river discharge; and during the flood season (as in May, August), they were mainly caused by the biological uptake, corresponding to the high chlorophyll levels (mean 4.2 μ g/L) and lower DO (mean 5.5 mg/L). The silicate activities have similar behaviors to nitrogen along the salinity gradient. To be different, the DIP in the dry season shown to be an addition induced by a buffer mechanism [29], particularly in the middle and lower estuary; it appeared to be a deficit in the flood season, caused by the biological uptake.
These DIN results suggested that the main N addition was intended to the land-based sources (e.g., sewage emissions from coastal cities) and internal nitrogen cycling [34] because of the weak river discharge with relatively lower amount of nutrients. The nitrogen input was mainly from river inflow. The DIN concentrations in many samples were relatively higher in the western zone of the PRE than the levels predicted from the simple effects of physical processes. Strong interactions during summer potentially decreased the residence time of dissolved nutrients, and may promote the desorption of nutrients from suspended particles. The relatively short residence time of water with extremely high nutrient concentration was thus one of the driving factors that controlled the phytoplankton variability [48,49]; the residence time was a convenient parameter representing the time scale of physical transport processes, and often used for comparison with time scales of biogeochemical processes. The phytoplankton chlorophyll level was relatively high, thus nitrogen may be also removed by the sedimentation of microorganisms [29]. However, the relationship between chlorophyll and DIN was not significant (p > 0.05). Vertical mixing was weak in the western and northern zones of the PRE where the salinity level was low and the freshwater inflow was strong (Figure 3). The net nitrogen removal efficiency was probably confined by the N regeneration from particulate organic matter [36]. For example, nitrogen species were potentially discharged into the estuarine system through different paths such as land-based runoff, effluent discharges, atmospheric deposition, and the degradation of microorganisms [36,37].
The major P species were derived from land-based sources, accounting for 99%, and the sources of atmospheric deposition and marine currents only contributed 1%; among the land-based sources, sewage discharge was the first contributor to P sources [46,50]. The DIP removal was induced by phytoplankton uptake and absorption process on sediment in May and August while phosphorus production that was detected in November was probably caused by the phosphorus replenishment (e.g., sewage discharge, atmospheric deposition). These positive and negative DIP deviations also demonstrated that the P species were mainly derived from the effluent discharge in the upper PRE, as the freshwater end-member, rather than the riverine input; in the middle estuary, they were derived from the terrestrial emissions of coastal cities such as Dongguan, Zhuhai, and Shenzhen; in the lower estuary, land-based sources from Zhuhai, HongKong, and Macao contributed much. Considering human activities (e.g., dam constructions in the upper channel), the decreased sediment load would influence the amount of P species due to their capacity of desorption/absorption to P. The DSi deviation had similar behavior to DIN along the salinity gradient. Rapid removal of DSi often occurred in the region of low salinity (<10‰) of the estuary. The input of DSi largely came from river discharge, and their removal was mostly uptake by the pelagic and benthic diatoms.
In summary, an analysis of the interplay between salinity and nutrients (R = −0.93, −0.45, and −0.92 for DIN, DIP, and DSi, respectively; p < 0.05) incorporating the marine water and river discharge provided an effective way to distinguish the sinks and sources of nutrients in the PRE. Sewage treatment plants and other nutrient inputs from the surrounding regions, especially from the large city groups of Guangzhou, Dongguan, Zhuhai, and Shenzhen were important contributors to the estuarine pollutants. Atmospheric deposition was also another important nutrient source. The removal of DIN was different from DIP and DSi, with a special mechanism involved in DIN removal in the specific estuary; DIN was less active to sediment particles but was removed by biological processes such as denitrification behavior in the estuary. Meanwhile, DIP was strongly particle active and was easily adsorbed on sediments. These factors resulted in different degrees of nutrient dynamics for different nutrients. In addition, geomorphology, water age, and other environmental factors also influenced the behaviors of estuarine nutrients. Consequently, the sinks and sources of nutrients strongly depended on specific characteristics of the estuarine systems. Therefore, individual strategies for managing the aquatic environment of the PRE are required to effectively reduce riverine inputs to sea waters.

3.4.3. Contributions to Phytoplankton Chlorophyll

The optimal Redfield atomic ratio for N:P:Si was 16:1:16, which was the stoichiometric requirement for phytoplankton growth [51].Nutrient limitation assessments have stated that the aquatic environment was P-limited in most of the PRE (Figure 5), which corresponded with other studies [26,27,28,52]. The DIN concentrations were very high; increase in nutrients in the estuary might also be induced by nitrogen regeneration and phosphorus buffer. The results showed that only phosphorus limitation predominantly appeared in the entire estuary in February and November, as a result of high DIN and DSi fluxes and low DIP fluxes; meanwhile, both P- and N-limitations were found in May and August. Additionally, N-limitation occurred occasionally in the upper and lower estuary. The potential nutrient limitations in this study may be explained from several possible reasons. First, the riverine nitrogen and silicate input to the estuary have increased relative to phosphorus. Second, P release to the Pearl River has been inhibited considerably since 2001, including a decrease in some products with elemental P (e.g., washing powder, fertilizer), which resulted in a decreased P load.
Relationships of environmental drivers shaped the response of phytoplankton. The chlorophyll in the PRE was significantly affected by the seasonality of hydrology and nutrients, which co-influenced the PRE ecosystem. The PCA-generated identification of the roles in the classified environmental drivers would help our understanding of the phytoplankton’s physical controls and resource demands (e.g., nutrient consumption). The rotated PC loading is displayed in Table 3. Figure 8 plots the first two component loading between water quality parameters and phytoplankton chlorophyll based on the data of four seasons. No meteorological data were considered in this study, which would moderately or significantly influence the nutrient distributions and phytoplankton chlorophyll [53].
The first two PCs were extracted and represented most of the variances (63.5%). Principal component 1, with an eigenvalue of 5.0, accounted for 41.8% of the variance in the data and was highly weighted by nitrogen, silicate, salinity, and COD, and PC2 was dominated by Chla, DO, and phosphorus. These PCA findings demonstrated the underlying mechanisms involved in environmental stress: the role of salinity on affecting the level of nutrients was significant; negative correlations between salinity and nutrients co-influenced phytoplankton growth; the direct role of SPM on chlorophyll was not significant; the contribution of P element on the chlorophyll was stronger than nitrogen and silicate.

3.5. Environmental Effects of Nutrient Over-Enrichment

Estuarine eutrophication has become a widespread matter of concern over the past few decades [54]. The level of eutrophication in the PRE varied from 0.004–184.71 (10.12 ± 20.60) in the entire estuary (Figure 9). Polluted waters appeared in the upper and middle sections of the PRE with the surface waters being more polluted than in the bottom. In February, 45% of the area of surface waters was classified as eutrophic, while 38%, 76%, and 49% were so classified in May, August, and November, respectively. Severe eutrophication was discovered in the upstream although the level of eutrophication decreased offshore from the mouth of the Humen outlet; the waters in the eastern PRE were more polluted (e.g., Shenzhen coast) than those in the west; the aquatic environment in the inner Lingdingyang Bay was more severe than the outer bay; the lower PRE was more insensitive to nutrient enrichment and related eutrophication. The variable causing the most serious changes was DIN during the sampling time. The waters at the mouth of the PRE had a longer residence time, and the pollutants diffused slowly during movement of the water column [47,48]; waters in the bay well mixed with the oceanic currents, so that the pollutants in this zone diffused rapidly.
The eutrophication values for the surface samples were significantly and negatively correlated with salinity levels; R = −0.77, −0.93, −0.93, and −0.82 in February, May, August, and November, respectively, with corresponding values of −0.82, −0.93, −0.91, and −0.87 in the bottom waters. These correlations demonstrated that the dilution-mixing process of marine waters strongly influenced the nutrient levels. The level of surface DO negatively contributed to eutrophication (in May, R = −0.67; in August, R = −0.63; in November, R = −0.52) excluding in February (R = 0.06); meanwhile, partial hypoxia frequently occurred in the bottom waters in summer (DO < 2 mg/L). Favorable temperatures (e.g., May, August) facilitated photosynthesis so that more oxygen was produced. Higher E values tended to the more active activities of marine organisms, the phytoplankton growth was thus promoted in the water body, and more oxygen was consumed [55]; the degradation of organic pollutants also required the consumption of DO, which would lead to decreased DO; the non-significant correlation (e.g., in Feb) indicated that the DO distribution was not only related to influences of seawater and temperature, but also related to the DO input. The oxygen levels were negatively correlated with the trends of phytoplankton chlorophyll (R = −0.88). The oxygen balance was also an indicator of the condition of the entire ecosystem.

3.6. Significance of Ecological Resources Exposed to Rapid Development of the Pearl River Delta

The rapid economic development of the Pearl River Delta has increased the discharge of sewage and many pollutants (Table 4). In this delta, an average of 4.07 × 10 8 t/year of domestic sewage, 8.21 × 10 8 t/year of industrial wastewater, and 138.43 × 10 4 t/year of total pollutants were produced during 2006–2016. Of which, the discharge of domestic sewage, industrial sewage, and total amount of pollutants changed by 9%, –18%, and 60%, respectively. Most of the domestic wastewater was discharged into the estuary (data derived from the Ministry of Ecology and Environment of the People’s Republic of China, accessible through http://www.mee.gov.cn/hjzl/shj/jagb/).
In the recent few decades, the dam constructions in the upstream have caused a decreasing trend in the sediment flux from the Pearl River into the estuary. However, the transport of DIN into the coastal waters of the PRE has significantly increased (Figure 10). The Theil-Sen slope was then calculated to determine by how much the nutrient levels had increased or decreased [4,56]. Historical nutrient levels tended to increase gradually, with slope values of 0.043, 0.001, and 0.020 for DIN, DIP, and DSi, respectively, based on Mann–Kendall test. The DIN increased significantly over the past two decades (y = 0.0581x + 0.2999, p < 0.05, R 2 = 0.56); both PO 4 (R 2 = 0.10) and DSi (R 2 = 0.04) increased non-significantly. Before 1990, the nutrient level was non-eutrophic [57]. After 1990, the nutrient concentrations were increased, and the aquatic environment in the PRE was then classified as eutrophic [4,16,20]. The DIN concentration increased by 109% from 1997 (0.589 mg/L) to 2016 (1.23 mg/L). The mean DIN, DIP, and DSi concentrations over the past two decades were 1.25 mg/L, 0.030 mg/L, and 2.83 mg/L, respectively. In contrast to nitrogen, DSi showed a gradually increasing trend until 2002 and then decreased. The decrease in DSi was attributed to human activity, such as the construction of dams in the upstream channel.
The rapid development of industrialization and urbanization in this region has resulted increased levels of the nitrogen species in estuary as a consequence of population growth. There were several possible reasons to explain the above findings. First, the upstream zone at Humen, Jiaomen, Hongqimen, and Hengmen received nutrients and other pollutants from the major economic zones of Guangzhou, Dongguan, and Foshan, which has a maximum contribution to the upper PRE. These cities alone have a population approximately equal to the region of greater Shanghai or about 30 million people (data derived from the Ministry of Natural Resources of the People’s Republic of China, accessible through http://www.mnr.gov.cn/sj/tjgb/). Second, the pollutants released from Shenzhen, Zhuhai, and Zhongshan contributed greatly to the concentration of pollutants in the middle PRE. Thirdly, pollutants from Hong Kong, Zhuhai, and Macao, were the main contributors to the pollutants in the lower PRE.
Additionally, the common pollutant-related issues in the water bodies of the PRE were high microorganism populations along with increases in organic matter, eutrophication, and oil in the water (Guangdong Provincial Marine Environmental Quality Bulletin, web-link through http://gdee.gd.gov.cn/hjzkgb/content/post_2466217.html). Many pollutants (e.g., phosphorus species) were easily absorbed onto the particles and so accumulated in sediments. The water environmental quality of the PRE in 2016 was detected as eutrophic, which promoted the growth of phytoplankton, triggered bloom events (N = 13); red tide algae, caused by Akashiwo sanguinea and Noctiluca scintillans, threatened the fishing resources and estuarine environment. Moreover, the cumulative bloomed area was 944.31 km 2 in 2016. In the whole PRE ecosystem, insufficient information was investigated on biological responses to changes in riverine nutrients, future efforts in water quality monitoring would therefore focus not only on anthropogenic nutrient loading and phytoplankton community, but also other important indicators such as zooplankton community and fish resources.

4. Conclusions

The Pearl River estuary (PRE) was affluent in riverine nutrients and was specialized by a strong interplay between marine water and river inflow. The seasonality of nutrient dynamics was significant (p < 0.05). Correspondingly, the levels of dissolved nutrients were relatively higher in the flood season than those in the dry season. Increased fluvial discharge distinctly influenced concentrations of nutrients and phytoplankton chlorophyll. Insufficient phosphorus was predominantly discovered in most of the PRE and resulted from the increases of DIN and DSi fluxes. Observed nutrient concentrations deviated from the predicted values induced by the physical mixing, suggesting that both biological uptake and production of nutrients co-occurred in this estuary. Moreover, riverine input was responsible for the aquatic environment in the upper PRE, and the nutrients and other pollutants released from the larger coastal cities of Shenzhen, Zhuhai, Hongkong, and Macao were the major contributors to the nutrient status in the middle and lower PRE. Consequently, the sinks and sources of nutrients were largely controlled by their specific biogeochemical characteristics of the estuarine systems. This field investigation helps us better understand the estuarine environment and determine how nutrient production and consumption are involved with riverine input, salinity gradients, and biological uptake.

Supplementary Materials

The following are available at https://0-www-mdpi-com.brum.beds.ac.uk/2073-4441/12/11/3245/s1, Table S1: Two end-member model results of nutrients in February in the Pearl River estuary, Table S2: Two end-member model results of nutrients in May in the Pearl River estuary, Table S3: Two end-member model results of nutrients in August in the Pearl River estuary, Table S4: Two end-member model results of nutrients in November in the Pearl River estuary.

Author Contributions

Conceptualization and draft preparation, L.N.; software, writing—review and editing, P.v.G.; writing and validation, X.L.; methodology and formal analysis, H.C.; investigation and data curation, T.Z.; project administration, Q.Y. All authors have read and agreed to the published version of the manuscript.

Funding

This study was financially supported by the National Key Research and Development Program of China (grant number 2016YFC0402601), National Natural Science Foundation of China (grant number 51709289, 51909290), Fundamental Research Funds for the Central Universities (grant number 19lgpy88), and Guangzhou Science and Technology Innovation Development Project (grant number 201904010430).

Acknowledgments

The authors deeply appreciate the crew of South China Sea Environmental Monitoring Center of State Oceanic Administration (China) for carrying out the cruise surveys. The anonymous reviewers and the Editors are acknowledged for their comments and suggestions, which will greatly improve the manuscript. The authors would like to thank LetPub (https://www.letpub.com.cn/) for providing linguistic assistance during the preparation of this manuscript.

Conflicts of Interest

The authors declare no conflict of interest.

References

  1. López Abbate, M.; Molinero, J.; Guinder, V.; Perillo, G.; Freije, R.; Sommer, U.; Spetter, C.; Marcovecchio, J. Time-varying environmental control of phytoplankton in a changing estuarine system. Sci. Total Environ. 2017, 609, 1390–1400. [Google Scholar] [CrossRef] [PubMed]
  2. Chen, Y.; Cheng, W.; Zhang, H.; Qiao, J.; Liu, J.; Shi, Z.; Gong, W. Evaluation of the total maximum allocated load of dissolved inorganic nitrogen using a watershed coastal ocean coupled model. Sci. Total Environ. 2019, 673, 734–749. [Google Scholar] [CrossRef] [PubMed]
  3. Monteiro, M.C.; Jiménez, J.A.; Pereira, L.C.C. Natural and human controls of water quality of an Amazon estuary (Caeté-PA, Brazil). Ocean Coast. Manag. 2016, 124, 42–52. [Google Scholar] [CrossRef] [Green Version]
  4. Niu, L.; Luo, X.; Hu, S.; Liu, F.; Cai, H.; Ren, L.; Ou, S.; Zeng, D.; Yang, Q. Impact of anthropogenic forcing on the environmental controls of phytoplankton dynamics between 1974 and 2017 in the Pearl River estuary, China. Ecol. Indic. 2020, 116, 106484. [Google Scholar] [CrossRef]
  5. Yang, W.; Sun, T.; Yang, Z. Effect of activities associated with coastal reclamation on the macrobenthos community in coastal wetlands of the Yellow River Delta, China: A literature review and systematic assessment. Ocean Coast. Manag. 2016, 129, 1–9. [Google Scholar] [CrossRef] [Green Version]
  6. Liu, B.; Swart, H. Impact of river discharge on phytoplankton bloom dynamics in eutrophic estuaries: A model study. J. Mar. Syst. 2015, 152, 64–74. [Google Scholar] [CrossRef]
  7. Frame, E.R.; Lessard, E.J. Does the Columbia River plume influence phytoplankton community structure along the Washington and Oregoncoasts? J. Geophys. Res. 2009, 114, C00B09. [Google Scholar]
  8. Liu, Q.; Liang, Y.; Cai, W.; Wang, K.; Wang, J.; Yin, K. Changing riverine organic C:N ratios along the Pearl River: Implications for estuarine and coastal carbon cycles. Sci. Total Environ. 2020, 709, 136052. [Google Scholar] [CrossRef]
  9. Machado, D.A.; Marti, C.L.; Imberger, J. Influence of microscale turbulence on the phytoplankton of a temperate coastal embayment. Estuar. Coast. Shelf Sci. 2014, 145, 80–95. [Google Scholar] [CrossRef]
  10. Marmin, S.; Lesueur, P.; Dauvin, J.C.; Samson, S.; Tournier, P.; Lavanne, A.G.; Brunaud, C.D.; Thouroude, C. An experimental study on dredge spoil of estuarine sediments in the bay of seine (France): A morphosedimentary assessment. Cont. Shelf Res. 2016, 116, 89–102. [Google Scholar] [CrossRef]
  11. Vidal, J.; Rigosi, A.; Hoyer, A.; Escot, C.; Rueda, F.J. Spatial distribution of phytoplankton cells in small elongated lakes subject to weak diurnal wind forcing. Aquat. Sci. 2014, 76, 83–99. [Google Scholar] [CrossRef]
  12. Jin, Y.; Yang, W.; Sun, T.; Yang, Z.; Li, M. Effects of seashore reclamation activities on the health of wetland ecosystems: A case study in the Yellow River Delta, China. Ocean Coast. Manag. 2016, 123, 44–52. [Google Scholar] [CrossRef] [Green Version]
  13. Kim, T.; Lee, K.; Duce, R.; Liss, P. Impact of atmospheric nitrogen deposition on phytoplankton productivity in the South China Sea. Geophys. Res. Lett. 2014, 41, 3156–3162. [Google Scholar] [CrossRef]
  14. Cao, Z.; Dai, M.; Zheng, N.; Wang, D.; Li, Q.; Zhai, W.; Meng, F.; Gan, J. Dynamics of the carbonate system in a large continental shelf system under the influence of both a river plume and coastal upwelling. J. Geophys. Res. 2011, 116, G02010. [Google Scholar] [CrossRef] [Green Version]
  15. Farrow, C.R.; Ackerman, J.D.; Smith, R.E.H.; Snider, D. Riverine transport and nutrient inputs affect phytoplankton communities in a coastal embayment. Freshw. Biol. 2019, 65, 289–303. [Google Scholar] [CrossRef]
  16. Tao, W.; Niu, L.; Liu, F.; Cai, H.; Ou, S.; Zeng, D.; Lou, Q.; Yang, Q. Influence of river-tide dynamics on phytoplankton variability and their ecological implications in two Chinese tropical estuaries. Ecol. Indic. 2020, 115, 106458. [Google Scholar] [CrossRef]
  17. Statham, P.J. Nutrients in estuaries—An overview and the potential impacts of climate change. Sci. Total Environ. 2011, 434, 213–227. [Google Scholar] [CrossRef] [PubMed]
  18. Lie, A.A.Y.; Wong, C.K.; Lam, J.Y.C.; Liu, J.H.; Yung, Y.K. Changes in the nutrient ratios and phytoplankton community after declines in nutrient concentrations in a semi-enclosed bay in Hong Kong. Mar. Environ. Res. 2011, 71, 178–188. [Google Scholar] [CrossRef]
  19. Wu, M.; Wang, Y.; Wang, Y.; Yin, J.; Dong, J.; Jiang, Z.; Sun, F. Scenarios of nutrient alterations and responses of phytoplankton in a changing Daya Bay, South China Sea. J. Mar. Syst. 2017, 165, 1–12. [Google Scholar] [CrossRef]
  20. Zhang, H.; Li, S. Effects of physical and biochemical processes on the dissolved oxygen budget for the Pearl River estuary during summer. J. Mar. Syst. 2010, 79, 65–88. [Google Scholar] [CrossRef]
  21. Lu, F.; Ni, H.; Liu, F.; Zeng, E.Y. Occurrence of nutrients in riverine runoff of the Pearl River Delta, South China. J. Hydrol. 2009, 376, 107–115. [Google Scholar] [CrossRef]
  22. Dai, M.; Zhai, W.; Cai, W.; Callahan, J.; Huang, B.; Shang, S.; Huang, T.; Li, X.; Lu, Z.; Chen, W.; et al. Effects of an estuarine plume-associated bloom on the carbonate system in the lower reaches of the Pearl River estuary and the coastal zone of the northern South China Sea. Cont. Shelf Res. 2008, 28, 1416–1423. [Google Scholar] [CrossRef]
  23. Zhang, L.; Shi, Z.; Zhang, J.; Jiang, Z.; Huang, L.; Huang, X. Characteristics of nutrients and phytoplankton productivity in Guangdong coastal regions, South China. Mar. Pollut. Bull. 2016, 113, 572–578. [Google Scholar] [CrossRef] [PubMed]
  24. Lu, Z.; Gan, J. Controls of seasonal variability of phytoplankton blooms in the Pearl River Estuary. Deep-Sea Res. Pt. II 2015, 117, 86–96. [Google Scholar] [CrossRef]
  25. Shi, Z.; Xu, J.; Huang, X.; Zhang, X.; Jiang, Z.; Ye, F.; Liang, X. Relationship between nutrients and plankton biomass in the turbidity maximum zone of the Pearl River estuary. J. Environ. Sci.-China 2017, 57, 72–84. (In Chinese) [Google Scholar] [CrossRef] [PubMed]
  26. Li, R.; Xu, J.; Li, X.; Shi, Z.; Harrison, P. Spatiotemporal variability in phosphorus species in the Pearl River estuary: Influence of the river discharge. Sci. Rep. 2017, 7, 13649. [Google Scholar] [CrossRef] [Green Version]
  27. Zhang, X.; Shi, Z.; Liu, Q.; Ye, F.; Tian, L.; Huang, X. Spatial and temporal variations of picoplankton in three contrasting periods in the Pearl River estuary, South China. Cont. Shelf Res. 2013, 56, 1–12. [Google Scholar] [CrossRef]
  28. Gan, J.; Lu, Z.; Cheung, A.; Dai, M.; Liang, L.; Harrison, P.J.; Zhao, X. Assessing ecosystem response to phosphorus and nitrogen limitation in the Pearl River plume using the Regional Ocean Modelling system (ROMS). J. Geophys. Res. Ocean. 2014, 119, 8858–8877. [Google Scholar] [CrossRef]
  29. Han, A.; Dai, M.; Kao, S.; Gan, J.; Li, Q.; Wang, L.; Zhai, W.; Wang, L. Nutrient dynamics and biological consumption in a large continental shelf system under the influence of both a river plume and coastal upwelling. Limnol. Oceanogr. 2012, 57, 486–502. [Google Scholar] [CrossRef] [Green Version]
  30. Lu, Z.; Gan, J.; Dai, M.; Zhao, X.; Hui, C.R. Nutrient transport and dynamics in the South China Sea: A modeling study. Prog. Oceanogr. 2020, 183, 102308. [Google Scholar] [CrossRef]
  31. Zhao, H. Evolution of the Pearl River Estuary; China Ocean Press: Beijing, China, 1990; pp. 1–357. (In Chinese) [Google Scholar]
  32. Niu, L.; Van Gelder, P.H.A.J.M.; Changkuan, Z.; Guan, Y.; Vrijling, J.K. Statistical analysis of phytoplankton biomass in coastal waters: Case study of the Wadden Sea near Lauwersoog (The Netherlands) from 2000 through 2009. Ecol. Inform. 2015, 30, 12–19. [Google Scholar] [CrossRef]
  33. Praus, P. Principal component weighted index for wastewater quality monitoring. Water 2019, 11, 2376. [Google Scholar] [CrossRef] [Green Version]
  34. Wu, M.; Hong, Y.; Yin, J.; Dong, J.; Wang, Y. Evolution of the sink and source of dissolved inorganic nitrogen with salinity as a tracer during summer in the Pearl River Estuary. Sci. Rep. 2016, 6, 36638. [Google Scholar] [CrossRef] [PubMed] [Green Version]
  35. Huang, X.; Huang, L.; Yue, W. The characteristics of nutrients and eutrophication in the Pearl River estuary, South China. Mar. Pollut. Bull. 2003, 47, 30–36. [Google Scholar] [CrossRef]
  36. Gao, L.; Li, D.; Zhang, Y. Nutrients and particulate organic matter discharged by the Changjiang (Yangtze River): Seasonal variations and temporal trends. J. Geophys. Res. 2012, 117, G04001. [Google Scholar] [CrossRef] [Green Version]
  37. Chai, C.; Yu, Z.; Shen, Z.; Song, X.; Cao, X.; Yao, Y. Nutrient characteristics in the Yangtze River Estuary and the adjacent East China Sea before and after impoundment of the Three Gorges Dam. Sci. Total Environ. 2009, 407, 4687–4695. [Google Scholar] [CrossRef]
  38. Zhang, J.; Liu, S.; Zhang, Q.; Liu, Y. Nutrient Distribution and Eutrophication Assessment for the Adjacent Waters of the Yellow River Estuary. Mar. Sci. Bull. 2008, 27, 65–72. (In Chinese) [Google Scholar]
  39. Dan, S.F.; Liu, S.; Udoh, E.C.; Ding, S. Nutrient biogeochemistry in the Cross River estuary system and adjacent Gulf of Guinea, South East Nigeria (West Africa). Cont. Shelf Res. 2019, 179, 1–17. [Google Scholar] [CrossRef]
  40. Vipindas, P.V.; Anas, A.; Jayalakshmy, K.V.; Lallu, K.R.; Benny, P.Y.; Shanta, N. Impact of seasonal changes in nutrient loading on distribution and activity of nitrifiers in a tropical estuary. Cont. Shelf Res. 2018, 154, 37–45. [Google Scholar] [CrossRef]
  41. Jabir, T.; Vipindas, P.V.; Yousuf, J.; Prabhakaran, M.P.; Sudheesh, V.; Arvund, S.; Mohamed, H.A. Nutrient stoichiometry (N:P) controls nitrogen fixation and distribution of diazotrophs in a tropical eutrophic estuary. Mar. Pollut. Bull. 2020, 151, 1–9. [Google Scholar] [CrossRef]
  42. Lin, Y.; Su, J.; Hu, C.; Zhang, M.; Li, Y.; Guan, W.; Chen, J. N and P in waters of the Zhujiang River Estuary in summer. Acta Oceanol. Sin. 2004, 26, 63–73. [Google Scholar]
  43. Jiang, Z.; Liu, J.; Chen, J.; Chen, Q.; Yan, X.; Xuan, J.; Zeng, J. Responses of summer phytoplankton community to drastic environmental changes in the Changjiang (Yangtze River) Estuary during the past 50 years. Water Res. 2014, 54, 1–11. [Google Scholar] [CrossRef] [PubMed]
  44. Shen, P.; Li, Y.; Qi, Y.; Zhang, L.; Tan, Y.; Huang, L. Morphology and bloom dynamics of Cochlodinium geminatum Schutt in the Pearl River estuary, South China Sea. Harmful Algae 2012, 13, 10–19. [Google Scholar] [CrossRef]
  45. Jordan, T.; Cornwell, J.; Boynton, W.; Anderson, J.T. Changes in phosphorus biogeochemistry along an estuarine salinity gradient: The iron conveyer belt. Limnol. Oceanogr. 2008, 53, 172–184. [Google Scholar] [CrossRef]
  46. Nguyen, T.T.N.; Nemery, J.; Gratiot, N.; Garnier, J.; Strady, E.; Tran, V.Q.; Nguyen, A.T.; Nguyen, T.N.T.; Golliet, C.; Aime, J. Phosphorus adsorption/desorption processes in the tropical Saigon River estuary (Southern Vietnam) impacted by a megacity. Estuar. Coast. Shelf Sci. 2019, 227, 106321. [Google Scholar] [CrossRef]
  47. He, Q.; Qiu, Y.; Liu, H.; Sun, X.; Kang, L.; Cao, L.; Li, H.; Ai, H. New insights into the impacts of suspended particulate matter on phytoplankton density in a tributary of the Three Gorges Reservoir, China. Sci. Rep. 2017, 7, 13518. [Google Scholar] [CrossRef] [PubMed] [Green Version]
  48. Wang, C.; Hsu, M.; Kuo, A.Y. Residence time of the Danshuei River estuary, Taiwan. Estuar. Coast. Shelf Sci. 2004, 60, 381–393. [Google Scholar] [CrossRef]
  49. Delhez, E.J.M.; Deleersnijder, E. Residence time and exposure time of sinking phytoplankton in the euphotic layer. J. Theor. Biol. 2010, 262, 505–516. [Google Scholar] [CrossRef] [Green Version]
  50. Jarvie, H.P.; Withers, P.J.A.; Hodgkinson, R.; Bates, A.; Neal, M.; Wickham, H.D.; Harman, S.A.; Armstrong, L. Influence of rural land use on streamwater nutrients and their ecological significance. J. Hrodrol. 2008, 350, 166–186. [Google Scholar] [CrossRef]
  51. Redfield, A. The biological control of chemical factors in the environment. Am. Sci. 1958, 46, 205–221. [Google Scholar]
  52. Yin, K.; Song, S.; Sun, J.; Wu, M.C.S. Potential P limitation leads to excess N in the pearl river estuarine coastal plume. Cont. Shelf Res. 2004, 24, 1895–1907. [Google Scholar] [CrossRef]
  53. Li, Y.; Zhang, Y.; Shi, K.; Zhu, G.; Zhou, Y.; Zhang, Y.; Guo, Y. Monitoring spatiotemporal variations in nutrients in a large drinking water reservoir and their relationships with hydrological and meteorological conditions based on Landsat 8 imagery. Sci. Total Environ. 2017, 599–600, 1705–1717. [Google Scholar] [CrossRef] [PubMed]
  54. Wu, G.; Cao, W.; Wang, F.; Su, X.; Yan, Y.; Guan, Q. Riverine nutrient fluxes and environmental effects on China’s estuaries. Sci. Total Environ. 2019, 661, 130–137. [Google Scholar] [CrossRef] [PubMed]
  55. Dai, M.; Guo, X.; Zhai, W.; Yuan, L.; Wang, B.; Wang, L.; Cai, P.; Tang, T.; Cai, W. Oxygen depletion in the upper reach of the Pearl River estuary during a winter drought. Mar. Chem. 2006, 102, 159–169. [Google Scholar] [CrossRef]
  56. Miyazako, T.; Kamiya, H.; Godo, T.; Koyama, Y.; Nakashima, Y.; Sato, S.; Kishi, M.; Fujihara, A.; Tabayashi, Y.; Yamamuro, M. Long-term trends in nitrogen and phosphorus concentrations in the Hii River as influenced by atmospheric deposition from East Asia. Limnol. Oceanogr. 2015, 60, 629–640. [Google Scholar] [CrossRef]
  57. Lin, Y.; Zhou, Y.; Wang, G. Red tide organisms and their relationships with environment in the Zhujiang estuary. Trop. Oceanol. 1994, 13, 58–64. (In Chinese) [Google Scholar]
  58. Ma, Y.; Wei, W.; Xia, Y.; Yu, B.; Wang, D.; Ma, Y.; Wang, L. History change and influence factor of nutrient in Lingdingyang sea area of Zhujiang River Estuary. Acta Oceanol. Sin. 2009, 31, 69–77. [Google Scholar]
  59. Hu, M.; Liu, L.; Ma, Q.; Zhu, T.; Tian, X.; Dai, M. Spatial-temporal distribution of dimethylsulfide in the subtropical Pearl River estuary and adjacent waters. Cont. Shelf Res. 2005, 25, 1996–2007. [Google Scholar] [CrossRef]
  60. Dong, Y.; Cai, J.; Qian, H. Nutrient ratios and its relationship with phytoplankton in the Pearl River Estuary. Mar. Sci. Bull. 2009, 28, 3–10. (In Chinese) [Google Scholar]
  61. Liu, H.; Huang, L.; Tan, Y.; Ke, Z.; Liu, J.; Zhao, C.; Wang, J. Seasonal variations of chlorophyll a and primary production and their influencing factors in the Pearl River Estuary. J. Trop. Oceanogr. 2017, 36, 81–91. (In Chinese) [Google Scholar]
  62. Shi, Y.; Zhao, H.; Wang, X.; Zhang, J.; Sun, X.; Yang, G. Distribution Characteristics of Nutritive Salts and Chlorophyll a in the Pearl River Estuary. J. Guangdong Ocean Univ. 2019, 39, 56–65. (In Chinese) [Google Scholar]
  63. Zeng, D.; Niu, L.; Tao, W.; Fu, L.; Yang, Q. Nutrient dynamics in Pearl River Estuary and their eutrophication evaluation. J. Guangdong Ocean Univ. 2020, 40, 73–82. (In Chinese) [Google Scholar]
Figure 1. Sketch map of the Pearl River estuary (PRE) and adjacent coastal waters. The PRE consists of three major rivers (east, north, and west rivers), discharging waters to the South China Sea via eight outlets at Humen (HUM), Jiaomen (JIM), Hongqili (HQM), Hengmen (HEM), Modaomen (MDM), Jitimen (JTM), Hutiaomen (HTM), and Yamen (YAM).
Water 12 03245 g001
Figure 2. Temporal variations of water and sediment discharge in the Pearl River (sum of Boluo, Shijiao, and Gaoyao hydrological stations). (a) Seasonal variation in 2016, (b) annual change during 1997–2016. Data are derived from the Pearl River Water Resources Committee, accessible through http://www.pearlwater.gov.cn/.
Water 12 03245 g002
Figure 3. Seasonal variations of salinity and suspended particulate matter in the surface waters of the Pearl River estuary ((a) February, May; (b) August, November), no SPM data in August and November.
Water 12 03245 g003
Figure 4. Spatial distributions of dissolved inorganic nitrogen (a1d1), dissolved phosphorus (a2d2), and dissolved silicate (a3d3) at the surface layer in the Pearl River estuary, unit: mg/L ((a) February; (b) May; (c) August; (d) November).
Water 12 03245 g004
Figure 5. Scatter diagrams of atomic nutrient ratios in the Pearl River estuary ((a) N-limited; (b) P-limited; (c) Si-limited).
Water 12 03245 g005
Figure 6. Plot showing the correlations between nutrient concentrations (N, P, and Si) and hydrological parameters (salinity and suspended particulate matter) in the Pearl River estuary.
Water 12 03245 g006
Figure 7. Seasonal change of nutrient deviation ( Δ DIN, Δ DIP, and Δ DSi) vs. salinity in the surface samples, plots denoting the differences between the observed concentrations, and predicted values by the two end-member mixing model. The dashed line represents no deviation; the positive and negative deviations represent the nutrient input (e.g., emissions of coastal cities, riverine input, atmospheric deposition) and removal (e.g., biological uptake, sedimentation of particles). The limit lines indicate the nutrient deviations within 95% confidence level.
Water 12 03245 g007
Figure 8. Biological response (in terms of chlorophyll a) to nutrients (N, P, Si) and hydrology in the Pearl River estuary.
Water 12 03245 g008
Figure 9. Seasonal changes in eutrophication levels and their responses to hydrological factors (e.g., salinity and DO) in the Pearl River estuary ((a) February; (b) May; (c) August; (d) November).
Water 12 03245 g009
Figure 10. Time-varying trends of nutrients between 1997 and 2016 in the Pearl River estuary, historical data were provided as in [16,20,58,59,60,61,62,63] and our field efforts.
Water 12 03245 g010
Table 1. Summary of water quality parameters in the Pearl River estuary.
VariableAbbreviationUnitMinMaxSDMeanSample Analysis
Water temperature (in May)T C24.4430.731.5527.35CTD
Dissolved oxygenDOmg/L1.910.481.396.50Iodometry
Chemical oxygen demandCODmg/L0.193.360.651.16Alkaline permanganate method
SalinityS2.0234.7510.2022.85CTD
Suspended particulate matterSPMmg/L0.8139.118.715.58Gravimetric analysis
PhosphorusDIPmg/L0.0010.2320.0350.025Colorimetry
Dissolved inorganic nitrogenDINmg/L0.0122.9380.7630.803Colorimetry
SilicateDSimg/L0.0314.891.271.331Colorimetry
Total nitrogenTNmg/L0.143.440.851.37Colorimetry
Total phosphorusTPmg/L0.0050.310.0490.051Colorimetry
Chlorophyll aChlaµg/L0.1221.114.083.99UV spectrophotometry
Table 2. Correlations between nutrient concentrations (N, P, and Si) and hydrological factors (dissolved oxygen (DO), chemical oxygen demand (COD), salinity, and suspended particulate matter (SPM)) in the Pearl River estuary (* significant at the 0.05 level).
February May
PO 4 NO 2 NO 3 NH 4 SiO 4 PO 4 NO 2 NO 3 NH 4 SiO 4
DO−0.1180.2210.262−0.1070.261 −0.563 *−0.781 *−0.606 *−0.686 *−0.723 *
COD0.488 *0.753 *0.737 *0.512 *0.758 * 0.367 *0.713 *0.758 *0.710 *0.774 *
Salinity−0.509 *−0.739 *−0.939 *−0.664 *−0.924 * −0.369 *−0.613 *−0.927 *−0.577 *−0.898 *
SPM0.1570.1470.1380.0460.236 0.0270.361 *0.514 *0.2620.483 *
August November
PO 4 NO 2 NO 3 NH 4 SiO 4 PO 4 NO 2 NO 3 NH 4 SiO 4
DO−0.562 *−0.702 *−0.549 *−0.711 *−0.705 * −0.303 *−0.415 *−0.665 *−0.362 *−0.678 *
COD0.723 *0.590 *0.513 *0.582 *0.661 * 0.519 *0.740 *0.781 *0.567 *0.796 *
Salinity−0.467 *−0.696 *−0.940 *−0.518 *−0.939 * −0.556 *−0.701 *−0.948 *−0.513 *−0.955 *
Table 3. PCA-generated component loading between phytoplankton chlorophyll and multiple environmental factors in the estuary.
MonthPCsInitial EigenvaluesRotation Sums of Squared Loading
Total% of VarianceCumulative %Total% of VarianceCumulative %
February16.5954.9554.956.5154.2154.21
21.8515.4070.361.8915.7469.96
31.058.7879.141.109.1879.14
May17.1655.0655.065.1139.3039.30
22.1016.1171.183.4026.1765.46
31.037.9479.121.7813.6579.12
August17.1765.1965.194.2939.0139.01
21.5013.6478.833.9135.5674.58
31.3011.7990.621.7716.0590.62
November17.7070.0070.005.3448.5048.50
21.4312.9682.963.7934.4682.96
Table 4. Historical sewage discharge and total amount of pollutants from the Pearl River into the estuary (2006–2016).
YearDomesticSewage Discharge (10 8 t/year) Total Pollutants (10 4 t/year)
Secondary IndustrialTertiary IndustrialTotal
200639.1381.6410.8131.57126.22
200739.4775.5710.46125.49221
200839.1370.8410.8120.77167.09
200938.870.1710.46119.4278.6
201040.8271.8611.47124.1471.7
201141.4970.5113.49125.4975.82
201241.1667.1315.52123.8166.33
201340.4865.1115.52121.1193.06
201441.4963.0816.87121.45176.63
201543.1859.3717.54120.1243.57
201642.8457.3517.88118.07202.76
Publisher’s Note: MDPI stays neutral with regard to jurisdictional claims in published maps and institutional affiliations.

