Government Guarantee Decisions in PPP Wastewater Treatment Expansion Projects


1
Department of Construction Management and Real Estate, Tongji University, Shanghai 200092, China
2
Brick Public Consulting Co., Ltd., Shenzhen 518054, China
3
School of Architecture and Built Environment, Deakin University, Geelong, VIC 3220, Australia
*
Author to whom correspondence should be addressed.
Water 2020, 12(12), 3352; https://0-doi-org.brum.beds.ac.uk/10.3390/w12123352
Submission received: 24 October 2020
/
Revised: 23 November 2020
/
Accepted: 27 November 2020
/
Published: 29 November 2020
(This article belongs to the Special Issue Urban Water Economics)
Abstract
:Public private partnership (PPP) models are often used in delivering wastewater treatment (WWT) projects. When existing PPP projects need expansion due to higher demand for WWT, in many cases, the expansion may involve a new PPP contract involving a new concessionaire. Expansion PPPs have unique challenges as the sharing of responsibilities and risks can become complex. The complexities are further exacerbated when there are government guarantees involved. Structuring inappropriate guarantees can often lead to high costs for the government. This study focused on the choice of government guarantee in PPP expansion projects in the WWT sector by examining two popular guarantee mechanisms: minimum revenue guarantee and exclusive right. A decision model was developed and applied in a real WWT expansion PPP project in China to illustrate the optimal guarantee under varying circumstances related to service demand, expected unit price, and the existing guarantees in the existing PPP project. The contribution of the study lies in the applicability of the model to facilitate better decisions for the government in selecting the optimal guarantee mechanism in PPP expansion projects.
1. Introduction
As cities around the world experience more urbanization, the demand for wastewater treatment (WWT) infrastructure has increased [1]. In many cases, the design and the capacity of existing WWT plants have become inadequate due to higher demand, necessitating new greenfield projects to be developed or for existing projects to be expanded. With the growing pressure on governments to provide the essential infrastructure, public private partnership (PPP) models are adopted as a means to attract private sector funds as well as to utilize the technical and managerial skills of private partners in the delivery of these projects [2]. Despite its acceptance and reported advantages, the complexity of PPPs combined with characteristically lengthy concession periods create high risks in these projects [3,4]. Governments often provide various guarantees as risk sharing mechanisms to make PPPs viable and financially attractive to their private partners. These incentives create stronger competition, which in theory, leads to lower costs for the government and creates higher value for money (VfM) [5].
Project risks are shared by governments in PPP projects using a variety of methods that take the form of reimbursements, subsidies, price adjustments, concession period extension, termination arrangements, and guarantees [6]. In the face of inherent systematic risks related to the market demand, it is common for the government to provide a minimum revenue guarantee (MRG) to the concessionaire/operator in revenue funded PPPs, while where there are possibilities of increased demand, exclusive right (ER) is provided [7]. The MGR presents one of the most attractive forms of incentives. This guarantee mechanism ensures that the project operator/concessionaire obtains a certain (predetermined) amount of income regardless of the exogenous factors affecting the project revenue. ER, also known as restrictive competition guarantee, is the provision of an exclusive right to the operator/concessionaire to be the sole provider of the services for an agreed amount of time [7]. In some cases, the operator/concessionaire is provided with subsidies for the amount of revenue lost where a new project is built to provide the same services. The MRG and ER are both popular in PPP wastewater treatment projects, however, when these guarantees are not carefully designed, it can create serious issues for the governments [2].
PPP expansion projects could be required as a result of (unanticipated) growth in demand or due to inaccurate forecasts made in the original PPP [8], and in other cases, could be planned extensions. Regardless of the reasons, the expansion adds to the complexities of an already complex PPP by involving a second project bidding and negotiations for a fresh PPP contract with new concession terms and risk transfer mechanisms. The difficulty may lie in determining how the expanded project is structured and delivered. Moreover, the design of the guarantee mechanisms is also important in these type of projects as they not only influence the financial viability of the new expansion PPP, but they also have a significant impact on the existing or original PPP project’s revenue. As such, this will have an impact on the governments’ costs.
The research on risk sharing mechanisms between the public and the private partners in PPPs has grown substantially in recent years, and much of the focus has been on PPPs utilizing revenue from user fees or tolls [9,10,11,12]. However, PPPs where the service fees are remunerated by the government, as in the case of many WWT PPPs, have received less attention. It can be argued that the government’s involvement in PPPs of this type is greater as they directly manage the fees paid to the project operator. Moreover, to the best of the authors’ knowledge, there are no studies that have focused specifically on the structure of government guarantees in PPP expansion projects. Expansion projects herein refers to PPPs where the project (that is operational) is expanded with a new PPP contract to construct additional infrastructure and operate and manage the facility to improve/increase service provision. This study attempts to fill that gap. In doing so, this study focused on examining the decision to select between MRG and ER mechanisms in government remunerated WWT PPPs. The primary objective of this study was to examine the cost of MRG and the ER, based on which the government can make an informed decision to utilize the most optimum guarantee mechanism. Specifically, a stepwise mathematical framework was used to assess the government’s decision based on their payments for different scenarios, and the factors that influence government decisions were also analyzed. Finally, the framework was used in a real-life PPP WWT expansion project in China to provide an illustrative example.
The contribution here is twofold; first, this study contributes to the theory by building to the existing knowledge of decision-making, specifically on the choice of guarantee mechanisms. Second, it presents a practical instrument that can be employed by governments to make better decisions, particularly in expansion WWT PPPs, where the service fees are remunerated by the government. As the complexities in these types of projects create uncertainties, wrong decisions on the government’s part can be very costly. Thus, the framework developed here can facilitate government decision-making in relation to PPP incentives specifically for WWT projects.
2. Public Private Partnerships (PPPs) and Government Guarantees
In the water treatment sector, the government has long been the main investor and operator, while the efficiency for funding and operations has remained low [13]. As an alternative approach, PPPs have emerged as an attractive model for delivering water treatment projects [14]. This project delivery model is generally considered as an effective means to fund the growing demand for infrastructure and services in an environment of limited public funds. Governments adopt PPP for a variety of reasons including the use of private investment and the transfer of project risks to a more efficient private partner. However, with the complexity of PPPs and the underlying uncertainties that exist within the long term concession periods, major challenges remain for the efficient operation and management of these projects [5,15].
The major challenges for the private sector operator in any revenue-funded PPP is the efficient management of demand and revenue risk [16,17]. Even with comprehensive assessments to forecast demand, long-term projects face high revenue uncertainties [18]. The lower than anticipated demand is often taken as systematic risk that affects revenue. The risk generally lies with the possibility that the demand is inadequate and consequently, the revenue from the project will be insufficient to service the project’s operation and maintenance costs, repay debt, and provide a satisfactory return on investment. The majority of PPP renegotiations and cancellations occur due to revenue risks [19].
Sharing of the demand and revenue risk by the government in PPPs can take any number of forms that may include explicit guarantees, take-or-pay contracts, or cost-plus contracts. Various tools are used by governments for providing risk sharing incentives, for example, flexible contract designs that allow the private sector to (re)negotiate the length of the concession are used as an equivalent to revenue compensation [20]. Other common mechanisms include profit allocation when there are issues relating to the private sector operator generating excessive revenue. These revenue sharing mechanisms are used to balance the profit by giving the government the right to capture the excess revenue [15]. Additionally, to manage and share the cost of revenue uncertainties, a price adjustment mechanism is also designed in the contract. Generally, the customer price index (CPI) is used as the reference to adjust the unit price to cover parts of cost inflation when paying the service fees to the private sector operator [21].
Government guarantees remain as one of the most popular incentive mechanisms, and a variety of complex techniques have been developed by researchers to establish an optimum level of government guarantees to resolve the issues around demand and revenue uncertainties. Existing studies have generally examined MRG threshold [16], demand guarantee [22], interest rate guarantee [23], and concession period extensions [24,25,26]. Of the many studies that have focused on models to assess the optimum level of MRGs, the real option approach has been widely used to explicitly price the guarantees [27]. Among others, Liu and Cheah [28] used Monte Carlo simulation to analyze embedded options in the form of government guarantees and Ashuri et al. [29] developed a risk-neutral binomial lattice based on real option theory for toll roads. Attention has also been given to develop models to value guarantees for the governments [30,31] and to calculate MRG levels to achieve a balanced outcome for both the private and the public sector parties [11,23]. Specifically, in the water sector, Park et al. [32] proposed a real option-based model focusing on maximum revenue limit and maximum expense limit, and Sun and Zhang [27] presented a model to optimize the MRG and royalty collection with a focus on balancing the risk and reward for the government and the private sector.
Studies on ER, on the other hand, has attracted research to a lesser degree. The exception is the work of Liu, Yu, and Cheah [7], who argued that ER is generally common and necessary in PPP projects, and modeling ER mechanisms can lead to better decision making for the government. Project revenue may be impacted when another project delivering the same services is developed and the end users may opt to use and pay for the new project [33]. To avert this risk, the concessionaire may ask for an ER from the government, which can be an assurance that no new competing project will be developed. ER may also take the form of a guarantee to compensate the losses in revenue caused by the rival projects. Provision of ER to deliver services changes the nature of the revenue risks and may impact the MRG calculations if MRG is already structured in the contracts.
For the government, higher than expected (or forecasted) demand during the project operation can also create a challenge. The concern could either be related to not being able to deliver the required level of services, or it could be related to the private sector operator generating excess revenue [27]. The effective and efficient operation of projects in some sectors such as the water and wastewater treatment sectors can be more important for governments as these provide basic services to its citizens [32,34]. Moreover, not being able to meet the demands even when the PPP infrastructure is already operating at a high capacity level can be a major concern for the government. To solve this problem in particular, governments may have to either create a new greenfield project or to expand the existing project. PPP contracts can often have a clause where the government will have the right to authorize expansion to the project when the service demand exceeds the project’s capacity (or is close to being exceeded) to deliver those services [5]. For the government, future expansion to the project can make more sense than to build a larger facility and not let it run it to its full capacity in the earlier years of operation when the demand is low. This is particularly true in the revenue funded water projects where the sunk costs are high and the private sector partner are not willing to bear the risk of investing in a facility that only operates partially, without favorable guarantees from the government.
All demand risks in PPPs can be costly, and as seen from many transport PPPs, these risks ultimately become the government’s responsibility [35]. Carpintero and Peterson [36] studied 131 WWT PPPs in Spain to conclude that one of the key issues in WTP PPPs is the misallocation of demand risk to the private sector operator. Forecasting demand over the long-term concession period can be difficult [15,18], and when government guarantees are not devised well, it creates serious threat to their credibility, while imposing a serious burden on taxpayers. Jang et al. [37] highlighted the high costs to the government as a result of expensive MRGs. Similarly, Chiara and Kokkaew [38] used the example of the revenue guarantees provided during the 80s and 90s in Mexican PPP toll roads to highlight the high costs of these guarantees. Song et al. [39] provided examples of PPP project failures in the water treatment sector in China as a result of sub-optimal guarantees.
Existing studies on this topic have focused heavily on user pay or toll funded PPPs. There are fewer studies that have focused specifically on WWT projects, and this could be because the risk of lower than expected demand for the operators in utility sectors is not as severe as in the case of toll funded projects. WWT service users do not have the option to choose between service providers, so there is less fluctuation in demand for services [32].
However, with the expansion of an existing WWT PPP due to higher demand, there can be new and complex challenges, particularly in designing the contracts and structuring guarantees for the expansion PPP. The conditions for expansion PPPs are different to that of normal PPPs since the original or existing PPP will strongly (and unavoidably) be linked to its expansion PPP, and the guarantee decisions made for the latter will also impact the former. For example, structuring the demand responsibility and guarantees, which directly impact the service fee payments for both the original and the expansion PPP operators, can be problematic.
More importantly, guarantees cost governments money, as they assume all contingent liabilities that these support instruments may create [2], and the wrong choice of guarantee may result in excessive costs for them, which defeats the purpose of using the PPP model. Prior to structuring the guarantees in expansion PPPs, the first key step for the government is to assess the choice of guarantee based how much it will cost them. This paper attempts to solve this problem in part through a model that can facilitate that decision, specifically the choice between MRG and ER in government renumerated WWT PPPs.
3. Modeling the Guarantee Decision
This study developed a deterministic decision model for governments to choose between MRG and ER in PPP WWT expansion projects. The focus of this study was on the expansion component of an existing PPP, wherein the expansion is a new PPP. Herein, this paper refers to the existing PPP project as the phase I project and the expansion PPP project as the phase II project.
The decision model is presented in the following four steps. In the first step, basic assumptions are put forth and the numerical model is constructed to assess the government’s payments in regard to the two guarantee options. In doing so, the following four conditions are considered:
- Government’s payment to phase I PPP before phase II PPP begins operation;
- Government’s payment to phase I PPP after phase II PPP begins operation;
- Government’s payment to phase II PPP; and
- Government’s total payment to phase I PPP and phase II PPP.
In the second step, a decision factor model is developed to facilitate the government’s decision on providing MRG or ER for the phase II project. In the third step, factors that affect the government’s decision making are analyzed. Specifically, the following two factors are considered:
- WWT service demand, and
- Expected unit price of WWT.
Finally, in the fourth and final step, a real WWT project in China consisting of phase I and phase II, is used as the illustrative example to show the applicability of the decision model. In the following sub sections, each of the four steps are discussed in detail.
3.1. Modeling Government Payments
First, the following assumptions are made for developing the model:
- The concession period of the phase I project under a PPP contract is years including a construction period of years and an operation period of years, and the unit price of the service provided by the project is .
- The government has provided a MRG to the phase I project for the whole concession period. The MRG is defined as a certain percentage (, ) of the designed capacity () of the phase I project. Consequently, if the demand is lower than the MRG during the concession period, the government will compensate the project based on the MRG as promised in the contract.
- The concession period of phase II project under a PPP contract is years including a construction period of years and an operation period of years, and the unit price of public service provided by the project is .
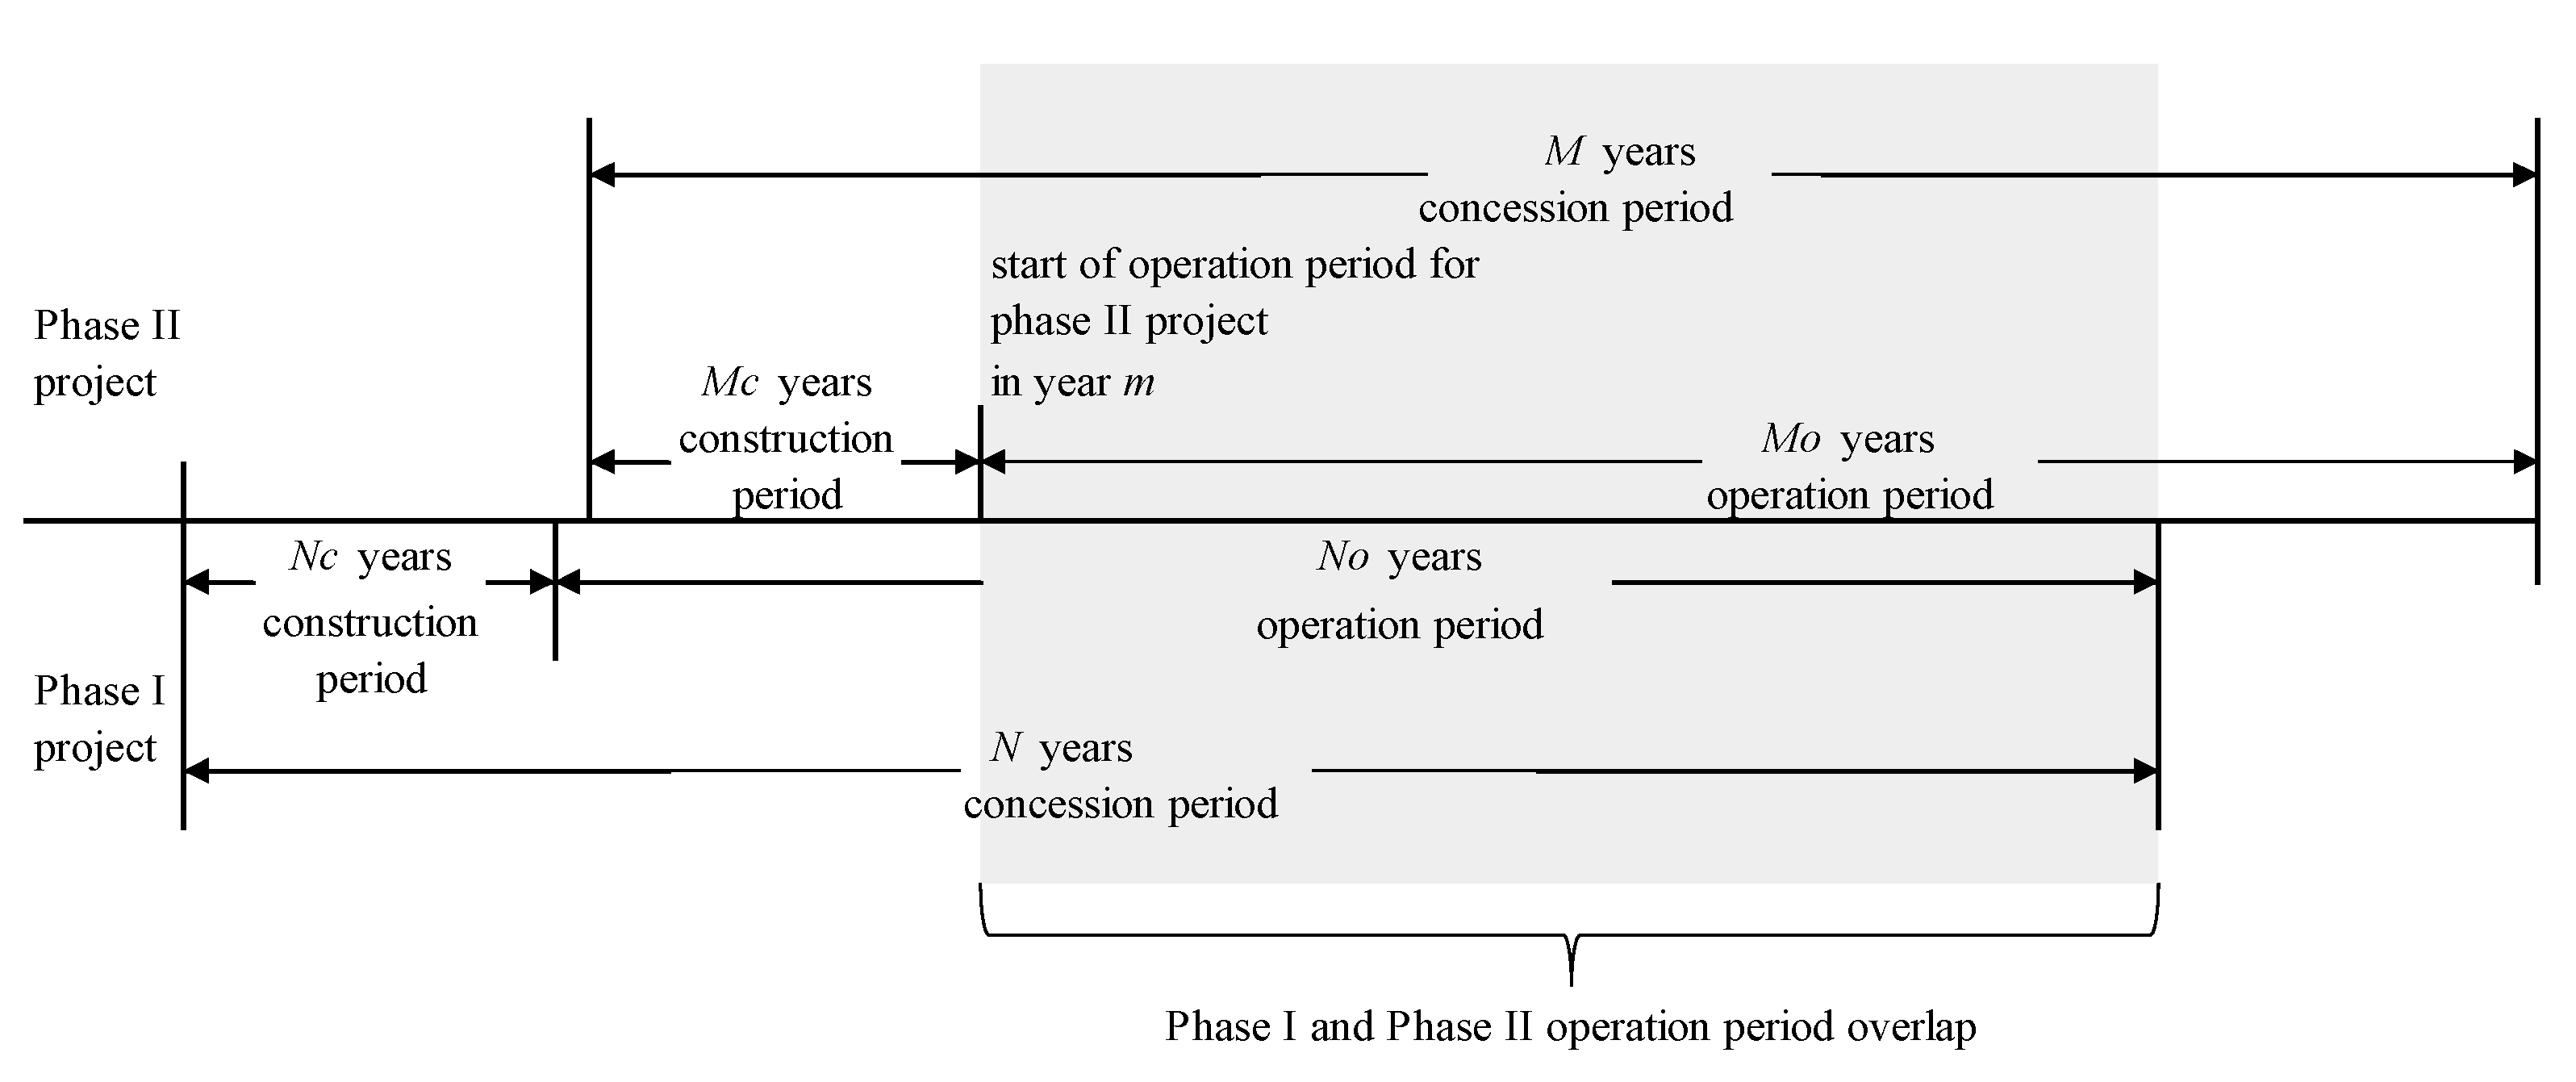
- The phase II project begins operation at year . This study will concentrate on the timeframe during which the phase I and phase II operation overlap (see Figure 1), thus, it is assumed that .
- The total service demand in the region in year is , and it will be met solely by the phase I and phase II projects. The service provided by the phase I project in the year is and the service provided by the phase II project in the year is .
- The government has two guarantee options for the phase II project. Option A is a MRG to the phase II project for the whole concession period. The MRG is defined as a certain percentage (,) of the designed capacity () of the phase II project. The total demand is shared by the phase I and phase II projects based on their design capabilities. If the demand is lower than the MRG during the concession period, the government will compensate the project based on the MRG as promised in the contract. Option B is that the government grants an ER to phase II for providing the public services in the region, which means that once phase II begins operation, the service provision to meet the demand in the region should be first undertaken by the phase II project to full capacity, and when the demand is higher than its capacity to deliver, the remaining demand responsibility should be given to the phase I project.
- The government’s total payment to the phase I project during the concession period is TA, and the government’s annual payment to the phase I project in the year is . The government’s total payment to the phase II project during the concession period is TB, and the government’s annual payment to the phase II project in the year is .
- The discount rate is assumed as zero when calculating the government’s costs. This is because there are no hard and fast rules as to what rate to use, and governments generally use different rates on a case by case basis. Moreover, in China, government guidelines on affordability assessment in government renumerated PPPs advise that no discount rate is to be considered in such fiscal affordability assessments.
3.2. Modelling Payment to Phase I Prior to Phase II Operation
Before the phase II project begins operation, if the actual revenue is lower than the MRG threshold, which is due to lower demand, the government will pay the project based on the MRG to the phase I project as promised in the contract. However, if the actual revenue is more than the MRG threshold, the service fees will be calculated based on the actual demand. Therefore, the payment to the phase I project prior to the phase II operation is stated numerically as shown in Equation (1).
where is the government’s total payment to the phase I project prior to phase II operation and is the government’s payment to phase I project in the year before the phase II project begins operation.
3.3. Modeling Payment to Phase I after Phase II Begins Operation
Once the phase II project begins operation, the government’s payment to the phase I project is influenced by whether or not the government has granted an ER to phase II. If the government selects option A, the government will provide a MRG to the phase II project for the whole concession period. The MRG is defined as a certain percentage (, ) of the designed capacity () of the project and there is no ER for the phase I and phase II projects. The payment to the phase I project after the phase II project begins operation is stated numerically as shown in Equation (2).
where is the government’s total payment to the phase I project after the phase II project starts operating and is the government’s payment to phase I project in the year if the government provides a MRG to the phase II project.
If the government selects option B, the government will provide an exclusive right to the phase II project during its entire concession period. Here, the ER is defined as the services being provided by the phase II project first up until the total demand increases beyond the designed capacity () of the phase II project to meet those demands. Therefore, the payment to the phase I project after the phase II project begins operation is stated numerically as shown in Equation (3).
where is the government’s total payment to the phase I project after the phase II project starts operation and is the government’s payment to the phase I project in the year if the government provides an ER to the phase II project.
3.4. Modeling Payment to the Phase II
If the government selects option A, that is the government provides an MRG to the phase II project, the payment to the phase II project is stated numerically as shown in Equation (4).
where is the government’s total payment to the phase II project for the concession period if the government provides a MRG and is the government’s payment to the phase II project in the year if the government provides a MRG.
If the government selected option B, that is the government provides an exclusive right to the phase II project for the whole concession period, the payment to the phase II project is stated numerically as shown in Equation (5).
where is the government’s total payment to the phase II project during the concession period if the government provides an ER and is the government’s payment to phase II project in the year if the government provides an exclusive right.
3.5. Modeling Total Payment to the Phase I and Phase II Projects
If the government selects option A, the total payment to the phase I and phase II projects is stated mathematically as shown in Equation (6).
where is the government’s total payment to the phase I and phase II projects during the phase I project’s concession period, if the government provides a MRG to the phase II project. By integrating Equations (1), (2) and (4), the can be obtained as shown in Equations (7) and (8).
If the government selects option B, the total payment to the phase I and phase II projects is stated numerically as shown in Equation (9):
where is the government’s total payment to the phase I and phase II projects during the phase I project’s concession period, if the government provides an ER to the phase II project. By integrating Equations (1), (3), and (5), the can be obtained as shown in Equations (10) and (11).
4. Modeling Decision Factor
In this step, the decision factors are examined to help governments make the optimal decision, based on the government’s total payment. Therefore, the decision factor () is defined here as the difference in the government’s total payment in the phase I and phase II projects while considering the different type of government support mechanisms for the phase II project, which is shown in Equation (12).
By integrating Equations (8) and (11), the decision factor () can be calculated as follows:
Equation (14) can be further simplified as Equation (15):
Assuming that the design capacities of phase I and phase II are both known prior to the tendering of the phase II project, and are considered as constants. Thus, and as shown in Equation (15), the will be mainly influenced by the variables , , , , and . In order to minimize the government’s total payment, the factors that influence government decision need to be analyzed in detail.
5. Factors Influencing Government’s Total Payment
To further analyze the influencing factors on the government’s decision for providing MRG or ER to the phase II project, several assumptions were made to simplify the model.
The assumptions are as follows:
- The core contract terms involving the phase I and phase II project are known during the procurement of the phase II project. These include the concession period (N, M), percentage of guaranteed demand (), design capability (, ), etc.
- It is assumed that “”; the unit price () of the phase I project is known; and the bidders tender for the unit price () of the phase II project. Prior to the tendering, information on the design capacity of phase I and II project is provided in the request for quotation (RFQ) documents. The bidders estimate the forecasted revenue, investment, and operation cost, etc. and bid for the unit price.
- The forecast of the demand for services as the in the year is given in the technical feasibility report conducted prior to the tendering for the phase II project.
- As the unit price determination is closely linked to the MRG provided by the government, it is assumed that the for the phase II project is known during procurement if the government has decided to provide MRG. Generally, if the government decides to provide MRG, the will be provided in the RFQ documents.
- To ensure that the model is equitable for the project company, the model is simplified by assuming “”, and considering that a MRG of less than 50% is generally insufficient for the project company.
Based on the above assumptions, Equation (15) can be simplified as Equations (16)–(19):
5.1. Wastewater Treatment (WWT) Service Demand
As shown in Equation (19), the WWT service demand during the concession period has an obvious impact on the decision factor (), and the choice of government incentive under different situations with regard to service demand is shown in Table 1. For example, if the service demand is less than , the optimal choice is to provide ER to the phase II project, regardless of what the unit price () of the phase II project is. This is because under the ER arrangement, the service demand is still lower than the level of MRG threshold, even though the total service provision responsibility is taken by the phase II project.
The phase II project may have been initiated as a result of the service demand going beyond the phase I project capability to deliver the services, thus, it is very unlikely that the demand would be less than . On the other hand, if the demand is more than (total capacity of both phase I and phase II projects), the government’s total payment will be the same while providing MRG or ER to the phase II project, as both projects will be paid for the full capacity operation, and the government support mechanism is not necessitated.
If the demand is less than , but more than , the better choice is to provide MRG to the phase II project, as shown in Table 1. In such situations, if the ER is provided to the phase II project, the total government payments will be based on the service quantity of ( + ), which is more than for MRG.
If the demand is less than , but more than , the decision on selecting MRG or ER will depend on the relationships between the unit price () of the phase I project and the unit price () of the phase II project, as shown in Table 1.
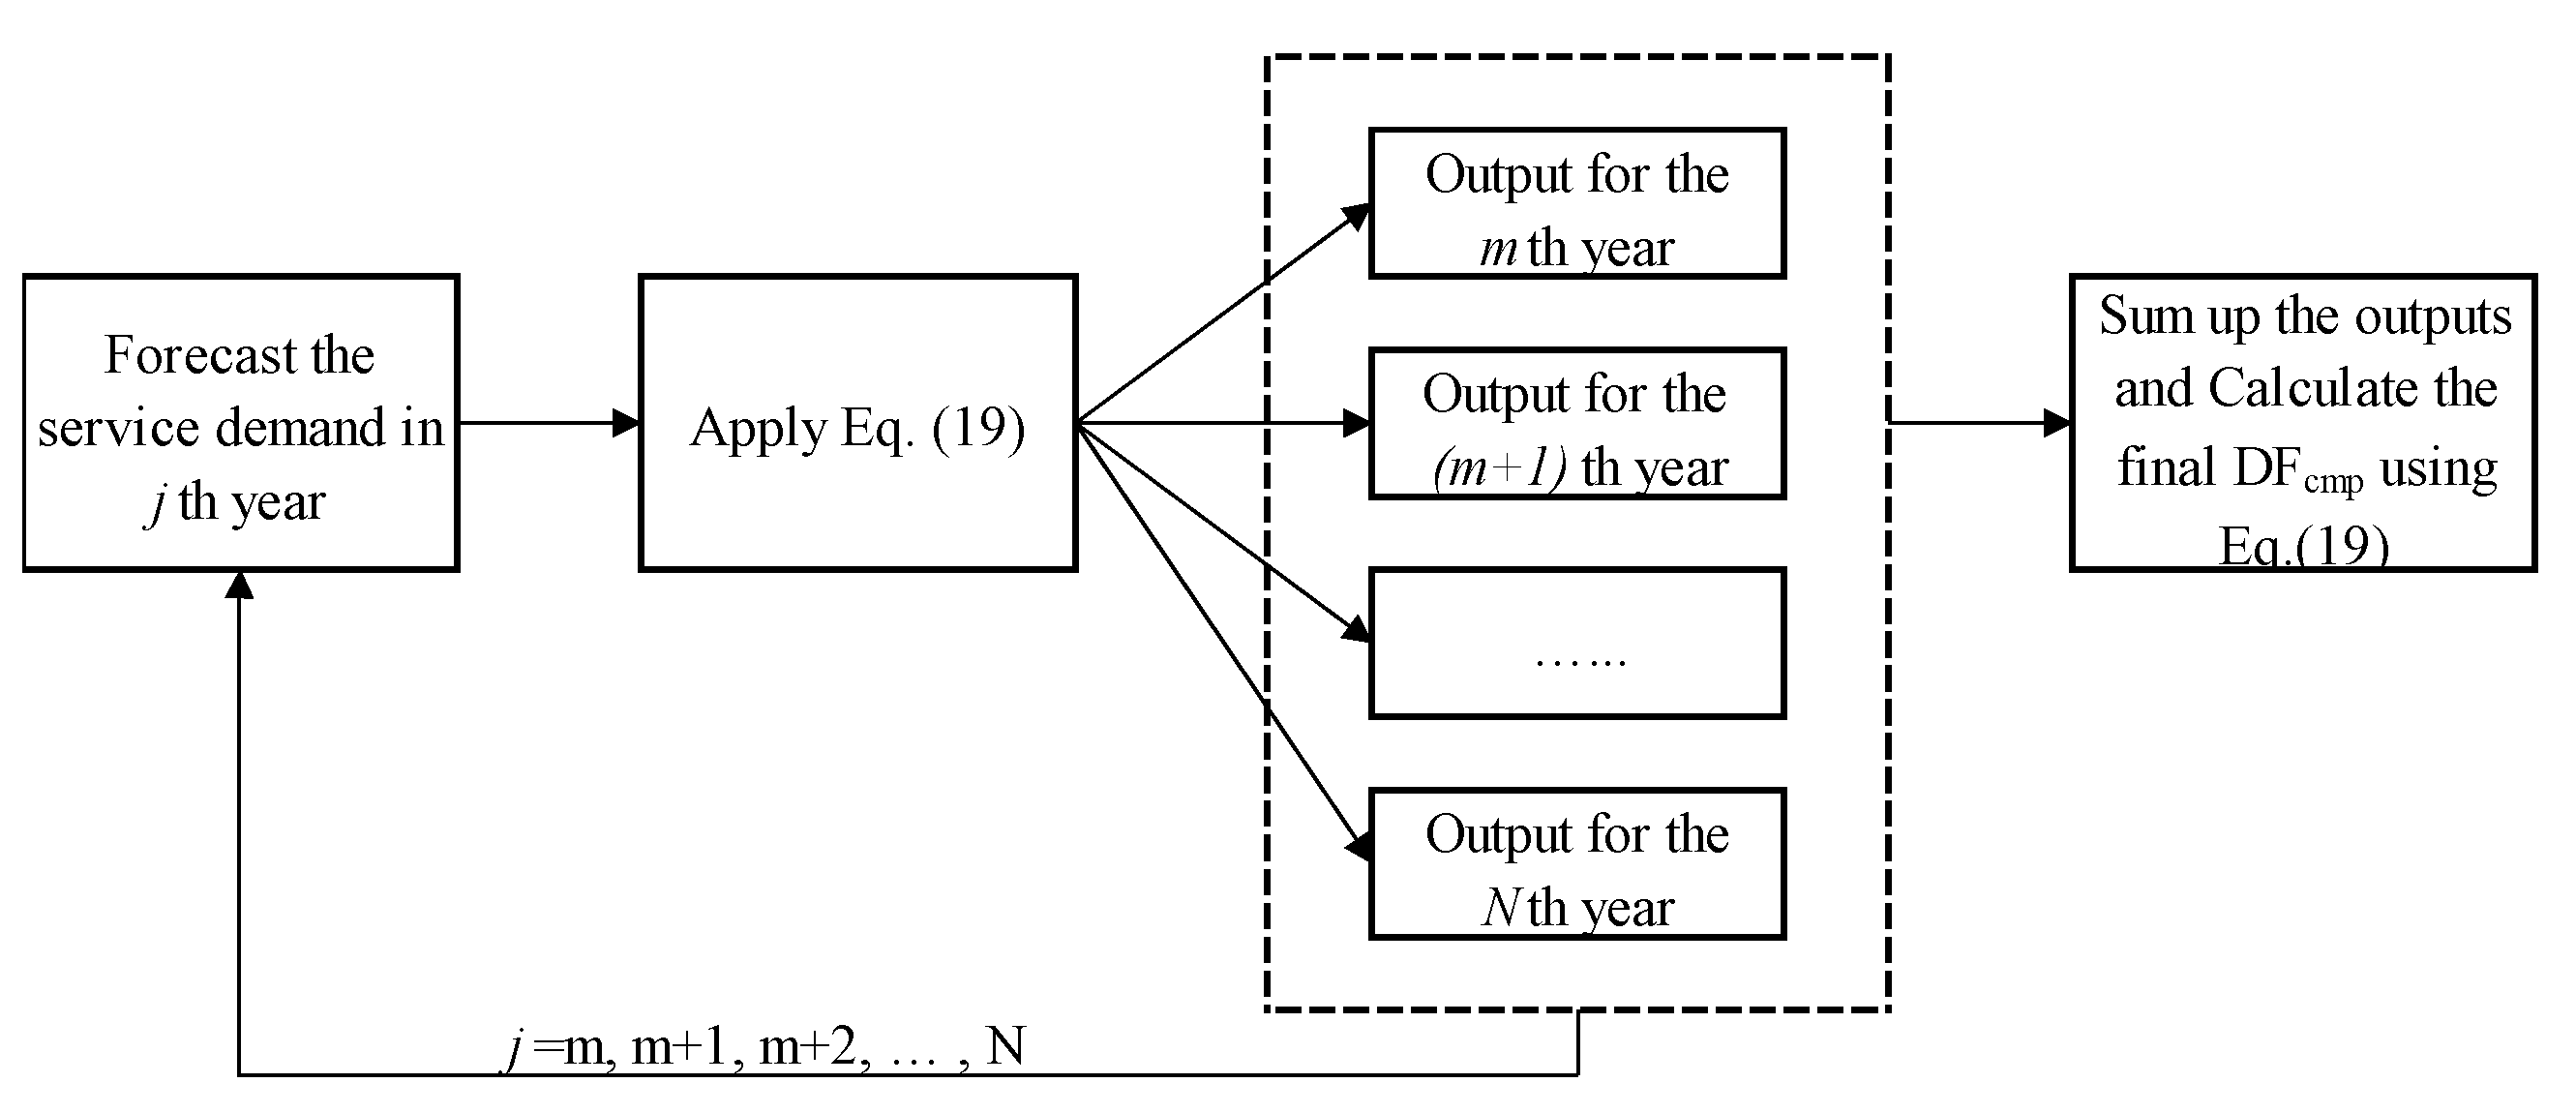
It should be noted that the demand can fluctuate every year during the concession period, and the actual demand for each year may involve different scenarios, as shown in Table 1. Therefore, a comprehensive forecasting of the service demand for each year can be done based on a simulation process as shown in Figure 2, where Equation (19) is used to determine the government’s final decision.
5.2. Unit Price of WWT
Aside from the service demand, the unit price of the WWT is also one of the key factors influencing total government payments, as shown in Equation (19) and Table 1. The unit price here is the expected unit price or expected bid price, as actual bids are generally only received after the guarantee mechanisms are disclosed to the bidders. Based on the assumptions made, if the service demand is between and , the unit price will have a clear influence on the government’s total payments (see Table 1 and Table 2).
This implies that when the expected unit price is lower in the phase II project, the better option for the government is to provide an ER. This makes sense because in order to save cost on the government’s total payment, it is better to design a contract allowing more demand to be met by the phase II project. Therefore, in practice, before the tendering of the phase II project takes place, the government could determine the upper price ceiling and the bid price would need to be lower than the upper price ceiling provided in the RFQ. It is important that the upper price ceiling would need to be based on the financial and market analysis. Moreover, as the decision factor is related to the phase II project’s unit price, the price ceiling should be carefully determined not only by considering the financial viability of the expansion project, but also the MRG or ER decision.
6. Illustrative Example
The decision model was applied in a case of a PPP wastewater treatment plant project in Shenzhen, China. The test case involved an original phase I PPP project that was later expanded with a phase II PPP project. The data on the projects were collected by reviewing the project feasibility report for the phase II project and the PPP contracts signed between the government and the concessioners in the phase I and phase II projects. Additionally, several interviews were conducted with the project consultants and the local authorities; specifically two interviews were conducted with project consultants, where one was conducted with an official from the Shenzhen PPP Center and one was conducted with an official from the Water Affairs Bureau.
6.1. Project Case Profile
The Shenzhen Gushu wastewater treatment plant (phase I) is held by the concessionaire, the Shenzhen Hanyang Wastewater Treatment Company. The phase I project provides the wastewater treatment service for the Xin’an and Xixiang areas in Bao’an district in Shenzhen. According to the contract, the government is required to pay the wastewater treatment fee to the project company for the duration of the concession period. The phase I project, which began operation in 2009, has a concession term of 22 years. At the end of the concession term, the project is to be transferred back to the government free of charge in 2028.
Table 3 provides the details of the phase I project. The wastewater treatment unit price in the project was 1.377 RMB/ton, and the MRG is equivalent to the revenue generated from 60% of designed capacity of the project. Based on the contract, if the quantity of wastewater in this area was to be less than the project’s design capacity, the service fee should be paid based on the MRG as in the concession contract.
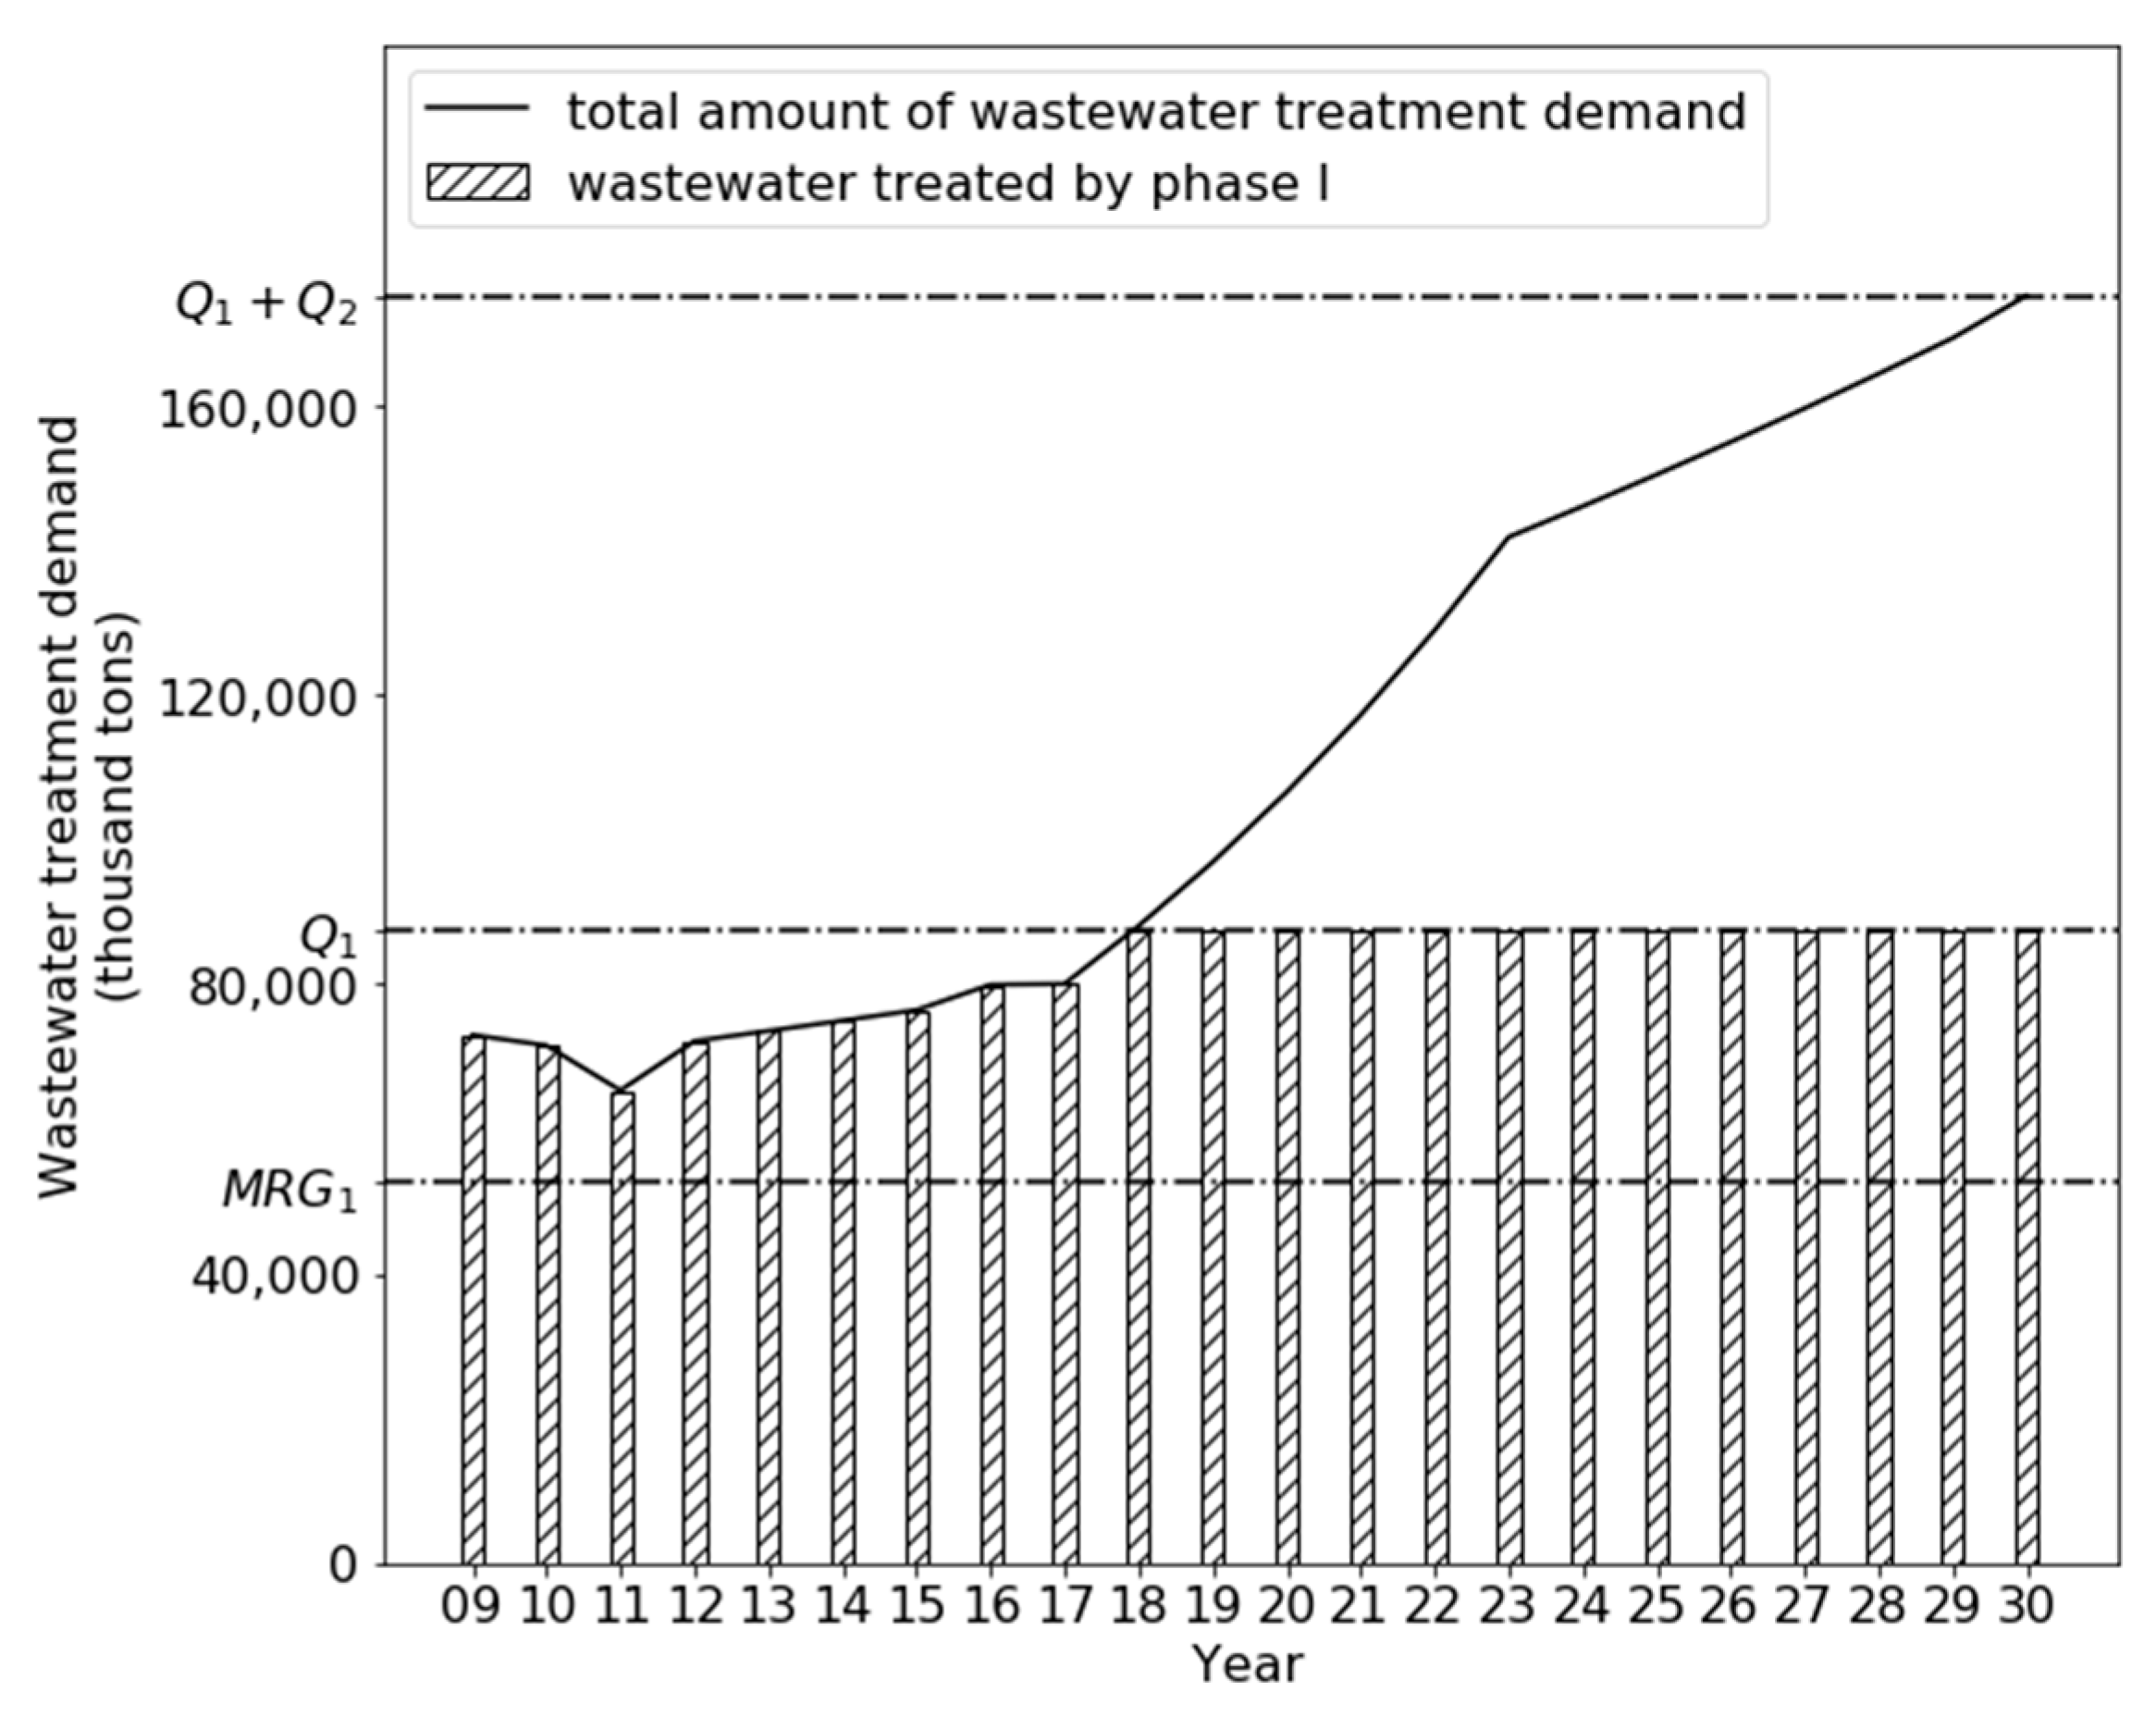
The details in the wastewater demand, project capacity, and the MRG for the project are illustrated in Figure 3 and Table 4, where it is shown that after 2019, there will be a gap between the demand for wastewater treatment and the capacity of the phase I project () to meet that demand. This was expected as a result of the rapid urbanization in the city of Shenzhen. Consequently, an expansion wastewater treatment plant (phase II) was essential and it was commissioned in order to satisfy the demand of the Xin’an and Xixiang areas. The construction for the phase II project began in 2019, and the wastewater treatment plant is expected to begin operation in 2021. According to the feasibility study conducted for the phase II project, the wastewater treatment demand is expected to level with the total treatment capacity of the phase I () and phase II () project in 2030, which is 17,520,000 tons, as shown in Table 4.
Table 5 provides the details of the phase II project, a 22-year concession contract including a 2-year construction period and a 20-year operation period. To share the demand risk, the government could either provide a MRG to the phase II project in the same way as in the phase I project, or could provide an ER to the phase II project. The wastewater treatment unit price of the phase II project would be determined through public tendering.
6.2. Wastewater Treatment Demand Sharing
Once the phase II project begins operation in 2021, the service demand sharing mechanism will affect the revenue of both the phase I and phase II projects, and additionally, it will affect the government’s total service fee payments. If the government decides to provide a MRG to the phase II project, the total wastewater treatment demand would be shared by the phase I and phase II project based on their design capacity following the assumptions made in this study.
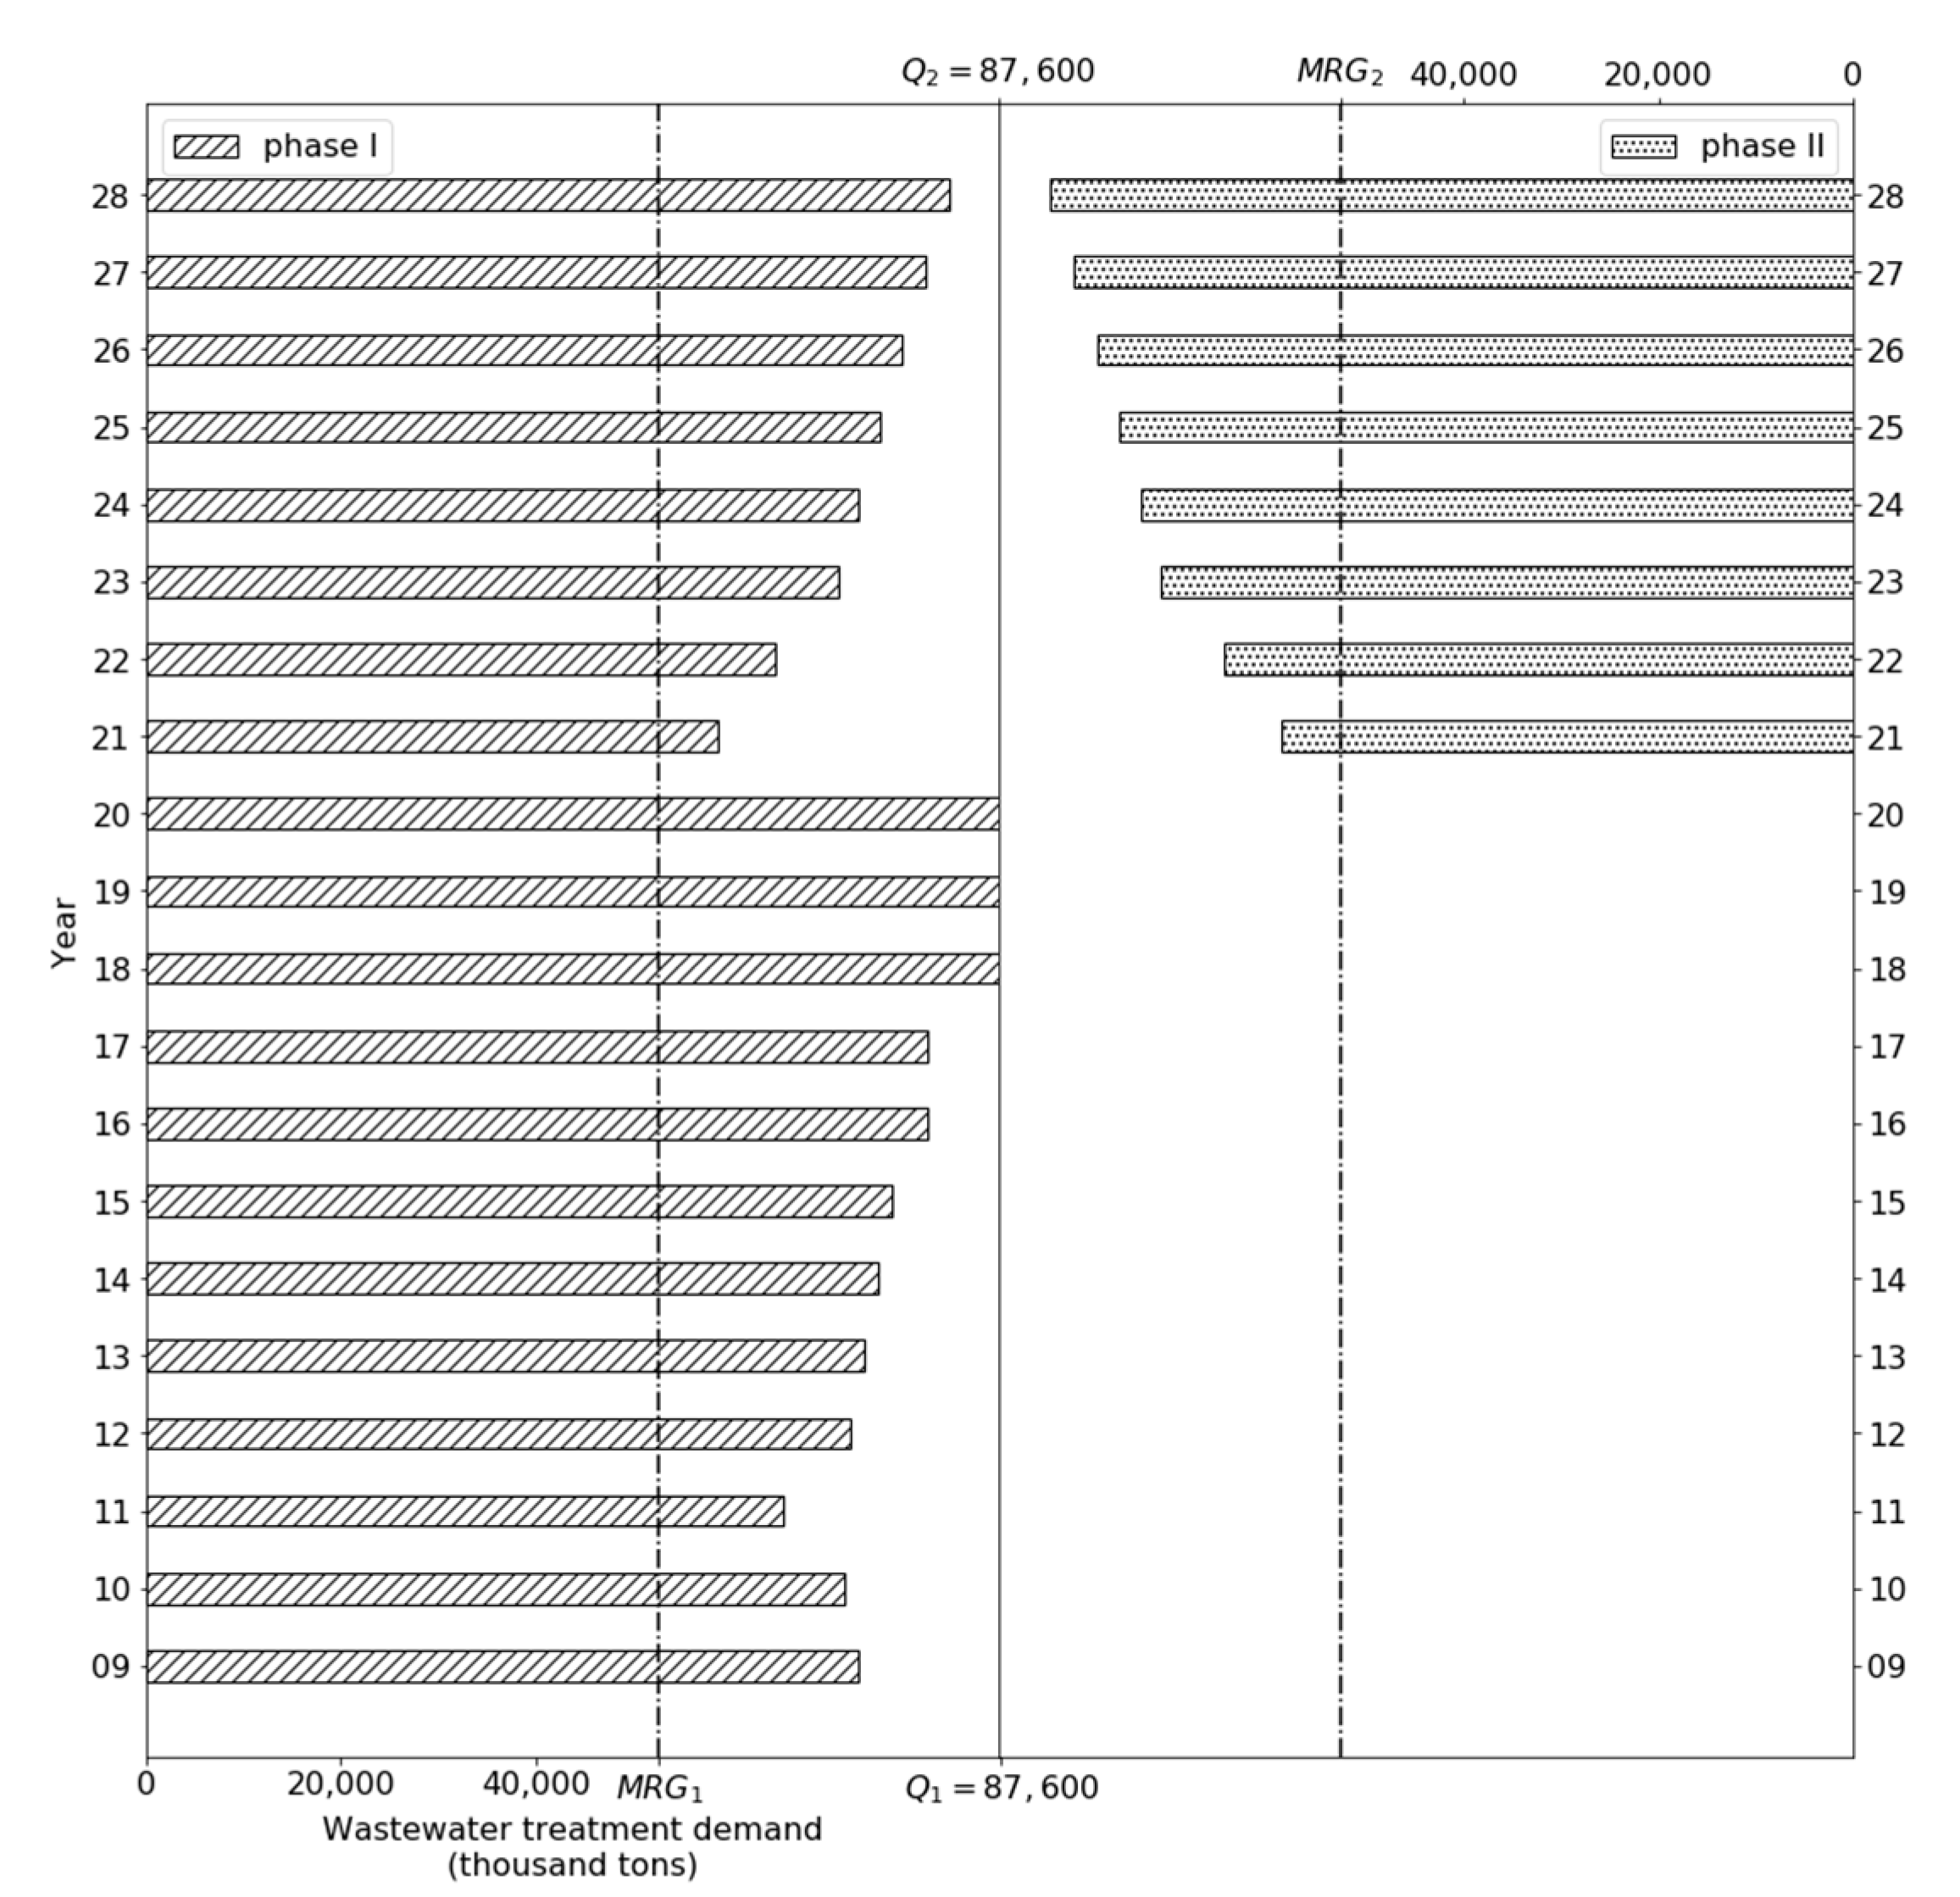
Figure 4 illustrates the sharing mechanism of wastewater demand between the phase I and phase II projects in the case where a MRG is provided to the phase II project. As seen from Figure 4, before 2021, all the wastewater treatment demand responsibility is met by the phase I project. It can also be seen that since 2017, the phase I project has been operating at full capacity, which will continue up until the phase II project begins operation. If the MRG is provided to the phase II project, the total wastewater treatment demand would be shared by the phase I and phase II project after 2021. In this case, the estimated demand will always be above the level of MRG for each project, and the wastewater treatment fee will be paid based on the actual demand.
The concession period of phase I expires in 2028 and the analysis beyond that period is not covered in this study, as the phase I project will be transferred back to the government and will not operate as a PPP.
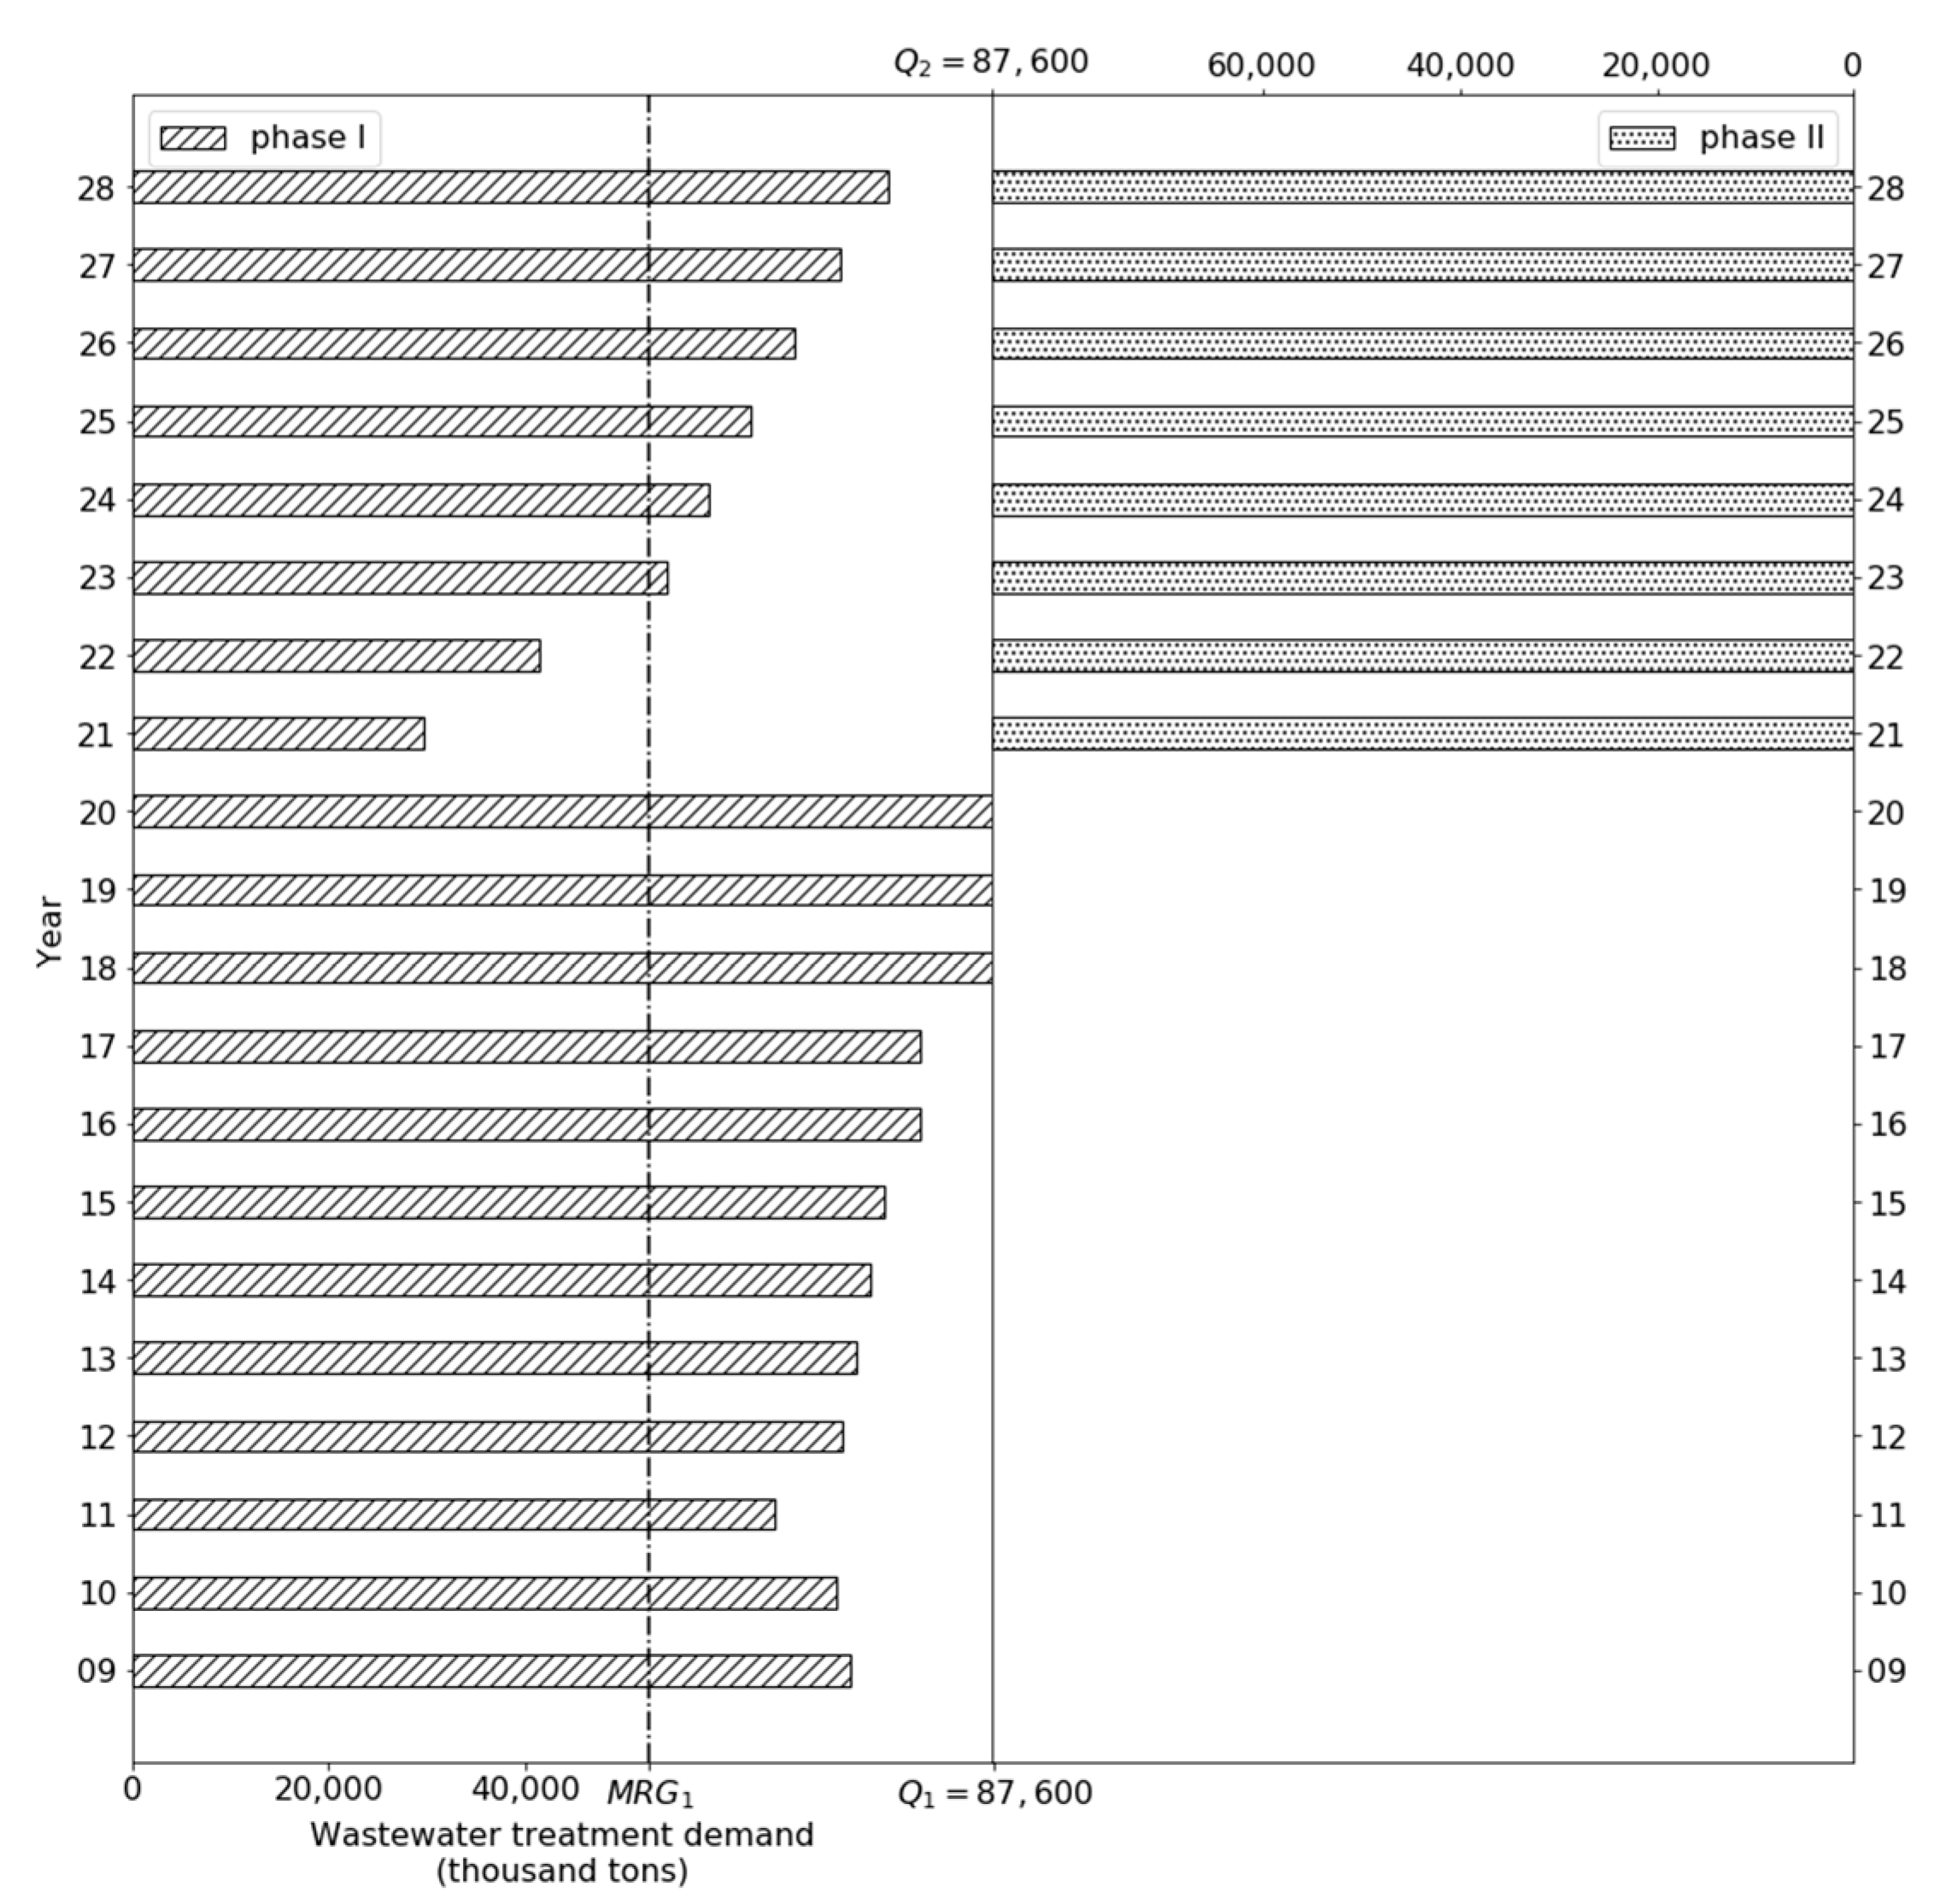
Figure 5 illustrates the sharing of wastewater demand between the phase I and phase II projects in the case an ER is provided to the phase II project. With an exclusive right provided to the phase II project, the responsibility to meet the total wastewater treatment demand should first be taken by the phase II project to its full capacity, and then the residual wastewater would be treated by the phase I project following the assumptions made in this study. As seen from Figure 5, the phase II project would be in operation at full capacity starting from 2021. However, the demand is expected to be lower than the level of MRG for the phase I project in the years 2021 and 2022. Only after 2022, will the actual wastewater treatment of phase I project be above the level of MRG. Therefore, in 2021 and 2022, the wastewater treatment fee of the phase I project will be paid based on the MRG, and after 2022, the government would pay for the services based on the actual demand.
6.3. Analysis and Discussion
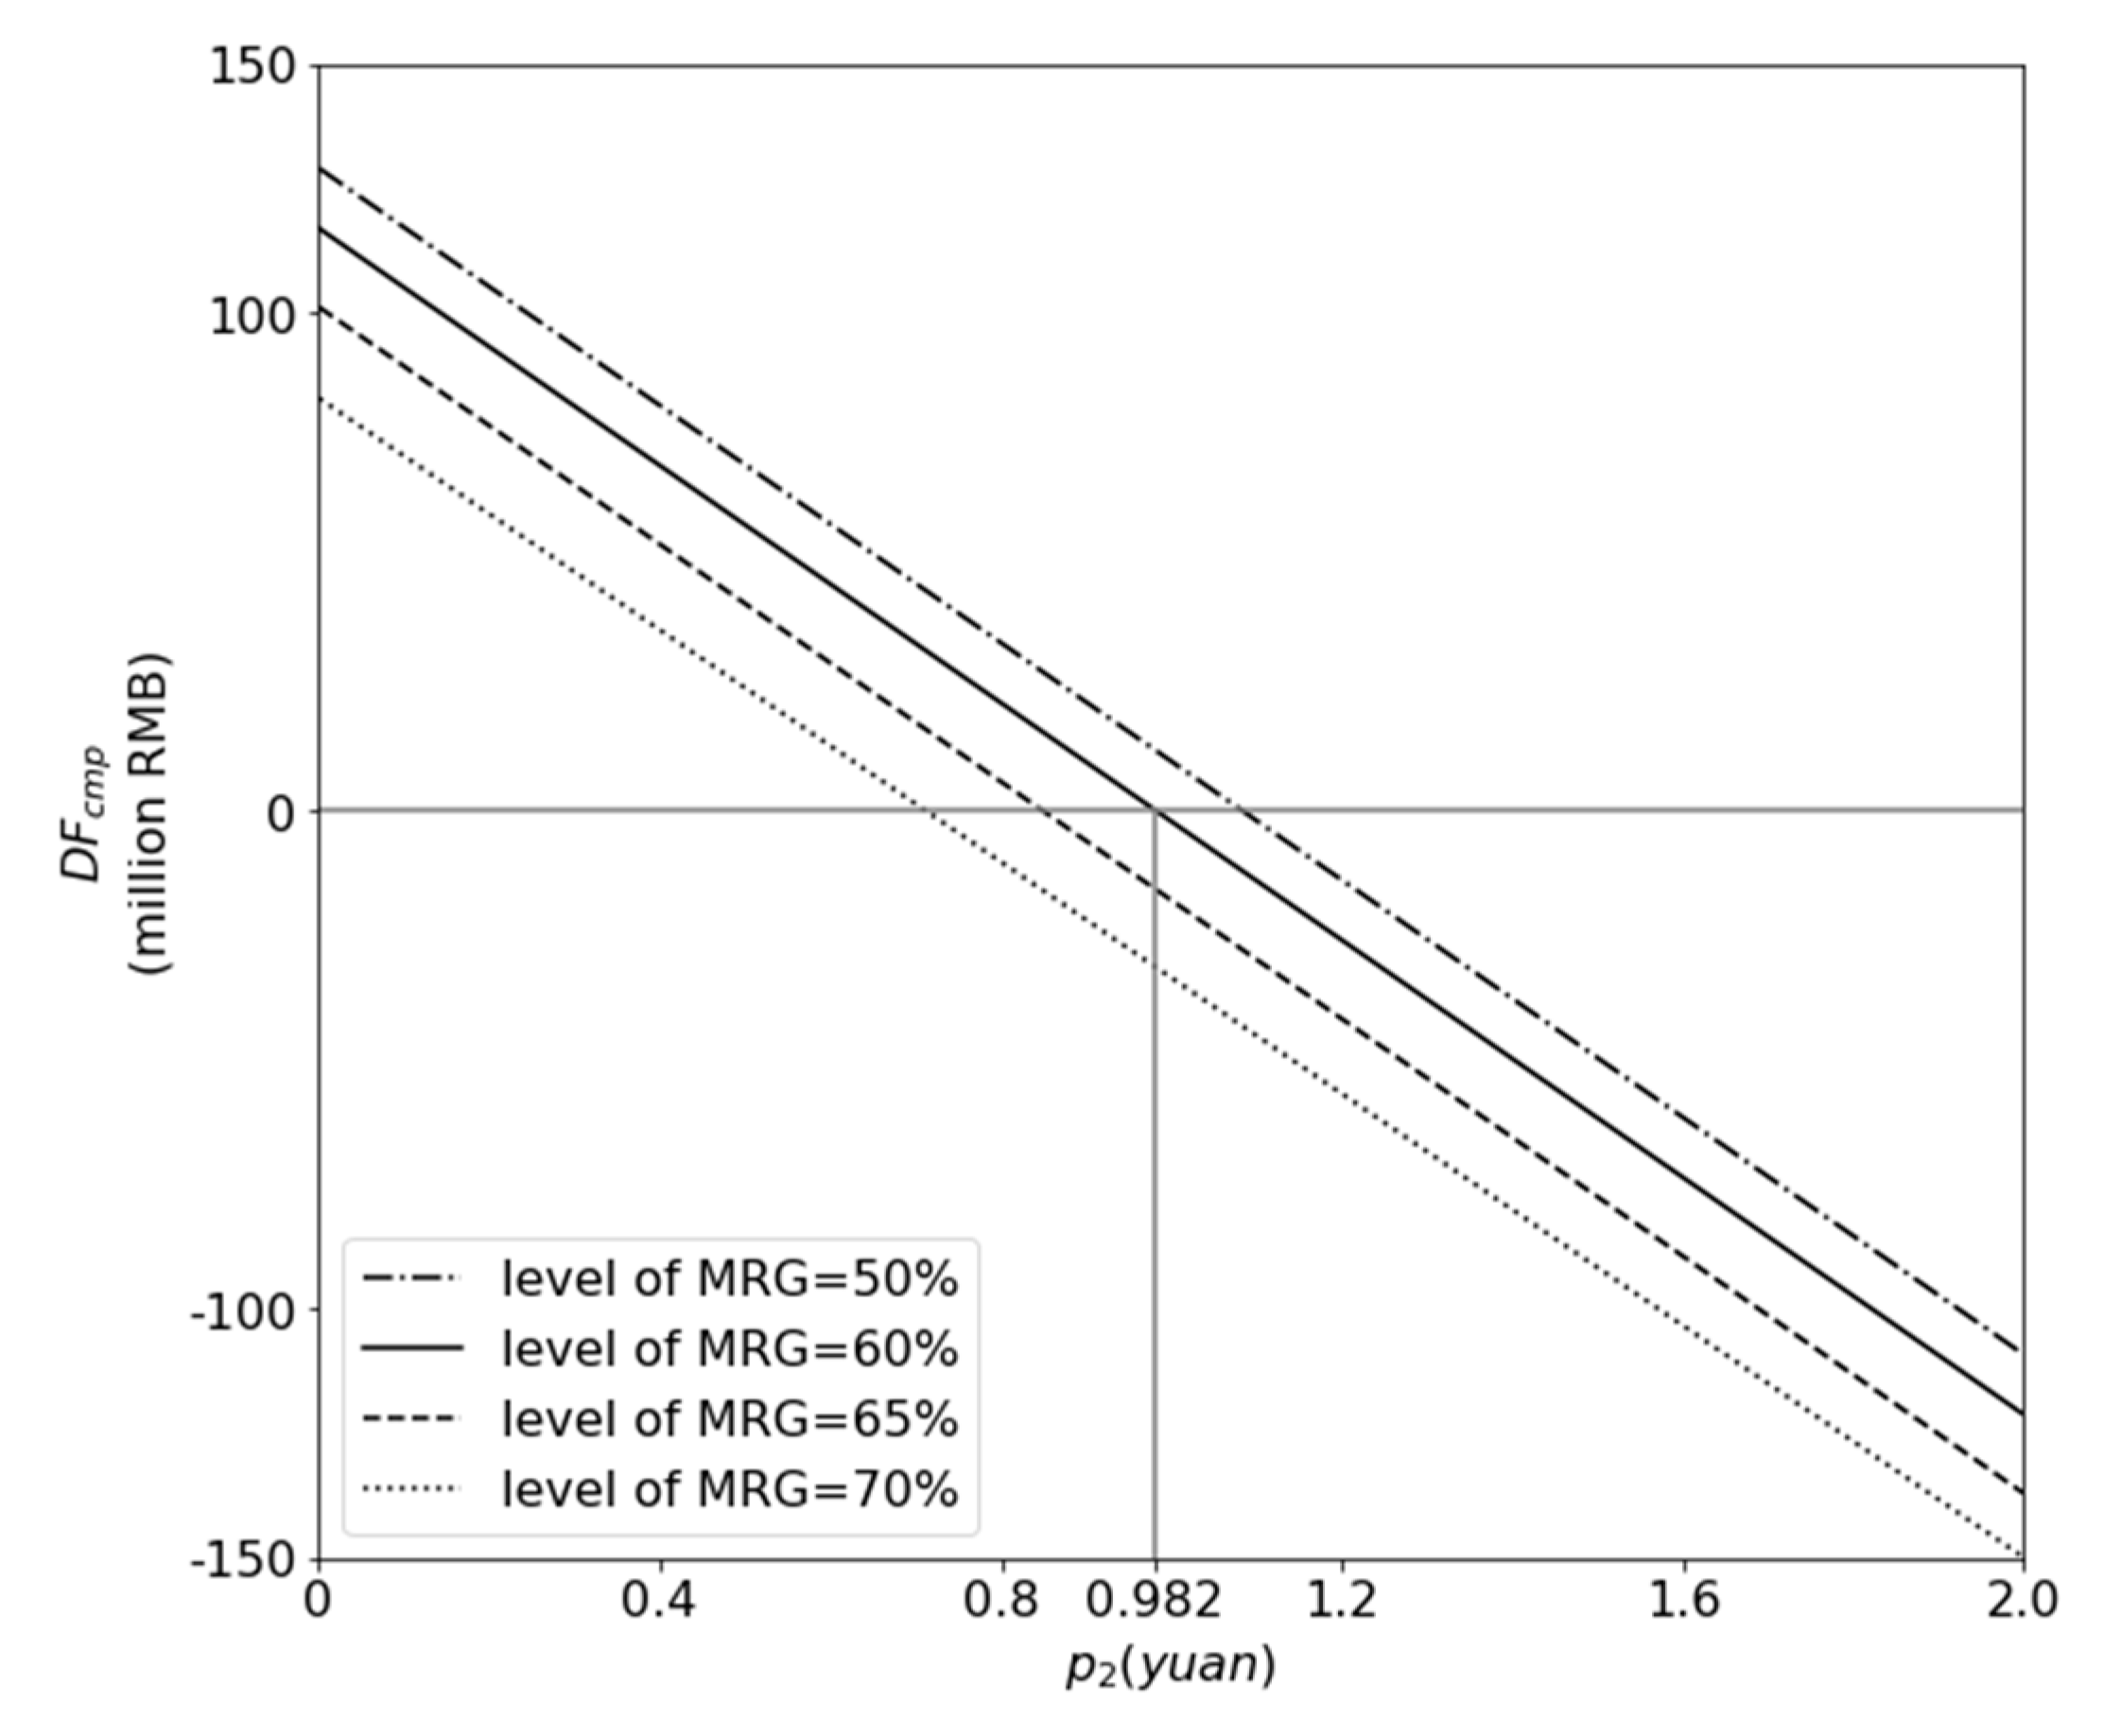
As the quantity of wastewater forecasts and the demand sharing mechanism are given, the government’s total service fee payments to the phase I and phase II projects are different under MRG or ER arrangements for the phase II project. Applying Equation (8) and Equation (11), the government’s total service fees payment can be calculated. Moreover, the conditions in this case satisfies the assumptions put forth in Equation (19). The change in the decision factor based solely on the unit price of the phase II project is illustrated in Figure 6.
As shown in Figure 6, when the unit price of phase II project is 0.982, the total government payment is the same for MRG or ER. However, the decision factor decreases as the phase II project’s unit price increases, that is, when the phase II project’s unit price is lower than 0.982. Here, it is better to provide an ER instead of MRG and allow more demand responsibility to be taken by the phase II project.
On the other hand, if the phase II project’s unit price is higher than 0.982, it is more optimal for more demand responsibility to be given by phase I. Therefore, ER is not recommended here, and a MRG is a better option for the sharing of demand risk in the phase II project. Additionally, as shown in Figure 6, an increase in the level of MRG lowers the unit price equilibrium of the phase II project. This means that with a higher level of MRG provided, the optimal choice for the government is to provide an ER. In practice, the implication is that if the concessionaire demands too much in revenue guarantee in order to share the demand risk, it may be instead more favorable to provide an ER and let the concessionaire bear the demand risk.
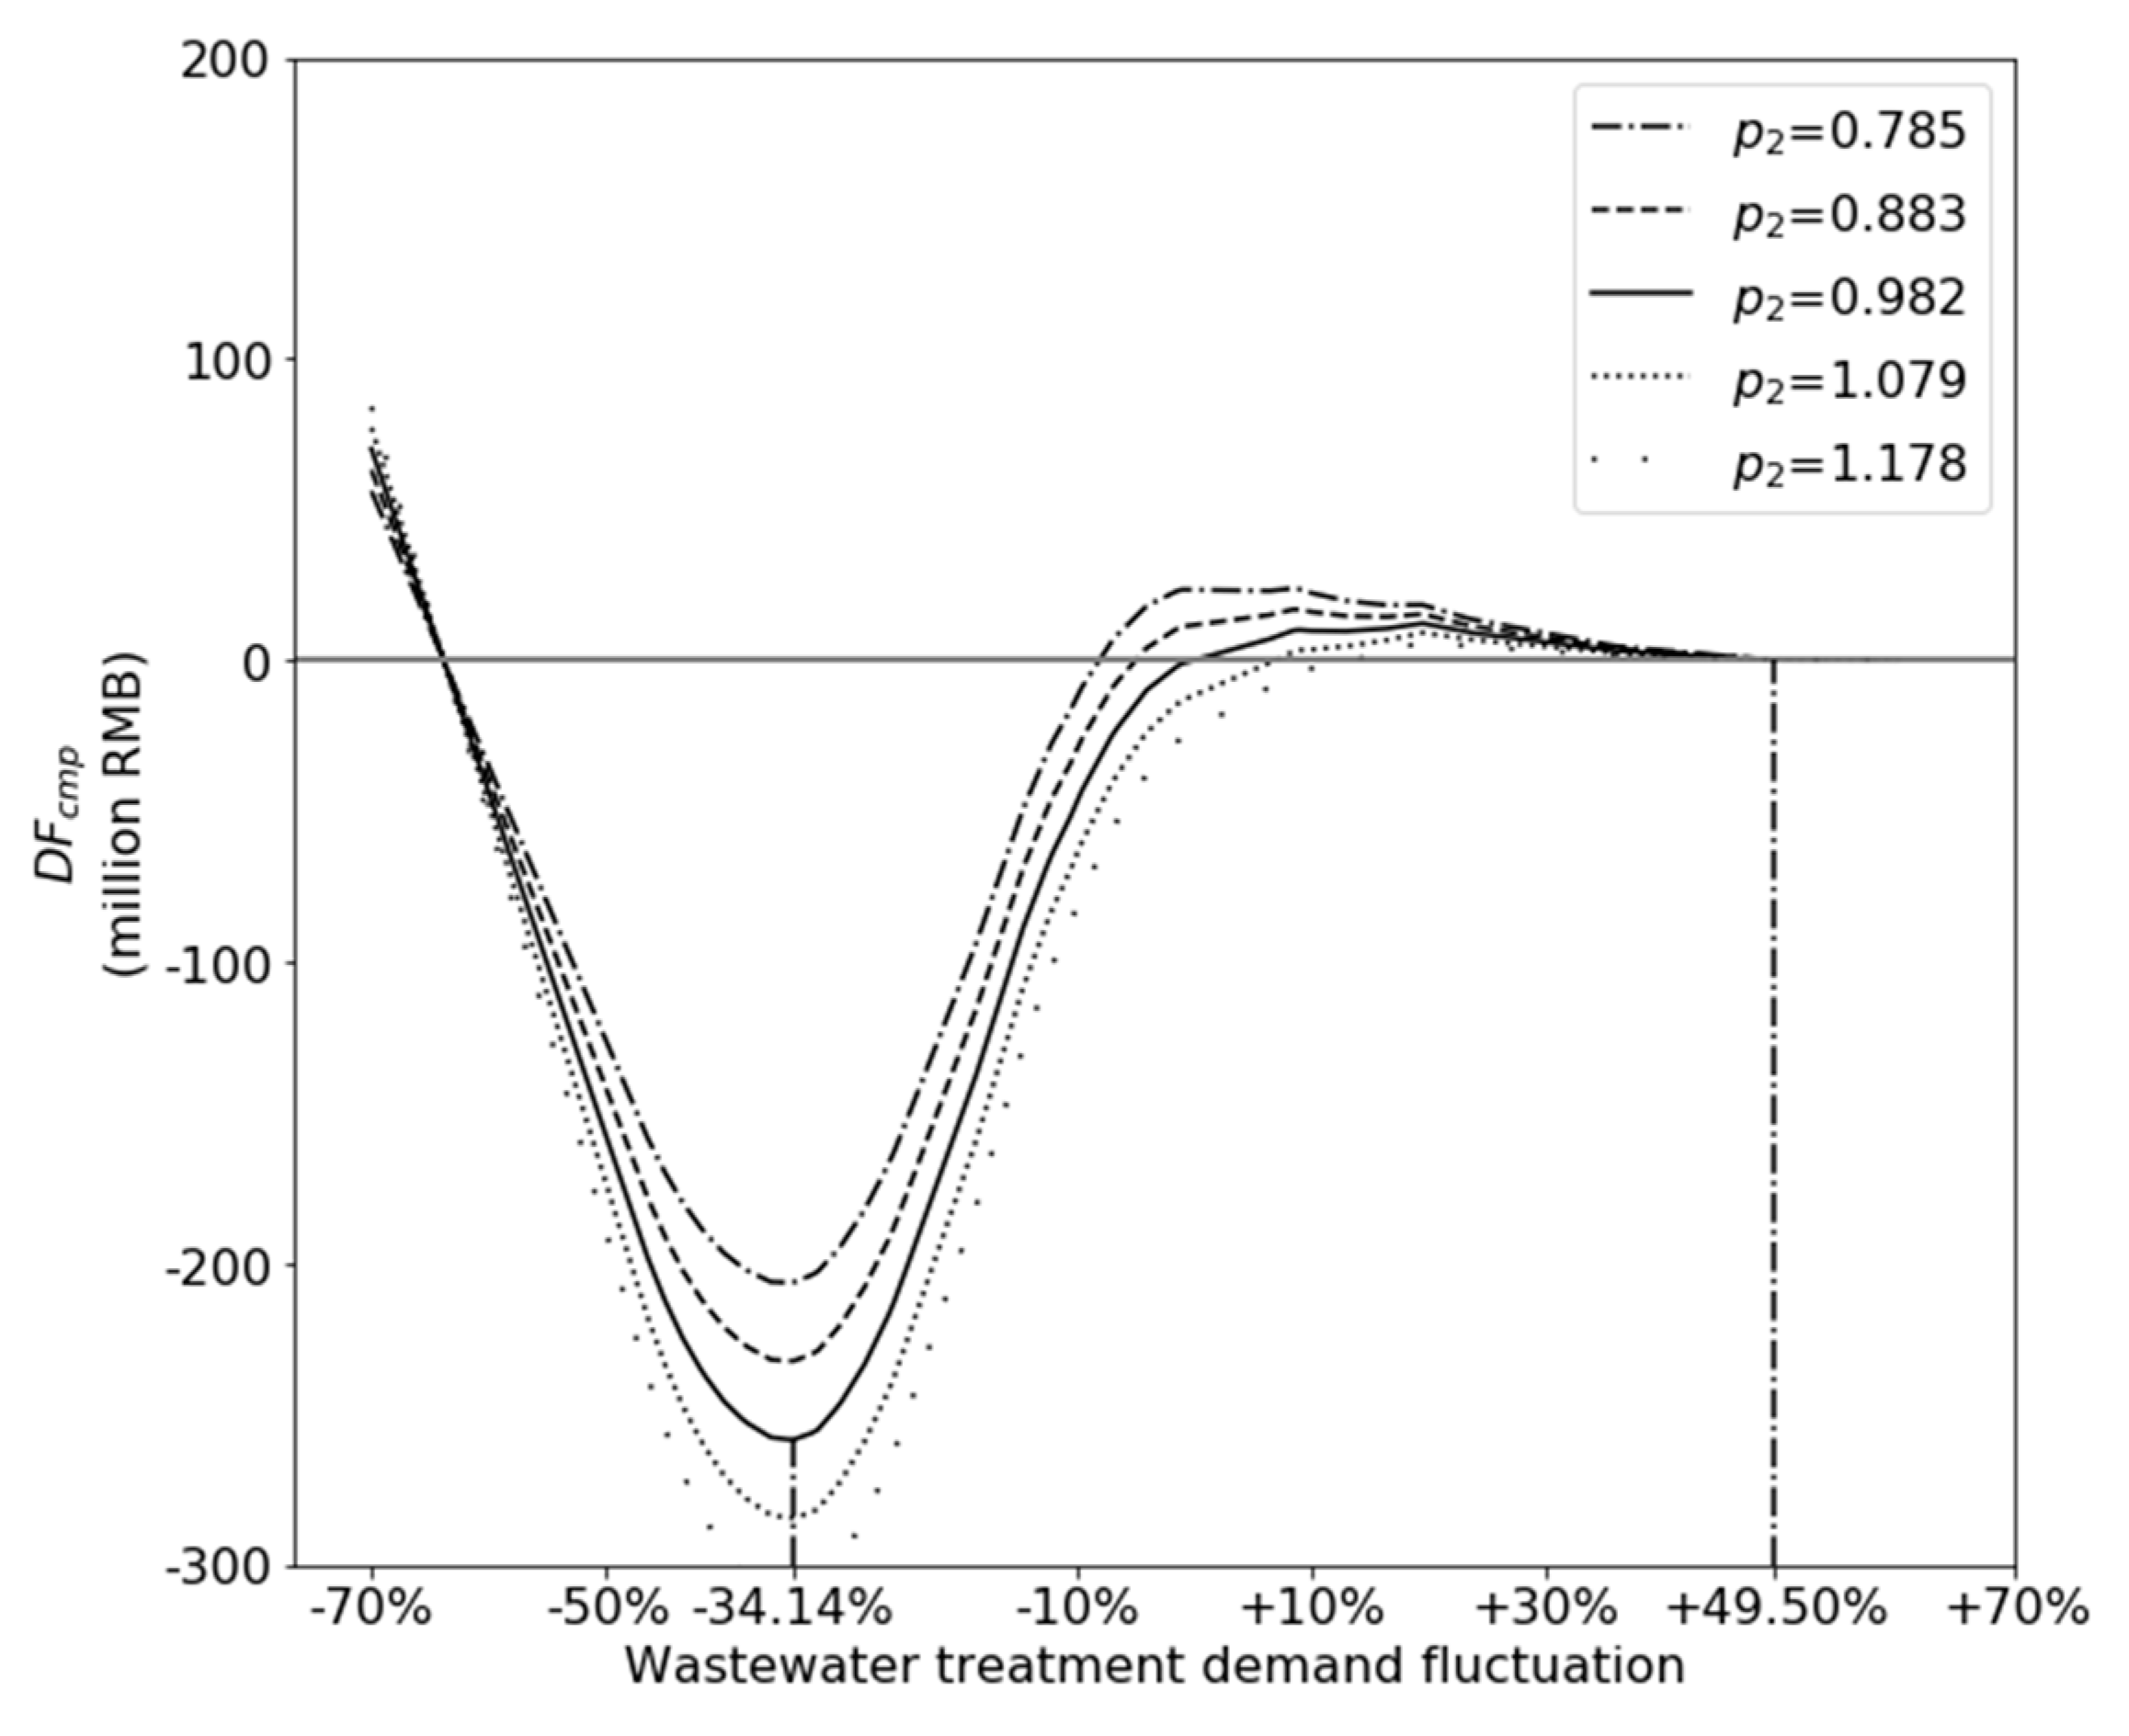
As already mentioned, the choice of providing an ER or a MRG is based on the wastewater treatment demand. Figure 7 illustrates the changes in the decision factor with the fluctuation in wastewater treatment demand. It shows that, given the unit price of the phase I and II projects, the relationship of demand and decision factor is not linear.
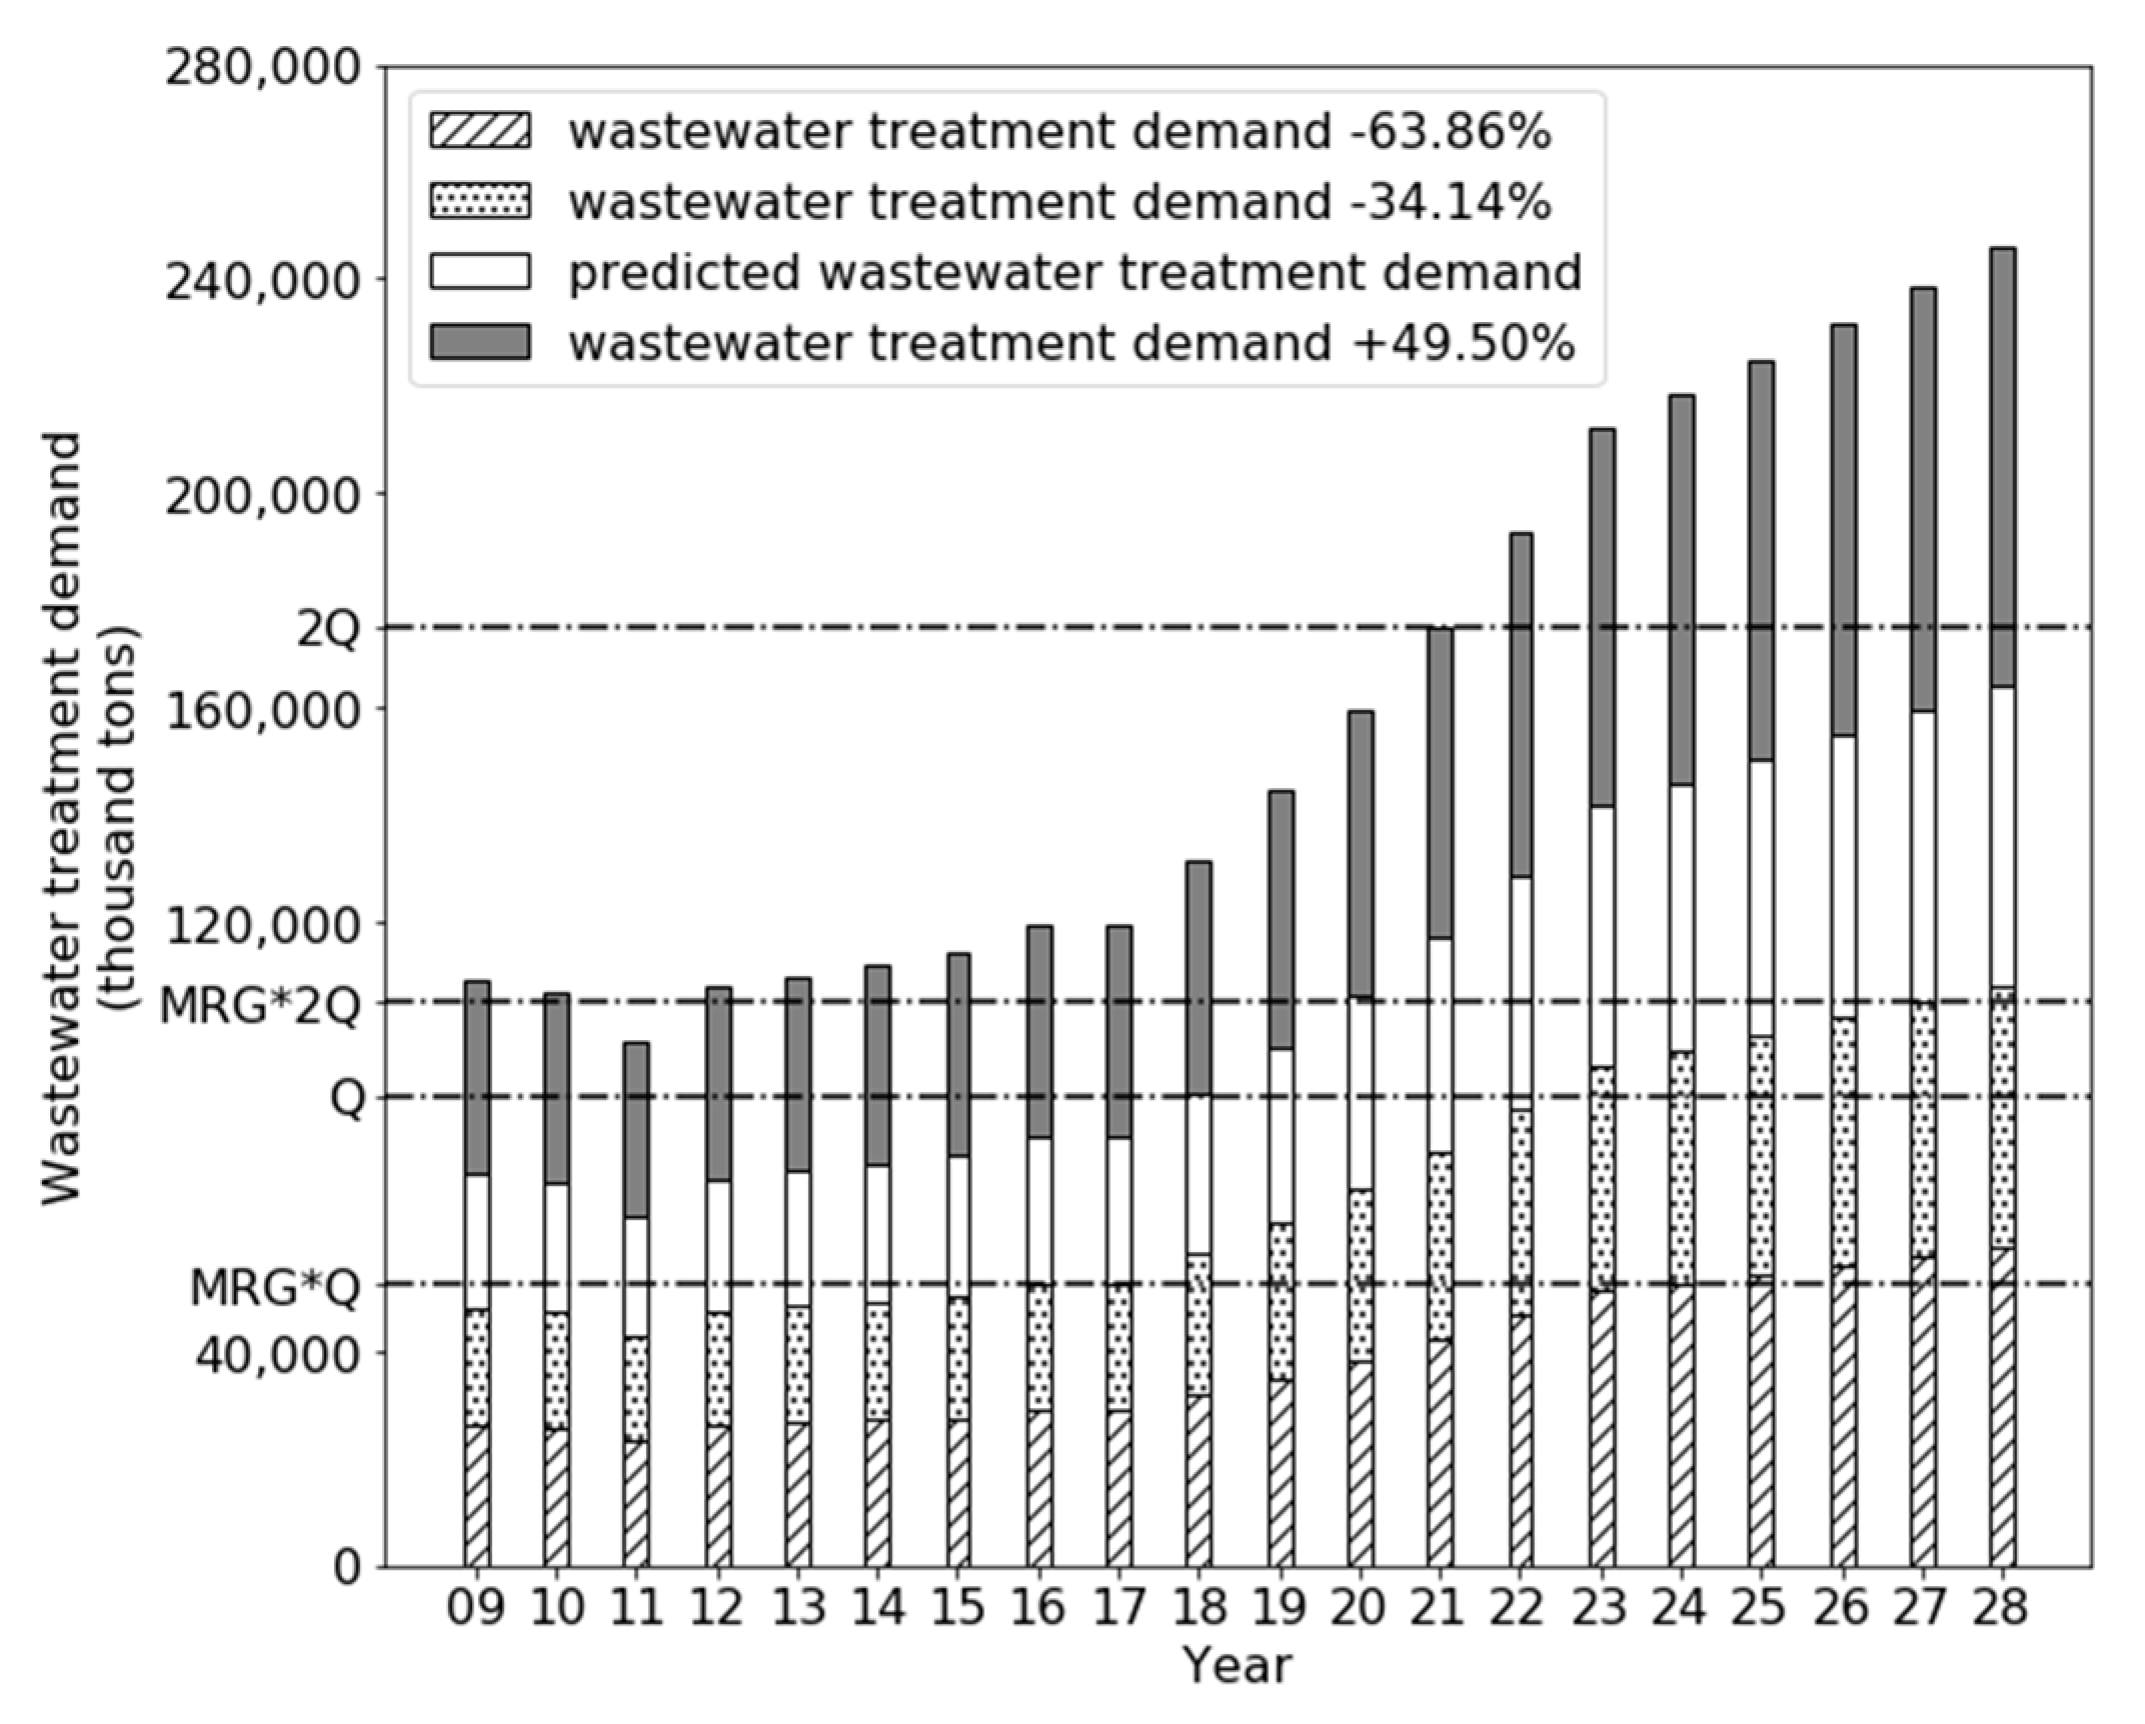
This illustrates the same trend that is seen in Table 1. As seen from Figure 7 and Figure 8, given the service unit price in this case, when the total demand is even lower than one project’s guaranteed demand, is positive, so it is better to allocate the phase II project with all the demand in order to save the government’s total cost. If the total demand is higher than one project’s MRG, is negative and it is better to provide a MRG to the phase II project.
For example, if the actual demand is shared based on the design capacity, and is lower than the level of MRG for each project, the government’s total payment will depend on the MRGs of both projects, which can be expensive for the government. In such situations, if the demand responsibility is first taken by the phase II project under an ER arrangement, then the residual demand can be allocated to the phase I project. By doing this, the government’s total payment will depend on the MRG of the phase I project and the actual demand for the phase II project, which can ultimately save costs for the government.
The value of declines as the total demand increases, so the minimum value of is located at the point where demand goes down 34%. From then on, the value of improves as the demand grows, and the MRG and ER decision is subsequently influenced significantly by the phase II project’s unit price (see Figure 7 and Table 1). The lower the phase II project’s unit price, the better it is to allocate more demand responsibility to the phase II project. This is where the advantage of providing an ER to the phase II project becomes obvious.
7. Conclusions and Future Work
As many PPPs around the world transition to their later years of operation, many projects may face the problem of higher demand for service provision, leading to expansion projects. In this study, a decision model for the selection between minimum revenue guarantee (MRG) and exclusive right (ER) for PPP wastewater treatment (WWT) expansion projects was developed, particularly in relation to the government’s service fee payments. The decision factor () was developed to help the government select an optimal incentive for the expansion PPP. The model illustrates that if the is less than zero, MRG is the optimal option, that is, it costs less for the government in relation to their total service fee payments. On the other hand, when the is more than zero, providing ER to the expansion project is optimal.
The key factors that influence the decision on providing MRG or ER are identified as the service demand, service unit price, and the level of MRG in the original (phase I) project. These factors were analyzed in detail in this study. The findings showed that the demand has an clear impact on the decision factor and when the demand is (much) higher than the total capacity of both the original and the expansion PPPs, providing either a MRG or an ER to the expansion project does not make a significant difference in relation to the government’s cost savings. In this case, the decision is mainly dependent on the expected service unit price. If the unit price of the expansion project is expected to be lower, it can be suggested that an ER is provided to the expansion project and at the same time, allocate more demand responsibility to the expansion project.
The developed model specifically examines the choice between MRG and ER in government remunerated expansion PPPs in WWT projects. This study is important as it lays the groundwork for analyzing government decisions related to PPP expansion projects. Therefore, this study contributes to the theory by adding to the existing knowledge of government guarantee mechanisms for PPPs in the water sector. In the practical domain, the model can be applied as an instrument by governments to make the initial decisions to choose between the two types of guarantees in PPP expansion projects in the WWT sector. Following this decision, the government can focus on a detailed design of the selected guarantee mechanism by considering related uncertainties and risks over the new concession period.
There are some limitations in this study that need to be mentioned. First, when modeling the total government payment, a discount rate of zero was used mainly because there are no standard requirements on what rate is used and generally, governments select the discount rate on a case by case basis. The choice of discount rate can influence the decision; however, the decision factor model can be easily adapted in practice by using an appropriate discount rate when the model is used.
Second, for the purposes of model simplification and better comparability, it was assumed that both phase I and phase II would have the same levels of MRGs. In practice, this may not be the case. Therefore, future studies can consider developing the model by examining various levels of MGR provided to the two projects.
Third, in the decision factor model, the two factors, demand and service unit price, were analyzed independently and their relationship was not considered. This was mainly because the demand is usually not sensitive to the service price fluctuation in the government remunerated PPP contracts such as in the case of the WWT case study analyzed in this research.
Finally, the uncertainty of demand was only covered in terms of its sensitivity, while the volatility of demand for each year was not considered as a random variable. These limitations, however, provide opportunities for further studies. As such, future subsequent studies are planned, specifically to develop a more comprehensive model that focuses on exploring the relationships of service price and demand as well as the uncertainty of demand in each year. Furthermore, modeling using more advanced methods such as Monte Carlo simulations is proposed to incorporate more data inputs and improve the accuracy of model prediction to help improve the decision effectiveness.
Author Contributions
Conceptualization, L.W. and G.W.; Methodology, L.W. and W.Z.; Validation, A.S. and G.W.; Formal analysis, L.W. and A.S.; Investigation, L.W. and W.Z.; Resources, A.S.; Data curation, W.Z.; Writing—original draft preparation, L.W. and A.S.; Writing—review and editing, A.S. and G.W.; Visualization, W.Z. All authors have read and agreed to the published version of the manuscript.
Funding
This study was financially supported by the National Natural Science Foundation of China (Project 71471138).
Conflicts of Interest
The authors declare no conflicts of interest.
References
- Das, R.; Laishram, B.; Jawed, M. Public participation in urban water supply projects—The case of South-West Guwahati, India. Water Res. 2019, 165, 114989. [Google Scholar] [CrossRef] [PubMed]
- Carbonara, N.; Pellegrino, R. Revenue guarantee in public–private partnerships: A win–win model. Constr. Manag. Econ. 2018, 36, 584–598. [Google Scholar] [CrossRef]
- Grimsey, D.; Lewis, M.K. Evaluating the risks of public private partnerships for infrastructure projects. Int. J. Proj. Manag. 2002, 20, 107–118. [Google Scholar] [CrossRef]
- Wang, L.; Zhang, X. Determining the value of standby letter of credit in transfer stage of a PPP project to control concessionaire’s opportunistic behavior. J. Manag. Eng. 2019, 35, 04019003. [Google Scholar] [CrossRef]
- Shrestha, A.; Chan, T.-K.; Aibinu, A.A.; Chen, C. Efficient risk transfer in PPP wastewater treatment projects. Util. Policy 2017, 48, 132–140. [Google Scholar] [CrossRef]
- Shrestha, A.; Tamošaitienė, J.; Martek, I.; Hosseini, M.R.; Edwards, D.J. A principal-agent theory perspective on PPP risk allocation. Sustainability 2019, 11, 6455. [Google Scholar] [CrossRef] [Green Version]
- Liu, J.; Yu, X.; Cheah, C.Y.J. Evaluation of restrictive competition in PPP projects using real option approach. Int. J. Proj. Manag. 2014, 32, 473–481. [Google Scholar] [CrossRef]
- Singh, L.B.; Kalidindi, S.N. Traffic revenue risk management through annuity model of PPP road projects in India. Int. J. Proj. Manag. 2006, 24, 605–613. [Google Scholar] [CrossRef]
- Heravi, G.; Hajihosseini, Z. Risk allocation in public–private partnership infrastructure projects in developing countries: Case study of the Tehran–Chalus toll road. J. Infrastruct. Syst. 2012, 18, 210–217. [Google Scholar] [CrossRef]
- Wibowo, A.; Permana, A.; Kochendörfer, B.; Kiong, R.T.L.; Jacob, D.; Neunzehn, D. Modeling contingent liabilities arising from government guarantees in Indonesian BOT/PPP toll roads. J. Constr. Eng. Manag. 2012, 138, 1403–1410. [Google Scholar] [CrossRef]
- Carbonara, N.; Costantino, N.; Pellegrino, R. Concession period for PPPs: A win–win model for a fair risk sharing. Int. J. Proj. Manag. 2014, 32, 1223–1232. [Google Scholar] [CrossRef]
- Wang, Y.; Liu, J. Evaluation of the excess revenue sharing ratio in PPP projects using principal–agent models. Int. J. Proj. Manag. 2015, 33, 1317–1324. [Google Scholar] [CrossRef]
- Li, H.; Lv, L.; Zuo, J.; Su, L.; Wang, L.; Yuan, C. Dynamic Reputation Incentive Mechanism for Urban Water Environment Treatment PPP Projects. J. Constr. Eng. Manag. 2020, 146, 04020088. [Google Scholar] [CrossRef]
- Dharmapuri Tirumala, V.R.R.S.; Tiwari, P.; Sawhney, A.; Kodumudi Pranatharthiharan, K. Analyzing Configurational Paths for Successful PPPs in Indian Urban Drinking Water Sector. J. Infrastruct. Syst. 2020, 26, 04020023. [Google Scholar] [CrossRef]
- Liu, Q.; Liao, Z.; Guo, Q.; Degefu, D.M.; Wang, S.; Jian, F. Effects of Short-Term Uncertainties on the Revenue Estimation of PPP Sewage Treatment Projects. Water 2019, 11, 1203. [Google Scholar] [CrossRef] [Green Version]
- Chiara, N.; Garvin, M.J.; Vecer, J. Valuing simple multiple-exercise real options in infrastructure projects. J. Infrastruct. Syst. 2007, 13, 97–104. [Google Scholar] [CrossRef] [Green Version]
- Wang, L.; Zhang, X. Bayesian analytics for estimating risk probability in PPP waste-to-energy projects. J. Manag. Eng. 2018, 34, 04018047. [Google Scholar] [CrossRef]
- Cruz, C.O.; Marques, R.C. Flexible contracts to cope with uncertainty in public–private partnerships. Int. J. Proj. Manag. 2013, 31, 473–483. [Google Scholar] [CrossRef]
- Wibowo, A. CAPM-based valuation of financial government supports to infeasible and risky private infrastructure projects. J. Constr. Eng. Manag. 2006, 132, 239–248. [Google Scholar] [CrossRef]
- Xiong, W.; Zhang, X. Concession renegotiation models for projects developed through public-private partnerships. J. Constr. Eng. Manag. 2014, 140, 04014008. [Google Scholar] [CrossRef]
- Chen, Q.; Shen, G.; Xue, F.; Xia, B. Real options model of toll-adjustment mechanism in concession contracts of toll road projects. J. Manag. Eng. 2018, 34, 04017040. [Google Scholar] [CrossRef]
- Brandao, L.E.T.; Saraiva, E. The option value of government guarantees in infrastructure projects. Constr. Manag. Econ. 2008, 26, 1171–1180. [Google Scholar] [CrossRef]
- Pellegrino, R.; Carbonara, N.; Costantino, N. Public guarantees for mitigating interest rate risk in PPP projects. Built Environ. Proj. Asset Manag. 2019, 9, 248–261. [Google Scholar] [CrossRef]
- Ng, S.T.; Xie, J.; Cheung, Y.K.; Jefferies, M. A simulation model for optimizing the concession period of public–private partnerships schemes. Int. J. Proj. Manag. 2007, 25, 791–798. [Google Scholar] [CrossRef]
- Zhang, X. Win–win concession period determination methodology. J. Constr. Eng. Manag. 2009, 135, 550–558. [Google Scholar] [CrossRef]
- Hanaoka, S.; Palapus, H.P. Reasonable concession period for build-operate-transfer road projects in the Philippines. Int. J. Proj. Manag. 2012, 30, 938–949. [Google Scholar] [CrossRef]
- Sun, Y.; Zhang, L. Balancing public and private stakeholder interests in BOT concessions: Minimum revenue guarantee and royalty scheme applied to a water treatment project in China. J. Constr. Eng. Manag. 2015, 141, 04014070. [Google Scholar] [CrossRef]
- Liu, J.; Cheah, C.Y. Real option application in PPP/PFI project negotiation. Constr. Manag. Econ. 2009, 27, 331–342. [Google Scholar] [CrossRef]
- Ashuri, B.; Kashani, H.; Molenaar, K.; Lee, S.; Lu, J. Risk-neutral pricing approach for evaluating BOT highway projects with government minimum revenue guarantee options. J. Constr. Eng. Manag. 2012, 138, 545–557. [Google Scholar] [CrossRef]
- Hawas, F.; Cifuentes, A. Valuation of projects with minimum revenue guarantees: A Gaussian copula–based simulation approach. Eng. Econ. 2017, 62, 90–102. [Google Scholar] [CrossRef]
- Cheah, C.Y.; Liu, J. Valuing governmental support in infrastructure projects as real options using Monte Carlo simulation. Constr. Manag. Econ. 2006, 24, 545–554. [Google Scholar] [CrossRef]
- Park, T.; Kim, B.; Kim, H. Real option approach to sharing privatization risk in underground infrastructures. J. Constr. Eng. Manag. 2013, 139, 685–693. [Google Scholar] [CrossRef]
- Carmichael, D.G.; Nguyen, T.A.; Shen, X. Single treatment of PPP road project options. J. Constr. Eng. Manag. 2019, 145, 04018122. [Google Scholar] [CrossRef]
- Shrestha, A.; Aibinu, A.; Chan, T.; Chen, C. Risk allocation in public private partnerships in China’s water projects: A principal agent approach. In Water Resources Management VII; Brebbia, C.A., Ed.; WIT Press: South Hampton, NH, USA, 2013; Volume 171, pp. 85–96. [Google Scholar]
- Burke, R.; Demirag, I. Changing perceptions on PPP games: Demand risk in Irish roads. Crit. Perspect. Account. 2015, 27, 189–208. [Google Scholar] [CrossRef]
- Carpintero, S.; Helby Petersen, O. Public–private partnerships (PPPs) in local services: Risk-sharing and private delivery of water services in Spain. Local Gov. Stud. 2016, 42, 958–979. [Google Scholar] [CrossRef]
- Jang, W.; Yu, G.; Jung, W.; Kim, D.; Han, S.H. Financial conflict resolution for public-private partnership projects using a three-phase game framework. J. Constr. Eng. Manag. 2018, 144, 05017022. [Google Scholar] [CrossRef]
- Chiara, N.; Kokkaew, N. Alternative to government revenue guarantees: Dynamic revenue insurance contracts. J. Infrastruct. Syst. 2013, 19, 287–296. [Google Scholar] [CrossRef]
- Song, J.; Hu, Y.; Feng, Z. Factors influencing early termination of PPP projects in China. J. Manag. Eng. 2018, 34, 05017008. [Google Scholar] [CrossRef]
Figure 1.
Concession periods of the phase I and phase II projects.

Figure 2.
Simulation process for decision factor calculation.

Figure 3.
Wastewater quantity in the Xin’an and Xixiang areas.

Figure 4.
Demand sharing when MRG is provided to the phase II project.

Figure 5.
Demand sharing where ER is provided to the phase II project.

Figure 6.
Relationships between the decision factor and the unit price of the phase II project.

Figure 7.
Change in decision factor based on the wastewater treatment demand fluctuation.

Figure 8.
Demand fluctuation during the concession period.


Table 1.
Decision factor in different scenarios of service demand.
| No. | The during the Concession Period | Selection of Government Support | |
|---|---|---|---|
| 1 | ER | ||
| 2 | MRG | ||
| 3 | MRG | ||
| 4 | depends on the and | depends on the and | |
| 5 | depends on the and | depends on the and | |
| 6 | No difference between MRG and ER |
Table 2.
Decision factor in different scenarios of unit price.
| No. | The during the Concession Period | Unit Price | Selection of Government Support | |
|---|---|---|---|---|
| 1 | ER | |||
| 2 | MRG | |||
| 3 | ER | |||
| 4 | MRG |
Table 3.
Detailed information of the Shenzhen Gushu Wastewater Treatment Plant (Phase I).
| No. | Description | Data/information |
|---|---|---|
| 1 | Location | Shenzhen City, China |
| 2 | Total investment (Capital expenditure) | RMB 330 Million (USD 47.8 Million) |
| 3 | Wastewater treatment capacity (tons/day) | 240,000 |
| 4 | Concession period (years) | 22 |
| 4.1 | Construction period (years) | 2 |
| 4.2 | Operation period (years) | 20 |
| 5 | Operation started at (year) | 2009 |
| 6 | Operation expired at (year) | 2028 |
| 7 | Unit price (RMB/ton) | 1.377 |
| 8 | MRG (percentage of designed capacity) | 60% |
Note: Data from the Phase I project contract; Capex based on 2019 values; USD 1 = RMB 6.91 (2019).
Table 4.
Wastewater treatment demand in the Xin’an and Xixiang areas.
| Year | Demand (Thousand Tons/Year) | Year | Demand (Thousand Tons/Year) |
|---|---|---|---|
| 2009 | 73,000 | 2020 | 106,548 |
| 2010 | 71,540 | 2021 | 117,202 |
| 2011 | 65,335 | 2022 | 128,923 |
| 2012 | 72,150 | 2023 | 141,815 |
| 2013 | 73,550 | 2024 | 146,069 |
| 2014 | 74,977 | 2025 | 150,451 |
| 2015 | 76,432 | 2026 | 154,965 |
| 2016 | 79,942 | 2027 | 159,614 |
| 2017 | 73,000 | 2028 | 164,402 |
| 2018 | 71,540 | 2029 | 169,330 |
| 2019 | 96,861 | 2030 | 175,200 |
Table 5.
Detailed information of Shenzhen Gushu Wastewater Treatment Plant (Phase II).
| Description | Data/Information |
|---|---|
| Location | Shenzhen City, China |
| Total investment (Capital expenditure) | RMB 1122.5 Million (USD 162.4 Million) |
| Wastewater treatment capacity (tons/day) | 240,000 |
| Concession period (years) | 22 |
| Construction period (years) | 2 |
| Operation period (years) | 20 |
| Concession started at (year) | 2019 |
| Operation started at (year) | 2021 |
| Unit price (RMB/ton) | To de determined through tendering |
Note: Data from the Phase II business case; Capex based on 2019 values; USD 1 = RMB 6.91 (2019).
Publisher’s Note: MDPI stays neutral with regard to jurisdictional claims in published maps and institutional affiliations. |
© 2020 by the authors. Licensee MDPI, Basel, Switzerland. This article is an open access article distributed under the terms and conditions of the Creative Commons Attribution (CC BY) license (http://creativecommons.org/licenses/by/4.0/).
Share and Cite
MDPI and ACS Style
Wang, L.; Shrestha, A.; Zhang, W.; Wang, G. Government Guarantee Decisions in PPP Wastewater Treatment Expansion Projects. Water 2020, 12, 3352. https://0-doi-org.brum.beds.ac.uk/10.3390/w12123352
AMA Style
Wang L, Shrestha A, Zhang W, Wang G. Government Guarantee Decisions in PPP Wastewater Treatment Expansion Projects. Water. 2020; 12(12):3352. https://0-doi-org.brum.beds.ac.uk/10.3390/w12123352
Chicago/Turabian StyleWang, Liguang, Asheem Shrestha, Wen Zhang, and Guangbin Wang. 2020. "Government Guarantee Decisions in PPP Wastewater Treatment Expansion Projects" Water 12, no. 12: 3352. https://0-doi-org.brum.beds.ac.uk/10.3390/w12123352
Note that from the first issue of 2016, this journal uses article numbers instead of page numbers. See further details here.