Article

Cost–Benefit Evaluation of Decentralized Greywater Reuse Systems in Rural Public Schools in Chile

by
Carolina Rodríguez
1,2,
Rafael Sánchez
3,
Natalia Rebolledo
4,
Nicolás Schneider
4,
Jennyfer Serrano
5 and
Eduardo Leiva
1,2,*
1
Departamento de Ingeniería Hidráulica y Ambiental, Pontificia Universidad Católica de Chile, Avenida Vicuña Mackenna 4860, Macul, Santiago 7820436, Chile
2
Departamento de Química Inorgánica, Facultad de Química y de Farmacia, Pontificia Universidad Católica de Chile, Avenida Vicuña Mackenna 4860, Macul, Santiago 7820436, Chile
3
Instituto de Geografía, Pontificia Universidad Católica de Chile, Avda. Vicuña Mackenna 4860, Santiago 7820436, Chile
4
Fundación un Alto en el Desierto, Omar Elorza 704, Ovalle 1842274, Chile
5
Escuela de Biotecnología, Universidad Mayor, Camino La Pirámide 5750, Huechuraba, Santiago 8580745, Chile
*
Author to whom correspondence should be addressed.
Submission received: 5 November 2020 / Revised: 30 November 2020 / Accepted: 5 December 2020 / Published: 10 December 2020
(This article belongs to the Special Issue The Use of Greywater and Wastewater for Irrigation)

Abstract

:
Water scarcity is one of the most important climatic threats in recent times. In Chile, the north and north-central areas, with predominantly arid or semi-arid climates, have been strongly affected by the low availability of water, as well as by overexploitation of water resources derived from the negative effect caused by some sectors of the economy such as agriculture and mining. Only 53% of households in rural areas in Chile have access to drinking water from a public network. To date, some pilot greywater treatment systems have been implemented in rural public schools. This paper presents an economic analysis of pilot systems for greywater treatment from three case studies. The results showed that the implementation of these systems would not be economically feasible, since the initial investment costs can exceed USD 5200, which is not offset by the water savings. However, other benefits, such as thermal regulation, better life quality, and the feeling of well-being and satisfaction of students and teachers should be considered to be paramount for the evaluation of treatment systems. In addition, current levels of treated greywater could allow irrigation of 6.24, 5.68, and 3.56 m2/person in the Alejandro Chelén, El Guindo, and Pedro de Valdivia schools, respectively. These results contribute to a better understanding of the social role that should be applied to the evaluation of ecological systems that save water and improve the well-being of the population.

1. Introduction

Water scarcity is one of the most damaging risks facing the world today [1]. Over two billion people live in water-scarce regions and over four billion experience severe water shortage conditions at least one month a year [2,3]. Some of the main factors that have caused and accelerated water scarcity in the world are population growth, changes in consumption habits, and climate change [1,4]. The concept of water scarcity refers to the lack of physical availability of water, however, water scarcity also involves multiple factors, such as economical and social. Countries with sufficient renewable water resources may have shortages due to lack of infrastructure, poor water quality, lack of management capacity, and environmental aspects [5]. Therefore, water scarcity should be understood from a water resources point of view and also as a social and political problem, where resource management has a fundamental role [6,7].
In Chile, water scarcity has also become a problem of great concern. The geographical distribution of water availability is quite uneven [8,9]. The north-central zone of Chile, with a predominant arid and semi-arid climate, has an average water availability between 52 m3/person/year in the Antofagasta Region (21–26° S, 69–70° W) and 1020 m3/person/year in the Coquimbo Region (29–32° S, 70–71° W) [10]. This entire area is below the threshold for sustainable development of 1700 m3/person/year [1,11]. Thus, it is necessary to promote a change in consumption habits and improve the management of water resources to respond to future scenarios with greater water scarcity, through the development of technologies to make the use of water more efficient.
The areas with the greatest water scarcity in Chile present strong economic activity, mainly related to intensive agriculture in the central zone and mining in the north zone [8,12,13,14,15]. In regions with predominant mining activity, the consumptive demand for water for this activity exceeds 50% of the total water availability, while in predominantly agricultural areas, the water demand exceeds 80% of the total water availability [16]. This has caused serious problems related to the availability of water for human consumption. Currently, about 300,000 rural households in Chile do not have the necessary infrastructure to supply drinking water [17].
In this scenario, from a circular economy perspective, water recycling and reuse has become a relevant alternative [18]. The reuse of greywater has become a viable alternative in recent times [19,20]. Greywater is defined as domestic wastewater that excludes water from the toilet [21]. In general, these waters can be reused after simple treatments for non-potable uses [19]. In 2018, the law no. 21,075 was enacted in Chile, which regulates the collection, reuse, and disposal of greywater for urban uses, irrigation of recreational areas, and ornamental irrigation [9,22]. However, this law does not distinguish between urban and rural areas. In particular, rural areas are the most affected by access to water and sanitation, and they are an important target population in the implementation of greywater treatment systems. According to data from 2017, only 53% of households in rural areas in Chile have access to drinking water from the public network. About 28% of households are supplied from water wells, 12% from rivers or water channels, and 7% by cistern trucks [23], while 47.2% of the rural population does not have a formal drinking water supply [17]. Greywater treatment can be a sustainable alternative to reduce the pressures on water resources. However, there are still several barriers that need to be considered, such as public acceptance of water reuse and the technical and economic feasibility of the projects [21].
One of the main barriers to the implementation of greywater treatment systems corresponds to economic feasibility. The initial investment for the installation of the systems is usually higher than USD 1000 and operating and maintenance costs are around USD 165/year [21,24]. The economic factor and poverty, as well as other restrictive aspects imposed by law, such as those related to monitoring and control, could limit the viability of applying greywater treatment systems in rural areas. In this context, some foundations have promoted greywater reuse initiatives in areas affected by drought. In particular, the Un Alto en el Desierto Foundation in collaboration with the Pontificia Universidad Católica de Chile has worked on the implementation of pilot treatment systems for reusing greywater in rural public schools. These initiatives have been financed with competitive funds awarded under different projects, which has sustained the initial investment. However, to extend these initiatives to other establishments, an economic analysis is necessary to determine the economic and social feasibility of these projects.
In this work, three greywater reuse pilot projects implemented in rural schools in the Coquimbo Region, Chile, were economically and socially analyzed. This region is characterized by having a high risk of water scarcity due to the decrease in rainfall during the last years and the extensive agricultural activity developed in the area [8,9]. For this study, the capital, operating, and maintenance costs of the treatment systems, as well as the environmental costs, were determined. The benefits were quantified in terms of water savings and the environmental benefit associated with green areas. Additionally, the environmental and social benefits that treatment systems can bring to these communities were discussed. A sensitivity analysis was also carried out on the frequency of maintenance of the systems, investment costs, discount rate, green area costs, and the amount greywater treated per capita. These results contribute to a better understanding of the economic aspects involved in low-scale greywater treatment systems.

2. Materials and Methods
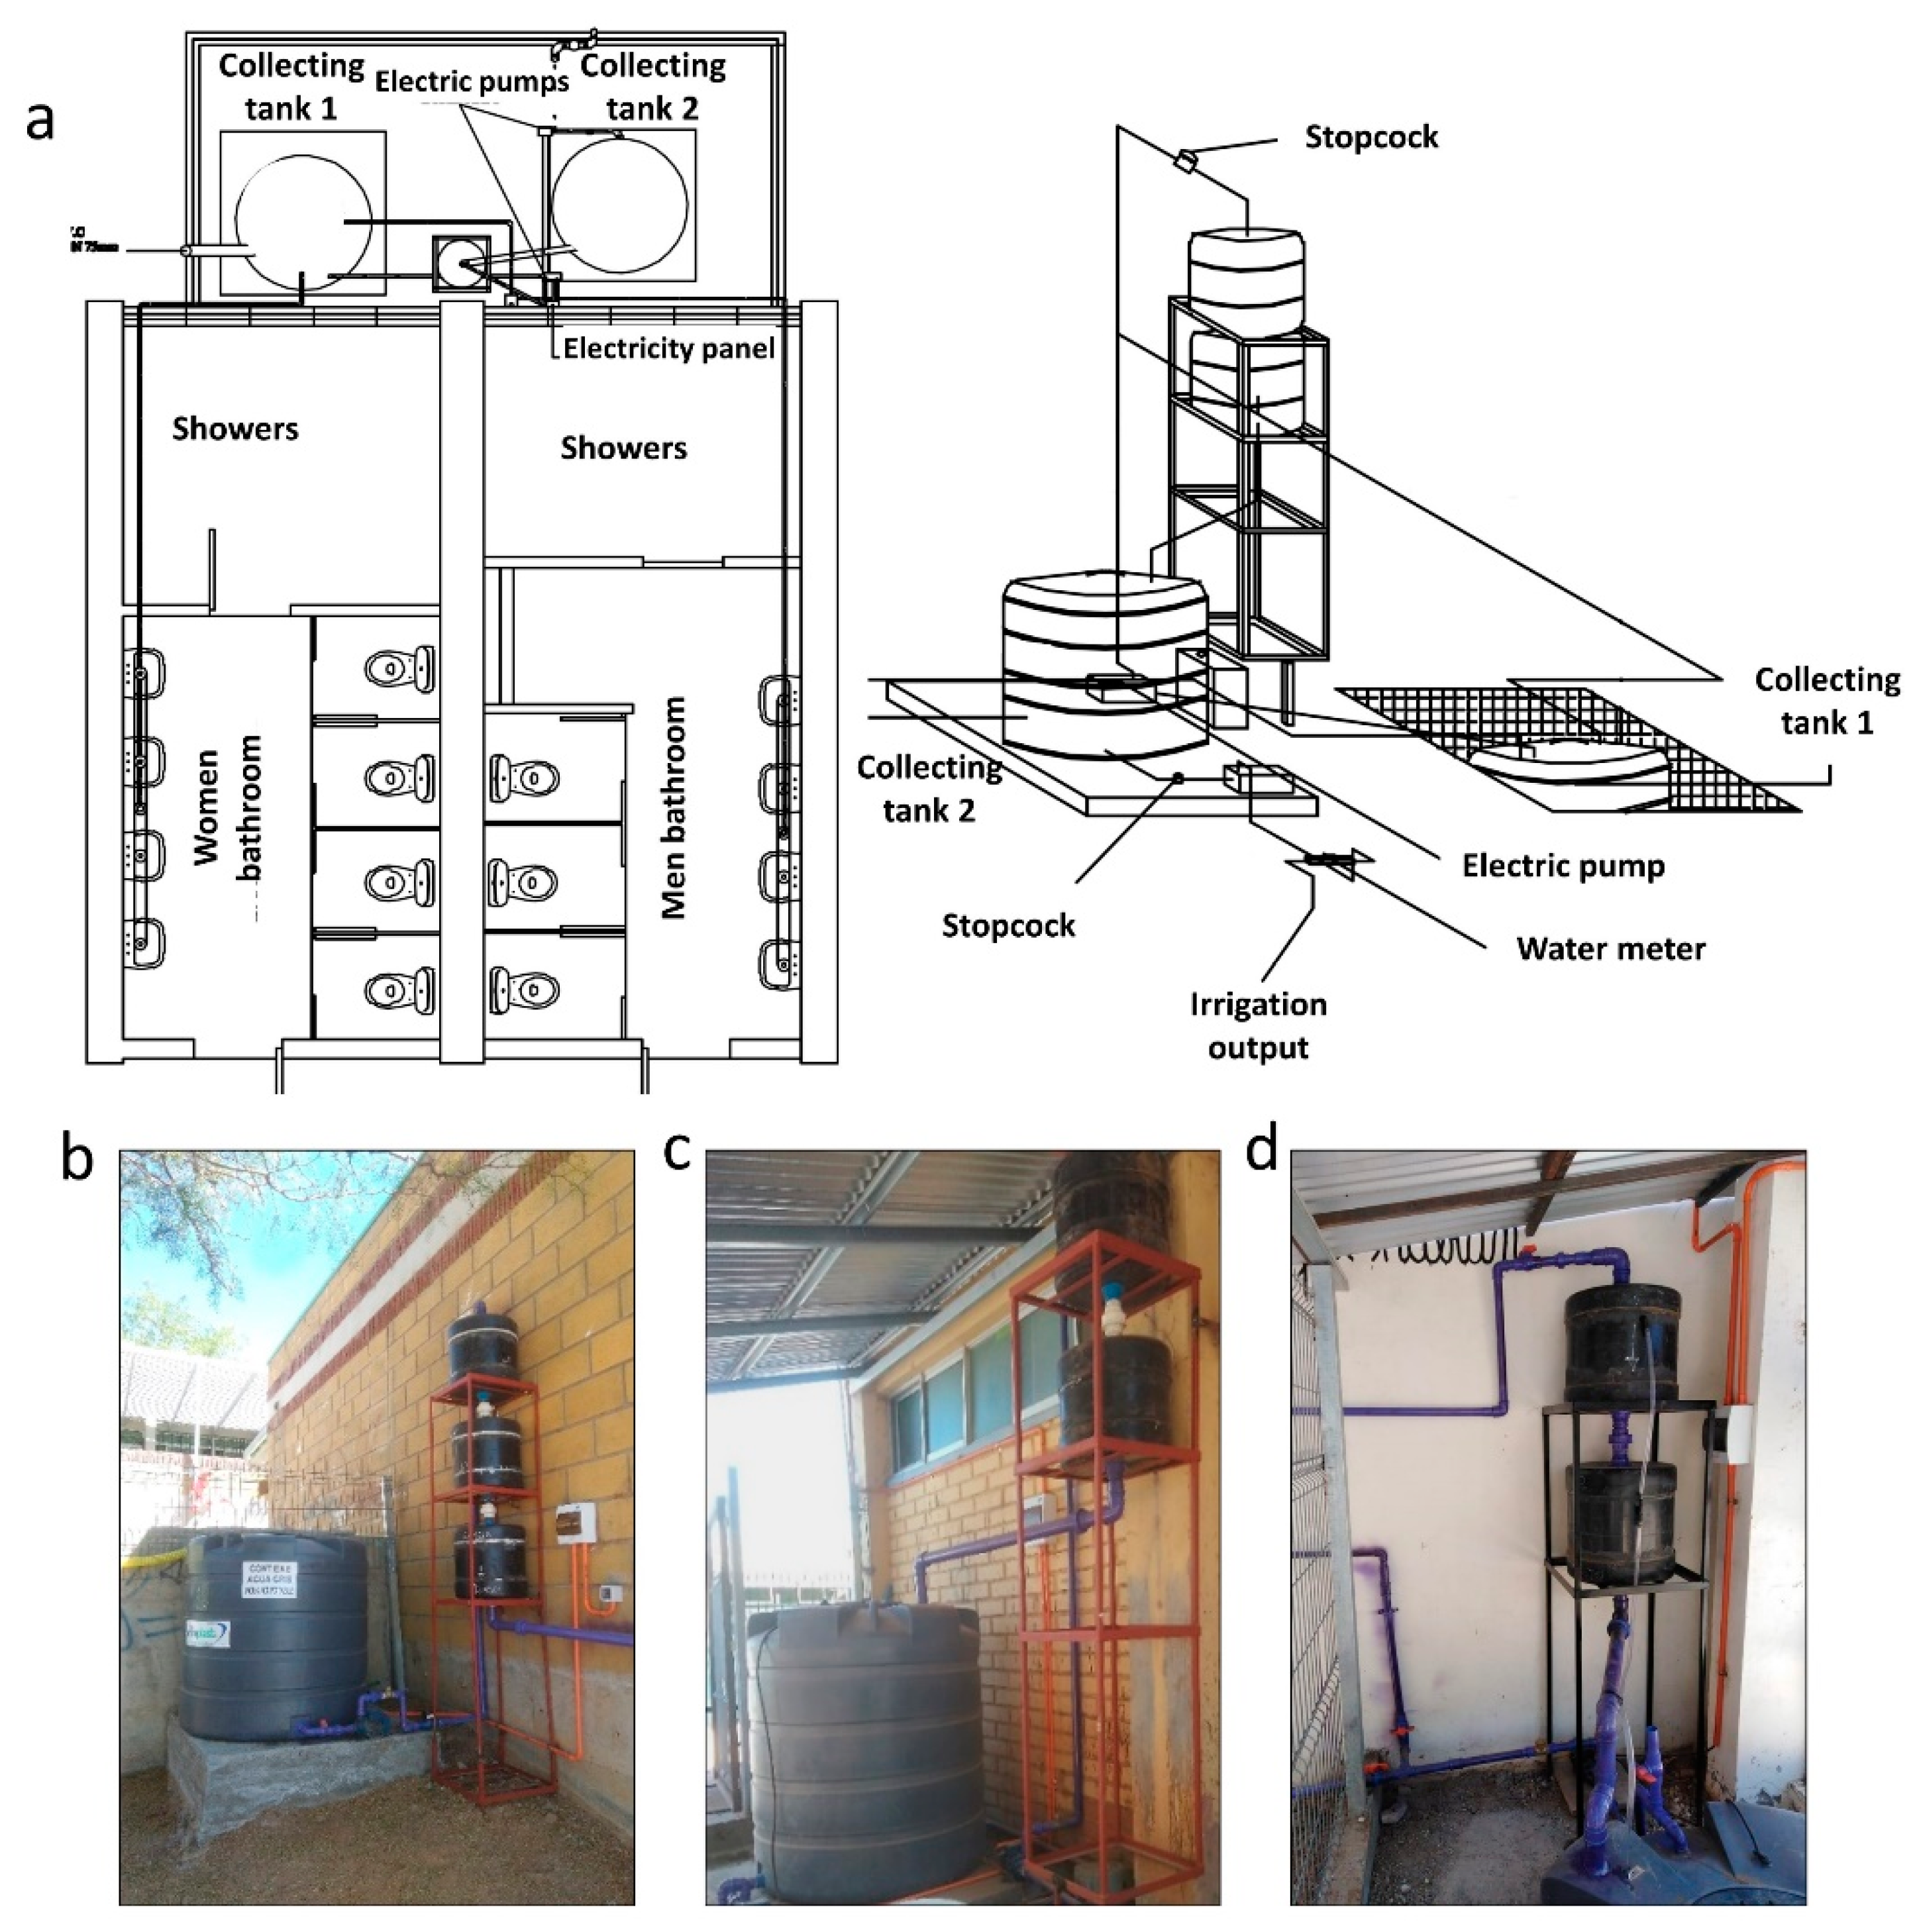
2.1. Study Cases

Three rural public schools in the Coquimbo Region, Chile were chosen as case studies (Figure 1). The Alejandro Chelén School (30.88° S, 71.01° W) has 350 students and 70 workers, therefore, in total, there are 420 people at the establishment. The school is supplied with water through the services of a sanitary company. The school has a pilot greywater treatment system consisting of 3 sections of filters in series, two sections composed of modified activated carbon and one section composed of zeolite. The El Guindo School (30.64° S, 71.11° W) has 93 students and 28 workers, which gives a total of 121 members at the establishment. The school is supplied by self-managed rural potable water systems (APR) and has a pilot treatment system made up of two sections of activated carbon in series. Finally, the Pedro de Valdivia School (31.11° S, 71.16° W) has 106 students and 27 workers, for a total of 133 members at the school. This school is supplied by APR (1–10 m3 per week) and by cistern truck (25 m3 per week). Currently, it has a pilot greywater treatment system, which consists of two activated carbon filter sections, as in the case of the El Guindo School. These data are summarized in Table 1. Additionally, the quality of the treated greywater for the schools during the pilot phase is also presented in Table 1.

2.2. Quantitative Economic Analysis

The factors studied in the quantitative economic analysis are presented in Table 2. These data were obtained from real data monitored for each of the study cases.

2.2.1. Economic Cost

Economic costs include capital (CC), operating (CO), maintenance (CM), and water quality control (CQ) costs associated with the project. The calculation of these costs is carried out according to Equations (1)–(4).
C C = C m + C q + C w
C O = t = 1 n C e ( 1 + r ) t
C M = t = 1 n C f ( 1 + r ) t
C Q = t = 1 n C a + C t ( 1 + r ) t
where Cm, Cq, and Cw correspond to materials, equipment, and workforce costs; Ce is the costs of electrical energy; Cf corresponds to the cost of the replacement of filter materials, which occurs every 100,000 L of greywater treated with a minimum frequency of one maintenance at year; and Ca and Ct are the costs of water analysis and water samples transport, respectively. In the last case, the water quality control is carried out quarterly, as required by current regulations [25]. A discount rate (r) of 8.16% was used and the evaluation period (n) was 10 years because a longer period of operation in a decentralized treatment system could imply a redesign of the system to adapt it to new needs, which should be evaluated as a new project. The discount rate was determined using the capital asset pricing model (CAPM) and financial indices obtained from Damodaran [26] for the waste and environmental services industry [27].

2.2.2. Environmental Cost

The main environmental cost identified in the pilot projects described in the case studies corresponds to the noise pollution produced by the operation of the electric pumps. This cost was determined according to the approximate valuation of 2 €/year or USD 2.34/year for the reduction of 1 dB [28,29]. Therefore, the environmental cost (CN) was determined using the following equation:
C N = t = 1 n C d B × dB   ( 1 + r ) t  
where CdB corresponds to the annual cost of reducing a decibel and dB corresponds to the perceived decibels. The environmental cost was accounted for based on the total mitigation of noise produced by the electric pumps. However, the noise levels emitted by the operation of the pumps are below the limit required by Chilean regulations of 55 decibels in public spaces or green areas [30].
Therefore, the total cost of the project is calculated as follows:
C T = C C + C O + C M + C Q + C N  

2.2.3. Economic Benefit

The economic benefit (BE) was estimated from the water savings and the cost associated with the volume of water reused by the treatment systems as follows:
B E = t = 1 n R w × C w ( 1 + ) t ( 1 + r ) t
where Rw is the reclaimed water, CW is the current unit cost of water, and ∆ is the annual increase in the price of water obtained from the moving average of the last 10 years, which indicates an increased value of approximately 5.15% per year. The prices of water, according to the location and type of supply were USD 1.67/m3 for Alejandro Chelén School, USD 0.88/m3 for El Guindo School, and USD 2.00/m3 for Pedro de Valdivia School.

2.2.4. Environmental Benefit

To obtain an approximate quantification of the environmental benefits (BN) of the project, we used data from a study carried out in Santiago, Chile about the willingness to pay for green areas. According to the surveys carried out, it was determined that the price for an additional hectare of green area in present value is approximately USD 1.34 per month per person [31]. Therefore, the environmental benefit was determined using the following equation:
B N = t = 1 n C G × A × N ( 1 + r ) t
where CG corresponds to the willingness to pay for an additional hectare of green per year per person, A is the surface of green areas expressed in units of hectares, and N is the number of members in each school.
The total benefit of the project (BT) is calculated as follows:
B T = B E + B N
Both the costs and benefits of the pilot treatment systems were evaluated considering an operating time of 10 months per year (school year) and only working days (excluding weekends), for a total of 200 operating days per year approximately.
Additionally, the ratio of benefits to costs (RB/C) was determined, according to Liang and van Dijk [32], using the following Equation (10) (if RB/C > 1 the project is economically feasible, while if RB/C < 1 the project is not economically feasible):
R B / C = B T C T  

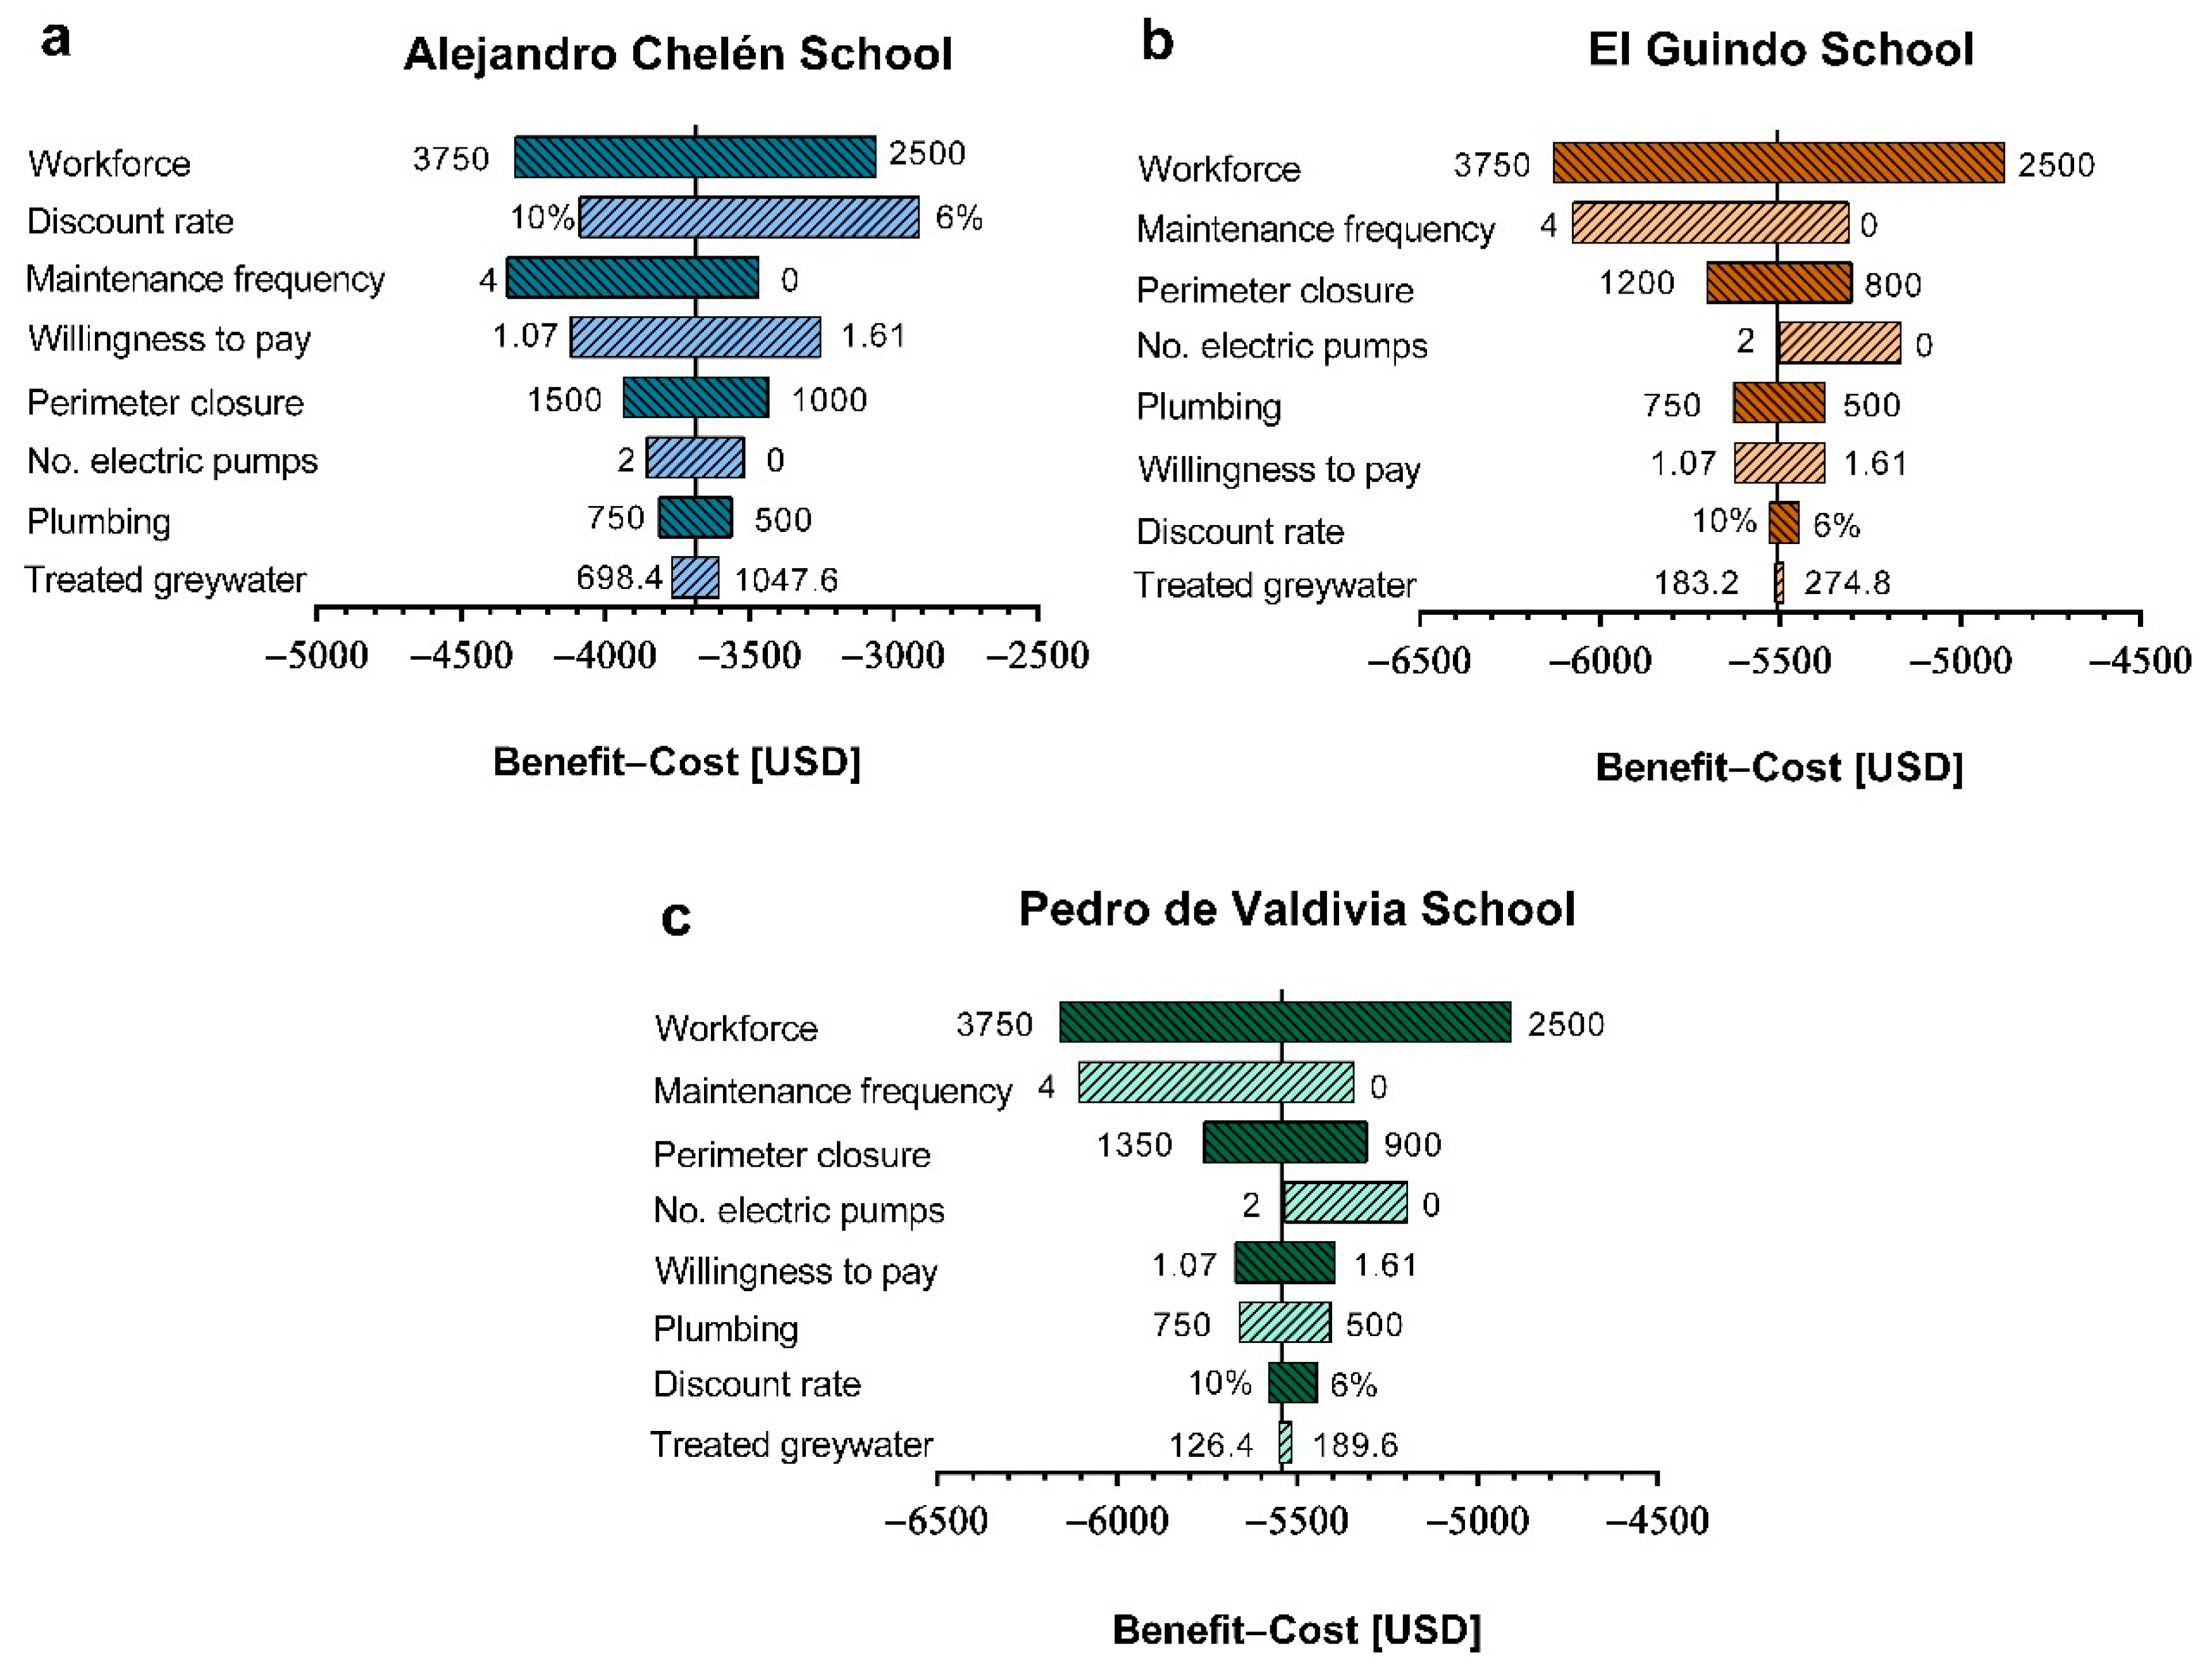
2.3. Sensitivity Analysis

A sensitivity analysis was performed for some variables in the cost/benefit analysis. The variables studied were the cost of workforce, the frequency of maintenance (expressed as number of times a year), the cost of the perimeter closure, the number of electric pumps, the plumbing costs, the amount of treated greywater, the discount rate and the willingness to pay for green areas. Table 3 presents a summary of the parameters and the range of variation studied. These data are presented as a tornado diagram to compare the relative importance of the variables. Additionally, cash flows were studied without considering capital costs, a scenario that simulates state financing of investment costs in treatment systems as part of a social initiative. In this case, the operating and maintenance costs were evaluated in contrast to the benefits of saving water.

2.4. Qualitative Economic Analysis

The qualitative analysis of the benefits associated with greywater reuse projects is based on benefits that are difficult to quantify from an economic point of view, but which have a great impact and social benefit. Because the current use of recycled greywater, in the case studies, is for the irrigation of green areas, the qualitative social evaluation focused on the benefits associated with green areas in school communities.

3. Results and Discussion

The results were divided into a quantitative and qualitative evaluation, according to the data monitored in the greywater treatment systems in the three schools.

3.1. Quantitative Economic Analysis

Table 4 presents the results of the economic analysis of the projects in the three schools. On the one hand, the fixed costs associated with the construction of the greywater treatment systems correspond to the collecting tanks, the perimeter closure of the installation area, plumbing, the initial filtering materials, electric pumps, water meters, and the required workforce. We observe that, in the three projects, these costs were higher than USD 5200. On the other hand, the operating costs were associated with the electrical consumption of the electric pumps, which used an average of 8 h a day, corresponding to the school’s operating hours. This cost strongly depends on the number of electric pumps used in each project. In particular, at the Alejandro Chelén School, only one pump was used, while in the other cases two electric pumps were used, therefore, the operating costs were double. The maintenance costs are, primarily, the replacement of the filter materials, that is, activated carbon and zeolite, depending on the case. Regarding the environmental cost, the noise produced by the electric pumps was identified as the most important. Finally, the benefits correspond to the water saved from the treatment systems. The greywater production data are real levels monitored to date.
The results show that, in the three cases studied, the economic analysis is unfavorable. The benefits minus the costs are negative in all three cases being USD −3686.67 in Alejandro Chelén School, USD –5501.90 in El Guindo School, and USD –5533.47 in Pedro de Valdivia School. These values are mainly attributable to the fact that the benefits are not able to compensate for the initial investment in an evaluation period of 10 years. In particular, the Alejandro Chelén School presents the less negative value as compared with in the other cases, which is compensated mainly because it is the school with the most students, and therefore the generation of daily greywater is higher than the other cases. In the same way, greater generation of greywater results in a greater potential irrigation area, and therefore the environmental benefits are higher than in the other cases. It should be noted that the price of water for the Pedro de Valdivia School was the highest, which corresponds to the price of water supplied by a cistern truck for the area, followed by the price of water at the Alejandro Chelén School, which corresponds to the price of the sanitary, which charges fees that include potable water, collection, and treatment services. Finally, the lowest water price corresponds to the El Guindo School, which is supplied through APR, organizations made up of committees or cooperatives that administer, operate, and maintain drinking water services in rural areas [33]. This difference in prices is based on the fact that the tariff model in Chile aims to finance operating and maintenance costs, and investment needs and replacement of infrastructure and equipment [34,35].
Additionally, the economic feasibility was studied based on the calculation of the benefit/cost ratio. As in the previous information, it can be observed that all the values are less than 1 and are quite small, which indicates that there is no economic feasibility, as mentioned by Liang and van Dijk [32]. These data are shown in Table 5.
By dividing the cost of the project evaluated over 10 years by the water reused in the same period, total costs of USD 2.11/m3, USD 12.01/m3, and USD 17.51/m3 were obtained for Alejandro Chelén School, El Guindo School, and Pedro de Valdivia School, respectively. It can be seen that the unit cost increases considerably when the scale of treatment is lower, as is the case of the El Guindo and Pedro de Valdivia Schools, where the current level of treatment is less than 250 L per day. A similar result was reported by Friedler [36], who evaluated the unit cost of treatment based on daily water flow. According to his calculations, the unit treatment cost was approximately USD 4/m3 when the water flow was 1 m3/day, while costs were reduced to less than USD 1/m3 for over 10 m3/day. In addition, a study carried out in Beijing [32] demonstrated the importance of considering environmental and social benefits when evaluating greywater treatment systems. When only the financial analysis was considered, the two projects evaluated presented negative values, around USD 0.04/m3 for treated water volumes of approximately 107,000 and 750,000 m3 per year, for each project. However, when considering the environmental and social benefits, the evaluation obtained positive values, ranging between USD 0.5/m3 and USD 1.8/m3.

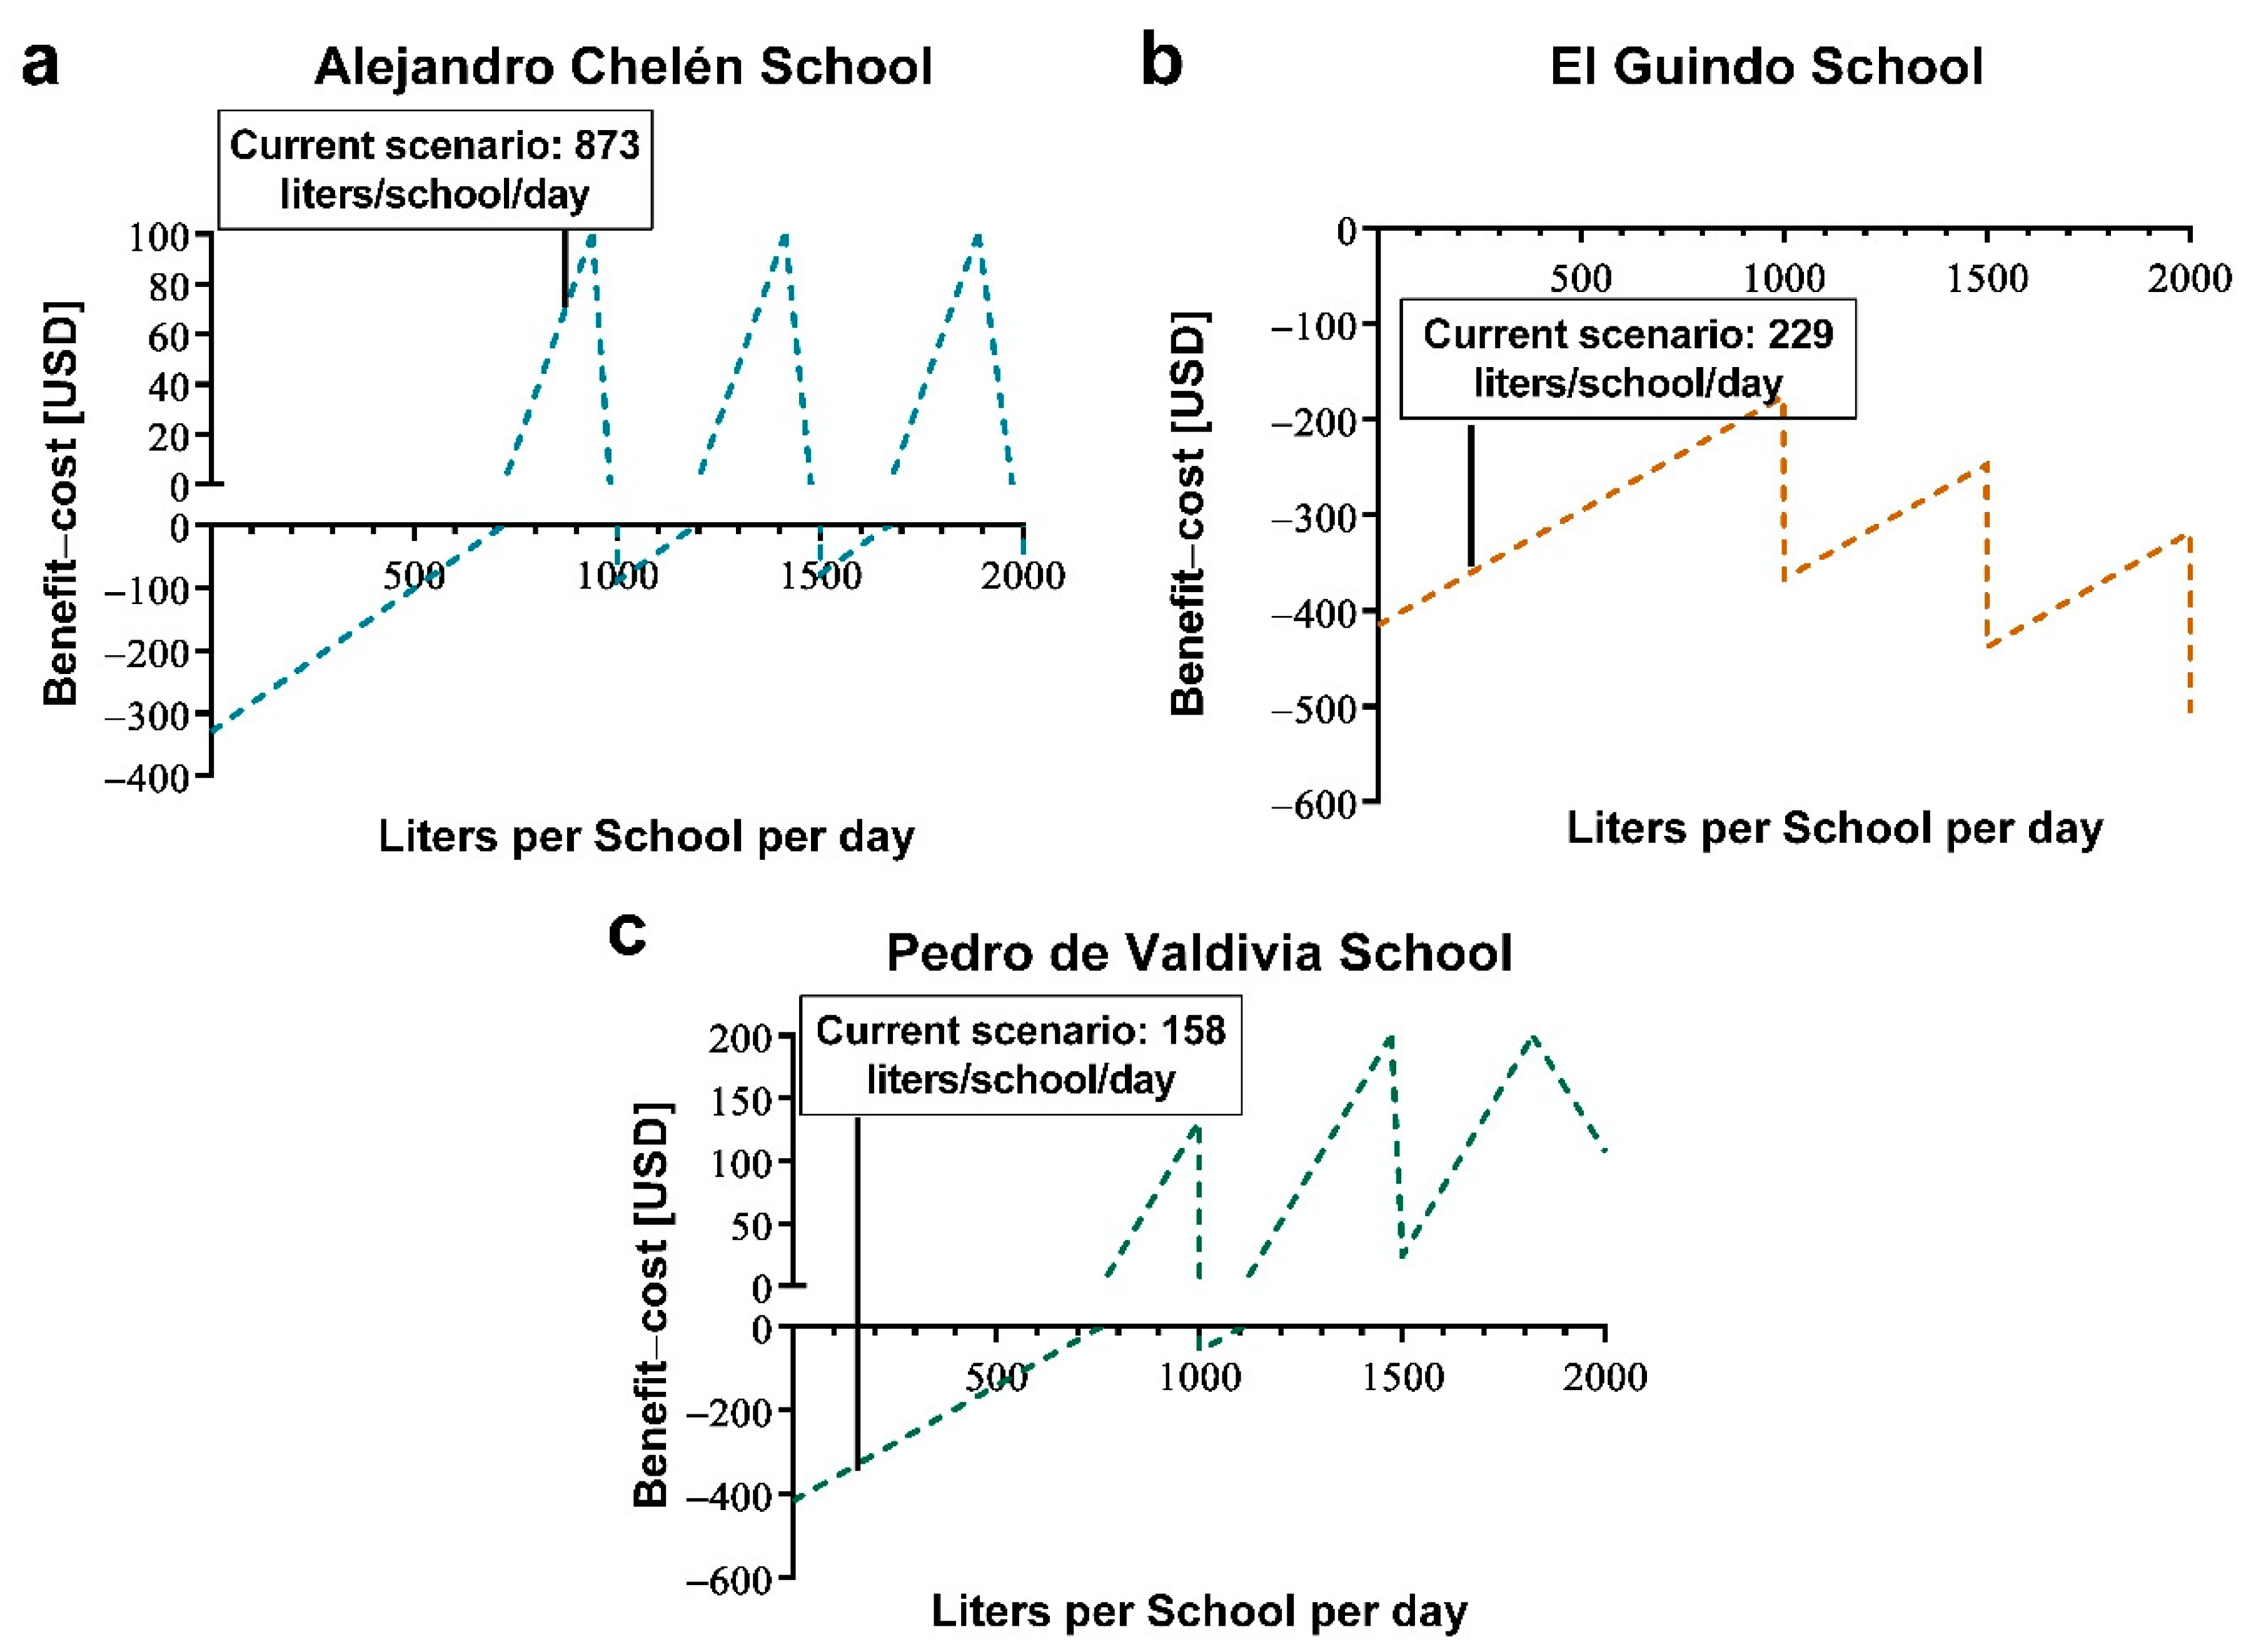
3.2. Sensitivity Analysis

Investment costs are difficult to modify at this scale, although they can be reduced somewhat with economies of scale. However, it is important to identify the impact that certain variable expenses have in the final analysis of economic feasibility. Figure 2 shows the sensitivity analysis for eight variables. It can be seen that the variable with the greatest relevance corresponds to the workforce. These prices reflect the market values for the installation of a single treatment system. However, with an economy of scale, these costs could be reduced. The second most relevant is the frequency of maintenance, particularly the replacement of filter materials. At this point, it is necessary to evaluate other maintenance methods to avoid replacing all the materials every time, such as backwashing [37,38,39]. At the Alejandro Chelén School, the variation in the discount rate was more significant than in the other schools because the annual benefits were higher, due to the greater amount of greywater treated. It should be noted that the typical social discount rate for evaluating projects in Chile is 6%, therefore, the sensitivity analysis of this value shows an approximation to a social evaluation of the project. The other variables associated with costs, such as the perimeter closure, the number of electric pumps, and the plumbing service have less relative importance. Finally, the amount of greywater treated daily, which corresponds to the only variable associated with economic benefits, was the least relevant. For this reason, the assessment is economically unfavorable in almost all possible scenarios.
Since the economic analysis had highly negative results, the economic feasibility was evaluated without considering the initial investment costs or the quality control costs, simulating a state subsidy. In addition, the environmental cost was eliminated, since, although it quantified in the general economic analysis, the noise generated by the operation did not exceed the current regulations on noise pollution [30]. Similarly, the environmental benefit was excluded, to compare only directly perceived cash flows. Thus, a simplified economic analysis was carried out, considering only the operating and maintenance costs, and the perceived water savings. In Chile, public schools are managed by municipalities, with resources from the central government and municipal funds, which are very unequal throughout the country [40]. Therefore, for the evaluated scenarios, we seek to determine if the operating and maintenance costs can be equated by the economic benefits and that these do not represent additional operating expenses in the establishments, whose resources may be very limited. The feasibility was evaluated in a range from 0 to 2000 L of greywater treated per school per day (Figure 3).
The graphs show a shape of peaks, since when a threshold of treated greywater is exceeded, a change of filtering materials is contemplated, thus, increasing maintenance costs. Under the current operating conditions, only at the Alejandro Chelén School are the benefits of saving water higher than the operating and maintenance costs of the treatment systems. However, the Pedro de Valdivia School can compensate for operating and maintenance costs if it increases the amount of greywater treated per capita to 6.4 L per day, which is equivalent to treating 850 L per day in the establishment. In the case of the El Guindo School, given that the price of water from APR is lower than the other cases, it is not possible to compensate for the operating and maintenance expenses by increasing the amount of greywater treated. Other studies of economic analysis for greywater or rainwater treatment systems have shown the infeasibility of decentralized projects, which is why the need for government subsidies is necessary to make these initiatives more attractive [41,42]. Particularly, due to the current regulations in Chile and the economic precariousness present in some rural areas of the population, subsidies for initial investment and quality control of treatment systems represent the most economically feasible scenario.

3.3. Qualitative Economic Analysis

The economic analysis of projects at the scale studied is unfavorable. However, social benefits play an important role in the evaluation of a project. Increasing the availability of water in areas of water scarcity is not quantifiable solely based on the price of water saved. The extra benefits that the availability of water for irrigation in arid or semi-arid areas can generate in the population are very important. The World Health Organization (WHO) recommends a minimum threshold of 9 m2 per person of green areas [43]. The areas where the studied schools are located have a green area surface of 4.91 m2 per person [44]. Therefore, it is necessary to increase the green areas in these regions to meet the minimum recommendations for a better quality of life.
The treated greywater has the potential to be used for irrigation of plants, fruit trees, ornamental trees, and green areas in general, according to the quality of greywater required for different uses. Currently, treated greywater is used in schools to irrigate green areas. These green areas can be optimized if the necessary water is used, avoiding losses, and preferring native plants and trees. Quillay (Quillaja Saponaria) was taken as a reference, as an endemic tree in the area, to make a general estimate of the green area surface that these waters could maintain. According to some studies, to optimize the growth of the Quillay, 5 L of water are needed every 15 days for irrigation and an area of 1 m2 per tree [45,46].
Table 6 shows the area that could be irrigated with the current level of greywater treated daily. In addition, the range of greywater, corresponding to the first peak of economic feasibility in Figure 3, was added in parentheses. In the case of El Guindo School, where there was no economically feasible range, the upper peak was used, where the economic feasibility was less negative. Green areas could increase if the amount of greywater treated daily is increased, which is particularly recommended in El Guindo and Pedro de Valdivia Schools, to improve economic viability. If these initiatives are extended to other schools in the area, it is possible to increase the availability of green areas per person at a regional level, and thus contribute to improving people’s quality of life.
In the studied area, the annual average temperature is 17.4 °C [47]. However, during the summer months, the temperature reaches maximum values above 32 °C [47]. Vegetation is very useful to help regulate the ambient temperature, as well as to adjust the humidity of surrounding areas [48,49,50]. The specific effect in reducing the temperature in school buildings depends on some factors, such as the location of the green areas, their extension, and the leafiness of the trees. However, in general, it has been reported that vegetation gives greater comfort to adjacent areas [51,52,53].
Although the climatic effects of vegetation can be more precisely quantified, there are several additional effects that green areas have on people’s physical and mental health. A study carried out in Denmark [54] showed that access to green areas within short commute distances from home was associated with a lower degree of stress and also with lower obesity rates. Additionally, several studies have shown that green areas in schools and any type of infrastructure and sustainable design in schools were associated with better performance and a greater sense of satisfaction on the part of both students and teachers [55,56,57]. In particular, the projects of this study have been incorporated into the study plans, allowing the improvement of environmental and sustainable education in the establishments. These curricular modifications have been reflected in participatory workshops of two hours a week, in which children can learn recreationally and didactically.

4. Conclusions

The economic analysis of three pilot projects of greywater treatment systems in rural public schools in Chile showed that it is infeasible because the high initial investment costs are not compensated for by the savings in water quantified from the price of water in each case. The amount of water recovered on a small scale fails to offset the capital costs, as well as the operating and maintenance costs that these greywater treatment systems represent. Therefore, it is naive to think that only by the existence of legal regulation for the reuse of greywater, private actors (individual or collective) will be encouraged to promote projects in this matter, considering the economic, social, and institutional inequalities that exist in the national territory. The current situation evaluated in the three schools is not economically attractive. Under this context, subsidies are necessary for the initial investment of these projects.
However, the growing scarcity of water in the area, as well as the social benefits produced by greater availability of water in arid and semi-arid areas, should be taken as a factor of greater relevance when evaluating this type of project. Greywater allows the irrigation of green areas, which are very scarce in areas with low water availability and a lack of rainfall. The increase in green areas in schools is related to better performance and productivity, and a greater sense of satisfaction. It also contributes to increasing the availability of green areas per person in the area, which is below the threshold recommended by the WHO. Therefore, greywater projects should be evaluated from a social point of view, and funding increased through public policies that promote greater sustainability in schools. In this way, the State should promote public policies that allow subsidizing and stimulating alliances with private parties to promote sustainable schools.

Author Contributions

The manuscript was written by C.R., but all the authors contributed to its preparation and review; conceptualization and data analyses were carried out by C.R. in discussion with E.L.; validation of results was performed by E.L.; the manuscript was edited and review by C.R., N.R., N.S., R.S., J.S., and E.L. All authors have read and agreed to the published version of the manuscript.

Funding

This research was funded by FIC-R Fondo de Innovación para la Competitividad Gore Coquimbo BIP nos. 30485965-0, CORFO-L2 L2 ISV93456 and FONDECYT 11191154 (2019–2022).

Acknowledgments

Thanks to the schools and educational communities that collaborated in this study. We thank Daniel Rojas, Hernán Toro, Marcos Florio, Hernán Flores, Hugo Guzmán, Jaime Esquivel, Lorena Molani, Arnulfo Santibáñez for their assistance in the construction of pilots and support in design experiences, control and system monitoring. We also extend thanks to the reviewers for their corrections and suggestions, who contributed significantly to improving the quality of this manuscript.

Conflicts of Interest

The authors declare no conflict of interest.

References

  1. Liu, J.; Yang, H.; Gosling, S.N.; Kummu, M.; Flörke, M.; Pfister, S.; Hanasaki, N.; Wada, Y.; Zhang, X.; Zheng, C.; et al. Water scarcity assessments in the past, present, and future. Earth’s Future 2017, 5, 545–559. [Google Scholar] [CrossRef] [PubMed]
  2. Tzanakakis, V.A.; Paranychianakis, N.V.; Angelakis, A.N. Water Supply and Water Scarcity. Water 2020, 12, 2347. [Google Scholar] [CrossRef]
  3. Mekonnen, M.M.; Hoekstra, A.Y. Four billion people facing severe water scarcity. Sci. Adv. 2016, 2, e1500323. [Google Scholar] [CrossRef] [Green Version]
  4. Kummu, M.; Guillaume, J.H.A.; de Moel, H.; Eisner, S.; Flörke, M.; Porkka, M.; Siebert, S.; Veldkamp, T.I.E.; Ward, P.J. The world’s road to water scarcity: Shortage and stress in the 20th century and pathways towards sustainability. Sci. Rep. 2016, 6, 38495. [Google Scholar] [CrossRef] [Green Version]
  5. Rijsberman, F.R. Water scarcity: Fact or fiction? Agric. Water Manag. 2006, 80, 5–22. [Google Scholar] [CrossRef] [Green Version]
  6. Mehta, L.; Huff, A.; Allouche, J. The new politics and geographies of scarcity. Geoforum 2019, 101, 222–230. [Google Scholar] [CrossRef] [Green Version]
  7. Hussein, H. Lifting the veil: Unpacking the discourse of water scarcity in Jordan. Environ. Sci. Policy 2018, 89, 385–392. [Google Scholar] [CrossRef]
  8. Aitken, D.; Rivera, D.; Godoy-Faúndez, A.; Holzapfel, E.; Aitken, D.; Rivera, D.; Godoy-Faúndez, A.; Holzapfel, E. Water Scarcity and the Impact of the Mining and Agricultural Sectors in Chile. Sustainability 2016, 8, 128. [Google Scholar] [CrossRef] [Green Version]
  9. Rodríguez, C.; Sánchez, R.; Lozano-Parra, J.; Rebolledo, N.; Schneider, N.; Serrano, J.; Leiva, E. Water Balance Assessment in Schools and Households of Rural Areas of Coquimbo Region, North-Central Chile: Potential for Greywater Reuse. Water 2020, 12, 2915. [Google Scholar] [CrossRef]
  10. Lajaunie, M.-L.; Scheierling, S.; Zuleta, J.; Chinarro, L.; Vazquez, V. Chile-Diagnóstico de la Gestión de los Recursos Hídricos [Chile-Diagnosis of the Management of Water Resources, Authors Translation]; The World Bank: Washington, DC, USA, 2011. [Google Scholar]
  11. Damkjaer, S.; Taylor, R. The measurement of water scarcity: Defining a meaningful indicator. Ambio 2017, 46, 513–531. [Google Scholar] [CrossRef] [Green Version]
  12. Gómez-González, S.; González, M.E.; Paula, S.; Díaz-Hormazábal, I.; Lara, A.; Delgado-Baquerizo, M. Temperature and agriculture are largely associated with fire activity in Central Chile across different temporal periods. For. Ecol. Manag. 2019, 433, 535–543. [Google Scholar] [CrossRef]
  13. Fernández, F.J.; Blanco, M.; Ponce, R.D.; Vásquez-Lavín, F.; Roco, L. Implications of climate change for semi-arid dualistic agriculture: A case study in Central Chile. Reg. Environ. Chang. 2019, 19, 89–100. [Google Scholar] [CrossRef]
  14. Furnaro, A. Hegemony and passivity in mining regions: Containing dissent in north-central Chile. Extr. Ind. Soc. 2019, 6, 215–222. [Google Scholar] [CrossRef]
  15. Fernandez, V. Copper mining in Chile and its regional employment linkages. Resour. Policy 2018. [Google Scholar] [CrossRef]
  16. MOP. Estimación de la Demanda Actual, Proyecciones Futuras y Caracterización de la Calidad de los Recursos Hídricos en Chile [Estimation of Current Demand, Future Projections and Characterization of the Quality of Water Resources in Chile, Authors Translation]; MOP: Santiago, Chile, 2017.
  17. Fundación Amulén. Pobres de Agua. Radiografía del Agua Rural de Chile: Visualización de un Problema Oculto [Poor of Water. Radiography of Rural Water in Chile: Visualization of a Hidden Problem, Authors Translation]; Fundación Amulén: Santiago, Chile, 2019. [Google Scholar]
  18. Voulvoulis, N. Water reuse from a circular economy perspective and potential risks from an unregulated approach. Curr. Opin. Environ. Sci. Health 2018, 2, 32–45. [Google Scholar] [CrossRef]
  19. Oteng-Peprah, M.; Acheampong, M.A.; deVries, N.K. Greywater Characteristics, Treatment Systems, Reuse Strategies and User Perception—A Review. Water. Air. Soil Pollut. 2018, 229, 1–16. [Google Scholar] [CrossRef] [Green Version]
  20. Maimon, A.; Gross, A. Greywater: Limitations and perspective. Curr. Opin. Environ. Sci. Health 2018, 2, 1–6. [Google Scholar] [CrossRef]
  21. Boyjoo, Y.; Pareek, V.K.; Ang, M. A review of greywater characteristics and treatment processes. Water Sci. Technol. 2013, 67, 1403–1424. [Google Scholar] [CrossRef]
  22. Diario Oficial de la República de Chile. Ley N° 21.075: Regula la Recolección, Reutilización y Disposición de Aguas Grises [Law N ° 21.075: Regulates the Collection, Reuse and Disposal of Gray Water, Authors Translation]; Biblioteca del Congreso Nacional de Chile: Santiago, Chile, 2018. [Google Scholar]
  23. Instituto Nacional de Estadísticas. Síntesis de Resultados Censo 2017 [Summary of 2017 Census Results, Authors Translation]; INE: Santiago, Chile, 2018.
  24. Godfrey, S.; Labhasetwar, P.; Wate, S. Greywater reuse in residential schools in Madhya Pradesh, India-A case study of cost-benefit analysis. Resour. Conserv. Recycl. 2009, 53, 287–293. [Google Scholar] [CrossRef]
  25. Ministerio de Salud. Proyecto de Reglamento Sobre Condiciones Sanitarias Básicas para la Reutilización de Aguas Grises [Draft Regulation on Basic Sanitary Conditions for the Reuse of Graywater, Authors Translation]; Departamento de Salud Ambiental: Santiago, Chile, 2018.
  26. Aswath, D. Damodaran Online. Available online: http://pages.stern.nyu.edu/~adamodar/ (accessed on 15 October 2020).
  27. Lilford, E.; Maybee, B.; Packey, D. Cost of capital and discount rates in cash flow valuations for resources projects. Resour. Policy 2018, 59, 525–531. [Google Scholar] [CrossRef]
  28. Santhosh, C.; Velmurugan, V.; Jacob, G.; Jeong, S.K.; Grace, A.N.; Bhatnagar, A. Role of nanomaterials in water treatment applications: A review. Chem. Eng. J. 2016, 306, 1116–1137. [Google Scholar] [CrossRef]
  29. Bjørner, T.B. Combining socio-acoustic and contingent valuation surveys to value noise reduction. Transp. Res. Part D Transp. Environ. 2004, 9, 341–356. [Google Scholar] [CrossRef]
  30. Ministerio del Medio Ambiente (MMA). Decreto Supremo 38/11 “Norma de Emisión de Ruidos Generados por Fuentes que Indica” [Supreme Decree 38/11 Norm of Emission of Noise Generated by Sources that Indicates, Authors Translation]; MMA: Santiago, Chile, 2011.
  31. Martínez, C. Valoración Económica de Áreas Verdes Urbanas de uso Público en la Comuna de La Reina [Economic Valuation of Urban Green Areas for Public Use in the Commune of La Reina]. Master’s Thesis, Environmental Management and Planning, University of Chile, Santiago, Chile, 2004. [Google Scholar]
  32. Liang, X.; van Dijk, M.P. Financial and economic feasibility of decentralized wastewater reuse systems in Beijing. Water Sci. Technol. 2010, 61, 1965–1973. [Google Scholar] [CrossRef] [PubMed] [Green Version]
  33. Fuster, R.; Donoso, G. Rural Water Management. In Global Issues in Water Policy; Springer: Berlin/Heidelberg, Germany, 2018; Volume 21, pp. 151–163. [Google Scholar]
  34. Donoso, G. Urban water pricing in Chile: Cost recovery, affordability, and water conservation. Wiley Interdiscip. Rev. Water 2017, 4, e1194. [Google Scholar] [CrossRef]
  35. Molinos-Senante, M.; Donoso, G. Water scarcity and affordability in urban water pricing: A case study of Chile. Util. Policy 2016, 43, 107–116. [Google Scholar] [CrossRef]
  36. Friedler, E. The water saving potential and the socio-economic feasibility of greywater reuse within the urban sector—Israel as a case study. Int. J. Environ. Stud. 2008, 65, 57–69. [Google Scholar] [CrossRef]
  37. Benstoem, F.; Nahrstedt, A.; Boehler, M.; Knopp, G.; Montag, D.; Siegrist, H.; Pinnekamp, J. Performance of granular activated carbon to remove micropollutants from municipal wastewater—A meta-analysis of pilot- and large-scale studies. Chemosphere 2017, 185, 105–118. [Google Scholar] [CrossRef]
  38. Korotta-Gamage, S.M.; Sathasivan, A. A review: Potential and challenges of biologically activated carbon to remove natural organic matter in drinking water purification process. Chemosphere 2017, 167, 120–138. [Google Scholar] [CrossRef]
  39. Zipf, M.S.; Pinheiro, I.G.; Conegero, M.G. Simplified greywater treatment systems: Slow filters of sand and slate waste followed by granular activated carbon. J. Environ. Manag. 2016, 176, 119–127. [Google Scholar] [CrossRef]
  40. Parry, T.R. Decentralization and privatization: Education policy in Chile. J. Public Policy 1997, 17, 107–133. [Google Scholar] [CrossRef]
  41. Leong, J.Y.C.; Balan, P.; Chong, M.N.; Poh, P.E. Life-cycle assessment and life-cycle cost analysis of decentralised rainwater harvesting, greywater recycling and hybrid rainwater-greywater systems. J. Clean. Prod. 2019, 229, 1211–1224. [Google Scholar] [CrossRef]
  42. Jabornig, S. Overview and feasibility of advanced grey water treatment systems for single households. Urban Water J. 2014, 11, 361–369. [Google Scholar] [CrossRef]
  43. WHO. Urban Planning, Environment and Health: From Evidence to Policy Action; WHO: Geneva, Switzerland, 2010. [Google Scholar]
  44. (SIEDU), Sistema de Indicadores y Estándares del Desarrollo Urbano. Indicadores Urbanos [Urban Indicators, Authors Translation]. Available online: http://siedu.ine.cl/descargar/descarga.html (accessed on 19 October 2020).
  45. Valenzuela Díaz, L.M. Evaluación de un Ensayo de Riego y Fertilización de Quillay (Quillaja Saponaria Mol.), en la Comuna de San Pedro, Provincia de Melipilla, Región Metropolitana [Evaluation of a Test of Irrigation and Fertilization of Quillay (Quillaja Saponaria Mol.), In the Commune of San Pedro, Province of Melipilla, Metropolitan Region, Authors translation]. Undergraduate’ Thesis, Universidad de Chile, Santiago, Chile, 2007. [Google Scholar]
  46. Benedetti Ruiz, S.; Delard, R.; Roach Barrios, F.A. Quillay: Una Alternativa Multipropósito para la Zona Central Central [Quillay: A Multipurpose Alternative for the Central Area, Authors Translation]; INFOR: Santiago, Chile, 2000; ISBN 9567727376. [Google Scholar]
  47. Explorador Climático (CR)2. Centro de Ciencias del Clima y la Resilencia [Climate Explorer (CR)2. Climate and Resilience Sciences Center, Authors Translation]. Available online: http://explorador.cr2.cl/ (accessed on 20 June 2020).
  48. Gómez, F.; Montero, L.; De Vicente, V.; Sequi, A.; Castilla, N. Vegetation influences on the human thermal comfort in outdoor spaces: Criteria for urban planning. WIT Trans. Ecol. Environ. 2008, 117, 151–163. [Google Scholar]
  49. Sodoudi, S.; Zhang, H.; Chi, X.; Müller, F.; Li, H. The influence of spatial configuration of green areas on microclimate and thermal comfort. Urban For. Urban Green. 2018, 34, 85–96. [Google Scholar] [CrossRef]
  50. Zölch, T.; Rahman, M.A.; Pfleiderer, E.; Wagner, G.; Pauleit, S. Designing public squares with green infrastructure to optimize human thermal comfort. Build. Environ. 2019, 149, 640–654. [Google Scholar] [CrossRef]
  51. Morakinyo, T.E.; Adegun, O.B.; Balogun, A.A. The effect of vegetation on indoor and outdoor thermal comfort conditions: Evidence from a microscale study of two similar urban buildings in Akure, Nigeria. Indoor Built Environ. 2016, 25, 603–617. [Google Scholar] [CrossRef]
  52. Zhang, A.; Bokel, R.; van den Dobbelsteen, A.; Sun, Y.; Huang, Q.; Zhang, Q. An integrated school and schoolyard design method for summer thermal comfort and energy efficiency in Northern China. Build. Environ. 2017, 124, 369–387. [Google Scholar] [CrossRef]
  53. Teli, D.; Jentsch, M.F.; James, P.A.B. Naturally ventilated classrooms: An assessment of existing comfort models for predicting the thermal sensation and preference of primary school children. Energy Build. 2012, 53, 166–182. [Google Scholar] [CrossRef]
  54. Nielsen, T.S.; Hansen, K.B. Do green areas affect health? Results from a Danish survey on the use of green areas and health indicators. Health Place 2007, 13, 839–850. [Google Scholar] [CrossRef]
  55. Meron, N.; Meir, I.A. Building green schools in Israel. Costs, economic benefits and teacher satisfaction. Energy Build. 2017, 154, 12–18. [Google Scholar] [CrossRef]
  56. Vakalis, D.; Lepine, C.; MacLean, H.L.; Siegel, J.A. Can green schools influence academic performance? Crit. Rev. Environ. Sci. Technol. 2020, 1–43. [Google Scholar] [CrossRef]
  57. Scott, J.T.; Kilmer, R.P.; Wang, C.; Cook, J.R.; Haber, M.G. Natural Environments Near Schools: Potential Benefits for Socio-Emotional and Behavioral Development in Early Childhood. Am. J. Community Psychol. 2018, 62, 419–432. [Google Scholar] [CrossRef] [PubMed]
Figure 1. Greywater treatment systems in rural schools. (a) Top and front view of the design drawing of the treatment systems; Photographs of the actual systems in (b) Alejandro Chelén School; (c) El Guindo School; and (d) Pedro de Valdivia School.
Water 12 03468 g001
Figure 2. Sensitivity analysis of the variation of workforce costs, maintenance frequency, costs of perimeter closure, number of electric pumps, plumbing costs, greywater treated daily, discount rate, and willingness to pay for green areas at (a) Alejandro Chelén School; (b) El Guindo School; and (c) Pedro de Valdivia School.
Water 12 03468 g002
Figure 3. Simplified economic analysis, considering only operating and maintenance costs, and saved water benefits, studied in a range from 0 to 2000 L of greywater treated per school per day at (a) Alejandro Chelén School; (b) El Guindo School; and (c) Pedro de Valdivia School.
Water 12 03468 g003
Table 1. Characteristics of the case studies.
SchoolNumber of MembersWater SupplyPilot Treatment SystemPermitted Use According to the Quality of the Treated Greywater
Alejandro Chelén420Sanitary company3 Filter sections in series:
2 Sections of activated carbon (~5 mm diameter and ~25 mm length) and 1 Section of zeolite (~5 mm diameter)
Irrigation of recreational areas and services *
El Guindo121Rural potable water (APR)2 Sections of activated carbon (~5 mm diameter and ~25 mm length)Irrigation of recreational areas and services *
Pedro de Valdivia13370% APR & 30% cistern truck2 Sections of activated carbon (~5 mm diameter and ~25 mm length)Irrigation of recreational areas and services *
* Maximum limit according to Chilean regulation, biological oxygen demand (BOD5) 240 mg/L; total suspended solids (TSS) 140 mg/L; fecal coliforms (FC) 1000 mg/L.
Table 2. Factors considered for quantitative economic analysis.
FactorDescription
Economic costInitial investment (materials, equipment, labor, etc.)
Operating, maintenance, and water quality control costs (change of filter materials, electricity, etc.)
Environmental costNoise pollution
Economic benefitsWater savings
Table 3. Sensitivity analysis parameters.
VariableRange of Variation
Workforce−20% to +20%
Maintenance frequency0 to 4
Perimeter closure−20% to +20%
No. electric pumps0 to 2
Plumbing−20% to +20%
Treated greywater−20% to +20%
Discount rate (r)6% to 10%
Willingness to pay−20% to +20%
Table 4. Economic costs and benefits of the projects evaluated at 10 years (USD).
Alejandro ChelénEl GuindoPedro de Valdivia
Economic costCapital costs:
collecting tanks,215215215
perimeter closure,125010001125
plumbing,625625625
filter material,178.20156.26156.25
electric pumps,61.30122.50122.50
water meter,35.6335.6335.63
workforce312531253125
Operating cost:
electricity112.24224.48224.48
Maintenance cost:
filter material217.80190.97190.97
Quality control cost:372.20372.20372.20
Environmental costnoise56.28112.57112.57
Economic benefitWater savings400.1154.8886.55
Environmental benefitWillingness to pay for green areas2161.82622.81684.58
Total (Benefit—Cost)−3686.67–5501.90–5533.47
Table 5. Economic feasibility.
Alejandro ChelénEl GuindoPedro de Valdivia
RB/C (ratio benefits/cost)0.4100.1100.122
Table 6. Potential irrigation of green areas with current levels of treated greywater and the first range of economic feasibility.
Total Greywater Treated Per Day [L]Irrigation Area (Quillay as Reference) [m2]Green Areas/Person [m2/Person]
Alejandro Chelén School873 (807–999)2619 (2421–2997)6.24 (5.76–7.14)
El Guindo School229 (540–999) *687 (1620–2997)5.68 (13.39–24.77)
Pedro de Valdivia School158 (850–999)474 (2550–2997)3.56 (19.17–22.53)
Data subject to economic feasibility without considering capital costs. In parentheses, the potential ranges are shown taking as reference the first peak of the economic feasibility of Figure 3. * Least negative range of economic feasibility.
Publisher’s Note: MDPI stays neutral with regard to jurisdictional claims in published maps and institutional affiliations.

