Legacy Phosphorus in Lake Okeechobee (Florida, USA) Sediments: A Review and New Perspective


1
Emergent Technologies Institute, U. A. Whitaker College of Engineering, Florida Gulf Coast University, 16301 Innovation Lane, Fort Myers, FL 33913, USA
2
Department of Ecology and Environmental Studies, Florida Gulf Coast University, 10501 FGCU Boulevard South, Fort Myers, FL 33965-6565, USA
*
Author to whom correspondence should be addressed.
Water 2021, 13(1), 39; https://0-doi-org.brum.beds.ac.uk/10.3390/w13010039
Submission received: 21 October 2020
/
Revised: 14 December 2020
/
Accepted: 23 December 2020
/
Published: 28 December 2020
(This article belongs to the Section Biodiversity and Functionality of Aquatic Ecosystems)
Abstract
:Lake Okeechobee is one of the largest freshwater lakes in the United States. As a eutrophic lake, it has frequent algal blooms composed predominantly of the cyanobacterium genus Microcystis. Many of the algal blooms are associated with the resuspension of a thixotropic benthic mud containing legacy nutrients. Since Lake Okeechobee has an area of 1732 km2 (40–50 km radius) and a mean depth of only 2.7 m, there is sufficient fetch and shallow water depth to allow frequent wind, wave, and current generated events, which cause sediment resuspension. Three types of mud exist in the lake including an immobile dark-colored, consolidated mud, a brownish-colored mud, which is poorly consolidated and mobile, and a dark-colored thixotropic, highly mobile mud that is a mixture of organic matter and clay-sized minerals. Altogether, these muds contain an estimated 4.6 × 10⁶ kg of total phosphorus and commensurate high amounts of labile nitrogen. The thixotropic mud covers most of the lakebed and contains the suitable nutrient ratios to trigger algal blooms. A bioassay analysis of the thixotropic mud compared to the consolidated mud showed that it produced up to 50% more nutrient mass compared to the consolidated mud. The thixotropic mud does not consolidate, thus remains mobile. The mobility is maintained by the dynamics of the algal blooms and bacterial decay of extracellular secretions (transparent exopolymer particles) that bind sediment, transfer it to the bottom, and undergo bacterial digestion causing gas emissions, thus maintaining the organic/sediment matrix in suspension. Despite major efforts to control external nutrient loading into the lake, the high frequency of algal blooms will continue until the muds bearing legacy nutrients are removed from the lake.
1. Introduction
The occurrence and movement of labile forms of nutrients, mainly phosphorus (P) and nitrogen (N), in the environment have considerable impacts on many natural ecosystems. Transport and cycling of nutrients impact biological productivity, which in turn can cause numerous complex and commonly negative effects to various surface–water bodies including lakes, rivers, and wetlands [1]. It is therefore important to understand the forms of anthropogenic P because it can be a limiting nutrient in inland environments, from source to sink, to ascertain how to control and remove it before it severely impacts a hydrosystem, sometimes leading to permanent damage.
Excessive nutrient loading, in some cases causing imbalances, has altered some of the largest natural hydrosystems in southern Florida. The literature indeed shows that the largest lakes, which are mostly located in north, central, and the northern portion of south Florida (Lake Okeechobee, Lake George, Lake Seminole, Lake Kissimmee, Lake Apopka, Lake Isokpoga, East and West Lake Tohopokaliga, Crescent Lake and Orange Lake) are eutrophic to hypereutrophic [2,3]. Thus, this research reviews the sources and sinks of nutrients in Lake Okeechobee with emphasis on the accumulated legacy nutrients in muddy sediments as well as the strategies to remove the problematic mud from the hydrosystem.
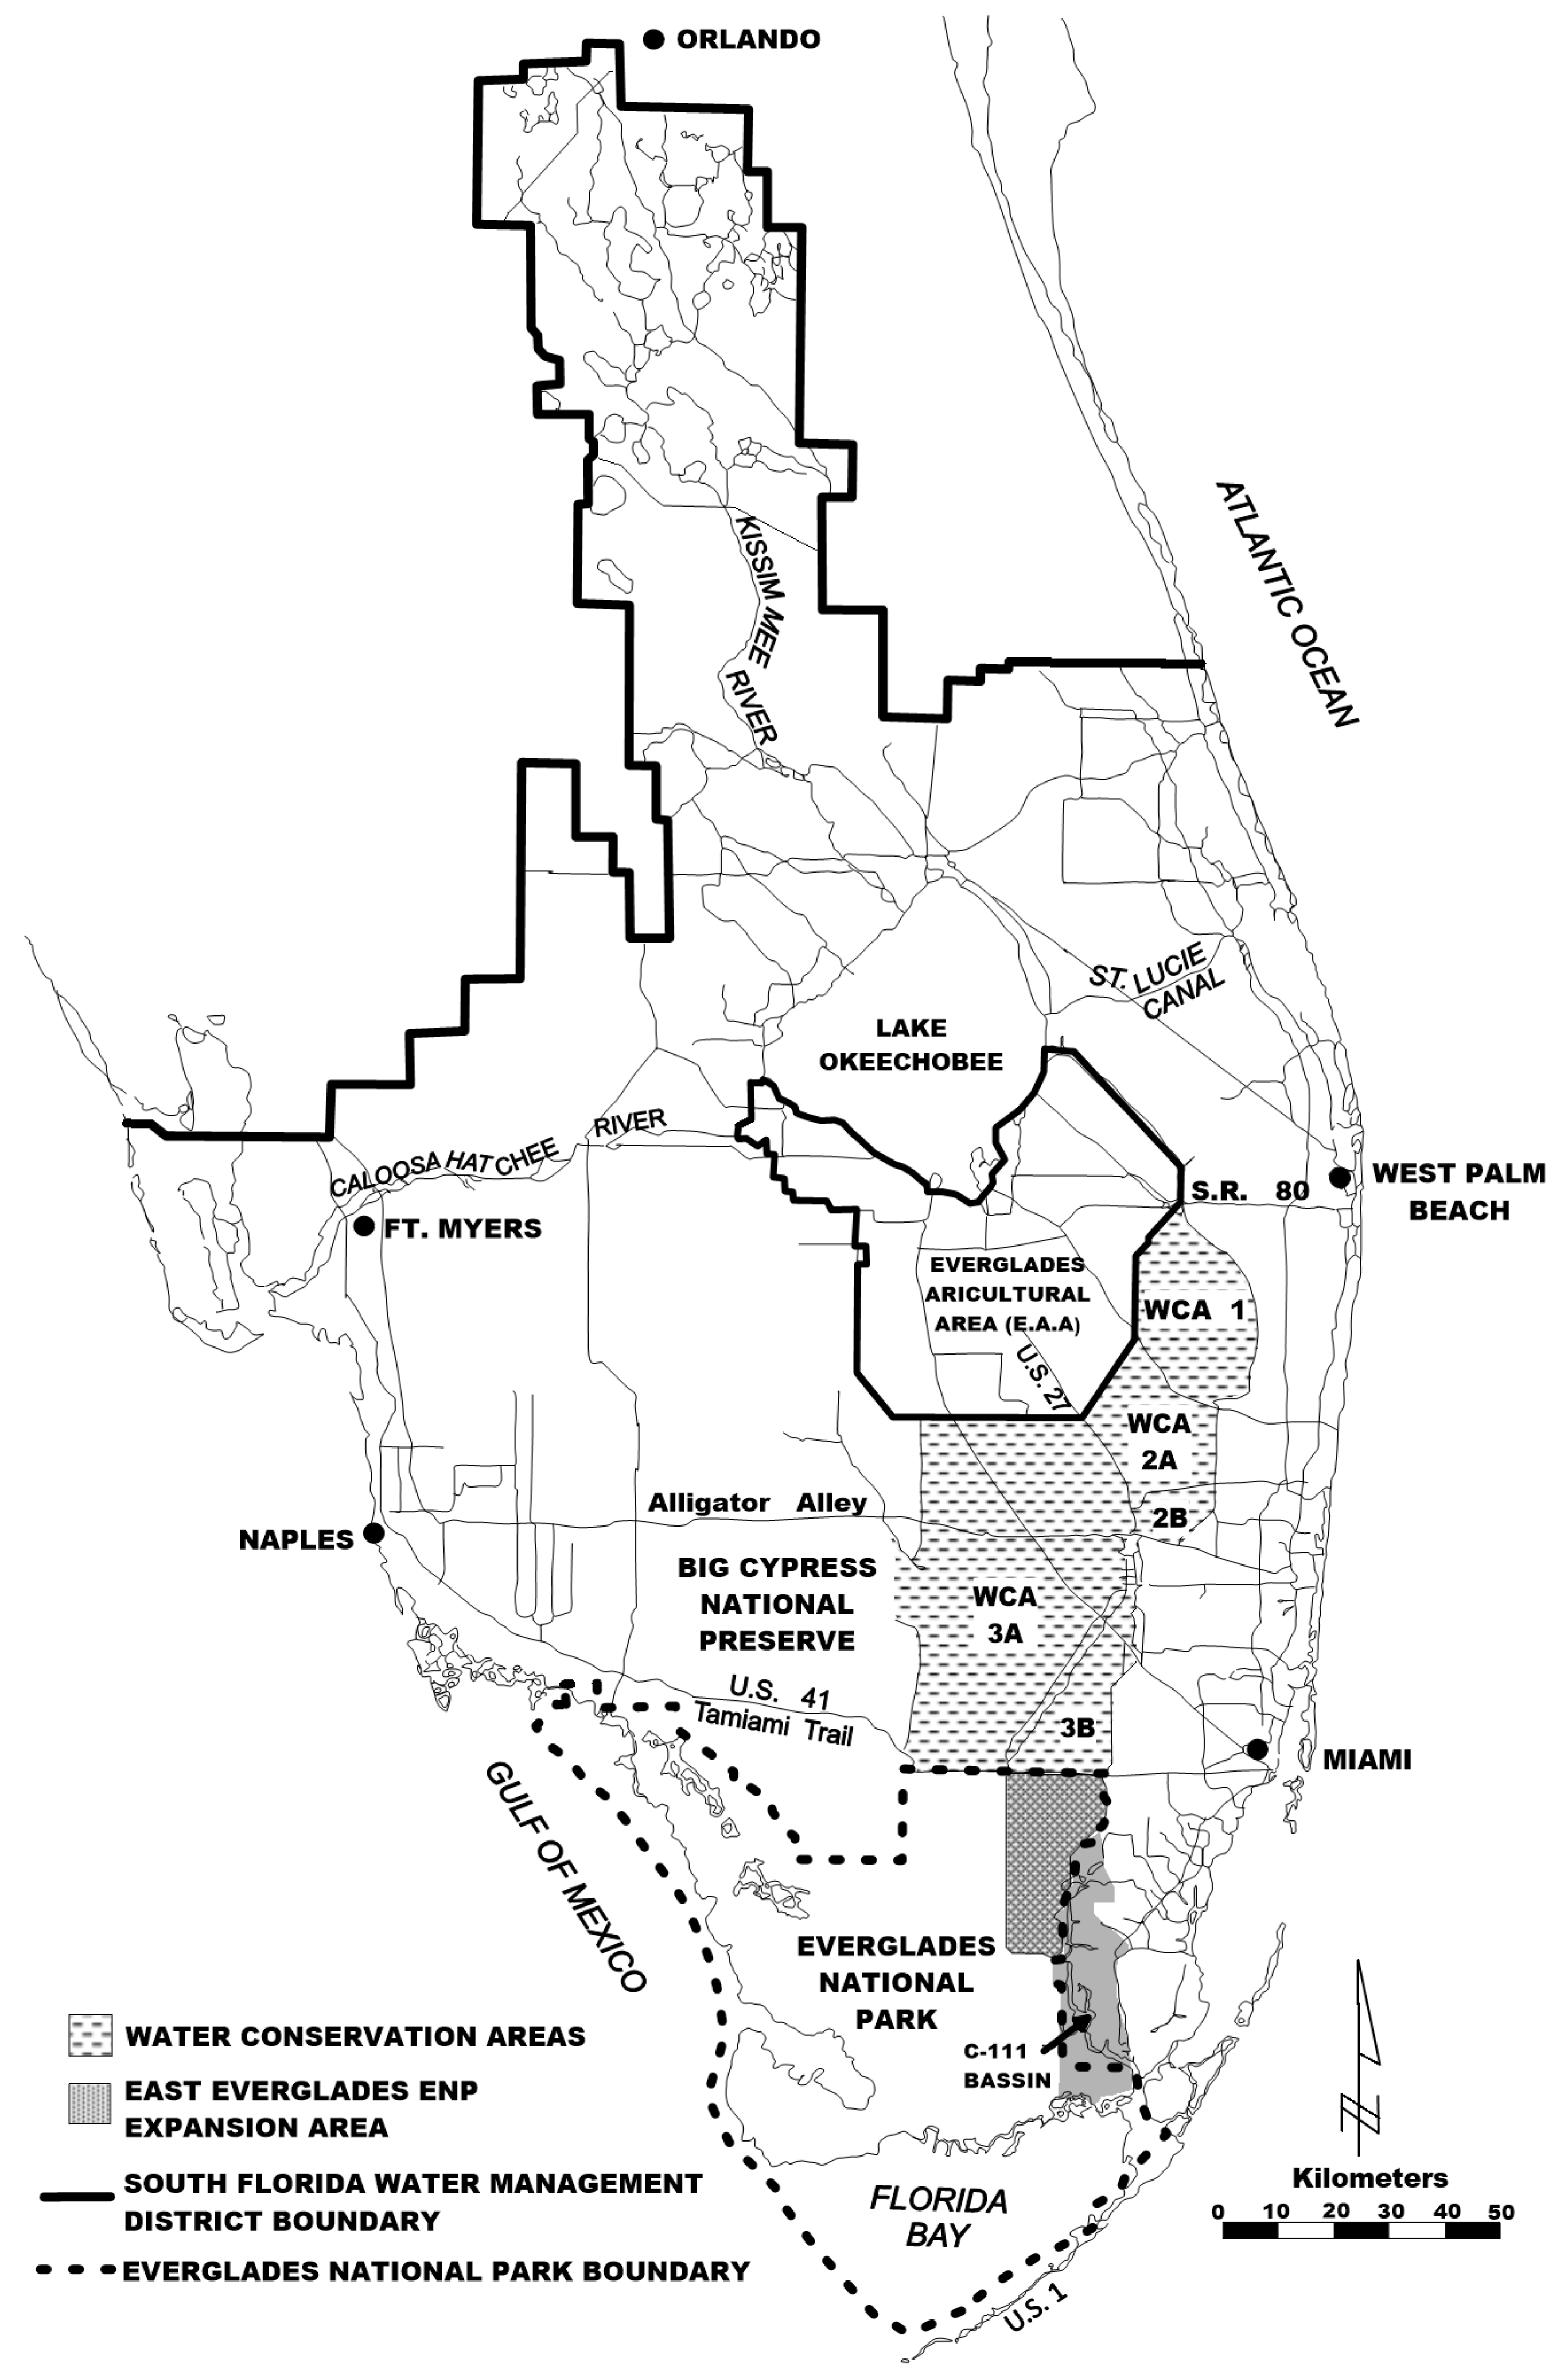
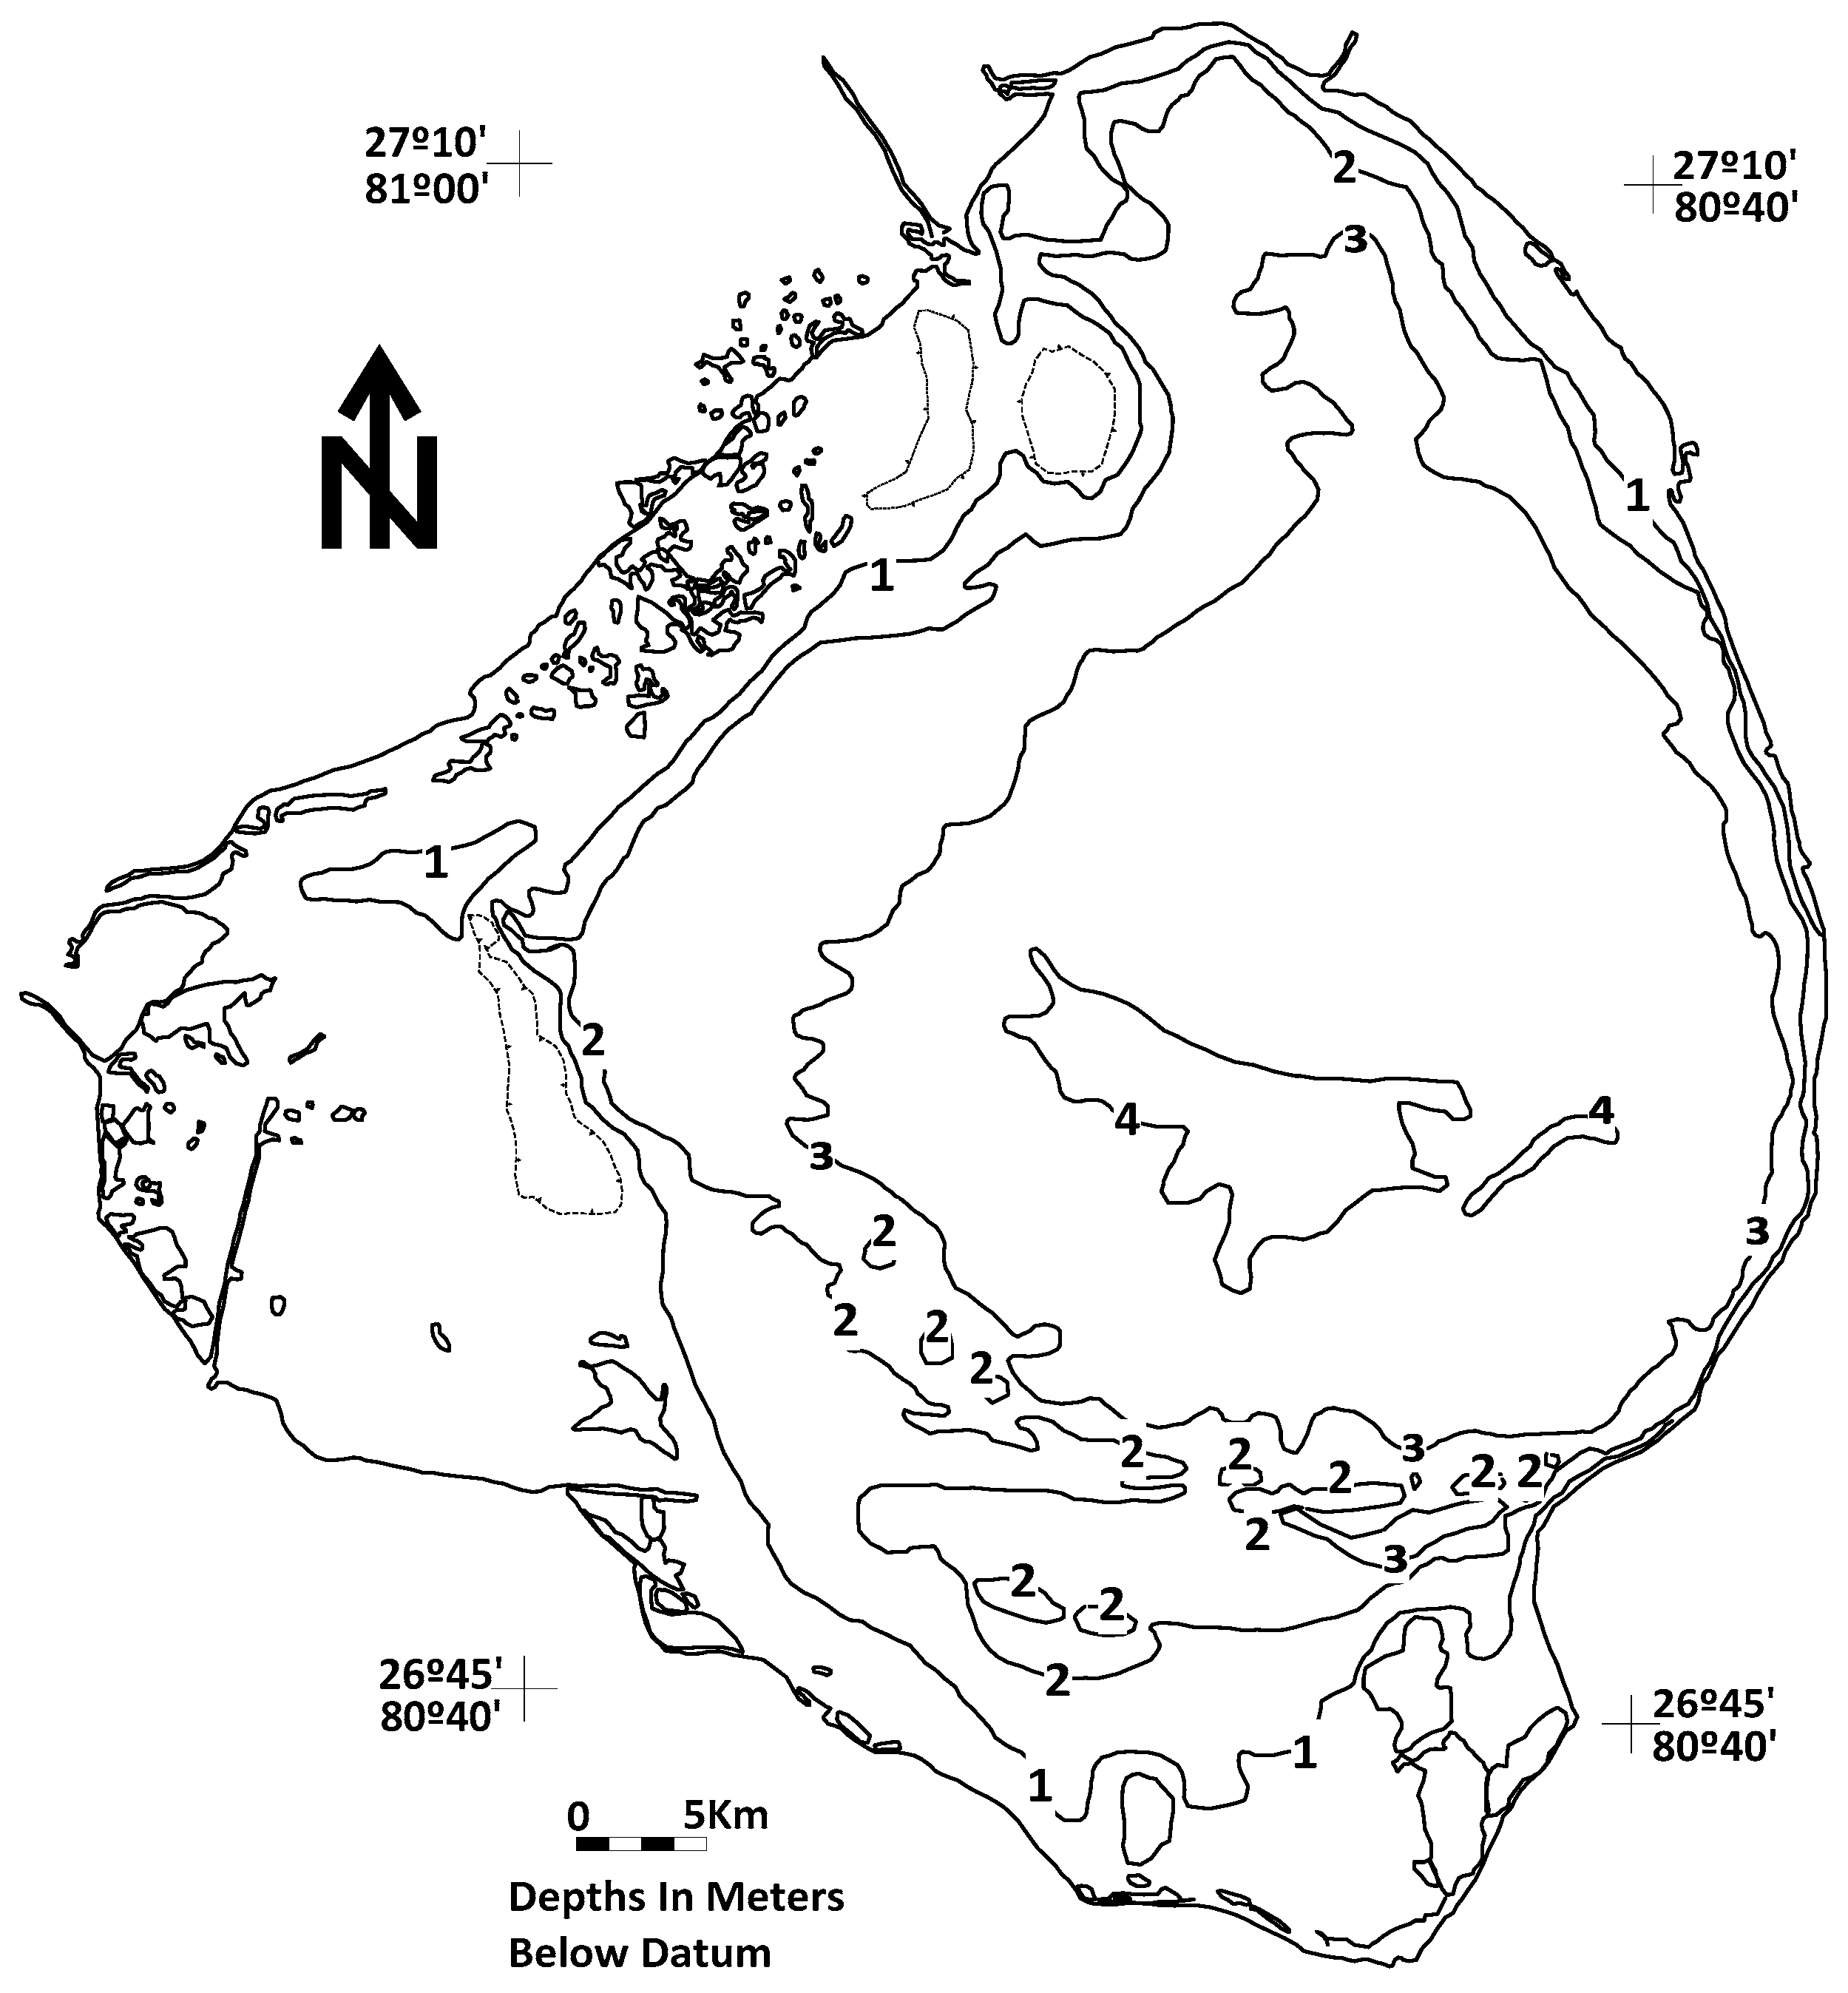
The Lake Okeechobee-Everglades natural system is one of the largest freshwater lakes by surface area in the United Sates. It is hydraulically-connected to a very large sedge and graminoid dominated moorland [4] (Figure 1). Historically, the Everglades hydraulic continuum once constituted the world’s largest contiguous freshwater system [5]. The surface area of Lake Okeechobee covers an area of approximately 1732 km2 with a mean depth of 2.7 m and an estimated volume of 5.2 km3 (Figure 2). Its deepest portion is about 4.7 m when the lake stage stands at 4.2 m [6].
The hydrology of Lake Okeechobee was drastically altered with the channelization of the Kissimmee River, coupled with the excavation of canals that connect it with the St. Lucie River to the east and the Caloosahatchee River to the west, and the construction of the Herbert Hoover Dike surrounding the lake [8]. These alterations prevented the natural lateral expansion of the lake into the surrounding riparian wetlands, which used to sequester nutrient-bearing fine particulates issued from wind-driven lake resuspended sediment [9]. While the Kissimmee River has undergone restoration by recreation some meanders, it still drains an urbanized and agropastoral watershed. Thus, the direct discharge from the Kissimmee River at the north side of the lake, coupled with back-pumping of water tied to the agriculture activities at the south end of the lake, other types of anthropogenic water discharges, and natural system discharges (e.g., hurricanes) have altered the lake hydrology and water quality [10]. Therefore, the P load to Lake Okeechobee has been over 500 metric tons per year over most of the past 30 years [11]. Although a portion of this P load has left the lake via the Caloosahatchee and St. Lucie rivers, a very large quantity of P remains in the lake as a legacy P reservoir, which is periodically remobilized by storm activity.
Bioavailable nitrogen is the limiting nutrient and, as such, it is an important nutrient in Lake Okeechobee [12,13,14]. However, P is a key nutrient and contaminant within this ecosystem since its excessive loading leads and amplifies the nitrogen limitation (i.e., secondary nitrogen limitation) and thus is the focus of this research [15,16]. Phosphorus has indeed led to water quality issues within Lake Okeechobee, the Greater Everglades Ecosystem, and the major discharge rivers to the east and west including the St. Lucie Canal/River continuum and the Caloosahatchee River, respectively. It is also noteworthy to assert that even prior to human intrusion, Lake Okeechobee suffered periods of eutrophication and anoxia [4]. However, the anthropogenic colonization of the region and subsequent linearization of the Kissimmee River caused it to become a drainage canal and increased the P (and other nutrients) loading into the lake. These high concentrations of nutrients entering the lake led to its partial eutrophication and recurrent algal blooms. As such, and despite its outlets, the lake has been converted into a large holding basin rather than a natural lake emptying south into the Everglades [15].
Since 1980, a number of water management actions have been utilized to lessen the degree of P loading of Lake Okeechobee, coastal ecosystems, and the Everglades ecosystem. Phosphorus source-control measures were implemented in the basins affected by inflow to streams from agriculture [17]. It was recognized that high concentrations of nutrients occurred in Taylor Creek and were associated with the dairy farms in its basin, which led to the purchase and removal of some dairy farms in this watershed [18]. In addition, agricultural runoff best management practices were implemented to control soluble and particulate P, and the meanders were placed back into the surface-water system of the Kissimmee River partly to help assimilate P. Despite all of these control measures, there has been a massive accumulation of P in the sediments of Lake Okeechobee and recycling of P from these bottom sediments into its water column. These sediments are considered to be legacy P sources [16,19]. The planned removal of organic sediments containing P inside the Hoover Dike was also implemented during some drought periods [20].
Prior to human alteration, water moved continuously southward from the central Florida area into Lake Okeechobee and then out of the southern part of the lake into the Everglades. After the construction of the Hoover Dike, discharge of water to the Everglades was redirected east and west. In the latest attempt to control P loading to the remaining Everglades, large man-made wetlands were constructed to treat the stormwater to remove P using submergent and emergent wetland plants in combination with epiphytic, epipelic, epilithic, and metaphytic algae [21,22]. However, the runoff during the wet season and occasional hurricane events continues to load the natural system with excess phosphorus. Another potential problem looms as possible increases in the dry and wet P fallout of African dust becomes a more common contribution [23]. Therefore, additional P removal will be required in the future to improve and maintain the natural systems associated with this ecosystem, particularly within the estuarine systems of the St. Lucie and Caloosahatchee Rivers.
A detailed understanding of the forms of P, and how it cycles through the natural system is necessary to develop new and innovative engineering methods to alleviate its environmental impacts. A key issue is the removal of the legacy P in Lake Okeechobee, a significant component of which is the fluid mud in the lake. The purpose of this research is to provide a detailed assessment of the occurrence and impacts of muddy bottom sediments in Lake Okeechobee.
2. History and Management of Lake Okeechobee with Its Associated Environmental Impacts
2.1. Geology of Lake Okeechobee
Geologically, Lake Okeechobee began as a geographic landform about 6300 years ago, but did not acquire its current morphometry until about 4000 years ago [7]. The lake likely had a higher stage in the geological past with the maximum level being reached during the Neo-Atlantic climatic interval, which was known for being hurricane prone [4,7]. The deepest part of the lake is currently located at or near mean sea level. Geologic formations occurring under Lake Okeechobee and along the Caloosahatchee River consist of the Tamiami Formation, the Caloosahatchee Formation, the Fort Thompson Formation, and the Lake Flirt Marl. Therefore, it is likely that the area from Lake Okeechobee to the west coast was a marine embayment with episodic sea level events that produced marine parasequences separated by thin, freshwater, laminated limestones. All of the marine flooding events in southern Florida from the Middle Pliocene to the late Pleistocene had termination high stand elevations of at least 7.6 m above sea level. Therefore, the limestone in Lake Okeechobee is of Middle Pliocene to Late Pleistocene in age. The presence of marine fauna in the lake bottom sediments indicates that the area was tidal during at least part of the Pleistocene.
Heilprin [24] described the pre-alteration geology of Lake Okeechobee based on direct observations made in 1886. The lake had an extensive sandy beach shoreline on the northern side and a predominantly sand bottom devoid of mud. The only muddy area was on the “immediate borders, where there was a considerable outwash of decomposed and decomposing vegetable substances” [24]. The consolidated mud on the lake bottom was not observed by Heilprin, because no systematic survey of the lake bottom was conducted. The vegetation along the northern lake margin was typically upland varieties with the south side being wetland varieties, which transitioned into the Everglades. Will [25] made observations of the south side of the lake, where he described eight stream channels oriented in a southerly direction and extending 1.6 to 3.2 km south into the Everglades [25]. The channels were up to 3 m deep and contained a mud bottom. The banks of the bayous were elevated 0.4 to 0.8 m above the lake stage and consisted of mud populated by willow, custard apple, and other wetland vegetation [25]. According to Will [25], who lived near the lake beginning in 1913, at high water, the lake extended north up to 9.7 km from the normal shoreline position.
The first systematic evaluation of the Lake Okeechobee bottom characteristics and sediment was conducted by Gleason and Stone [4]. They ran numerous bottom depth and seismic reflection profiles of the lake to help determine the bottom characteristics. In addition, they collected grab samples of the bottom and 82 sediment cores.
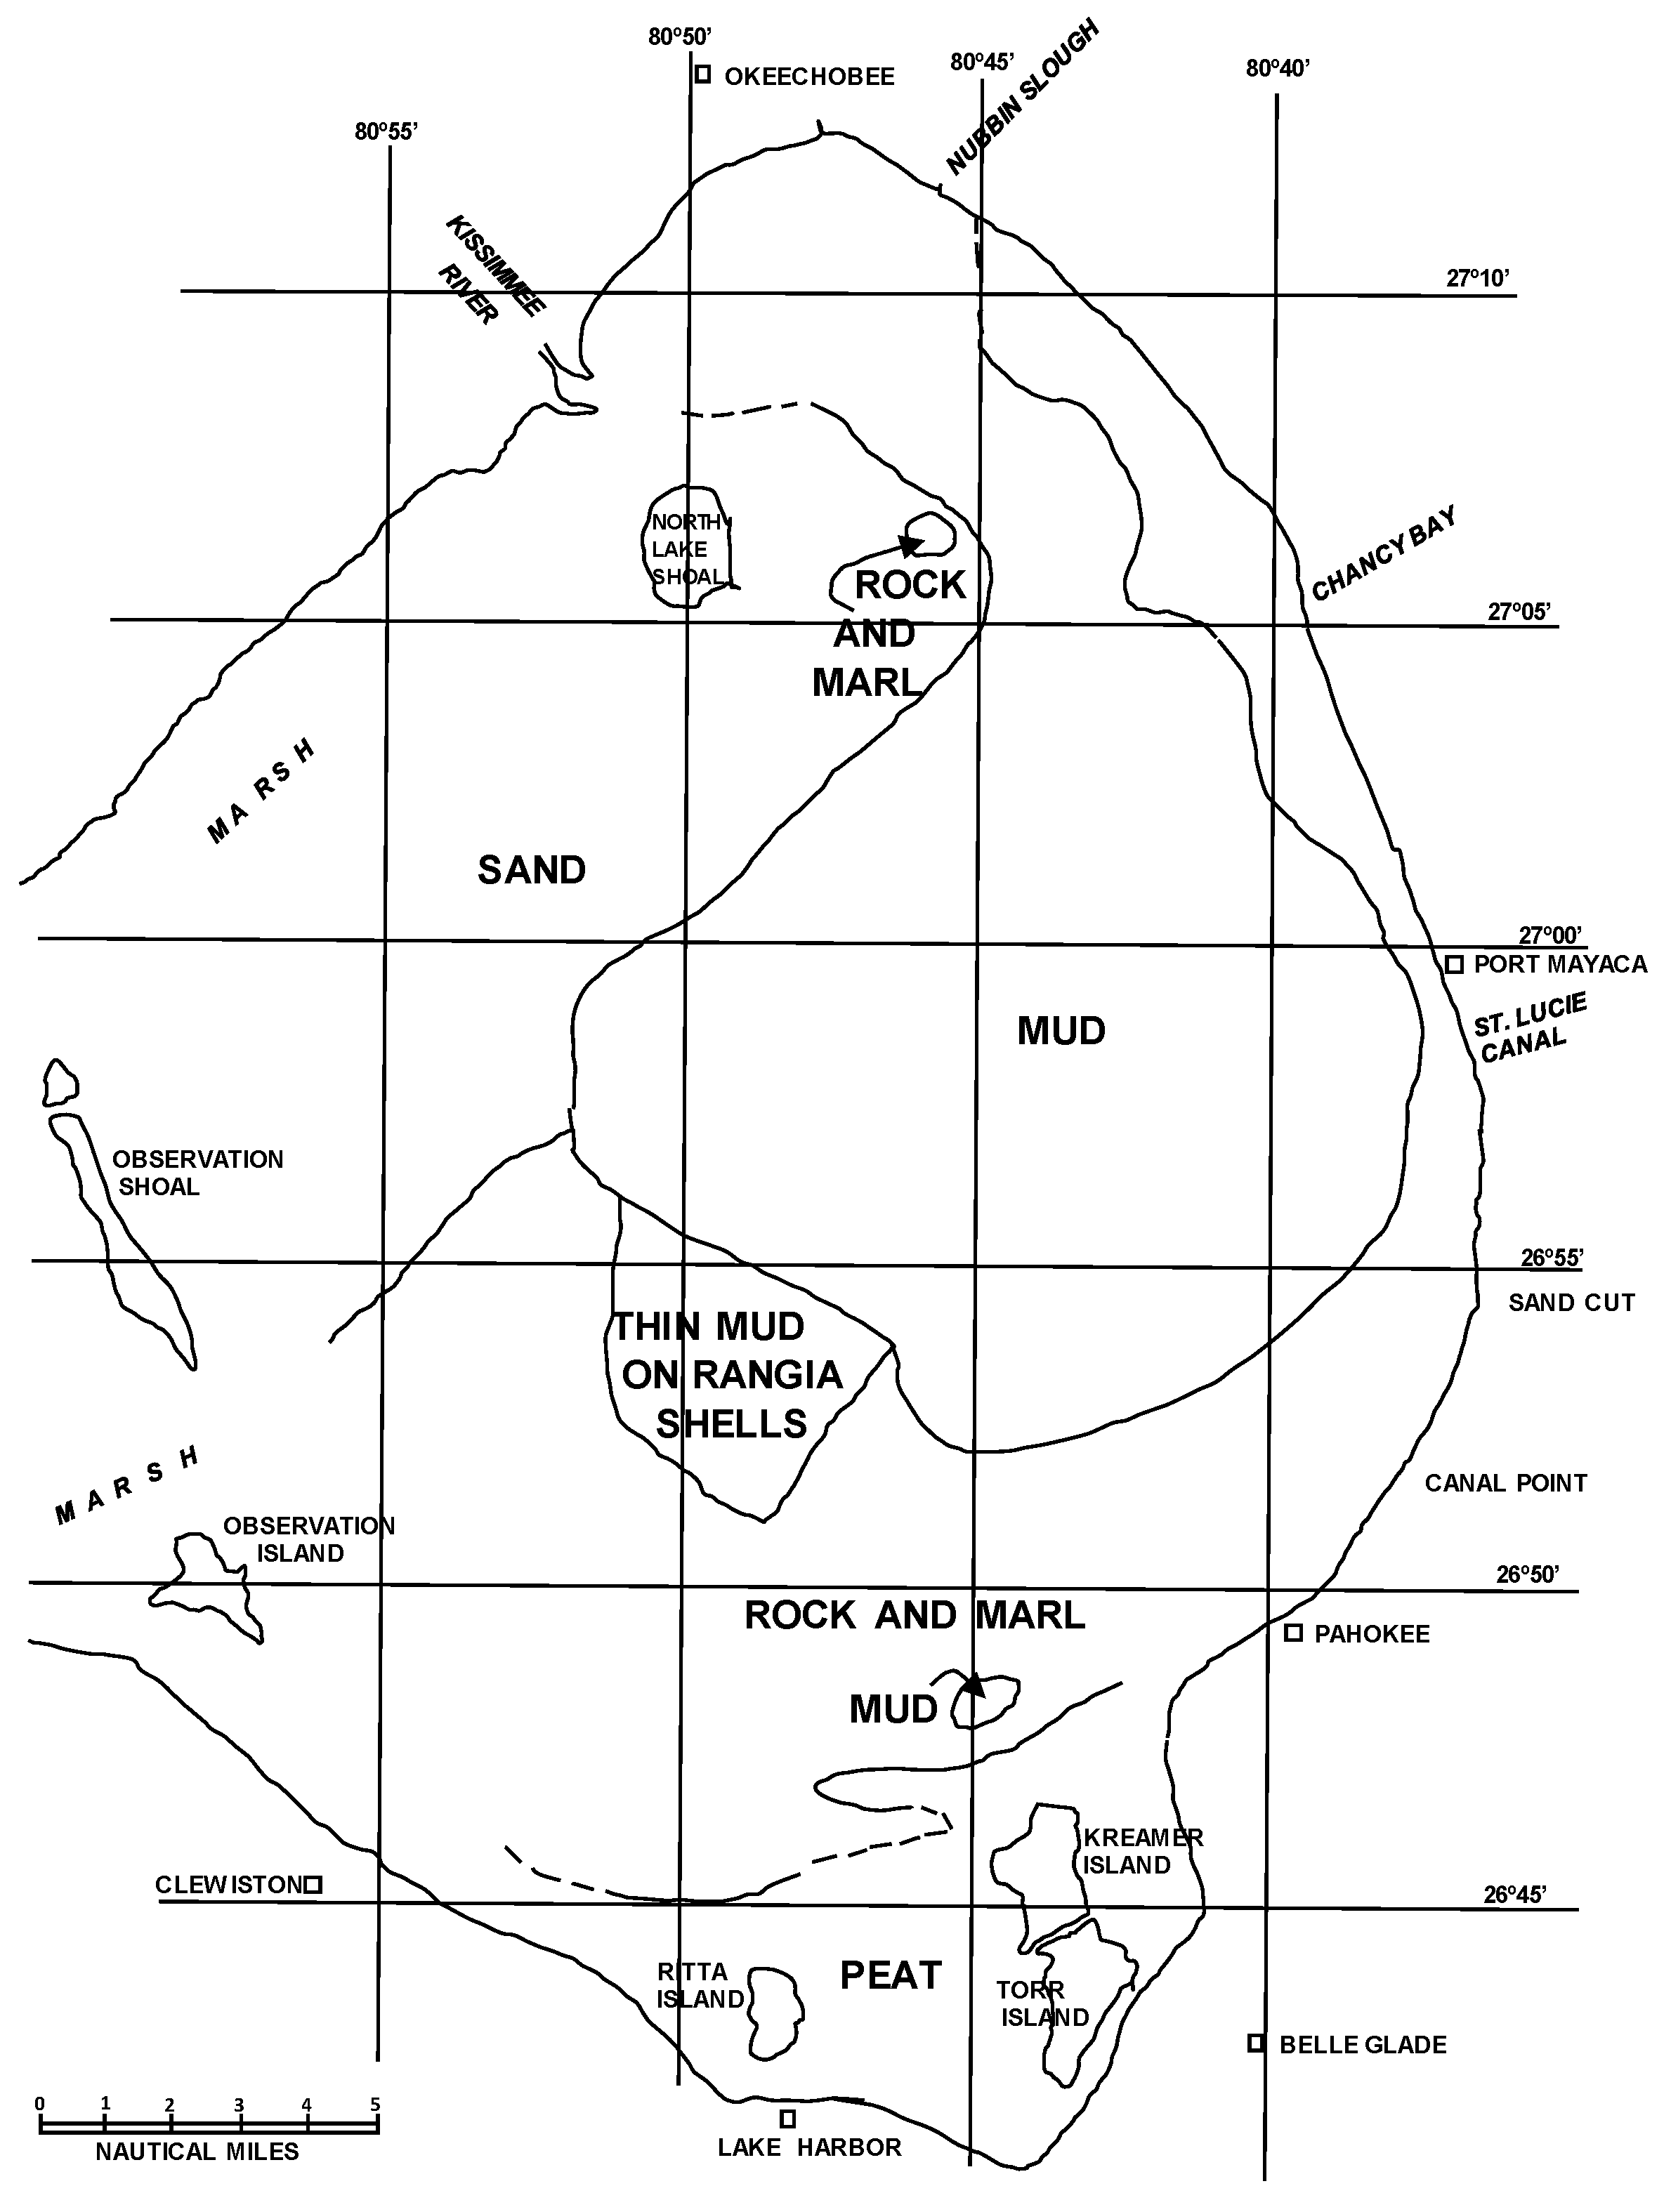
The investigation of the bottom sediments of Lake Okeechobee showed that about one-third of the lake bottom was covered with a stiff organic mud in 1975 [4]. However, most of the western half of the lake had a sandy bottom and the southern part of the lake bottom was rock or calcareous marl (Figure 3). The organic mud thickness ranged from 0 to 80 cm [4]. The map compiled by Gleason and Stone [4] showed the general bottom sediment pattern (Figure 3). A large sand area was found in the northwest area that consisted of quartz sand containing marine shells, predominantly Chione cancellata (currently termed Chione elevata as originally described by Say [26]). A lobe of mud was found from the northernmost part of the lake to the south into the deepest water. The mud appeared to be linked to the inflow areas of the Kissimmee River and Nubbin Slough. The mud lobe was bounded by rock and marl on the east and southern boundaries. An area of thin mud containing Rangia cuneata (Sowerby) was found. This mollusk species is a marine bivalve associated with the last time the lake was tidal, sometime in the Pleistocene. Freshwater mollusks were found along the southwest margin of the mud lobe in the lake bottom. Both deposits suggest that storm activity deposited the shell material, which was later covered by mud [4]. The southern margin of the lake contained marsh areas and peat deposits of variable thickness.
2.2. Shell Occurrence in the Mud and Implications of Mud Transport
The occurrence of freshwater mollusk shells within the mud may indicate that at least some of the mud deposits are relatively stable or was during the time prior to sampling and coring in 1975. The upper part of the mud contains hydrobiids, which commonly form layers in the cores and some are likely to be storm deposits buried by mud deposition during calm periods [4].
3. Muddy Bottom Sediments in Lake Okeechobee
3.1. Thickness and Volume of the Mud Unit in Time
Three types of mud occur in Lake Okeechobee: consolidated mud, partially consolidated mud, and a fluid mud layer that occurs in variable thicknesses in time [16]. The consolidated mud is dark-colored, layered, contains shell lag deposits, and has heterogeneous properties [4]. The partially consolidated mud has a brownish color and occurs along marginal wetland areas. The fluid or thixotropic mud occurs in some of the streams entering the lake such as the Taylor Creek/Nubbin Slough and as a thin layer occurring over a large percentage of the lake bottom [22]. It is unknown if the Taylor Creek/Nubbin Slough source of the fluid mud is significant in the overall fluid mud accumulation in the lake. The fluid mud occurs in some thickness throughout the lake, but has accumulated to the greatest extent in the deeper parts of the lake as a result of periodic resuspension and erosion of the partially-consolidated and fluid muds, influx of organic debris into the lake during storms, and erosion of organic debris/sediment from the edges of the lake.
The fluid mud is here termed “thixotropic”, because it exhibits some very specific properties that separate it from the consolidated mud as defined by Mewis and Wagner (2009) [27]. Thixotropy is a time-dependent shear thinning property. Certain gels or fluids that are thick or viscous under static conditions will flow (become thinner, less viscous) over time when shaken, agitated, shear-stressed, or otherwise stressed (time dependent viscosity). They then take a fixed time to return to a more viscous state. Some non-Newtonian pseudoplastic fluids show a time-dependent change in viscosity; the longer the fluid undergoes shear stress, the lower its viscosity. A thixotropic fluid is a fluid that takes a finite time to attain equilibrium viscosity when introduced to a steep change in shear rate. A thixotropic fluid occurring in a dynamic environment does not consolidate.
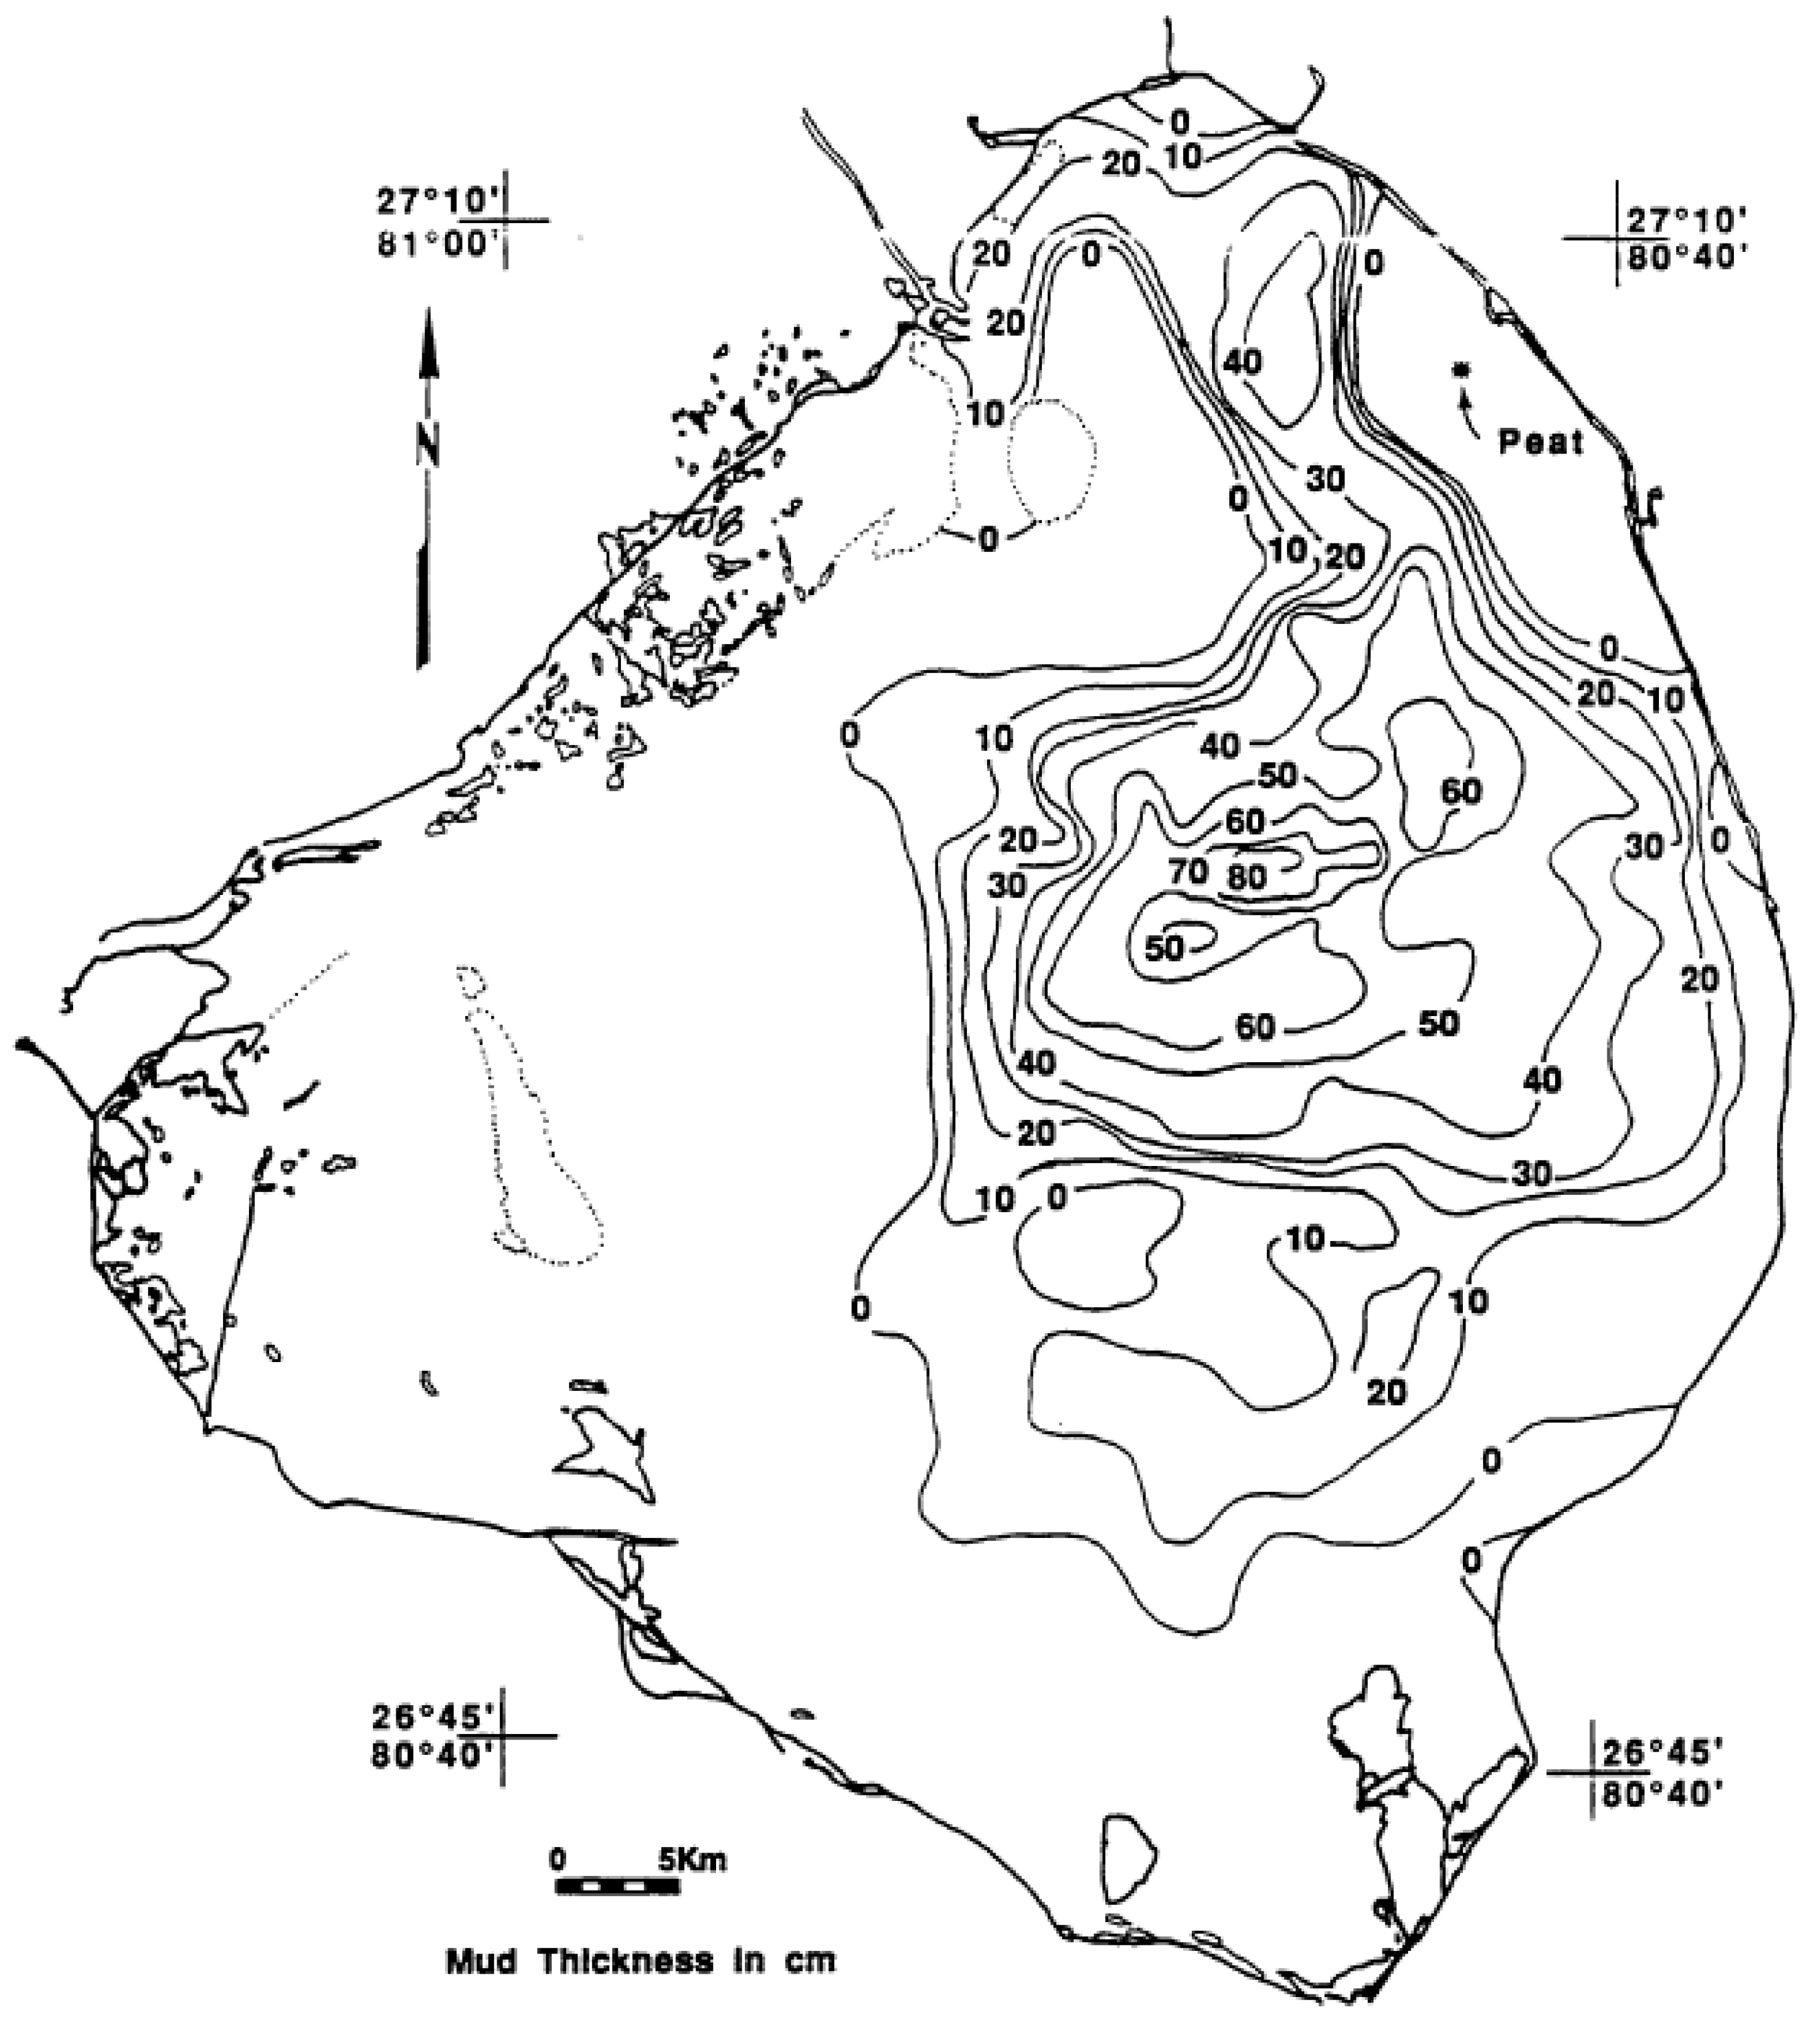
The thickness of the consolidated mud layer was initially mapped by Gleason and Stone [4] and is shown in Figure 4. The sampling locations were originally estimated by dead-reckoning and Loran C, and are not as accurate as modern positions determined by GPS. Therefore, the exact boundaries have some error, but the general pattern is considered accurate. The thickness of the mud ranged from zero to 80+ cm with a general correspondence between the highest thickness of mud and the greatest depth of the lake [4] (Figure 3). The average thickness of the mud was estimated to be 0.46 m or 46 cm. The total estimated volume was 201 × 106 m3.
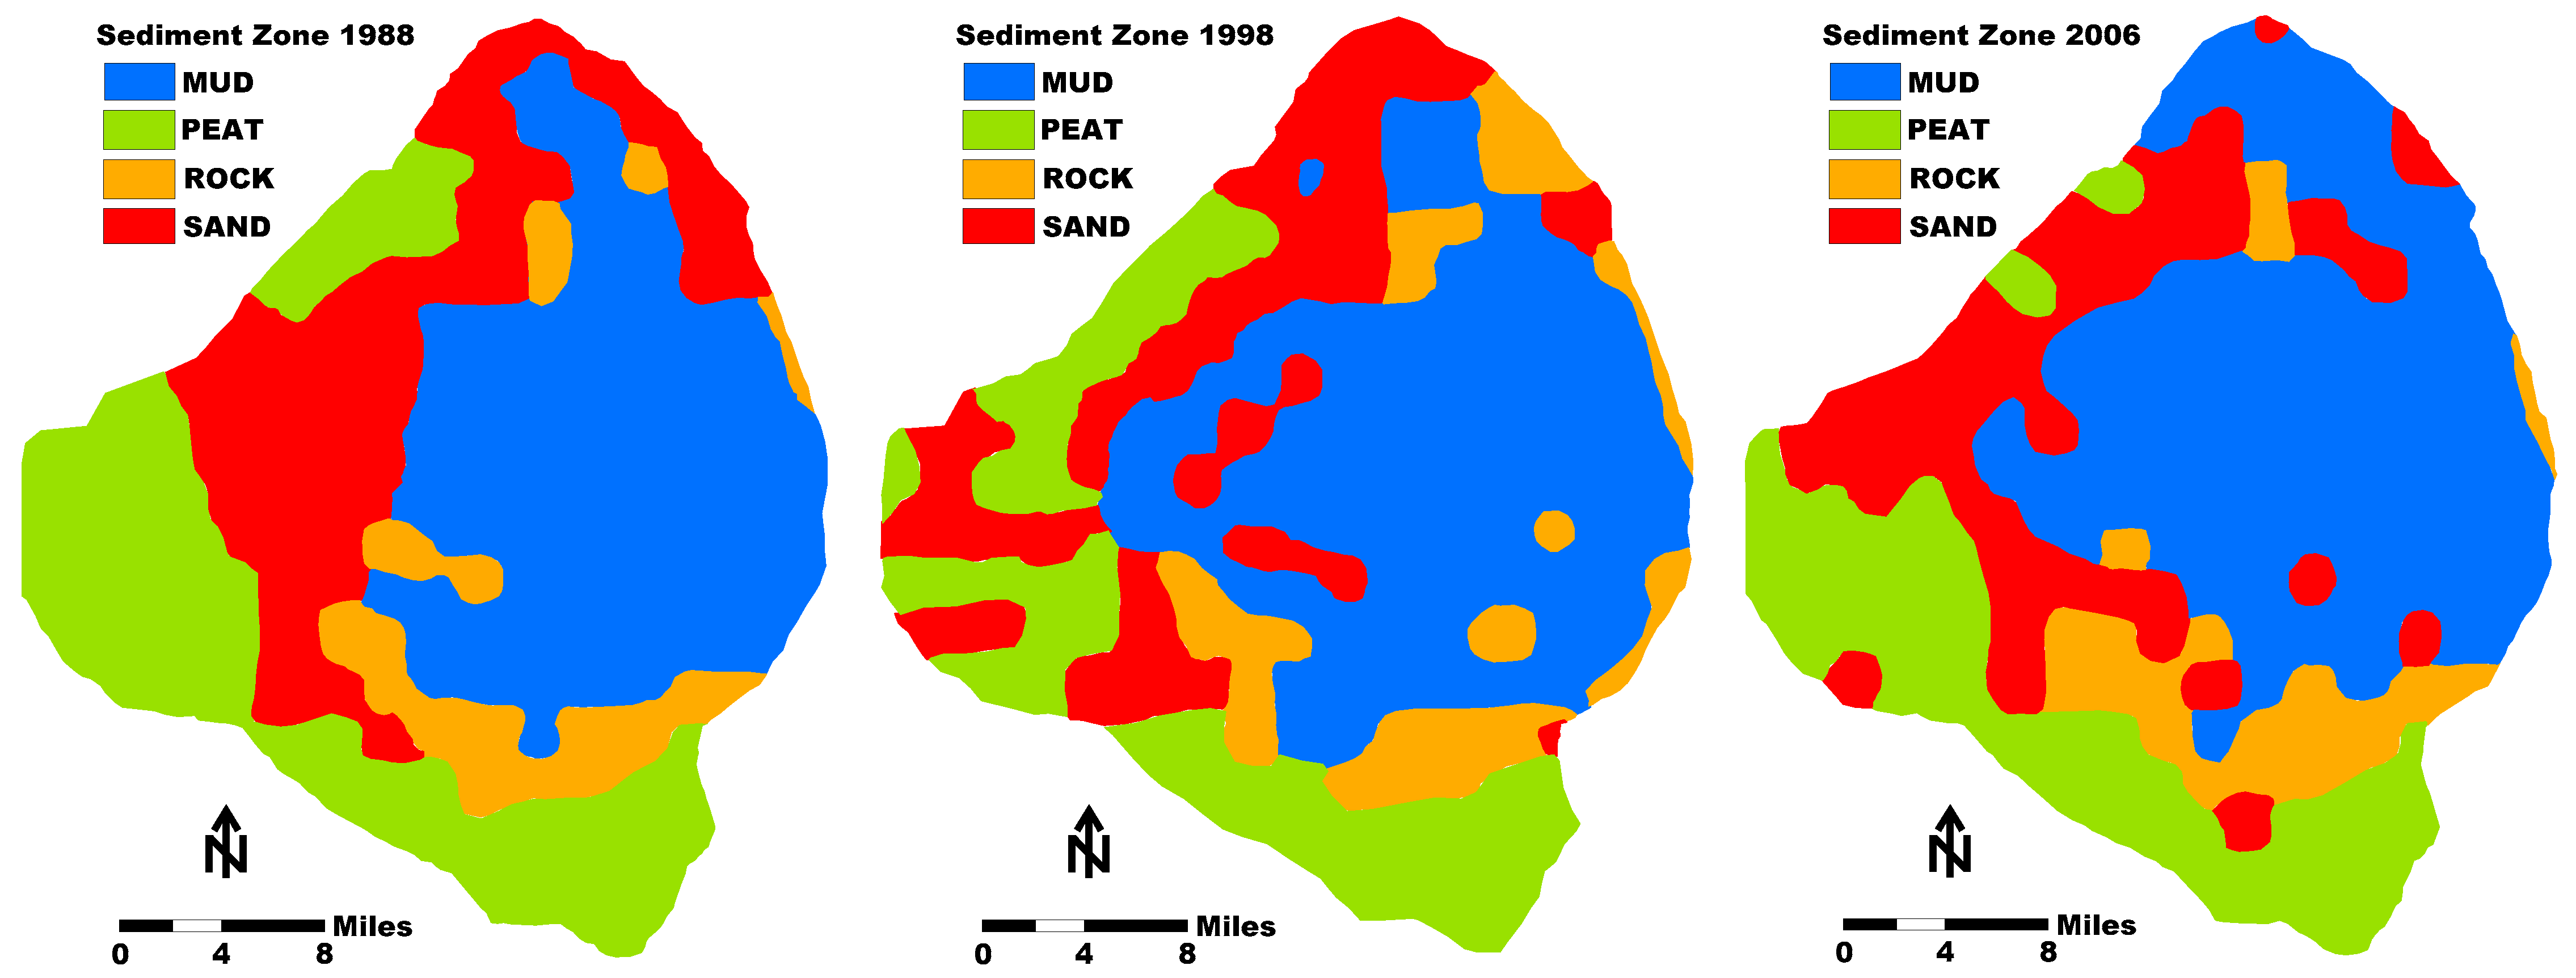
Subsequent surveys of the mud thickness in Lake Okeechobee were conducted in 1988, 1998, and 2006 [16,28,29,30] (Figure 5). The estimated average mud thickness was 66, 74, and 51 cm, respectively [20]. The calculated mud volumes were 219 × 106, 197 × 106, and 144 × 106 m3 [31]. Based on the use of modern GPS, the subsequent surveys may have a slightly greater accuracy. However, the mud volume thicknesses reported by Yan and James [31] seem to be somewhat different than the actual studies made. Gleason and Stone [4] estimated the mud volume to be 201 × 106 m3 (Figure 4). Kirby et al. [7] estimated the volume to be 193 × 106 m3. In addition, they also reported that a fluid mud layer was found in several cores that ranged from 0 to 10 cm in thickness. However, only the consolidated mud was mapped, and no comprehensive mapping of the fluid mud was made.
The data from the last three surveys suggest that the total volume of mud in Lake Okeechobee declined by 10% between 1988 and 1998 and by 27% between 1998 and 2006 with an overall decline of 52% between 1988 and 2006 [31]. An important consideration is that the 2006 measurements were made after a very active hurricane year when two major storms passed over the lake. This decline of mud volume in the lake is subject to considerable debate based on subsequent scientific investigation on the stability of the consolidated mud layer and the ability of storms to re-suspend it (see Section 4.1).
3.2. Composition of the Mud
3.2.1. Total and Organic Carbon Content of the Mud
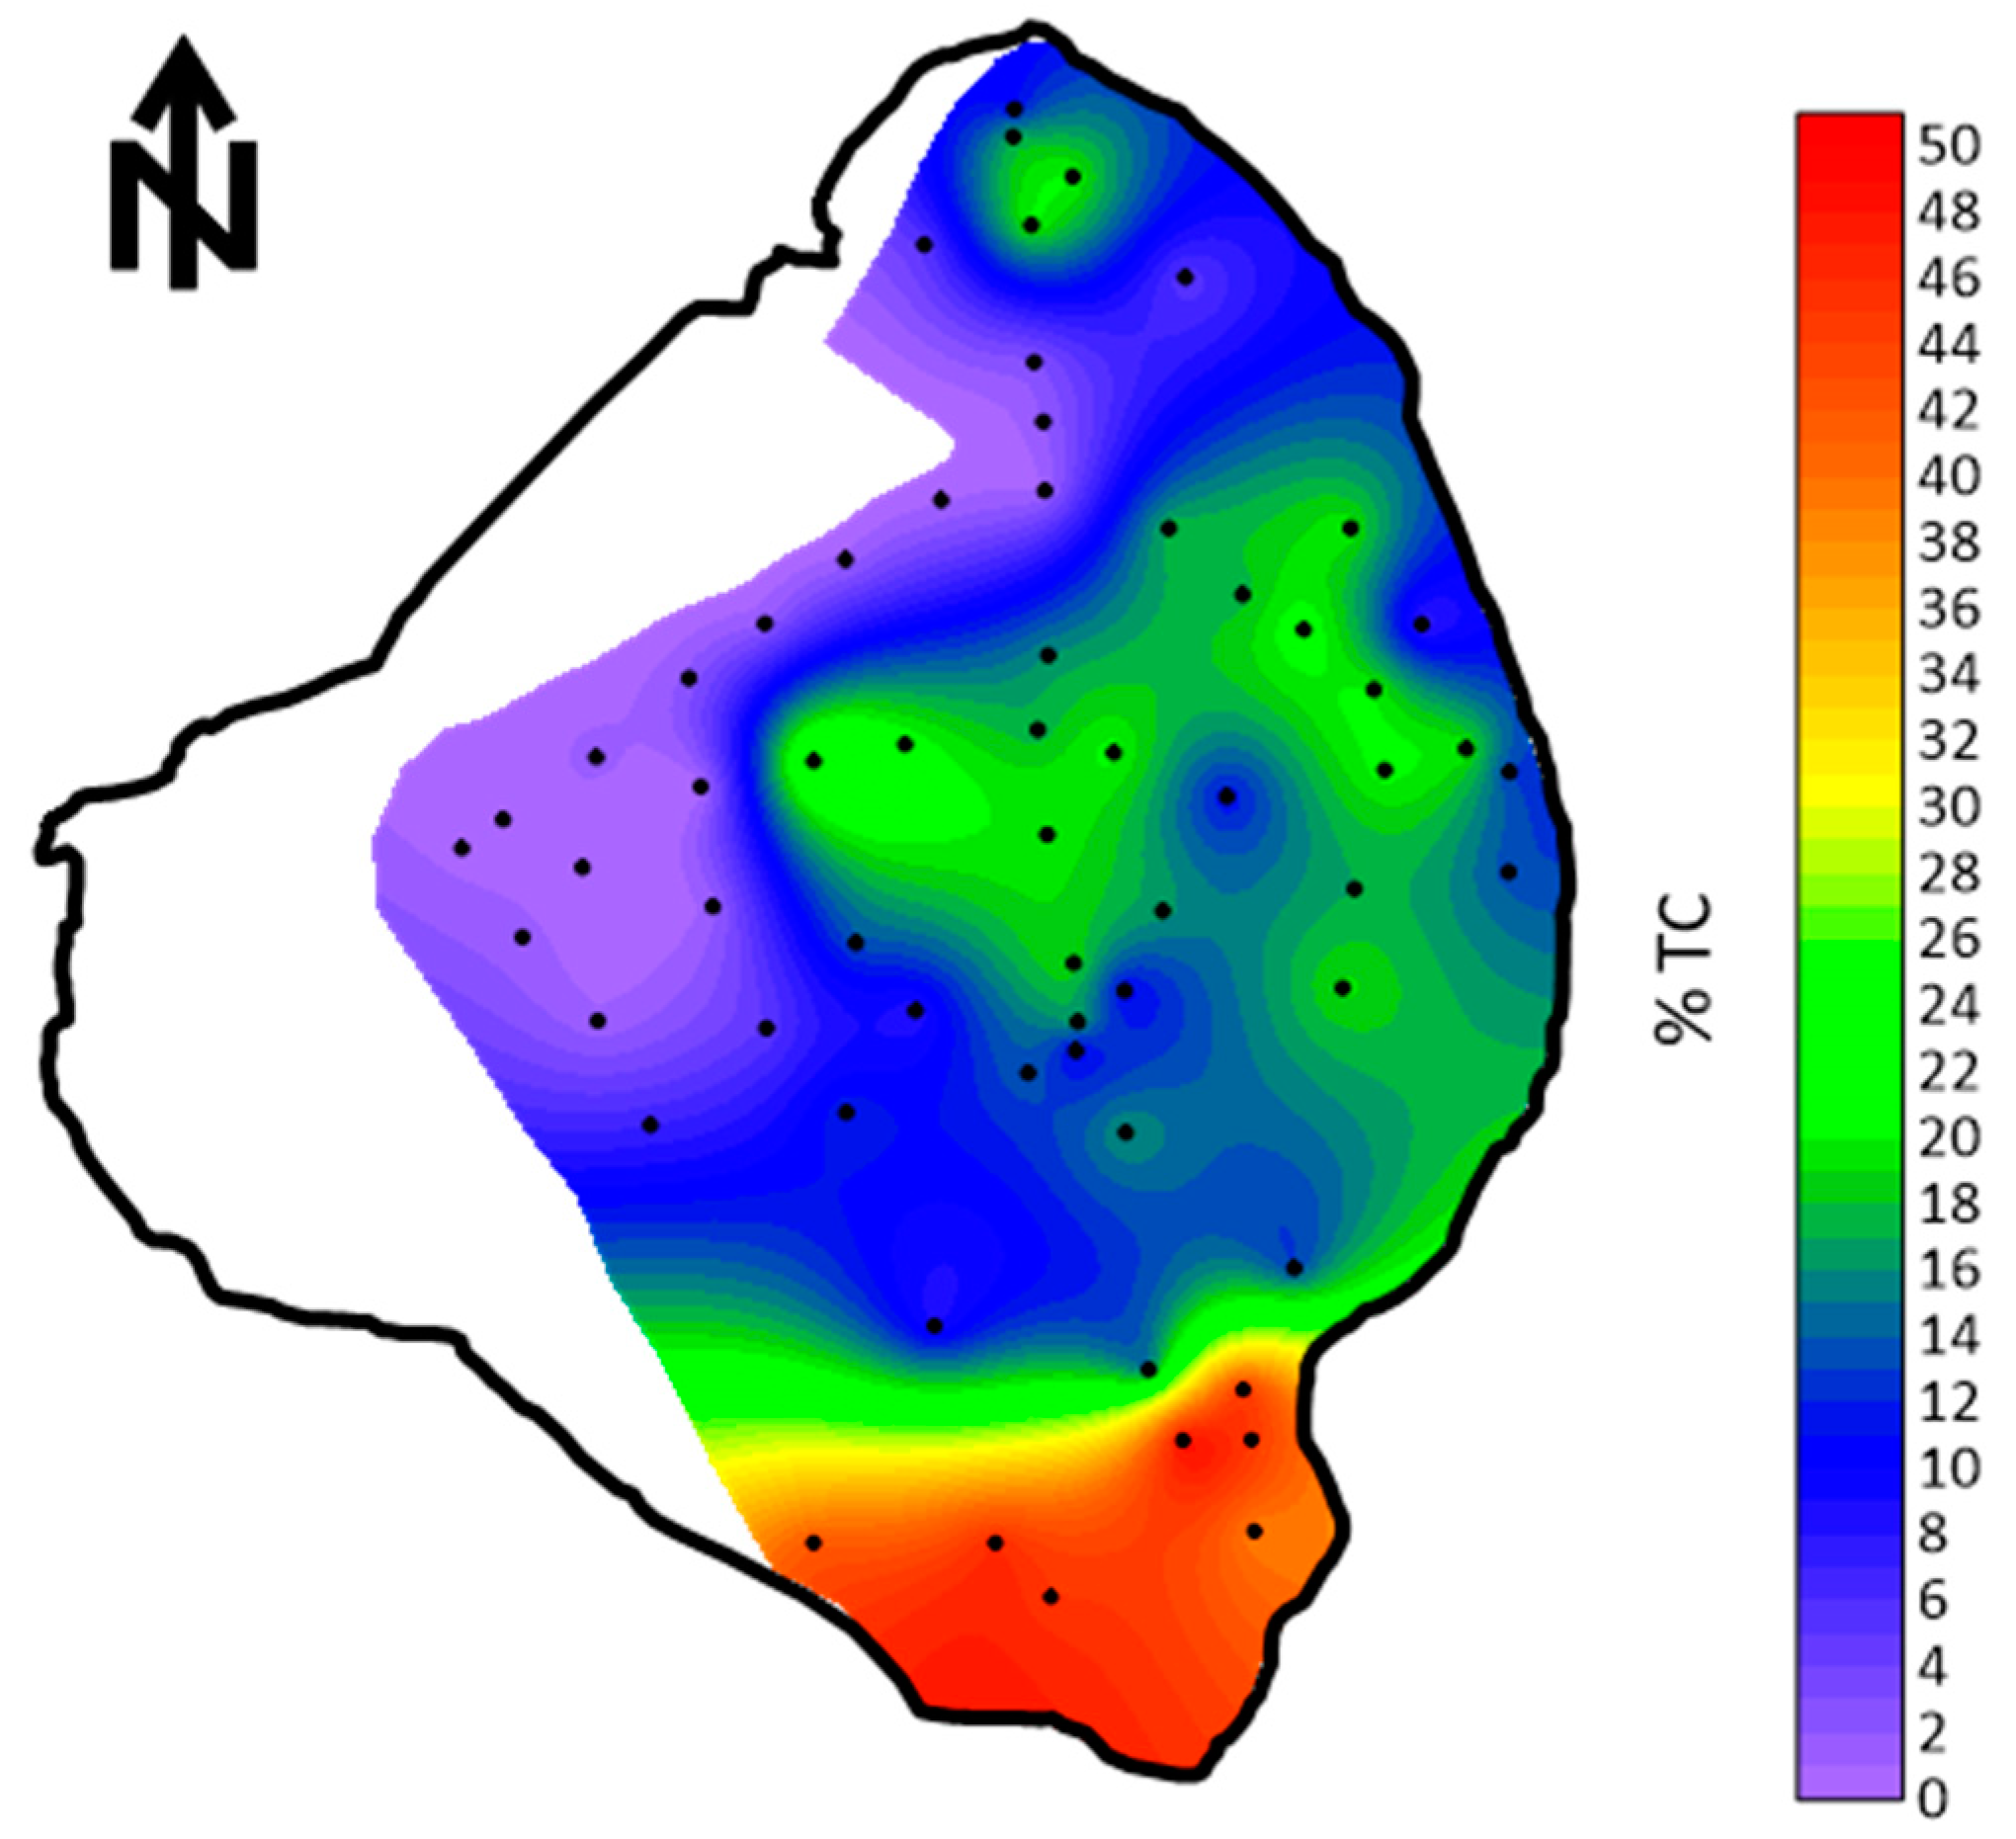
The first measurements of the total and organic fractions of the mud were made by Gleason and Stone [4]. The total carbon, consisting of both non-organic and organic carbon, was mapped using numerous samples across the lake bottom. The percentage of total carbon in the mud ranged from 10.3 to 21.3% (Figure 6). Based on only six samples, the mud contained between 17.3 and 25.1% organic material. Gleason and Stone [4] concluded that the likely origin of the mud was from transport into the lake and not from precipitation from phytoplankton. However, the non-organic carbon fraction in the form of fine calcite crystals could have originated in periphyton algal mats that can occur near the lake banks.
3.2.2. Phosphorus Content of the Mud
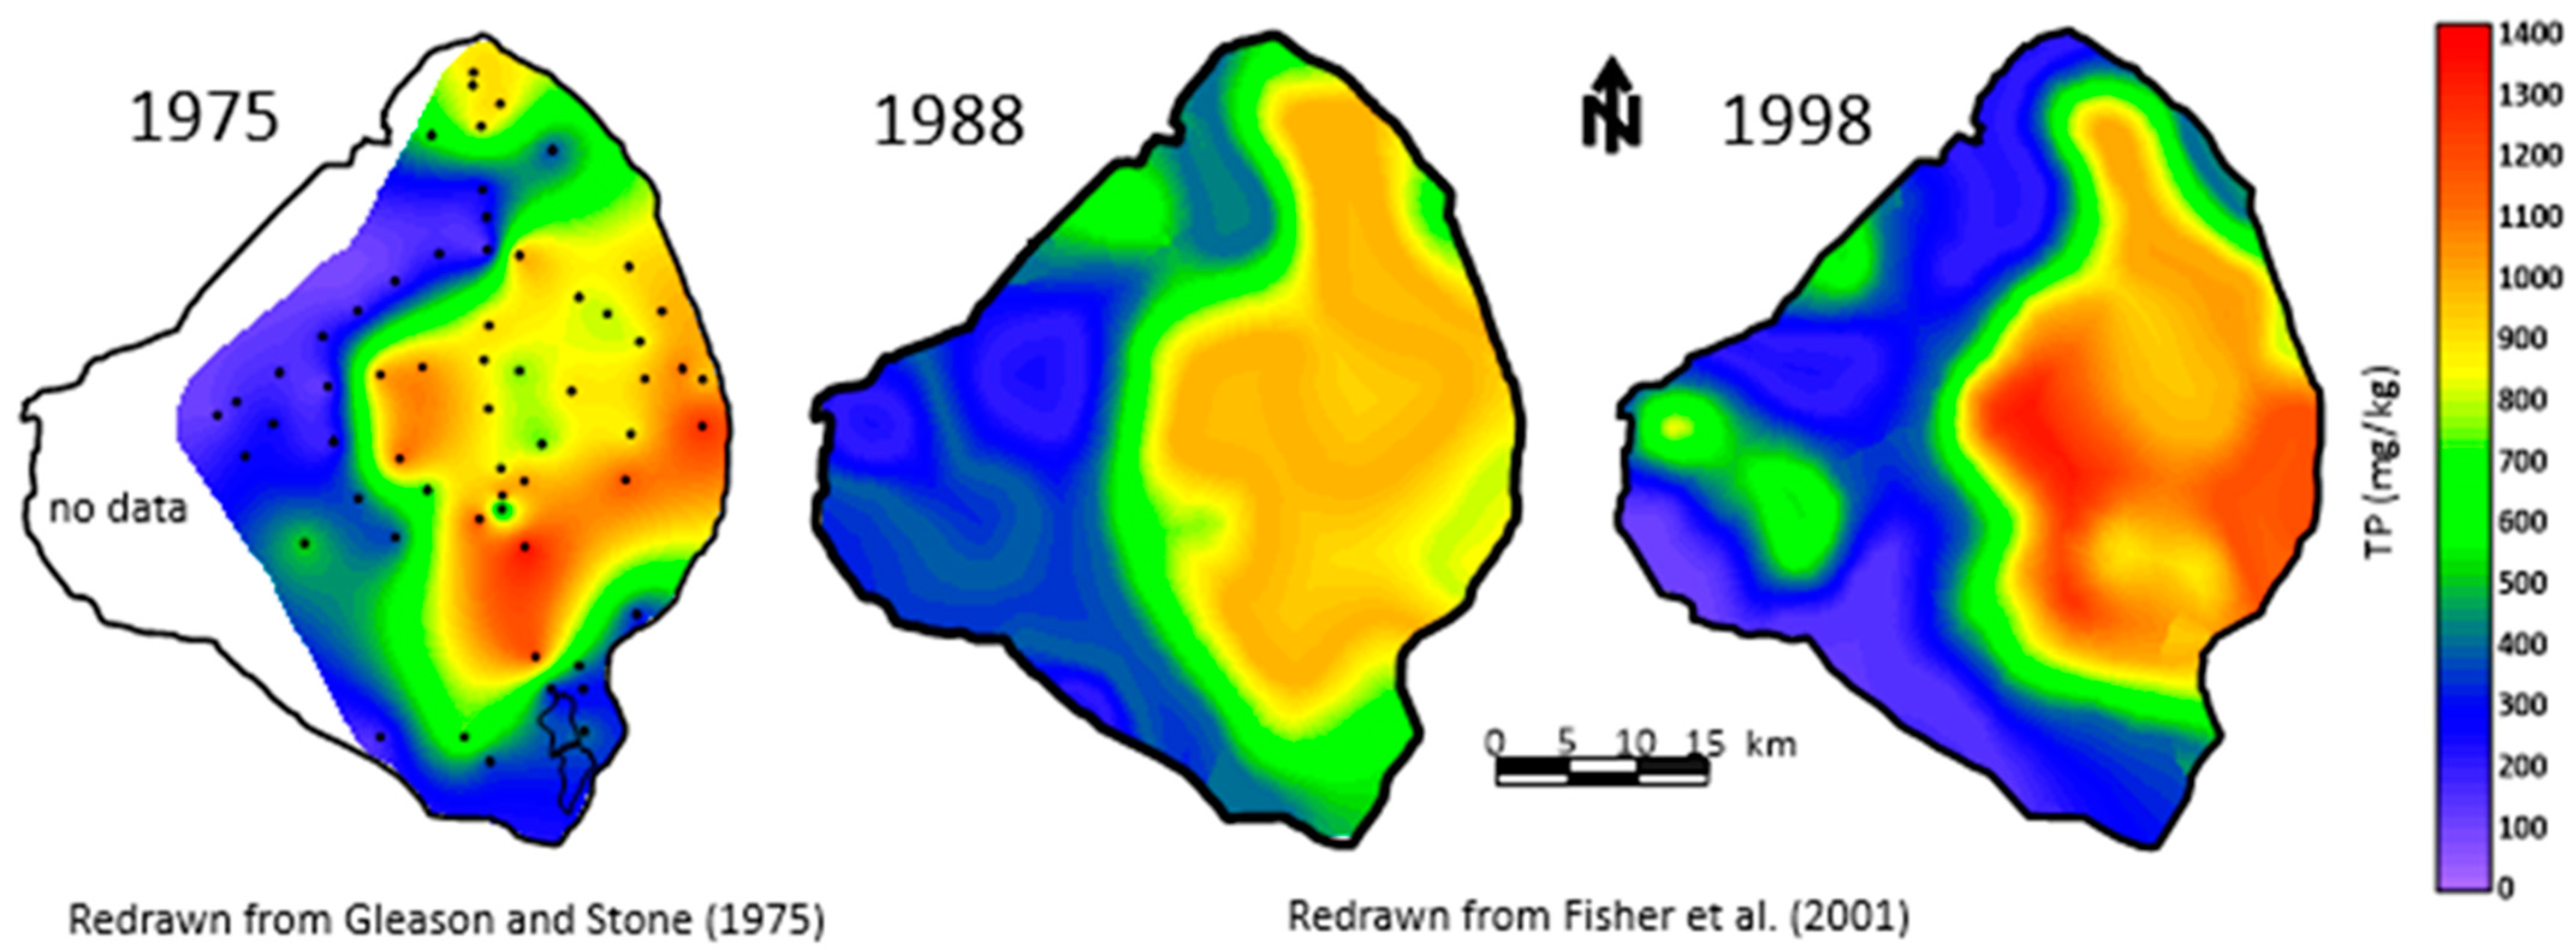
Another key parameter measured by Gleason and Stone [4] was the concentration of phosphorus in the mud, which ranged from 731 to 1353 µg/g (Figure 7). These values were much higher than the values found in the sandy sediments on the lake bottom and two to three times higher than in the peats found beneath the southern part of the lake. The phosphorus concentration in the three sediment types showed a consistent pattern with mud > peat > sand [4]. Gleason and Stone [4] calculated the total phosphorus stored in the sediment to be 45.12 × 10⁶ kg. They estimated that the time required to accumulate the phosphorus was 180 years, based on an annual rate calculated by Joyner [32] for the period 1 January 1969 to 31 January 1970. If the data from Davis and Marshall [33] measured in 1973–1974 were used, instead, for the time required to accumulate the phosphorus, it would take 72 years, which better matches the measured age of the mud (see Section 4.1). The total phosphorus measured in the upper 0–10 cm of the organic sediment for 1988 and 1998 was reported by Fisher et al. [29]. These measurements are considered more accurate than the original measurements based on better station positioning and improved laboratory techniques. Note that the pattern of the mud changed between the two measurements with some change in estimated volume. However, the estimated concentration of total P in the sediments varied little from 1034 µg/g in 1988 and 1035 µg/g in 1998.
3.2.3. Nitrogen Content of the Mud
The percent of nitrogen in the mud was also enriched compared to the sand. However, a comparison of the nitrogen in the sediments showed a different pattern compared to the phosphate, which was peat > mud > sand. The estimated quantity of nitrogen in the mud was 402 × 106 kg. An analysis of the annual rate of deposition based on the Joyner [32] nutrient data suggests that it took 230 years to accumulate the nitrogen in the mud. The Davis and Marshall [33] data suggest that the accumulation of the nitrogen in the mud took 67 years.
3.2.4. Iron Content in the Mud
Another substance that is important in creating algal bloom activity in the water column is iron. The percentage of iron as Fe2O3 in the mud ranged from 1.4 to 3.5%. There is a question concerning the form of iron in the sediments and the mechanism of how it was historically added to the lake (e.g., decay of aquatic vegetation, atmospheric fallout). However, since there is a significant presence of sulfur, the iron may occur within the mineral pyrite (FeS2), and is not bio-available as long as the conditions are chemically reducing, when the sediments are mobilized in the water column. However, the oxidation of the pyrite could release some iron into the water column during storm activity.
3.2.5. Shell Occurrence in the Mud and Implications of Mud Transport
The occurrence of shell within the mud may indicate that at least some of the mud deposit is relatively stable or was during the time prior to sampling and coring in 1975. The upper part of the mud contains hydrobiids, which commonly form layers in the cores and some are likely storm deposits buried by mud deposition during calm periods [4].
The interstitial water collected from the mud showed high concentrations of orthophosphate and ammonium [4]. When the muddy sediments are mobilized, the interstitial water is released into the water column and adds to the overall load of nutrients in the lake water.
4. Dynamics of Sediment Transport and Movement
Based on the research done to date on Lake Okeechobee, there are conflicts in the possible role of the muddy sediment in terms of impacts on lake water quality. Studies on the thickness and volume of the sediments suggest they are dynamic and have potential for remobilization during and shortly after storms. These remobilizations impact the water column and release nutrients, causing rather rapid triggering of algal blooms. However, chronological investigations of the consolidated bottom mud seem to indicate a degree of stability. In addition, Kirby et al. [7] concluded that “The microscopic primary fabric is clear evidence that the deeper layers of the mud patch are not susceptible to frequent reworking.”
4.1. Chronological Assessment of the Consolidated Mud in Lake Okeechobee
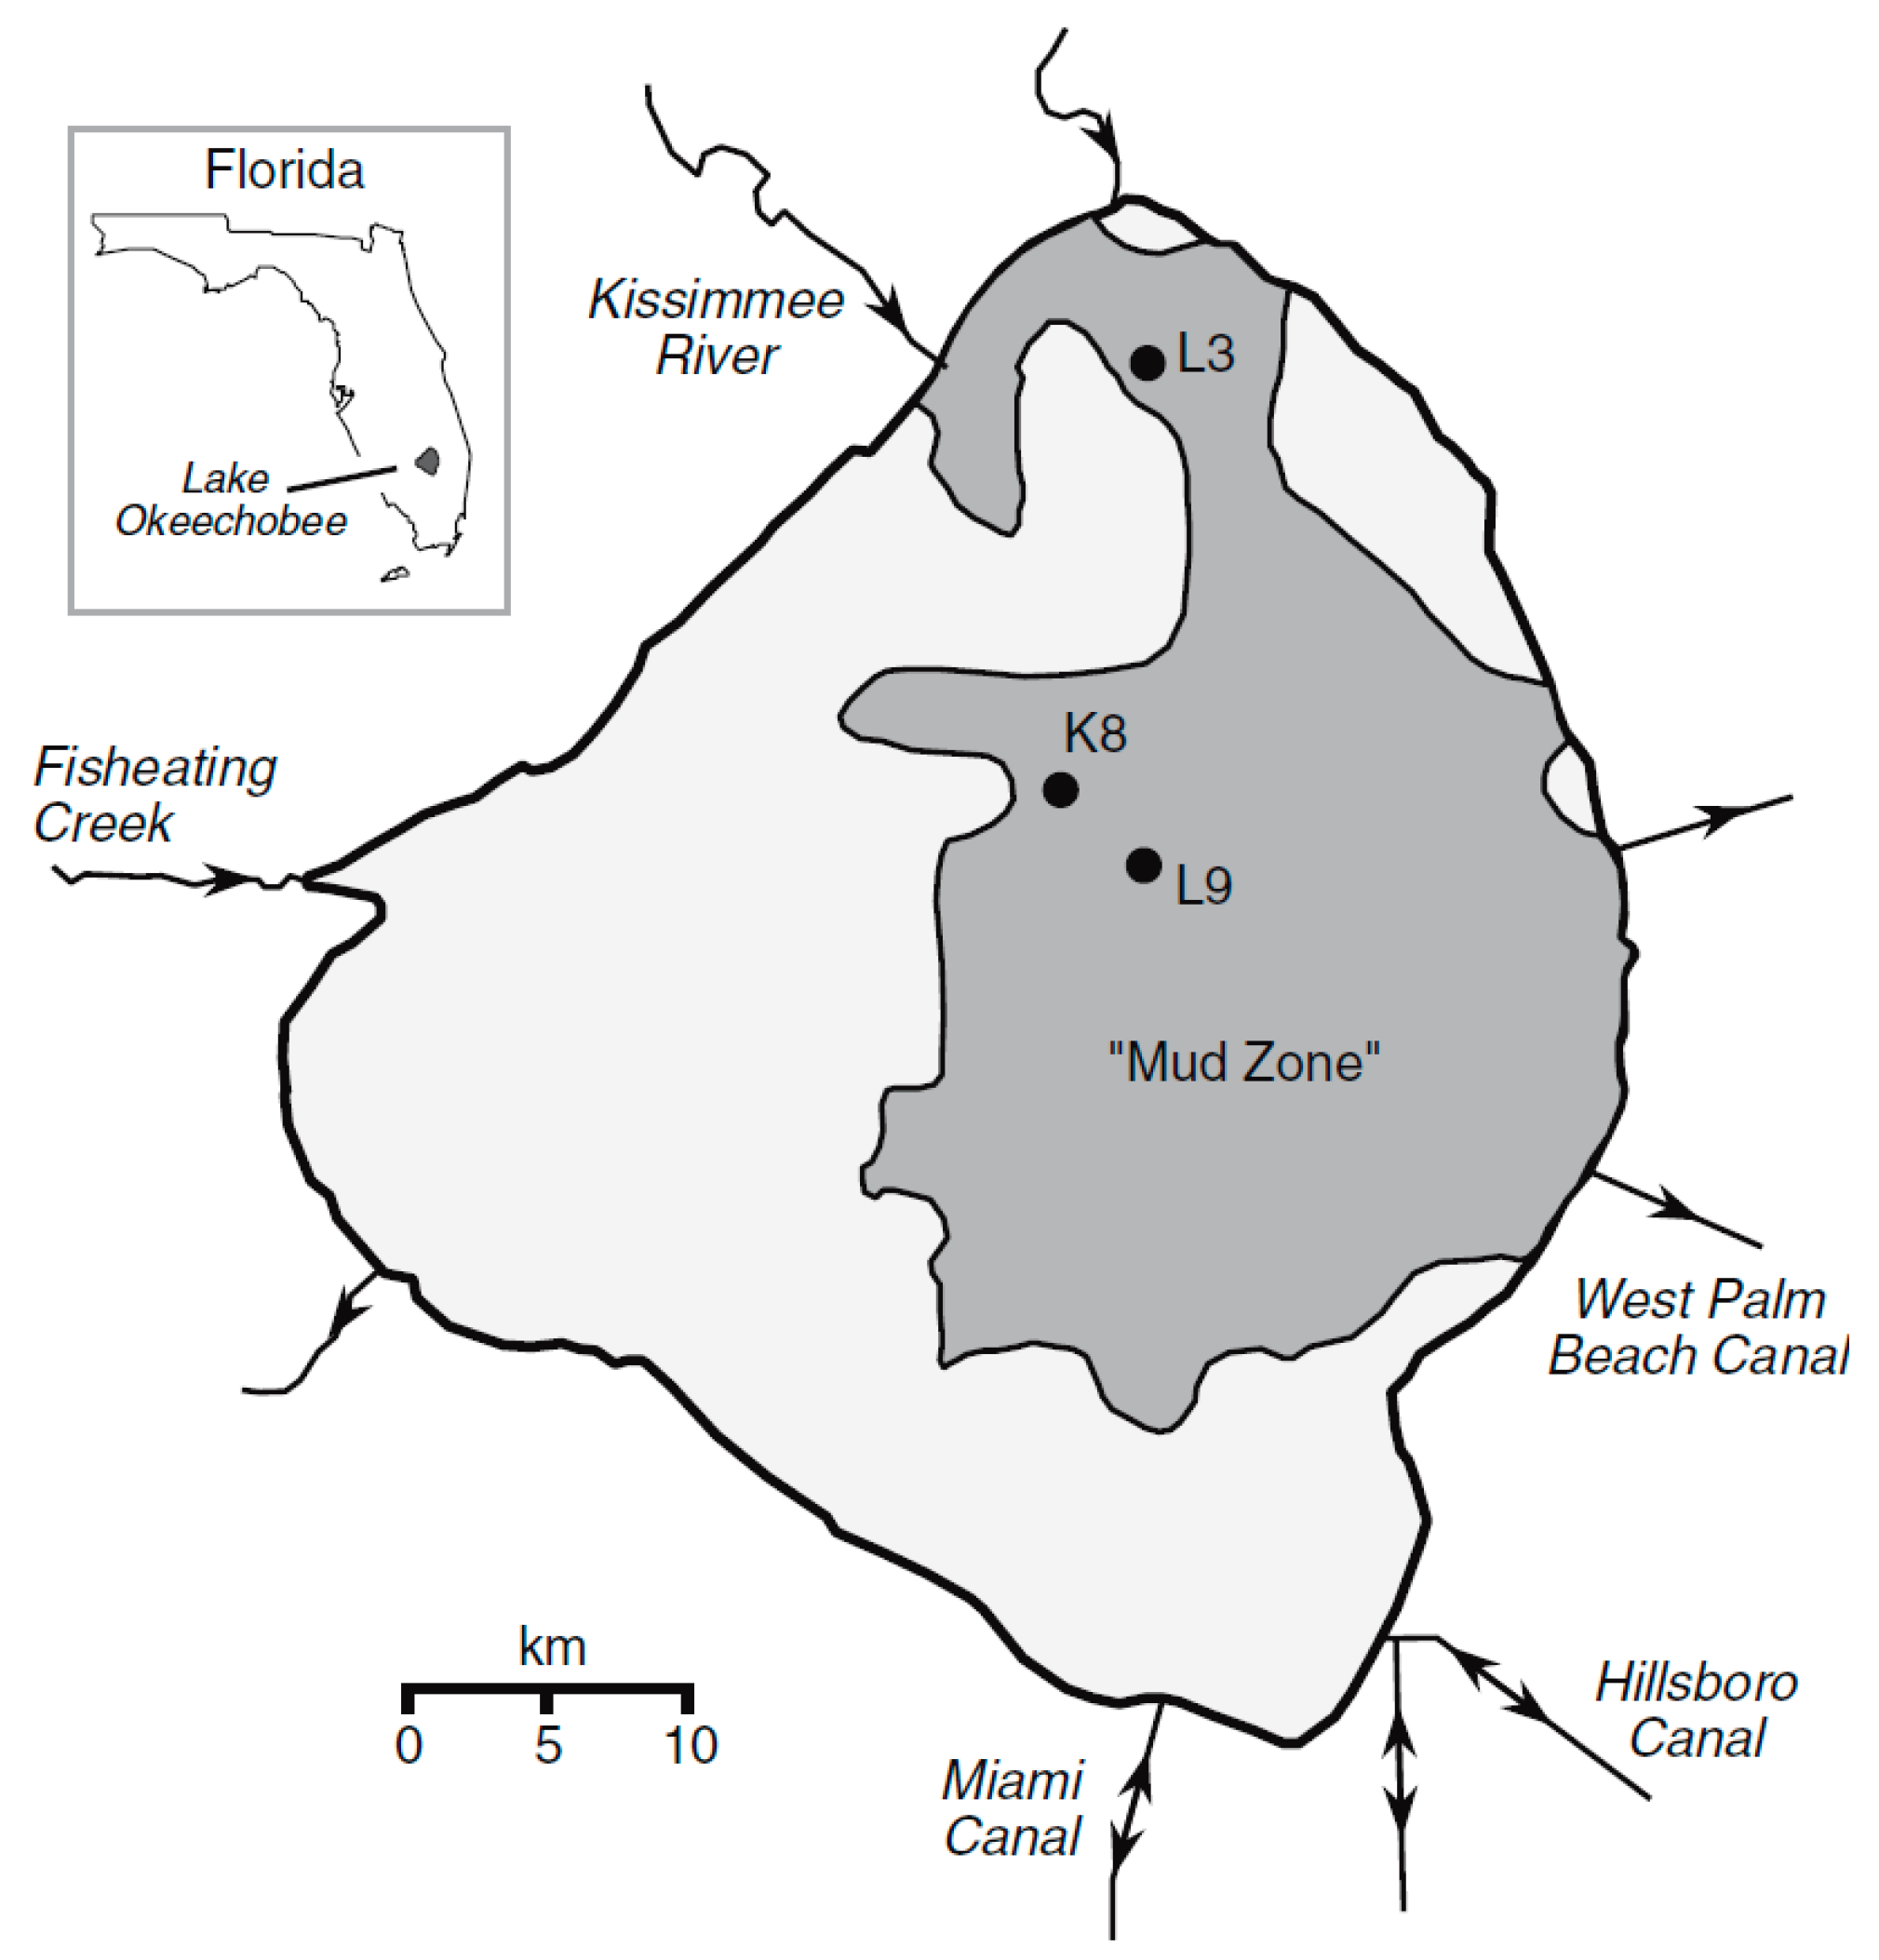
Three cores were obtained from the mud “zone” of Lake Okeechobee and detailed measurements of radioactive isotopes were performed to determine the age and stability of the sediments [34]. The locations of the cores are shown in Figure 8.
The cores were 85, 42, and 41 cm in length corresponding to sites L3, K8, and L9, respectively. All of the cores showed a clear delineation with the underlying sediment, either marl or quartz sand. The cores contained layers of gastropods [4]. The activity of 210Pb showed a steep decline from the surface to a depth of 10 cm with a lower slope of decline below that depth. The calculated ages for the muds showed a range from 2006 to about 1880 in L3, from 2006 to 1880 in L9, and 2006 to 1940 in K8. Calculated ages in the cores produced similar results using 137Cs activity. Based on the isotope dating analysis, Schottler and Engstrom [34] concluded that the muddy sediment was not disturbed to any significant degree since 1930. However, prior to this time, there is some indication that the mud could have been disturbed. The lake did have a direct perturbation event in 1928 as a category 4 hurricane passed over it and caused the historical muck dike surrounding the lake to breach [25]. Their conclusion for the 75-year relatively stable period from 1930 to 2005 seems to contradict the changes in mud distribution found by comparing the mud thickness between 1998 and 2006. Another contributing factor could be that two major hurricanes impacted the lake in 2004.
4.2. Impact of Density and Shear-Strength on Mud Transport
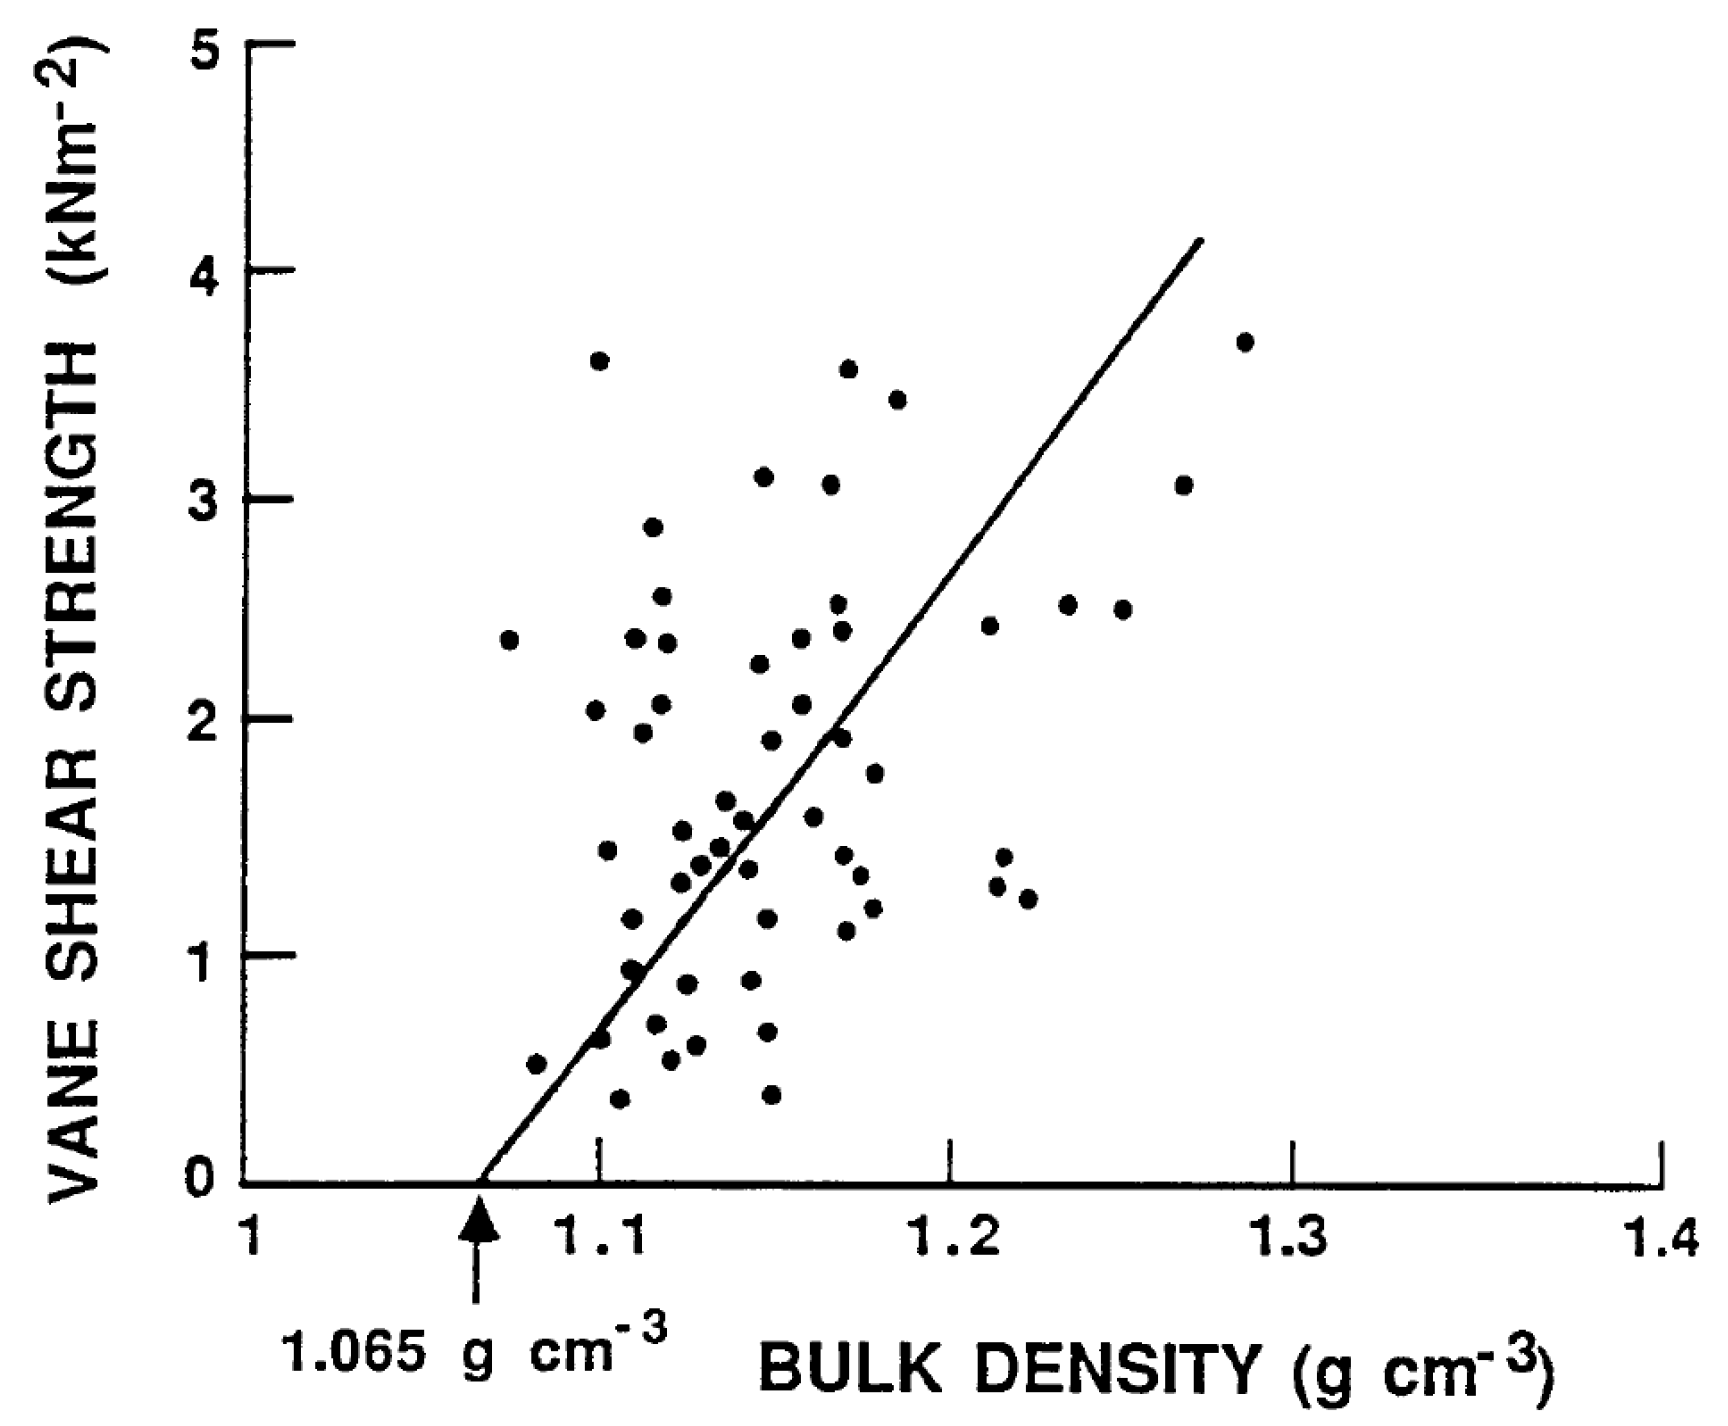
The shear strength of mud is a key factor affecting potential remobilization by bottom current velocity (erosion), regardless of whether it is a current or wave-orbital motion. Detailed measurements of the density and shear-strength of the mud units in Lake Okeechobee were made [7,35]. The upper 0 to 8 cm of the mud contained the thixotropic unit (see Section 3.1). The in situ measurements yielded densities ranging from 1.01 to 1.03 g/cm3. The shear-strength was below the detection limits of the instrument. It has been documented that at density values below 1.065 g/cm3, the shear-strength becomes zero, which means the mud behaves as a fluid and can be entrained, resuspended, and mixed quite easily. The mud densities in the consolidated unit ranged from 1.2 to 1.3 g/cm3. These values had shear-strengths generally over three times the critical value for erosion. Numerous measurements were made to determine the relationship between bulk density and shear strength in the Lake Okeechobee sediments [35,36] (Figure 9).
4.3. Occurrence of a Thixotropic Organic Mud Unit (Organic Floc Layer) in Lake Okeechobee
Based on studies of the consolidated mud deposit on the bottom of Lake Okeechobee and the difficulty in eroding and remobilizing it, there must be an additional source of sediment that has more mobility [10]. In fluid density profiles, Kirby et al. [7] found that a fluid mud ranging from 0 to 10 cm in thickness occurred at the top of several cores. They also believed that this unit was more susceptible to resuspension. Hansen et al. [37] described an unconsolidated “floc” layer above the consolidated mud in their study of sediment resuspension in Lake Okeechobee. The layer was about 10 cm thick lying atop the consolidated mud layer. Moore et al. [19] described the occurrence of an “organic floc” layer that was 2 to 5 cm thick in the Kissimmee River and Taylor Creek in proximity to Lake Okeechobee. They also found a 2 to 5 cm thick layer of “organic floc” at sampling station 17, which was located about 10 km due south of the entrance of the Kissimmee River into Lake Okeechobee. A core collected on 14 June 2020 by our research team, showed an “organic floc layer” 10 to 20 cm thick above the consolidated mud (GPS location-N 26°57.245′, W 080°45.138′). A shallow core and a water column sample collected by the authors in July 2020 contained the dispersed floc material in the water column above the bottom sediment. When the fluid material (organics and mud) settled, it was 5 to 10 cm in thickness.
The influx of thixotropic organic mud into the lake may be occurring as direct flow from entering streams, especially the Taylor Creek/Nubbin Slough where this layer is known to occur on the bottom. Vegetative storm debris carried into the lake during hurricanes may also contribute to the layer. In-lake processes such as periodic erosion of wetland areas located inside of the Hoover Dike and mixing events that incorporate poorly consolidated sediment into the organic floc could also contribute to this layer.
4.4. Wave and Storm-Induced Impacts on the Muddy Sediment in Lake Okeechobee
Wind-induced re-suspension of sediments is a common global occurrence in shallow and deep lakes [37,38,39,40,41,42,43,44,45,46,47,48,49,50,51,52,53] and Lake Okeechobee is no exception [37,52,54,55]. A series of modeling efforts were used to assess the resuspension issue along with wind-related variation in phosphorus concentrations in Lake Okeechobee [7,22,37,38,52,53,55,56,57,58,59,60].
The modeling work conducted by James et al., (1997) [55] concentrated primarily on inorganic sediment resuspension. They had difficulty in determining the settling rate of the sediments during the initial modeling efforts. They used the WASP model to compute the sediment resuspension from bottom shear stress [61]. The resuspension part of the model was used primarily to evaluate the inorganic suspended solids and not the thixotropic organic/inorganic mud. During the initial run, the concentration of suspended sediments was underestimated. A key finding was that the internal flux to external load ratio showed that resuspension exceeded external loading by 123 times. This is consistent with the presence of the thixotropic mud laying within the lake.
Bachmann et al. [52] modeled Lake Okeechobee and a large number of other shallow lakes in Florida to research resuspension of bottom sediments. In their modeling efforts, they calculated the following: (1) the surface area of the lake subject to resuspension of sediments; (2) the percentage of the lake bottom disturbed 50% of the time; (3) the cumulative percentage of time that 50% of the lake bottom was disturbed; and (4) the percentage of time that 100% of the lake bottom was disturbed. The modeling exercise was based on some common principles in wave dynamics. The first principle states that when the water depth is less than half the wavelength, the horizontal water movement at the lakebed may be sufficient to resuspend sediments [40]. Additionally, the dynamic ratio of Håkanson [39], defined as the square root of the lake surface area in square kilometers divided by the lake depth in meters, was found to impact the potential for resuspension. Thus, it was assumed that lakes with a higher dynamic ratio are subject to a greater degree of sediment resuspension. Bachmann et al. [52] found the following: (1) the surface area of Lake Okeechobee was 1292 km3; (2) the mean depth was 2.4 m; (3) the dynamic ratio was 14.98 km/m; (4) the percentage of area subject to sediment resuspension was 100%; (5) the percentage of area disturbed 50% of the time was 90%; (6) the percentage of time 50% of the lake area had a disturbed bottom was 50%; and (7) the percentage of time 100% of the lake bottom is disturbed was 39.5%. A critical aspect of this investigation was that the bottom sediment was easily re-suspended based on the wave-generated orbital stress across the bottom. In well-consolidated muds, the required water velocity to resuspend consolidated clay-sized sediments is quite high and would not likely support the calculation estimates following the fundamental wave dynamics evaluated [7,62]. However, if bottom sediments are not well-consolidated with low density and high-water content, they can be readily resuspended. A thixotropic sediment or organic floc unit can be easily resuspended at a potential rate higher than calculated by Bachmann et al. [52]. Therefore, the wetland areas located along the western margin and the thixotropic sediments on the bottom of Lake Okeechobee are subject to resuspension in wind events occurring throughout the year, likely occurring greater than 50% of the time. Based on the difficulty in resuspending the consolidated sediments and the maps showing the changes in bottom sediment thicknesses (Figure 5), there may be a third type of mud on the lake bottom (brown mud), which has a density lying between the consolidated mud and the thixotropic mud. This material may settle to the bottom, but not consolidate to a consistency that makes it resistant to re-suspension.
4.5. Recycling of Organic Phosphorus from Bottom Sediments of Lake Okeechobee
Based on the modeling of sediments in Lake Okeechobee, there is no question that resuspension is occurring and has done so for a prolonged period [37,52]. The key issue is how much P and other nutrients are associated with the sediment during a resuspension event, and how much of the nutrient mass is available for uptake by algae.
Algal assay research was conducted on Lake Okeechobee sediments (consolidated and organic flocs) to determine if resuspension events caused the release or removal of P from the water column [37]. It was found that a resuspension event could cause either a source or sink for bioavailable P in the water column. Under reduced conditions, the resuspension of sediments is a potential source of available sediments for algal growth. The conclusion by Hansen et al. [37] is consistent with that found by Reddy [58,59], who concluded that PO4 release during resuspension events was dependent on both sediment composition and the redox potential.
Depending on the sediment source that is in the water column, either inorganic bottom sediment or the thixotropic sediment (referred to as organic floc sediment in some publications), there are some differences in algal growth stimulation. The bioassay work by Hansen et al. [37] suggested that when the biogeochemical conditions create algal blooms from a resuspension event, the thixotropic or organic floc sediments cause a greater positive change in growth, which can be up to 50% greater.
5. Lake Sediments as a Nutrient Source for Lake Okeechobee Cyanobacteria Blooms
Cyanobacterial (blue-green algae) blooms in Lake Okeechobee are frequent in late spring and through the summer months. These blooms negatively impact the limnoecology of the lake and downstream estuaries, causing declarations of State of Emergency for the lake and estuaries [63,64]. It is essential to understand and ameliorate the nutrient sources that feed these blooms, with emphasis on two essential macronutrients, nitrogen and phosphorus. Microcystis is commonly the dominant organism in these blooms. It is a genus that is reliant on the appropriate concentrations of both N and P to initiate and sustain population growth and toxin production [12,65]. These nutrients must be available to the phytoplankton community, which has a year-round cyanobacterial component, along with other environmental cues, that allow Microcystis to be dominant and form massive blooms.
The sediments in Lake Okeechobee (fluid mud), which have accumulated from decades of inflow from the watershed and in lake vegetation growth [66,67,68], serve as a semi-permanent source of the key nutrients that can support and sustain these massive blooms. This accumulation of nutrients in the sediments is common in many waterbodies and is commonly referred to as a “legacy” from prior watershed loading, enriching a waterbody for decades [69,70]. In Lake Okeechobee, P in the sediments is estimated to contain 2.87 × 10⁷ kg [71] with different P fluxes as a function of sediment type: littoral, peat, mud, and sand [72,73]. These studies have examined the flux from or to the water column, which is mainly controlled by redox potential and pH through iron–P interactions. In oxic sediments, ferric phosphorus controls P solubility. However, in anoxic sediments, phosphorus release is an order of magnitude greater [74]. N in the forms of ammonium and nitrate also efflux from the lake sediments [75].
The contribution of the sediment nutrients enriching the Lake Okeechobee phytoplankton community (Figure 10) remains a conundrum that has eluded the scientific community. Many of the common practices used for reducing the nutrient flux into the water column [76] have been piloted [77]. However, the P internal loading has not been resolved. Until the nutrient flux from the massive reserves in Lake Okeechobee sediments is curtailed, massive blooms of Microcystis will continue to plague this system, causing lake and downstream deleterious impacts in the Caloosahatchee and St. Lucie Rivers.
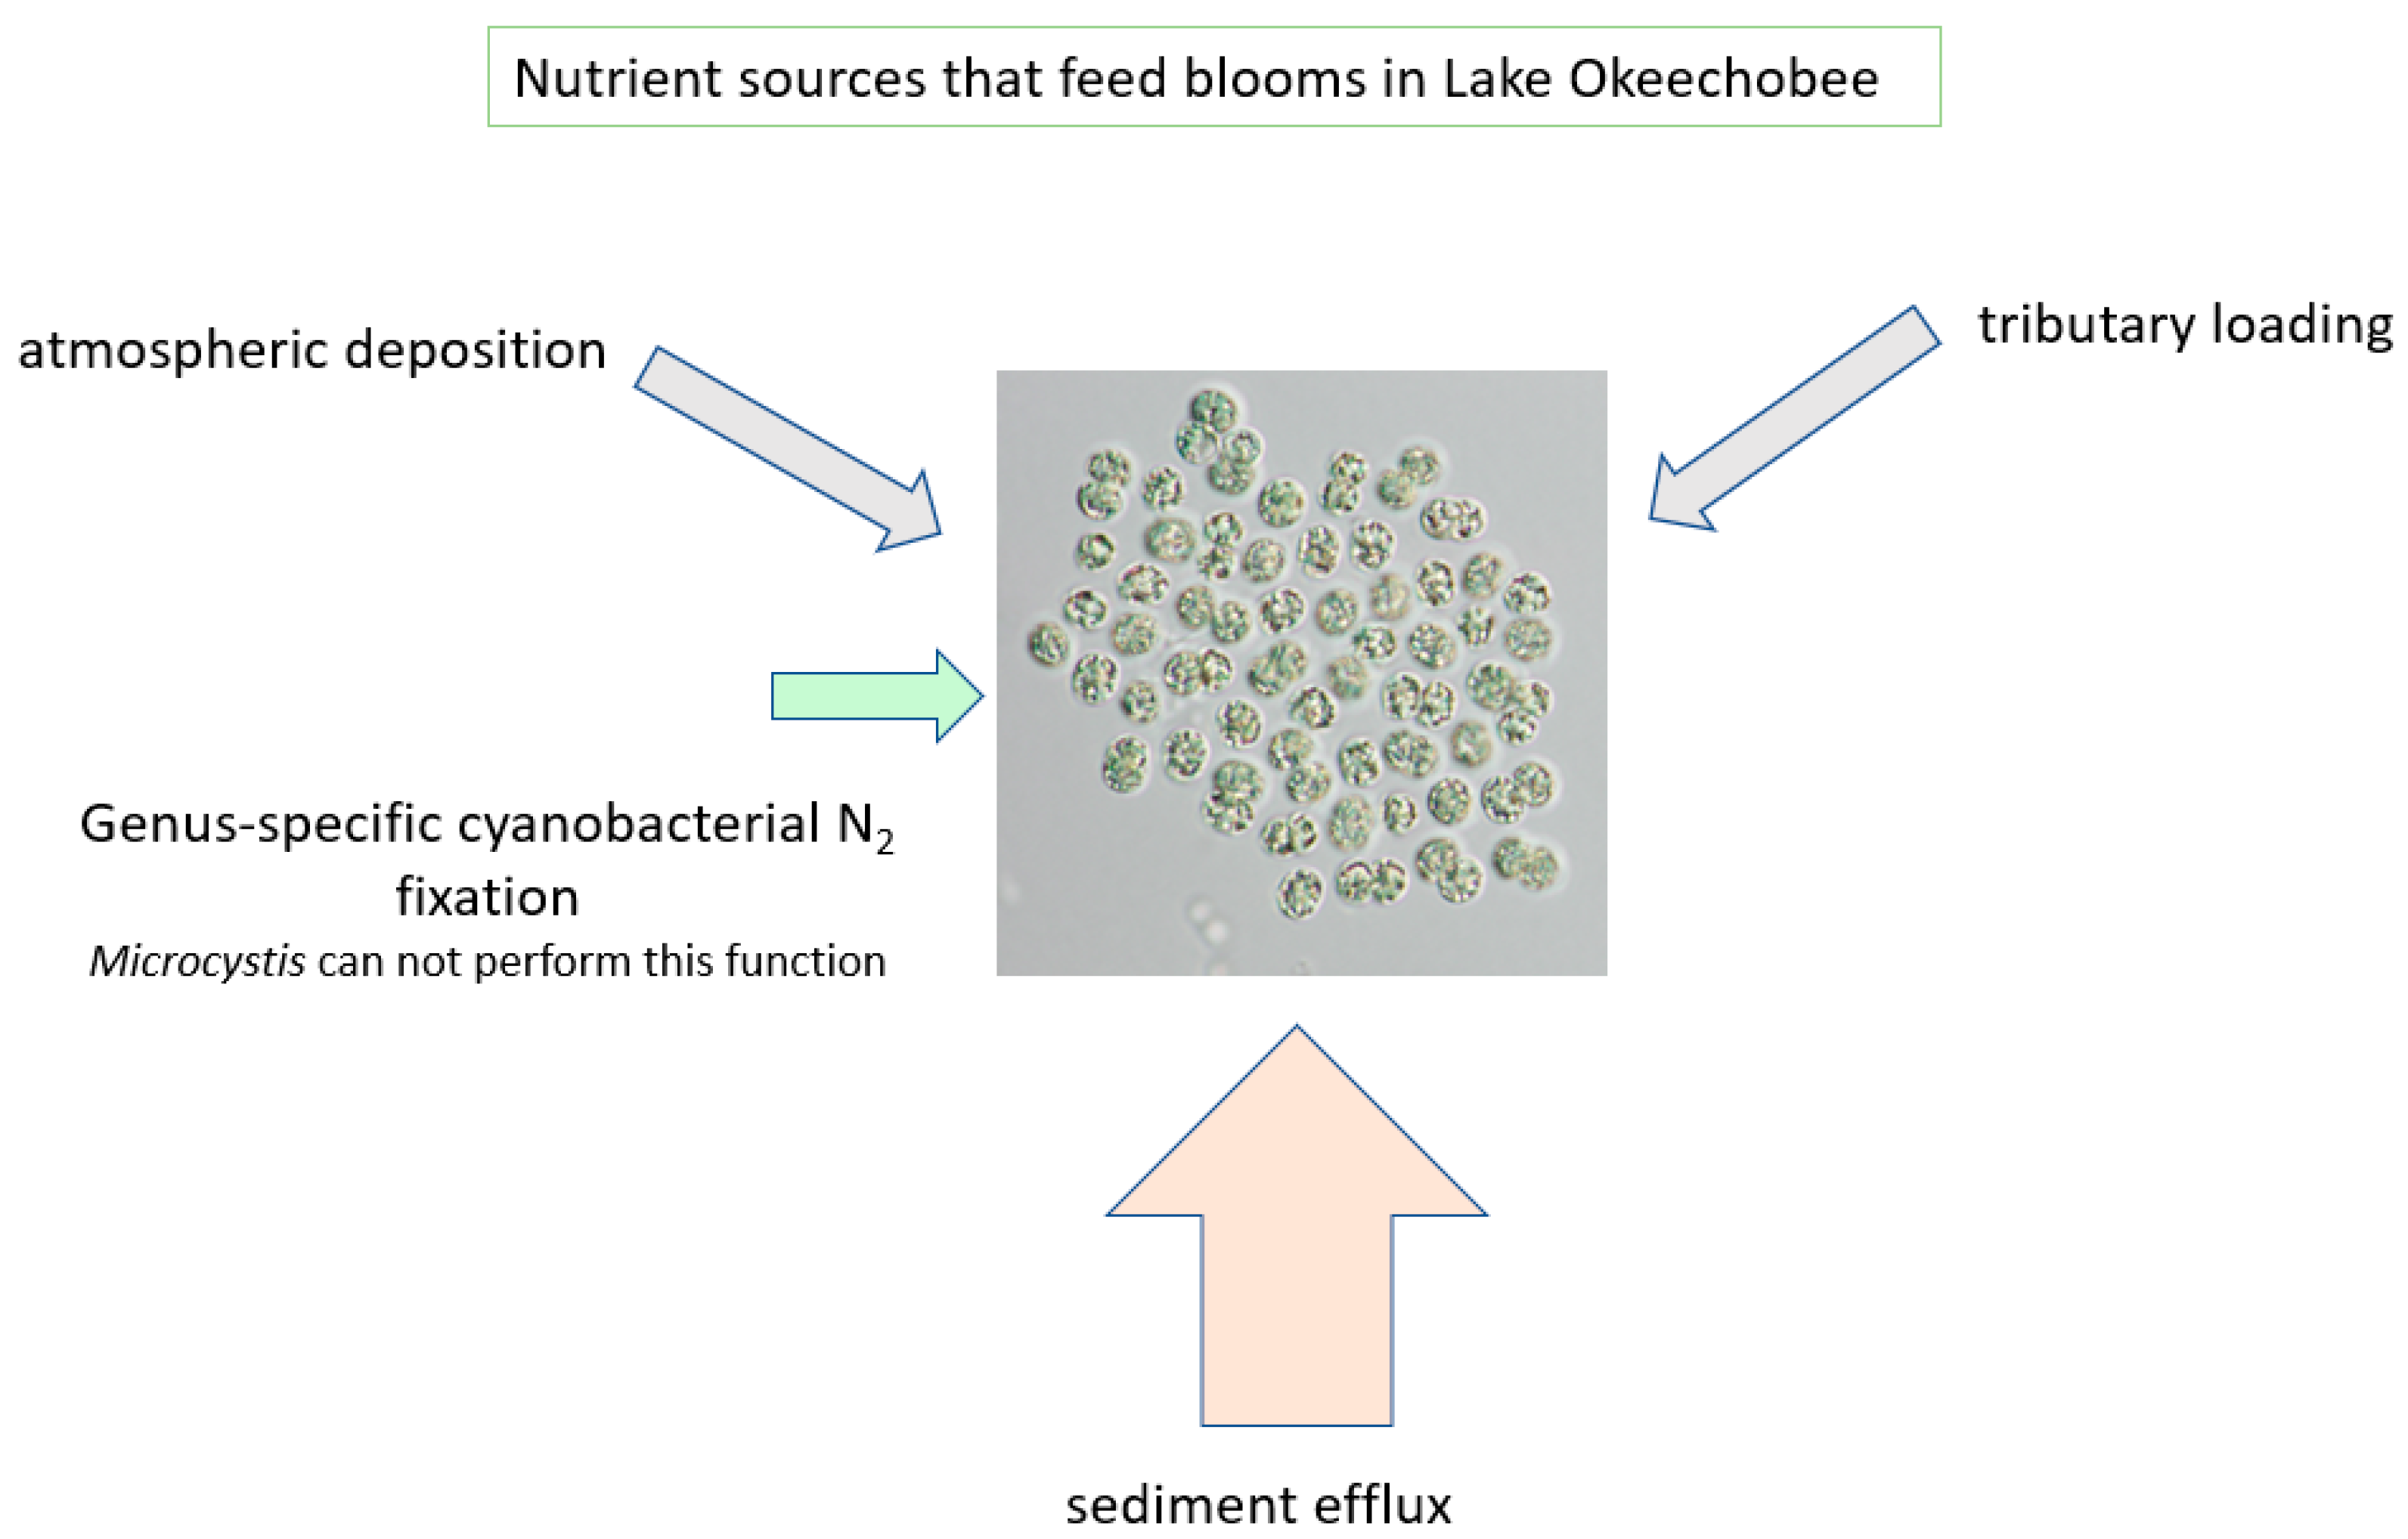
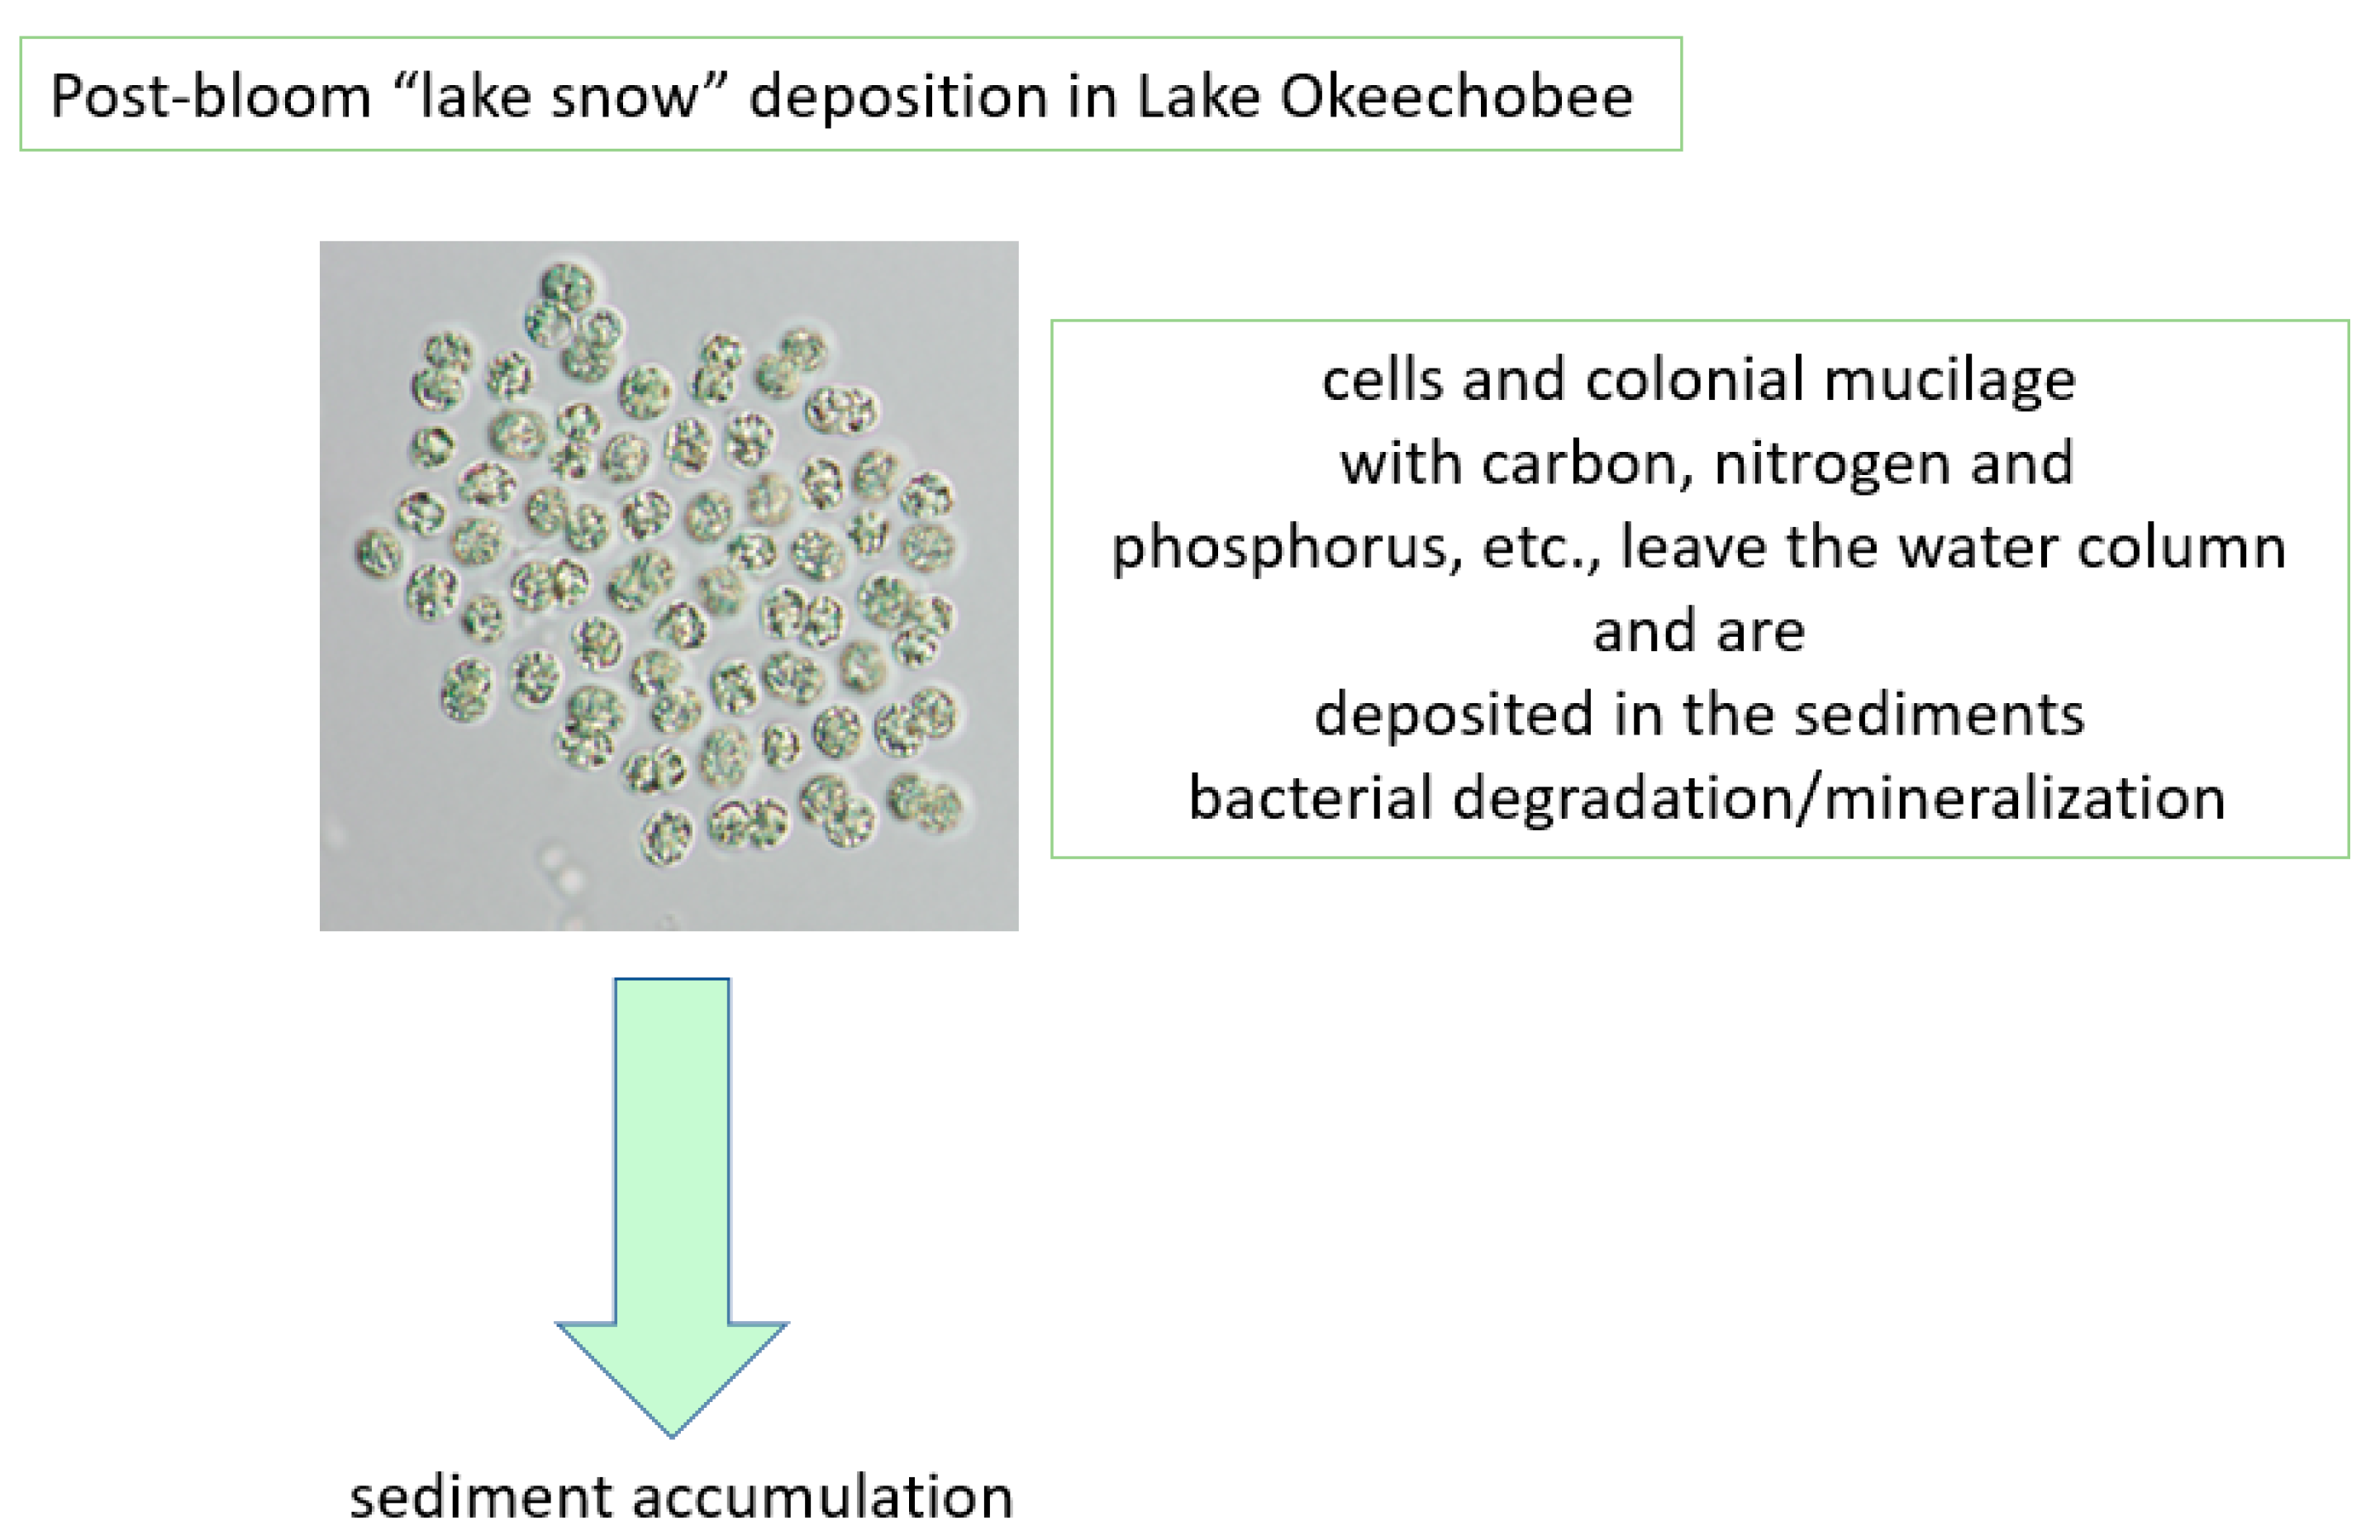
In addition to the sediment-recycled nutrients, it is also acknowledged that both N and P are transported to the lake via the tributary system. N2-fixing cyanobacteria also add to N availability, thereby providing multiple sources that lead to the massive blooms of Microcystis (Figure 11). There is also a recycling component associated with the die-off of a bloom, sinking in the water column, accumulating in the sediments as organic matter (added back to the thixotropic layer) and being mineralized by bacteria (Figure 12).
The average chemical composition of cyanobacteria follows the atomic Redfield ratio: 106C:16N:1P, as the average cellular mole ratio of carbon, nitrogen, and phosphorus. In freshwater systems, carbon is not limiting, leaving the ratio of 16:1 as the general determinant of either N-limited or P-limited for a waterbody.
Cyanobacteria are only capable of utilizing orthophosphate (PO4) and its solubility is a function of elements such as Ca2+, Mg2+, Fe2+, Fe3+, and Al3+ and pH. Cyanobacteria can also take advantage of organically bound P with the aid of phosphatase enzymes that cleave P from the dissolved organic matter. This phenomenon happens when the cells respond to nutrient depleted waters, allowing growth to continue when orthophosphate becomes limiting. Lake Okeechobee peat zone sediment efflux ranges from 0.2–2.2 mg soluble P/m2 day, while the mud zone efflux ranges from 0.1–1.9 P/m2.day [11], creating a pool of P readily available to the phytoplankton community. In addition, frequent sediment resuspension through wind, wave action, or periodically by hurricanes, creates an abundance of P in the water column, which promotes cyanobacterial blooms when other abiotic and biotic conditions are favorable.
Nitrogen sources for cyanobacteria incapable of fixing atmospheric nitrogen such as Microcystis include inorganic forms, ammonium (H4N+), ammonia (H3N), nitrite (NO2−), and nitrate (NO3−) [78]. The three amino acids, arginine, asparagine, and glutamine as well as urea can all be used as organic sources of N for cyanobacteria [68]. In resuspended sediments that are aerobic, ammonium can be oxidized to nitrite and nitrate by nitrifying bacteria, while under anerobic conditions, fixed N is converted to N2 by denitrifying bacteria. Lake Okeechobee surface sediments are aerobic and the efflux of ammonium, nitrite, and nitrate into the water column is highly conducive to cyanobacteria bloom formation and expansion.
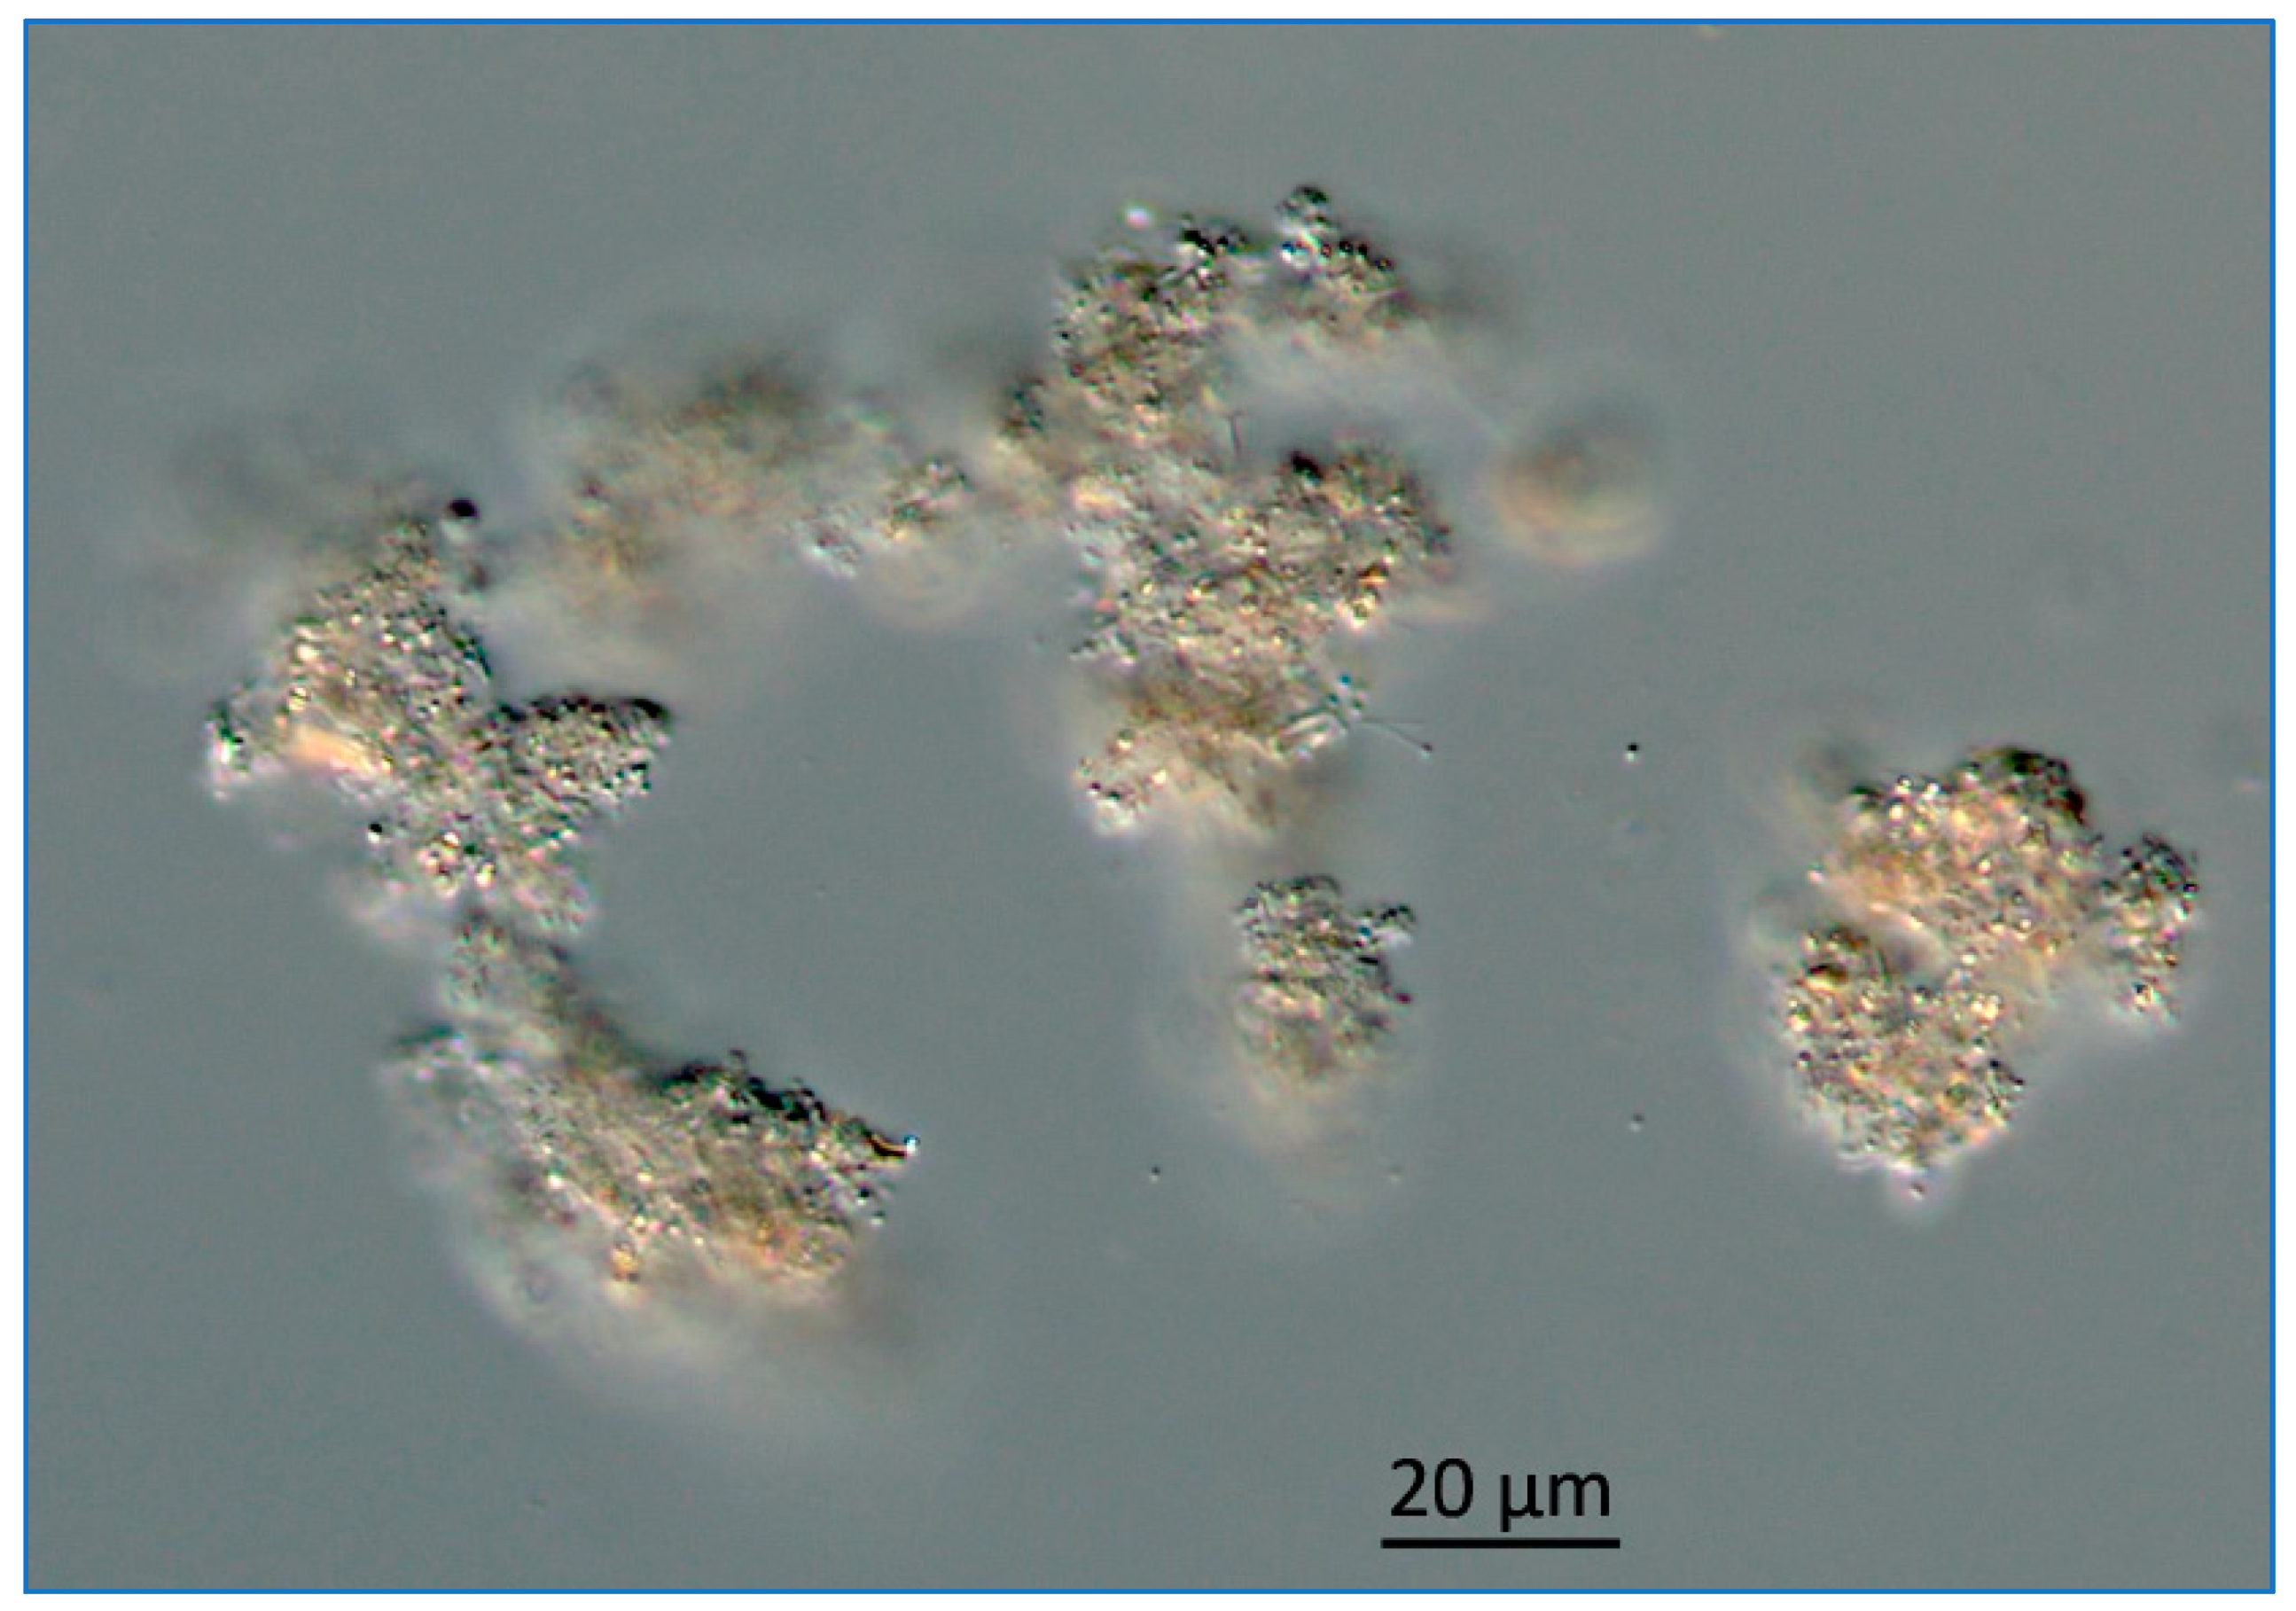
Microcystis colonies can also regulate their position in the water column using internal accumulation of gas in vesicles, which brings them to the surface for optimizing photosynthesis. The accumulation of photosynthate builds ballast during the day, and subsequently, colonies sink in the water column, typically into the nutrient-enriched waters near the water-sediment interface. While at depth, cells absorb key nutrients, the photosynthate ballast is utilized for respiration, creating the gas that allows colonies to float up to the water surface. This cycle of up–down migration is a mechanism that “pumps” sediment nutrients directly into cyanobacteria blooms. In addition, cyanobacteria also accumulate polymers to store excess nutrients internally, termed luxuriant, when concentrations exceed cellular metabolism requirements. For P, storage takes place in polyphosphate bodies and N is stored as cyanophycin granules. Both storage polymers can be utilized by the cells when needed due to a nutrient deficiency to continue growth. When a colony loses its buoyancy and sinks into the sediment layer as “lake snow” [79], these storage compounds, other cellular components, and a complex extracellular matrix of polysaccharides (mucilage) and associated bacteria are carried with it (Figure 13). This mucilage can include transparent exopolymer particles (TEP), which consist primarily of acidic polysaccharides.
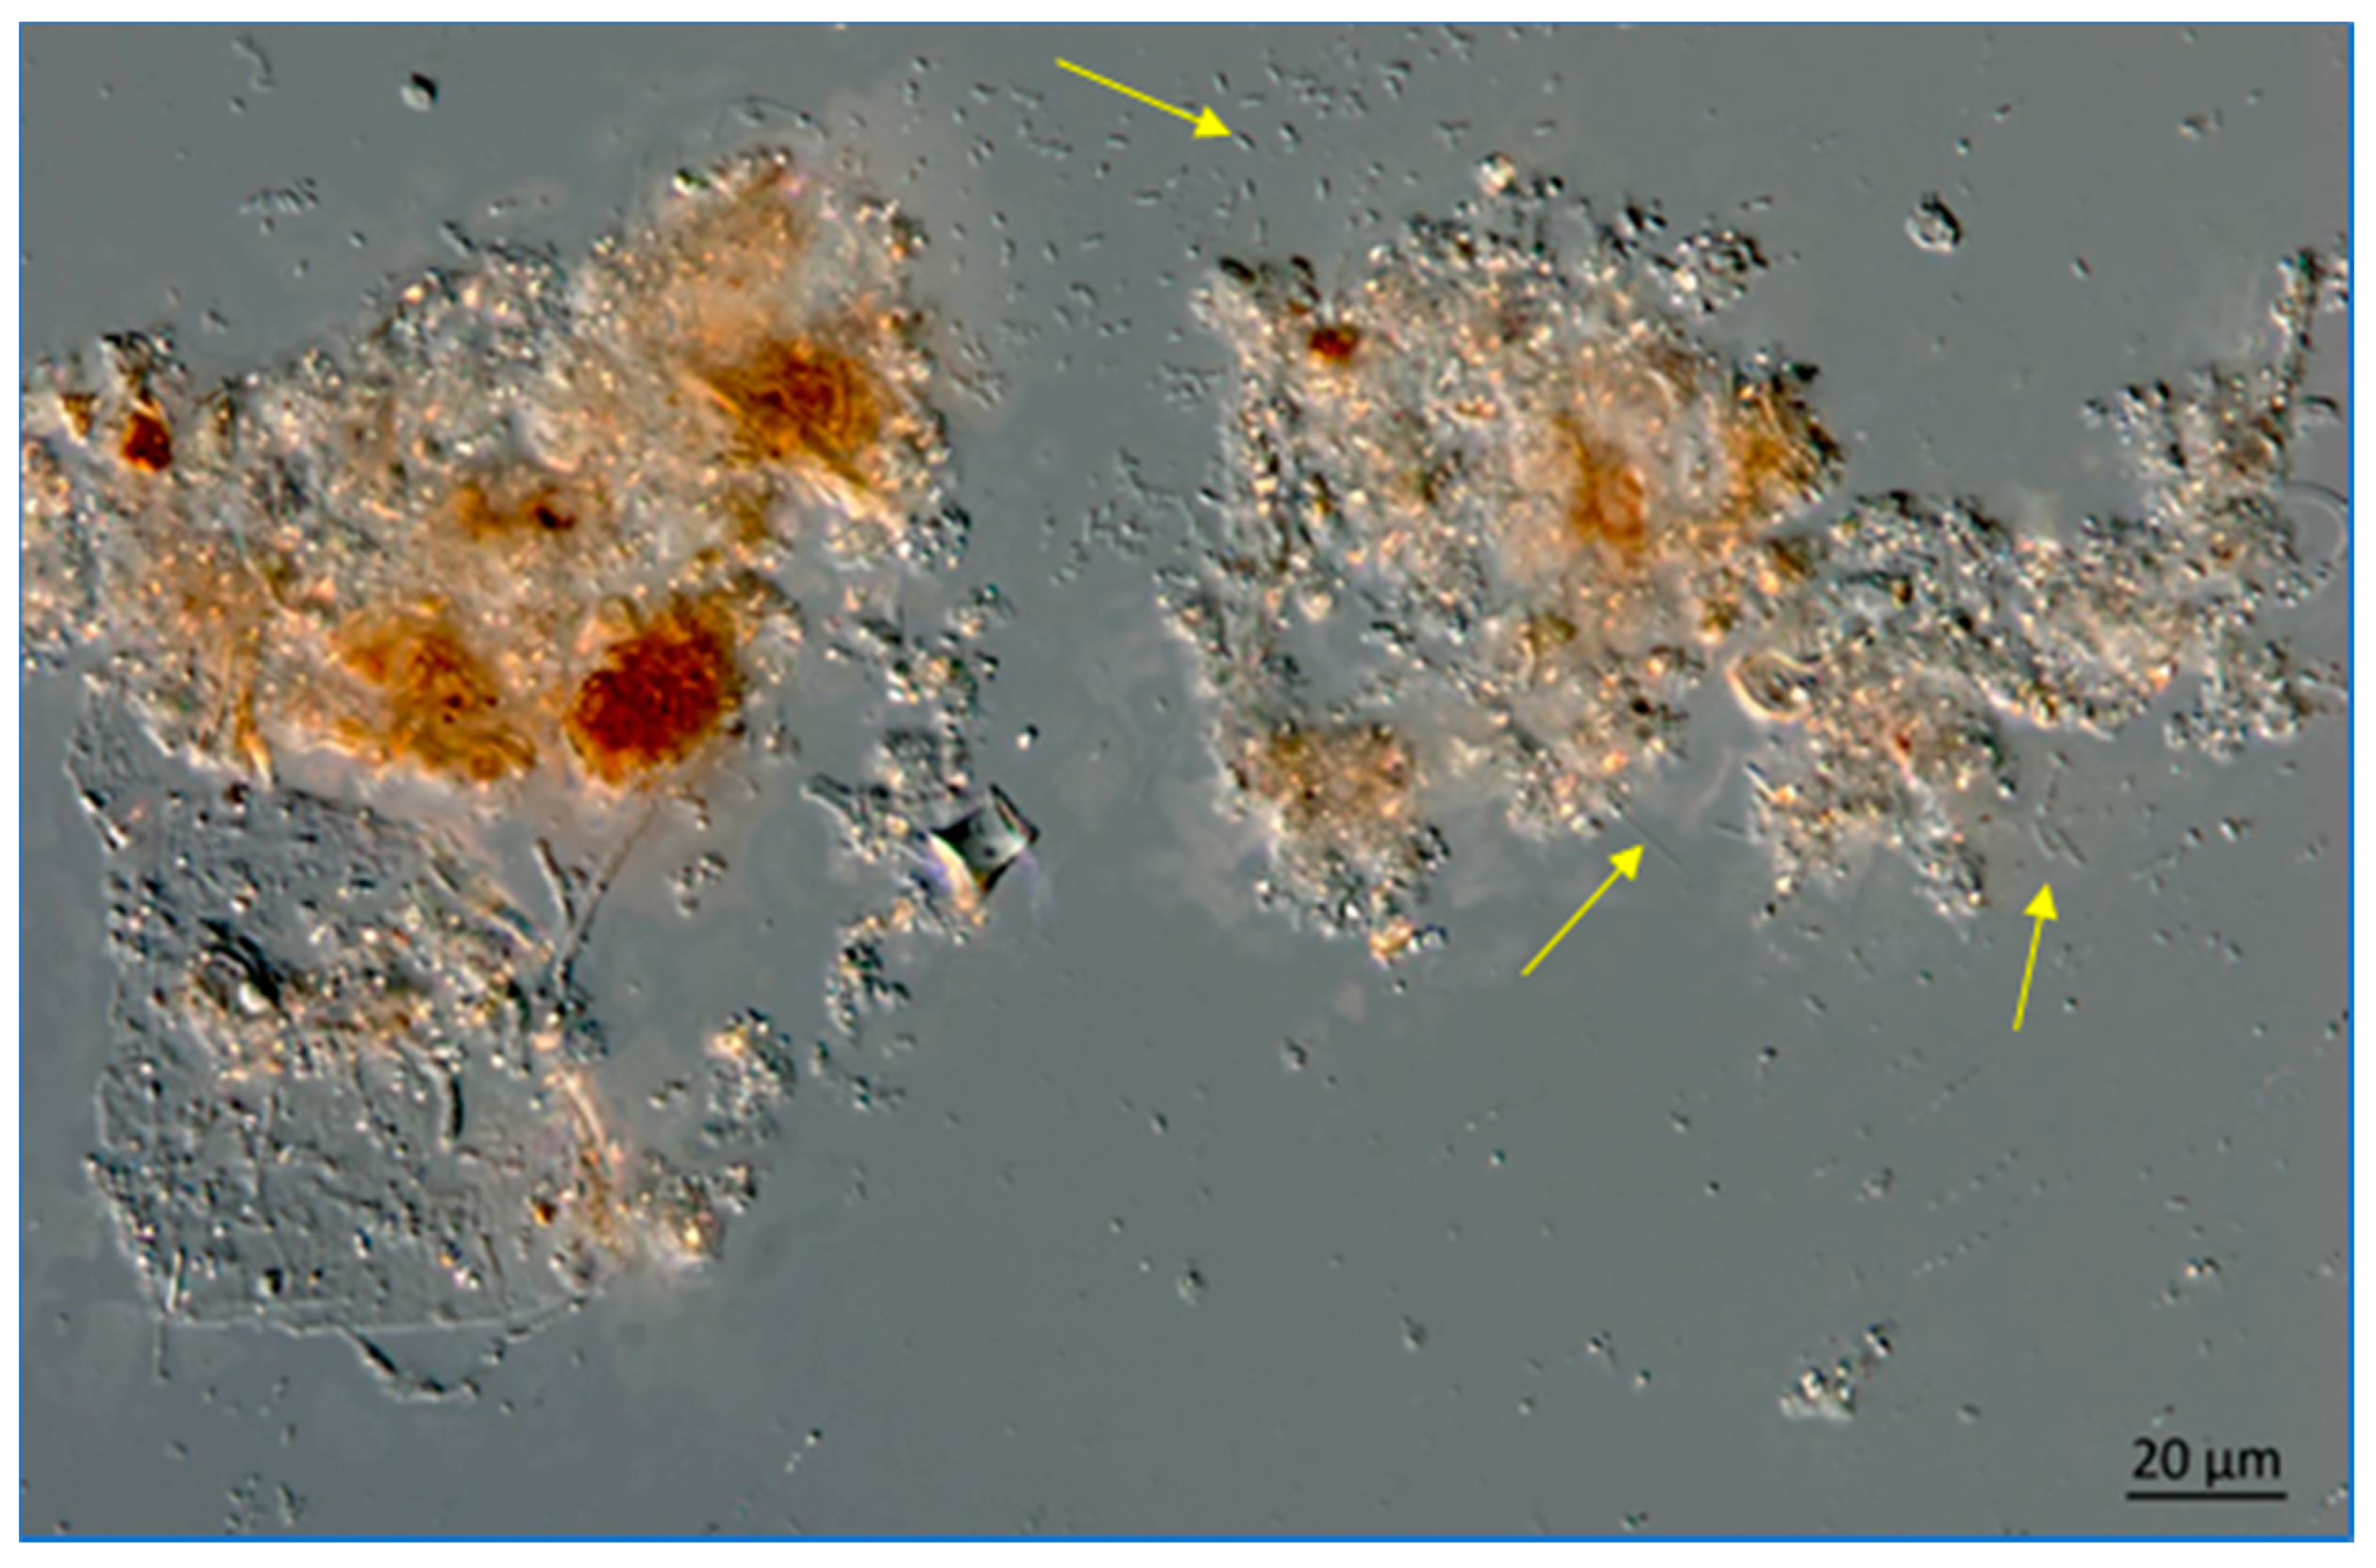
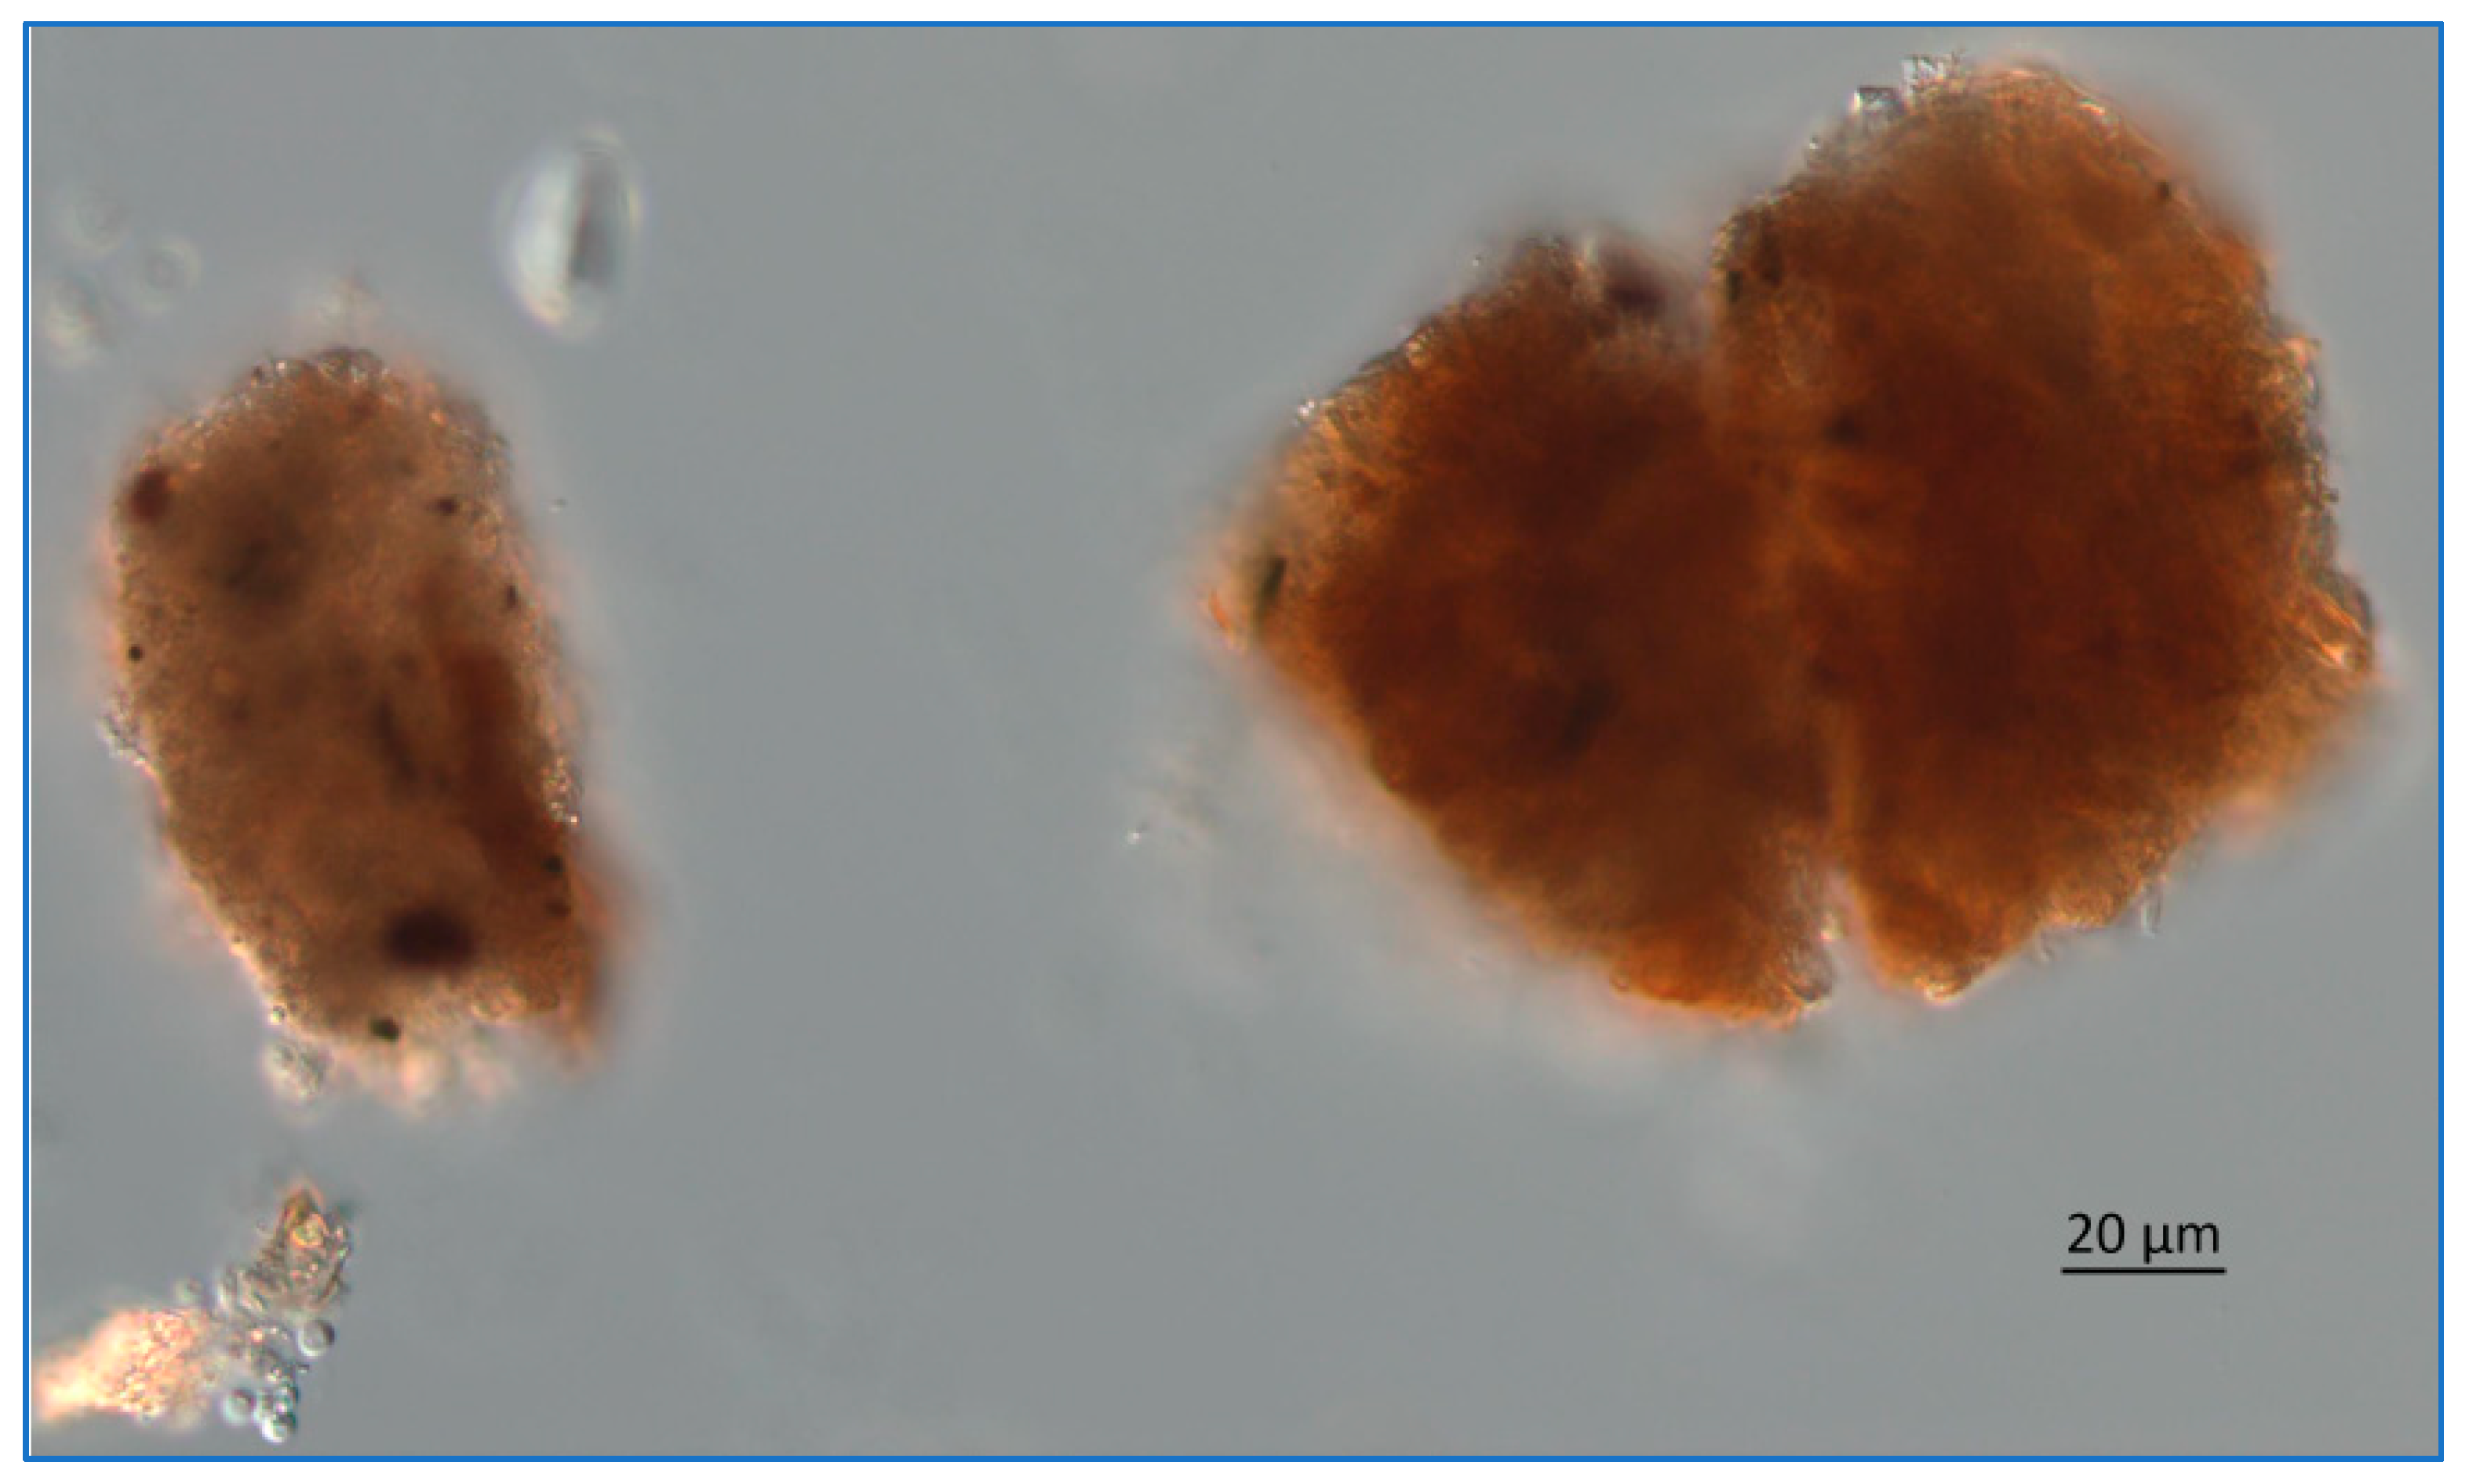
At greater depths in the Lake, the snow includes more organic materials such as fecal pellets from zooplankton (Figure 14 and Figure 15).
Therefore, the occurrence of the thixotropic mud in Lake Okeechobee can create the nutrient source in the water column to initiate algal blooms. In addition, the persistence of the thixotropic mud near the bottom after some settling can help maintain a bloom during the sinking phases of the movement of Microcystis colonies.
6. Discussion
6.1. Necessity for Removal of the Mobile Mud from Lake Okeechobee
In reviewing the issue of legacy phosphorus in Lake Okeechobee, the occurrence and dynamics of the bottom mud layer and its mobilization seems to be a key issue in the lake ecology. There are major discrepancies in the data interpretations concerning the mobility of the mud and how it releases phosphorus into the water column. Much has been written on the mud occurrence, composition, and dynamics [7,54,57,58,59]. However, there are two or three forms of the mud in Lake Okeechobee. These include consolidated mud on the bottom, semi-consolidated mud lying atop of the denser mud, and the thixotropic mud that lies atop of the semi-consolidated and consolidated mud and in some of the inflow streams. Kirby et al. [7] stated “A different scenario, however, envisages that, notwithstanding present nutrient loads. A large portion of nutrients are sorbed onto sediment particles, which are periodically resuspended leading to partial nutrient release. According to this internal loading dependent scenario, decreasing the fresh nutrient input will have little short-term impact, because nutrient releases will continue to be dominated by fine-sediment entrainment and nutrient loading”.
There are differing opinions concerning the impact of the sediment resuspension in Lake Okeechobee [16]. In 2012, Yan and James [31] concluded that the net solids load into Lake Okeechobee is negative with more export of solids than the inflow of solids. The data supporting this conclusion seems to be based on a combination of the bottom mud mapping and the balance of flows and associated turbidity.
The resuspension of the mud tends to release nutrients and initiate algal blooms. If the lake is experiencing a net loss of mud, then the impact on water quality should be declining. This begs the question that if the mud balance shows that the solids and associated legacy phosphorus is being “mined” from the lake, the inflow of dissolved and particulate phosphorus is being controlled to a better degree, then why have the algal blooms in Lake Okeechobee increased in frequency, duration, and intensity? It can be concluded that P is continuing to accumulate in Lake Okeechobee with no net loss [16].
We assert that the mud budget of the lake has not adequately accounted for the thixotropic component of the mud. This material cannot be cored and is known to occur in a bottom layer in the Taylor Creek/Nubbin Slough at a variable thickness [7,21]. It is documented that thixotropic mud can be mobilized by wind-induced currents, increased wave orbital motion during hurricane events, and by “normal” wave activity in the lake [42,52]. It is much easier to resuspend a fluid mud unit compared to consolidated inorganic clay, which requires a high scouring or orbital velocity according to Hjulström [63]. The higher velocity wave orbital motion would produce a limited occurrence of resuspension events based on normal wind activity and associated wave generation. Resuspension of the thixotropic unit would produce a much higher number of resuspension events and associated algal blooms.
Sedimentation in Lake Okeechobee is likely much more complex than previously described. While provisions have been made for the organic content of the clay-size sediments in models of the lake [55], the dynamics may not allow bottom deposition of these sediments within the consolidated mud, thus making them difficult to remobilize (e.g., Hjulström velocity required for orbital wave resuspension). In addition, a less stable layer may occur between the consolidated mud and the thixotropic mud [7]. This layer also has a greater susceptibility to resuspension. However, it is known that the “flocculent mud” or thixotropic sediments and the shallow depth of Lake Okeechobee allow frequent resuspension events [56,57,58,59].
A key question is the residence time of the thixotropic mud in the water column before it is deposited on the bottom and becomes part of either the consolidated mud deposit or the overlying layer or thixotropic mud containing gas [7]. A mechanism to maintain the thixotropic mud in a long-duration fluid state must be identified. Since the algal bloom frequency in Lake Okeechobee has increased greatly based on both nutrient influx into the lake and remobilization of legacy nutrients, the production of acidic polysaccharides and other extracellular substances (EPS) has also increased. It has been experimentally demonstrated that EPS interacts with clay minerals, aggregates these particles, and increases the settling velocity [80]. However, this does not necessarily indicate that the flocs will settle to the bottom and consolidate. The EPS, particularly the transparent exopolymer particles (TEP), are a major food supply for bacteria, which will secrete carbon dioxide during feeding and with breakdown of other organic molecules. The carbon dioxide release may keep the sediment in suspension for extended periods, aided by normal wave orbital motion. The gas issue in the mud has been raised in the past by Kirby et al. [7], who suggested that it may have an impact on the mobility of the mud. Therefore, the thixotropic mud layer may be semi-stable, lingering above the consolidated mud bottom, which allows resuspension of the sediment and nutrients at a lower wind velocity (smaller wave orbital motion). In addition, the organic material breakdown will tend to reduce oxygen concentrations based on combined chemical and biological oxygen demand. This reduction may make phosphate more bioavailable during resuspension events.
If this process is truly active in Lake Okeechobee, the assertion by Yan and James [31] that there has been approximately a 52% reduction in the mud within Lake Okeechobee between 1998 and 2006 is unlikely. Only the form of the muddy sediment was changed from consolidated to thixotropic with greater mobility. Hansen et al. [38] actually sampled the unconsolidated “floc layer” (thixotropic mud) in their investigation of phosphate release from this material and its relationship to algal blooms. The thixotropic or floc material tends to have a greater positive impact on stimulating algal growth compared to the consolidated mud. This conclusion is supported by Canfield et al. [16], who clearly stated that the restoration of Lake Okeechobee was “mission impossible” without the removal of the legacy nutrients that occur in the thixotropic mud.
6.2. Implications for Management of Other Complex Ecosystems and Future Research Required
The Lake Okeechobee Watershed including the Caloosahatchee and St. Lucie Rivers and the Everglades is one of the largest and most complex freshwater ecosystems on Earth. Management of the system is a daunting challenge, especially since it has been altered to such a large degree by anthropogenic activities. A very large number of scientific investigations have been conducted on the ecosystem including water quality assessments, surface, and groundwater modeling, assessments of nutrient budgets (including wet and dry fallout), wave and current dynamic models of the lake, engineering investigations on surface water flooding and control, sediment dynamics and geochemical studies, and many others. This is perhaps the most studied freshwater ecosystem in the world. However, perhaps the greatest challenge is to integrate all of the studies and plans into a comprehensive, system-wide restoration effort that achieves the key water quality goals. Elimination of the thixotropic mud containing a massive quantity of legacy nutrients in Lake Okeechobee is a key component that has not been achieved.
A research effort that cannot be ignored is the formulation of a plan to remove the thixotropic mud from the lake. While many investigations have been conducted on mapping the mud unit in the lake, the primary effort has been directed at measuring a mud type that is not mobile and does not really impact water quality. Future research must be directed at comprehensively investigating the thixotropic mud that is mobile and directly causes algal blooms. This impact needs to be modeled and quantified. In addition, engineering plans need to be developed to remove the mobile mud from the ecosystem using a cost-effective technology. The development of this method could be applied to many other lake systems that have a similar mobile mud that contain legacy nutrients in numerous global locations.
7. Conclusions
Legacy nutrients are a major issue that impacts the trophic state of Lake Okeechobee and are clearly associated with the occurrence of thixotropic mud (fluid organic floc material). The thixotropic mud has a much greater mobility compared to the consolidated mud layer on the bottom of the lake. It is resuspended from the bottom into the water column by currents, wind, and waves, particularly during strong storms and hurricanes. The resuspended sediments contain nutrients, which tend to stimulate algal growth to a high degree during favorable biogeochemical conditions.
There is no evidence that the volume of the thixotropic mud in Lake Okeechobee is declining, when in fact it could be increasing based on its occurrence on the bottom of streams feeding the lake, especially during hurricane events and major floods. In-lake processes may be adding to the volume of the thixotropic mud based on the transport of vast quantities of particulate organic material.
There is a direct association between sediment resuspension events and blooms of cyanobacteria in Lake Okeechobee. The thixotropic mud contains a greater concentration of nutrients compared to the immobile consolidated mud. In addition, bioassay studies have demonstrated that the resuspended thixotropic mud produces up to a 50% higher rate of algal growth versus the consolidated mud.
The thixotropic mud is an important component of the legacy P and N in Lake Okeechobee and as long as it remains in a mobile state in the lake, the frequency of algal blooms will be high. A method must be developed to effectively remove the thixotropic mud (organic floc material) from Lake Okeechobee and prevent it from continuing to damage the lake and the ecosystems of outflow streams (i.e., Caloosahatchee and St. Lucie Rivers).
Since the thixotropic mud containing legacy nutrients is a major factor in controlling algal blooms in the lake, it must be considered within the framework of total ecosystem management. A combination of nutrient influx management, water budget management, and elimination of the sources of legacy nutrients, must be used to manage not only Lake Okeechobee, but also the surface water bodies that receive discharge from the lake including the Caloosahatchee and St Lucie Rivers and the Everglades. The algal blooms starting in the lake have damaged the riverine and estuarine ecosystems from the lake the entire distance to the east and west coasts of Florida. This is a classic case of the need to manage a vast, regional ecosystem within a framework of all contributing factors including the problem of legacy nutrient management, which has been largely ignored because of the difficulty of the task and costs involved. Without removal of the thixotropic mud, cleanup and restoration of Lake Okeechobee and the associated estuarine system is “mission impossible”.
Author Contributions
T.M.M. wrote the sediments part of the manuscript and obtained project funding. S.T. wrote parts of the sediments section of the manuscript and drew the graphics. B.H.R. wrote the algae parts of the manuscript. All authors have read and agreed to the published version of the manuscript.
Funding
The funding for this project was provided by Hedrick Brothers Construction Company, Inc., West Palm Beach, Florida, USA.
Data Availability Statement
All data used in this paper are contained in the references provided.
Acknowledgments
Most of the authors used the facilities at the Emergent Technologies Institute, U. A. Whitaker College of Engineering at Florida Gulf Coast University for the performance of this research.
Conflicts of Interest
The authors declare no conflict of interest.
References
- Correll, D.L. The role of phosphorus in the eutrophication of receiving waters: A review. J. Environ. Qual. 1998, 27, 261–266. [Google Scholar] [CrossRef] [Green Version]
- Shannon, E.E.; Brezonik, P.L. Limnological characteristics of north and central Florida Lakes. Limnol. Oceanogr. 1972, 17, 97–110. [Google Scholar] [CrossRef]
- Bachmann, R.G.; Bigham, D.L.; Hoyer, M.V.; Canfield, D.E., Jr. Phosphorus, nitrogen, and the designated uses of Florida lakes. Lake Reserv. Manag. 2012, 28, 46–58. [Google Scholar] [CrossRef]
- Gleason, P.J.; Stone, P.A. Prehistoric Trophic Level Status and Possible Cultural Influences on the Enrichment of Lake Okeechobee; Unpublished Report; South Florida Water Management District: West Palm Beach, FL, USA, 1975.
- Riley, L.; Riley, W. Nature’s Strongholds: The World’s Largest Great Wildlife Reserves; Princeton University Press: Princeton, NJ, USA, 2005. [Google Scholar]
- Brooks, H.K. Lake Okeechobee. In Environments of South Florida: Present and Past II; Gleason, P.J., Ed.; Miami Geological Society: Coral Gables, FL, USA, 1984; pp. 38–68. [Google Scholar]
- Kirby, R.R.; Hobbs, C.H.; Mehta, A.J. Fine Sediment. Regime of Lake Okeechobee; Coastal and Oceanographic Engineering Department; University of Florida: Gainesville, FL, USA, 1989. [Google Scholar]
- McCoy, C.W.; Said, W.P.; Obeysekera, J.; Dreschel, T.; Van Aman, J. Landscapes and Hydrology of the Predrainage Everglades; University Press of Florida: Gainesville, FL, USA, 2011. [Google Scholar]
- Lodge, T.E. The Everglades Handbook. Understanding the Ecosystem, 4th ed.; CRC Press: Boca Raton, FL, USA, 2016. [Google Scholar]
- Light, S.S.; Dineen, J.W. Water control in the Everglades: A historical perspective. In Everglades: The Ecosystem and its Restoration; Davis, S.M., Ogden, J.C., Eds.; St. Lucie Press: Delray Beach, FL, USA, 1994; pp. 47–84. [Google Scholar]
- McCormick, P.V.; Newman, S.; Miao, S.; Gawlik, D.E.; Marley, D.; Reddy, K.R.; Fontaine, T.D. Effects of anthropogenic phosphorus inputs on the Everglades. In The Everglades, Florida Bay, and Coral Reefs of the Florida Keys: An Ecosystem Sourcebook; Porter, J.W., Porter, K.G., Eds.; CRC Press: Boca Raton, FL, USA, 2002; pp. 83–126. [Google Scholar]
- Canfield, D.E.; Hoyer, M.V. The eutrophication of Lake Okeechobee. Lake Reserv. Manag. 1988, 4, 91–99. [Google Scholar] [CrossRef] [Green Version]
- Kramer, B.J.; Davis, T.W.; Meyer, K.A.; Rosen, B.H.; Goleski, J.A.; Dick, G.J.; Oh, G.; Gobler, C.K. Nitrogen limitation, toxin synthesis potential, and toxicity of cyanobacterial populations in Lake Okeechobee and the St. Lucie River Estuary, Florida, during the 2016 state of emergency event. PLoS ONE 2018, 13, e0196278. [Google Scholar] [CrossRef] [Green Version]
- Rodusky, A.J.; Steinman, A.D.; East, T.L.; Sharfstein, B.; Meeker, R.H. Periphyton nutrient limitation and other potential growth-controlling factors in Lake Okeechobee, U.S.A. Hydrobiology 2001, 448, 27–39. [Google Scholar] [CrossRef]
- Havens, K.E. Secondary nitrogen limitation in a subtropical lake impacted by non-point source agricultural pollution. Environ. Pollut. 1995, 89, 241–246. [Google Scholar] [CrossRef]
- Canfield, D.E., Jr.; Bachman, R.W.; Hoyer, M.V. Restoration of Lake Okeechobee: Mission impossible? Lake Reserv. Manag. 2020, 1–17. [Google Scholar] [CrossRef]
- Bottcher, A.B.; Tremwel, T.K.; Campbell, K.L. Phosphorus management in flatwood (Spodosols) soils. In Phosphorus Biogeochemistry in Subtropical Ecosystems; Reddy, K.R., O’Conner, G.A., Scheiske, C.L., Eds.; Lewis Publishers: Boca Raton, FL, USA, 1999. [Google Scholar]
- Federico, A.C. Investigations of the Relationship between Land Use, Rainfall, and Runoff Quality in the Taylor Creek Watershed; South Florida Water Management District Technical Publication 77–3; South Florida Water Management District: West Palm Beach, FL, USA, 1977.
- Moore, P.A.; Reddy, K.R.; Fisher, M.M. Phosphorus flux between sediment and overlying water in Lake Okeechobee, Florida: Spatial and temporal variations. J. Environ. Qual. 1998, 27, 1428–1439. [Google Scholar] [CrossRef]
- Florida Fish and Wildlife Conservation Commission, 2019, Lake Okeechobee-Indian Prairie Scrape Project. Available online: https://bugwoodcloud.org/CDN/floridainvasives/Okeechobee/MeetingMinutes/2019-2020_Low_Water_Projects.pdf (accessed on 20 July 2020).
- Walker, W.; Kadlec, R. Dynamic Model. for Stormwater Treatment Areas; U.S. Department of Interior: Palm Harbor, FL, USA, 2005. Available online: http://www.wwwalker.net/dmsta1/ (accessed on 11 July 2020).
- Abtew, W.; Piccone, T.; Pietro, K.C.; Xue, S.K. Hydrologic and treatment performance of constructed wetlands: The Everglades stormwater treatment areas. In The Wetland Book I: Structure and Function, Management, and Methods; Finlayson, C.M., Everard, M., Irvine, K., McInnes, R.J., Middleton, B.A., Van Dam, A.A., Eds.; Springer Link: New York, NY, USA, 2017; pp. 243–262. [Google Scholar]
- Okin, G.S.; Mahowald, N.; Chadwick, O.A.; Artaxo, P. Impact of desert dust on the biogeochemistry of phosphorus in terrestrial ecosystems. Glob. Biogeochem. Cycles 2004, 18, GB2005. [Google Scholar] [CrossRef] [Green Version]
- Heilprin, A. Explorations on the West. Coast. of Florida and in the Okeechobee Wilderness; Wagner Free Institute of Science: Philadelphia, PA, USA, 1887. [Google Scholar]
- Will, L.E. Cracker History of Okeechobee; Great Outdoors Press: St. Petersburg, FL, USA, 1956. [Google Scholar]
- Say, T. An account of some of the marine shells of the United States. Acad. Nat. Sci. Phila. J. 1822, 2, 124–155. [Google Scholar]
- Mewis, J.; Wagner, N.J. Thixotropy. Adv. Colloid Interface Sci. 2009, 147, 214–227. [Google Scholar] [CrossRef] [PubMed]
- Reddy, K.R.; Sheng, Y.P.; Jones, B.L. Lake Okeechobee Phosphorus Dynamics Study; Final report on Contract Number C91–2393; Submitted to the South Florida Water Management District; South Florida Water Management District: West Palm Beach, FL, USA, 1995.
- Fisher, M.; Reddy, K.R.; James, R.T. Long-term changes in sediment chemistry of a large shallow subtropical lake. Lake Reserv. Manag. 2001, 21, 217–232. [Google Scholar] [CrossRef]
- BEM & University of Florida. Lake Okeechobee Sediment. Quality Final Report; South Florida Water Management District: West Palm Beach, FL, USA, 2007.
- Yan, Y.Y.; James, R.T. Spatial modeling of mud thickness and mud weights (1988–2006), Lake Okeechobee. Fla. Geogr. 2012, 43, 17–36. [Google Scholar]
- Joyner, B.F. Chemical and Biological Conditions of Lake Okeechobee, Florida; Florida Bureau of Geology Report of Investigations No. 71; Florida Bureau of Geology: Tallahassee, FL, USA, 1974.
- Davis, F.E.; Marshall, M.L. Chemical and Biological Investigations of Lake Okeechobee January 1973–June 1974; Interim Report; Southern Florida Flood Control District Technical Publication #75–1; Southern Florida Flood Control District: West Palm Beach, FL, USA, 1976.
- Schottler, S.P.; Engstrom, D.R. A chronological assessment of Lake Okeechobee (Florida) sediments using multiple dating markers. J. Paleoclimnol. 2006, 36, 19–36. [Google Scholar] [CrossRef]
- Hwang, K.-N. Erodibility of Fine Sediments in Wave-Dominated Environments. Master’s Thesis, University of Florida, Gainesville, FL, USA, 1989. [Google Scholar]
- Hwang, K.-N.; Mehta, A.J. Fine Sediment. Erodibility in Lake Okeechobee, Florida. Lake Okeechobee Phosphorus Dynamics Study Task 4.4; Report to the South Florida Water Management District; South Florida Water Management District: West Palm Beach, FL, USA, 1989.
- Hansen, P.S.; Philips, E.J.; Aldridge, F.J. The effects of sediment resuspension on phosphorus for algal growth in a shallow subtropical lake, Lake Okeechobee. Lake Reserv. Manag. 1997, 13, 154–159. [Google Scholar] [CrossRef] [Green Version]
- Sheng, Y.P.; Lick, W. The transport and resuspension of sediments in a shallow lake. J. Geophys. Res. 1979, 84, 1809–1826. [Google Scholar] [CrossRef]
- Håkanson, L. Lake bottom dynamics and morphology: The dynamic ratio. Water Resour. Res. 1982, 18, 1444–1450. [Google Scholar] [CrossRef]
- Carper, G.L.; Bachmann, R.W. Wind resuspension of sediments in a prairie lake. Can. J. Fish. Aquat. Sci. 1984, 41, 1763–1767. [Google Scholar] [CrossRef]
- Luettich, R.A., Jr.; Harleman, D.R.F.; Somlyódy, L. Dynamic behavior of suspended sediment concentrations in a shallow lake perturbated by episodic wind events. Limnol. Oceanogr. 1990, 35, 1050–1067. [Google Scholar] [CrossRef]
- Bengtsson, L.; Hellström, T. Wind-induced resuspension in a small shallow lake. Hydrobiologia 1992, 241, 163–172. [Google Scholar] [CrossRef]
- Blom, G.; Van Duin, E.H.S.; Aalderink, R.H.; Lijklema, L.; Toet, C. Modelling sediment transport in shallow lakes—Interactions sediment transport and sediment composition. Hydrobiologia 1992, 235–236, 153–166. [Google Scholar] [CrossRef]
- Blom, G.; Toet, C. Modelling sediment transport and sediment quality in a shallow Dutch lake (Lake Ketel). Wat. Sci. Technol. 1992, 28, 79–90. [Google Scholar] [CrossRef]
- Hawley, N.; Lesht, B.M. Sediment resuspension in Lake St. Clair. Limnol. Oceanogr. 1992, 37, 1720–1737. [Google Scholar] [CrossRef]
- Kristensen, P.; Sødergeerd, M.; Jeppersen, E. Resuspension in a shallow eutrophic lake. Hydrobiologia 1992, 228, 101–109. [Google Scholar] [CrossRef]
- Søndergaard, M.; Kristensen, P.; Jepperson, E. Phosphoorus release from suspended sediment in a shallow and wind exposed Lake Arreso, Denmark. Hydrobiologia 1992, 228, 91–99. [Google Scholar] [CrossRef]
- Carrick, J.J.; Aldridge, F.J.; Schelske, C.L. Wind influences phytoplankton biomass and composition in a shallow lake. Limnol. Oceanogr. 1993, 38, 1179–1192. [Google Scholar] [CrossRef]
- Evans, R.D. Empirical evidence of importance of sediment resuspension in lakes. Hydrobiolofis 1994, 284, 5–12. [Google Scholar] [CrossRef]
- Huttula, T. Sediment transport in Lake Säkylän Pyhäjärvi. Aqua Fenn. 1994, 24, 171–185. [Google Scholar]
- Podsetchine, V.; Huttula, T. Modelling sedimentation and resuspension in lakes. Water Pollut. Res. J. Can. 1994, 29, 309–342. [Google Scholar] [CrossRef]
- Bachmann, R.W.; Hoyer, M.V.; Canfield, D.E., Jr. The potential for wave disturbance in shallow Florida lakes. Lake Reserv. Manag. 2000, 16, 281–291. [Google Scholar] [CrossRef]
- Valipour, R.; Boegman, L.; Bouffard, D.; Rao, Y.R. Sediment resuspension mechanisms and their contributions to high-turbidity events in a large lake. Limnol. Oceanogr. 2017, 62, 1045–1065. [Google Scholar] [CrossRef] [Green Version]
- Mehta, A.J. Lake Okeechobee Phosphorus Dynamics Study. Volume IX. Sediment. Characterization–Resuspension and Deposition Rates; Final Report on Contract C91–2393 Submitted to the South Florida Water Management District; South Florida Water Management District: West Palm Beach, FL, USA, 1991.
- James, R.T.; Martin, J.; Wool, T.; Wang, P.F. A sediment resuspension and water quality model of Lake Okeechobee. J. Am. Water Res. Assoc. 1997, 33, 661–680. [Google Scholar] [CrossRef]
- Maceina, M.J.; Soballe, D.M. Wind related limnological variation in Lake Okeechobee, Florida. Lake Reserv. Manag. 1990, 6, 93–100. [Google Scholar] [CrossRef]
- Reddy, K.R. Lake Okeechobee Phosphorus Dynamics Study. Volume II. Physio-Chemical Properties in the Sediments; Final Report Submitted to the South Florida Water Management District; South Florida Water Management District: West Palm Beach, FL, USA, 1991.
- Reddy, K.R. Lake Okeechobee Phosphorus Dynamics Study. Volume III. Biogeochemical Processes in the Sediments; Final Report Submitted to the South Florida Water Management District; South Florida Water Management District: West Palm Beach, FL, USA, 1991.
- Reddy, K.R. Lake Okeechobee Phosphorus Dynamics Study. Volume IV. Biogeochemical Processes in the Sedimentsl; Final Report Submitted to the South Florida Water Management District; South Florida Water Management District: West Palm Beach, FL, USA, 1991.
- Bierman, V.J., Jr.; James, R.T. A preliminary modeling analysis of water quality in Lake Okeechobee, Florida: Diagnostic and sensitivity analysis. Water Res. 1995, 29, 2767–2775. [Google Scholar] [CrossRef]
- Gailani, J.; Ziegler, C.K.; Lick, W. Transport of suspended solids in the Lower Fox River. J. Great Lakes Res. 1991, 17, 479–494. [Google Scholar] [CrossRef]
- Hjulström, F. Studies of the morphological activity of rivers as illustrated by the River Fyris. Bull. Geol. Inst. Upsala 1935, 25, 221–527. [Google Scholar]
- Florida Department of Environmental Protection (FDEP). 2016. Available online: https://legalscoop.lexblogplatform.com/wp-content/uploads/sites/74/2016/07/16155.pdf (accessed on 23 July 2020).
- Florida Department of Environmental Protection (FDEP). Emergency Authorizations to Implement Measures to Address South Florida Algal Blooms. 2018. Available online: https://floridadep.gov/dear/algal-bloom/content/emergency-authorizations-implement-measures-address-south-florida-algal (accessed on 23 July 2020).
- Rosen, B.H.; Davis, T.W.; Gobler, C.J.; Kramer, B.J.; Loftin, K.A. Cyanobacteria of the 2016 Lake Okeechobee Waterway Harmful Algal Bloom; U.S. Geological Survey Open-File Report 2017–1054; U.S. Geological Survey: Tallahassee, FL, USA, 2017. [CrossRef] [Green Version]
- Kratzer, C.R.; Brezonick, P.L. Application of nutrient loading models to the analysis of trophic conditions in Lake Okeechobee, Florida. Environ. Mgmt. 1984, 8, 109–120. [Google Scholar] [CrossRef]
- Aumen, N.G. The history of human impacts, lake management and limnological research of Lake Okeechobee, Florida (USA), Arch. Hydrobiol. Beih. Ergebn. Limnol. 1995, 45, 1–16. [Google Scholar]
- James, R.T.; Jones, B.L.; Smith, V.H. Historical trends in the Lake Okeechobee ecosystem. II. Nutrient budgets. Arch. Hydrobiol. Suppl. Monogr. Beitr. 1995, 107, 24–47. [Google Scholar]
- Allan, J.L. Legacy sediment: Definitions and processes of episodically produced anthropogenic sediment. Anthropocene 2013, 2, 16–26. [Google Scholar]
- Chapra, S.C.; Canale, R.P. Long-term phenomenological model of phosphorus and oxygen for stratified lakes. Wat. Res. 1991, 25, 707–715. [Google Scholar] [CrossRef]
- Steinmen, A.D.; Havens, K.E.; Auman, N.G.; James, R.T.; Jin, K.J.; Zhang, J.; Rosen, B.H. Phosphorus in Lake Okeechobee, sources, sinks, and strategies. In Phosphorus Biochemistry in Subtropical Ecosystems; Reddy, K.R., O’Conner, G.A., Schelske, C.L., Eds.; Lewis Publishers: Boca Raton, FL, USA, 1999; pp. 527–584. [Google Scholar]
- Reddy, K.R.; Flaig, E.; Scinto, L.J.; Diaz, O.; DeBusk, T.A. Phosphorus assimilation in a stream system of the Lake Okeechobee Basin. J. Am. Water Res. Assoc. 1996, 32, 901–915. [Google Scholar] [CrossRef]
- Moore, A.; Reddy, K.R. Role of Eh and pH on phosphorus geochemistry in sediments of Lake Okeechobee, Florida. J. Environ. Qual. 1994, 23, 955–964. [Google Scholar] [CrossRef]
- Olila, O.C.; Reddy, K.R.; Harris, W.G. Forms and distribution of inorganic phosphorus in sediments of two shallow eutrophic lakes in Florida. Hydrobiologia 1995, 302, 147–161. [Google Scholar] [CrossRef]
- James, R.T.; Gardner, W.S.; McCarthy, M.J.; Carinia, S.A. Nitrogen dynamics in Lake Okeechobee: Forms, functions, and changes. Hydrobiologia 2011, 669, 199–212. [Google Scholar] [CrossRef]
- Cooke, G.D.; Welch, E.B.; Martin, A.B.; Fulmer, D.G.; Hyde, J.B.; Schrieve, G.D. Effectiveness of Al, Ca, and Fe salts for control of internal phosphorus loading in shallow and deep lakes. Hydrobiologia 1993, 253, 323–335. [Google Scholar] [CrossRef]
- Khan, A. Lake Okeechobee Sediment. Management: Greater Everglades Restoration Conference. 2010. Available online: https://conference.ifas.ufl.edu/GEER2010/Presentations/Thursday/Acacia%201–3/am/1120%20A%20Khan.pdf (accessed on 7 July 2020).
- Flores, E.; Herrero, A. Assimilatory nitrogen metabolism and its regulation. In The Molecular Biology of Cyanobacteria; Bryant, D.A., Ed.; Kluwer Academic Publishers: Dordrecht, The Netherlands, 1994; pp. 487–517. [Google Scholar]
- Grossart, H.P.; Simon, M. Limnetic macroscopic organic aggregates (lake snow): Occurrence, characteristics, and microbial dynamics in Lake Constance. Limnol. Oceanogr. 1993, 38, 532–546. [Google Scholar] [CrossRef]
- Tan, X.; Zhang, G.; Yin, H.; Reed, A.H.; Furakawa, Y. Characterization of particle size and settling velocity of cohesive sediments affected by a neutral exopolymer. Int. J. Sediment. Res. 2012, 27, 473–485. [Google Scholar] [CrossRef]
Figure 1.
Lake Okeechobee and its associated watershed.

Figure 2.
Bathymetry map of Lake Okeechobee relative to a datum of 3.81 m above mean sea level [7].
Figure 2.
Bathymetry map of Lake Okeechobee relative to a datum of 3.81 m above mean sea level [7].

Figure 3.
Map of the bottom sediment in Lake Okeechobee in 1975 [4].
Figure 3.
Map of the bottom sediment in Lake Okeechobee in 1975 [4].

Figure 4.
Thickness of organic mud on the bottom of Lake Okeechobee in 1989 [16].
Figure 4.
Thickness of organic mud on the bottom of Lake Okeechobee in 1989 [16].

Figure 5.
Sediment zone maps of Lake Okeechobee from 1988, 1998, and 2006 as compiled by Yan and James [31]. Note that the positioning systems used during these studies changed from LORAN to GPS. Therefore, some inherent geo localization errors occurred when comparing the maps.
Figure 5.
Sediment zone maps of Lake Okeechobee from 1988, 1998, and 2006 as compiled by Yan and James [31]. Note that the positioning systems used during these studies changed from LORAN to GPS. Therefore, some inherent geo localization errors occurred when comparing the maps.

Figure 6.
Total carbon percent (organic and inorganic) in the bottom sediments of Lake Okeechobee [4].
Figure 6.
Total carbon percent (organic and inorganic) in the bottom sediments of Lake Okeechobee [4].


Figure 8.
Map of Lake Okeechobee showing the locations of cores studied by Schottler and Engstrom in 2003 [34].
Figure 8.
Map of Lake Okeechobee showing the locations of cores studied by Schottler and Engstrom in 2003 [34].

Figure 9.
Mud vane shear strength variation with density. Redrawn from Hwang [36].
Figure 9.
Mud vane shear strength variation with density. Redrawn from Hwang [36].

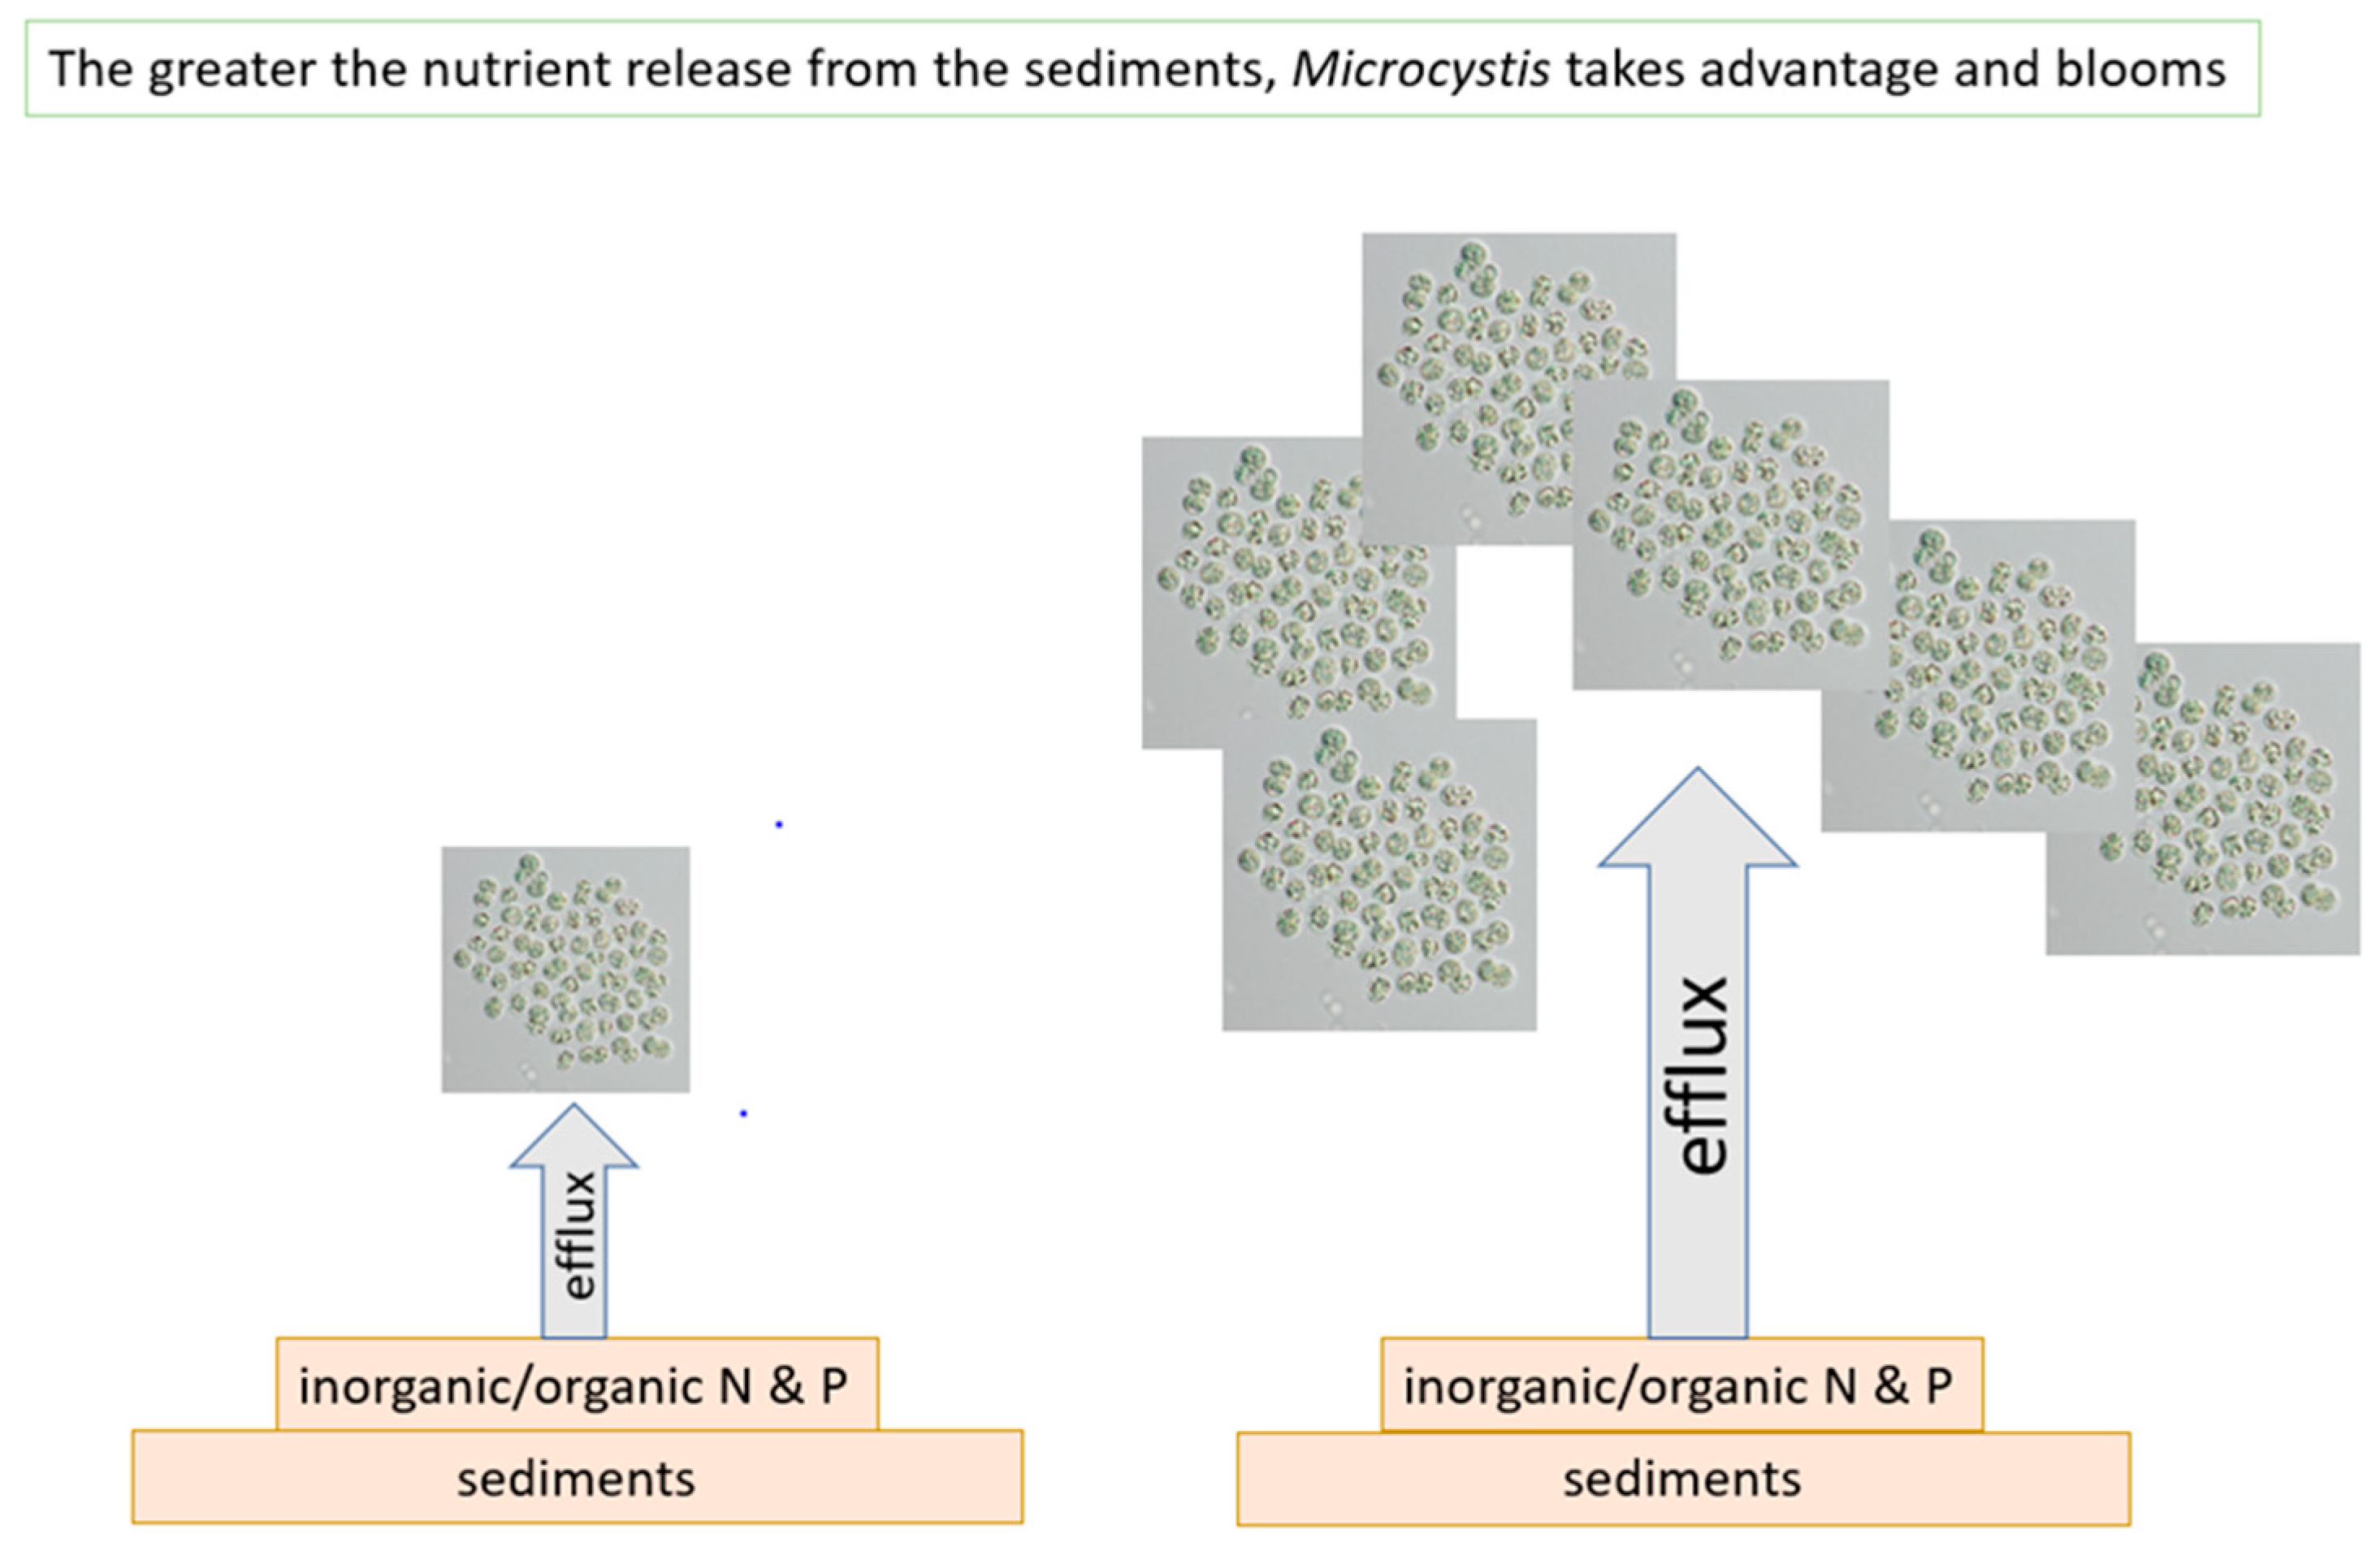
Figure 10.
Microcystis blooms are a function of the nutrient releases from the sediments.

Figure 11.
Nutrient sources that feed the algal blooms in Lake Okeechobee.

Figure 12.
Post algal bloom “lake snow” deposition in Lake Okeechobee.

Figure 13.
Photomicrograph of Lake Okeechobee snow collected from 1.8 m below the surface, June 2020. The image was obtained using a Zeiss AX10 microscope equipped with DIC and a digital imaging system.
Figure 13.
Photomicrograph of Lake Okeechobee snow collected from 1.8 m below the surface, June 2020. The image was obtained using a Zeiss AX10 microscope equipped with DIC and a digital imaging system.

Figure 14.
Lake Okeechobee snow from a 3.2 m depth, June 2020. Note the presence of filamentous bacteria at arrows. The image was obtained using a Zeiss AX10 microscope equipped with DIC and a digital imaging system.
Figure 14.
Lake Okeechobee snow from a 3.2 m depth, June 2020. Note the presence of filamentous bacteria at arrows. The image was obtained using a Zeiss AX10 microscope equipped with DIC and a digital imaging system.

Figure 15.
Lake Okeechobee snow from 3.2 m depth, June 2020. These are fecal pellets from zooplankton. The image was obtained using a Zeiss AX10 microscope equipped with DIC and a digital imaging system.
Figure 15.
Lake Okeechobee snow from 3.2 m depth, June 2020. These are fecal pellets from zooplankton. The image was obtained using a Zeiss AX10 microscope equipped with DIC and a digital imaging system.

Publisher’s Note: MDPI stays neutral with regard to jurisdictional claims in published maps and institutional affiliations. |
© 2020 by the authors. Licensee MDPI, Basel, Switzerland. This article is an open access article distributed under the terms and conditions of the Creative Commons Attribution (CC BY) license (http://creativecommons.org/licenses/by/4.0/).
Share and Cite
MDPI and ACS Style
Missimer, T.M.; Thomas, S.; Rosen, B.H. Legacy Phosphorus in Lake Okeechobee (Florida, USA) Sediments: A Review and New Perspective. Water 2021, 13, 39. https://0-doi-org.brum.beds.ac.uk/10.3390/w13010039
AMA Style
Missimer TM, Thomas S, Rosen BH. Legacy Phosphorus in Lake Okeechobee (Florida, USA) Sediments: A Review and New Perspective. Water. 2021; 13(1):39. https://0-doi-org.brum.beds.ac.uk/10.3390/w13010039
Chicago/Turabian StyleMissimer, Thomas M., Serge Thomas, and Barry H. Rosen. 2021. "Legacy Phosphorus in Lake Okeechobee (Florida, USA) Sediments: A Review and New Perspective" Water 13, no. 1: 39. https://0-doi-org.brum.beds.ac.uk/10.3390/w13010039
Note that from the first issue of 2016, this journal uses article numbers instead of page numbers. See further details here.