Article

Pressure Fluctuations in the Spatial Hydraulic Jump in Stilling Basins with Different Expansion Ratio

by
Nasrin Hassanpour
1,*,
Ali Hosseinzadeh Dalir
1,
Arnau Bayon
2 and
Milad Abdollahpour
3
1
Department of Water Engineering, University of Tabriz, Tabriz 51368, Iran
2
Department of Hydraulic Engineering and Environment, Universitat Politècnica de València, Camí de Vera, s/n, 46022 Valencia, Spain
3
Department of Civil, Architectural and Environmental Engineering, University of Napoli Federico II, 80125 Napoli, Italy
*
Author to whom correspondence should be addressed.
Submission received: 16 September 2020 / Revised: 16 December 2020 / Accepted: 17 December 2020 / Published: 30 December 2020
(This article belongs to the Special Issue Physical Modelling in Hydraulics Engineering)

Abstract

:
Pressure fluctuations are a key issue in hydraulic engineering. However, despite the large number of studies on the topic, their role in spatial hydraulic jumps is not yet fully understood. The results herein shed light on the formation of eddies and the derived pressure fluctuations in stilling basins with different expansion ratios. Laboratory tests are conducted in a horizontal rectangular flume with 0.5 m width and 10 m length. The range of approaching Froude numbers spans from 6.4 to 12.5 and the channel expansion ratios are 0.4, 0.6, 0.8, and 1. The effects of approaching flow conditions and expansion ratios are thoroughly analyzed, focusing on the dimensionless standard deviation of pressure fluctuations and extreme pressure fluctuations. The results reveal that these variables show a clear dependence on the Froude number and the distance to the hydraulic jump toe. The maximum values of extreme pressure fluctuations occur in the range 0.609 < X < 3.385 , where X is dimensionless distance from the toe of the hydraulic jump, which makes it highly advisable to reinforce the bed of stilling basins within this range.

1. Introduction

Hydraulic jumps are a rapidly varied open-channel flow characterized by a sudden transition from supercritical to subcritical flow regime [1]. Hydraulic jumps are classified based on the approaching flow Froude number ( F r 1 ). The most effective hydraulic jump in terms of energy dissipation occurs in the range of 4.5 < Fr1 < 10, which reduces the length of stilling basins [2]. The jump toe, where the upstream flow impinges into the downstream region, is a singular locus with discontinuities in velocity and pressure fields [3]. In hydraulic jumps, energy is dissipated due to the generation of large-scale turbulence structures [4], which are associated with non-negligible hydrodynamic pressure fluctuations acting on the stilling basin floor and sidewalls. These pressure fluctuations may cause severe damage by lifting up slabs, eroding materials, and causing cavitation [5]. Studies on turbulence intensity and pressure fluctuations in hydraulic jumps began in the late 1950s, when the necessary instrumentation became available [5]. During that period, major damages due to pressure fluctuations were reported in several stilling basins, e.g., Karnafuli dam in Bangladesh [6] and Malpaso dam in Mexico [7]. In both cases, the turbulent pressure fluctuation beneath the hydraulic jump was the primary cause of failure of the chute slabs [6,7]. Later on, Elder [4] presented information about model and prototype relationships, indicating that low-frequency turbulence and pressure fluctuations are primarily due to large-scale eddies and water surface disturbances, in which gravity and inertia forces are dominant. Conversely, high-frequency fluctuations are due to turbulence associated with viscous forces [5]. The statistical characteristics of the pressure fluctuations at the bottom of the hydraulic jump were studied by Schiebe [8], Abdul and Elango [9], Akbari et al. [10], Bowers and Toso [6], Lopardo and Henning [11], Lopardo et al. [12], Spoljaric et al. [13], Tullis and Rahmeyer [14], Vasiliev and Bukreyer [15], Fiorotto and Rinaldo [16], Lopardo and Romagnoli [17], and Novakoski et al. [18]. The values of standard deviation, skewness and kurtosis, maximum and minimum value, and temporal correlation of the pressure fluctuations at the bottom of the hydraulic jump are reported in these studies. In addition, they found that the peak value of the dimensionless index of the pressure fluctuation depends on the distance from the hydraulic jump toe, the chute slope, the approaching Froude number, the incident flow development, and the length of the test run. These studies also showed that the maximum and the minimum positive and negative pressure fluctuations along the jump increase abruptly at the beginning and decrease smoothly downstream of the peak.
In most prototype conditions with large Froude numbers, the air entrainment in hydraulic jumps is significant, both at the jump toe and through the roller, the recirculating region where most of the air entrapment occurs, and is transported downstream by large vortex structures [19]. Wang et al. [3] studied the total pressure fluctuation and the two-phase turbulent flow characteristics in different hydraulic jumps. The result shows that the maximum average of total pressure and the maximum pressure fluctuations are observed at different vertical positions. The total pressure fluctuations are associated with both velocity and water level fluctuations. This is supported by a comparison between relative total pressure fluctuation and turbulence intensity, as well as by a preliminary investigation of the pressure fluctuation frequencies. Wang et al. [20] predicted that the jump toe oscillation is closely linked to the air entrapment at the toe and the velocity variation in the shear flow. Their results corroborated that the unstable total pressure distribution is primarily associated with the free-surface fluctuation in the roller region. Additionally, statistical parameters regarding flow depths (average values, standard deviation, and skewness) were compared to the statistical values of pressure fluctuations obtained from the literature by Nobrega et al. [21]. The results indicated that the correlation between both phenomena is due by the fact that flow depth fluctuations and pressure fluctuations are both caused by turbulence. Onitsuka et al. [22] and Lopardo [23] found that roller oscillations also affect the instantaneous flow depth and bed pressure. In addition, instantaneous bed pressures are associated with free surface fluctuations. Schiebe [8] described the stochastic characteristics of the pressure fluctuations under a hydraulic jump. The results indicated that the root mean squares of pressure fluctuations in two experimental channels of different size were identical. Abdul and Elango [9] reported that the maximum intensity of pressure fluctuations with respect to the incident dynamic pressure is about 0.085. This value is higher than those reported by earlier investigators due to the turbulence development derived from the large velocity gradients near the impinging jet. Along the same line, Fiorotto and Rinaldo [16] presented a characterization of transient uplift generated by turbulent pressure fluctuations in stilling basins. They showed that the longitudinal correlation is heterogeneous and the statistical characteristics of pressure fluctuations depend on the position on the streamwise axis. They also found that the transversal spatial correlation is homogeneous and that the statistical characteristics of the pressure fluctuations are independent of the crosswise coordinate. Bellin and Fiorotto [24] conducted laboratory experiments to evaluate the design criteria for protection slabs in stilling basins, showing that the fluctuating force is highly related to the slab shape. Rectangular slabs placed with their longer side parallel to the flow direction seemed to be the most appropriate layout. Novakoski et al. [18] studied bed pressures downstream of a stepped spillway. The results indicated that the longitudinal distribution of skewness and kurtosis coefficients condition the positions of flow detachment start, roller end, and the limits of influence of the hydraulic jump on the flow.
According to the study of Abdul Khader and Elango [9], Akbari et al. [10], and Lopardo and Henning [11], the dimensionless index of pressure fluctuation is defined as follows:
C p = P 2 V 1 2 / 2 g
where V 1 2 / 2 g is the kinetic energy of the approaching flow ( V 1 is approaching flow velocity and g is gravity) and P 2 is the root mean square (RMS) of pressure and it is obtained from:
P 2 = 1 N n = 1 N P x , y , n Δ t P ¯ x , y 2
where N is the number of recorded data, P x , y , n Δ t is instantaneous pressure, P ¯ x , y is the average pressure, and Δ t is the data recording period. Additionally, the positive and negative pressure coefficients are defined by Toso and Bowers [5] as follows:
C + p = Δ P + V 1 2 / 2 g
C p = Δ P V 1 2 / 2 g
where Δ P + and Δ P are the maximum and minimum pressure deviations from the average value, respectively. Toso and Bowers [5] obtained peak values of the RMS dimensionless pressure fluctuations ( C p ) up to 0.1 and dimensionless pressure fluctuation ( C p ) values up to 1.3. Esfahani and Bajestan [25] demonstrated that increasing the Froude number causes an initial increment of the maximum values of positive and negative pressure coefficient. In addition, the result shows that the value of C p is always between C p and C + p . The average pressure data are shown as a function of the position of the hydraulic jump according to the nondimensionalization proposed by Marques et al. [26]:
ψ = P x y 1 y 2 y 1   X = x y 2 y 1
where P x is average pressure per unit specific weight at a given horizontal distance from the hydraulic jump toe, and y 1 and y 2 are the supercritical and subcritical flow depths, respectively. Teixeira [27], using the experimental data of Marques et al. [26], proposed the following relationship for the average pressure distribution:
ψ = 0.015 X 2 + 0.0237 X + 0.07
The state-of-the-art review shows that pressure fluctuations constitute an important research topic and a crucial aspect of the hydraulic structure design due to the major damages suffered by several stilling basins due to this phenomenon. However, it is worth remarking that most of these studies focus on the distribution of pressure fluctuations in classical hydraulic jumps. Nevertheless, when the hydraulic jump occurs in gradually expanding stilling basins, it is influenced by the formation of side eddies and few researchers focused on this effect on the fluctuating pressure.
In a gradually expanding stilling basin, three types of hydraulic jump can occur, namely: repelled hydraulic jump (R-jump), transitional hydraulic jump (T-jump), and spatial hydraulic jump (S-jump) [28]. The S-jump is characterized by a toe located within the expanding section and shows asymmetric flow features. The work presented herein reports a thorough study of the pressure fluctuations on spatial hydraulic jumps and provides extensive information on statistical parameters of pressure fluctuations in different scenarios. Recommendations for hydraulic-structure designers are also outlined from the results.

2. Methods

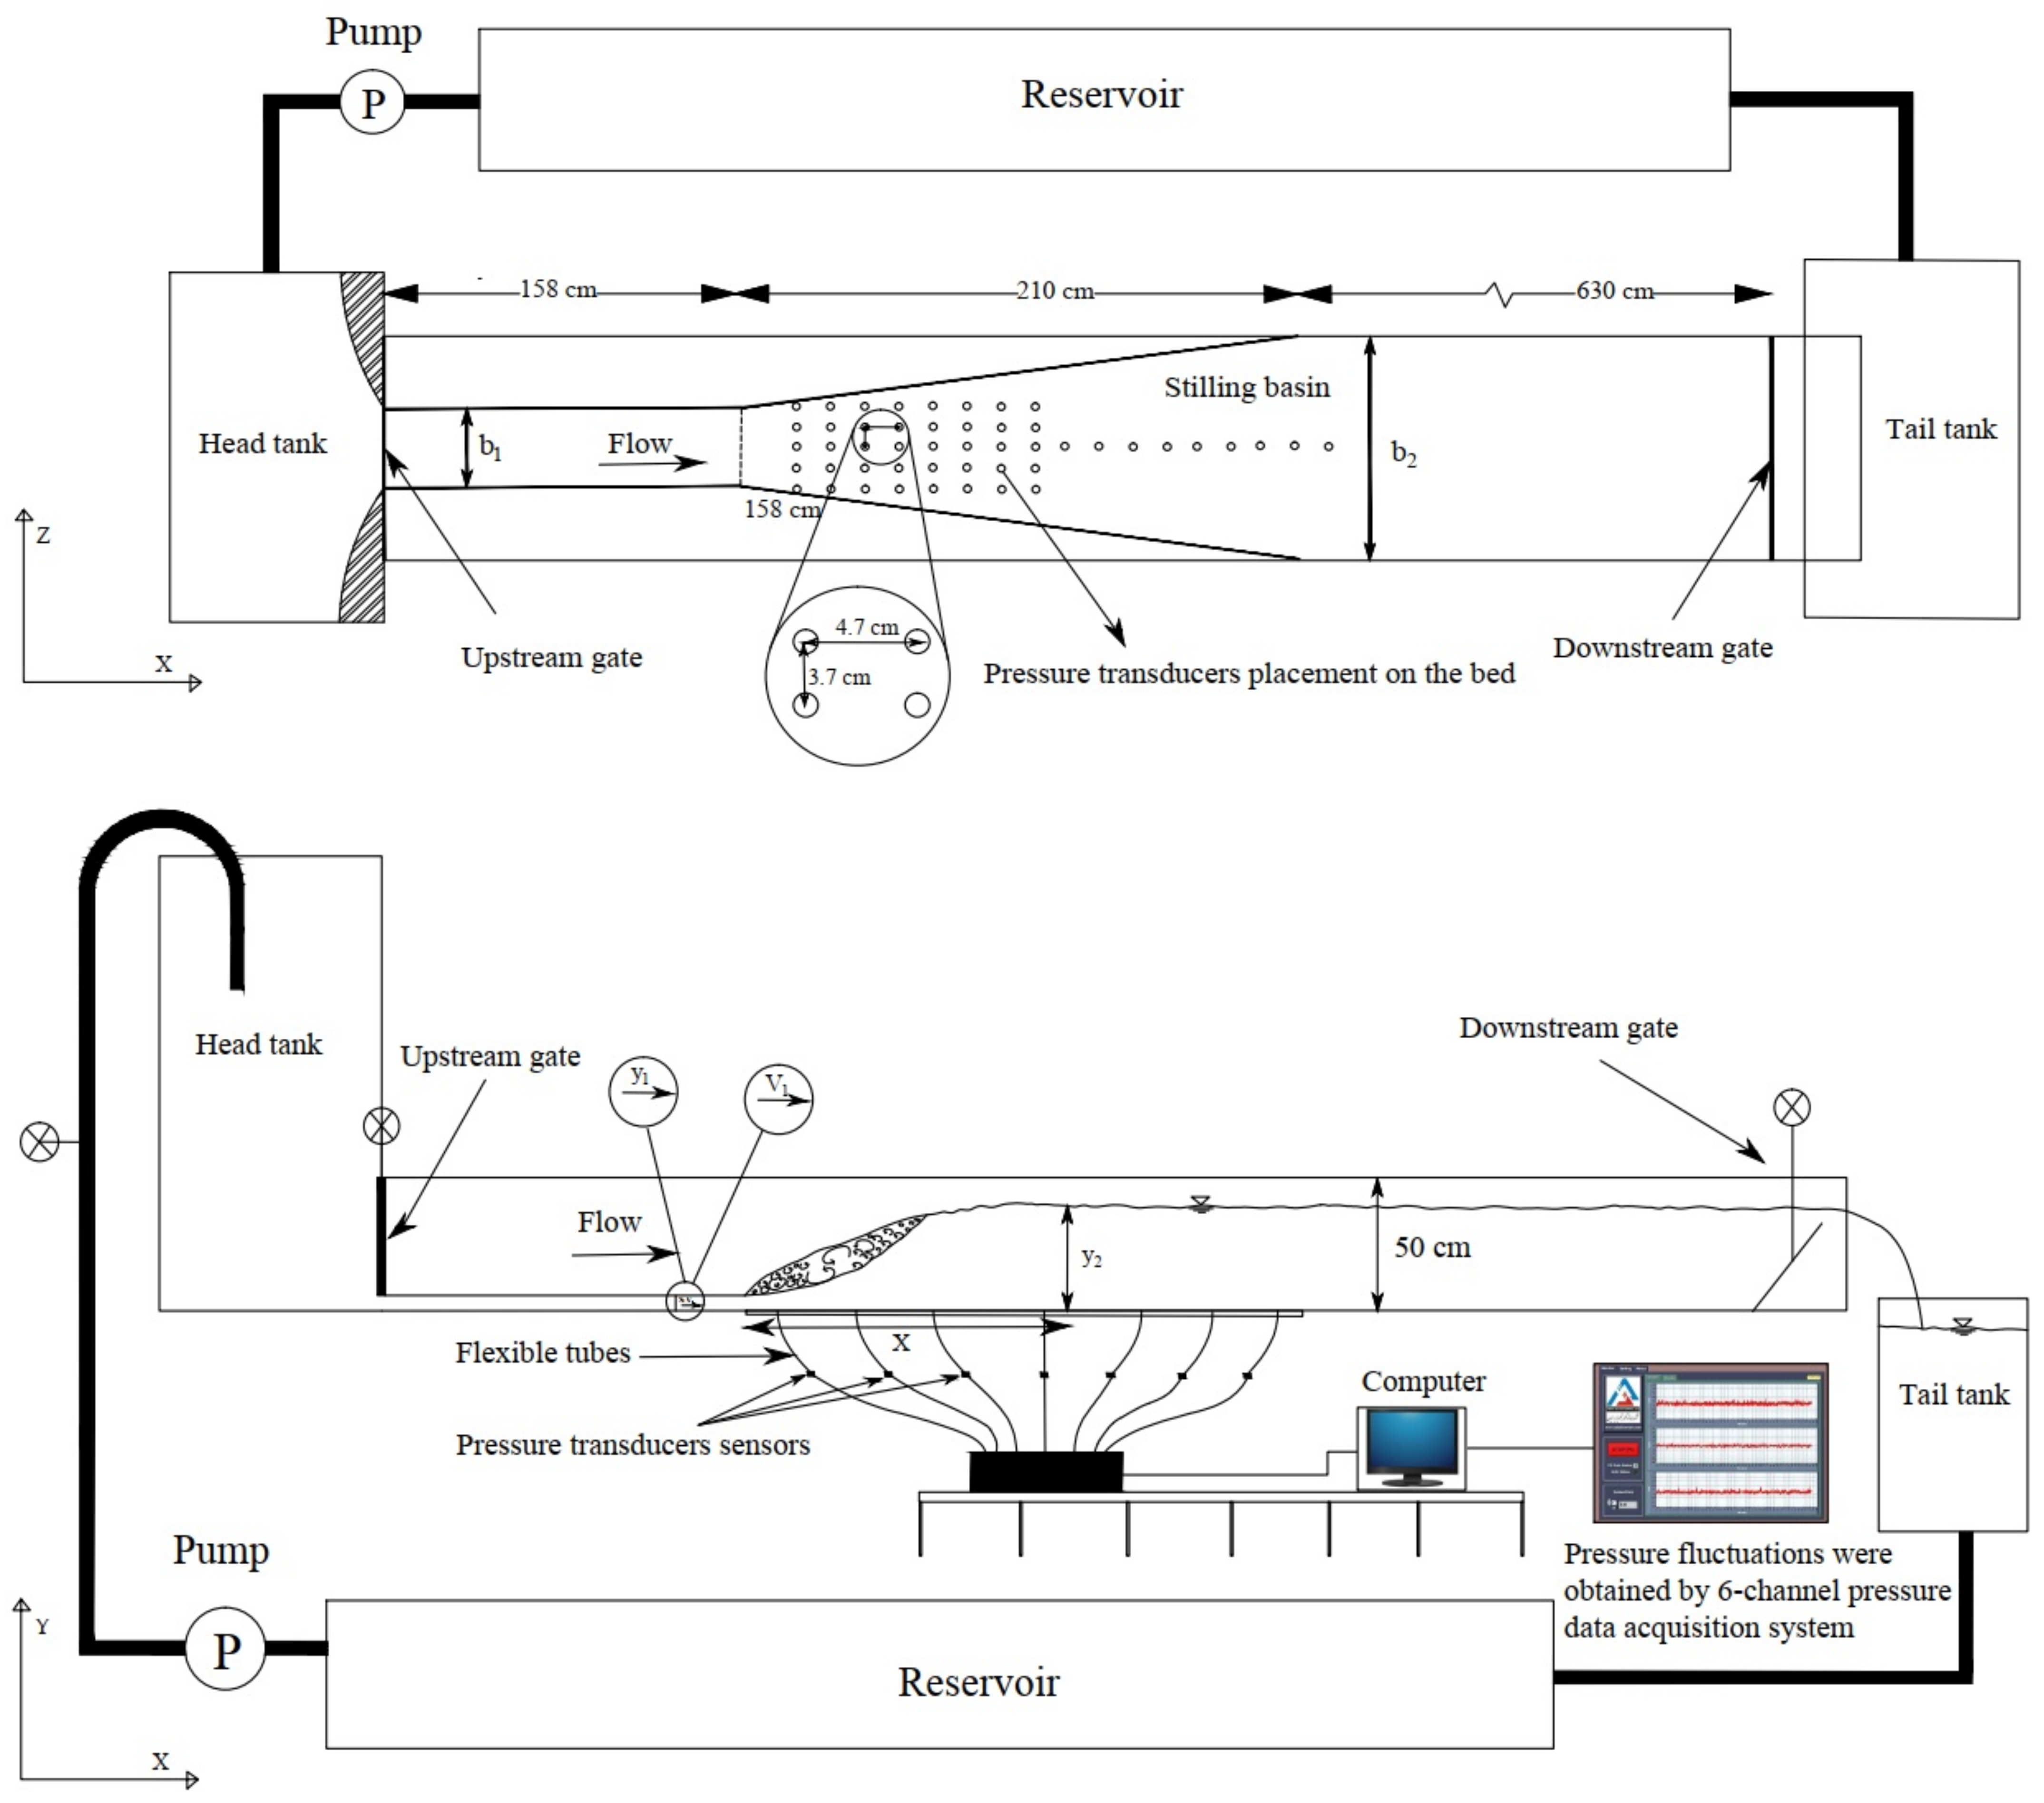
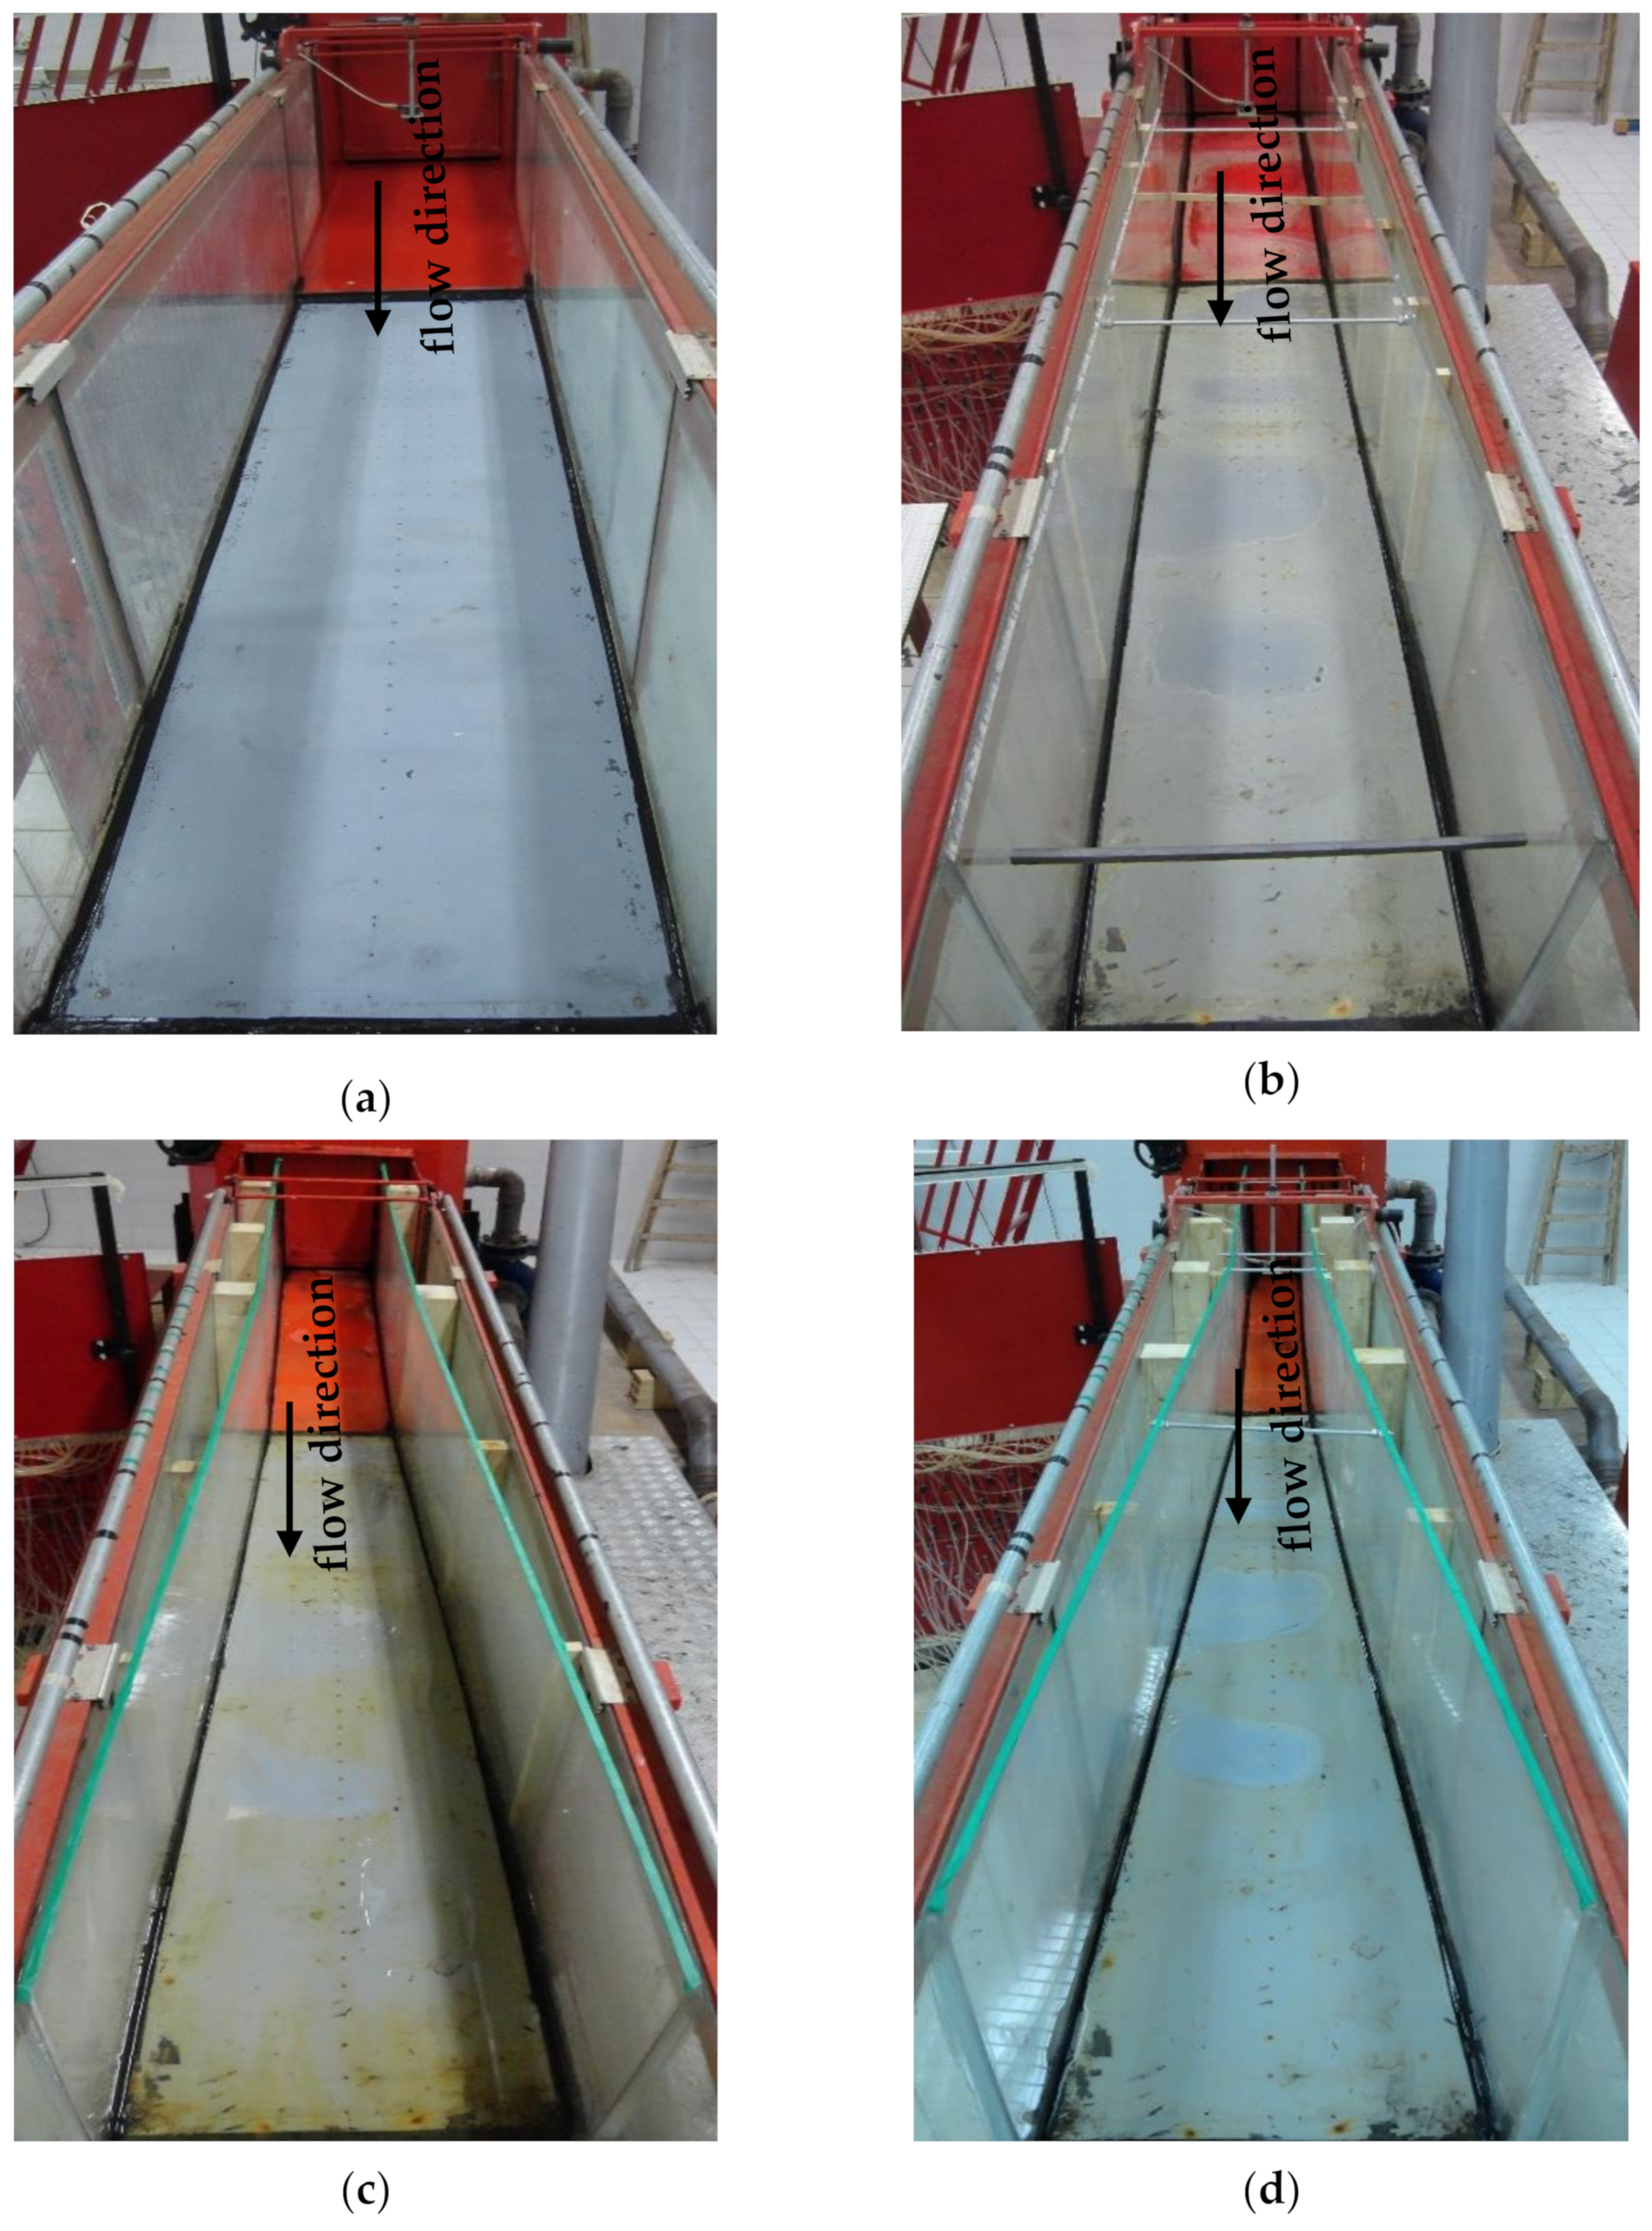
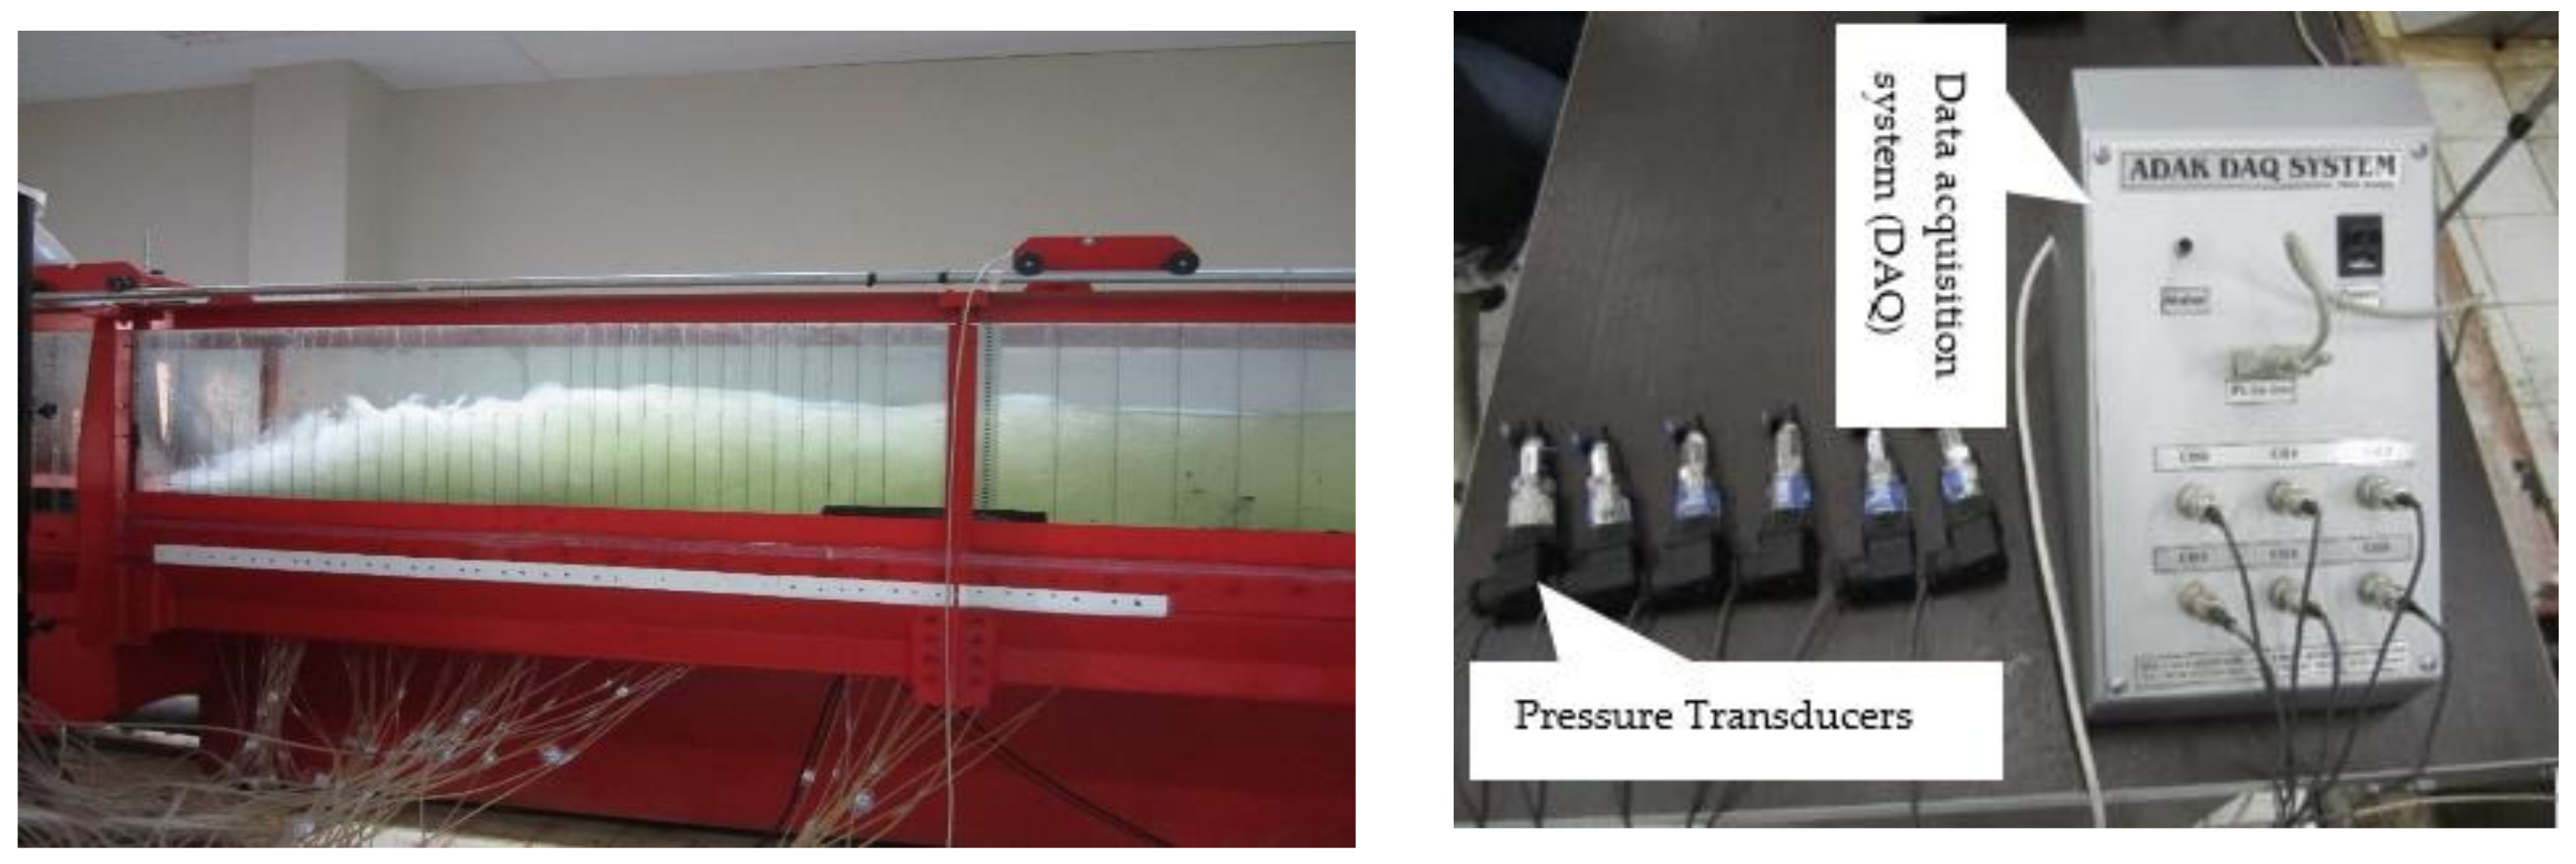
2.1. Experimental Setup and Instrumentation

The experiments were conducted at the hydraulics laboratory of the University of Tabriz (Iran) in a metal–glass horizontal rectangular flume of dimensions 10.0 m length, 0.5 m width, and 0.5 m height. The floor material is metal, whereas the sidewalls are made of glass to allow flow visualization. The schematic diagram of the experimental arrangement is shown in Figure 1.
The flow discharge was measured by an ultrasonic flow meter model Transit Time Clamp-on located in the supply line. The inflow conditions were controlled by a vertical sluice gate that was rounded undershoot to induce a horizontal impinging flow without contraction. A sluice gate was placed at the end of the flume to control the position of the hydraulic jump toe. Four physical model setups were built (see Figure 2) with different expansion ratios (B = b1/b2) of 0.4, 0.6, 0.8, and 1 (where b1 and b2 are the widths of the stilling basin upstream and downstream of the spatial hydraulic jump, respectively). Pressure fluctuations were measured using pressure transducers of the Atek BCT 110 series with an operation range of ±100 mbar and accuracy of ±0.5%. A sampling rate of 20 Hz with 90 s duration was used to collect 1800 sample data for each test and each pressure tap. Table 1 summarizes the tests conducted in the work that is presented herein.
The pressure transducers were connected to the taps on the stilling basins through flexible tubes and were mounted at different points along the stilling basin. The computer was linked to the transducers via a 6-channel (6CH) digital board and after processing the signals using a data acquisition system, the recorded data were displayed using 6CH Pressure DAQ (data acquisition) software. The pressure fluctuations were measured at 31 points on the center of the stilling basins, thus the distance between contiguous pressure taps in the longitudinal axis was 0.047 m (see Figure 3).

2.2. Dimensional Analysis

Complete solutions to engineering problems can rarely be achieved by analytical methods alone and laboratory tests are usually necessary to determine the way in which one factor depends on others. Dimensional analysis has proved very useful in reducing to a minimum the number of tests required and in grouping factors together. In other words, dimensional analysis is a technique not only to search for the correct form of the relation between different variables but also to suggest how experimental campaigns should be designed. In the case reported herein, the magnitude and extent of the pressure fluctuations are known to be influenced by the geometry of the stilling basin, the incoming flow conditions, and the Froude number [29]:
f 1 p , ρ , υ , y 1 , y 2 , V 1 , x , b 1 , b 2 , g = 0
where p is pressure fluctuation, ρ is the density of water, υ is water kinematic viscosity, y 1 is inflow depth, y 2 is sequent depth of flow, V 1 is average velocity at the beginning of the jump, x is longitudinal distance from the toe of the hydraulic jump, b 1 and b 2 are upstream and downstream widths of the stilling basin, and g is gravity. Based on the principle of dimensional reasoning [30], the functional relationship among them can be expressed as:
f 2 ( C p ) = p 2 V 1 2 / 2 g , y 2 y 1 , 1 R e 1 = υ V 1 y 1 , x y 1 , 1 F r 1 2 = g y 1 V 1 2 , b 1 y 1 , b 2 y 1 = 0
where C p is the pressure fluctuation coefficient, F r 1 is the supercritical Froude number, and R e 1 is the supercritical flow Reynolds number. Since the latter is rather high ( 50 , 000 Re 1 109 , 000 ), viscous effects may be neglected (Rajaratnam [31] and Hager and Bremen [32]). Therefore, the dimensionless RMS of pressure fluctuation can be defined as:
C p = p 2 V 1 2 / 2 g = f 3 y 2 y 1 , x y 1 , F r 1 , b 1 b 2
Consistently, the negative and positive pressure coefficients ( C + p , C p ) can be obtained as:
C + p = Δ p + V 1 2 / 2 g = f 4 y 2 y 1 , x y 1 , F r 1 , b 1 b 2
C p = Δ p V 1 2 / 2 g = f 5 y 2 y 1 , x y 1 , F r 1 , b 1 b 2

3. Results and Discussion

The dimensionless RMS of the pressure fluctuation and positive and negative pressure coefficients are analyzed to investigate the nature of pressure fluctuations of the S-jump in gradually expanding stilling basins. Additionally, statistic indicators, such as the skewness coefficients, are computed and discussed along with the rest of the results.

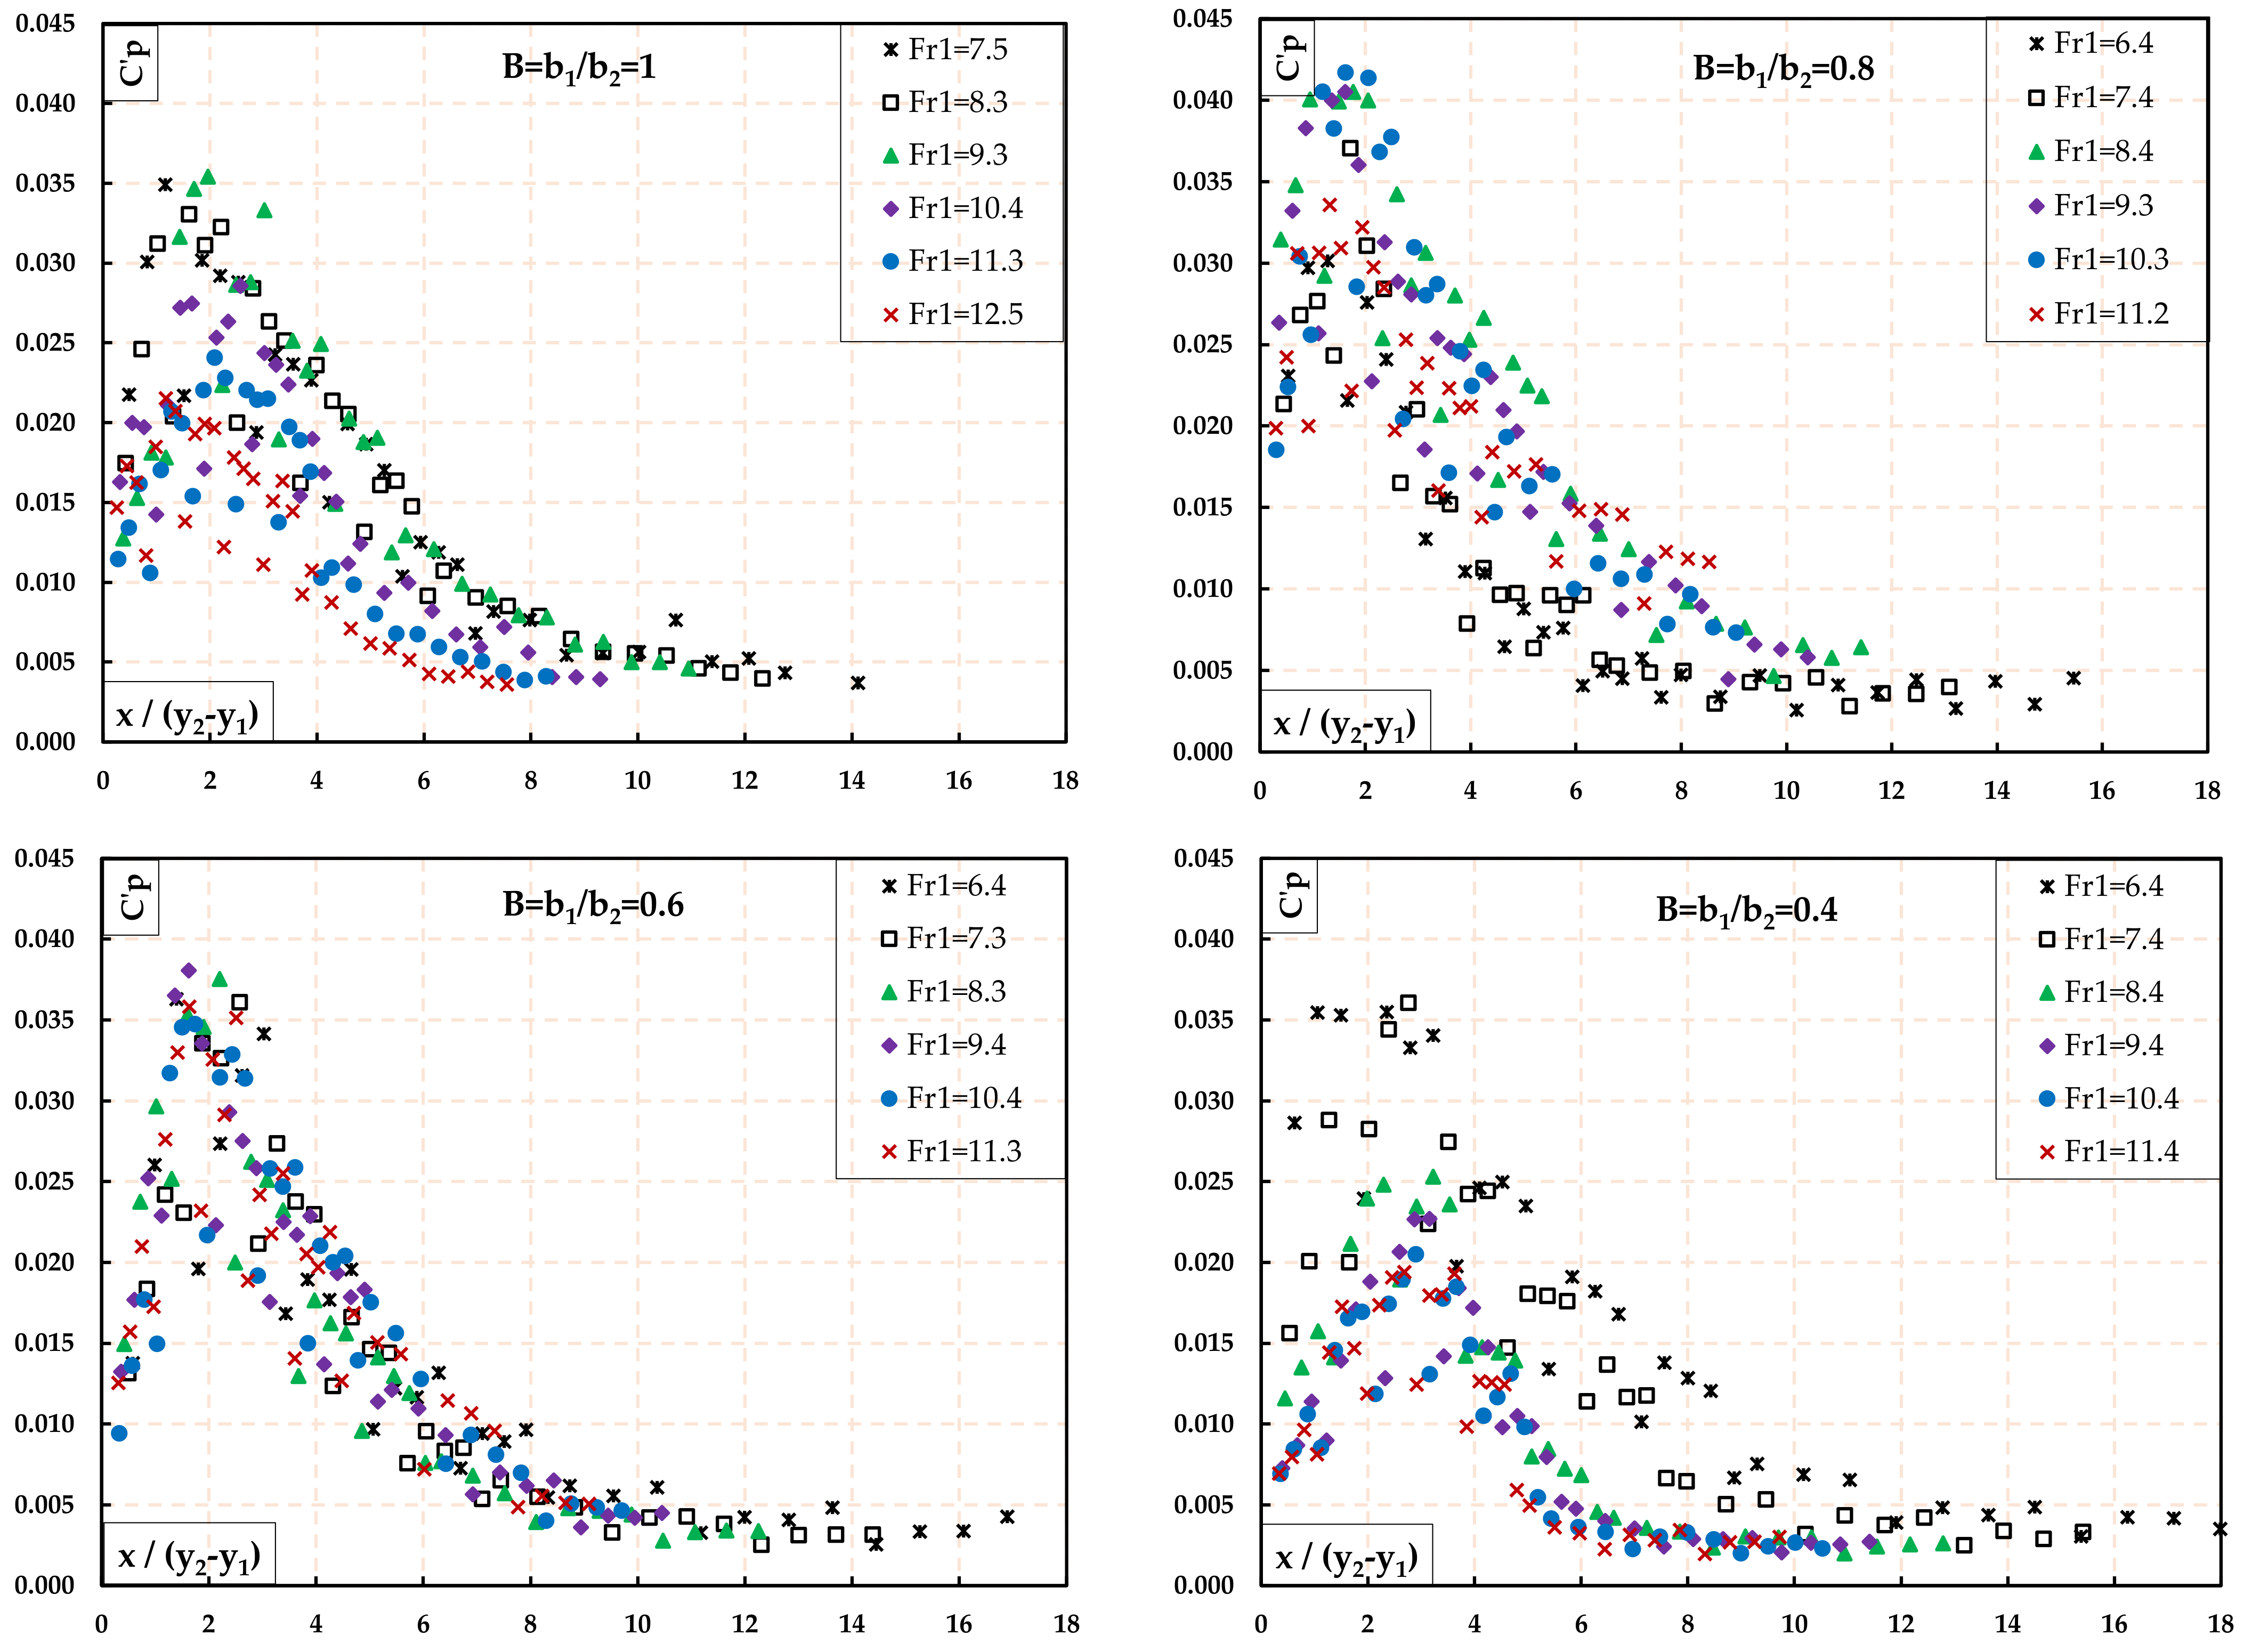
3.1. Dimensionless RMS of Pressure Fluctuations

Figure 4 shows the variations of the C p along the centerline of the spatial hydraulic jump according to the Froude number for expansion ratios of 0.4, 0.6, 0.8, and 1. In the figure, a clear pattern of the dependence of C p on the Froude number can be observed. This pattern seems to follow a similar trend regardless of the Froude number values, which suggests that the analyzed variable may show certain self-similarity. In all cases, the value of C p is relatively small near the hydraulic jump toe, following by an abrupt rise in the roller region, where most of the turbulence develops. Downstream of the peak value, the variable follows an exponential decay, which appears to be more abrupt at low Froude numbers. The results also indicate that the maximum value of C p in the expansion ratios of 1 and 0.4 decreases when the Froude number increases. In this case, the rate of increase of dynamic pressure is larger than the corresponding pressure fluctuations. This finding is in good agreement with the results obtained by Fiorotto and Rinaldo [33]. However, in the expansion ratios of B = 0.8 and B = 0.6 , the maximum value of C p increases as the Froude number increases. In this case, the rate of increase of pressure fluctuations is larger than that of dynamic pressures. The experimental data in the expansion ratios B = 0.8 and B = 0.6 shows that the intense turbulent fluctuations of the free surface characterizing these hydraulic jumps cause the differences in the pressure fluctuation patterns. In addition, probably by increasing the expansion ratio, flow separation and consequently flow turbulence increases.
Figure 4 also shows that the C p values reach a maximum value at an X value around 2, whereas the asymptotic range seems to be attained at about 8, where the influence of the hydraulic jump is no longer observable. This achievement coincides with the data obtained by Marques et al. [26] and Novakoski et al. [18], but from the beginning of the stilling basin to approximately between X = 1.75 and X = 4 , the C p values reach their maximum value, according to Marques et al. [26] and Novakoski et al. [18].
The maximum values of C p in the expansion ratio of 1, 0.8, 0.6, and 0.4 are 0.0354, 0.0417, 0.0375, and 0.0360, respectively. In addition, the results show that the maximum value of the pressure fluctuation coefficient and the peak frequencies of the spatial hydraulic jumps are larger than that of the classical hydraulic jump, which agrees well with Yan et al. [34]. This phenomenon can probably be explained by the formation of vortices near the expanding sidewalls in spatial hydraulic jumps, in coherence with Onitsuka et al. [22], who found that the instantaneous bed pressures are associated with the free surface fluctuations. Furthermore, the location of the maximum value of C p , depends on the Froude number. The distance where the C p reaches to its maximum value increases with the increase of the Froude number, which needs to be taken into account to provide stilling basins with appropriate protection against dynamic loads. Table 2 shows the maximum values of dimensionless RMS of the pressure fluctuations according to the expansion ratio.

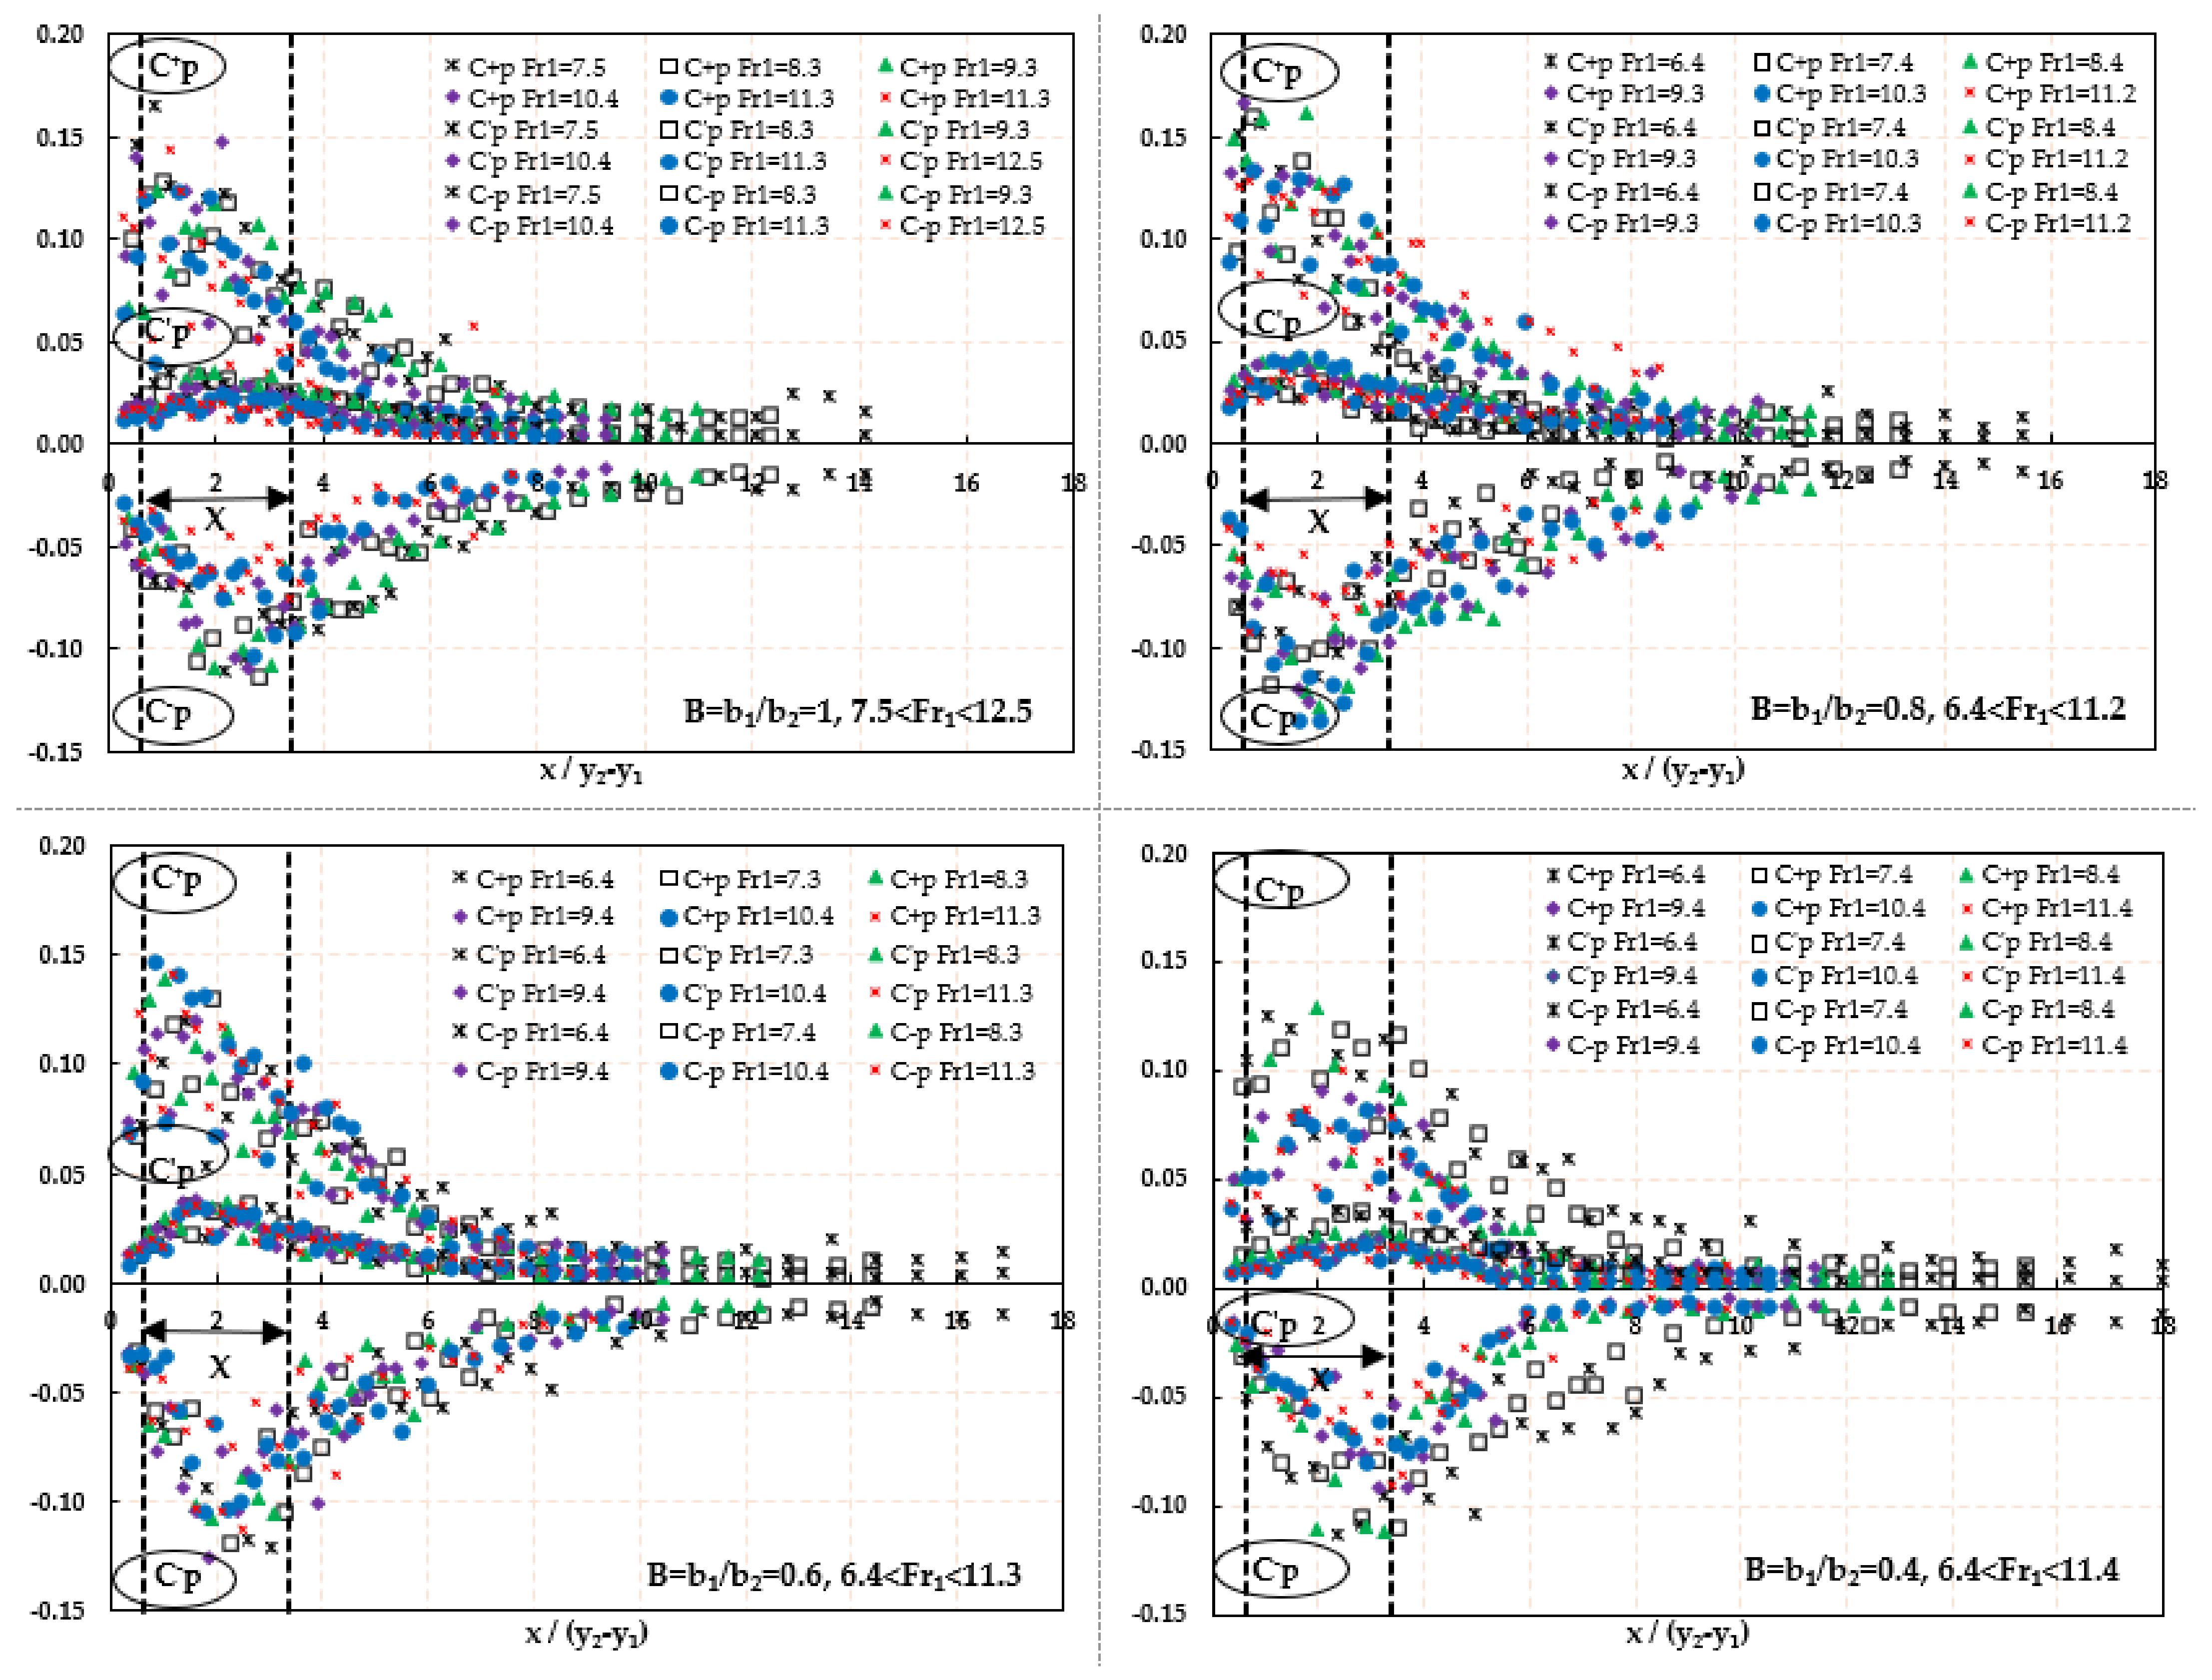
3.2. Positive and Negative Pressure Coefficients

The positive and negative pressure coefficients are calculated using pressures measured according to Equations (3) and (4), respectively, and shown in Figure 5.
As shown in Figure 5, the values of positive and negative pressure coefficients show a strong dependence on the distance to the hydraulic jump toe. Once again, positive and negative pressure coefficients increase abruptly near the hydraulic jump toe, reaching to the peak value at X = 2 . and then decrease until approximately X = 8 , where the asymptotic range is reached. It can be seen that the absolute values of the positive pressure coefficient are always higher than those corresponding to the negative pressure coefficient. It may be due to the presence of a water column above the pressure transducers. Table 3 shows the range of maximum positive and negative deviations from the average pressure according to the expansion ratio and the Froude number. Since the maximum values of the positive and negative pressure coefficients occur within the range 0.609 < X < 3.385 , it is therefore advisable to reinforce the bed of stilling basins in this region to avoid damages due to dynamic loads. The evolution of dimensionless RMS of the pressure fluctuation and the positive and negative pressure coefficients along the hydraulic jump are presented according to the expansion ratio and the Froude number. This information can assist designers of hydraulic structures to adopt the most suitable and economical stilling basin setup according to the flow conditions.

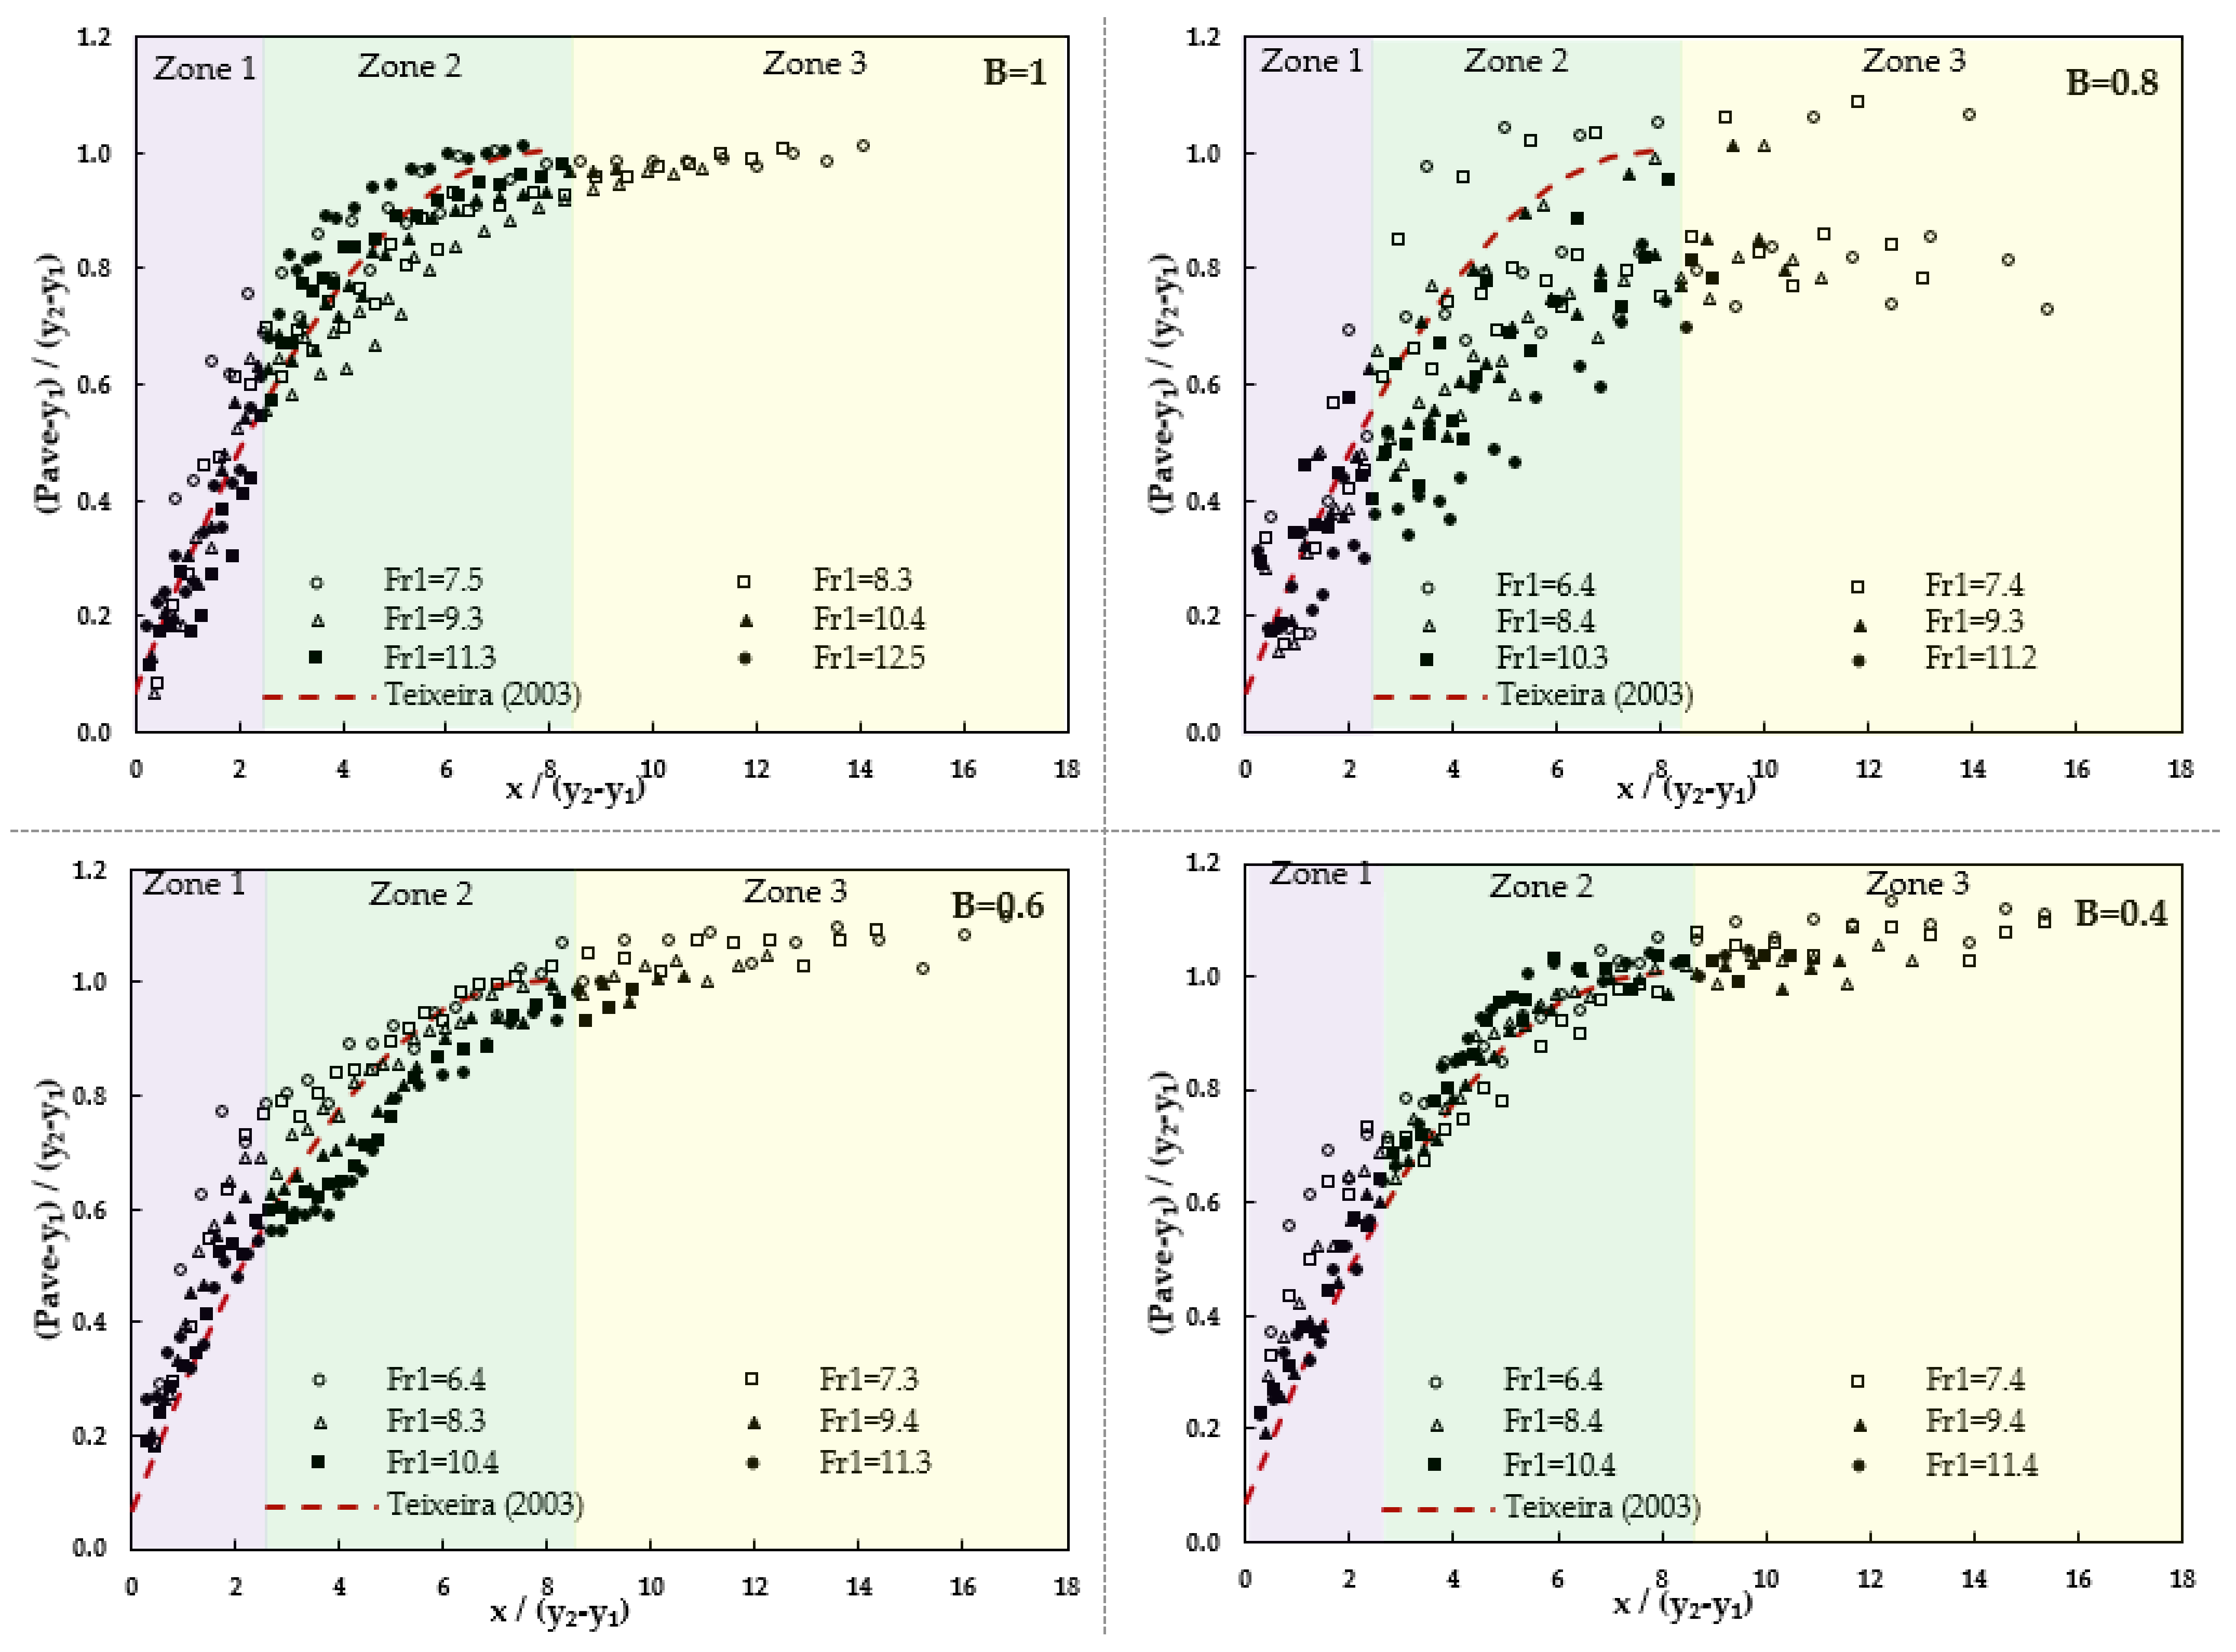
3.3. Average Pressure along the Central Axis

Figure 6 shows the resulting curves according to Equation (6) and the Froude number with different expansion ratios. A clear pattern can easily be observed among all the data, thus indicating the self-similarity of the average pressure profiles.
The average pressure values in the vicinity of the toe in the spatial hydraulic jumps are larger compared to the classical hydraulic jump. This is due to the presence of gradually expanding walls that decrease the sequent depth ratio [35]. It can also be observed in Figure 6 in all cases that the average pressure increment is nearly linear in the region X < 2.5 (zone 1). Beyond that, in the range 2.5 < X < 8 , the average pressure shows an exponential trend (zone 2), and for X 8 (zone 3) the average pressure trend stabilizes and approaches the asymptotic range. This pattern is similar to that observed in free surface profiles in the hydraulic jumps, which suggests that, despite the large kinetic energy causing violent pressure fluctuations, the average pressure profile is also hydrostatic, in agreement with Macian-Perez et al. [36]. In expansion ratios of 0.6 and 0.4, and also the case without any expansion ( a = 1 ) the average pressure becomes particularly constant in zone 3. Concerning the B = 0.8 case, direct observation of experiments showed overly large turbulent instabilities. This is may be due to water surface fluctuations making pressure readings less reliable. Therefore, these results must be interpreted with caution. The result obtained by Marques et al. [26] showed that the average pressure coefficient ( ψ ) beyond X 8 is almost constant and equal to one. In Figure 6, a comparison between the average pressure coefficient ( ψ ) with the equation of Teixeira [27] is presented, showing good agreement.

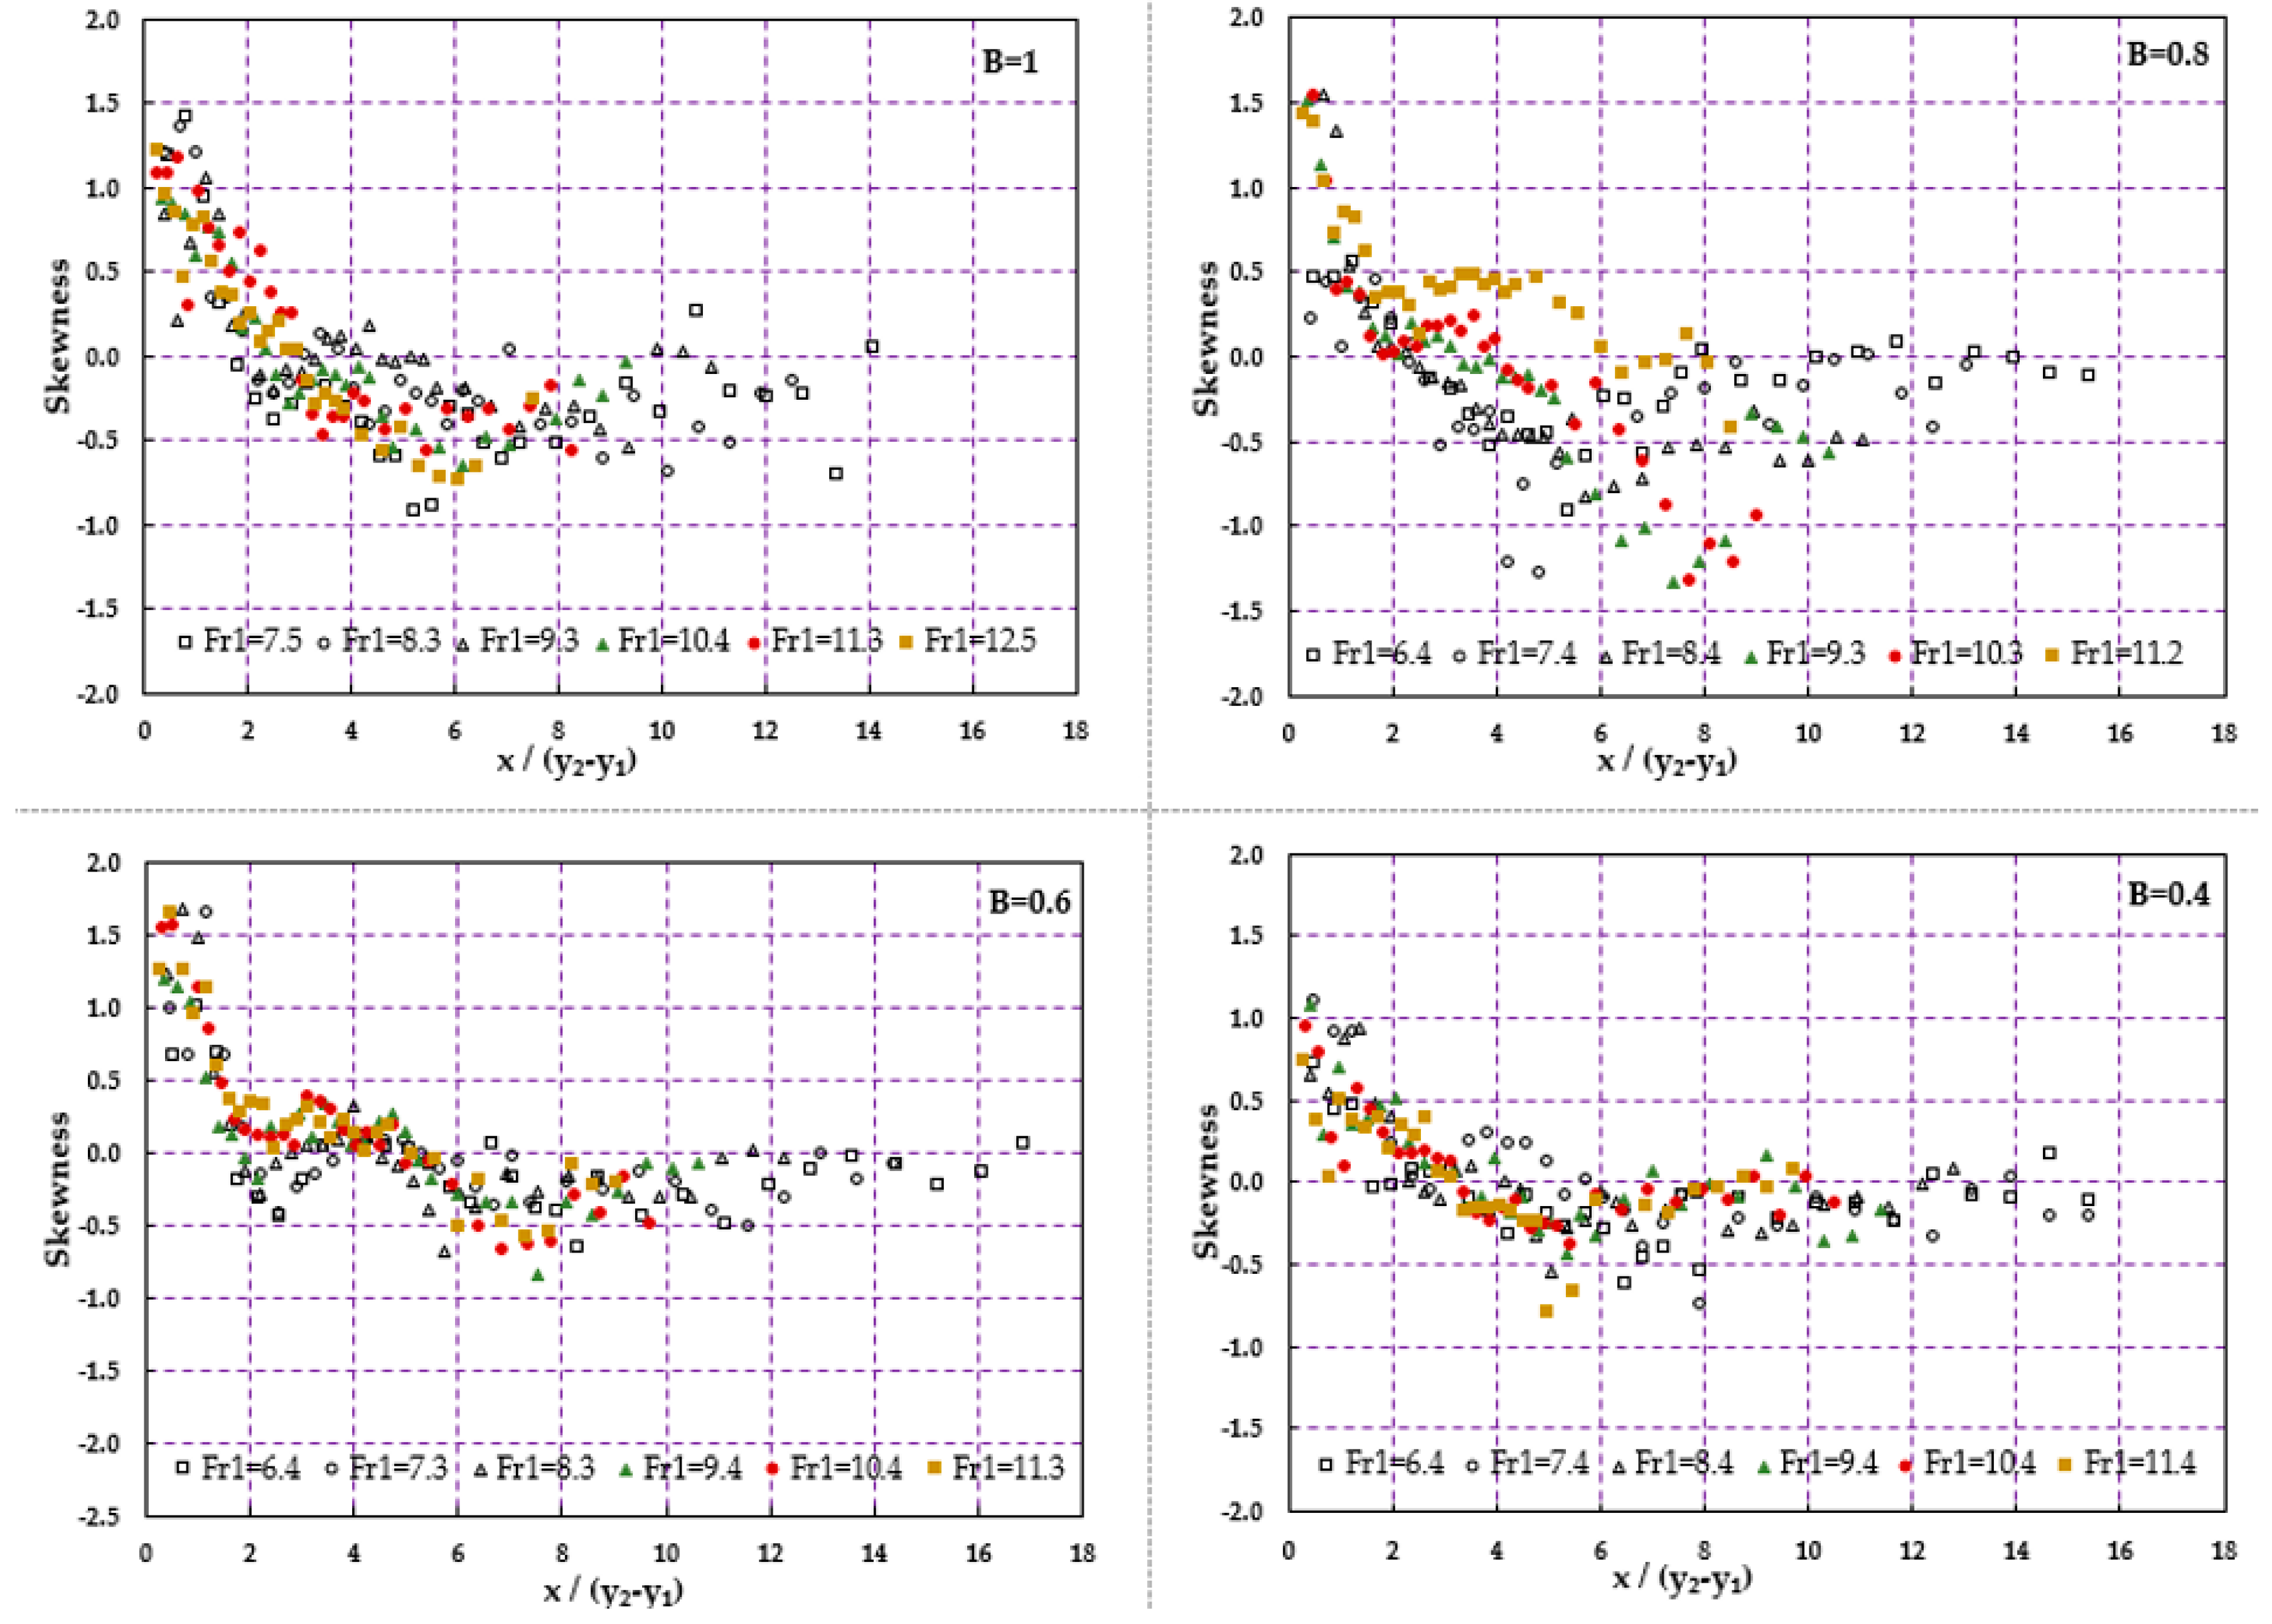
3.4. Skewness Coefficient of Pressure Fluctuations

The skewness coefficient of pressure fluctuations according to position within the hydraulic jump is computed according to the following expression:
S x , y = i = 1 i = n P x i , y i , t P ¯ x , y 3 n × σ 3 x , y
where P x i , y i , t is the instantaneous pressure value at point ( x , y ), P ¯ x , y is the average pressure, n is the number of the instantaneous pressure measurements, and σ x , y is the standard deviation of the pressure fluctuations. Skewness represents the degree of asymmetry of a distribution, i.e., how instantaneous values are biased to the left or right [37]. Figure 7 shows the skewness coefficient according to the expansion rate and Froude number, thus demonstrating that skewness is nearly independent from the Froude number variations in all expansion ratios. It can also be observed that the skewness reaches its maximum values at relative distances ( X ) between 0 to 3 and its minimum values within the range 4 < X < 8 . It can be observed in Figure 7 that from the vicinity of the hydraulic jump toe to the approximate position of X = 2 , the skewness coefficient is positive, which is probably due to the overpressure caused by the jet impingement into the hydraulic jump. The minimum skewness coefficient occurs at X = 6 for expansion ratios of 1 and 0.4, and at X = 8 for expansion ratios of 0.8 and 0.6 (near the end of the roller). In the zone downstream 4 < X < 9 , flow detachment due to jet oscillation is probably the cause of negative skewness coefficients [38], also in this range the negative pressure fluctuations are more frequent than positive values [33]. From this point on ( X > 9 ), the flow tends to an equilibrium, being parallel to the bottom of the stilling basin, so the skewness coefficient tends to a constant value close to zero.

4. Conclusions

Some of the most relevant hydrodynamic characteristics of spatial hydraulic jumps in stilling basins with different expansion ratios are presented herein. The results obtained indicate that the increase of turbulence intensity due to the high Froude numbers makes pressure fluctuations larger. It is observed that the dimensionless RMS of the pressure fluctuations also depends on the Froude number. The observed values of the dimensionless RMS of the pressure fluctuations are minimum near the hydraulic jump toe and an abrupt rise of the dimensionless RMS of the pressure fluctuations is observed downstream until the peak value, followed by an exponential decay. The maximum values of the dimensionless RMS of the pressure fluctuations in the main channel (a = 1) and in expansion ratios of 0.8, 0.6, and 0.4 are 0.0354, 0.0417, 0.0375, and 0.0360, respectively. In addition, the experimental data corroborated that instantaneous pressures on the bed are associated with free surface fluctuations. The results indicate that the dimensionless RMS of the pressure fluctuations values at the position of X 2 can reach the maximum value, and from that point to the distance X 6 , the pressure fluctuations decrease exponentially. After that point the values tend to stabilize, reaching the asymptotic range at X 8 . The results also show that the values of extreme pressure fluctuations depend on the distance from the hydraulic jump toe and the maximum values of the positive and negative pressure coefficients occur within the range of 0.609 < X < 3.385 . It is therefore advisable to reinforce the bed of the stilling basin in this region to avoid damages due to dynamic loads. The analysis of the average pressure indicates that pressures near the hydraulic jump toe in the spatial jumps are larger than those of a classical hydraulic jump, since the presence of the gradually expanding walls decreases the sequent depth ratio. The longitudinal distribution of the skewness coefficient allows for determining the position in which the flow detachment starts and where the roller ends. Additionally, it is found that the pressure distributions along the spatial hydraulic jumps do not follow a normal distribution, being the skewness values between –1.3 and 1.7. The results discussed herein contribute to understanding the flow in gradually expanding stilling basins, thus helping designers of hydraulic structures to adopt the most suitable strategies according to the flow conditions.

Author Contributions

Conceptualization, N.H. and A.B.; data curation, N.H. and A.H.D.; formal analysis, N.H. and A.H.D.; funding acquisition, A.H.D.; investigation, N.H.; methodology, N.H. and M.A.; project administration, N.H. and A.H.D.; supervision, A.H.D.; visualization, M.A.; writing—Original draft, N.H.; writing—Review and editing, A.H.D., A.B., and M.A. All authors have read and agreed to the published version of the manuscript.

Funding

This research received no external funding.

Acknowledgments

The authors acknowledge the support provided by the postdoctoral program APOSTD granted to Arnau Bayon by Generalitat Valenciana (Grant APOSTD/2019/100).

Conflicts of Interest

The authors declare no conflict of interest.

Notation

The following symbols are used in this paper:
SymbolDimensionsDefinition of the Symbols
B -Divergence ratio
b 1 L Width of the stilling basin in upstream
b 2 L Width of the stilling basin in downstream
C p -The dimensionless index of pressure fluctuation
C p max -Maximum RMS pressure fluctuations
C + p -Positive pressure coefficients
C + p m a x -Maximum positive pressure fluctuation
C p -Negative pressure coefficients
C p m a x -Maximum Negative pressure fluctuation
F r 1 -Approaching flow Froude number
g L T 2 Gravitational acceleration
N -The number of recorded data
P x L . The average pressure per unit specific weight of water
P x , y , n Δ t L The pressure at any time
P x i , y i , t L The instantaneous pressure value at point (x, y)
P ¯ x , y L The average value of pressure
Δ P + L The maximum pressure deviation from the average pressure
Δ P L The minimum pressure deviation from the average pressure
p L The pressure fluctuation
P 2 L The root mean square (RMS) of pressure
q L 2 T 1 Discharge per unit width
Re 1 -Inflow Reynolds number
S x , y -Skewness coefficient of pressure fluctuations
Δ t T The data recording period
V 1 L T 1 Approaching flow velocity
V 1 2 / 2 g L Dynamic pressure
x L Longitudinal distance from the toe of the hydraulic jump
X -Dimensionless longitudinal distance from the hydraulic jump toe
y 1 L Inflow depth of the hydraulic jump
y 2 L The sequent depth of the hydraulic jump
ρ M L 3 The mass density of water
υ L 2 T 1 Kinematic viscosity of water
σ x , y L The standard deviation of pressure fluctuations
ψ -The average pressure coefficient

References

  1. Wang, H.; Felder, S.; Chanson, H. An experimental study of turbulent two-phase flow in hydraulic jumps and application of a triple decomposition technique. Exp. Fluids 2014, 55, 1–18. [Google Scholar] [CrossRef] [Green Version]
  2. Chanson, H.; Carvalho, R.F. Hydraulic jumps and stilling basins. In Energy Dissipation in Hydraulic Structures; IAHR Monograph; CRC Press; Taylor & Francis Group: Leiden, The Netherlands, 2015; p. 168. [Google Scholar]
  3. Wang, H.; Murzyn, F.; Chanson, H. Total pressure fluctuations and two-phase flow turbulence in hydraulic jumps. Exp. Fluids 2014, 55, 1847. [Google Scholar] [CrossRef] [Green Version]
  4. Elder, R.A. Model-prototype turbulence scaling. In Proceedings of the 9th Convention of IAHR, Dubrovnik, Yugoslavia, 4–7 September 1961; pp. 24–31. [Google Scholar]
  5. Toso, J.W.; Bowers, C.E. Extreme pressures in hydraulic-jump stilling basins. J. Hydraul. Eng. 1988, 114, 829–843. [Google Scholar] [CrossRef]
  6. Bowers, C.E.; Toso, J. Karnafuli project, model studies of spillway damage. J. Hydraul. Eng. 1988, 114, 469–483. [Google Scholar] [CrossRef]
  7. Sanchez Bribiesca, J.; Capella Viscaino, A. Turbulent effects on the lining of stilling basin. In Proceedings of the ICOLD 11th Congress on Large Dams, Madrid, Spain, 11–15 June 1973; Volume 11(Q2), pp. 1575–1592. [Google Scholar]
  8. Schiebe, F.R. The Stochastic Characteristics of Pressure Fluctuations on a Channel Bed Due to the Macroturbulence in a Hydraulic Jump; University of Minnesota: Minneapolis, MN, USA, 1971. [Google Scholar]
  9. Abdul Khader, M.; Elango, K. Turbulent pressure field beneath a hydraulic jump. J. Hydraul. Res. 1974, 12, 469–489. [Google Scholar] [CrossRef]
  10. Akbari, M.; Mittal, M.; Pande, P. Pressure fluctuations on the floor of free and forced hydraulic jumps. In Proceedings of the International Conference on the Hydraulic Modelling of Civil Engineering Structures; Conventry, UK, 22–24 September 1982, BHRA Fluid Engineering: Coventry, UK, 1982; Paper CI; pp. 87–96. [Google Scholar]
  11. Lopardo, R.; Henning, R. Experimental advances on pressure fluctuations beneath hydraulic jumps. In Proceedings of the 21st IAHR Congress, Melbourne, Australia, 13–18 August 1985; pp. 633–638. [Google Scholar]
  12. Lopardo, R.; De Lio, J.; Vernet, G. Physical modelling on cavitation tendency for macroturbulence of hydraulic jump. In Proceedings of the International Conference on the. Hydraulic Modelling of Civil Engineering Structures, Coventry, UK, 22–24 September 1982; pp. 22–24. [Google Scholar]
  13. Spoljaric, A.; Maksimovic, C.; Hajdin, G. Unsteady dynamic force due to pressure fluctuations on the bottom of an energy dissipator—An example. In Proceedings of the International Conference on the Hydraulic Modelling of Civil Engineering Structures, Coventry, UK, 22–24 September 1982. [Google Scholar]
  14. Tullis, B.P.; Rahmeyer, W.J. Spillway Models, Hydraulic Modeling; BHRA: Coventry, UK, September 1982. [Google Scholar]
  15. Vasiliev, O.; Bukreyev, V. Statistical characteristics of pressure fluctuations in the region of hydraulic jump. In Proceedings of the 12th IAHR Congress, Fort-Collins, CO, USA, 11–14 September 1967; Volume 2, pp. 1–8. [Google Scholar]
  16. Fiorotto, V.; Rinaldo, A. Fluctuating uplift and lining design in spillway stilling basins. J. Hydraul. Eng. 1992, 118, 578–596. [Google Scholar] [CrossRef]
  17. Lopardo, R.A.; Romagnoli, M. Pressure and Velocity Fluctuations in Stilling Basins. In Advances in Water Resources and Hydraulic Engineering; Springer: Berlin/Heidelberg, Germany, 2009; pp. 2093–2098. [Google Scholar]
  18. Novakoski, C.K.; Conterato, E.; Marques, M.; Teixeira, E.D.; Lima, G.A.; Mees, A. Macro-turbulent characteristcs of pressures in hydraulic jump formed downstream of a stepped spillway. RBRH 2017, 22, e22. [Google Scholar] [CrossRef] [Green Version]
  19. Long, D.; Rajaratnam, N.; Steffler, P.M.; Smy, P.R. Structure of flow in hydraulic jumps. J. Hydraul. Res. 1991, 29, 207–218. [Google Scholar] [CrossRef]
  20. Wang, H.; Murzyn, F.; Chanson, H. Interaction between free-surface, two-phase flow and total pressure in hydraulic jump. Exp. Therm. Fluid Sci. 2015, 64, 30–41. [Google Scholar] [CrossRef] [Green Version]
  21. Nóbrega, J.; Schulz, H.; Marques, M. Relation between free surface profiles and pressure profiles with respective fluctuations in hydraulic jumps. In Proceedings of the 4th IAHR Europe Congress, Liege, Belgium, 27–29 July 2016; pp. 629–636. [Google Scholar]
  22. Onitsuka, K.; Akiyama, J.; Shige-Eda, M.; Ozeki, H.; Gotoh, S.; Shiraishi, T. Relationship between Pressure Fluctuations on the Bed Wall and Free Surface Fluctuations in Weak Hydraulic Jump. In New Trends in Fluid Mechanics Research; Springer: Berlin/Heidelberg, Germany, 2007; pp. 300–303. [Google Scholar]
  23. Lopardo, R.A. Extreme velocity fluctuations below free hydraulic jumps. J. Eng. 2013. [Google Scholar] [CrossRef] [Green Version]
  24. Bellin, A.; Fiorotto, V. Direct dynamic force measurement on slabs in spillway stilling basins. J. Hydraul. Eng. 1995, 121, 686–693. [Google Scholar] [CrossRef]
  25. Esfahani, M.J.N.; Bajestan, M.S. Dynamic Force Measurement of Roughened Bed B-jump at an Abrupt Drop. Arch. Des. Sci. 2012, 65, 47–54. [Google Scholar]
  26. Marques, M.G.; Drapeau, J.; Verrette, J.-L. Pressure fluctuations in a hydraulic jump. In Proceedings of the XVII Hydraulics Congress, Latin American, Guayaquil, Equador, 21–25 October 1997. (In Portuguese). [Google Scholar]
  27. Teixeira, E. Estimation of Pressure Values near the Bottom of Hydraulic-Jump Stilling Basins. Master‘s Thesis, Water Resources, and Environmental Sanitation, Institute of Hydraulic Research, Federal University of Rio Grande do Sul, Porto Alegre, Portugal, 2003. (In Portuguese). [Google Scholar]
  28. Bremen, R.; Hager, W.H. T-jump in abruptly expanding channel. J. Hydraul. Res. 1993, 31, 61–78. [Google Scholar] [CrossRef]
  29. Farhoudi, J.; Sadat-Helbar, S.; Aziz, N.I. Pressure fluctuation around chute blocks of SAF stilling basins. J. Agric. Sci. Technol. 2010, 12, 203–212. [Google Scholar]
  30. Yalin, M.S. Theory of Hydraulic Models; Macmillan: London, UK, 1971. [Google Scholar]
  31. Rajaratnam, N. Hydraulic jumps on rough beds. Trans. Eng. Inst. Can. 1968, 11, 1–8. [Google Scholar]
  32. Hager, W.H.; Bremen, R. Classical hydraulic jump: Sequent depths. J. Hydraul. Res. 1989, 27, 565–585. [Google Scholar] [CrossRef]
  33. Fiorotto, V.; Rinaldo, A. Turbulent pressure fluctuations under hydraulic jumps. J. Hydraul. Res. 1992, 30, 499–520. [Google Scholar] [CrossRef]
  34. Yan, Z.-M.; Zhou, C.-T.; Lu, S.-Q. Pressure fluctuations beneath spatial hydraulic jumps. Project supported by the National Natural Science Foundation of China (Grant No: 30490235). J. Hydrodyn. Ser. B 2006, 18, 723–726. [Google Scholar] [CrossRef]
  35. Hassanpour, N.; Hosseinzadeh Dalir, A.; Farsadizadeh, D.; Gualtieri, C. An Experimental Study of Hydraulic Jump in a Gradually Expanding Rectangular Stilling Basin with Roughened Bed. Water 2017, 9, 945. [Google Scholar] [CrossRef] [Green Version]
  36. Macián-Pérez, J.F.; Bayón, A.; García-Bartual, R.; Amparo López-Jiménez, P.; Vallés-Morán, F.J. Characterization of Structural Properties in High Reynolds Hydraulic Jump Based on CFD and Physical Modeling Approaches. J. Hydraul. Eng. 2020, 146, 04020079. [Google Scholar] [CrossRef]
  37. Bono, R.; Arnau, J.; Alarcón, R.; Blanca, M.J. Bias, precision, and accuracy of skewness and kurtosis estimators for frequently used continuous distributions. Symmetry 2020, 12, 19. [Google Scholar] [CrossRef] [Green Version]
  38. Lopardo, R.; Henning, R. Effect of inlet conditions over the instant pressure field in hydraulic jumps. In Proceedings of the Hydraulics Congress, Sao Paulo, Brazil; 1986; pp. 116–127. (In Spanish). [Google Scholar]
Figure 1. Plan and side view of the experimental setup with instruments.
Water 13 00060 g001
Figure 2. Sketch of gradual expanding geometry with an expansion ratio of (b) = 0.8, (c) = 0.6, (d) = 0.4, and (a) = 1 (flume without any expansion).
Water 13 00060 g002
Figure 3. Pressure transducers connected via a 6-channel digital board.
Water 13 00060 g003
Figure 4. Dimensionless RMS of the pressure fluctuation versus position in the hydraulic jump for different expansion ratios and Froude numbers.
Water 13 00060 g004
Figure 5. Positive and negative pressure fluctuation versus position in the hydraulic jump for different expansion ratios and different range of the Froude numbers.
Water 13 00060 g005
Figure 6. Average pressure distribution versus relative distance from the toe of the hydraulic jump according to expansion ratio and Froude number.
Water 13 00060 g006
Figure 7. Distribution of the skewness coefficients versus relative distance from the toe of the hydraulic jump according to expansion ratio and Froude number.
Water 13 00060 g007
Table 1. Main characteristics of the experiments carried out in the present study: b1 and b2, upstream and downstream widths of the stilling basin; q, discharge per unit width; Fr1, supercritical flow Froude number; Re1, supercritical flow Reynolds number; y1, inflow depth; V1, average velocity of upstream; and y2, sequent depth of flow.
Experimentsb1 (m)b2 (m)q (m2/s)Fr1Re1 × 106y1 (m)V1 (m/s)
10.50.50.0700–0.11697.5–12.50.065–0.1090.0213.368–5.622
20.40.50.0619–0.10716.4–11.20.056–0.0970.0212.946–5.098
30.30.50.0601–0.10766.4–11.30.053–0.0940.0212.864–5.123
40.20.50.0612–0.10906.4–11.40.050–0.0900.0212.916–5.192
Table 2. Maximum RMS pressure fluctuations measured as a function of Froude number.
Expansion Ratio (B) Froude Number (Fr1) C p max x / y 2 y 1 x / y 1
17.50.03491.1677.667
8.30.03301.61412.143
9.30.03541.96116.619
10.40.02852.56325.571
11.30.02412.08523.333
12.50.02151.17114.381
0.840.03011.2787.667
7.40.03701.71512.143
8.40.04051.76914.381
9.30.04051.61214.381
10.30.04171.62116.619
11.20.03361.32314.381
0.66.40.03631.3967.667
7.30.03612.57916.619
8.30.03752.19516.619
9.40.03811.62114.381
10.40.03471.73916.619
11.30.03581.62916.619
0.46.40.03552.35512.143
7.40.03602.76316.619
8.40.02533.21723.333
9.40.02273.14625.571
10.40.02052.90325.571
11.40.01942.68125.571
Table 3. Variation of maximum positive and negative pressure fluctuation.
Expansion Ratio (B)Froude Number (Fr1) C + p m a x x / y 1 x / y 2 y 1 C p m a x x / y 1 x / y 2 y 1
C + p m a x C + p m a x C p m a x C p m a x
17.50.1665.4290.8260.15312.1431.849
8.30.1287.6671.0190.14016.6192.209
9.30.1237.6670.9040.10916.6191.961
10.40.14821.0952.1150.10925.5712.563
11.30.12314.3811.2850.10330.0432.685
12.50.14414.3811.1710.07625.5712.081
0.86.40.1575.4290.9050.11312.1432.024
7.40.1605.4290.7670.1187.6671.083
8.40.16214.3811.7690.12916.6192.045
9.30.1675.4290.6090.12716.6191.863
10.30.17814.3811.4030.13621.0952.058
11.20.1297.6670.7050.0937.6670.705
0.66.40.1217.6671.3960.12016.6193.027
7.30.13012.1431.8850.14912.1431.885
8.30.1387.6671.0130.14816.6192.195
9.40.12014.3811.6210.12516.6191.873
10.40.1467.6670.8020.10416.6191.739
11.30.14112.1431.1900.11325.5712.506
0.46.40.1255.4291.0530.11412.1432.355
7.40.11914.3812.3910.10921.0953.508
8.40.12814.3811.9830.11223.3333.217
9.40.09016.6192.0450.09325.5713.146
10.40.08125.5712.9030.08025.5712.903
11.40.10032.2863.3850.09023.3332.446
Publisher’s Note: MDPI stays neutral with regard to jurisdictional claims in published maps and institutional affiliations.

