Article

Effective Desalination of Acid Mine Drainage Using an Advanced Oxidation Process: Sodium Ferrate (VI) Salt

by
Alexis Munyengabe
1,
Caliphs Zvinowanda
1,*,
James Ramontja
1 and
John Ngoni Zvimba
2
1
Department of Chemical Sciences, Faculty of Science, Doornfontein Campus, University of Johannesburg, Corner Nind and Beit Streets, P.O. Box 17011, Johannesburg 2028, South Africa
2
Water Use and Waste Management, Water Research Commission, Bloukrans Building, Lynnwood Bridge Office Park, 4 Daventry Street, Lynnwood Manor, Pretoria 0081, South Africa
*
Author to whom correspondence should be addressed.
Submission received: 25 August 2021 / Accepted: 18 September 2021 / Published: 23 September 2021

Abstract

:
The screening and treatment of acid mine drainage (AMD) using Na2FeO4 was explored. Elemental composition was performed, using an Inductively Coupled Plasma-Optical Emission Spectroscopy (ICP-OES) for the raw and treated AMD. The AMD samples were collected from three different sampling sites:(Raw Tailing Water 1 (RTW1), Raw Tailing Water 2 (RTW2) and Raw Tailing Water 3 (RTW3)) in Pretoria, South Africa, with acidic pH ranging between 2.50 and 3.13. Total dissolved solids and the electrical conductivity of AMD samples ranged between 960 and 1000 mg L−1, 226 and 263 µS. cm−1, respectively. The final pH of treated water samples increased up to ≥9.5 after treatment with sodium ferrate (VI) (Na2FeO4). Liquid Na2FeO4 was quantitatively produced through a wet oxidation method and was fully characterized, using Fourier Transform Infra-Red (FTIR), X-ray Diffraction spectroscopy (XRD) and UV-Vis instruments. Na2FeO4 showed dual functions by removing metals and raising the pH of the treated water. Concentrations of most trace elements did not comply with WHO and DWAF guideline standards in raw AMD while after treatment with Na2FeO4, the concentrations were below guidelines for domestic and irrigation purposes.

1. Introduction

Acid mine drainage (AMD) is normally generated when mining wastewaters come in contact with oxygenated water. This AMD severely impacts the ecosystem through the leaching process of heavy metals, free acids and sulphate into ground and surface water [1]. AMD also continues long after mining activities have stopped, and the consequences can last indefinitely followed by high clean-up costs. In some situations, it is not possible to perform its remediation with recent technologies. However, abandoned mine drainage seems to be a global environmental issue [2,3]. The most known effective methods for AMD treatment are passive and active. The passive method employs unprocessed materials, such as compost and limestone, under gravity flow conditions in engineered basins including wetlands, limestone beds, ponds, and bioreactors. The active method employs dosage, using chemicals, such as alkali and alkaline earth metal hydroxides and oxidants (salts), and ongoing energy input for mixing and aeration in conventional wastewater treatment unit process [4]. A hybrid system also exists that combines both passive and active approaches within the same treatment unit to remove trace and heavy metals. However, a quick abiotic Mn removal requires pH > 9, which is not achievable in a passive treatment and is relatively expensive in an active treatment [4,5]. Therefore, the abiotic oxidation of reduced Mn is a common concern in AMD treatment, both from active and passive perspectives. A spontaneous removal of Fe and Al through the oxidation of Fe and precipitation of metal hydroxides is a relatively straightforward process. Ferrate (VI) ion (FeO42−) is a coagulant and oxidant of increasing interest in environmental studies [4,6], that can have advantages in AMD treatment. For instance, FeO42- presents a high oxidation potential (+2.20 V) in an acidic medium [4]. It quickly oxidizes Mn and implies the in-situ generation of ferric hydroxides that may support the coagulation process [4,7,8]. The FeO42− ion was also indicated to not directly generate halogenated by-products in common natural waterways [4,9,10]. There are three known procedures for preparing different ferrate salts. Firstly, ferrate (VI) ion can be synthesized through an electrochemical technique using an iron-based anode in a strongly alkaline medium [11,12,13]. Secondly, ferrate (VI) salt can be synthesized through a wet oxidation method, which integrates the oxidation of iron sources, such as ferric chloride or ferrous sulphate by hypochlorite (OCl) ions in an alkaline solution [14,15]. Lastly, it can be produced using a dry oxidation or thermal method [16] or solid-phase reaction method at room temperature [17]. To the best of our knowledge, there has not been a direct examination of the effectiveness of FeO42- ions for the treatment of AMD. Most prior and preliminary works have focused on ferrate applications in wastewater [18,19,20,21], drinking water [4,22,23], oxidation of mine tailing and preventing acid drainage from uranium mill tailings [24], preliminary studies of ferrate treatment of metals in AMD [25], and TOC removal of surface water using ferrate (VI) [26]. However, this study aimed at conducting a preliminary treatment of synthetic AMD, using ferrate (VI) salt prepared through a wet oxidation method, assessment of metal concentrations in real AMD samples and their removal using sodium ferrate (VI) (Na2FeO4) without using energy in a single mixing and dosing unit.

2. Methodology

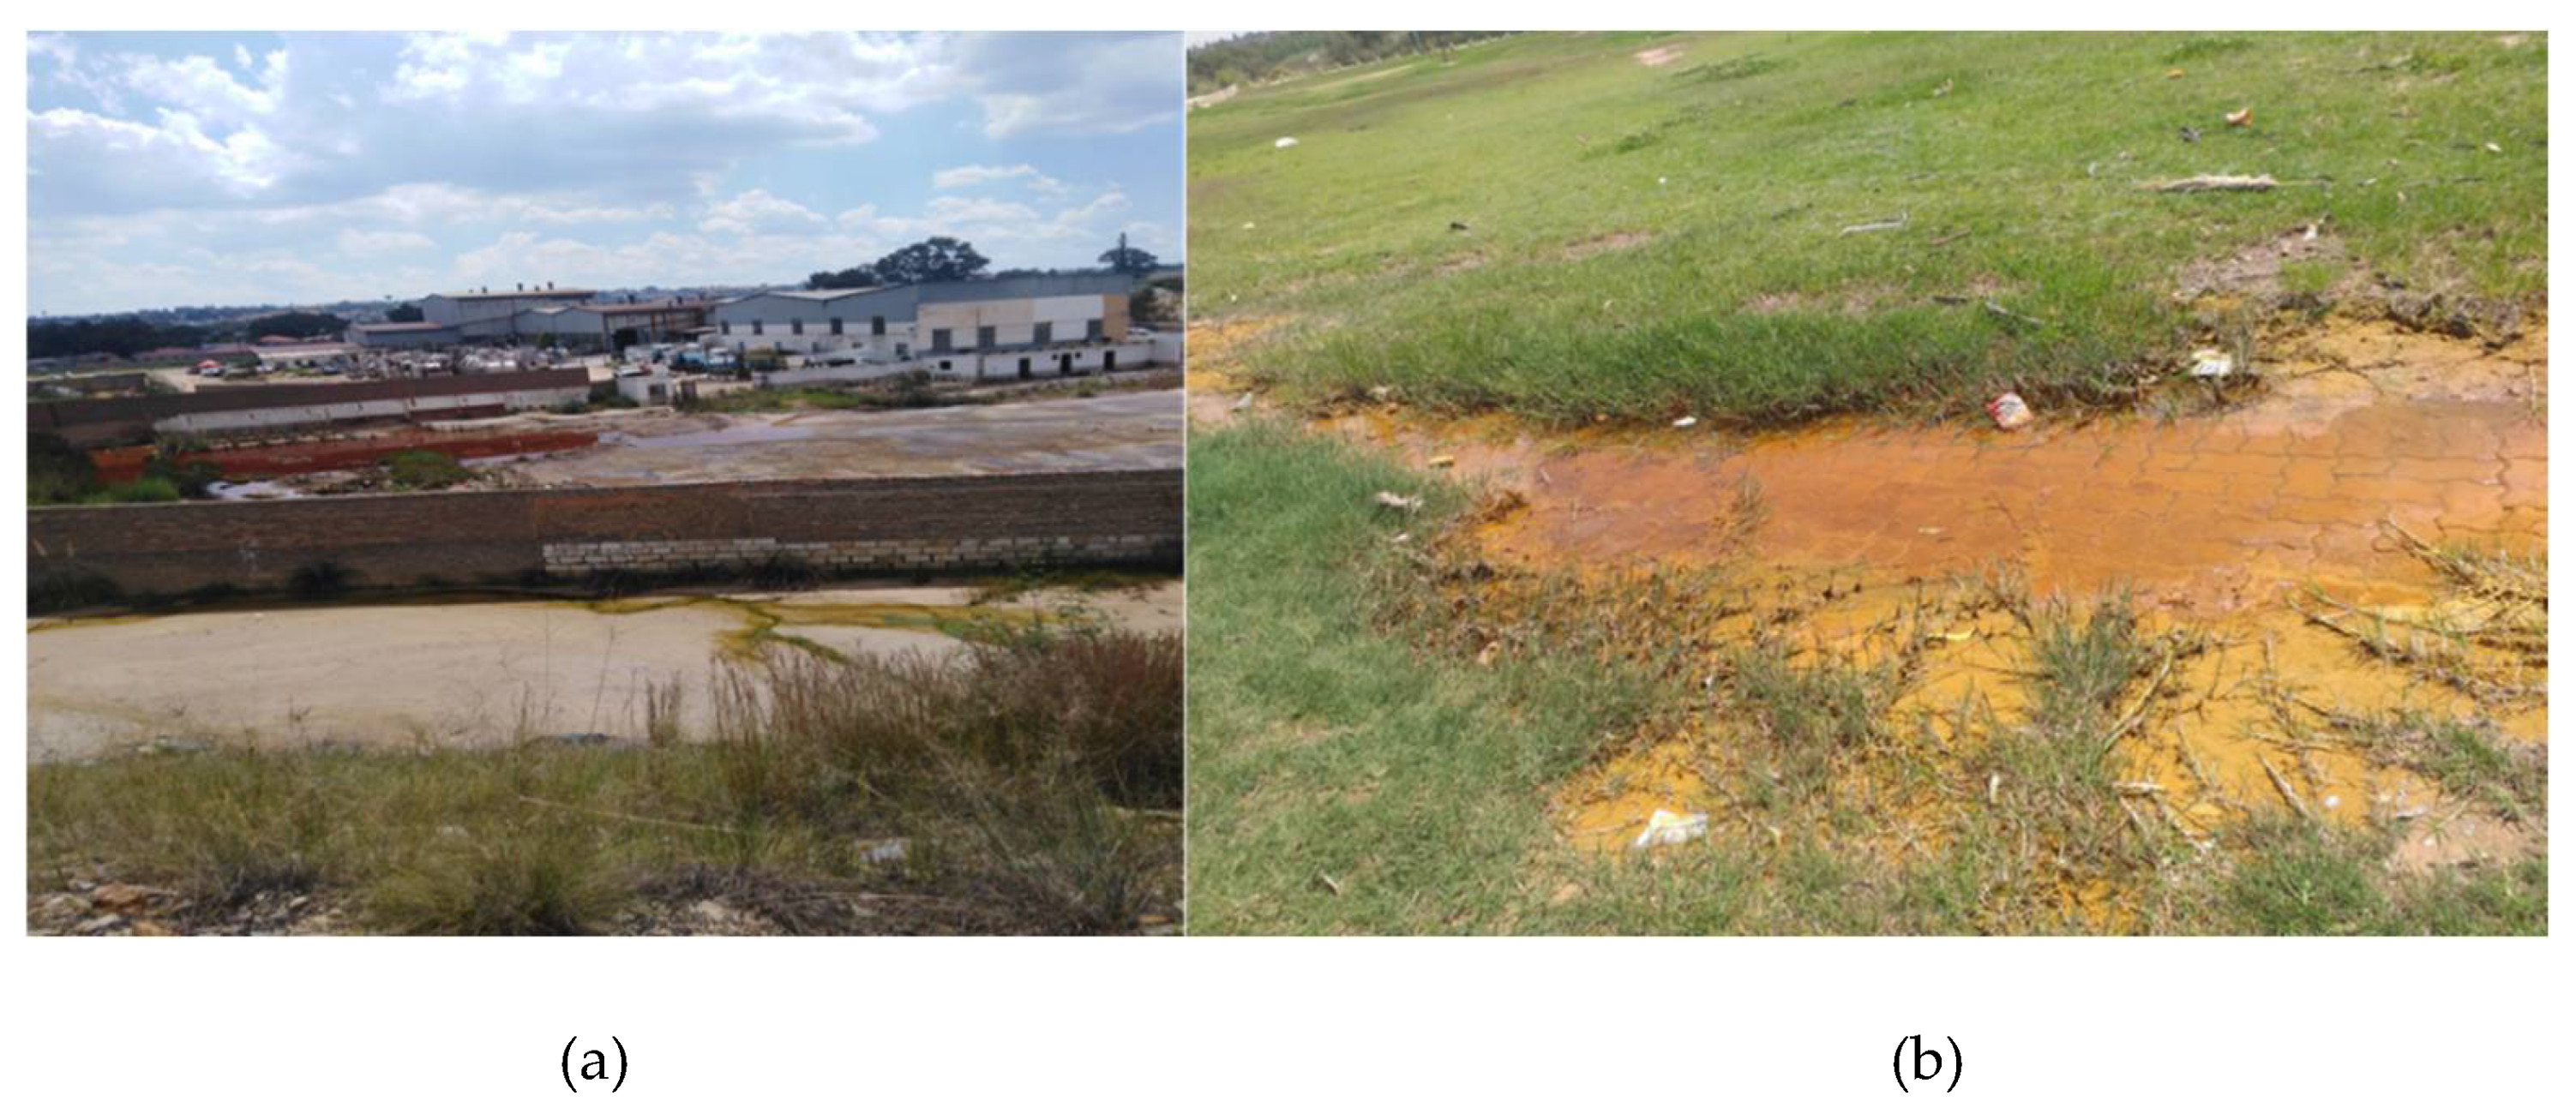
2.1. Water Sampling Process and Guidelines

Water samples with different pH values were taken from three sampling locations (RTW1, RTW2 and RTW3), where RTW1: Raw Tailing Water sampling site 1, RTW2: Raw Tailing Water sampling site 2 and RTW3: Raw Tailing Water sampling site 3 located in Princess Goldmine Dump, Johannesburg. Princess Goldmine Dump is located in the southwest and west of Johannesburg, Gauteng Province in South Africa. The gold is contained within the conglomerates of the Witwatersrand Supergroup and the gold-bearing reefs also contain minerals such as pyrite, traces of silver, and other metals [27]. Clear pictures showing anthropogenic activities occurring in these sampling site areas are indicated in Figure 1.
At least three water samples were collected from the above-mentioned sampling sites and kept in 500 mL bottles. After the sampling process, some physical parameters of water, such as temperature, TDS, EC, and pH, were immediately recorded. The samples were then transferred to the laboratory in a cooler box and kept in the refrigerator at 4 °C after the addition of 2 mL of concentrated HNO3. The pH values recorded from three sampling sites varied between 2.50 and 3.13 (Table 1) and were below the South African National Standards (SANS) 241-2015 and pH guidelines for drinking water compiled by World Health Organization (WHO). The bioavailability and speciation of metals in environmental matrices highly depend on physical parameters, especially the pH of water. The pH values of less than 4 generally increase the toxicity of most metals through the dissolution process. Electrical conductivity values of water samples exceeded SANS 241-2015 and were lower than the WHO guidelines. TDS of water collected from RTW2 fitted into SANS241-2015 guidelines; there are no WHO guidelines for TDS for drinking water as shown in Table 1.
The discussion of the results was performed concerning the current South African National Standards (SANS) [28] and WHO guidelines of drinking water [29] presented in Table 2.

2.2. Chemicals and Reagents

Liquid chemicals (AR grades)—sodium hypochlorite (15% m/v as Cl2), NaOH (47% m/m) and ferric chloride (43% m/m)—were purchased from NCP Chlorchem Pvt. Ltd., Johannesburg, South Africa and used without further purification. Ferrate salt standard, potassium ferrate (K2FeO4) (containing FeO42- ions) was ordered from American Elements Company, Los Angeles, United States of America.

2.3. Preparation of Liquid Sodium Ferrate (VI)

Liquid Na2FeO4 was produced, using the wet oxidation method developed by Ockerman and Schreyer [14] and Thompson et al. [30] with some modifications. This method was selected because dry oxidation and electrochemical methods [31,32] presented some drawbacks in the previous studies, due to complex reaction steps and safety concerns involved [33,34]. Hence, modifications were performed to check if Na2FeO4 could be generated using only liquid reagents to enhance the yield and stability of the product. Some optimum conditions developed by Sun et al. [3] for preparing the liquid Na2FeO4 were also revised and considered in this study. The mixing proportions of the reagents were 10:5:1 (v:v:v) for NaOCl(aq), NaOH(aq) and FeCl3(aq), respectively. An amount of 60 mL of NaOCl(aq) and 30 mL of NaOH(aq) was mixed into a 100 mL beaker placed in the ice bath, and 6 mL of liquid FeCl3(aq) was slowly added into the mixture with mild stirring. The ice bath was meant to quench the excess heat generated from an exothermic reaction, although the product is not stable at high temperatures. The mixture was gently heated at 25 °C for 10 min to speed up the reaction of the production of Na2FeO4. The low temperature was applied to avoid degradation of both hypochlorite ions and ferrate ions, which were produced. The basic chemical reaction for the preparation of Na2FeO4 [35,36] is shown in Equation (1):
2 FeCl3(aq) + 3 NaOCl(aq) + 10 NaOH(aq) → 2 Na2FeO4(aq) + 9 NaCl(aq) + 5 H2O(l)
The product obtained exhibited a reddish-purple color, which is very similar to the one obtained in the literature [3]. The solution was centrifuged to remove impurities, and the supernatant liquid was collected for further analysis. The liquid sodium ferrate (VI) solution produced was characterized and quantified, using UV-Visible (UV-Vis) spectroscopy. By using the freeze-drying process, the liquid sodium ferrate was frozen at −70 °C and dried overnight; a solid Na2FeO4 was then obtained and characterized, using X-ray diffraction (XRD) and Fourier transform-infrared (FT-IR) spectroscopy. More details on its storage and stability might be found in Munyengabe and Zvinowanda [37].

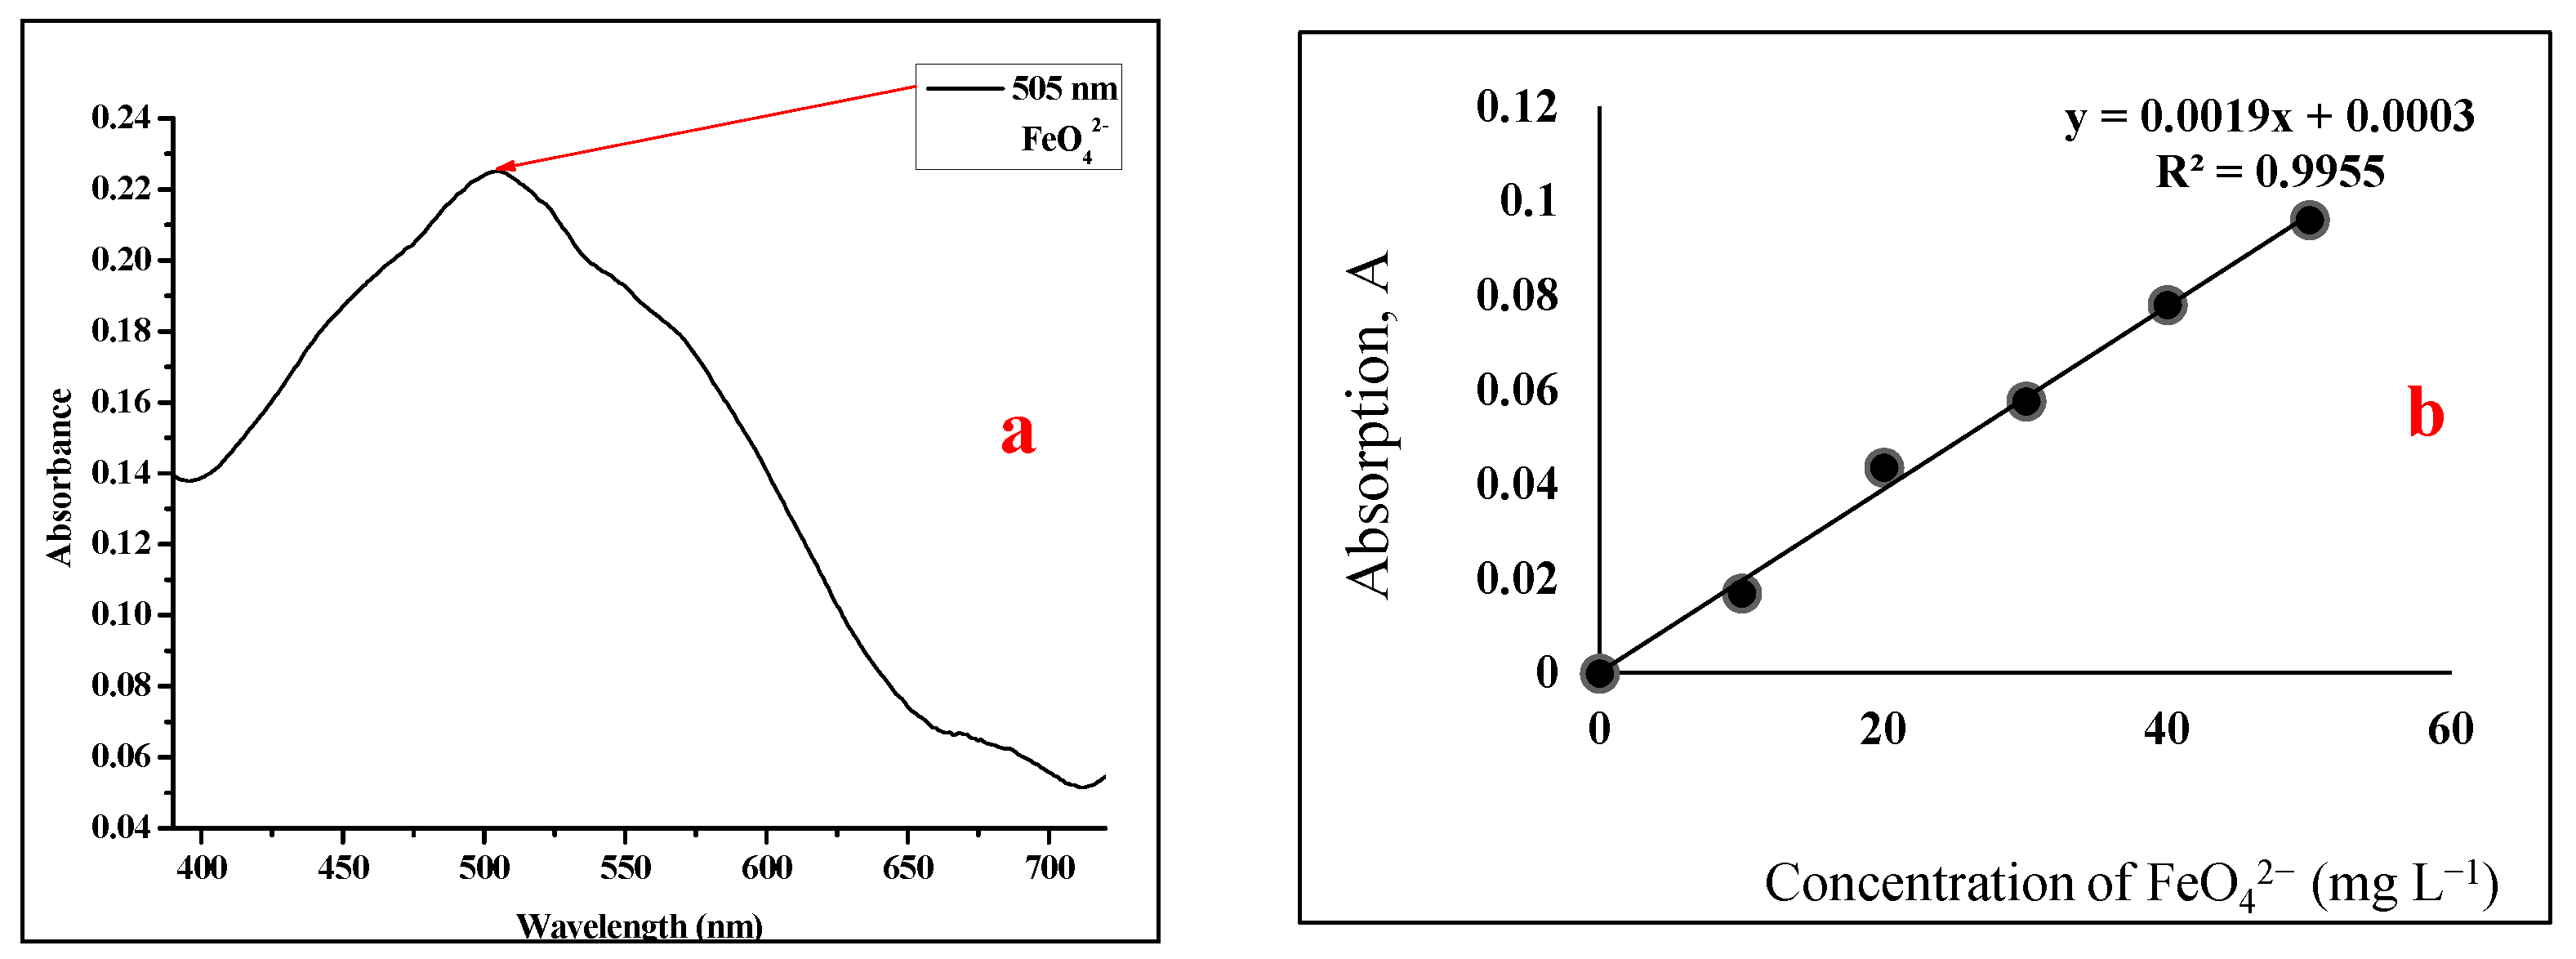
2.4. Characterization and Quantification of Sodium Ferrate (VI) Using UV-Vis Spectroscopy

A stock solution of 100 mg L−1 (as FeO42−) was prepared by dissolving 16.52 mg of K2FeO4 as a standard in 100 mL of ultrapure water. Working solutions were prepared (from 0 to 50 mg L−1), and their absorbances were measured at λmax = 505 nm [38] on UV-Vis spectroscopy Cary 60 (Agilent Technologies) as shown in Figure 2. The correlation coefficient was R2 = 0.9955.
Sodium ferrate (VI) with the chemical formula of Na2FeO4 was successfully produced and quantified with the concentration of 12.40 g L−1 or 0.10 M (as FeO42−) (reading on UV-Vis: 0.0124 g L−1 multiplied by a dilution factor: 1000). The concentration was determined to evaluate the effectiveness of the method, and it was found to be higher than some concentrations obtained in the literature using other methods [36]. This confirmed that sodium hypochlorite has oxidized all iron sources (liquid ferric chloride). For instance, Cui et al. [39] used the microwave method (dry oxidation method) to prepare sodium ferrate with solid Fe3O4(s) as an iron source in the reaction, and the calculated concentration was 1.41 g L−1. Batarseh, Reinhart and Daly [36] also synthesized sodium ferrate using the wet oxidation method, and the resulting concentration was 2.00 g L−1 as Fe. Currently, Laksono and Kim [40] synthesized sodium ferrate, using the wet oxidation method to remove 2-bromophenol from environmental matrices. Ferric chloride and sodium hydroxide were in solid states, and the resulting concentration of ferrate was 42.00 g L−1 as Fe. However, quantifying the sodium ferrate in this study was the main purpose of this project, which is treating acid mine drainage using sodium ferrate (VI) with a known concentration and checking the effectiveness of the method.

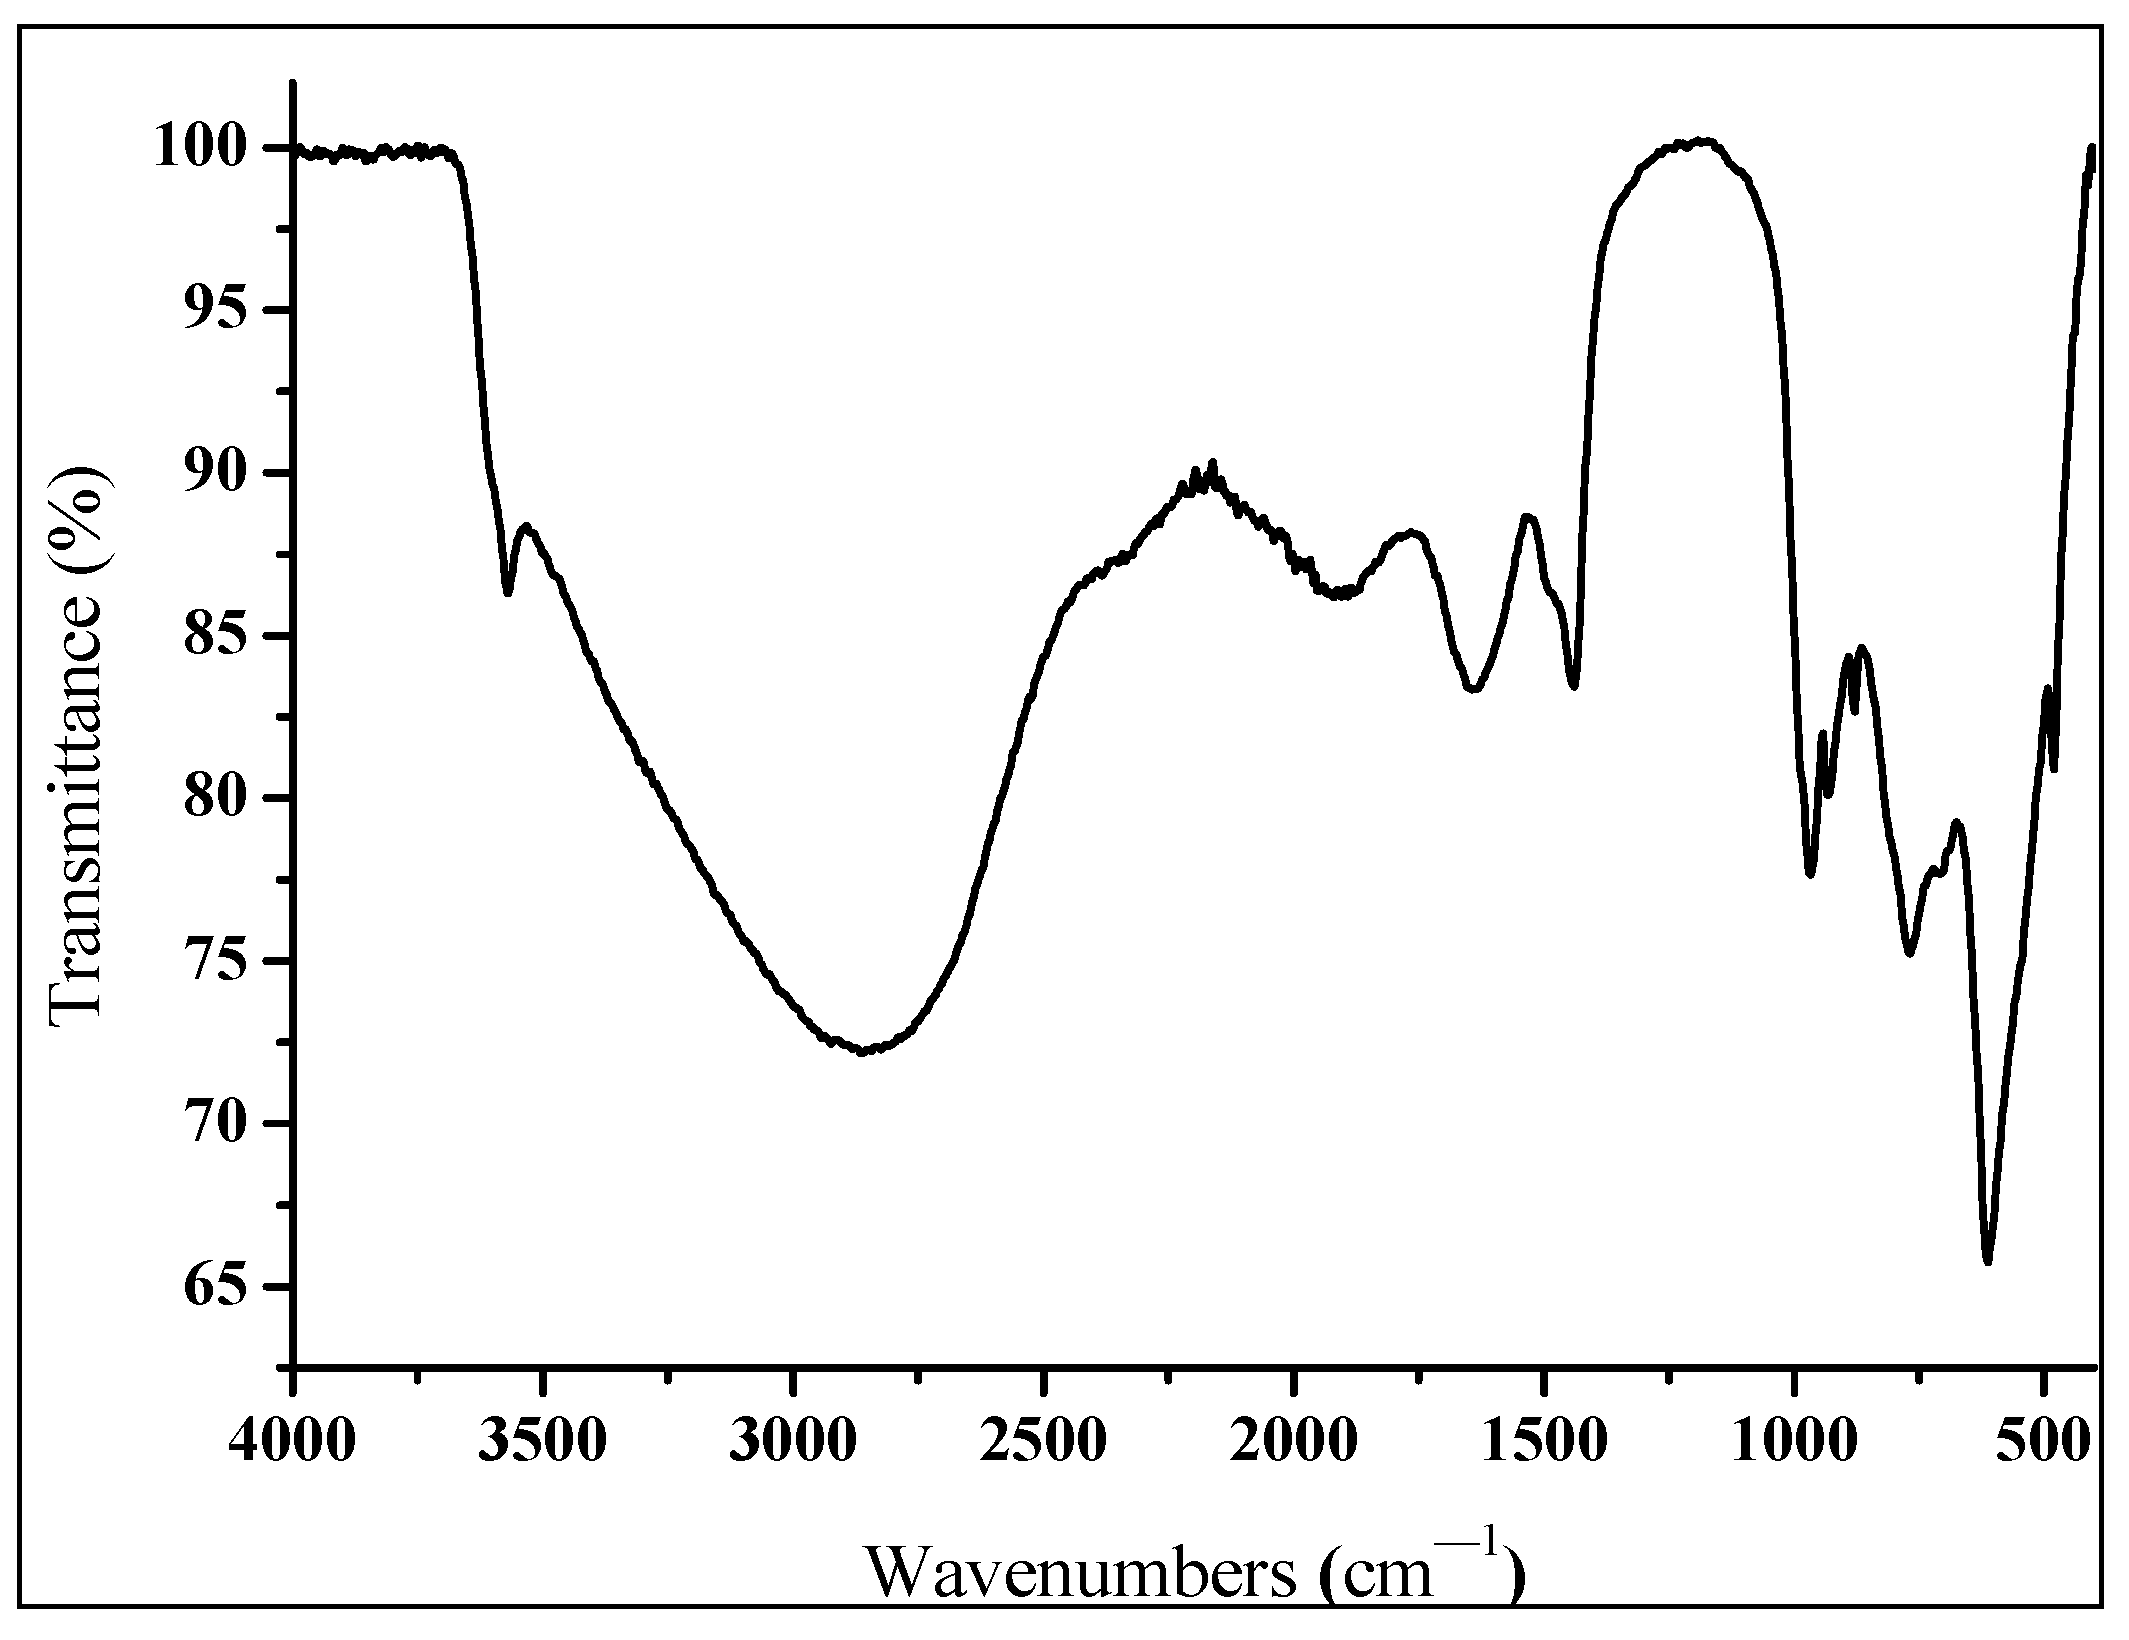
2.4.1. Characterization of Sodium Ferrate (VI) Using FT-IR

To characterize the sodium ferrate (VI) produced using the FT-IR spectroscopy technique, a portion of the liquid sodium ferrate (VI) synthesized was frozen under −70 °C and dried, using a vacuum dryer overnight. The FT-IR spectrum of NaFeO4 showing various IR absorption peaks (functional groups) is shown in Figure 3. For similarity reasons, the literature was checked, and the results showed that the chemical shifts of peaks can depend on many factors or parameters, such as drying temperatures, reaction time, composition, concentration, and states of the reactants. This means that if ferric/ferrous sulphate or nitrate compounds are used as an iron source, these sulphate and nitrate ions coexist with the ferrate and cause interference, which impacts on chemical shifts of the functional groups. However, the peaks of sodium ferrate obtained between 600 and 900 cm−1 in this study were very similar to the peaks found by El Maghraoui et al. [31], Lei et al. [17] and El Maghraoui et al. [32].
The stretching vibration characteristic peaks of the Fe–O bond in ferrate were obtained at around 700 cm−1, 769 cm−1, 879 cm−1 and confirmed the presence of the Fe-O bond in the crystals, which is sodium ferrate (VI) salt. The small difference in chemical shifts of functional groups of the product of this study compared with the literature could be caused by the conditions of production and crystallization. Moreover, the peaks observed in 1908, 1632 and 1443 cm−1 should be assigned to the characteristic peaks of the C-O bond stretching vibration, which could be caused by the CO2 in the air [41]. The peaks obtained between 2400 and 4000 cm−1 are ascribed to the H-O bond from water [16,42]. Additionally, the visibility and the sharpness of the peaks also can confirm the high purity of the product.

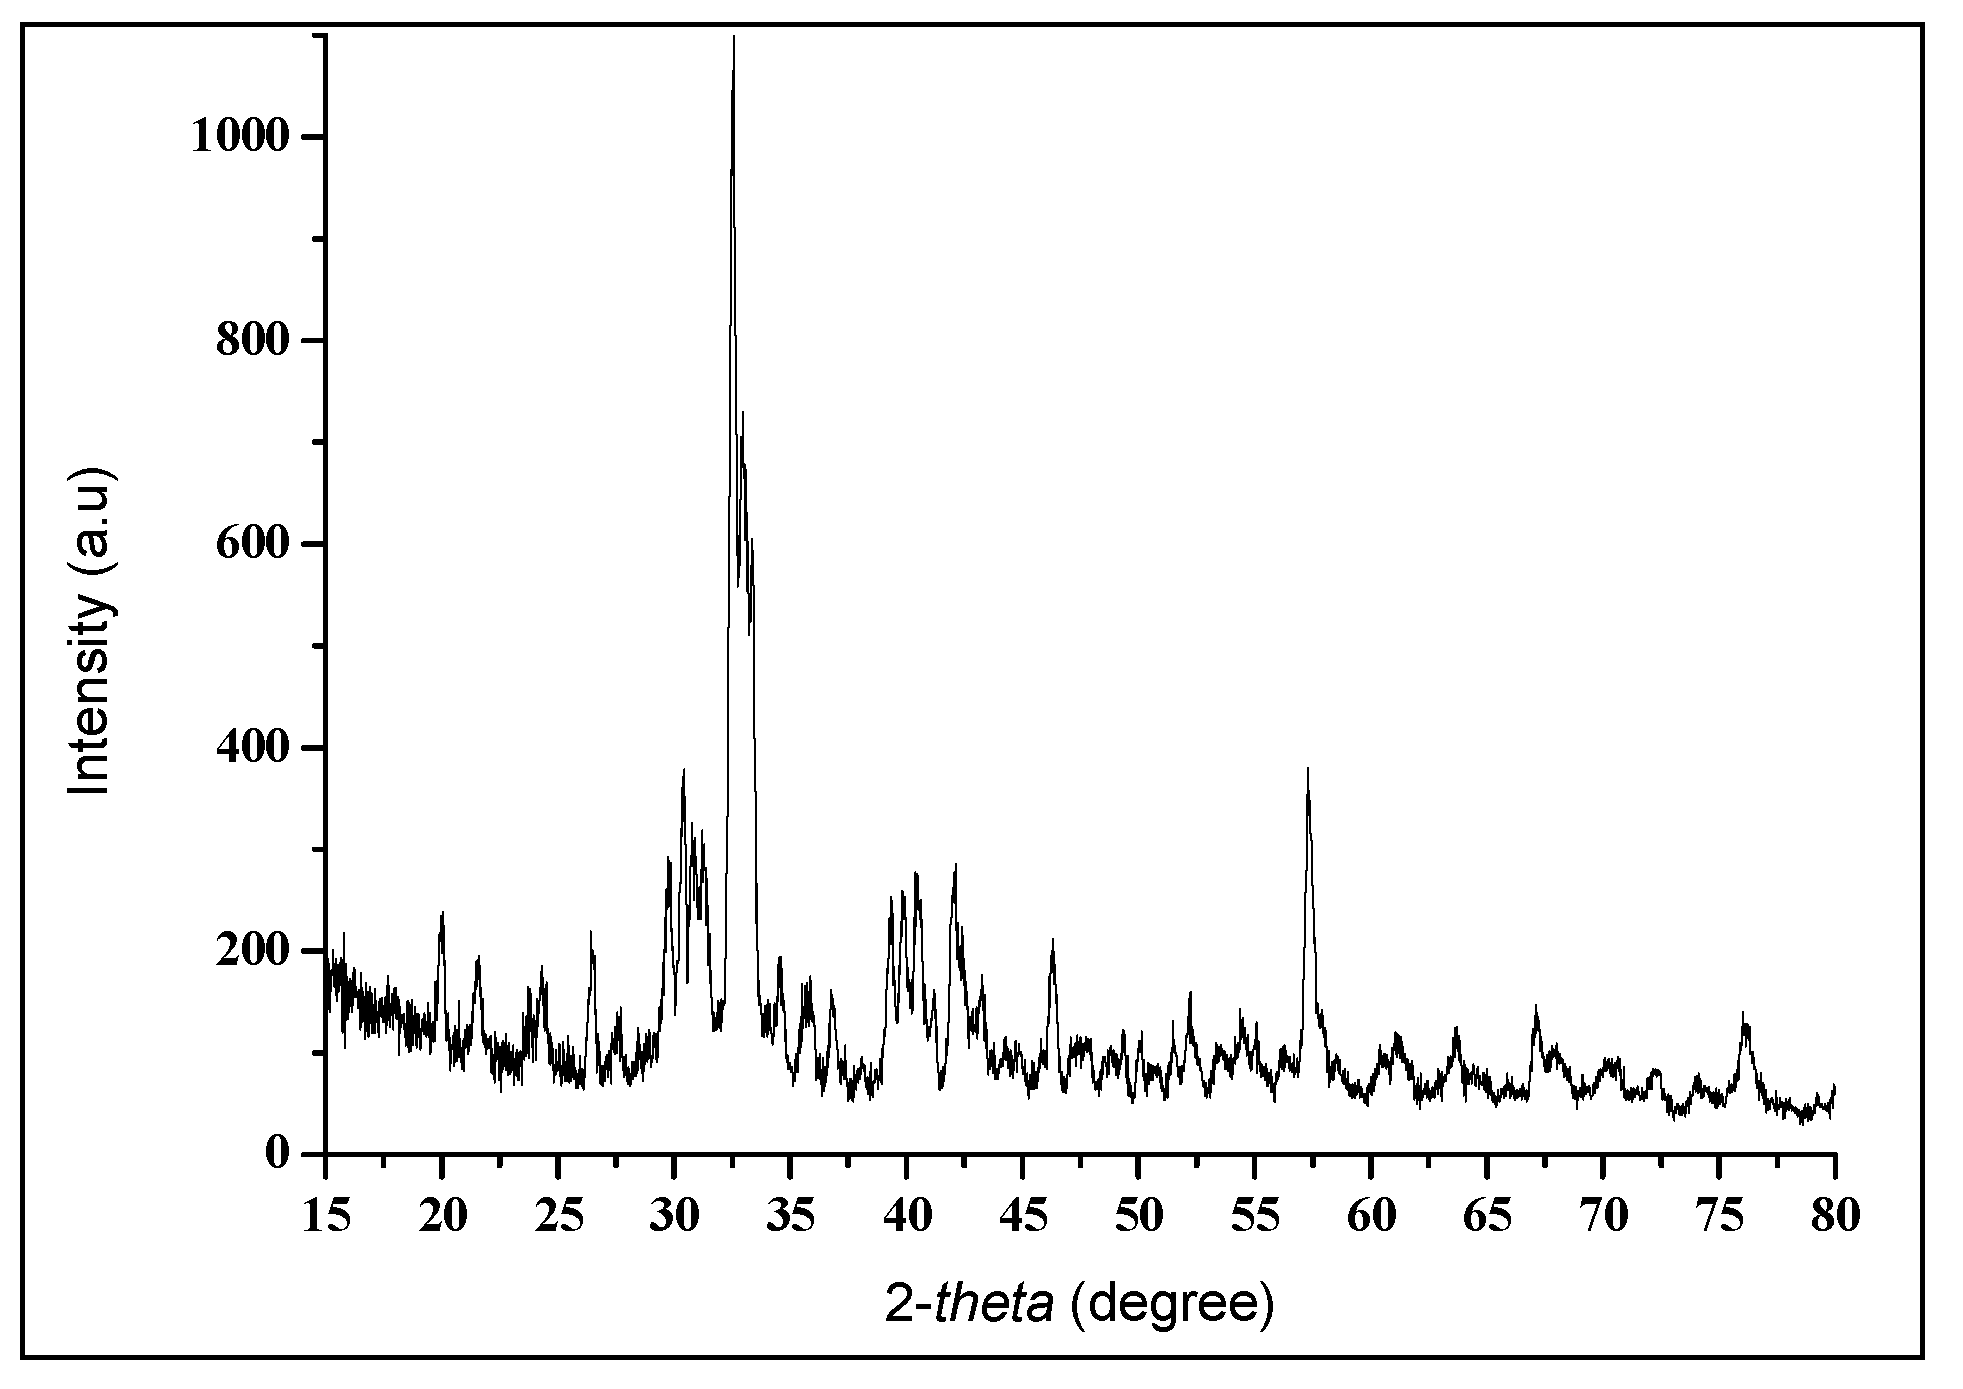
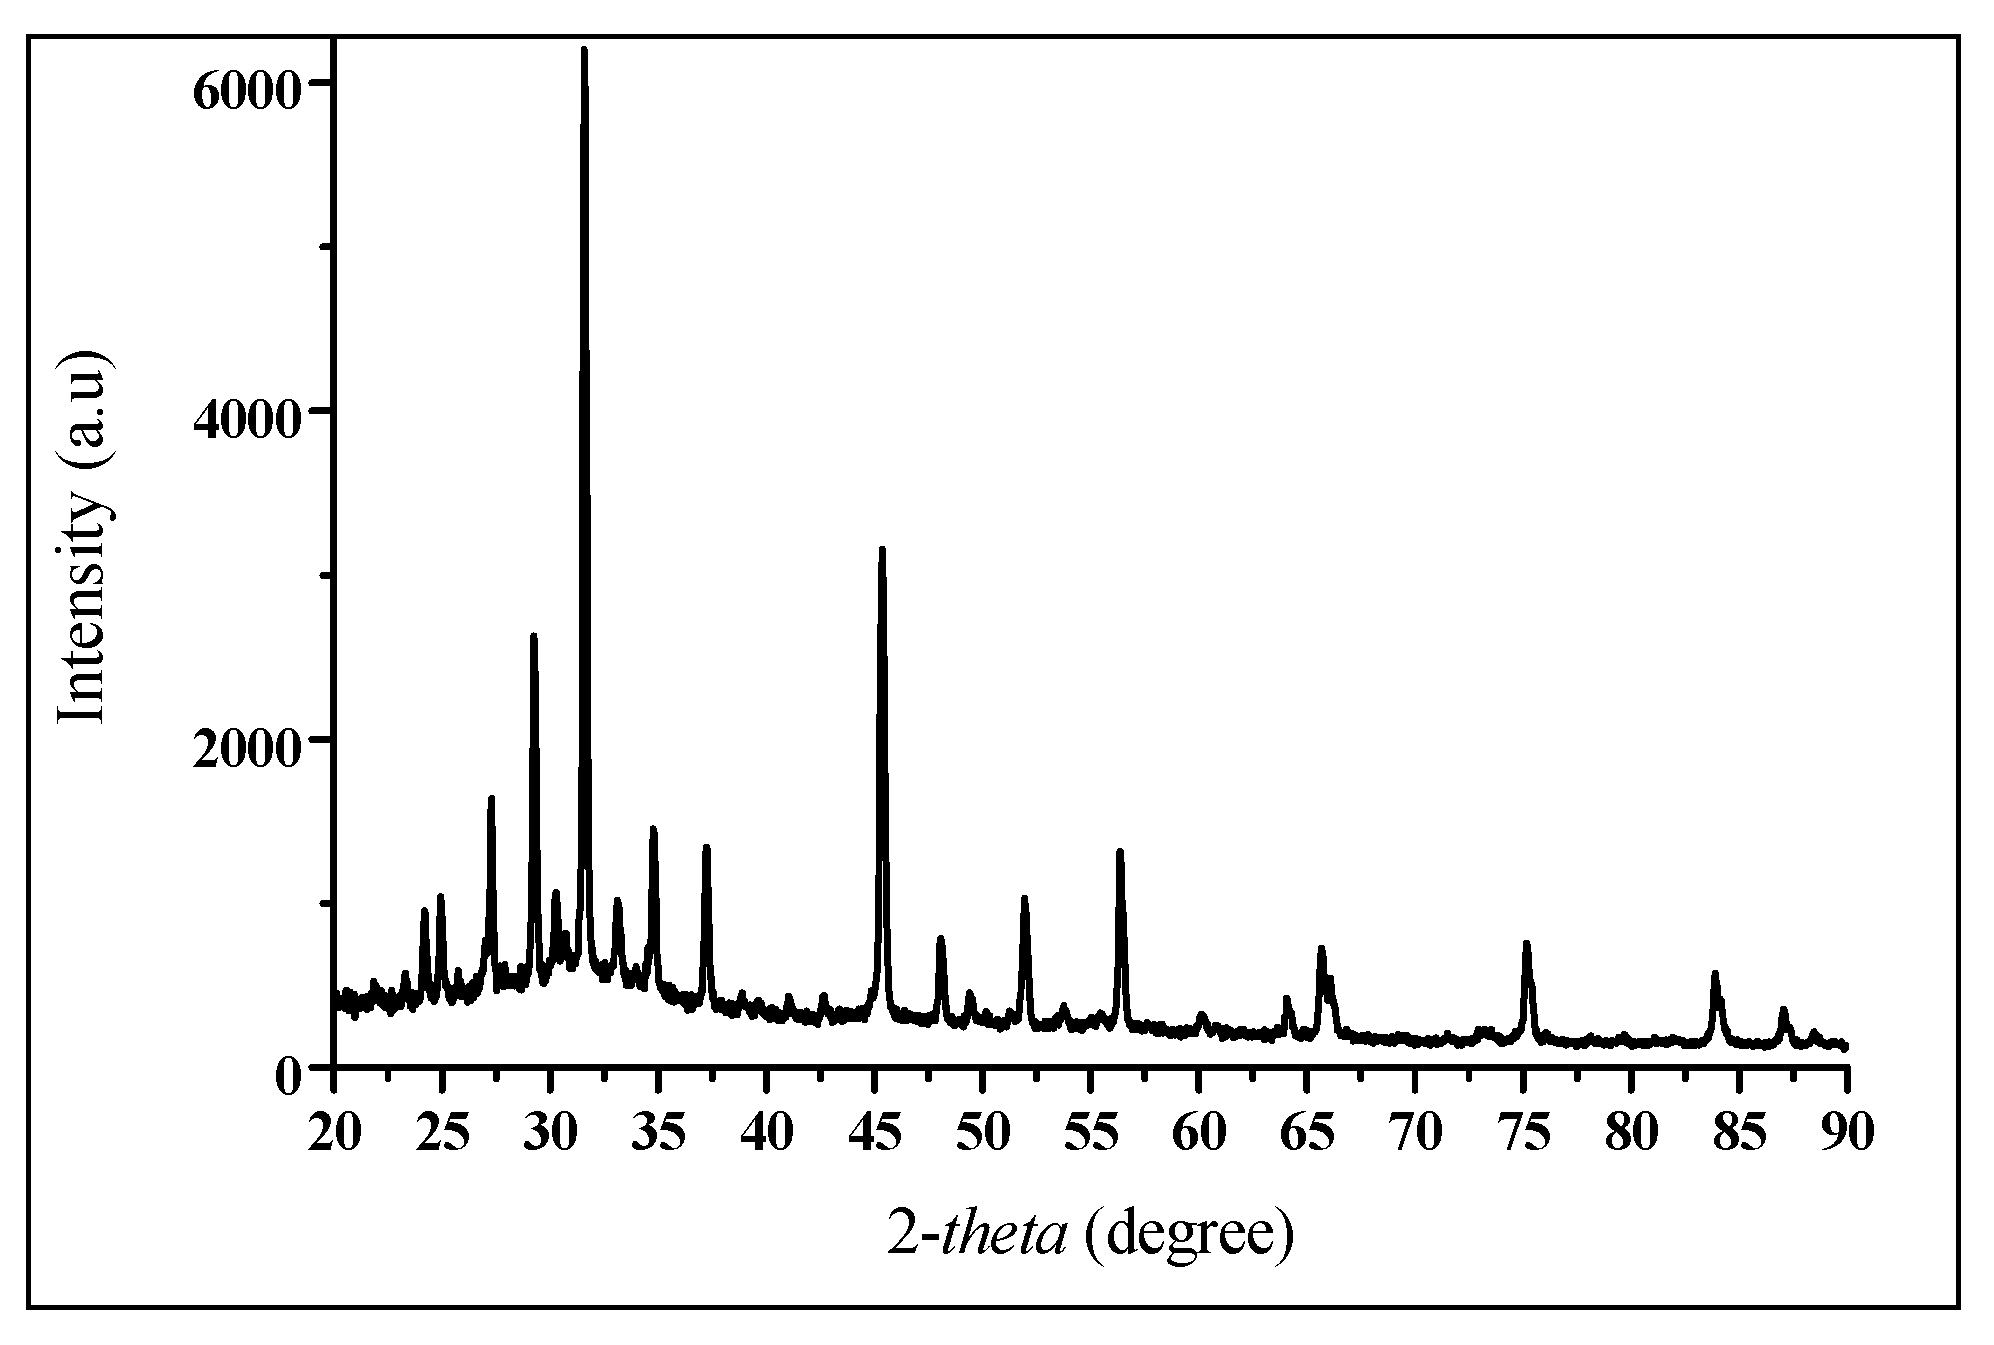
2.4.2. Characterization Using an X-ray Diffraction (XRD) Spectroscopy

Before XRD analysis, both the reference and the prepared samples were grounded and sieved to make a fine powder. The powder was then packed in the sample holders and loaded in the sample rack for analysis. The XRD patterns of diffractograms of potassium ferrate (VI) and sodium ferrate (VI) are demonstrated in Figure 4 and Figure 5. The XRD patterns were analyzed by scanning from 2-theta (2θ) ranging between 4.00 and 80.00°. Sharps peaks of crystalline K2FeO4 at 2θ values are 30.40°, 31.29°, 32.54°, 39.36°,40.51°, and 57.30°.
Sharps peaks of crystalline of Na2FeO4 at 2θ values are 27.27°, 29.23°, 31.56°, 45.35°, and 56.35° and were more visible, compared to the reference (K2FeO4). Figure 4 and Figure 5 show strong similarities and prove the crystal structure of both ferrates and demonstrate the similarities with Na2FeO4 as found by El Maghraoui et al. [31] and BaFeO4 by Koltypin et al. [38]. Both reference and product ferrates analyzed in this study had an orthorhombic shape. From the analytical point of view, the XRD is one of the analytical tools used to verify the presence of crystallinity of ferrate salts.

2.5. Optimization of Parameters

The optimum conditions followed during the treatment of real AMD are presented in Table 3 and more details could be found in Munyengabe et al. [15].

2.6. Analytical Techniques

Inductively Coupled Plasma-Optical Emission Spectroscopy (ICP-OES) (iCap 6500 Duo, Thermo Scientific, Manchester, U.K.) was used to determine metal concentrations in AMD before and after treatment with ferrate ions. Good linearity was obtained from the ICP-OES calibration curves of metals prepared from a multi-element (100 mg L−1) standard solution. The main target elements to be removed in this study were Fe, Mn and Zn. Iron was selected during AMD treatment, as it is the main cause of acidity in this type of water, while Mn and Zn are hardly being removed from the water at a low pH value. Before the oxidation process, AMD was diluted 100 times by taking 1 mL of the sample into 99 mL of deionized water and filtered (0.22 µm) to fit in the multi-element calibration curve ranging from 0 to 7.50 mg L−1. Treated AMD was first centrifuged, and the supernatant liquid was filtered using the same filter. All samples were run three times on ICP-OES. Three untreated acidic water samples (RTW1, RTW2 and RTW3) were filtered and subjected to ICP-OES for screening purposes to assess the concentrations of metals, metalloids and trace elements. After that, a small portion (20 mL) from each AMD sample was treated with 5 mL (0.025 mmol. L−1) of sodium ferrate (VI) in 30 min of contact time as the optimal conditions. The removal percentage was calculated using the following Equation (2).
Removal percentage = [(Ci−Cr)/Ci] × 100%
where Ci and Cr are the initial and final concentrations (mg L−1) of metals, respectively.

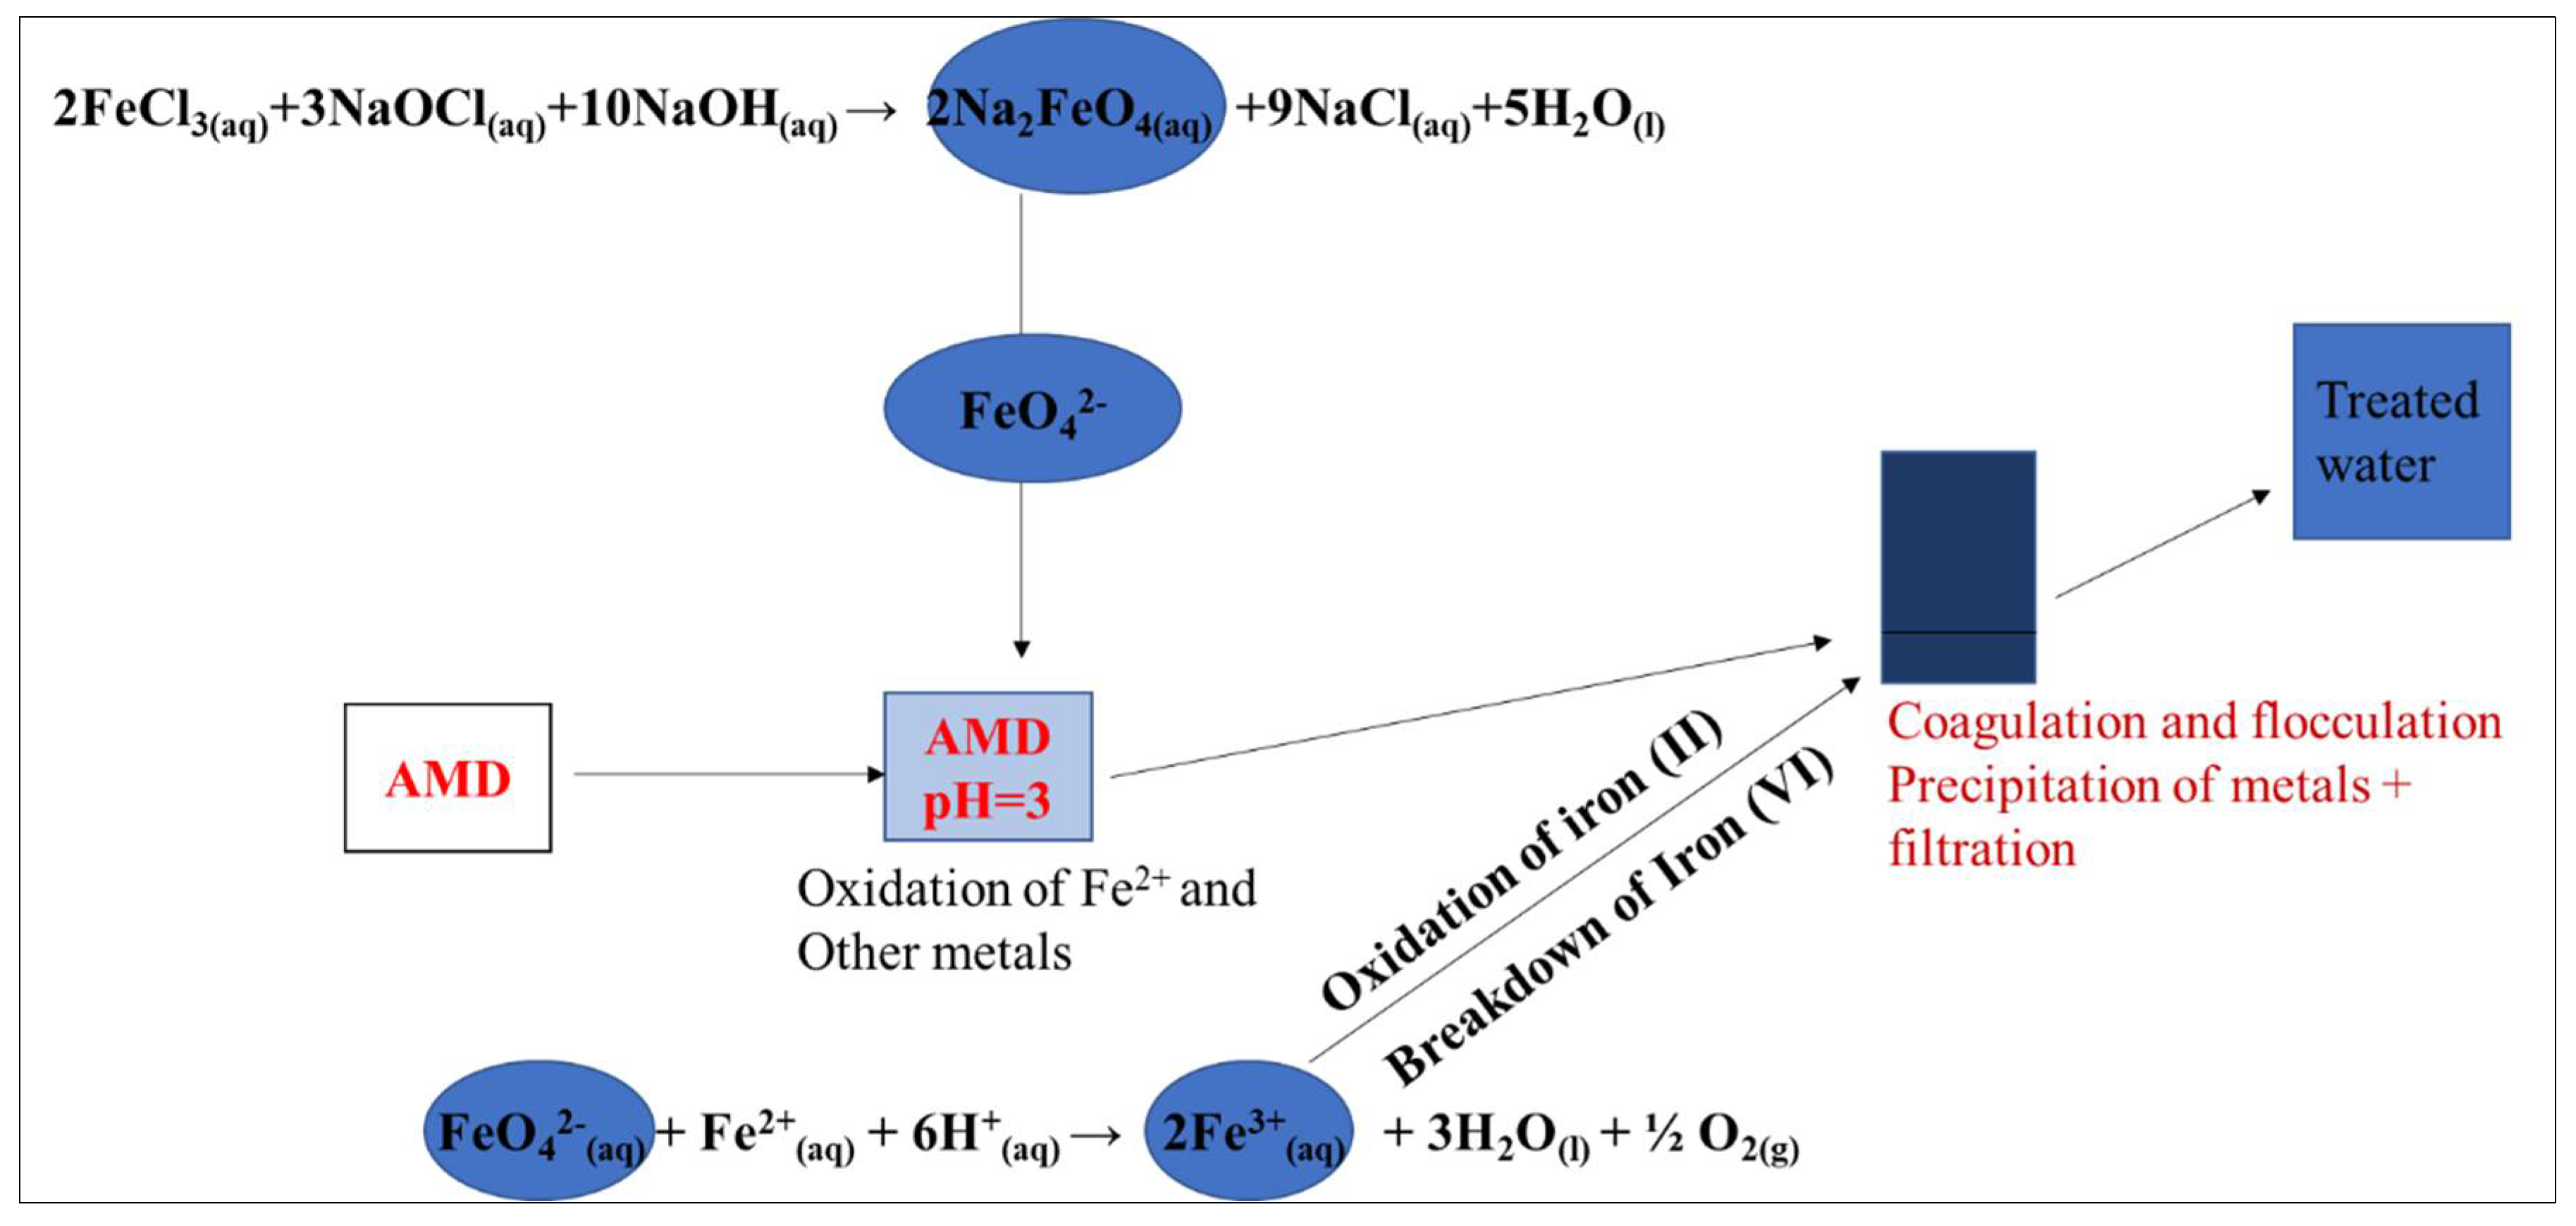
2.7. Flow Diagram of Real AMD Treatment Using Sodium Ferrate (FeO42−)

This investigation aimed to demonstrate that ferrate treatment offers an attractive solution to the treatment of AMD that is highly rich in Fe2+ and other dissolved metals as shown in Figure 6. The proposed flow diagram indicates all processes of AMD treatment, where oxidation and chemical desalination processes were performed at pH = 3 during this study.
Figure 6 clearly shows the preparation of Na2FeO4, its implementation in the oxidation of Fe2+ in synthetic AMD, and the production of Fe3+ from the self-decomposition of FeO42−- ions as well as the oxidation of the Fe2+ molar ratio (1:1) from AMD. These generated Fe3+ ions are common environmentally friendly coagulants providing the efficient adsorption and precipitation of different pollutants present in wastewater and water, due to their high surface area.

3. Results and Discussions

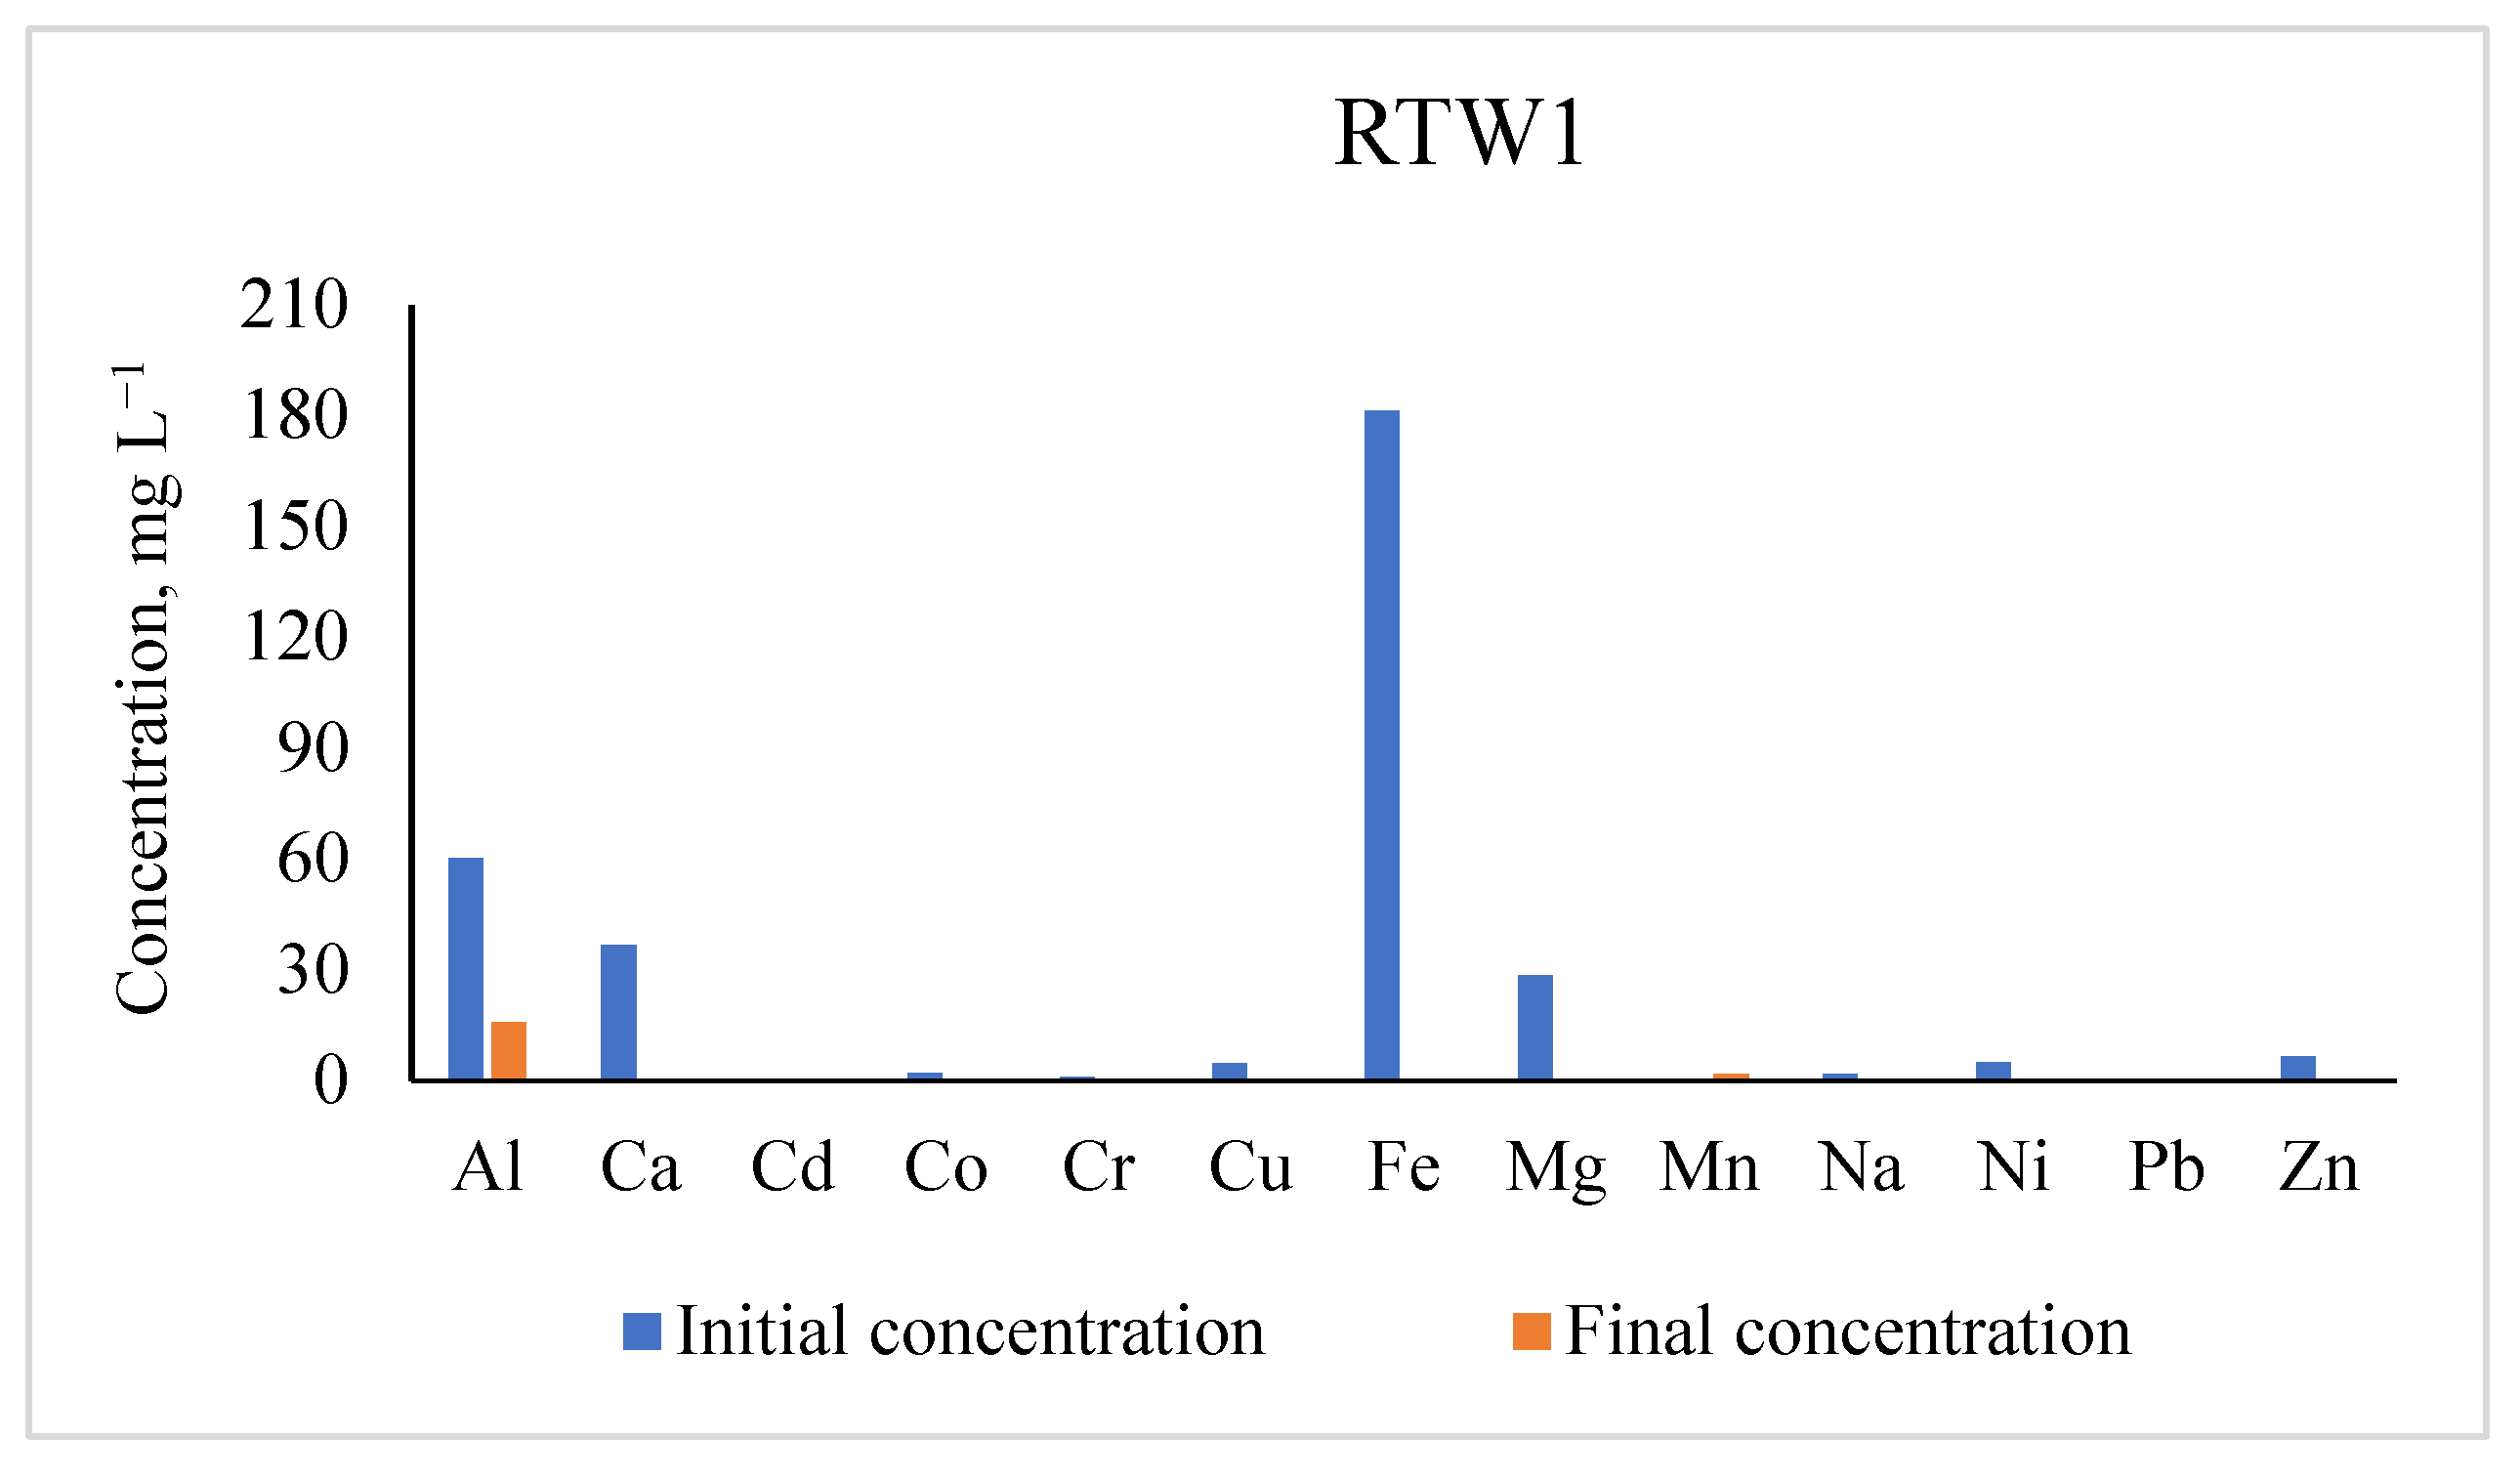
3.1. Concentrations of Metals in RTW1

The initial and concentrations of all assessed metals in the raw AMD sample collected from RTW1 and their residual concentrations in the treated one by Na2FeO4 along with their percentage removals are presented in Table 4.
This acidic water sample collected from RTW1 was highly characterized by Fe, Al, Ca and Mg, while other metal concentrations were below 20.0 mg L−1 as shown in Figure 7. The residual concentrations of most of the elements detected in RTW1 after being treated using sodium ferrate (VI) were below the WHO guidelines of drinking water (Table 3).
The AMD sample also contained a high concentration of Cd, which was greater than SANS 241-2015 for drinking water (≤3 µg L−1) (Table 3). Therefore, the removal of all metals from AMD by Na2FeO4 ranged between 26 and 100%. The low percentage removal for heavy metals especially Cd might be related to the acidic pH of the water and high TDS greater than 1000 mg L−1. The previous study on Cd removal from natural water by K2FeO4 was highly pH-dependent, where higher removal was related to higher pH values [43].

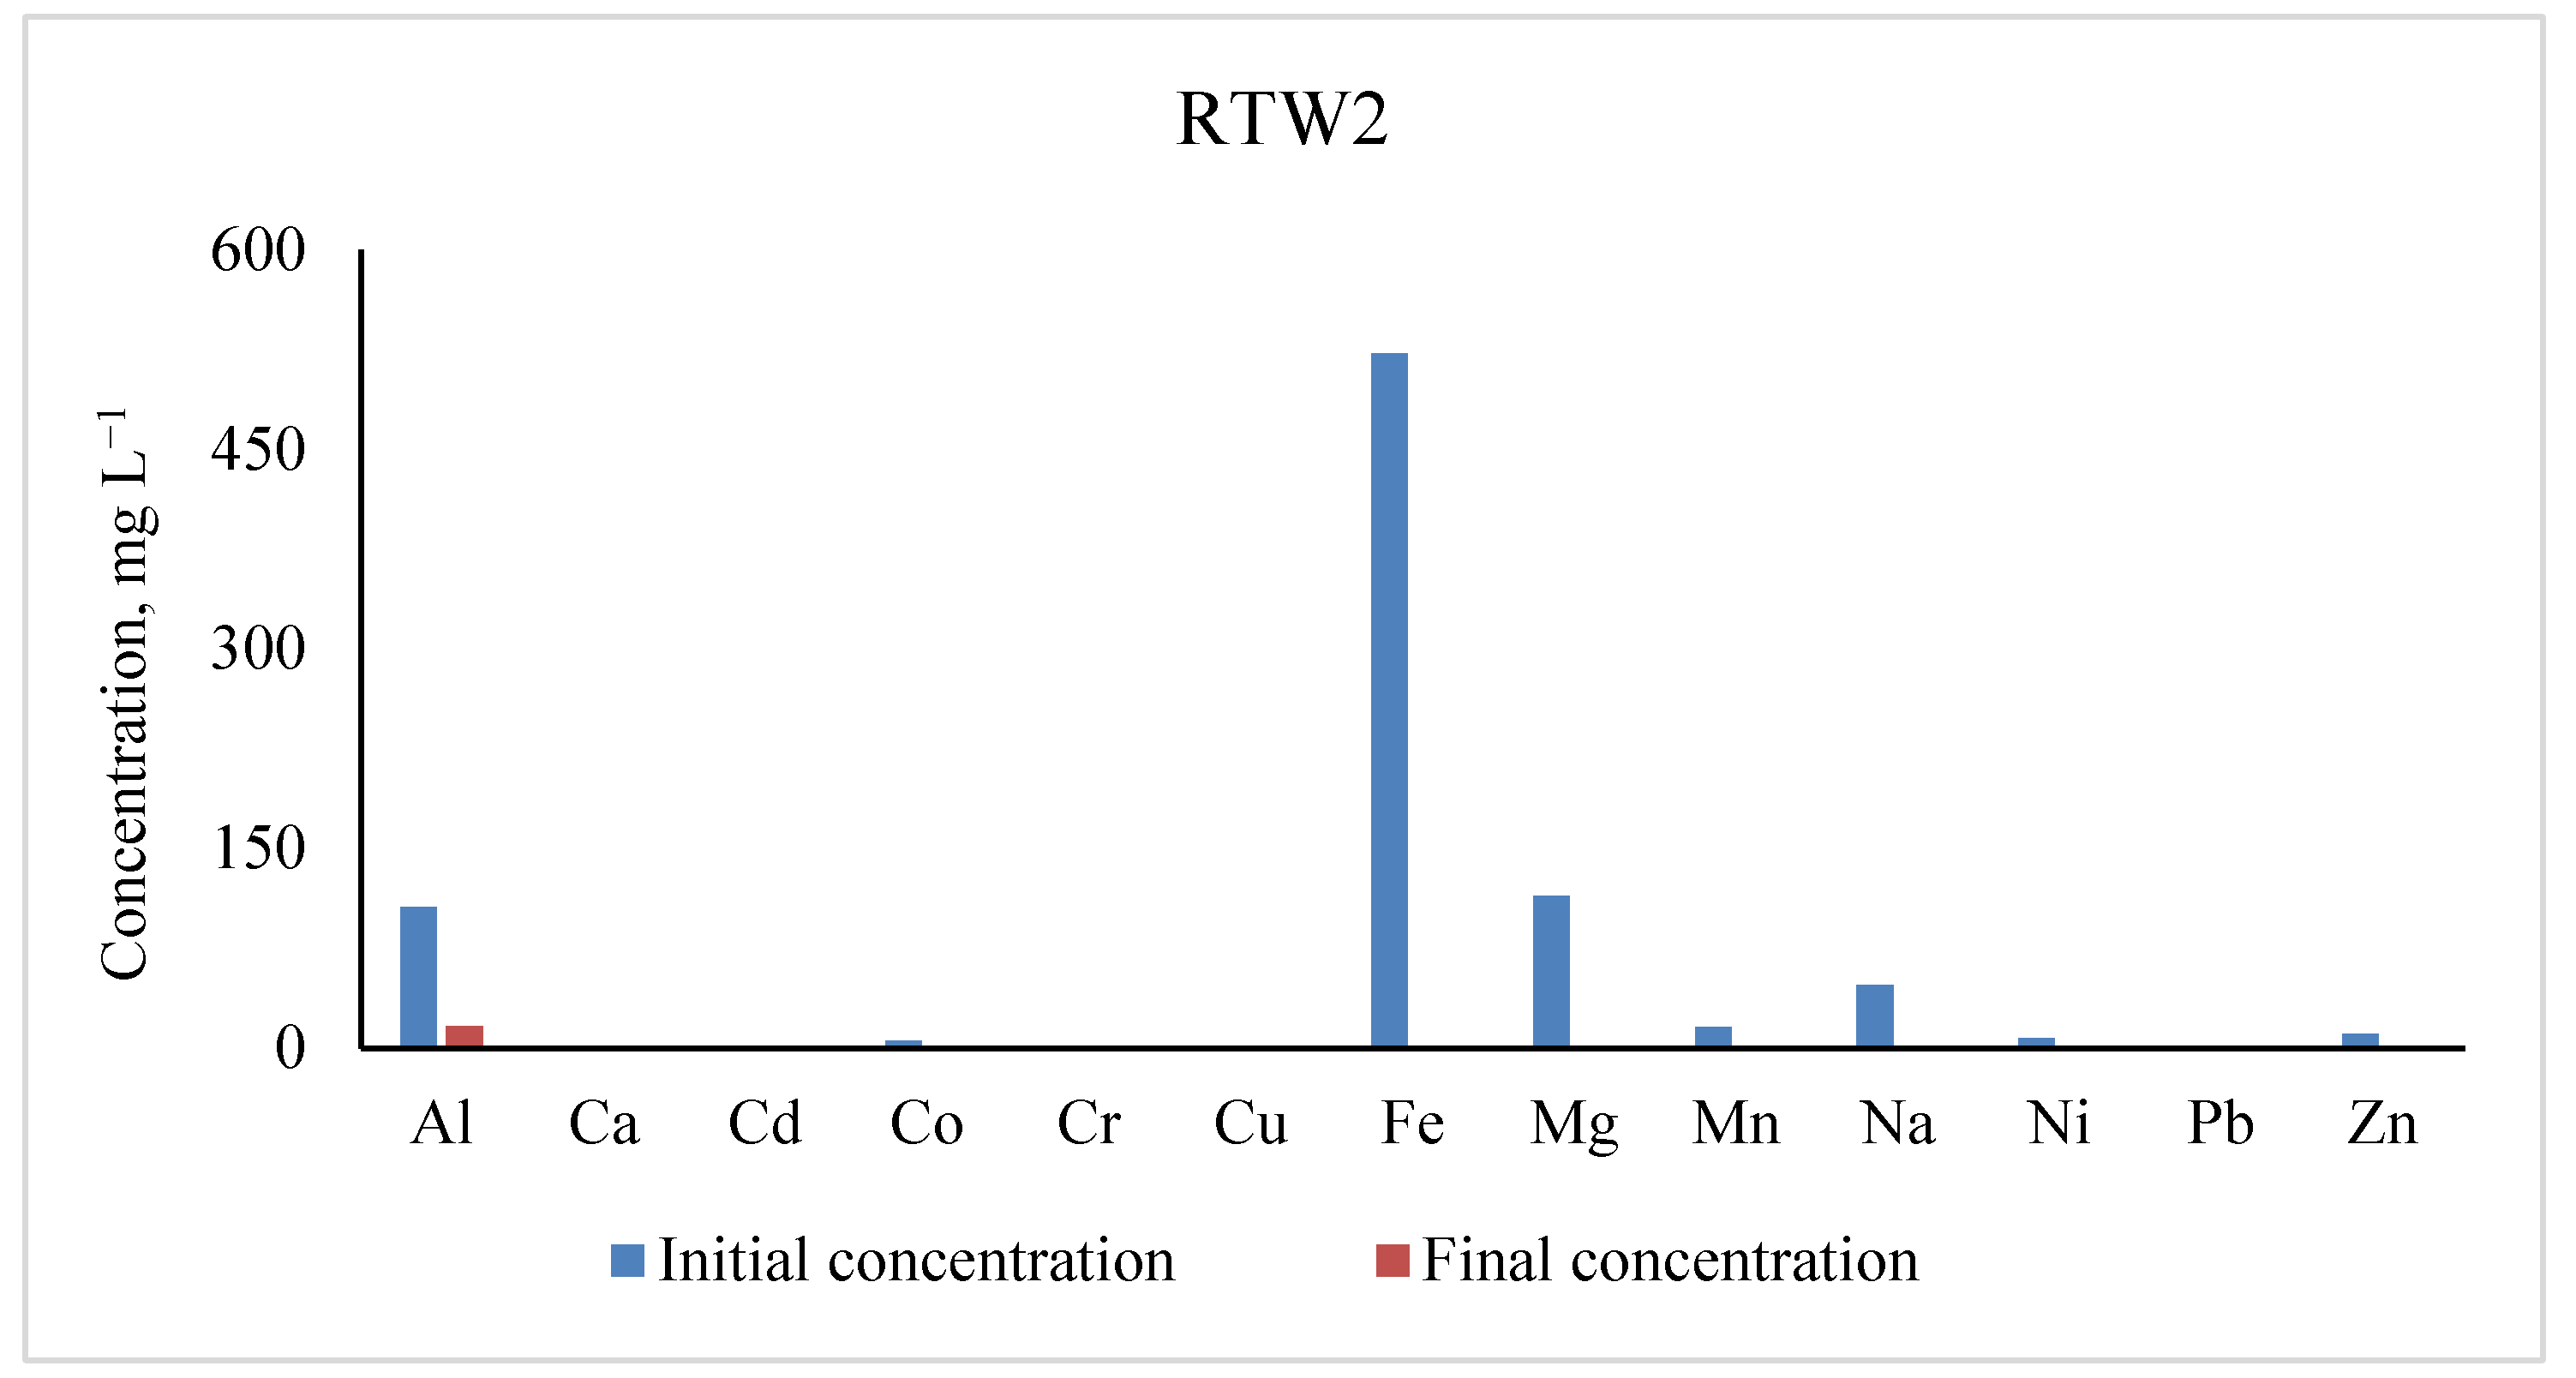
3.2. Concentrations of Metals in RTW2

The initial and residual concentrations of all assessed metals in the AMD sample collected from RTW2 are presented in Table 5.
This acidic water collected from RTW2 also contained high concentrations of Fe, Mg and Al, which were greater than 100 mg L−1, while other metal concentrations were below 50 mg L-1, as shown in Figure 8.
Contrary to sampling site RTW1, Cd was not detected in this AMD sample, but the Pd concentration was 12 times the SANS 241-2015 guidelines (≤10 µg L−1). The initial concentration of Cr was also higher than the SANS 241-2015 guidelines (≤50 µg L−1) as presented in Table 3. Therefore, the removal of all metals from AMD by Na2FeO4 ranged between 84.23 and 100%, which was better than the one found in the previous sampling site.

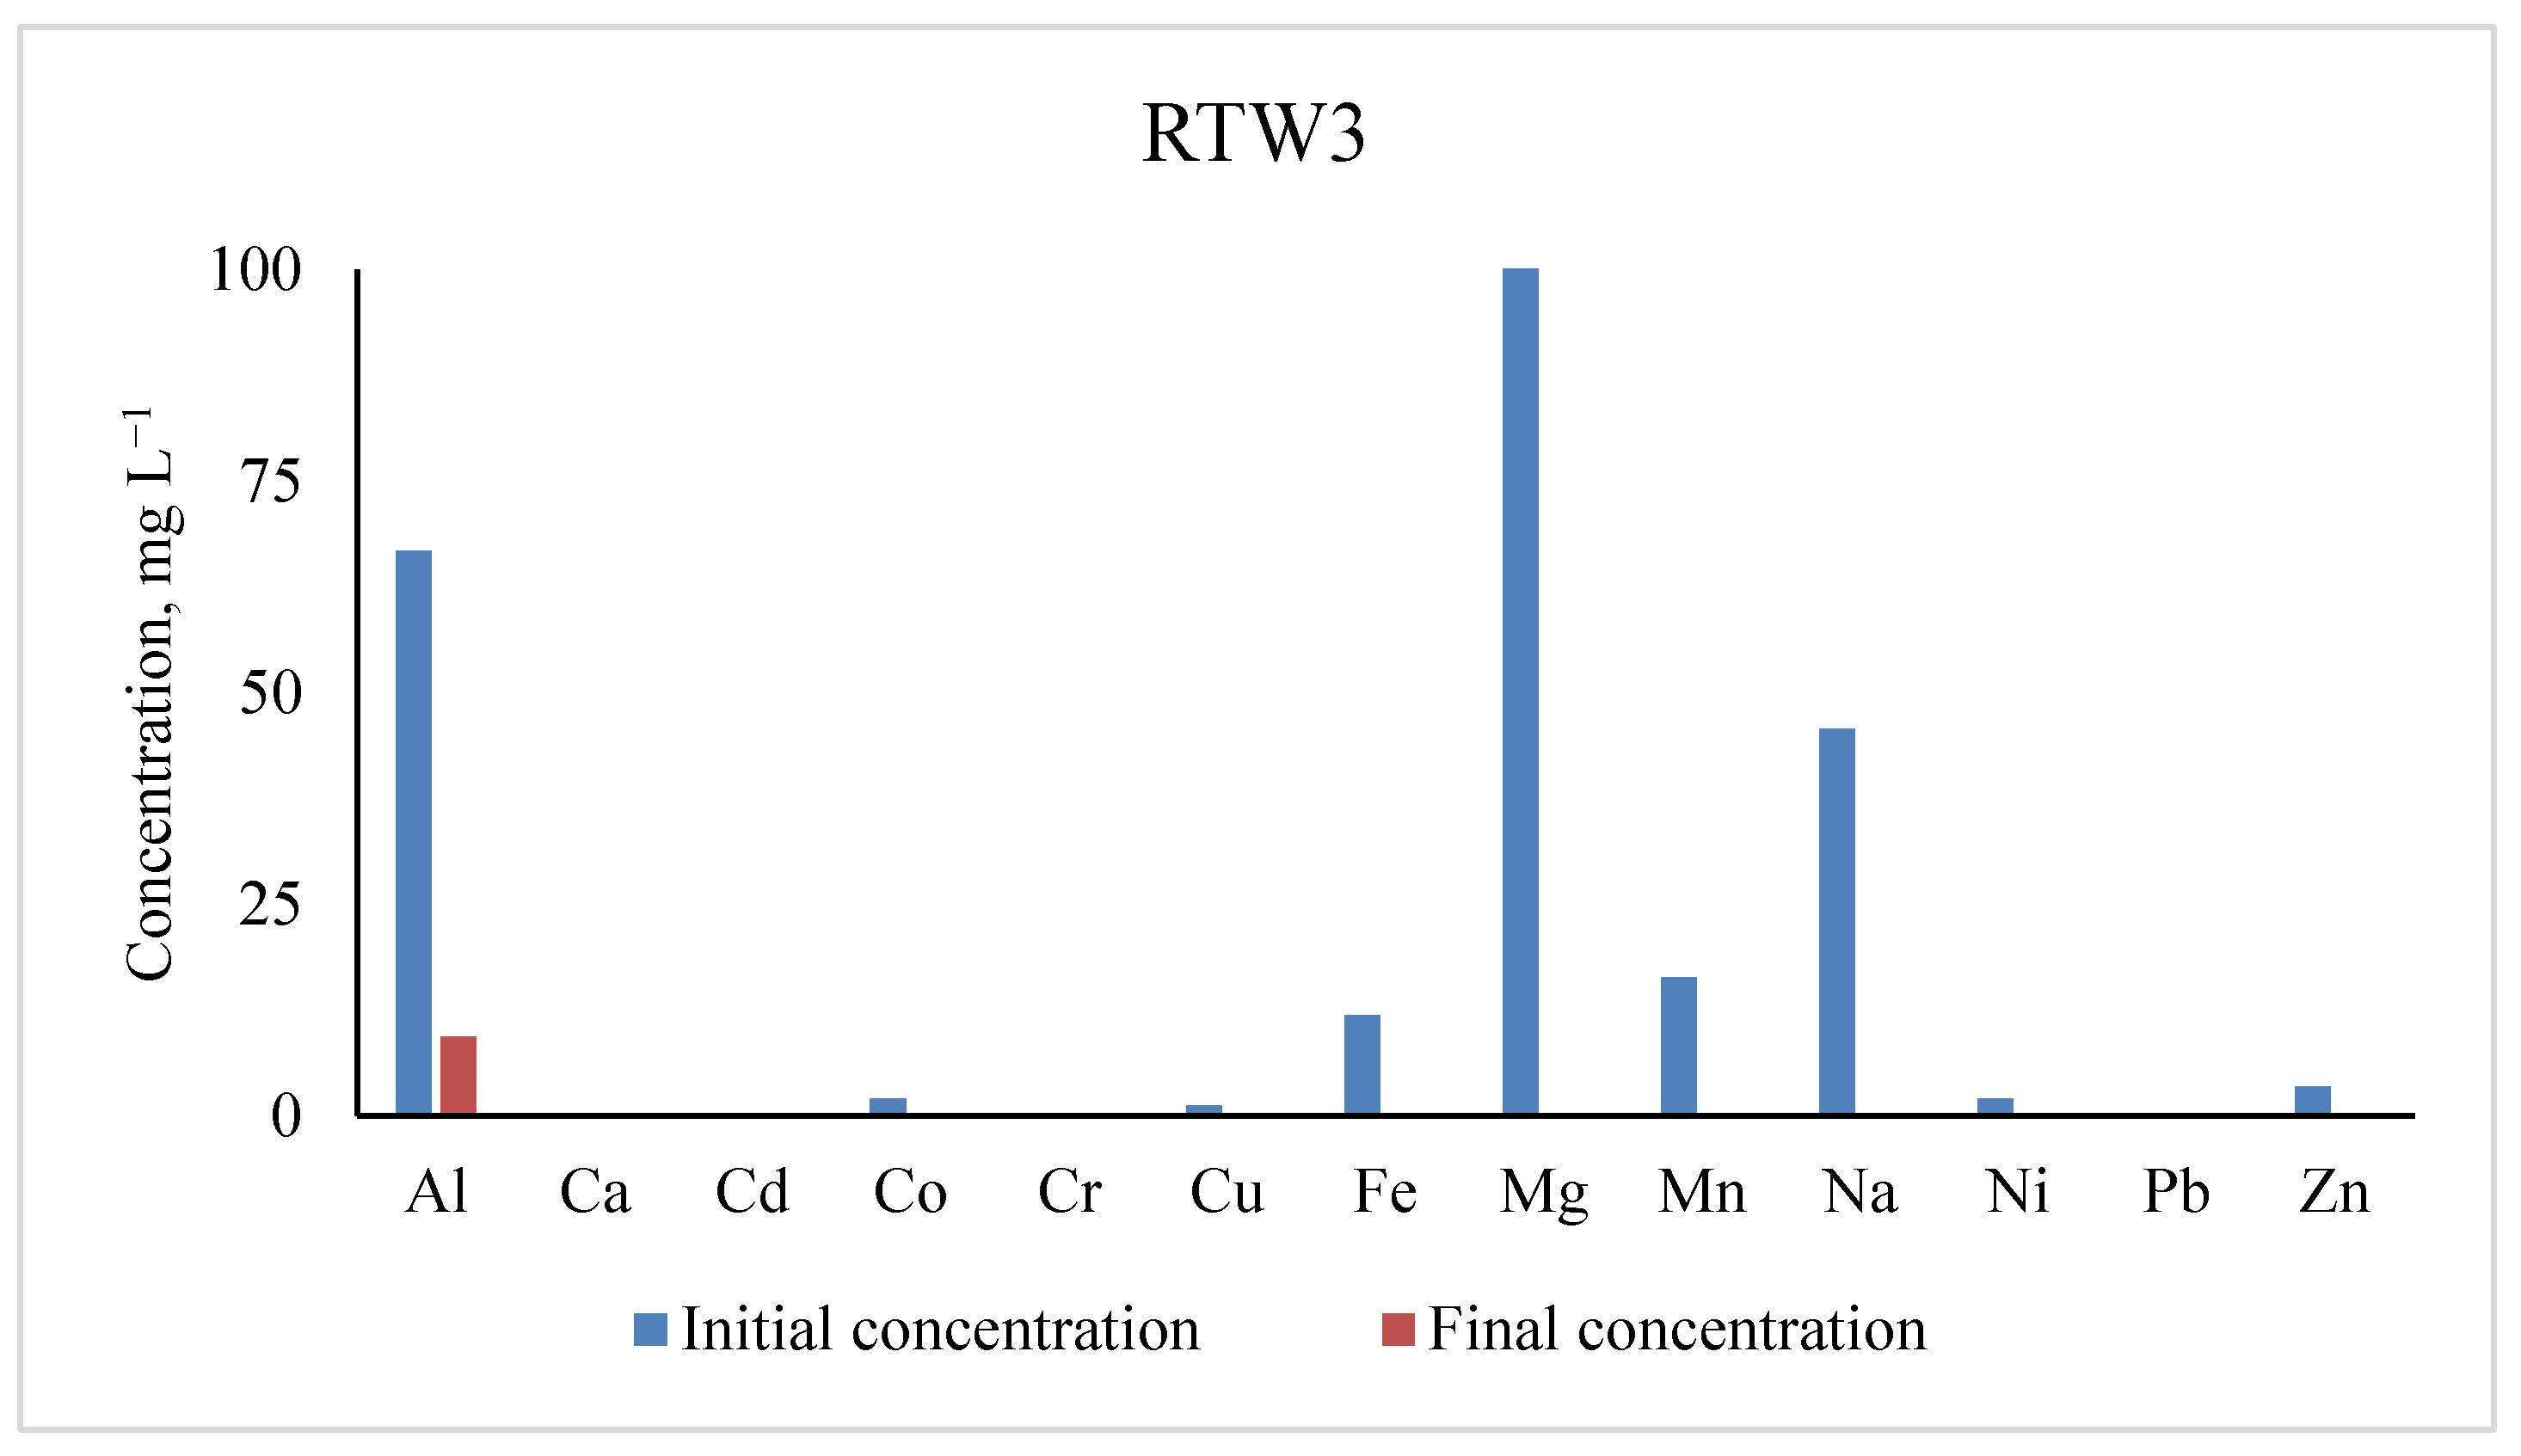
3.3. Concentrations of Metals in RTW3

The initial and residual concentrations of all assessed metals in the AMD sample collected from RTW3 are presented in Table 6.
This acidic water sample collected from RTW3 was also highly characterized by pH = 3.13 and high concentrations of alkali and alkaline earth metals—Na, Mg and one metal, such as Al—which were greater than 40 mg L−1, while other metal concentrations assessed were below 20 mg L−1 including Fe as shown in Figure 9.
The pH of AMD collected from sampling site RTW3 was greater than the other pH values observed in the previous sampling sites. This might be caused by the presence of Na, Mg and Al in high concentrations. Both Pd (14.0 µg L−1) and Cr (92.0 µg L−1) did not meet the SANS 241-2015 (≤10 µg L−1 and ≤50 µg L−1, respectively) (Table 3) before the treatment, while Pd (2 µg L−1) met the standards after treatment and Cr was below the detection limit. Fe, as the main target element, was completely removed with a removal efficiency of 99.85%. In conclusion, sodium ferrate showed its potential of removing metals through coagulation and flocculation processes from raw tailing waters characterized with an acidic pH, and the residual concentrations of most elements detected in all AMD samples were below the SANS 241-2015 and WHO guidelines [29] of drinking water with a resultant pH ≥ 9. Na2FeO4 became the promising alternative material for water processing and mining wastewater with zero energy input and non-toxic by-products. The novelty of this paper relied on the treatment of AMD, using an advanced oxidation process (AOP), which is sodium ferrate (VI) in a single mixing of a dosing unit, where generated ferric ions from the breakdown of this AOP acts as an effective coagulant and flocculent in the form of nanoparticles.

4. Conclusions

Liquid Na2FeO4 was quantitatively produced through a wet oxidation method and was fully characterized, using FTIR, XRD and UV-Vis instruments. It was then applied for real AMD samples collected from three different places (RTW1, RTW2 and RTW3) in Johannesburg, Pretoria, South Africa, with corresponding pH values of 2.50, 2.58 and 3.13, respectively. The results demonstrated that Na2FeO4 has the potential to remove metals from AMD through coagulation and flocculation processes with percentage removals ranging between 26 and 100% for all sampling sites without generating any harmful by-products. This showed that Na2FeO4 could become a promising alternative material for water processing and mining wastewater with zero energy input and non-toxic by-products. Na2FeO4 also played different roles, such as an oxidizer, coagulant, flocculent, and neutralizer, where the resulting pH of the treated AMD samples was greater than or equal to 9.

Author Contributions

Conceptualization: A.M. and C.Z.; Data curation: A.M.; Formal analysis: A.M.; Funding acquisition: C.Z.; Investigation: A.M. and C.Z.; Methodology: A.M.; Project administration: C.Z.; Resources: C.Z.; Software: A.M.; Supervision: C.Z.,A.M. and J.N.Z.; Validation: A.M. and J.N.Z.; Visualization: A.M. and J.R.; Writing–original draft: A.M.; Writing–review & editing: A.M., C.Z., J.R. and J.N.Z. All authors have read and agreed to the published version of the manuscript.

Funding

This research received no external funding, and The APC was funded by University of Johannesburg, South Africa.

Institutional Review Board Statement

Not applicable.

Informed Consent Statement

Not applicable.

Data Availability Statement

Not applicable.

Acknowledgments

This study was supported by the University of Johannesburg and NRF/South Africa. Many thanks to P. N. Nomngongo, and the group members from Environmental Analytical Chemistry Lab 3404. The authors would like to acknowledge V. N. Mukhethwa and M. Sihlahla for the provision of water samples and D. Ramutshatsha for the assistance with ICP-OES.

Conflicts of Interest

The authors declare no conflict of interest.

References

  1. Younger, P.L. Mine Waste or Mine Voids: Which is the Most Important Long-Term Source of Polluted Mine Drainage? In the United Nations Environment Program 2002, Mineral Resources Forum: Current Feature Paper. Available online: www.mineralresourcesforum.org/docs/pdfs/younger1102.pdf (accessed on 8 August 2021).
  2. Strosnider WH, J.; López, F.L.; LaBar, J.A.; Palmer, K.J.; Nairn, R.W. Unabated acid mine drainage from Cerro Rico de Potosí, Bolivia: Uncommon constituents of concern impact the Río Pilcomayo headwaters. Environ. Earth Sci. 2014, 71, 3223–3234. [Google Scholar] [CrossRef]
  3. Sun, X.H.; Wang, L.; Li, W.C.; Tuo, W.Q. Preparation of liquid ferrate and the optimization of process parameters. In Advanced Materials Research; Trans Tech Publications Ltd.: Freienbach, Switzerland, 2013; Volume 772, pp. 884–887. [Google Scholar] [CrossRef]
  4. Goodwill, J.E.; Mai, X.; Jiang, Y.; Reckhow, D.A.; Tobiason, J.E. Oxidation of manganese (II) with ferrate: Stoichiometry, kinetics, products and impact of organic carbon. Chemosphere 2016, 159, 457–464. [Google Scholar] [CrossRef] [PubMed]
  5. Skousen, J.; Zipper, C.E.; Rose, A.; Ziemkiewicz, P.F.; Nairn, R.; McDonald, L.M.; Kleinmann, R.L. Review of passive systems for acid mine drainage treatment. Mine Water Environ. 2017, 36, 133–153. [Google Scholar] [CrossRef] [Green Version]
  6. Munyengabe, A.; Zvinowanda, C. Production, characterization and application of ferrate (vi) in water and wastewater treatments. Braz. J. Anal. Chem. 2019, 6, 40–57. [Google Scholar] [CrossRef]
  7. Lv, D.; Zheng, L.; Zhang, H.; Deng, Y. Coagulation of colloidal particles with ferrate (VI). Environ. Sci. Water Res. Technol. 2018, 4, 701–710. [Google Scholar] [CrossRef]
  8. Zheng, L.; Deng, Y. Settleability and characteristics of ferrate (VI)-induced particles in advanced wastewater treatment. Water Res. 2016, 93, 172–178. [Google Scholar] [CrossRef] [PubMed]
  9. Huang, X.; Deng, Y.; Liu, S.; Song, Y.; Li, N.; Zhou, J. Formation of bromate during ferrate (VI) oxidation of bromide in water. Chemosphere 2016, 155, 528–533. [Google Scholar] [CrossRef] [Green Version]
  10. De Luca, S.J.; Cantelli, M.; De Luca, M.A. Ferrate vs traditional coagulants in the treatment of combined industrial wastes. Water Sci. Technol. 1992, 26, 2077–2080. [Google Scholar] [CrossRef]
  11. Alsheyab, M.; Jiang, J.Q.; Stanford, C. Online production of ferrate with an electrochemical method and its potential application for wastewater treatment: A review. J. Environ. Manag. 2009, 90, 1350–1356. [Google Scholar] [CrossRef]
  12. Dubrawski, K.L.; Cataldo, M.; Dubrawski, Z.; Mazumder, A.; Wilkinson, D.P.; Mohseni, M. In-situ electrochemical Fe (VI) for removal of microcystin-LR from drinking water: Comparing dosing of the ferrate ion by electrochemical and chemical means. J. Water Health 2018, 16, 414–424. [Google Scholar] [CrossRef] [Green Version]
  13. Stanford, C.; Jiang, J.Q.; Alsheyab, M. Electrochemical production of ferrate (iron VI): Application to the wastewater treatment on a laboratory scale and comparison with iron (III) coagulant. Water Air Soil Pollut. 2010, 209, 483–488. [Google Scholar] [CrossRef]
  14. Ockerman, L.T.; Schreyer, J.M. Preparation of sodium ferrate (VI). J. Am. Chem. Soc. 1951, 73, 5478. [Google Scholar] [CrossRef]
  15. Munyengabe, A.; Zvinowanda, C.; Zvimba, J.N.; Ramontja, J. Innovative oxidation and kinetic studies of ferrous ion by sodium ferrate (VI) and simultaneous removal of metals from a synthetic acid mine drainage. Phys. Chem. Earth Parts A/B/C 2020, 102932, In Press, Corrected Proof. [Google Scholar] [CrossRef]
  16. Lei, B.; Zhou, G.; Cheng, T.; Du, J. Synthesis of potassium ferrate by chemical dry oxidation and its properties in the degradation of methyl orange. Asian J. Chem. 2013, 25, 27. [Google Scholar] [CrossRef]
  17. Kooti, M.; Jorfi, M.; Javadi, H. Rapid chemical synthesis of four ferrate (VI) compounds. J. Iran. Chem. Soc. 2010, 7, 814–819. [Google Scholar] [CrossRef]
  18. Yates, B.J.; Zboril, R.; Sharma, V.K. Engineering aspects of ferrate in water and wastewater treatment: A review. J. Environ. Sci. Health 2014, 49, 1603–1614. [Google Scholar] [CrossRef]
  19. Lee, Y.; Zimmermann, S.G.; Kieu, A.T.; von Gunten, U. Ferrate (Fe (VI)) application for municipal wastewater treatment: A novel process for simultaneous micropollutant oxidation and phosphate removal. Environ. Sci. Technol. 2009, 43, 3831–3838. [Google Scholar] [CrossRef]
  20. Waite, T.D.; Gray, K.A. Oxidation and coagulation of wastewater effluent utilising ferrate (VI) ion. In Studies in Environmental Science 23; Elsevier: Amsterdam, The Netherlands, 1984; pp. 407–420. [Google Scholar] [CrossRef]
  21. Sharma, V.K. Ferrate (V) oxidation of pollutants: A premix pulse radiolysis study. Radiat. Phys. Chem. 2002, 65, 349–355. [Google Scholar] [CrossRef]
  22. Nguema, P.F.; Jun, M. Application of ferrate (VI) as a disinfectant in drinking water treatment processes: A review. Int. J. 2016, 7, 53–62. [Google Scholar] [CrossRef]
  23. Song, Y.R.; Ma, J.W. Development of ferrate (VI) salt as an oxidant and coagulant for water and wastewater treatment. In Applied Mechanics and Materials; Trans Tech Publications Ltd.: Freienbach, Switzerland, 2013; Volume 361, pp. 658–661. [Google Scholar] [CrossRef]
  24. Fernandes, H.M.; Reinhart, D.; Franklin, M.R. Use of Na-Ferrate (VI) to prevent acid drainage from uranium mill tailings. In Uranium 2008, Mining and Hydrogeology; Springer: Berlin/Heidelberg, Germany, 2008; pp. 261–270. [Google Scholar] [CrossRef]
  25. Goodwill, J.E.; LaBar, J.; Slovikosky, D.; Strosnider, W.H. Preliminary assessment of ferrate treatment of metals in acid mine drainage. J. Environ. Qual. 2019, 48, 1549–1556. [Google Scholar] [CrossRef] [Green Version]
  26. Momtazpour, H.; Jorfi, S.; Tabatabaie, T.; Pazira, A.A. Application of sodium ferrate produced from industrial wastes for TOC removal of surface water. Water Sci. Technol. 2019, 79, 1263–1275. [Google Scholar] [CrossRef] [PubMed]
  27. Weissenstein, K.; Sinkala, T. Soil pollution with heavy metals in mine environments, impact areas of mine dumps particularly of gold-and copper mining industries in Southern Africa. Arid Ecosyst. 2011, 1, 53–58. [Google Scholar] [CrossRef]
  28. SANS (South African National Standards) 241:2015. Drinking-Water. Available online: https://selectech.co.za/whatyoushouldknowaboutthenew2015bluedroplimitssans2412015drinkingwater/#:~:text=The%20new%20SANS%2041%3A2015 (accessed on 8 August 2020).
  29. World Health Organization (WHO). Guidelines for Drinking-Water Quality: The Fourth Edition Incorporating the First Addendum. License: CC BY-NC-SA 3.0 IGO. 2017. Available online: https://apps.who.int/iris/bitstream/handle/10665/254637/9789241549950-eng.pdf;jsessionid=F099F3FEEEBB3C1A1A81964E06B241FC?sequence=1 (accessed on 8 August 2020).
  30. Thompson, G.W.; Ockerman, L.; Schreyer, J.M. Preparation and purification of potassium ferrate (VI). J. Am. Chem. Soc. 1951, 73, 1379–1381. [Google Scholar] [CrossRef]
  31. El Maghraoui, A.; Zerouale, A.; Ijjaali, M. Process for the synthesis of ferrate (VI) Alkali metal dry. Adv. Mater. Phys. Chem. 2015, 5, 10. [Google Scholar] [CrossRef] [Green Version]
  32. El Maghraoui, A.; Zerouale, A.; Ijjaali, M.; Sajieddine, M. Synthesis and characterization of ferrate (VI) alkali metal by electrochemical method. Adv. Mater. Phys. Chem. 2013, 3, 83–87. Available online: http://www.scirp.org/journal/PaperInformation.aspx?PaperID=29310 (accessed on 15 July 2021). [CrossRef] [Green Version]
  33. Bouzek, K.; Schmidt, M.J.; Wragg, A.A. Influence of electrolyte composition on current yield during ferrate (VI) production by anodic iron dissolution. Electrochem. Commun. 1999, 1, 370–374. [Google Scholar] [CrossRef]
  34. Sharma, V.K.; Zboril, R.; Varma, R.S. Ferrates: Greener oxidants with multimodal action in water treatment technologies. Acc. Chem.Res. 2015, 48, 182–191. [Google Scholar] [CrossRef]
  35. Sharma, V.K.; Kazama, F.; Jiangyong, H.; Ray, A.K. Ferrates (iron (VI) and iron (V)): Environmentally friendly oxidants and disinfectants. J. Water Health 2005, 3, 45–58. [Google Scholar] [CrossRef]
  36. Batarseh, E.S.; Reinhart, D.R.; Daly, L. Liquid sodium ferrate and Fenton’s reagent for treatment of mature landfill leachate. J. Environ. Eng. 2007, 133, 1042–1050. [Google Scholar] [CrossRef]
  37. Munyengabe, A.; Zvinowanda, C. Synthesis and chemical stability studies of sodium ferrate (VI) solution. Asian J. Chem. 2019, 31, 3029–3034. [Google Scholar] [CrossRef]
  38. Koltypin, M.; Licht, S.; Nowik, I.; Vered, R.T.; Levi, E.; Gofer, Y.; Aurbach, D. Study of various (“super iron”) MFeO4 compounds in Li salt solutions as potential cathode materials for Li batteries. J. Electrochem. Soc. 2006, 153, A32–A41. Available online: https://www.cheric.org/research/tech/periodicals/doi.php?art_seq=527715 (accessed on 15 August 2020). [CrossRef]
  39. Cui, P.; Chen, S.S.; Li, D.S.; Zhao, P. Preparation of Sodium Ferrate by Microwave Method; Trans Tech Publications Ltd.: Freienbach, Switzerland, 2013; Volume 781, pp. 2225–2228. [Google Scholar] [CrossRef]
  40. Laksono, F.B.; Kim, I. Removal of 2-Bromophenol by advanced oxidation process with in-situ liquid ferrate (VI). Int. Proc. Chem. Biol. Environ. Eng. 2016, 94, 128–135. [Google Scholar] [CrossRef]
  41. Martinez-Tamayo, E.; Beltran-Porter, A.; Beltran-Porter, D. Iron compounds in high oxidation states: II. Reaction between Na2O2 and FeSO4. Thermochim. Acta 1986, 97, 243–255. [Google Scholar] [CrossRef]
  42. Peleyeju, M.G.; Umukoro, E.H.; Tshwenya, L.; Moutloali, R.; Babalola, J.O.; Arotiba, O.A. Photo-electrocatalytic water treatment systems: Degradation, kinetics and intermediate products studies of sulfamethoxazole on a TiO2-exfoliated graphite electrode. RSC Adv. 2017, 7, 40571–40580. [Google Scholar] [CrossRef] [Green Version]
  43. Liang, Y.M.; Jun, M.; Liu, W. Enhanced removal of lead (II) and cadmium (II) from water in alum coagulation by ferrate (VI) pretreatment. Water Environ. Res. 2007, 79, 2420–2426. [Google Scholar] [CrossRef]
Figure 1. Environmental problems caused by Princess Goldmine Dump ((a) to human settlement, factory, and (b) Manuel Street Park).
Water 13 02619 g001
Figure 2. (a) Absorption peak of K2FeO4 (FeO42−-) on UV-Vis and (b) calibration curve.
Water 13 02619 g002
Figure 3. Sodium ferrate (VI)–Fourier transform-infrared spectrum.
Water 13 02619 g003
Figure 4. XRD patterns of potassium ferrate (VI) (standard).
Water 13 02619 g004
Figure 5. XRD patterns of sodium ferrate (VI) (product).
Water 13 02619 g005
Figure 6. Process flow diagram of AMD treatment (oxidation and chemical desalination).
Water 13 02619 g006
Figure 7. Initial and residual concentrations of metals in water samples collected from RTW1.
Water 13 02619 g007
Figure 8. Initial and residual concentrations of metals in water sample collected from RTW2.
Water 13 02619 g008
Figure 9. Initial and residual concentrations of metals in water samples collected from RTW3.
Water 13 02619 g009
Table 1. Average levels of physical parameters in pond and tailing effluents.
Samples and
Guidelines
Temperature
°C
pH
at 25 °C
EC
µS cm−1
TDS
(mg L−1)
RTW126.22.58262>1000
RTW226.72.50263960
RTW325.03.13226>1000
SANS guidelines<30≥5 to ≤9.7≤170≤1200
WHO guidelines 6.5–9.5600
Table 2. SANS 241-2015 and WHO guidelines of drinking water.
ElementsSANS 241-2015 (Limits for Drinkability)
(µg L−1)
WHO Guidelines [29]
(mg L−1)
Al≤3000.2
Ca 100–300
Cd≤30.003
Co
Cr≤500.05
Cu≤2000
Fe≤20000.5–50
Mg
Mn≤4000.4
Na≤200200
Ni≤700.07
Pb≤100.01
Zn≤5<3
Table 3. Optimum conditions obtained all parameters with initial and final concentrations of Fe2+.
Time
(min)
pHVolume of Fe2+
(mL)
Volume of Ferrate
(mL)
Concentration of Ferrate
(mmol L−1)
303.01555 × 10⁻²
Table 4. Sampling site RTW1.
ElementsInitial Concentrations
(mg L−1)
Residual Concentrations
(mg L−1)
% Removal
Al60.35 ± 0.5015.7773.90
Ca36.66 ± 0.000.10399.72
Cd0.005 ± 0.000.00426.00
Co2.10 ± 0.000.000699.97
Cr0.97 ± 0.000.37061.72
Cu4.74 ± 0.000.03099.40
Fe181.30 ± 0.000.54099.70
Mg28.53 ± 0.000.00100.00
Mn0.590 ± 0.01bdl
Na1.77 ± 0.000.00100.00
Ni4.87 ± 0.010.00100.00
Pb0.002 ± 0.00bdl
Zn6.490 ± 0.000.28095.70
bdl: below the detection limit.
Table 5. Sampling site RTW2.
ElementsInitial Concentrations
(mg L−1)
Residual Concentrations
(mg L−1)
% Removal
Al105.00 ± 0.4016.56084.23
Cabdlbdl
Cdbdlbdl
Co5.16 ± 0.000.01199.78
Cr1.02 ± 0.000.11788.40
Cu1.30 ± 0.000.00799.45
Fe521.40 ± 0.050.08899.98
Mg113.70 ± 0.040100.00
Mn15.48 ± 0.010.002100.00
Na47.07 ± 0.040.00100.00
Ni7.34 ± 0.010.00100.00
Pb0.12 ± 0.00 0.00198.85
Zn10.75 ± 0.000.02499.77
bdl: below the detection limit.
Table 6. Sampling site RTW3.
ElementsInitial Concentrations
(mg L−1)
Residual Concentrations
(mg L−1)
% Removal
Al66.67 ± 0.219.32186.02
Ca
Cd0.003 ± 0.000.00170.00
Co1.929 ± 0.000.01099.48
Cr0.092 ± 0.00bdl
Cu1.159 ± 0.000.00899.32
Fe11.79 ± 0.000.01799.85
Mg104.30 ± 0.030100.00
Mn16.32 ± 0.000.00299.98
Na45.65 ± 0.050100
Ni1.949 ± 0.00bdl
Pb0.014 ± 0.000.002
Zn3.374 ± 0.000.01699.51
bdl: below the detection limit.
Publisher’s Note: MDPI stays neutral with regard to jurisdictional claims in published maps and institutional affiliations.

