Article

Shallow Groundwater Quality Assessment and Its Suitability Analysis for Drinking and Irrigation Purposes

1
Key Laboratory of Groundwater Resources and Environment, Ministry of Education, Jilin University, Changchun 130021, China
2
College of New Energy and Environment, Jilin University, Changchun 130021, China
3
Department of Civil Engineering, College of Engineering, Taif University, Taif 21944, Saudi Arabia
4
College of Construction Engineering, Jilin University, Changchun 130026, China
5
State Key Laboratory of Information Engineering in Surveying, Mapping and Remote Sensing (LIESMARS), Wuhan University, Wuhan 430079, China
6
School of Environmental Studies, China University of Geosciences, Wuhan 430074, China
7
Department of Biological Sciences, International Islamic University, Islamabad 44000, Pakistan
8
National Water Research Center, P.O. Box 74, Shubra El-Kheima 13411, Egypt
*
Author to whom correspondence should be addressed.
Submission received: 14 October 2021 / Revised: 16 November 2021 / Accepted: 22 November 2021 / Published: 26 November 2021

Abstract

:
For shallow groundwater, hydrogeochemical processes and quality assessment must be addressed because shallow groundwater is freely available in many parts of the globe. Due to recent anthropogenic activities and environmental changes in Sakrand, Sindh, Pakistan, the groundwater is extremely vulnerable. To provide safe drinking and agricultural water, hydrogeochemical analysis is required. Ninety-five groundwater samples were analyzed using agricultural and drinking indices to determine the hydrogeochemical parameters using multivariate analysis such as Pearson correlations, principal component cluster analysis, as well as Piper diagrams and Gibbs plot for drinking and agricultural indices. An abundance of ions was observed through the statistical summary; however, cations and anions were recorded in the orders Na+ > Ca2+ > Mg2+ > K+ and HCO3 > Cl > SO42− > NO3 > F. The hydrogeochemical process used to quantify the major reactions occurring in the groundwater system showed rock dominance; the Piper diagrams evaluated the water type. A mixed pattern of calcium, magnesium, and chloride ions (Ca2+−Mg2+−Cl type) was observed. Additionally, the ion exchange method showed an excess of bicarbonate ions due to carbonic acid weathering. The water quality index (WQI) resulted 32.6% of groundwater being unsuitable for human consumption; however, the United States Salinity Laboratory (USSL) diagram showed 60% of samples were unsuitable for irrigation due to high salinity and the Wilcox diagram depicted 5% of samples lying in the unsuitable region. Most of the water samples were suitable for drinking; only a few samples were unsafe for drinking purposes for children due to the high hazard index.

1. Introduction

Water is the most basic and critical requirement for human survival. With the increasing expansion of industrialization and urbanization, ensuring the sustainable use of water resources to solve the supply–demand gap remains a global problem [1]. Groundwater has been widely used for drinking, irrigation, and numerous industrial applications across the world as an essential source of water supply [2,3]. Groundwater is widely utilized for drinking and irrigation in Pakistan, particularly in the south [4]. The district’s socioeconomic environment (Shaheed Benazirabad) implies that Sakarand’s people are highly reliant on agriculture for food and money [5], and the majority of the agriculture is dependent on groundwater irrigation [6]. Despite its geological protection, groundwater, like surface water, is susceptible to contamination. Because of the advancement of human activities, industrial and agriculture activities possible sources of groundwater pollution rose in the previous decade [7,8,9,10,11,12]. Agriculture, through erosion and chemical runoff, is a major contributor to the deterioration of surface and groundwater resources [13]. The necessity to produce enough food has a global impact on agricultural techniques such as intensification, which requires more irrigation, and the widespread application of fertilizers and pesticides. Nutrients and pesticides can contaminate surface and groundwater if these activities are not properly managed [14,15]. The generation of trash and its manner of disposal in urban and industrial regions is one of the activities that produces huge amounts of pollutants that will be discovered in the natural environment without appropriate treatment and can reach groundwater [11,16].
Water quality evaluation has become inevitable in water resource management as a result of the increased degradation of water quality in connection to human activities. The most frequent method of assessing water quality was to compare the contents of water quality parameters to their standard levels for a given purpose [17,18,19,20,21]. The hydrochemical properties of groundwater might be used to identify possible changes in groundwater quality by plotting main ion concentrations on various graphical representations, such as a Piper diagram, Gibbs plot, Na-normalization ratio, and so on, and using statistical analysis [2,22]. A water quality index (WQI) is another method for measuring and classifying water quality that is becoming increasingly popular. A WQI has the benefit of utilizing mathematical techniques to convert water quality parameter levels into an indicator score. Numerous organizations and scholars [23,24,25] have created and utilized several multivariate statistical analysis and groundwater numerical modeling to help public authorities manage groundwater remediation water indices to characterize the appropriateness of various uses of water resources [25]. These approaches, including principal component analysis (PCA), cluster analysis (CA), and discriminant analysis, are often used to solve multivariate issues and are broadly used in geology and hydrology.
Shallow groundwater is a popular supply of household water in many Pakistani suburbs and rural regions [26]. However, due to heavy human activity, its quality is declining, potentially harming human health and the ecosystem. Numerous investigations have indicated anthropogenic pollution of groundwater resources in many locations, such as agricultural contamination (As, Ni, pesticides, etc.) found in the groundwater of Multan’s most heavily irrigated regions [27]. In Sialkot, groundwater is highly contaminated with Zn, Fe, and Pb because of leaching from contaminated soil [28], and a similar case was reported in Lower Dir (northern Pakistan), where high levels of Cr, Pb, Cd, Co, and Fe were found in groundwater whose major contributor is the local geology [29]. Baig et al. (2009) assessed the water quality parameters in the Jamshoro area of Pakistan, finding that Na+, K+, and SO42− concentrations were increased due to the semi-arid environment and human interferences (intensive agriculture) [30].
According to Memon et al. (2011) TDS, EC, alkalinity, hardness, and Na+ levels in all three water bodies (dug wells, shallow pumps, and water supply systems) were above the WHO’s acceptable limits. The high concentration of Na+, as well as the high concentration of Iron, was a serious concern in the Thar district’s drilled wells and shallow pumps, particularly in district Badin [31]. Lanjwani et al. (2020) found significant concentrations of main ions such as Ca2+, Mg2+, Na+, Cl, SO42−, and HCO3 in 36 percent of water samples collected from the district of Larkana, Sindh, as well as poor water quality based on WQI, and a polluted index of Pb, Ni, and Cd [32]. In lower southern Sindh, Shahab et al. (2016) observed groundwater pollution with significant concentrations of EC, TDS, Na+, Cl, SO42−, HCO3, As, and Fe [33].
The water quality in Sindh province is deteriorating day by day. Due to rising population density, significant groundwater extraction for agriculture, harsh climatic conditions, and dwindling water tables in Sindh’s Sakrand district, it became critical to analyze the region’s water quality for drinking and irrigation. Thus far, hydrochemical research has not been done yet in the Sakrand area of Sindh to assess water quality for drinking and agricultural purposes. The present study aims to identify the physical and chemical characteristics of groundwater to assess the drinking and agricultural water quality of a small, densely inhabited, agriculturally rich region. This study’s findings would be useful information for managing groundwater resources as well as for seeking an effective approach to address the present health and agricultural issues in Sakrand, Sindh. It may also assist in the implementation of a sound management method in other regions. Furthermore, this study could also provide a reference for several methodologies to reveal hydrogeochemical processes and evaluate groundwater quality.

2. Description of the Study Area

2.1. Study Area

The study area is located in the Sindh province it is the second-most populous province in Pakistan. Sakrand is a town in Sindh province which lies in district Shaheed Benazirabad, previously known as Nawabshah; the location is about 26°8′17″ N 68°16′23″ E; the cross-section and peizomatric map is shown in Figure 1. The elevation of the study area is 25 m (82 ft), the climate is predominantly hot and dry, and the temperature ranges from below 40 °F to above 117 °F. It can be classified an arid subtropical zone, i.e., very cold and dry in winter and very hot, arid, humid, and windy in summer. The summer temperatures can reach 53°C, while winter temperatures can fall as low as 1°C. However, the average annual precipitation varies from 200 mm to 300 mm [34], with the majority occurring during the monsoon season, which occurs in July, August, and September. Wheat and cotton are the most widely farmed crops in the region and are cultivated in Sindh’s delta plain [35].

2.2. Geology and Hydrogeology

Sakrand is in the southern part of the Indus plain; thus, the groundwater resources are from the Indus river. The groundwater along the small strip of the Indus river is usually less saline than other major parts, where the water is generally very saline [33]. Low cropping intensity, canal seepage, and lateral channels produce salinization. Chemical investigation showed about 15% of the studied area is moderately to extremely saline, and saline–alkaline soil accounts for more than 5.5% of the total landmass [36]. The groundwater table ranges from 1.5–12 m and the average depth is 4.53 m. The flow in the upper and middle sections is more south-westerly, while in the middle and lower sections it is more westerly, toward the Indus river. Sand is usually the primary component of a uniform, non-artesian, and transmissive aquifer.

3. Materials and Methods

3.1. Sample Collection and Analysis

Ninty-five groundwater samples were collected from shallow aquifer (<35 m) at Sakrand, Sindh, Pakistan. Groundwater samples were collected, rinsed, washed with 10% HCl solution and tested for the analysis. The bottles were soaked with double-deionized water after being rinsed. Collected samples were examined for drinking and agriculture purposes. Physicochemical characteristics were tested at Pakistan Council of Research in Water Resources, (PCRWR) as follows: pH determined by pH 720 WTW Series meter, electrical conductivity (EC), total dissolved solids (TDS), and temperature were measured by EC-TDS-Temp (RS232C/Meter CON 110 m). Total alkalinity was calculated by using acid titration in samples containing methyl-orange. Titration methods were used for Cl and HCO3; however, a turbidity meter was used to measure the turbidity whereas the major anions such as (NO3) and sulfate (SO42−), were determined by ultraviolet-visible (UV-VIS) spectrophotometer (Analytik Jena, Jena, Germany). A flame photometer (PFP7, Cambridge shire, UK) was used to measure the cations, such as Mg2+, Ca2+, K+, Na+, and Fe.

3.2. Statistical Parameters

Statistical analysis plays an integral role in evaluating the data set for the different operations of data analysis, performed to determine the correlation plots. Statistical techniques using IBM SPSS 20 software’s and the mean values, including minimum, maximum, median percentile, and standard deviation values of the parameters were also determined in box plots. The multivariate analysis was done by principal component analysis (PCA) and cluster analysis (CA) using R-package R v.4. to determine the primary factors that influence groundwater quality and its suitability for drinking and irrigation. PCA [37] is a strong method for examining patterns of correlations between groups of variables. The Golden Software Grapher 18.3 was used for the pictorial representation of the Piper, showing the chemistry of the water samples collected from the study area. The study area map was created by ARC.GIS 10.7.1 for data set interpretation. Additionally, MS Excel 2019 were also used for the U.S. Salinity Laboratory (USSL) and Wilcox diagram. The World Health Organization (WHO) guidelines were used to determine the WQI, and the calculation was carried out using a weighted arithmetic index [3].

3.3. Assessment of Groundwater Quality

3.3.1. For Drinking

The water quality index (WQI) is used for the checking of the suitability of water for drinking purposes. The most comprehensive method for determining the quality of groundwater is water quality assessment; thus, WHO standards were used to assess groundwater quality. The aggregate effects of various chemical parameters on groundwater were checked thoroughly [38].
WQI is calculated in three steps; the weight assessment was done in the first step. Weight is represented as wi for all parameters. The parameters were (EC, pH, TDS, HCO3, Cl, SO42−, Ca2+, Mg2+, Na+, K+, NO3, F, Fe, As) in order of their relative weight importance. Overall assessment for quality was carried out. While evaluating the quality of groundwater, weights were assigned between 1 to 5, based on the importance of their role [39].
In step number two, the relative weights were calculated for each parameter using Equation (1).
W i = w i i n w i
Here, relative weight is W i and the weight of each parameter is wi while n is the total number of parameters studied.
The quality rating scale q i is computed in step number three for each parameter using Equation (2).
q i = C i S i × 100
Hence, C i represents the concentration of each parameter (mg/L); S i is the standard of WHO Table 1, and q i is the quality index [40].
Furthermore, summation of sub-indexes is done by following Equations (3) and (4).
SI i = W i × q i
WQI = i = 1 n SI i
SIi and Wi are sub-indexes and relative weights for the ith parameter, respectively; qi, on the other hand, is a rating based on the ith parameter’s concentration.

3.3.2. For Irrigation

The typical indicators for assessing groundwater for irrigation—sodium absorption ratio (SAR), soluble sodium percentage (SSP), permeability index (PI), magnesium ratio (MAR), and Kelley’s ratio (KR) were computed.
(a)
Sodium Adsorption Ratio (SAR)
The suitability indicator for water irrigation is the sodium adsorption ratio (SAR). In addition to the indication, it also checks on the chances of sodium hazard of the collected irrigation water [41] and is calculated by Equation (5).
SAR = Na + Ca 2 + + Mg 2 + 2
(b)
Soluble Sodium Percentage (SSP)
The Soluble Sodium Percent (SSP) for groundwater was calculated by Equation (6).
SSP = 100 × ( K + + Na + ) Ca 2 + + Na + + Mg 2 + + K +
(c)
Permeability Index (PI)
Groundwater suitability for irrigation may also be determined by using the (PI), which is calculated employing Equation (7).
PI = Na + + HCO 3 Ca 2 + + Mg 2 + + Na + × 100
(d)
Magnesium Ratio (MAR)
The extra or excess amount of magnesium over magnesium and calcium is known as MAR. If the magnesium is present in excess in the soil, it disastrously affects the quality of the soil. If the hazard value of magnesium increases up to 50%, it adversely affects the quality of soil, and the soil becomes more alkaline. This alkalinity directly affects crop yields [42]. The magnesium ratio was calculated by Equation (8).
MAR = Mg 2 + Mg 2 + + Ca 2 + × 100
(e)
Kelly Ratio (KR)
Kelly proposed another crucial factor to calculate groundwater appropriateness for irrigation, known as the Kelly ratio (KR), which is calculated by Equation (9). If the value of (KR) is greater than 1 it refers to a surplus of sodium in groundwater, and if it is less than 1 it shows fitness of groundwater for irrigation.
KR = Na + Mg 2 + + Ca 2 +  

3.4. Health Risk Assessment

Health risk assessment generally refers to the process in which there is an estimation and calculation of deleterious effects on human health. These adverse effects may be due to contaminations to which humans are being exposed. Specifically, contaminants in water severely impact human health; thus, the physical, biological, and chemical pollution of water causes serious health issues [43]. Generally, humans are exposed to water contaminants by domestic usage of water through direct consumption or indirect uptake during a bath, etc. Some water vapors are inhaled, and this is another pathway for the uptake of contaminants of water [44,45].
Pakistan is one of the developing countries in Asia facing different health issues due to poor water quality. The Pakistan Council of Research Water Resources (PCRWR) reported in 2008 that about 40% of illnesses in Pakistan are due to the drinking of contaminated water and 20–40% of hospitalizations are because of various water-borne diseases [46].
The United States Environmental Protection Agency (USEPA) devised a risk assessment process for human health. There are four steps for HRR assessment [47]. (1) Identification of hazards, (2) Assessment for the dose-response, (3) Assessment for exposure, (4) Characterization of risk. The for-mulas separately calculate the risk for children and adults by Equation (10)
CDI = C w × IR × EF × ED BW × AT
CDI is the abbreviation for Chronic Daily Intake. Its units are mg/kg/day. Other symbols are explained and elaborated in Table 2.
The hazard quotient (HQ) calculated by Equation (11) to determine the rate of noncarcinogenic risk in adults and children.
HQ = HI = CDI RfD
Here RfD stands for reference dose of a specific element specified in this study; these elements are Fe and As (mg/kg/day).
The value of RfD for arsenic metal is 0.0003 and for iron is 0.7. To calculate the carcinogenic risk for the carcinogenic contaminants we use Equation (12).
CR = CDI × SF
SF stands for slope factor. If the value of HQ exceeds 1 and that of CR exceeds 1 × 10⁶ then the risk is dangerous, and there is a need for working on reducing this risk.

4. Results and Discussion

4.1. Hydrochemical Parameters of Groundwater

The prime qualities are the physicochemical parameters for identifying the quality, nature, and type of groundwater [48]. This study used statistical analysis to better display the vast data set, revealing the minimum, maximum, mean, median, standard deviation, and percentiles shown in Table 3, with the associated box plot given in Figure 2. The summary of the physicochemical parameters and the hydrochemical properties of groundwater have been statistically evaluated, and the findings compared with World Health Organization standards.
Hence the 17 parameters were being observed for about ninety-five samples, EC ranged from a minimum of about 470 to a maximum value of 7086, with a mean value of 1829.57, which falls beyond of WHO’s recommended range. The results showing an increase in EC may be due to the dissolution of minerals present in groundwater; this dissolution may be through water–rock interaction [48].
The pH ranged from 6.5 to 8.1, with a mean of 7.17, indicating that the groundwater is neutral to slightly alkaline. Turbidity values are within the range determined by WHO standard. This indicates that the wells are well built and not so shallow [49]. TDS consists of calcium, bicarbonates, chlorides, magnesium, sulfates, and potassium, which are inorganic salts dissolved in groundwater [50]. Hardness is a general result of the addition of polyvalent ions, more specifically calcium and magnesium ions. The concentration of anions can be written as HCO3 > Cl > SO42 > NO3 >F. Similarly, the concentrations of the cation are in the order Na+ > Ca2+ > Mg2+ > K+. Groundwater classification based on TDS and EC is shown in Table 4.
Thus, by analysis of groundwater based on TDS and EC, the following results were observed. According to EC (μS/cm), from 95 samples studied, no any sample found to be excellent, however 3% samples found in good, 67% of samples were permissible, 19% of samples were not suitable for usage or may be harmful and 11% of the samples were toxic and hazardous for consumption. Similarly, based on TDS (mg/L), about 13% of samples were most appropriate for drinking, 36% of samples were permissible to drink, about 49% of samples were useful for irrigation, and 2% were not suitable for use in either drinking or irrigation.

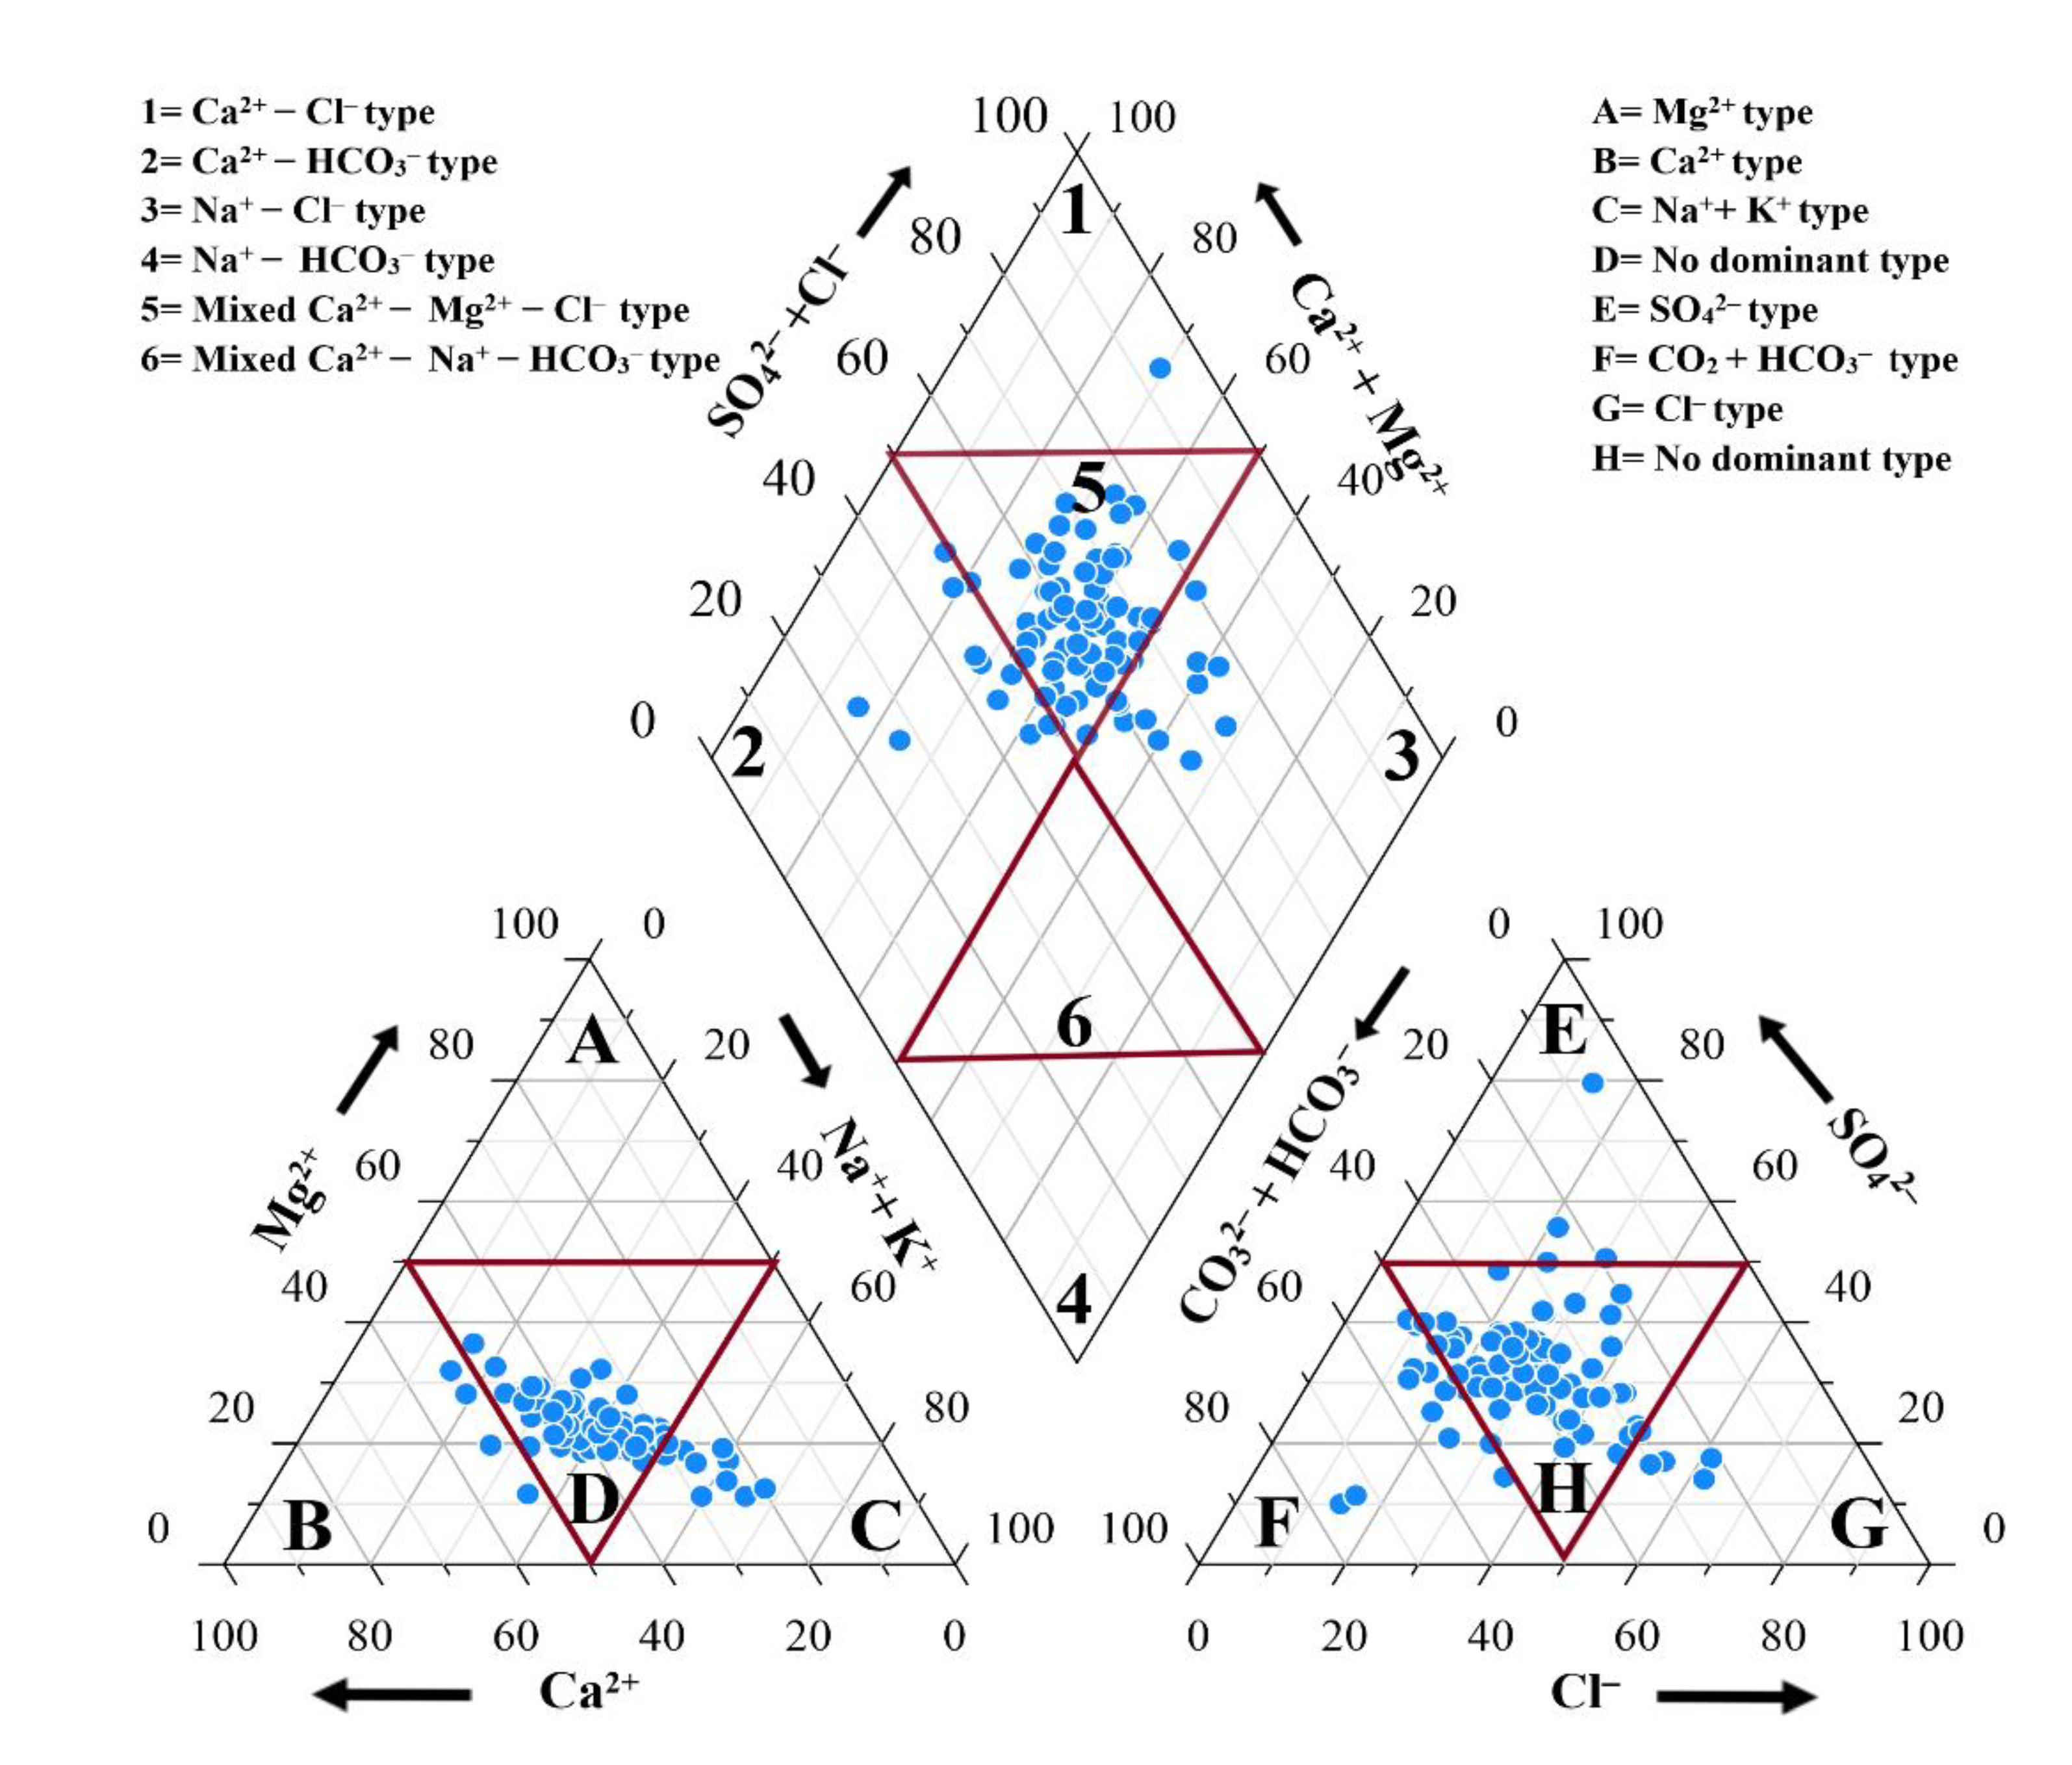
4.2. Hydrogeochemical Facies

The Piper plot shows water chemistry and investigates groundwater hydrogeochemical composition. The different combinations of ions show the samples’ dominant water chemistry under observation [51]. The diamond graph is distributed into 6 regions, as shown in Figure 3, and resulted in the majority of the samples (about 60%) lying in the 5th region of the graph, which is a mixture of calcium, magnesium, and chloride ions ( Ca 2 + Mg 2 + Cl type). About 30% of the samples showed the dominant Na + Cl type and about 10% of the samples showed chemistry of the Ca 2 + HCO 3 type. One sample was in the Ca2+–Cl type region. Most of the anions and cations showed no dominant types, but some samples in the cations showed dominance in Na+-K+ type and anions, and some samples showed observant chemistry of the types HCO3 and Cl; however, no points fell in zone A. The study revealed the area affected by ion exchange and weathering of silicate. The groundwater samples, implying that weathering of carbonate minerals is an influencing factor for groundwater hydrogeochemical composition.

4.3. Hydrogeochemical Evolutional Processes

4.3.1. Formation Mechanism of Groundwater Chemistry

The major geochemical process used to control the hydrogeochemical characteristics of groundwater in an aquifer is represented by the Gibbs diagram. It is an efficient tool that Gibbs, in 1970, proposed for understanding the mechanism of aquifer chemistry. A Gibbs diagram demonstrates the ionic composition of samples of groundwater; the y-axis contains TDS values, and the x-axis has Na+/(Ca2+ + Na+) and Cl/(HCO3 + Cl) respectively. Microsoft Excel 2019 was used to draw the Gibbs diagram for determining and analyzing the relationship between lithology and hydrochemistry in aquifers.
Rock dominance, precipitation dominance, and evaporation dominance are associated with groundwater characteristics [52]. The Gibbs diagram is shown in Figure 4 and indicates that rock dominance impacted most groundwater samples. Rock dominance is the erosion, transportation, and weather to the groundwater table from the parent rock. Dissolvable salts and minerals become absorbed and assimilated into groundwater. The Gibbs plot also shows the falling of some samples in the evaporation dominance zone; thus, the intense and strong evaporation in the alluvial plain is due to the shallow groundwater depth. Shallow and deep water depths are typically the reasons for evaporation dominance [53].

4.3.2. Silicate Weathering

Silicate weathering is also important for influencing groundwater ion chemistry [38,54]. Source analysis of major ions in groundwater was conducted using ion-ratio maps (Figure 5). It contributes a lot to major ion chemistry and degradation of silicates, and its incongruence makes it difficult to quantify. This yields dissolved species with various other solid phases, mostly clays. Silicate weathering produces sodium by dissolution of halite Equation (13) and Equation (14), the most abundant cation in the study region is sodium. Figure 5a shows a graph between sodium and calcium. In reverse ion exchange, sodium ions are being reduced while forward ion-exchange sodium ions are added to the water [55]. Figure 5b is a graph between Na+/Cl (meq/L), and EC values indicate that the ratio of Na+/Cl, which is greater than 1, means that silicate weathering was the procedure for the derivation of Na+ ions. As shown in Figure 5b, almost 90% of the sample has a Na+/Cl ratio greater than 1, which shows the production of Na+ ions in water due to forward ion-exchange occurrence. It is a predominant factor that the forward ion exchange sodium ions are released in water, which further testifies that the cations are present in order Na+ > Ca2+ > Mg2+ > K+. Figure 5c is a scatter plot between calcium and bicarbonate in mg/L. The Ca2+ and HCO3 scatter plot was used to investigate the dissolution of carbonate minerals; the results reveal that carbonic acid (Silicate) weathering, rather than calcite dissolution, plays a substantial role in releasing the second main cation calcium into the water. Similarly, Figure 5d shows a scatter plot between calcium and sulfate ions. Anhydrite or gypsum dissolution is common, which indicates a relatively higher concentration of sulfate [56,57].
Na + Cl Na + + Cl
2 NaAlSi 3 O 8 + 2 CO 2 + 11 H 2 O Al 2 Si 2 O 5 ( OH ) 4 + 4 H 4 SiO 4 + 2 Na + + 2 HCO 3
Furthermore, Figure 6a indicates that the major Na+ ions in water are released by the forward ion-exchange method. Similarly, Figure 6b indicates that silicate weathering rather than carbonate mineral dissolution was used to release calcium and magnesium ions.

4.4. Major Ion Sources and Hydrogeochemical Evolution

4.4.1. Ion Exchange

To investigate and characterize the source of ions in water samples, chloro-alkaline indices (CAI) were used. The exchange of Na+ and K+ from water with Mg2+ and Ca2+ indicated the CAI is positive and, similarly, the exchange of magnesium and calcium from the water with sodium and potassium is indicated by the negative CAI [58]. The positive CAI-1 and CAI-2 are known as direct or reverse ion exchange and the negative indices show indirect or forward ion exchange [59]. In the given samples, CAI–1 and CAI–2 indices were calculated, and most of the indices were negative, as shown in the Figure 7. This indicates forward ion exchange. The formulae are given as in Equation (15) and Equation (16).
CAI 1 = Cl Na + + K + Cl
CAI 2 = Cl Na + + K + SO 4 2 + HCO 3 + CO 3 2 + NO 3

4.4.2. Correlation Analysis

Pearson correlation is a useful method for expressing the relationship between several hydrogeochemical and physiochemical characteristics in groundwater. A coefficient of correlation matrix of 17 parameters and samples (n = 95) was calculated using IBM SPSS Statistic 20. The parameters were analyzed the samples showing r > 0.5 were considered to be positive with moderate correlation while r > 0.9 represented strong positive correlation. The 2-tailed Pearson correlation test was carried out to find the significance level.
According to the Pearson correlation coefficient matrix (Table 5), the EC was positively correlated with TH, Cl, SO42−, Na+, NO3, F (r >0.5). This suggests that the salinity of groundwater is influenced by the key components and that the trends among them follow a similar pattern. Similarly, there was a strong correlation of TH with Cl, SO42−, Na+ (r > 0.9) and a moderate correlation with, K+, NO3, F, Fe (r > 0.5). However, HCO3 correlation exists with Cl and Na+ (r = 0.52), which demonstrates Na+ origin from silicate weathering [53]. The main exchangeable ions, Na+, K+, Ca+ and Na+, K+, Mg+, were also found to have a positive correlation. As a result, the simultaneous rise or reduction in cations is mostly due to dissolution/precipitation reactions and concentration effects. The very strong correlation of Cl with SO42−, Na+, and SO42− with Na+ (r > 0.9) indicates that high salinity occurs in the area as a result of excessive fertilizer use and salt leaching from irrigation water return flow. It is also possible that the sulfate deposition in aquifer water was caused by fertilizer application and organic matter degradation. However, there is no statistically significant association between pH with the other factors in the region. These connections represented the ions’ major contributions to groundwater totals and revealed significant effects.

4.4.3. Multivariate Analysis

Multivariate statistical approaches have been extensively employed to help solve environmental issues and comprehend natural and human processes [37,60]. In order to pull relevant information from water-quality data, correlation analysis, principal component analysis, and hierarchical cluster analysis have been widely employed. Multivariate statistical methods have been widely used to understand mechanism of environmental issues and comprehend natural and anthropogenic processes, thus principal component analysis (PCA) and hierarchical cluster analysis (HCA) have been widely used to investigate the mechanism of hydro-geochemistry.
Principal component analysis (PCA) was performed on the groundwater dataset for additional statistical validation (Table 6). A PCA plot is a powerful recognition method that represents sample characteristics and parameter distribution, as well as the source of contamination [25,60]. All four components explain 65.74% of the total cumulative variance. The variations described related to the chemical parameter loadings are categorized as strong, (>0.75), moderate (0.75 to 0.50), and weak (0.50 to 0.30). PCA with Varimax normalization was used to study the intercorrelation of physicochemical properties. The PCA resulted of four components, each with its own variance and eigenvalues; i.e., 42.67% and 7.25% for factor 1, 8.25%, and 1.4% for factor 2, 7.56% and 1.29% for factor 3, and 7.26% and 1.23 for factor 4, respectively.
The first factor, F1, explained 42.67% of the total variance and exhibited significant positive EC and total hardness HCO3, Cl, Na+, which showed anthropogenic contamination sources from industrial effluents such as Cl, Na+, SO42−, K+, NO3 and other parameters. Thus, agricultural activities are indicated as a contributing process and may be obtained by gypsum and calcium-bearing minerals dissolution [61]. The sources of NO3 include onsite sanitation, municipal waste, and nutrient pollution caused by surrounding agricultural activities that have been going on for a long time [62]. Gypsum and calcium-rich minerals, perhaps the main sources of Ca2+, SO42−, and HCO3, are dissolving into the water [63].
F2 describes 8.25% of the variability and significant correlation between mg+ and HCO3, while further variables have loadings with modest positive and negative values. The most prevalent sinks for secondary salts in soil include chemical weathering, leaching, secondary salt dissolution in pore spaces, agricultural effluents, plants, and clays. It implies that both F1 and F2 may reflect the impacts of lowering variables, hence F1 and F2 are included in the PCA score plot (Figure 8). Factor 3 and Factor 4 account for 7.5% and 7.26% respectively, of the overall variation; thus, extreme negative values suggest areas not affected by the process.
CA Cluster analysis (CA) is an important multivariate statistical technique often used to better organize complex water data into various clusters [64]. Ward’s method, which often calculates the squared Euclidean distance between the water variable for the similarity index, was applied. All groundwater samples from the three clusters were assigned to the factors based on their PCA factor scores to show the relative relevance of factors in various clusters [65]. In this study (n = 95) of groundwater samples, 48 contained C1, while 37 samples contained C2, and 10 samples contained in C3. The findings of the water study revealed that the majority of the samples were classed as Cluster-I, which reveals the hardness, Na+, K+ and HCO3, Cl, SO42−, NO3 concentration, and other chemical characteristics, showing a high sensitivity to industrial, irrigational, and overabundant agricultural activities. Cluster II was linked to the highest average Mg2+ and HCO3 due to the dissolution of gypsum, as well as the interaction of water and rock. The source of HCO3 might be from industrial waste water and sulfate fertilizer contaminating the groundwater. Various clusters’ prominent characteristics are shown in Figure 9; samples are plotted in both negative and positive direction as shown by Cluster-I, which indicates that they are affected by both lithological and silicate weathering factors. Compared to Cluster-II, Cluster-III samples are more likely to be plotted in the positive direction, which indicates the dissolved minerals, including Fe2+, are released in the aquifer by dissolution due to high acidity.

4.5. Groundwater Suitability Evaluation

Groundwater suitability for drinking and other uses is determined using hydrochemical analysis data.

4.5.1. Water Quality Assessment for Drinking Purpose

The selected samples of water used the WQI to addressing overall groundwater quality [66]. Relative weights were calculated as shown in Table 7, where the classification of drinking water is computed. WQI values are divided into five groups: (i) excellent <50, (ii) good >50, (iii) poor >100, (iv) very poor >200, and (v) water unsuitable for drinking >300, as shown in Table 7.

4.5.2. Groundwater Suitability for Irrigation Purpose

SAR or the alkali hazard index are useful tools for determining the suitability of groundwater for irrigation. Wilcox and USSL diagrams are common indices for assessing groundwater suitability for irrigation. Sodium absorption ratio (SAR), Na %, permeability index (PI), Magnesium Ratio (MAR), and Kelley’s ratio (KR) were computed and are shown in Table 8.
Higher salinity decreases osmotic activity by preventing water from reaching plant branches and leaves, resulting in lower yield. Groundwater is classified by SAR as low (SAR < 10), medium (10 < SAR_18), high (18 < SAR_26), and very high (SAR > 26) sodium hazard. Sodium salinity hazard is due to higher SAR values, which reduce the availability of soil water, which in turn affects crop growth and reduces the ratio of magnesium and calcium nutrients. The increased salt absorption in the research area can be linked to clay minerals and the survival of a variety of other rock types. The most likely cause of an increased sodium concentration in water is some kind of lithological source that causes the suspension of such minerals. A high quantity of sodium in water may also be caused by the use of agrochemicals in agricultural activities. High salt content in soil has disastrous effects on soil structure, infiltration, and aeration, and a higher sodium percentage may also decrease flocculation and weaken the permeability and tilth of the soil [67,68].
Salinity hazards are classified as very high salinity water (C4), high salinity water (C3), medium salinity water (C2), and low salinity water (C1). However alkalinity hazards are divided into four categories: very high sodium water (S4), high sodium water (S3), medium sodium water (S2), and low sodium water (S1). However, SAR was employed as an alkalinity hazard, while EC was used as a salinity hazard. Figure 10 show the USSL diagram, wherein most samples lie in the region from C2S2 to C2S4 and C3S2 to C3S4 whereas six samples lie in C2S1 and three sample in C3S1, which is suitable for irrigation with minimal Na+ exchange [69]. However, one sample lies in C4S2 and one sample C4S3, four samples in C4S4, and all these samples show very high salinity and medium to very high alkalinity and cannot not used for irrigation [53]. Thus, 60% fall in C3 and C4, which show the highest salinity and medium to high sodium hazard, and cannot be used for irrigation purpose, because the water under these regions is not suitable for any agricultural activity [70]. About (40%) of the samples lie in these regions, restricting them use in irrigation.
The sodium percentage (Na%) also indicates suitability of the water for irrigation purposes [71]. To explore the water samples for irrigation, the Wilcox diagram formed is shown in Figure 11. Different samples laid in different fields excellent to good, good to permissible, permitted to doubtful, doubtful to inappropriate, and finally unsuitable the classifications for these fields [72,73]. The Wilcox diagram observed that almost 50% of the samples are acceptable to use for irrigation, about 25% of the sample lie in permissible to doubtful region, about 20% sample lies in the doubtful to unsuitable to be used for irrigation field, and 5% samples lie in the unsuitable region, meaning they cannot be used for irrigation due to the adverse effects they may cause.

4.6. Health Risk Analysis

Arsenic and iron in groundwater samples were assessed for non-carcinogenic health risks as stated above [74,75]. As a first step, CDI was calculated for both adults and children and As and Fe metals. Later, using these CDI values, the hazard quotient (HQ) [76,77] was calculated for both adults and children and As and Fe metals. The values of hazard quotient in As for children from 0 to 0.000667 and average value 0.000107. Similarly, for adults, the hazard quotient value in arsenic ranged from 0 to 0.000286 with an average value of 4.57 × 10 5 . For iron, the hazard quotient values in children ranged from 0 to 0.395, with an average value of 0.00815, and in adults, these values ranged from 0 to 0.01229, with an average value of 0.001873. All these values are shown in Table 9.
These obtained calculations for each sample were observed for chronic risk. As explained previously, the samples with a hazard quotient greater than 1 were thought to show a chronic risk rate and need for treatment [78]. In the obtained samples, the hazard indices for As and Fe in adults were both below 1 and showed negligible to low chronic risk. In other words, almost 100% of water samples were suitable for health rate assessment in adults. Moreover, in children, about 20% of the As samples exceeded the range of HQ that is 1, but Fe metals had HQ values within the permissible range [79]. Hence about 100% of groundwater samples being examined showed no health risk in adults and almost 80% showed no health risk in children, as detailed in Table 10.

5. Conclusions

Groundwater analysis is being done using different methods and techniques to evaluate the usability of groundwater for irrigation and drinking purposes. The water quality index, Gibbs and Pipers plots, Wilcox, USSL diagram, health risk assessment, ion exchange, and multivariate analysis were used to demonstrate whether the water samples from the region Sakrand, Sindh are safe for human use. The result of following the abundance of ions indicated the cations were in the order Na+ > Ca2+ > Mg2+ > K+ and the abundance of anions was in the order HCO3 > Cl > SO42− > NO3 > F. In the research, the concentration of sodium and bicarbonate ions represents the phenomenon of silicate weathering, which is the control to major ions chemistry of groundwater. The eminent factor to study the quality of groundwater samples for drinking by the WQI, according to which about 67.4% of samples were found to be excellent and good for drinking and the rest, 32.6%, were not drinkable. The Gibbs diagram of the study region showed rock dominance due to dissolvable salts and minerals becoming absorbed and assimilated with groundwater. Furthermore, the Piper diagram showed no dominant ions but some samples in cations showed dominance in Na+–K+ type and anions, and some samples showed an observant chemistry of the type HCO3 and Cl. Overall, most (about 60%) of the samples laid in the 5th region of the graph, which was a mixture of calcium, magnesium, and chloride ions (Ca2+ − Mg2+ – Cl type). The dominant cation was sodium, and the dominant anion was bicarbonate. The ion exchange method showed that forward ion exchange was dominant. Multivariate analysis statistically proved the relation between different variables and their hydrogeochemistry in the groundwater. Similarly, with the sole purpose of the evaluation of the water samples for irrigation purposes, investigated by agricultural indices, showed a high salinity hazard using the USSL diagram. Further investigation on irrigation sampling resulted in 60% of the sample showing medium to high salinity and low alkalinity hazards. However, the Wilcox diagram indicated that most of the samples were good to permissible for irrigation purposes. Overall, health risk rates were determined in the region and only 20 samples were found to be risky for children. Other than that, all samples were suitable for both children and adults.

Author Contributions

Writing—original draft; M.Y.J.B. and W.Z.; Conceptualization; M.Y.J.B. and W.Z.; J.C.; methodology; M.Y.J.B., J.C. and S.L.; software; M.Y.J.B., E.E.H. and M.A.; formal analysis; G.R., M.Y.J.B. and M.A.; investigation; M.Y.J.B., M.A., M.M. and J.I.; resources; W.Z.; data curation; M.Y.J.B., S.A.T. and J.I.; review and editing; W.Z., E.E.H. and A.T.; visualization; E.E.H., M.A. and A.T.; supervision; W.Z. All authors have read and agreed to the published version of the manuscript.

Funding

This research was funded by [Taif University Researchers Supporting Project] grant number [TURSP-2020/324].

Institutional Review Board Statement

Not applicable.

Informed Consent Statement

Not applicable.

Data Availability Statement

The data presented in this study are available on request from the first or corresponding authors.

Acknowledgments

Authors would like to acknowledge the financial support provided from Taif University Researchers Supporting Project Number [TURSP-2020/324].

Conflicts of Interest

The authors declare no conflict of interest.

References

  1. Slukovskii, Z.; Dauvalter, V.; Guzeva, A.; Denisov, D.; Cherepanov, A.; Siroezhko, E. The hydrochemistry and recent sediment geochemistry of small lakes of Murmansk, Arctic Zone of Russia. Water 2020, 12, 1130. [Google Scholar] [CrossRef] [Green Version]
  2. Egbi, C.D.; Anornu, G.; Appiah-Adjei, E.K.; Ganyaglo, S.Y.; Dampare, S.B. Evaluation of water quality using hydrochemistry, stable isotopes, and water quality indices in the Lower Volta River Basin of Ghana. Environ. Develop. Sustain. 2019, 21, 3033–3063. [Google Scholar] [CrossRef]
  3. Qu, B.; Zhang, Y.; Kang, S.; Sillanpää, M. Water quality in the Tibetan Plateau: Major ions and trace elements in rivers of the “Water Tower of Asia”. Sci. Total Environ. 2019, 649, 571–581. [Google Scholar] [CrossRef] [PubMed]
  4. Qureshi, A.S.; Shah, T.; Akhtar, M. The Groundwater Economy of Pakistan; IWMI: Lahore, Pakistan, 2003; Volume 64. [Google Scholar]
  5. Memon, S.A.; Sheikh, I.A.; Talpur, M.A.; Mangrio, M.A. Impact of deficit irrigation strategies on winter wheat in semi-arid climate of sindh. Agric. Water Manag. 2021, 243, 106389. [Google Scholar] [CrossRef]
  6. Soomro, A.; Memon, A.; Gadehi, M.; No, E.-S.B. Use of groundwater for agricultural production in Deh Desvi of Thano Boola Khan, Jamshoro, Sindh. Pak. J. Agric. Agril. Engg. Vet. Sci 2010, 26, 60–69. [Google Scholar]
  7. Buschmann, J.; Berg, M.; Stengel, C.; Winkel, L.; Sampson, M.L.; Trang, P.T.; Viet, P.H. Contamination of drinking water resources in the Mekong delta floodplains: Arsenic and other trace metals pose serious health risks to population. Environ. Int. 2008, 34, 756–764. [Google Scholar] [CrossRef] [PubMed]
  8. Chauhan, V.S.; Nickson, R.; Chauhan, D.; Iyengar, L.; Sankararamakrishnan, N. Ground water geochemistry of Ballia district, Uttar Pradesh, India and mechanism of arsenic release. Chemosphere 2009, 75, 83–91. [Google Scholar] [CrossRef] [PubMed]
  9. Daud, M.; Nafees, M.; Ali, S.; Rizwan, M.; Bajwa, R.A.; Shakoor, M.B.; Arshad, M.U.; Chatha, S.A.S.; Deeba, F.; Murad, W. Drinking water quality status and contamination in Pakistan. BioMed Res. Int. 2017, 2017. [Google Scholar] [CrossRef] [PubMed]
  10. Baloch, M.Y.J.; Talpur, S.A.; Talpur, H.A.; Iqbal, J.; Mangi, S.H.; Memon, S.J.J.o.W.; Technology, E. Effects of Arsenic Toxicity on the Environment and Its Remediation Techniques: A Review. J. Water Environ. Technol. 2020, 18, 275–289. [Google Scholar] [CrossRef]
  11. Hussein, E.E.; Fouad, M.; Gad, M.I.J.A.w.s. Prediction of the pollutants movements from the polluted industrial zone in 10th of Ramadan city to the Quaternary aquifer. Appl. Water Sci. 2019, 9, 20. [Google Scholar] [CrossRef] [Green Version]
  12. Hu, P.; Sharifi, A.; Tahir, M.N.; Tariq, A.; Zhang, L.; Mumtaz, F.; Shah, S.H.I.A. Evaluation of Vegetation Indices and Phenological Metrics Using Time-Series MODIS Data for Monitoring Vegetation Change in Punjab, Pakistan. Water 2021, 13, 2550. [Google Scholar] [CrossRef]
  13. Qiao, B.; Wang, J.; Huang, L.; Zhu, L. Characteristics and seasonal variations in the hydrochemistry of the Tangra Yumco basin, central Tibetan Plateau, and responses to the Indian summer monsoon. Environ. Earth Sci. 2017, 76, 162. [Google Scholar] [CrossRef]
  14. Crosa, G.; Froebrich, J.; Nikolayenko, V.; Stefani, F.; Galli, P.; Calamari, D. Spatial and seasonal variations in the water quality of the Amu Darya River (Central Asia). Water Res. 2006, 40, 2237–2245. [Google Scholar] [CrossRef]
  15. Hildebrandt, A.; Guillamón, M.; Lacorte, S.; Tauler, R.; Barceló, D. Impact of pesticides used in agriculture and vineyards to surface and groundwater quality (North Spain). Water Res. 2008, 42, 3315–3326. [Google Scholar] [CrossRef] [PubMed]
  16. Shah, S.H.I.A.; Yan, J.; Ullah, I.; Aslam, B.; Tariq, A.; Zhang, L.; Mumtaz, F. Classification of Aquifer Vulnerability by Using the DRASTIC Index and Geo-Electrical Techniques. Water 2021, 13, 2144. [Google Scholar] [CrossRef]
  17. Bawoke, G.T.; Anteneh, Z.L. Spatial assessment and appraisal of groundwater suitability for drinking consumption in Andasa watershed using water quality index (WQI) and GIS techniques: Blue Nile Basin, Northwestern Ethiopia. Cogent Eng. 2020, 7, 1748950. [Google Scholar] [CrossRef]
  18. Cao, X.; Lu, Y.; Wang, C.; Zhang, M.; Yuan, J.; Zhang, A.; Song, S.; Baninla, Y.; Khan, K.; Wang, Y. Hydrogeochemistry and quality of surface water and groundwater in the drinking water source area of an urbanizing region. Ecotoxicol. Environ. Safety 2019, 186, 109628. [Google Scholar] [CrossRef] [PubMed]
  19. Gupta, S.D.; Mukherjee, A.; Bhattacharya, J.; Bhattacharya, A. An overview of agricultural pollutants and organic contaminants in groundwater of India. Groundwater South Asia 2018, 247–255. [Google Scholar]
  20. Pacheco Castro, R.; Pacheco Ávila, J.; Ye, M.; Cabrera Sansores, A. Groundwater quality: Analysis of its temporal and spatial variability in a karst aquifer. Groundwater 2018, 56, 62–72. [Google Scholar] [CrossRef] [PubMed]
  21. Zhang, Q.; Xu, P.; Qian, H. Groundwater quality assessment using improved water quality index (WQI) and human health risk (HHR) evaluation in a semi-arid region of northwest China. Expo. Health 2020, 1–14. [Google Scholar] [CrossRef]
  22. Tariq, A.; Shu, H.; Kuriqi, A.; Siddiqui, S.; Gagnon, A.S.; Lu, L.; Linh, N.T.T.; Pham, Q.B. Characterization of the 2014 Indus River Flood Using Hydraulic Simulations and Satellite Images. Remote Sens. 2021, 13, 2053. [Google Scholar] [CrossRef]
  23. Wang, J.; Liu, G.; Liu, H.; Lam, P.K. Multivariate statistical evaluation of dissolved trace elements and a water quality assessment in the middle reaches of Huaihe River, Anhui, China. Sci. Total Environ. 2017, 583, 421–431. [Google Scholar] [CrossRef] [PubMed]
  24. Xiao, J.; Wang, L.; Deng, L.; Jin, Z. Characteristics, sources, water quality and health risk assessment of trace elements in river water and well water in the Chinese Loess Plateau. Sci. Total Environ. 2019, 650, 2004–2012. [Google Scholar] [CrossRef]
  25. Colombo, L.; Alberti, L.; Azzellino, A.; Marina, B. Multi-methodological integrated approach for the assessment of Diffuse Pollution Background Levels (DPBLs) in Functional Urban Areas: The PCE case in Milano NW sector. Front. Environ. Sci. 2020. [Google Scholar] [CrossRef]
  26. Tariq, M.I.; Afzal, S.; Hussain, I. Degradation and persistence of cotton pesticides in sandy loam soils from Punjab, Pakistan. Environ. Res. 2006, 100, 184–196. [Google Scholar] [CrossRef] [PubMed]
  27. Tariq, S.R.; Shaheen, N.; Khalique, A.; Shah, M.H. Distribution, correlation, and source apportionment of selected metals in tannery effluents, related soils, and groundwater—A case study from Multan, Pakistan. Environ. Monit. Assess. 2010, 166, 303–312. [Google Scholar] [CrossRef] [PubMed]
  28. Ullah, R.; Malik, R.N.; Qadir, A. Assessment of groundwater contamination in an industrial city, Sialkot, Pakistan. Afr. J. Environ. Sci. Technol. 2009, 3, 429–446. [Google Scholar]
  29. Rashid, A.; Khan, S.; Ayub, M.; Sardar, T.; Jehan, S.; Zahir, S.; Khan, M.S.; Muhammad, J.; Khan, R.; Ali, A. Mapping human health risk from exposure to potential toxic metal contamination in groundwater of Lower Dir, Pakistan: Application of multivariate and geographical information system. Chemosphere 2019, 225, 785–795. [Google Scholar] [CrossRef]
  30. Baig, J.A.; Kazi, T.G.; Arain, M.B.; Afridi, H.I.; Kandhro, G.A.; Sarfraz, R.A.; Jamal, M.K.; Shah, A.Q. Evaluation of arsenic and other physico-chemical parameters of surface and ground water of Jamshoro, Pakistan. J. Hazard. Mater. 2009, 166, 662–669. [Google Scholar] [CrossRef] [PubMed]
  31. Memon, M.; Soomro, M.S.; Akhtar, M.S.; Memon, K.S. Drinking water quality assessment in Southern Sindh (Pakistan). Environ. Monitor. Assess. 2011, 177, 39–50. [Google Scholar] [CrossRef]
  32. Lanjwani, M.F.; Khuhawar, M.Y.; Jahangir Khuhawar, T.M. Assessment of groundwater quality for drinking and irrigation uses in taluka Ratodero, district Larkana, Sindh, Pakistan. Int. J. Environ. Anal. Chem. 2020, 100, 1–24. [Google Scholar] [CrossRef]
  33. Shahab, A.; Shihua, Q.; Rashid, A.; Hasan, F.U.; Sohail, M.T. Evaluation of Water Quality for Drinking and Agricultural Suitability in the Lower Indus Plain in Sindh Province, Pakistan. Pol. J. Environ. Stud. 2016, 25, 2563–2574. [Google Scholar] [CrossRef]
  34. Salma, S.; Rehman, S.; Shah, M. Rainfall trends in different climate zones of Pakistan. Pak. J. Meteorol. 2012, 9, 47. [Google Scholar]
  35. Qureshi, A.S.; McCornick, P.G.; Qadir, M.; Aslam, Z. Managing salinity and waterlogging in the Indus Basin of Pakistan. Agric. Water Manag. 2008, 95, 1–10. [Google Scholar] [CrossRef]
  36. Qureshi, A.; Lashari, B.; Kori, S.; Lashari, G. Hydro-salinity behavior of shallow groundwater aquifer underlain by salty groundwater in Sindh Pakistan. In Proceedings of the Proceedings, Fifteenth International Water Technology Conference, Alexandria, Egypt, 31 March–2 April 2011; pp. 1–15. [Google Scholar]
  37. Afifi, A.; May, S.; Clark, V.A. Computer-Aided Multivariate Analysis; CRC Press: Beijing, China, 2003. [Google Scholar]
  38. Karunanidhi, D.; Aravinthasamy, P.; Subramani, T.; Muthusankar, G. Revealing drinking water quality issues and possible health risks based on water quality index (WQI) method in the Shanmuganadhi River basin of South India. Environ. Geochem. Health 2020, 1–18. [Google Scholar] [CrossRef]
  39. Boateng, T.K.; Opoku, F.; Acquaah, S.O.; Akoto, O. Groundwater quality assessment using statistical approach and water quality index in Ejisu-Juaben Municipality, Ghana. Environ. Earth Sci. 2016, 75, 489. [Google Scholar] [CrossRef]
  40. Pei-Yue, L.; Hui, Q.; Jian-Hua, W. Groundwater quality assessment based on improved water quality index in Pengyang County, Ningxia, Northwest China. E-J. Chem. 2010, 7. [Google Scholar] [CrossRef]
  41. Neissi, L.; Golabi, M.; Gorman, J. Spatial interpolation of sodium absorption ratio: A study combining a decision tree model and GIS. Ecol. Indic. 2020, 117, 106611. [Google Scholar] [CrossRef]
  42. Kawagoshi, Y.; Hama, T.; Kakimoto, R.; Itomitsu, N.; Hong, N.; Tomiie, K. Nitrate contamination of groundwater and identification of its cause in Kumamoto City and neighbouring area in Japan. Int. J. Food Safety Nutr. Public Health 2016, 6, 14–28. [Google Scholar] [CrossRef]
  43. Dippong, T.; Mihali, C.; Hoaghia, M.-A.; Cical, E.; Cosma, A. Chemical modeling of groundwater quality in the aquifer of Seini town–Someș Plain, Northwestern Romania. Ecotoxicol. Environ. Saf. 2019, 168, 88–101. [Google Scholar] [CrossRef]
  44. Rehman, J.U.; Ahmad, N.; Ullah, N.; Alam, I.; Ullah, H. Health Risks in Different Age Group of Nitrate in Spring Water Used for Drinking in Harnai, Balochistan, Pakistan. Ecol. Food Nutr. 2020, 59, 462–471. [Google Scholar] [CrossRef]
  45. Rezaei, H.; Zarei, A.; Kamarehie, B.; Jafari, A.; Fakhri, Y.; Bidarpoor, F.; Karami, M.A.; Farhang, M.; Ghaderpoori, M.; Sadeghi, H.; et al. Levels, Distributions and Health Risk Assessment of Lead, Cadmium and Arsenic Found in Drinking Groundwater of Dehgolan’s Villages, Iran. Toxicol. Environ. Health Sci. 2019, 11, 54–62. [Google Scholar] [CrossRef]
  46. Tahir, M.; Rasheed, H. Fluoride in the drinking water of Pakistan and the possible risk of crippling fluorosis. Drink. Water Eng. Sci. 2013, 6, 17–23. [Google Scholar] [CrossRef] [Green Version]
  47. He, S.; Wu, J. Hydrogeochemical characteristics, groundwater quality, and health risks from hexavalent chromium and nitrate in groundwater of Huanhe Formation in Wuqi county, northwest China. Expo. Health 2019, 11, 125–137. [Google Scholar] [CrossRef]
  48. Khalid, S. An assessment of groundwater quality for irrigation and drinking purposes around brick kilns in three districts of Balochistan province, Pakistan, through water quality index and multivariate statistical approaches. J. Geochem. Explor. 2019, 197, 14–26. [Google Scholar]
  49. Azis, A.; Yusuf, H.; Faisal, Z.; Suradi, M. Water turbidity impact on discharge decrease of groundwater recharge in recharge reservoir. Procedia Eng. 2015, 125, 199–206. [Google Scholar] [CrossRef] [Green Version]
  50. Rao, N.S.; Sunitha, B.; Adimalla, N.; Chaudhary, M. Quality criteria for groundwater use from a rural part of Wanaparthy District, Telangana State, India, through ionic spatial distribution (ISD), entropy water quality index (EWQI) and principal component analysis (PCA). Environ. Geochem. Health 2020, 42, 579–599. [Google Scholar]
  51. Cloutier, V.; Lefebvre, R.; Therrien, R.; Savard, M.M. Multivariate statistical analysis of geochemical data as indicative of the hydrogeochemical evolution of groundwater in a sedimentary rock aquifer system. J. Hydrol. 2008, 353, 294–313. [Google Scholar] [CrossRef]
  52. Talpur, S.A.; Noonari, T.M.; Rashid, A.; Ahmed, A.; Jat Baloch, M.Y.; Talpur, H.A.; Soomro, M.H. Hydrogeochemical signatures and suitability assessment of groundwater with elevated fluoride in unconfined aquifers Badin district, Sindh, Pakistan. SN Appl. Sci. 2020, 2, 1–15. [Google Scholar] [CrossRef]
  53. Talib, M.A.; Tang, Z.; Shahab, A.; Siddique, J.; Faheem, M.; Fatima, M. Hydrogeochemical characterization and suitability assessment of groundwater: A case study in Central Sindh, Pakistan. Int. J. Environ. Res. Public Health 2019, 16, 886. [Google Scholar] [CrossRef] [Green Version]
  54. Subramani, T.; Rajmohan, N.; Elango, L. Groundwater geochemistry and identification of hydrogeochemical processes in a hard rock region, Southern India. Environ. Monit. Assess. 2010, 162, 123–137. [Google Scholar] [CrossRef]
  55. Barzegar, R.; Moghaddam, A.A.; Nazemi, A.H.; Adamowski, J. Evidence for the occurrence of hydrogeochemical processes in the groundwater of Khoy plain, northwestern Iran, using ionic ratios and geochemical modeling. Environ. Earth Sci. 2018, 77, 597. [Google Scholar] [CrossRef]
  56. Mgbenu, C.N.; Egbueri, J.C. The hydrogeochemical signatures, quality indices and health risk assessment of water resources in Umunya district, southeast Nigeria. Appl. Water Sci. 2019, 9, 1–19. [Google Scholar] [CrossRef] [Green Version]
  57. Mukherjee, A.; Fryar, A.E. Deeper groundwater chemistry and geochemical modeling of the arsenic affected western Bengal basin, West Bengal, India. Appl. Geochem. 2008, 23, 863–894. [Google Scholar] [CrossRef]
  58. Reyes-Toscano, C.A.; Alfaro-Cuevas-Villanueva, R.; Cortés-Martínez, R.; Morton-Bermea, O.; Hernández-Álvarez, E.; Buenrostro-Delgado, O.; Ávila-Olivera, J.A. Hydrogeochemical characteristics and assessment of drinking water quality in the urban area of Zamora, Mexico. Water 2020, 12, 556. [Google Scholar] [CrossRef] [Green Version]
  59. Amiri, V.; Sohrabi, N.; Dadgar, M.A. Evaluation of groundwater chemistry and its suitability for drinking and agricultural uses in the Lenjanat plain, central Iran. Environ. Earth Sci. 2015, 74, 6163–6176. [Google Scholar] [CrossRef]
  60. Giglioli, S.; Colombo, L.; Contestabile, P.; Musco, L.; Armiento, G.; Somma, R.; Vicinanza, D.; Azzellino, A.J.W. Source apportionment assessment of marine sediment contamination in a post-industrial area (Bagnoli, Naples). Water 2020, 12, 2181. [Google Scholar] [CrossRef]
  61. Satyaji Rao, Y.; Keshari, A.K.; Gosain, A.J.I.J.o.E.; Management, W. Evaluation of regional groundwater quality using PCA and geostatistics in the urban coastal aquifer, East Coast of India. Water 2010, 5, 163–180. [Google Scholar]
  62. Tank, D.K.; Chandel, C.S.J.N. Science Analysis of the major ion constituents in groundwater of Jaipur city. Pollution Res. 2010, 8, 1–7. [Google Scholar]
  63. Liu, J.; Gao, Z.; Wang, Z.; Xu, X.; Su, Q.; Wang, S.; Qu, W.; Xing, T.J.E.m. Assessment Hydrogeochemical processes and suitability assessment of groundwater in the Jiaodong Peninsula, China. Environ. Monit. Assess. 2020, 192, 1–17. [Google Scholar] [CrossRef]
  64. Ewaid, S.H.; Mhajej, K.G.; Abed, S.A.; Al-Ansari, N. Groundwater Hydrochemistry Assessment of North Dhi-Qar Province, South of Iraq Using Multivariate Statistical Techniques. In Proceedings of the IOP Conference Series: Earth and Environmental Science, Surakarta, Indonesia, 24–25 August 2021; p. 012075. [Google Scholar]
  65. Roy, B.; Roy, S.; Mitra, S.; Manna, A.K.J.A.J.o.G. Evaluation of groundwater quality in West Tripura, Northeast India, through combined application of water quality index and multivariate statistical techniques. Water 2021, 14, 1–18. [Google Scholar] [CrossRef]
  66. Sadat-Noori, S.; Ebrahimi, K.; Liaghat, A. Groundwater quality assessment using the Water Quality Index and GIS in Saveh-Nobaran aquifer, Iran. Environ. Earth Sci. 2014, 71, 3827–3843. [Google Scholar] [CrossRef]
  67. Ahsan, W.A.; Ahmad, H.R.; Farooqi, Z.U.R.; Sabir, M.; Ayub, M.A.; Rizwan, M.; Ilic, P. Surface water quality assessment of Skardu springs using Water Quality Index. Environ. Sci. Pollution Res. 2021, 28, 1–12. [Google Scholar] [CrossRef] [PubMed]
  68. Ramírez-Morales, D.; Pérez-Villanueva, M.E.; Chin-Pampillo, J.S.; Aguilar-Mora, P.; Arias-Mora, V.; Masís-Mora, M. Pesticide occurrence and water quality assessment from an agriculturally influenced Latin-American tropical region. Chemosphere 2021, 262, 127851. [Google Scholar] [CrossRef]
  69. Nagarajan, R.; Rajmohan, N.; Mahendran, U.; Senthamilkumar, S. Evaluation of groundwater quality and its suitability for drinking and agricultural use in Thanjavur city, Tamil Nadu, India. Environ. Monitor. Assess. 2010, 171, 289–308. [Google Scholar] [CrossRef] [PubMed] [Green Version]
  70. Zhou, Y.; Li, P.; Xue, L.; Dong, Z.; Li, D. Solute geochemistry and groundwater quality for drinking and irrigation purposes: A case study in Xinle City, North China. Geochemistry 2020, 125609. [Google Scholar] [CrossRef]
  71. Seth, R.; Mohan, M.; Singh, P.; Singh, R.; Dobhal, R.; Singh, K.P.; Gupta, S.J.A.W.S. Water quality evaluation of Himalayan rivers of Kumaun region, Uttarakhand, India. Appl. Water Sci. 2016, 6, 137–147. [Google Scholar] [CrossRef] [Green Version]
  72. Singh, K.R.; Goswami, A.P.; Kalamdhad, A.S.; Kumar, B. Development of irrigation water quality index incorporating information entropy. Environ. Dev. Sustain. 2020, 22, 3119–3132. [Google Scholar] [CrossRef]
  73. Esmeray, E.; Gökcekli, C. Assessment of groundwater quality for drinking and irrigation purposes in Karabuk province, Turkey. Environ. Earth Sci. 2020, 79, 1–17. [Google Scholar] [CrossRef]
  74. Khalid, S.; Shahid, M.; Shah, A.H.; Saeed, F.; Ali, M.; Qaisrani, S.A.; Dumat, C. Heavy metal contamination and exposure risk assessment via drinking groundwater in Vehari, Pakistan. Environ. Sci. Pollution Res. 2020, 27, 39852–39864. [Google Scholar] [CrossRef]
  75. ur Rehman, I.; Ishaq, M.; Ali, L.; Muhammad, S.; Din, I.U.; Yaseen, M.; Ullah, H. Potentially toxic elements’ occurrence and risk assessment through water and soil of Chitral urban environment, Pakistan: A case study. Environ. Geochem. Health 2020, 1–14. [Google Scholar] [CrossRef] [PubMed]
  76. Chattopadhyay, A.; Singh, A.P.; Singh, S.K.; Barman, A.; Patra, A.; Mondal, B.P.; Banerjee, K. Spatial variability of arsenic in Indo-Gangetic basin of Varanasi and its cancer risk assessment. Chemosphere 2020, 238, 124623. [Google Scholar] [CrossRef]
  77. Saha, N.; Rahman, M.S. Groundwater hydrogeochemistry and probabilistic health risk assessment through exposure to arsenic-contaminated groundwater of Meghna floodplain, central-east Bangladesh. Ecotoxicol. Environ. Saf. 2020, 206, 111349. [Google Scholar] [CrossRef]
  78. Barakat, A.; Hilali, A.; Baghdadi, M.E.; Touhami, F. Assessment of shallow groundwater quality and its suitability for drinking purpose near the Béni-Mellal wastewater treatment lagoon (Morocco). Hum. Ecol. Risk Assess. Int. J. 2020, 26, 1476–1495. [Google Scholar] [CrossRef]
  79. Shahab, A.; Qi, S.; Zaheer, M. Arsenic contamination, subsequent water toxicity, and associated public health risks in the lower Indus plain, Sindh province, Pakistan. Environ. Sci. Pollution Res. 2019, 26, 30642–30662. [Google Scholar] [CrossRef]
Figure 1. Groundwater sampling points and geological formation of Sakrand, Sindh, Pakistan.
Water 13 03361 g001
Figure 2. Box diagram of physicochemical parameters.
Water 13 03361 g002
Figure 3. Piper plot for the classification of groundwater facies.
Water 13 03361 g003
Figure 4. Gibb’s plot showing the ionic composition of the samples of groundwater. (a) Na+/Na+ + Ca2+ (mg/L) versus Log TDS (mg/L) and (b) Cl/Cl + HCO3 (mg/L) verses Log TDS (mg/L).
Water 13 03361 g004
Figure 5. Scatter plot between (a) Na+ and Cl (mg/L), (b) EC (μS/cm) and Na+Cl (meq/L), (c) Ca2+ and HCO3 (mg/L), (d) Ca2+ and SO42− (mg/L).
Water 13 03361 g005
Figure 6. Scatter plot between (a) Na+ and Ca2++Mg2+ (mg/L) and (b) Ca2++Mg2+ (mg/L) and HCO3 + SO42− (mg/L).
Water 13 03361 g006
Figure 7. Scatter chart of indices (a) CAI–1 and (b) CAI–2 and (c) Chloro-alkaline indices of groundwater in the study area.
Water 13 03361 g007
Figure 8. Analysis of principal component (a) Variable factors map PCA (b) top contribution PC1 and PC 2 (c) Variances of principal components.
Water 13 03361 g008
Figure 9. (a) Clustering of groundwater samples based on dissimilarity (b) Distribution of factors on samples of the three clusters.
Water 13 03361 g009
Figure 10. Irrigation water classification diagram United States Salinity Laboratory (USSL).
Water 13 03361 g010
Figure 11. Sodium percentage (%Na) versus EC (Wilcox 1948).
Water 13 03361 g011
Table 1. WHO standards, weights, and relative weights of various parameters.
ParametersWHO Standards (Si) Weight   ( w i )
Total = 52
Relative   Weight   ( W i )
Total = 1
EC (µS/cm)100040.08
pH6.5–8.540.08
TDS (mg/L)100050.09
HCO3 (mg/L)25040.08
Cl (mg/L)25040.08
SO42− (mg/L)25030.06
Ca2+ (mg/L)20040.08
Mg2+ (mg/L)15040.08
Na+ (mg/L)20050.09
K+ (mg/l)1250.09
NO3 (mg/L)1030.06
F (mg/L)1.530.06
Fe (mg/L)0.320.03
As (ppb)1020.03
Table 2. Exposure parameters for health risk rate assessment.
Exposure ParametersDescriptionUnitValue (For Adults)Value (For Children)
CwContaminant Concentration in Watermg/L------
IRIngestion RateL/day2 L/day1 L/day
EFExposure FrequencyDays/year365 days/year365 days/year
EDExposure DurationYears30 Years6 Years
BWBody WeightKg70 kg15 kg
ATAverage Exposure TimeDays10,9502190
Table 3. Statistical summary of groundwater.
Physiochemical
Parameters
MinimumMaximumMeanMedianStandard
Deviation
Percentiles (95)WHO
Standards
EC (µS/cm)47070861829.5716551138.6540281000
pH6.58.17.177.10.4386.5–8.5
Turbidity (NTU)03.92.562.70.783.825
TDS (mg/L)30144931116.931022643.6922071000
Alkalinity (mg/L)1.8287.636.74.8817.2̶
TH (mg/L)1301800517.06500282.21022.2300
HCO3 (mg/L)901400387.77340243.78860250
Cl (mg/L)70800196.90186108.52399250
SO42− (mg/L)23831165.28160101.52330250
Ca2+ (mg/L)24420101.708063.94210200
Mg2+ (mg/L)1548869.126154.64142.8150
Na+ (mg/L)39772158.54146104.61335200
K+ (mg/L)0.625.54.523.53.9313.0612
NO3 (mg/L)03.30.9250.860.492.4210
F (mg/L)0.030.770.250.230.110.441.5
Fe (mg/L)00.430.0620.050.070.2440.3
As (ppb)0101.5203.181010
Table 4. Classification of groundwater based on TDS and EC.
ParametersRangeWater QualityNumber of Samples
Electrical
Conductivity (EC) (µS/cm)
<250Excellent-
250–750Good3
750–2000Permissible64
2000–3000Doubtful18
>5000Very hazardous10
TDS (mg/L)<500Desirable for drinking12
500–1000Acceptable for drinking34
1000–3000Suitable for irrigation47
>3000Hazardous for both2
Table 5. Matrix of correlation coefficients for groundwater physiochemical parameters.
ParametersECPHTURBTDSALKTHHCO3ClSO42−Ca2+Mg2+Na+K+NO3FFeAs
EC1
PH−0.201
TURB0.030.141
TDS0.19−0.150.101
ALK0.20 *−0.17−0.020.041
TH0.62 **−0.26 **0.040.37 **0.32 **1
HCO30.25 *−0.21 *0.110.40 **0.190.62 **1
Cl0.61 ** −0.25 *0.040.33 **0.25 *0.94 **0.52 **1
SO42−0.65 ** −0.24 *0.060.31 **0.29 **0.93 **0.47 **0.96 **1
Ca2+0.36 **−0.12−0.120.24 *0.34 **0.41 **0.35 **0.29 **0.29 **1
Mg2+0.06−0.01−0.030.20 *0.010.30 **0.46 **0.25 *0.23 *0.28 **1
Na+0.62 **−0.23 *0.040.31 **0.29 **0.93 **0.52 **0.97 **0.96 **0.31 **0.24 *1
K+−0.5 **−0.26 **0.040.38 **0.25 *0.64 **0.40 **0.61 **0.63 **0.31 **0.180.61 **1
NO30.58 **−0.170.070.23 *0.23 *0.63 **0.27 **0.63 **0.67 **0.34 **0.120.63 **0.50 **1
F0.52 ** −0.26 **0.120.23 *0.39 **0.66 **0.32 **0.65 **0.68 **0.29 **0.080.67 **0.55 **0.54 **1
Fe0.41 **−0.110.010.29 **0.22 *0.58 **0.39 **0.57 **0.56 **0.20 *0.160.58 **0.62 **0.384 **0.43 **1
As−0.06−0.070.150.060.100.050.02−0.04−0.004−0.060.0004−0.08−0.02−0.040.16−0.091
*. Correlation is significant at the 0.05 level (2-tailed). **. Correlation is significant at the 0.01 level (2-tailed).
Table 6. Rotated factor loadings for the groundwater samples in the study area.
ParameterF.1F.2F.3F.4
EC0.71−0.27−0.150.06
PH−0.320.070.070.51
Turbidity0.06−0.10.740.32
TDS0.440.40.270.02
ALK0.39−0.16−0.02−0.61
Total Hardness0.950.030.030.04
HCO30.620.550.16−0.03
Cl0.93−0.07−0.020.17
SO42−0.93−0.130.010.14
Ca2+0.470.32−0.27−0.39
Mg2+0.310.7500.03
Na+0.93−0.08−0.050.16
K+0.76−0.03−0.010.02
NO30.72−0.22−0.070.07
F0.75−0.280.17−0.19
Fe0.670.02−0.060.18
As0−0.070.71−0.45
Eigen value7.251.41.291.23
Loading %42.678.257.567.26
Cumulative %42.6750.9258.4965.74
Each PC’s effective parameters are denoted by a bold number.
Table 7. Water quality index (WQI) of water samples in the study area.
WQI RangeQuality of WaterNo. of Samples
<50Excellent17
>50Good46
>100Poor16
>200Very poor11
>300Unsuitable5
Table 8. Calculated irrigation quality indices for groundwater of the study area.
ParametersMinimumMaximumMeanSD
SAR4.1680.4817.9810.03
Na %10.7781.2548.1611.31
PI12.0983.0653.7511.51
MAR1277.2141.0213.33
KI0.1196.701.990.581
Table 9. Statistical analyses for Health Risk rate (HRR) assessment.
Heavy MetalsAge GroupMinimumMaximumMean
Arsenic
(As)
Children00.0006670.000107
Adults00.0002864.5 × 10−5
Iron
(Fe)
Children00.3950.00815
Adults00.012290.001873
Table 10. Chronic Risk and Samples analysis.
Heavy MetalsAge GroupHazard Quotient (HQ)Chronic RiskNumber of Samples
Arsenic
(As)
Children<0.1Negligible75
≥0.1 < 1LowNone
≥1 < 4Medium20
≥4HighNone
Adults<0.1Negligible75
≥0.1 < 1Low20
≥1 < 4MediumNone
≥4HighNone
Iron
(Fe)
Children<0.1NegligibleAll samples
≥0.1 < 1LowNone
≥1 < 4MediumNone
≥4HighNone
Adults<0.1NegligibleAll samples
≥0.1 < 1LowNone
≥1 < 4MediumNone
≥4HighNone
Publisher’s Note: MDPI stays neutral with regard to jurisdictional claims in published maps and institutional affiliations.

