
Breaking Solitary Wave Impact on a Vertical Seawall


Department of Hydraulic and Ocean Engineering, National Cheng Kung University, Tainan City 70101, Taiwan
Water 2022, 14(4), 583; https://0-doi-org.brum.beds.ac.uk/10.3390/w14040583
Submission received: 12 January 2022
/
Revised: 7 February 2022
/
Accepted: 11 February 2022
/
Published: 15 February 2022
(This article belongs to the Special Issue Advances in Experimental Hydraulics, Coast and Ocean Hydrodynamics)
Abstract
:Wave interactions with vertical and sloping seawalls are indeed complicated, especially for the impacts due to breaking waves, which are unsteady, turbulent and multi-phase. Available studies successfully measured the impact pressure due to waves acting on seawalls, whereas the associated flow velocity and turbulence characteristic received limited attention, indicating that the momentum of such violent free-surface flows cannot be determined. In this study, new experiments were carried out in a laboratory-scale wave flume using a non-intrusive image-based measuring technique (bubble image velocimetry, BIV) to measure the flow velocities due to a shoaling solitary wave impinging on and overtopping a vertical seawall. By varying the wave height of solitary waves, the breaking point of a shoaling wave can be changed. As such, the impact point of a breaking wave in relation to the seawall can be thereby adjusted. Considering the same still-water depth, two wave height conditions are studied so as to produce different levels of aerated flows. Effects of high- and low-aerated cases on free surface elevations, flow velocities and turbulence characteristics are presented so as to develop a better understanding of wave-structure interactions. More specifically, the maximum velocities and turbulence intensities at different evolutionary phases are identified for these two cases.
1. Introduction
Coastal structures, such as levees and sea dikes, have long been used as coastal defenses to withstand wave impacts and protect the coastline. As such, wave overtopping on different coastal structures has been investigated for decades [1]. In general, wave overtopping on coastal structures typically occurs during typhoons due to the combination of large waves caused by strong winds and sea-level rise attributed to storm surges. The failure of coastal breakwaters mostly results from strong-wave induced hydrodynamics, leading to noticeable influences on the seaward of the levee, a wave overtopping the crown of the levee and overtopping flow pounding the landward of the levee [2]. Some historical events have shown catastrophic disasters partly attributed to the failure of coastal structures, such as 2011 Tohoku earthquake and tsunami [3,4] and 2005 Hurricane Katrina [5].
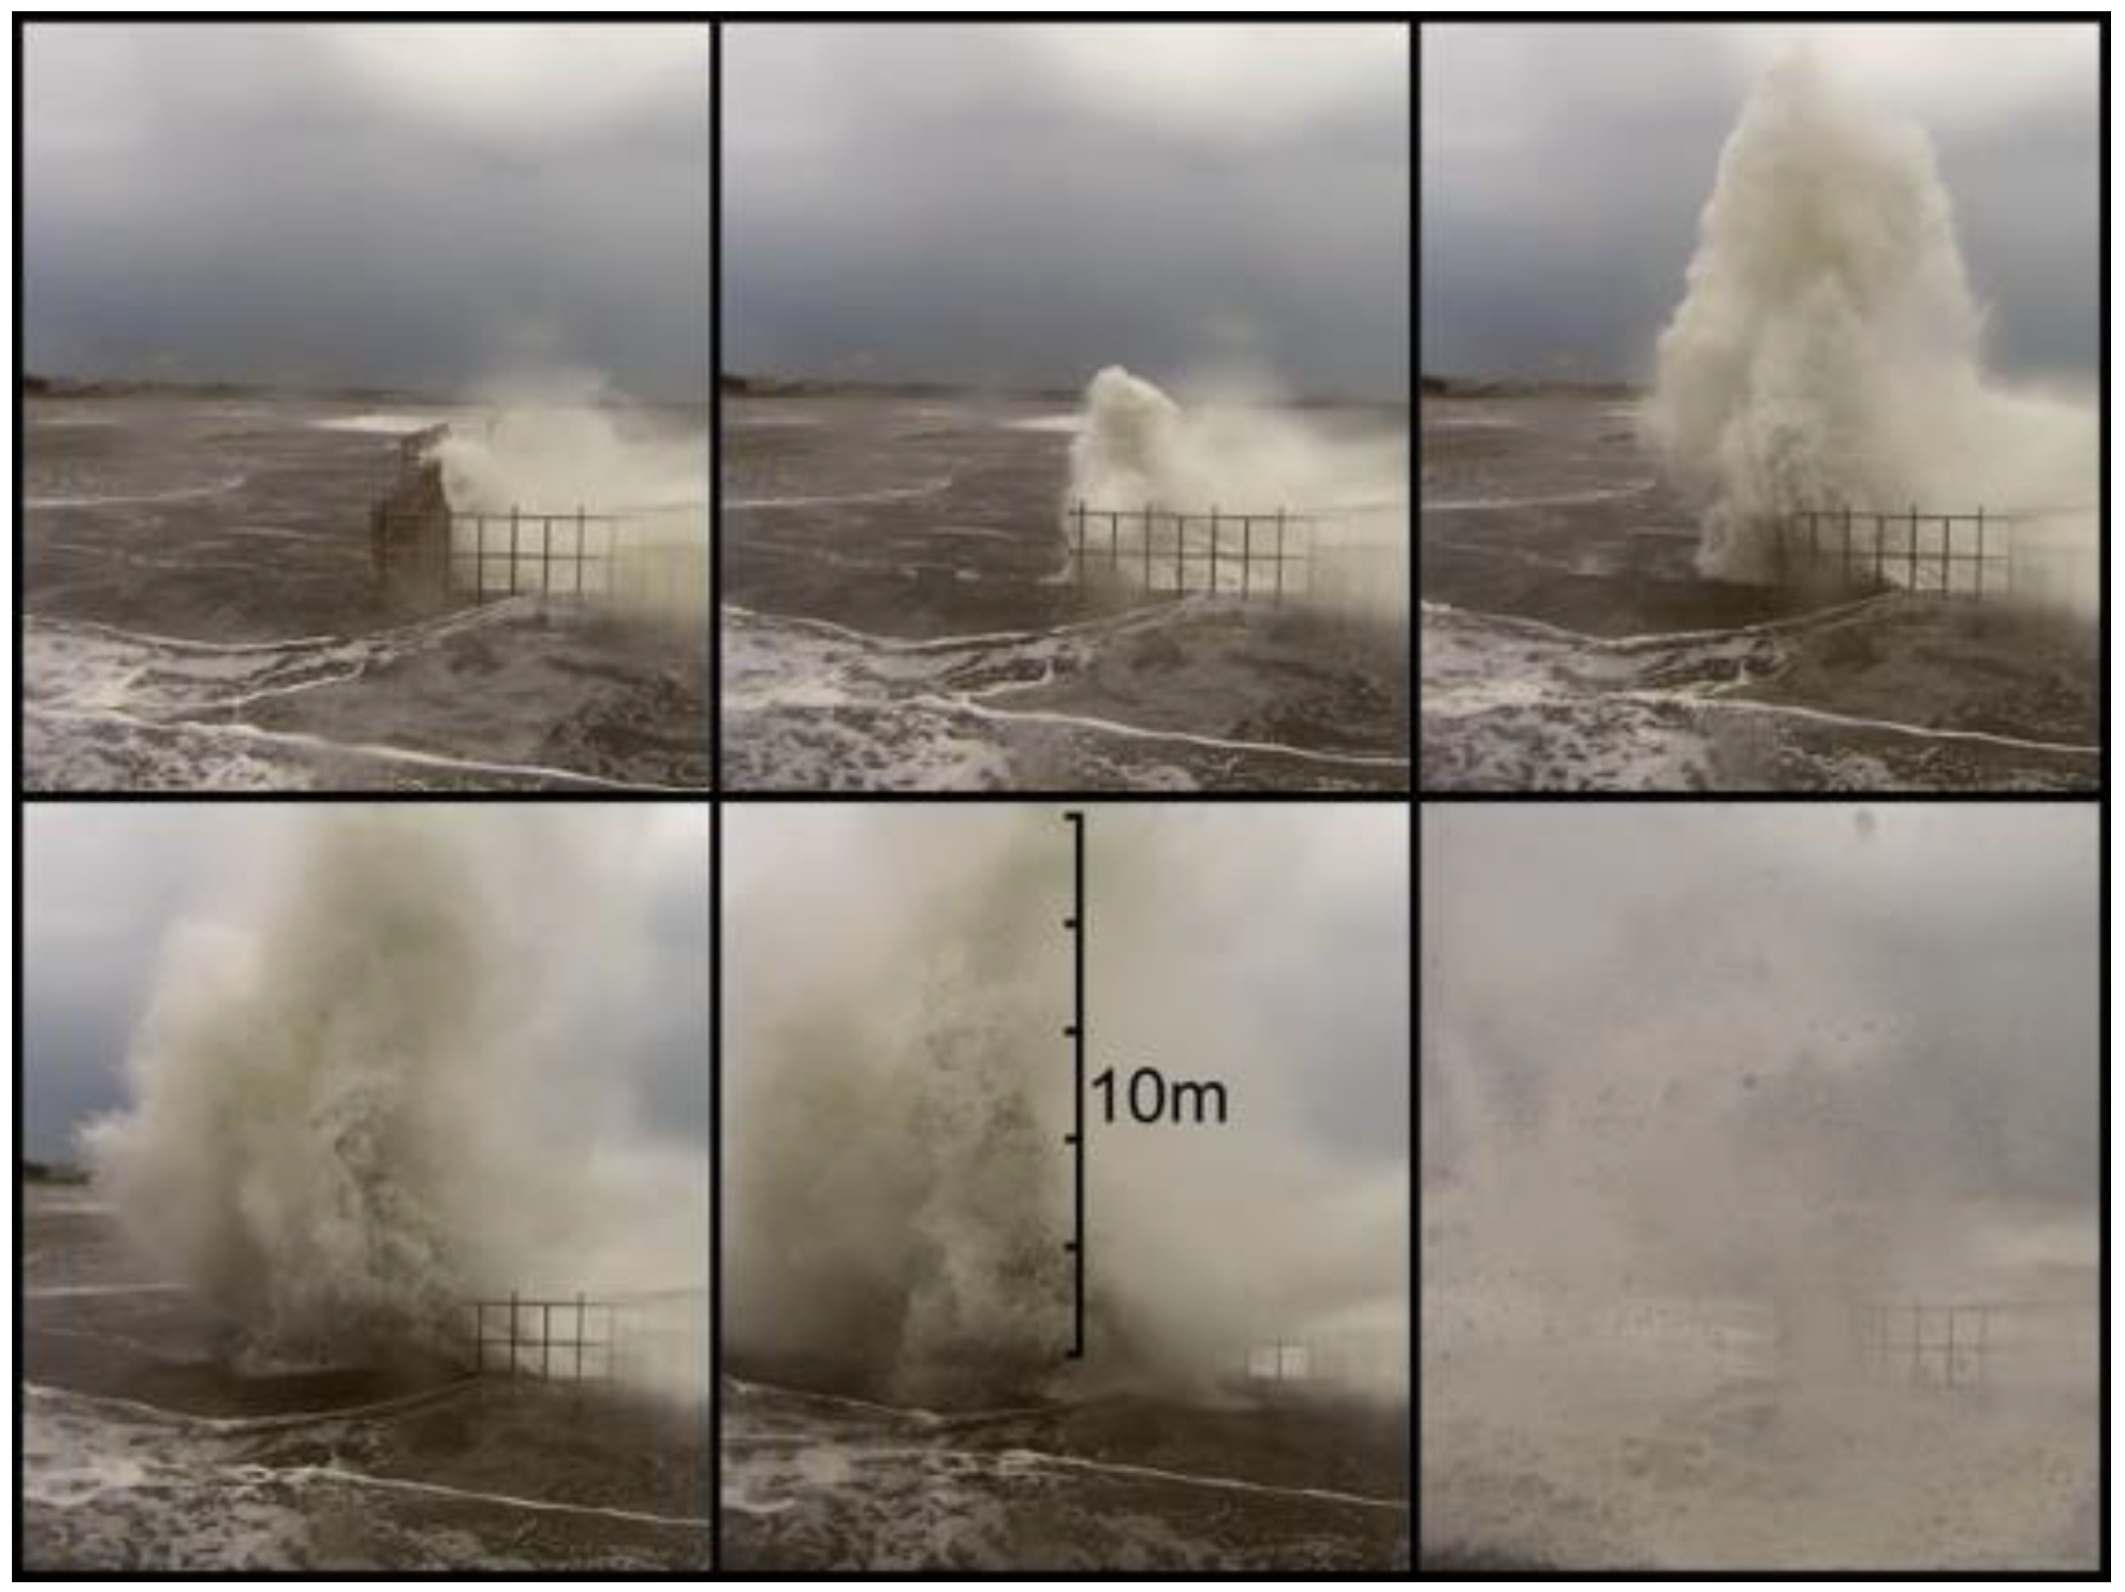
Many coastal cities also experience wave overtopping and sometimes experience damages of coastal structures annually, during the Pacific typhoon season (roughly falls between July and September). For example, Taiwan is vulnerable to the pathways of typhoons mostly from the Western North Pacific with, on average, 5.3 typhoon landfalls per year (from 2007 to 2016). Taiwan’s coastline is roughly 1338 km, in which the “artificial” coastline is more than 750 km, i.e., covered with artificial structures, indicating a high density of coastal structures constructed along the coasts. Such man-made structures are mostly vertical and steep seawalls protected by a large amount of armor blocks. However, such seawalls are sometimes smashed by wave actions. In August 2015, massive and long waves due to the Typhoon Soudelor (Category 5) led to the nationwide wave overtopping of seawalls and destroyed part of the breakwaters at the Fugang Fishing Harbor in Taitung (a city in the east coast of Taiwan); in September 2016, the same harbor was struck by the Typhoon Meranti (Category 5), which introduced long waves more than 10 m high for wave overtopping and devastated the outer embankment as well as the lighthouse. In Figure 1, the photographs document dramatic wave-overtopping processes at Anping, Tainan City, Taiwan. Although there were no direct in situ measurements, it is speculated that the waves that led to overtopping flow were of substantial size and resulted in sea sprays rising several tens of meters into the air, where one of the possible mechanisms to produce such an exceptional flow might be attributed to strongly amplified wave impinging the harbor wall, and then resulted in the proceeding wave overtopping. As indicated in [6], the design and risk assessment of coastal structures has been changed in the past decade to allowable overtopping instead of wave runup. Therefore, understanding the hydrodynamic characteristics of breaking waves on seawalls has become increasingly important for the safety and future planning of coastal communities.
Over the past few decades, breaking wave interactions with vertical and/or sloping walls has been extensively studied to mimic the wave impact and overtopping phenomena. Chan and Melville [7] presented an experimental study to measure the impact pressures and flow velocities, obtained using a laser anemometer, for deep-water breaking waves impacting on a vertical wall. They found that, before wave impact, peak velocities were observed near the wave front, around 2–3 times the inshore wave celerity (C), and, after wave impact, the vertical velocities, i.e., up to roughly 6 C, were significantly higher than that of the horizontal velocities. However, Chan and Melville [7] also reported that the use of laser-based measuring systems for flow velocity measurements often interfered with air bubbles due to the plunging wave with air-bubble entrainments. Generating breaking waves by means of wave shoaling due to the presence of a uniform slope, Kirkgöz [8,9] measured the impact pressures of vertical and sloping walls due to breaking waves. To clarify the effects of breaking waves with various types acting on the structure, Hattori et al. [10] performed laboratory experiments to measure impact pressures due to breaking waves with different overturning points in relation to the vertical wall. They found that the highest pressure was observed for the case of a vertical wave front striking the wall with limited air-bubble entrainments (flip-through breaker) whereas, for the case with large amounts of entrained air bubbles at the time of impact (plunging breaker), a lower level of pressure was recorded but with a longer rising time. Furthermore, Hull and Müller [11] experimentally studied the effects of breaker types and the impacts on a vertical wall. They concluded that maximum pressure was observed at the still-water level for the case of a plunging breaker with a large air pocket. Hull and Müller [11] also employed a particle image velocimetry (PIV) system to measure flow velocity for the case with limited air bubble entrainments. Bruce et al. [12] performed physical modeling for random waves acting on a vertical wall and, based on video recording, they found that the velocity of an up-rushing jet can be 6–10 times the inshore-wave celerity. Recently, Jensen [13] experimentally and numerically investigated a shoaling solitary wave impact on a vertical wall. The results revealed that the measured pressure for the case with a very steep front with an overturning jet was 60% higher than the flip-through case. PIV was also used in [13] to measure the flow velocities outside the aerated area and thereby, the velocity at the breaking wave front could not be determined. Watanabe and Ingram [14,15] measured the distributions and velocities of sprays produced by violent wave impacts on a vertical wall. They found that the maximum vertical velocity measured for the case of flip-through impact is more than ten times the maximum vertical velocity estimated by the small-amplitude wave theory. Some efforts were devoted to large-scale experiments, such as [16,17], whereby the former was to measure impact pressures of low-aeration and high-aeration waves while the latter made efforts to compare their new data with predictions using empirical and analytical models. Both large-scale experiments investigated the effects of vertical variations in terms of impact pressures and concluded that the highest pressure was observed near the still-water level.
Significant efforts in the literature have been made with regard to pressure and force measurements for wave impacts on vertical walls, as this is indeed closely related to the stability of the structures. Non-breaking wave loads on structures can be modeled with reasonable confidence [18], whereas breaking wave with stochastic amounts of air bubble entrainments might make the problem somewhat complicated and the conclusions might be slightly different due to the use of different instrument sizes and sampling as well as resolutions of measuring apparatus. Having said that, the impact pressure is closely related to the kinematics of breaking waves [19], implying the importance of determining the momentum of such violent free-surface flows. To measure the flow fields of breaking wave interactions with structures, Koosheh et al. [1] summarized three of the most widely used methods, including mechanical (micro-propeller), Doppler effect-based, and image- and optic-based measurements. As indicated in [7,20], among others, the optical-based measuring techniques, including PIV and laser-Doppler velocimetry, did not work well in highly aerated flows because of uncontrollable scattering of laser light. This is indeed the main restriction of such techniques for breaking waves with entrained air bubbles [20]. Furthermore, this might be one of the main reasons that, to the best knowledge of the author, a detailed measurement and insightful investigation of flow velocity and turbulence due to breaking waves impinging on and overtopping a vertical seawall is limited.
In this study, a non-intrusive image-based measuring technique (bubble image velocimetry, BIV) developed by Ryu et al. [21] was used to measure violent free-surface flows due to a breaking wave impinging on and overtopping a vertical wall. New experiments were carried out in a laboratory-scale wave flume and plunging breaking waves were generated through the shoaling of solitary waves. The use of solitary wave is beneficial to create a clear investigation without the effects from the preceding and following waves [22,23]. Two scenarios are considered here in order to reproduce different types of breaking waves and investigate their interactions with a vertical seawall. Each testing scenario was repeated up to 30–35 times to obtain meaningful ensemble-averaged flow velocities and turbulence characteristics. Using an image-based flow visualization technique, it is expected to improve the understanding of wave hydrodynamics in the vicinity of a vertical seawall due to violent breaking-wave impacts. Such data can be further used to validate analytical solutions [24] and multi-phase numerical models [25].
2. Experiment
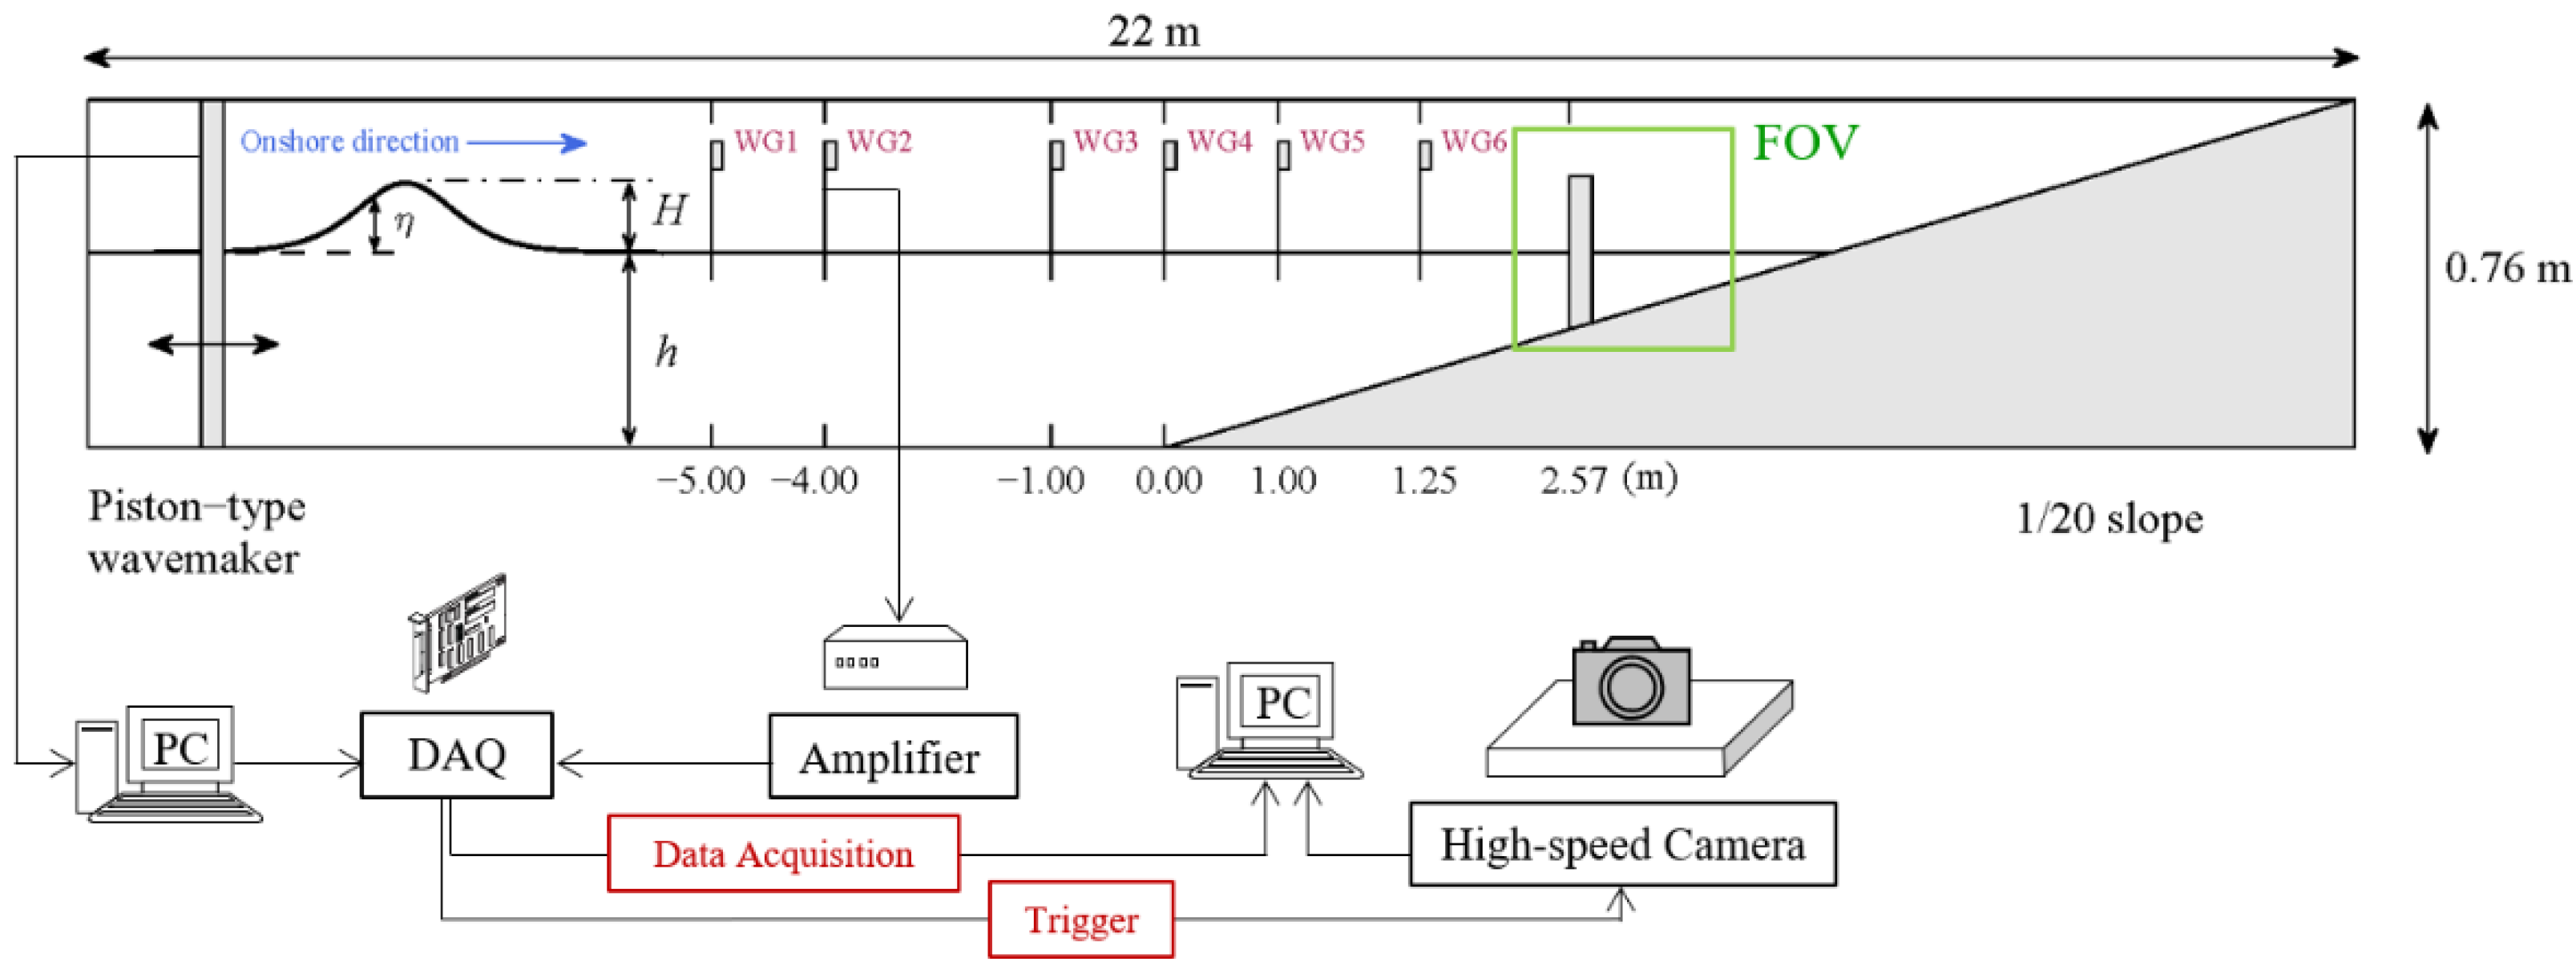
New experiments were carried out in a two-dimensional glass-walled and glass-bottomed wave flume located at Tainan Hydraulics Laboratory, National Cheng Kung University, Taiwan. The dimensions of wave flume are 22 m in length, 0.50 m in width and 0.76 m in depth. Figure 2 shows the experimental facilities and instrumentation layout. Solitary waves were generated by a programmable servo-controlled piston-type wavemaker at one end of the wave flume using the procedure suggested by Goring [26]. Detailed validations in terms of wave properties using this facility to generate stable and accurate solitary waves are given in [27,28]. A uniform and impermeable sloping beach of = 1/20 (vertical/horizontal) was constructed using anodized aluminum plates and installed at the other end of the wave flume. The region between the wavemaker and the toe of the slope was a constant depth region with a horizontal distance of 12 m. With a special care to bevel the structure bottom edge, an idealized vertical seawall was constructed of Plexiglas with dimensions of 10 cm in height, 2 cm in width and 50 cm in the spanwise direction to ensure a two-dimensional investigation. The seawall was positioned 257 cm away from the toe of the slope. The origin of the coordinate system (x, z) = (0, 0) is defined at the intersection between the seafloor and the toe of the 1/20 slope.
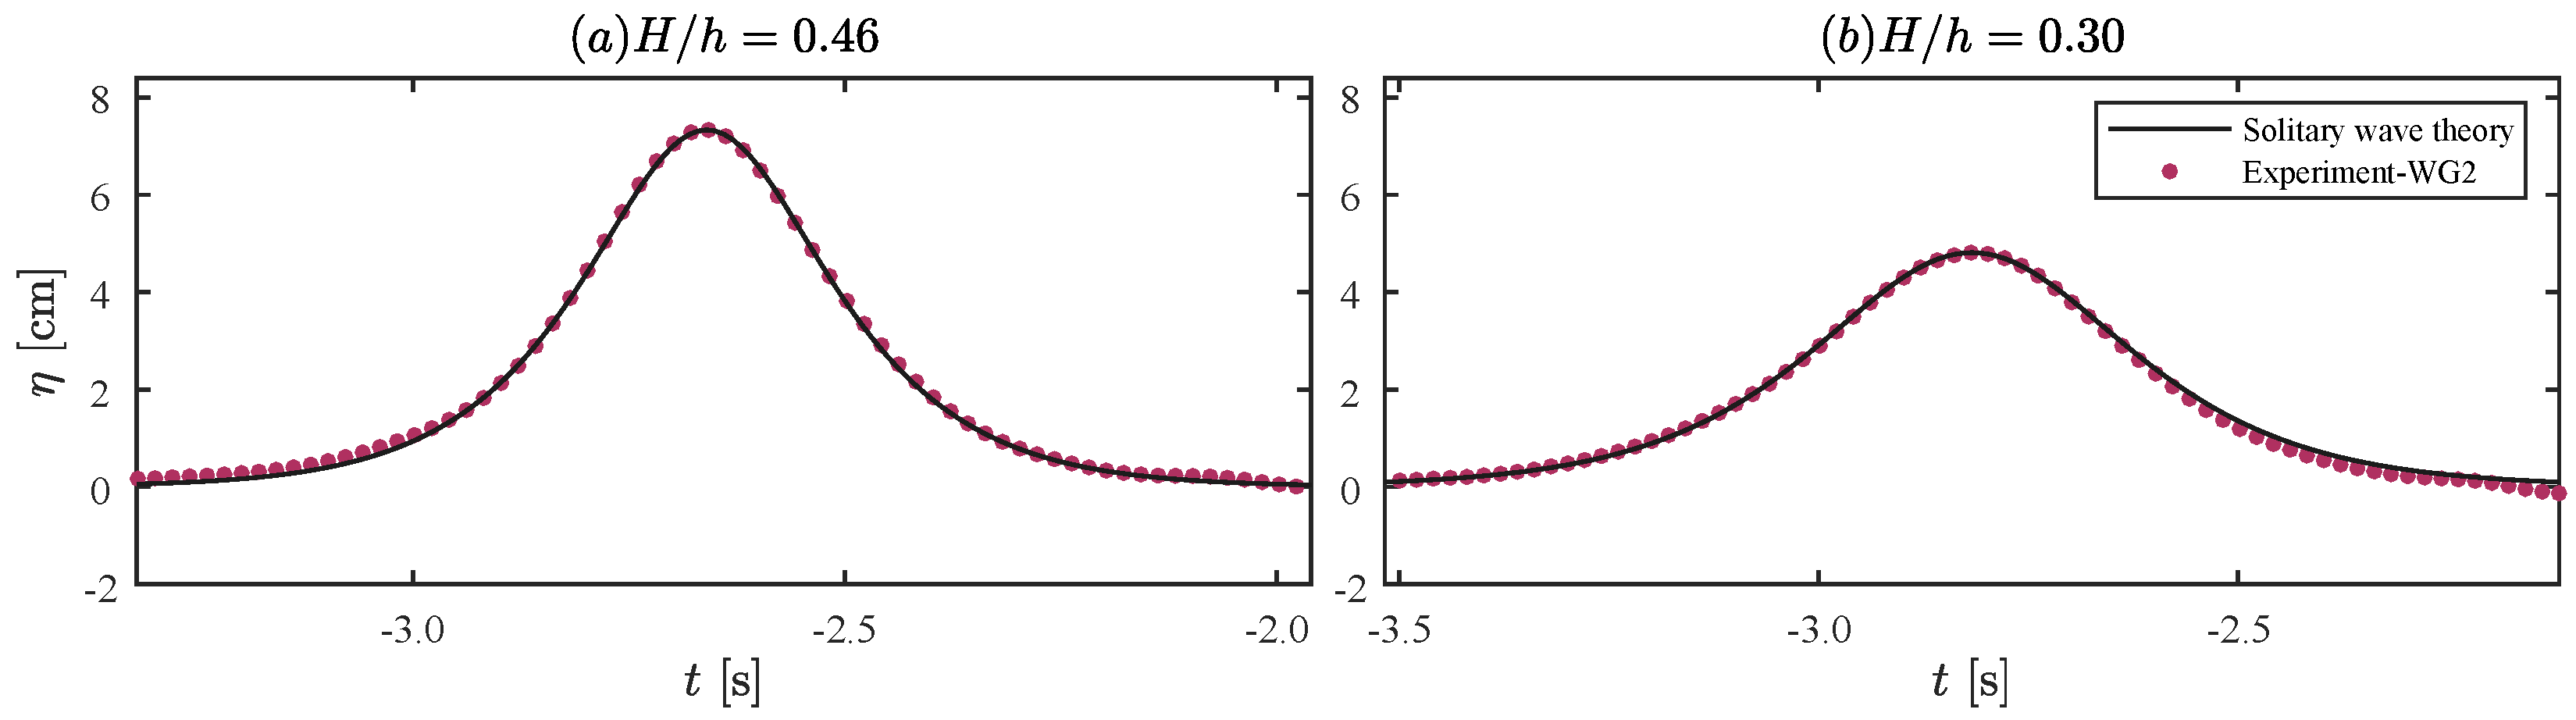
Six capacitance-type wave gauges were employed to measure the time series of free-surface elevations. The relative positions are depicted in Figure 2, in which three gauges were located at the constant depth and the other three gauges were deployed in the sloping area. For all incident waves, the still-water depth (h) was kept as 16 cm while the wave height (H) was varied for two cases, i.e., H/h = 0.46 and 0.30. The freeboard of the seawall used in this study was 6.85 cm. As such, for the case of H/h = 0.46, the incident-wave height is a bit higher than the freeboard, whereas, for the case of H/h = 0.30, its incident wave height is lower than the crown of structure. In this study, the experiment was not designed to be an exact scaled copy of a prototype structure. Instead, the physical model was employed to discover the complicated hydrodynamics of overtopping flows. Figure 3 shows comparisons between measurements at WG2 and the third order theoretical solutions of solitary wave [29] for both cases. Measured surface profiles fit the theory well. The time at which the crest of a solitary wave arrived at the toe of the slope, i.e., WG4, is defined as t = 0 s. Using the wave-breaking criterion [30] to classify the breaker type of a shoaling solitary wave, both scenarios belong to plunging breakers. It is speculated that a large amount of air bubbles would be entrained due to plunging waves. As such, traditional optical- and image-based measurements may not work well for these situations [20,27,31].
To overcome the difficulty of breaking-wave measurements, BIV [21] was employed to measure the flow velocities in the two-dimensional vertical plane in order to quantify the aerated flow fields due to the interactions of breaking waves and a vertical seawall. The implementation of the BIV method in a laboratory is similar to that of the PIV technology, except that BIV does not require the use of a laser but the use light bulbs instead as a backlight to illuminate the measuring region from behind. The basic idea of BIV is to use the shadowgraphy technique and control a narrow depth of field (DOF) in image recording, such that shadow textures created by air-liquid interfaces can be used as tracers and then cross-correlated for velocity determinations. Similar to typical PIV analyses, an adaptive multi-pass algorithm, identical to that used in [32], was employed to obtain velocity fields so as to increase spatial resolution with a sufficient level of accuracy. The cross-correlated velocity vectors were post-processed using the MPIV toolbox [33] to remove spurious vectors using the median filter. Using BIV, measuring highly aerated flows has become possible, such as green water flows [31,34,35], liquid sloshing [36], breaking waves in deep-water [37] as well as in the surf-zone [38,39] and open-channel flows [40].
In the present study, the BIV raw images were captured using a high-speed camera (MS55K2, Canadian Photonic Labs Inc.) mounted with a Nikon 60 mm f/2.8 focal lens. In the experiment, the camera resolution was set at a full resolution of 1280 × 1020 pixels with a framing rate at 1000 fps. The distance (l) from the camera lens to the measuring plane was 180.0 cm and the field of view was 42.4 cm × 33.9 cm; the calculated DOF was around 14.6 cm. The corresponding error due to the limited depth of DOF can be estimated by ε = DOF/(2l) [21]. As a result, the error caused by the limited DOF in the BIV system was around 4.06%. To provide the mean flow properties and reduce the error of the BIV system, the measured results shown here, including velocity fields and wave gauge data, were obtained by ensemble-averaging over 30 (for the case of H/h = 0.46) and 35 (for the case of H/h = 0.30) instantaneous trials under identical initial and boundary conditions. The reason to increase the number of repeated experimental runs for the case of H/h = 0.30 was that the captured images were of limited shadow textures during the phases of waves impacting on the wall, such that increasing the number of trails helped reduce the random error for the ensemble-averaging process. The Reynolds-decomposition method was then used to separate velocity fluctuations and to statistically obtain the turbulence characteristics. The turbulent kinetic energy (K) can be estimated by , in which the symbol represents ensemble average, N is the number of repeated experiment (N = 30 and 35, depending on scenarios), and , respectively denotes the horizontal and vertical velocity fluctuations. The whole measuring system and instruments were synchronized by using a data acquisition system (DAQ, National Instruments) along with an in-house developed LabVIEW program—as the wavemaker started generating a solitary wave, a signal was sent to the DAQ device to start data recording of connected instruments and the high-speed camera was then triggered to start through a predetermined delay time in order to skip unnecessary image recording until the target wave was in the vicinity of the vertical seawall. Figure 2 shows the sketch of synchronized instruments and the image-based measuring system.
3. Results and Discussion
In this section, the experimental results are presented in terms of free-surface elevations, mean velocities and velocity fluctuations by means of the turbulence intensity. Since the generated solitary waves recorded at WG2 were compared with theoretical results in Figure 3, other wave gauge data showing wave propagation, shoaling and reflection by the wall are discussed. Two scenarios were considered through varying the wave heights of solitary waves to further change the impinging point of breaking waves in relation to the vertical wall, which resulted in high-aeration and low-aeration flows for the comparisons of free surface elevation, mean flow velocity and turbulence intensity.
3.1. High-Aerated Case (H/h = 0.46)
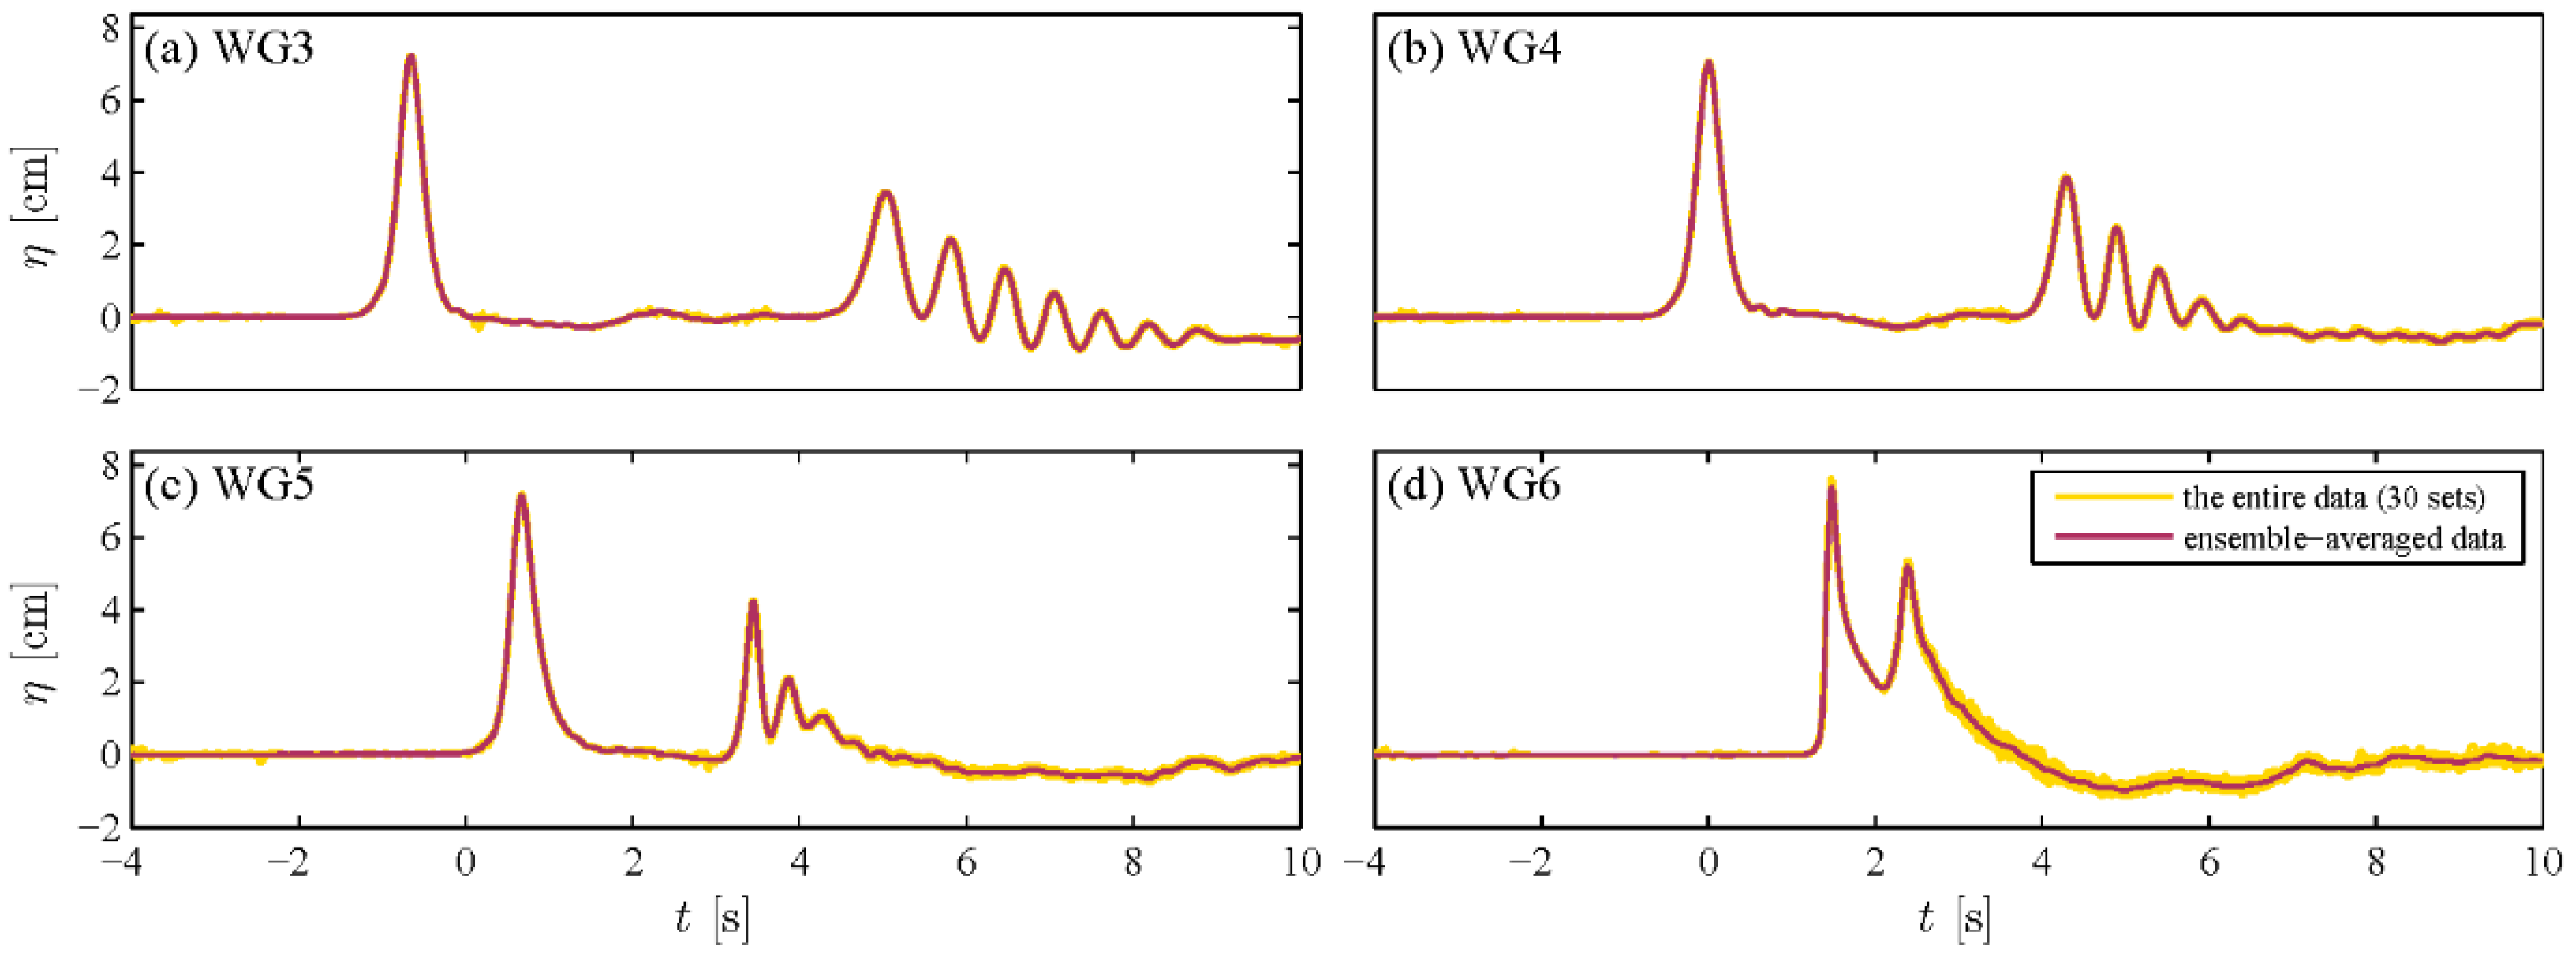
Figure 4 shows the free-surface elevation time series obtained from WG3 to WG6, for the case of H/h = 0.46. The WG3 was positioned in the constant depth region such that its main waveform is not affected by either the slope or the vertical wall until wave reflection was recorded, i.e., t > 4.0 s [Figure 4a]. The WG4 was exactly located at the toe of the slope such that the waveform becomes a bit asymmetric due to the presence of the slope [Figure 4b]. The shoaling effect becomes more prominent from the recording of WG5, in which the waveform turns into a more asymmetric shape to form a nearly vertical front [Figure 4c]. Lastly, WG6 was deployed just 1.32 m in front of the seawall and thereby its location is close to the breaking point of the shoaling wave. The definition of breaking point is where the wave crest starts to curl up. From WG6 recording the leading waveform features an almost vertical front. In Figure 4d, a second peak is recorded at t > 2.0 s due to wave reflection from the wall, in which the reflected wave height is roughly 0.7 times the incident wave height. For this case, wave breaking occurs prior to wave impacts on the seawall, such that energy dissipation should be expected and wave overtopping also leads to energy loss. As such, it is therefore reasonable to have partial wave reflection for this case. In addition, because the same experimental condition was repeated up to 30 times for this scenario. The entire dataset and the ensemble-averaged data can be shown together. It is acknowledged here that the criterion to ensure the data quality is based on the standard deviation for the data obtained from WG3 and its difference in terms of the wave height should be less than 2% before the data can be collected. It is found that the entire dataset, up to 30 repetitions, fit the ensemble-averaged data satisfactorily well. Noticeable variations are only observed for the recording from WG6 during the phase of wave reflection due to the breaking wave impacting on the vertical wall, which is the most complicated phenomenon in this study. Otherwise, the fit of the entire dataset shows a high degree of repeatability for the present measured data.
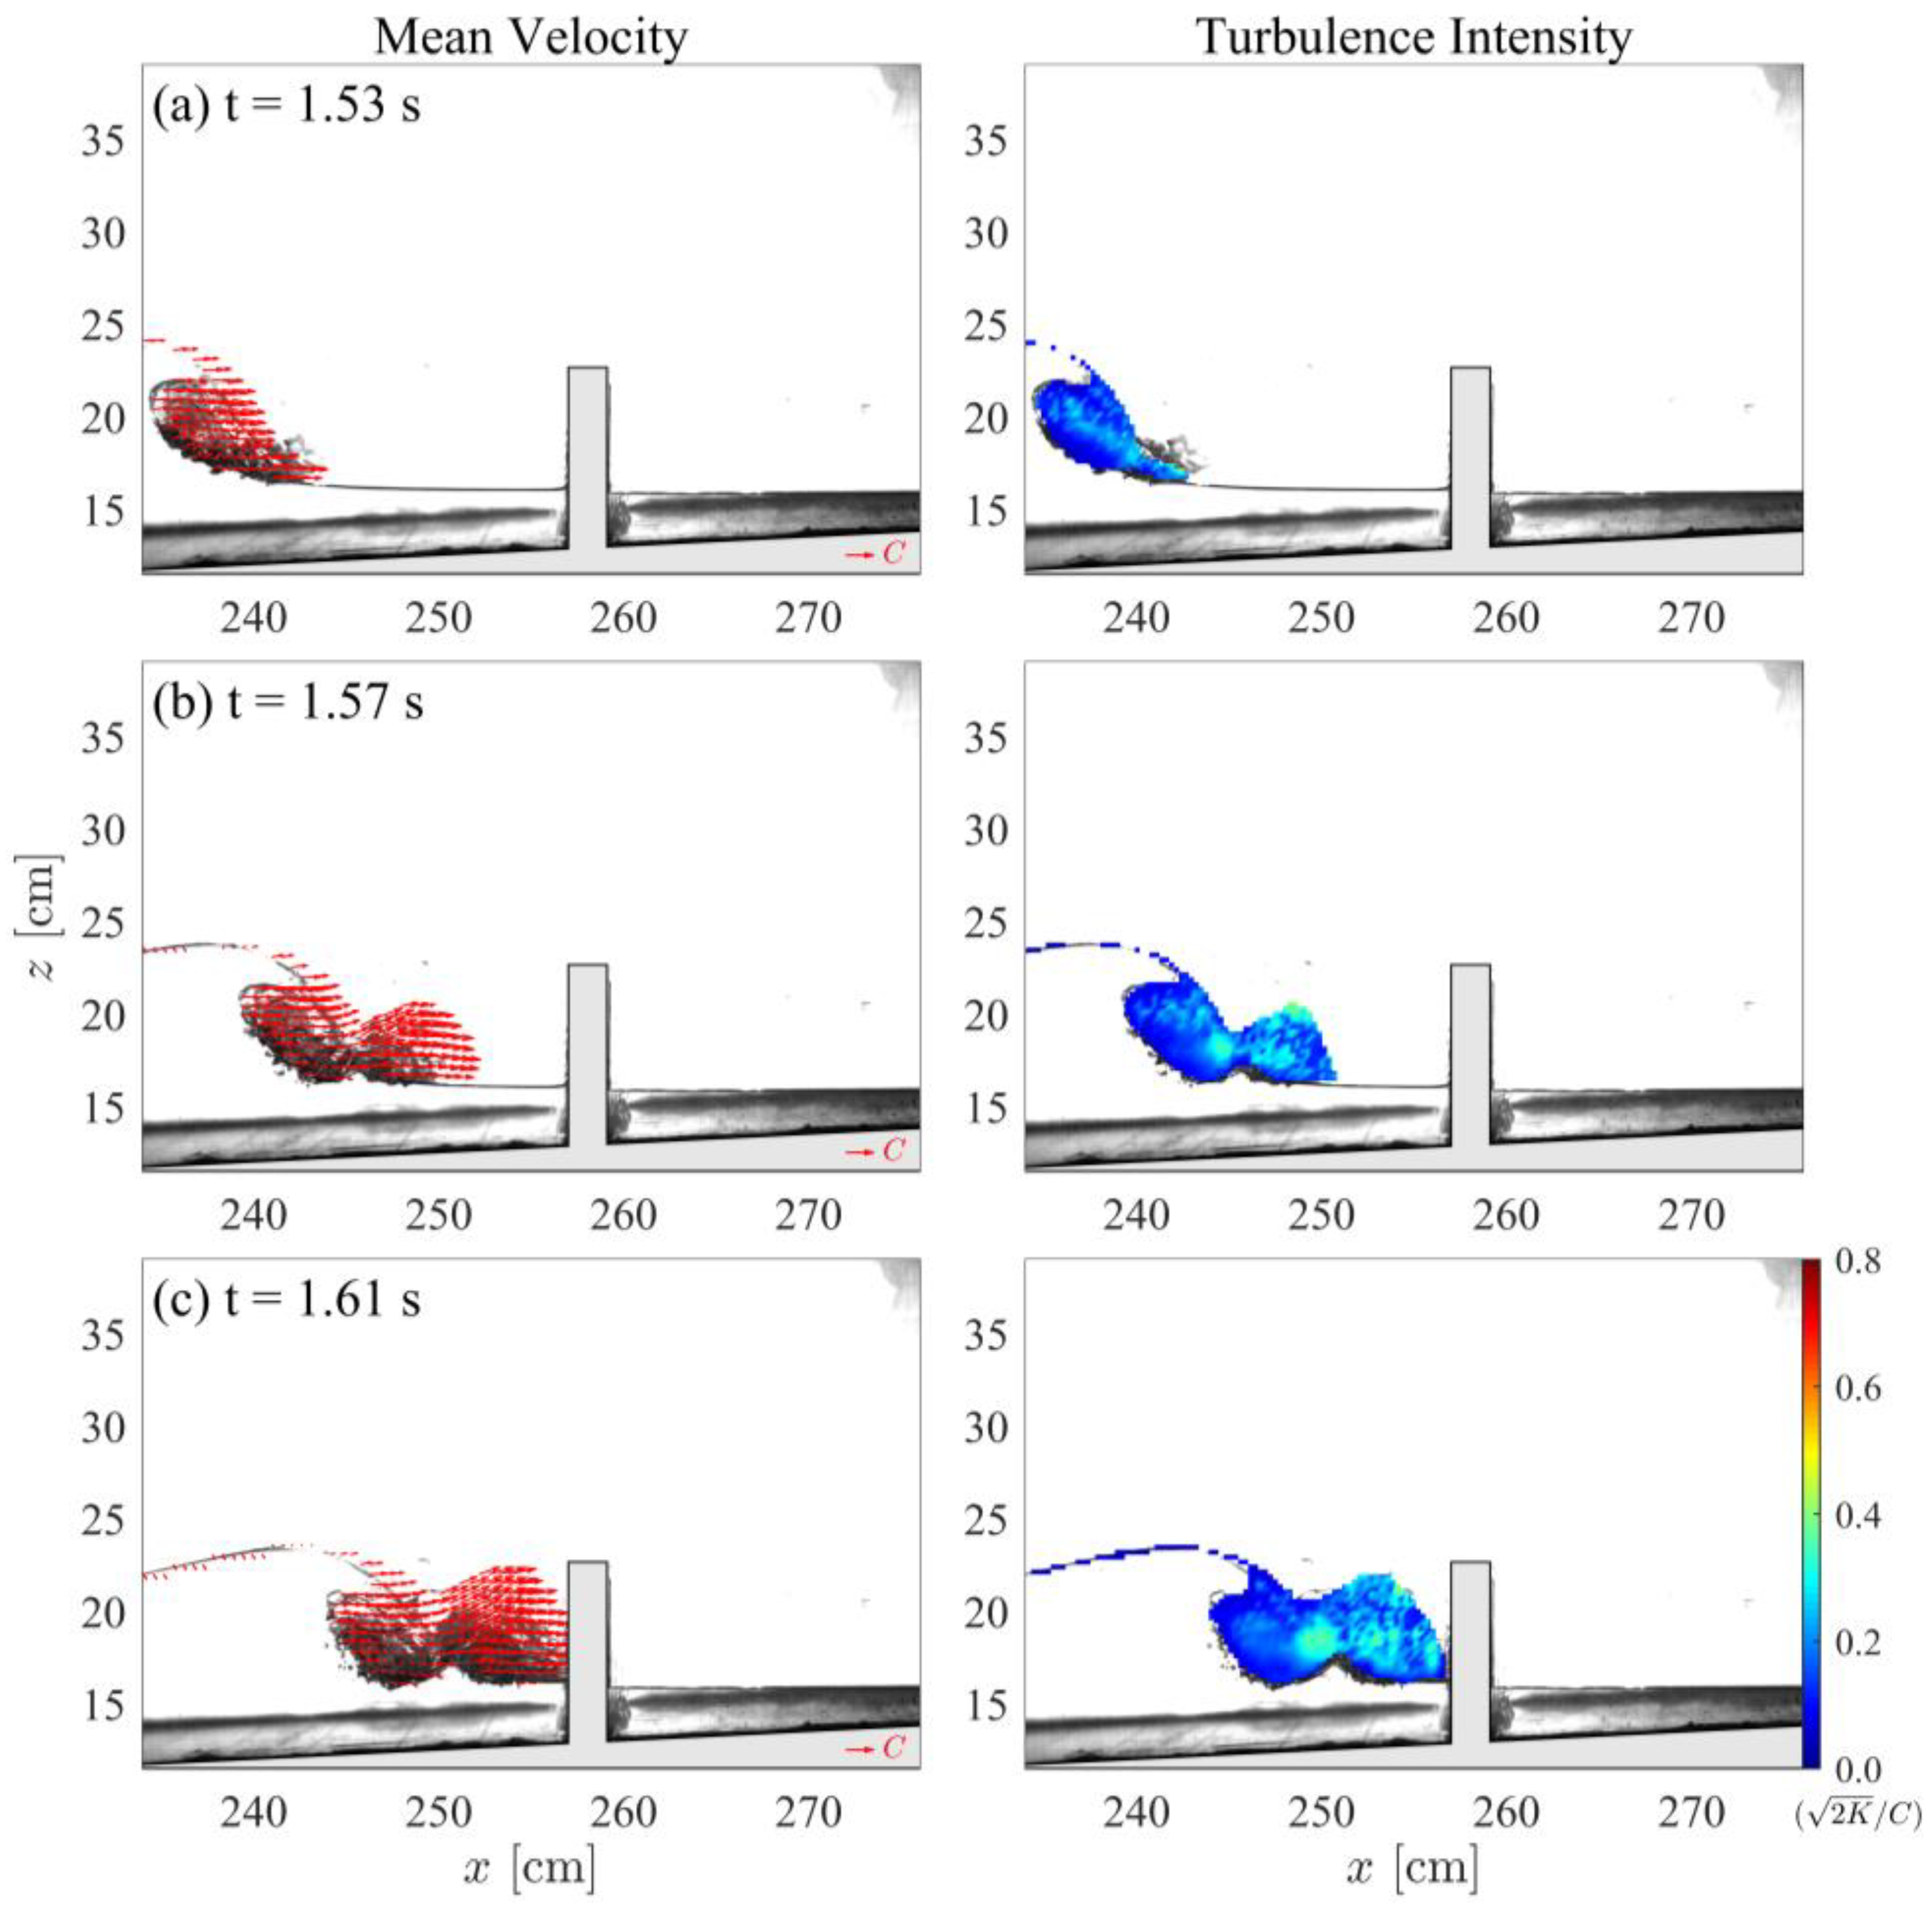
Figure 5 shows the velocity and turbulence characteristics obtained from the BIV analyses. For clarity, only every 2nd velocity columns are plotted using a regularly spaced grid. Specifically, the left column of Figure 5 shows the mean velocity fields obtained from ensemble averaging over 30 repeated instantaneous BIV measurements, while the right column of Figure 5 demonstrates the turbulent kinetic energy (K) by means of the turbulence intensity (), which is normalized by the wave celerity (C) of a solitary wave based on the Boussinesq theory [41], i.e., C =. For the case of H/h = 0.46, the phase velocity is equal to C = 1.50 m/s. In addition, the background images are arbitrarily selected from one of the 30 realizations. Due to the highly turbulent nature of breaking waves, slight mismatches at some instances between the mean velocity field and instantaneous image should be expected [31].
In Figure 5 nine instants are shown to illustrate the physical process due to a shoaling solitary wave interacting with a vertical seawall. Before the wave impacts on the wall, Figure 5a shows a fully developed breaking plunging wave with a large amount of entrained air bubbles and, at this moment, the velocity is dominated by the horizontal component with a value of around 1.2 C, which is higher than the vertical component with a value of around 0.3 C. To connect with previous studies in the literature [10,11,16], this case can be referred to as high-aeration flows. Figure 5b shows the first splash-up of the breaking solitary wave and the velocity is still horizontally dominated. More specifically, the maximum horizontal and vertical velocity at this moment increases to a value of 1.3 C and 0.4 C, respectively.
Then, the wave front, due to the splashing jet, hits the seaward side of the vertical seawall, as shown in Figure 5c. Since the wave front just touches the wall, drastic interactions between the breaking wave and the wall, similar to that shown in Figure 1, have not yet been triggered. As a result, the horizontal velocity still dominates the initiation of the wave-structure interaction process. The maximum horizontal and vertical velocity is around 1.2 C and 0.4 C, respectively.
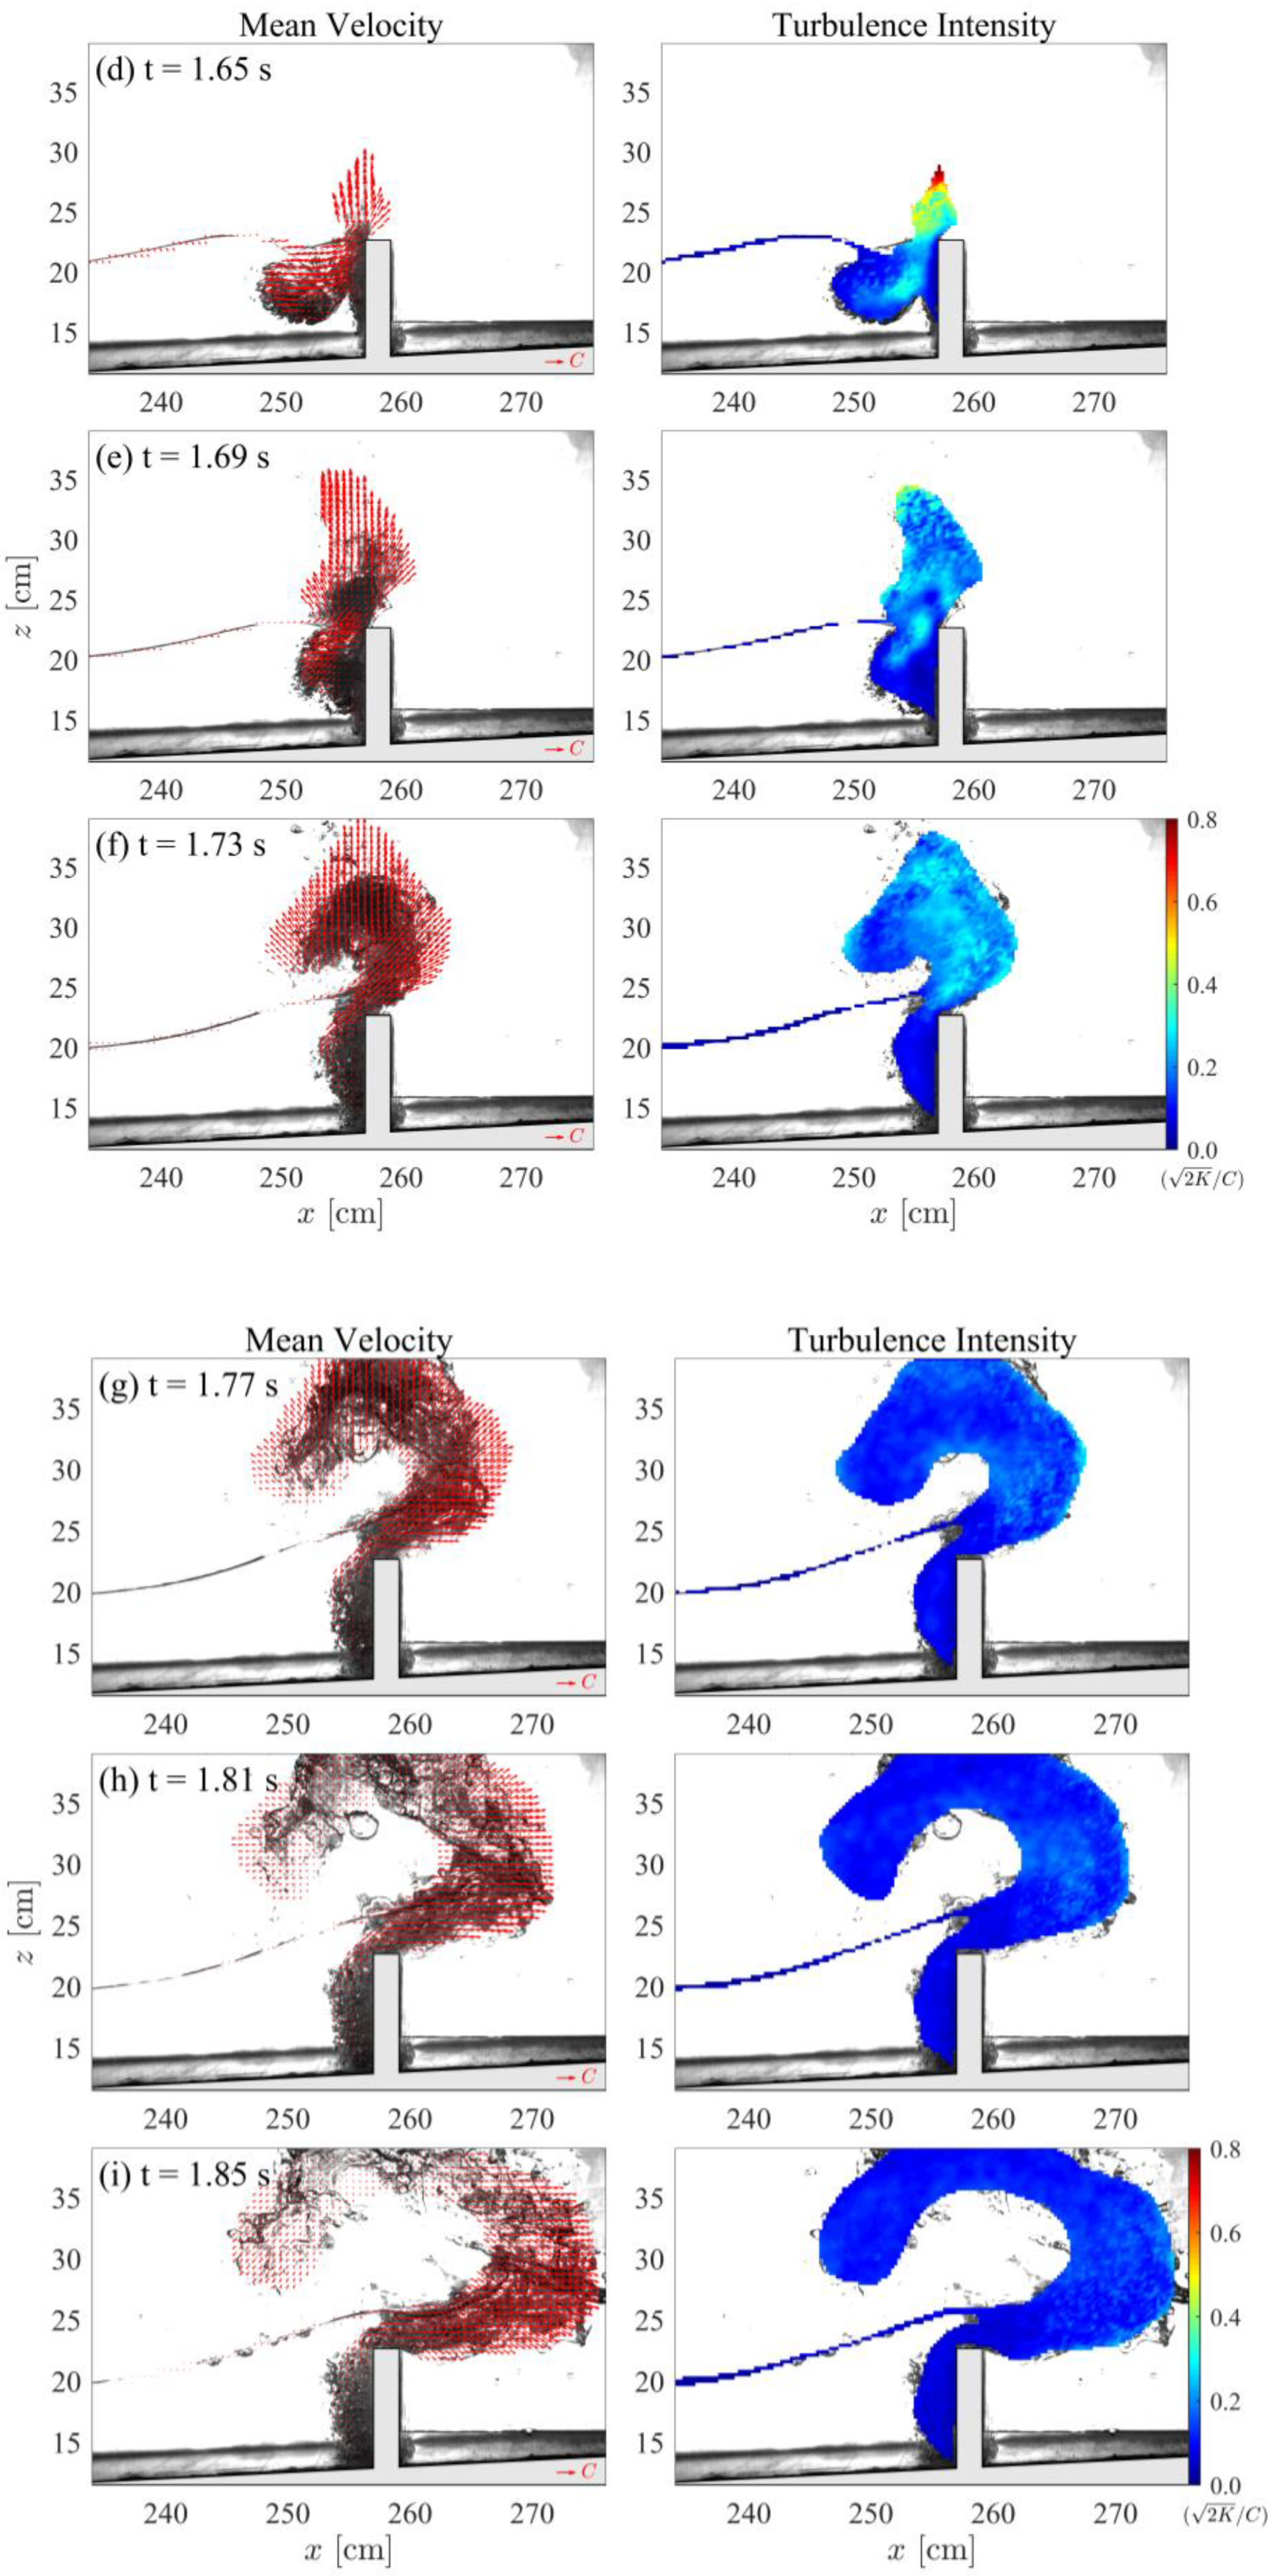
Right after the wave impacts on the wall, the dominating momentum changes immediately from a horizontal to vertical direction due to the presence of a vertical wall. As shown in Figure 5d, a vertical splashing jet is observed near the crown of the structure and the maximum vertical velocity is around 1.3 C while the maximum horizontal velocity reduces to roughly 1.0 C. The maximum vertical velocity during the whole interaction process is found at t = 1.67 s, up to 1.8 C, for which the corresponding evidence and analyses are discussed later. After t = 1.67 s, although the vertical splashing jet is still on the way up [Figure 5e], the measured velocity magnitude tends to reduce. At t = 1.69 s the maximum vertical velocity is around 1.2 C, while the maximum horizontal velocity is around 0.8 C. Furthermore, at this moment, sprays not only uprush vertically but also overtop the crown of the seawall moving to the landward direction. Those sprays, produced by violent wave interactions with the vertical seawall, are three-dimensionally distributed [15] and randomly generated, hence they cannot be easily captured using a two-dimensional image-based measuring system. Therefore, the associated maximum level of vertical velocity due to sprays running out the measuring area cannot be determined.
After t > 1.69 s, the splashing water and/or sprays not only move upward but also spread to both seaward and landward sides of the seawall, as seen in Figure 5f. More specifically, in Figure 5d–e, the overtopping flows are mainly attributed to the first splash-up jet of the breaking wave, mostly consisting of air-liquid mixture, and, in Figure 5f, the overturning jet of the breaking wave then overtops the wall, consisting of partly pure liquid and mostly air-liquid mixture. At t = 1.73 s, the maximum horizontal and vertical velocities are small than the wave celerity, respectively, at around 0.8 C and 0.6 C. The maximum momentum transfers from the vertical to horizontal direction are found at t = 1.77 s [Figure 5g]. Measured results indicate that, at this instant, both horizontal and vertical velocities are roughly the same, which are around 0.6 C. Afterward, the vertical velocities rapidly decrease with a local maximum value of around 0.2 C whereas the horizontal velocities are kept around 0.6 C until the splashing water drops due to gravity. For t > 1.77 s, the splashing flows are still spreading to all directions and the shape of such overtopping flow pattern looks like a “question mark”, as shown in Figure 5h. Then, such “question mark”-like flow pattern is continuously widened to form a larger area of wave overtopping and splashing jet [Figure 5h–i]. Finally, the wave overtopping flows down and impacts the landward of the structure, which might have potential risks, further affecting the structural stability if the incident wave is of long wavelength [42]. Due to gravity, sprays drop partly into the “ocean”. Remaining waves behind the leading breaking wave, which are not high enough to overtop the structure, are reflected by the seawall. This feature is consistent with those recorded by WG6, as shown in Figure 4d.
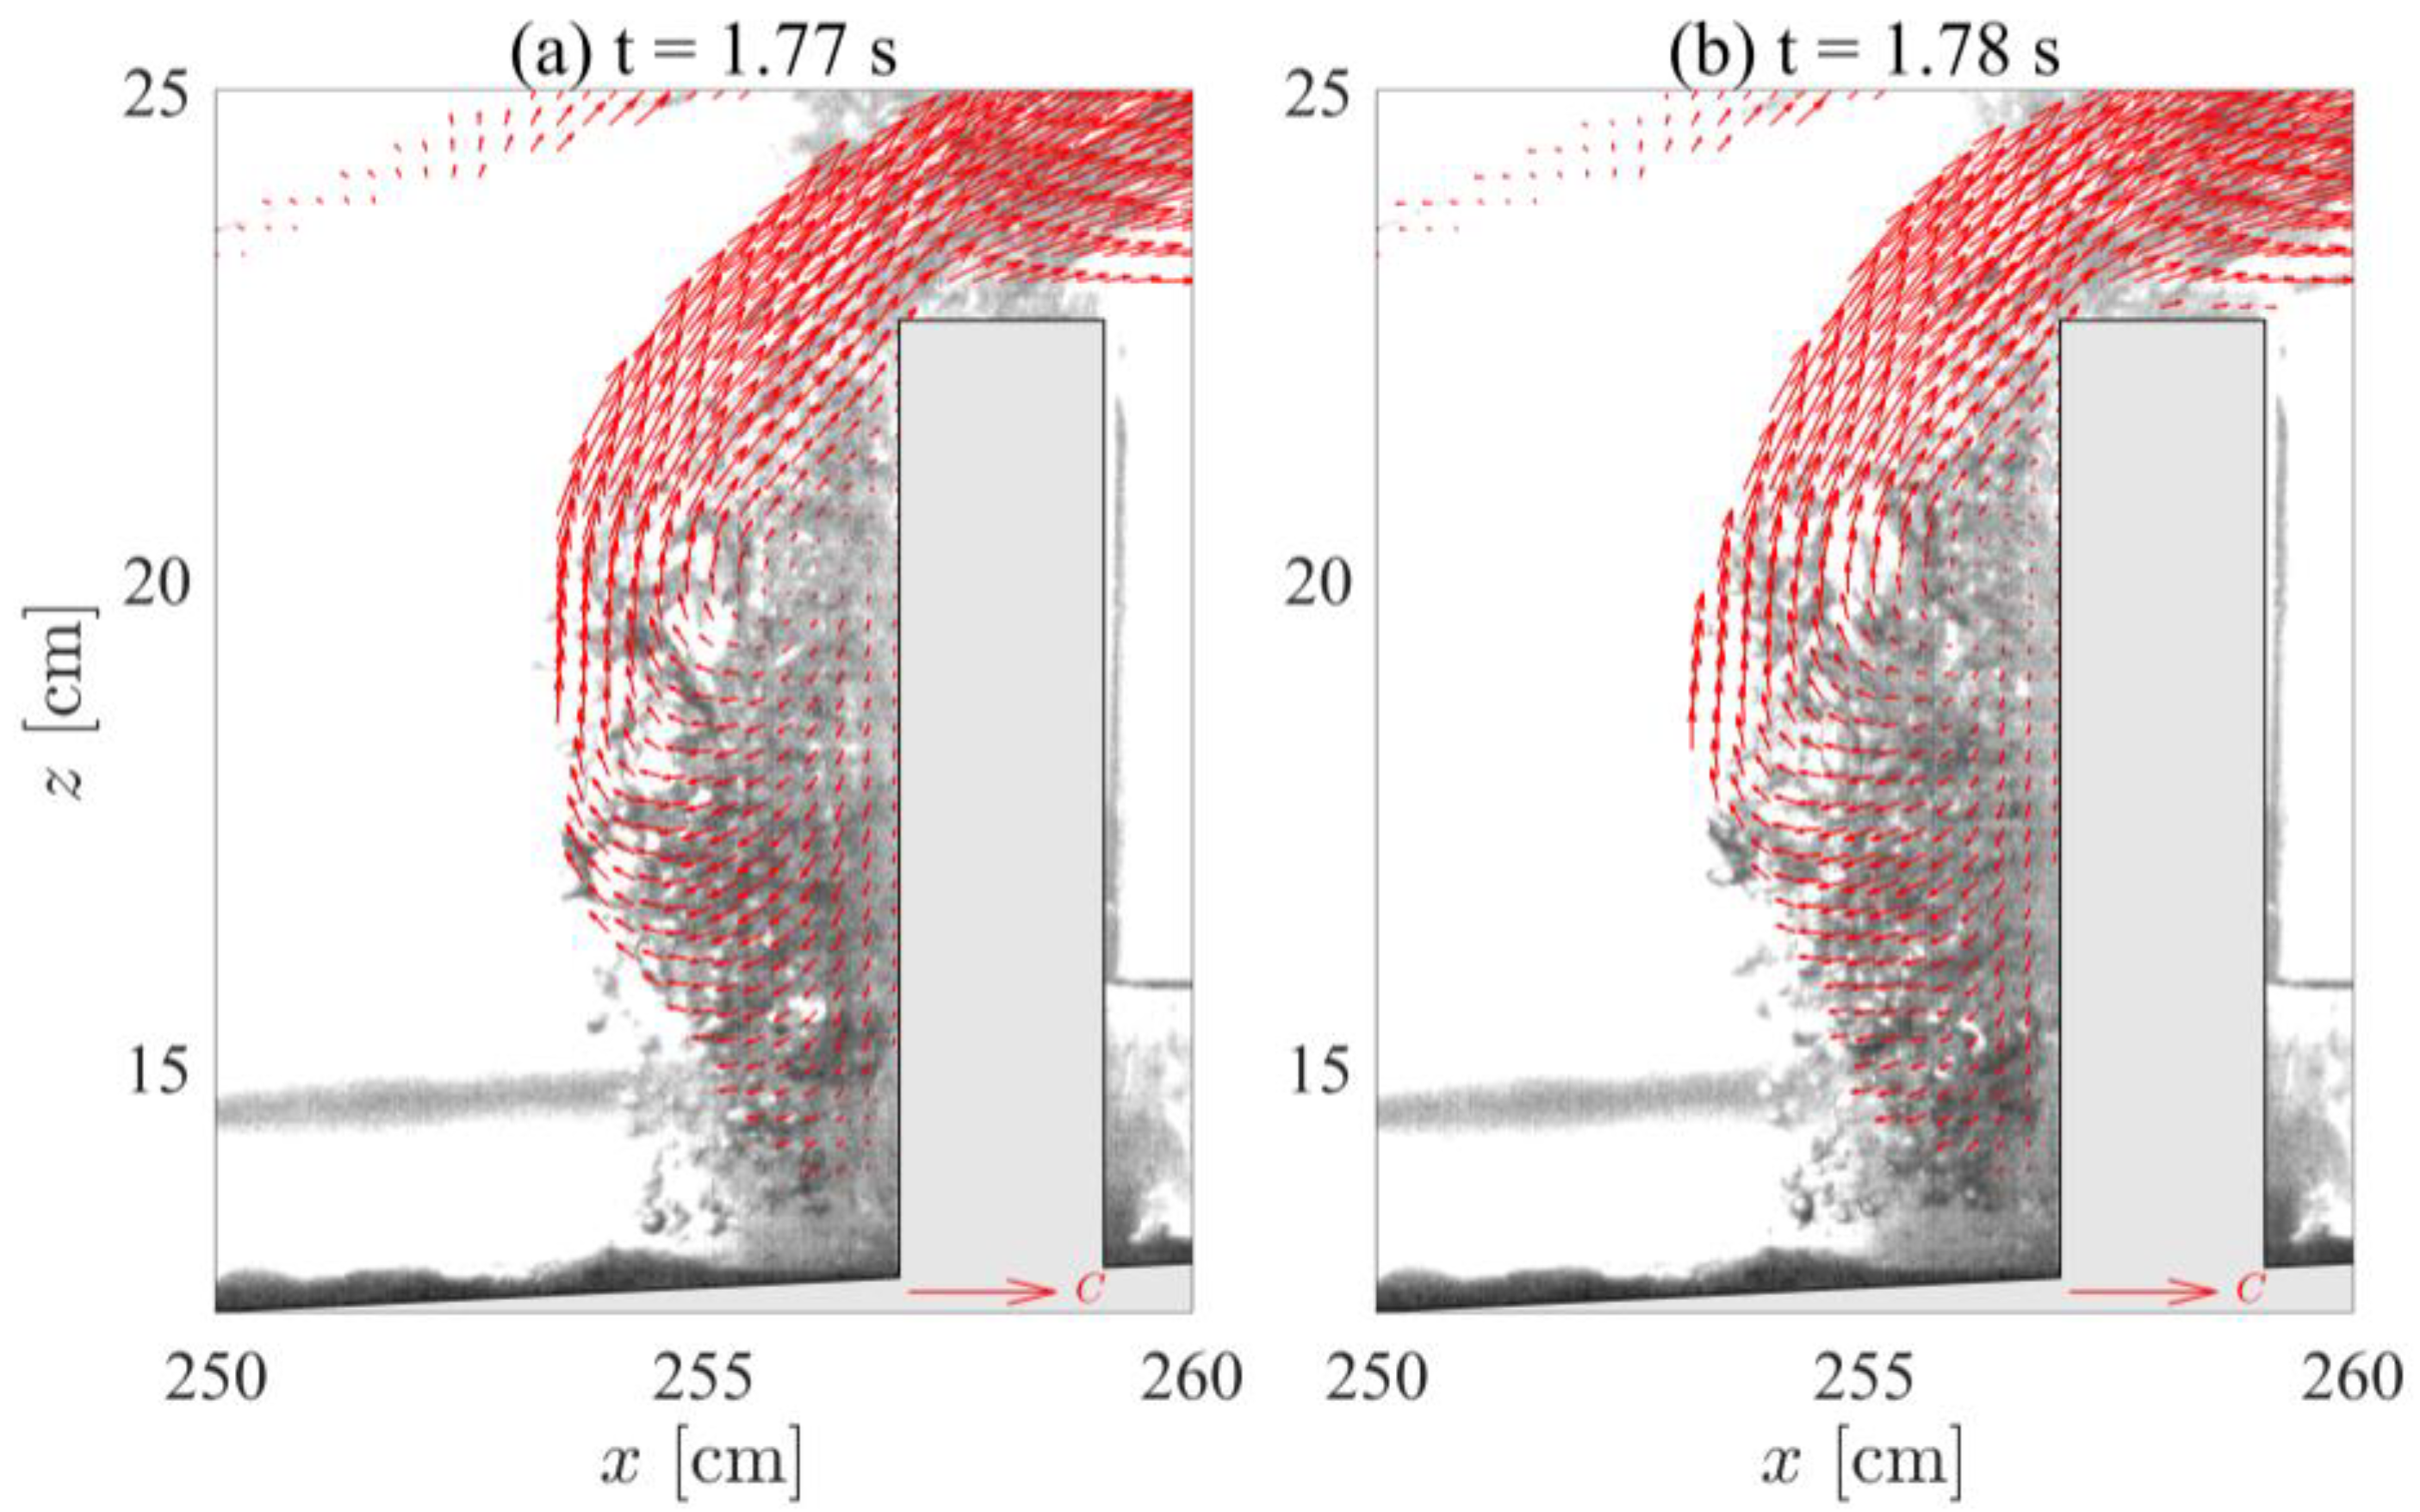
Flow-velocity fields around the toe of seawall are of concern, as related to wave-induced seawall scour [43]. In Figure 6, a closer view near the front side of the seawall is presented. A clockwise-rotating vortex is observed in front of the seawall because of the overturning wave that entrains air bubbles. This vortex then moves downward to the intersection of the slope and the seawall, which may be a reason for the possible scour of the structure’s foundation. Since the flow fields were only measured for aerated regions in this study, detailed flow characteristics for the entire area cannot be obtained. This deserves further investigation via simultaneous measurements using PIV and BIV, such as in [40], to facilitate an understanding for such complicated phenomena.
The right column of Figure 5 shows the turbulence intensity normalized by the phase celerity of a solitary wave. Before the wave impacts on the seawall, the turbulence fields are mainly attributed to the wave breaking of a shoaling solitary wave and the maximum magnitude of turbulence intensity during the time instants from t = 1.53 s to 1.61s is roughly 0.4 C [Figure 5a–c]. Right after the wave interacts with the seawall, the maximum value of turbulence intensity during the entire wave-structure interaction process is observed at t = 1.66 s with a value of roughly 0.9 C. The timing where the maximum turbulence occurred is associated with the initiation of vertically up-rushing flows and is close to that shown in Figure 5d. During the overtopping dominated process, the level of normalized turbulence intensity is relatively low, less than 0.3 C.
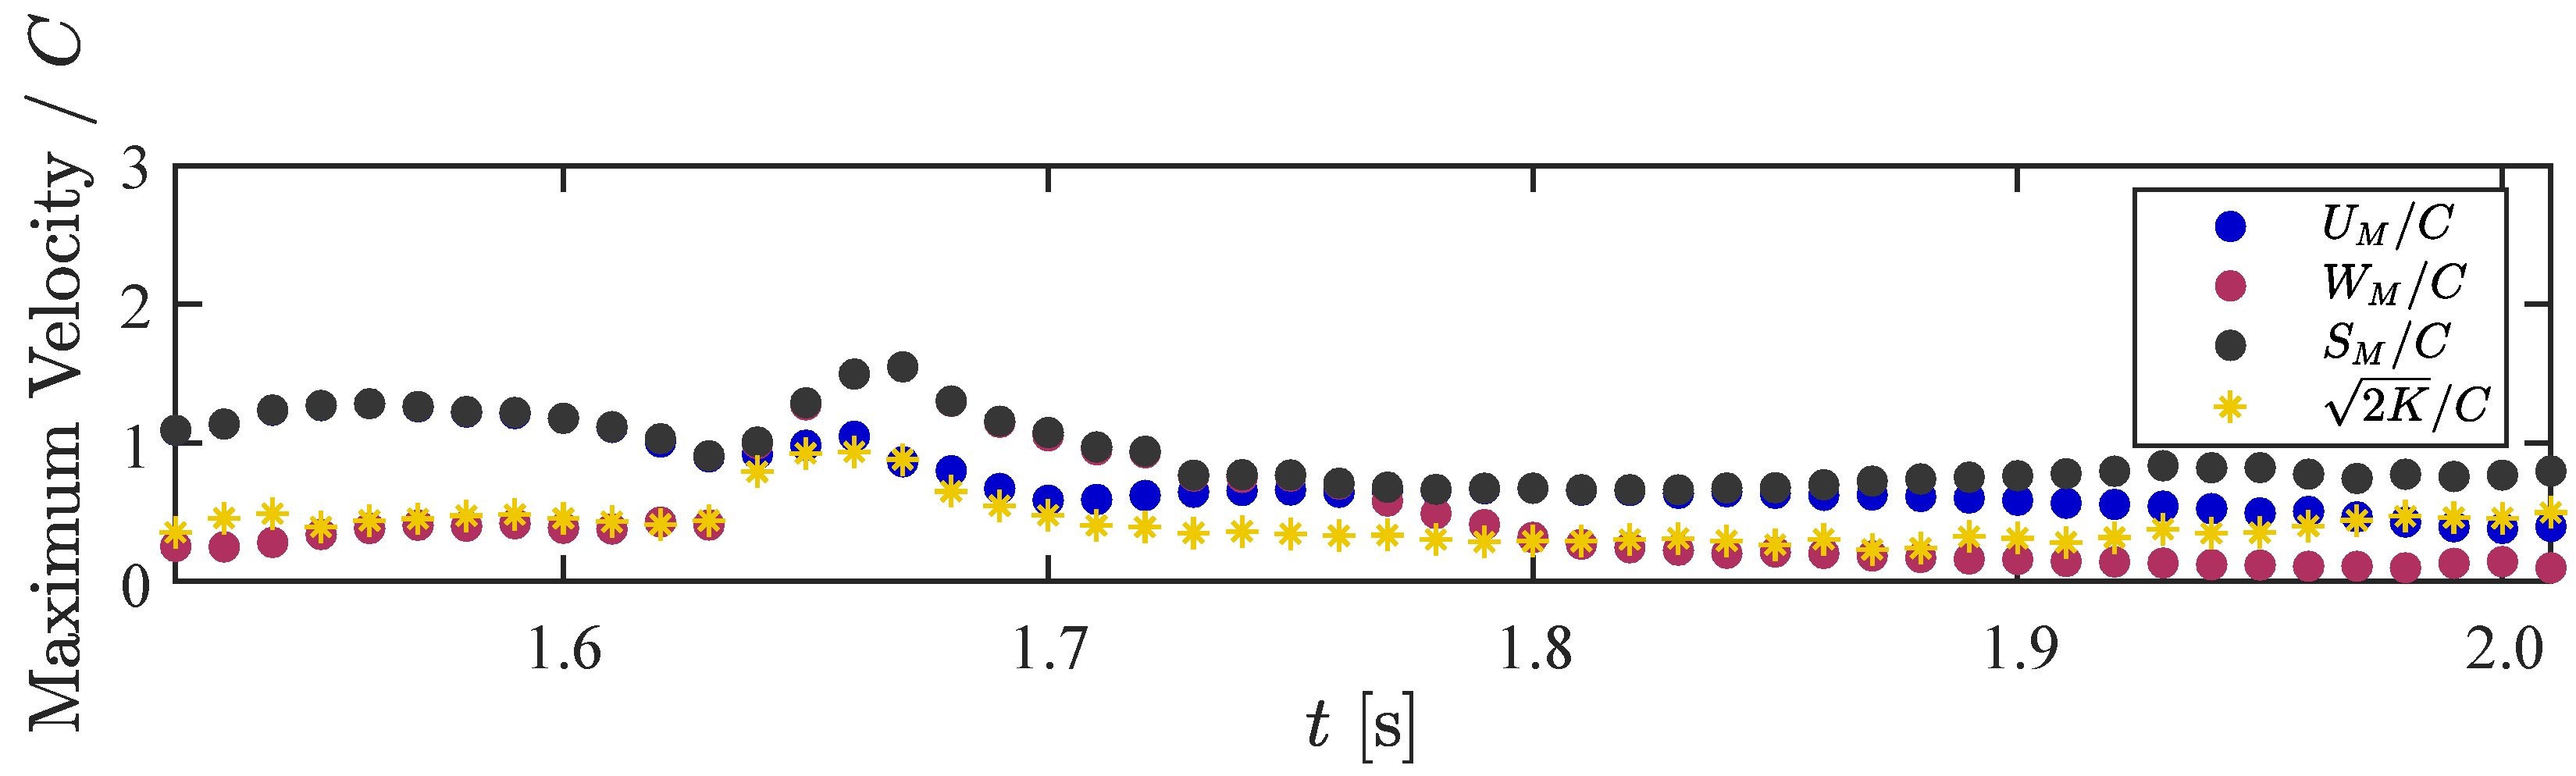
Based on the measured velocity and turbulence fields, the maximum horizontal velocities (), maximum vertical velocities (), maximum speed () and maximum turbulence intensity () are extracted at each time instant over the entire set of measurements. Noted that is defined as , where and denotes the horizontal and vertical velocities, respectively. Figure 7 shows the time history of the maximum velocities normalized by the wave celerity. Clearly, the wave-breaking process is dominated by the horizontal velocity and, after the plunging breaker has fully developed, the horizontal velocity starts to decrease. The maximum horizontal velocity during wave breaking is 1.3 C. This value is close to those of deep-water breaking waves, such as 1.5 C [31] and 1.4 C [34,44]. Transferring the dominating momentum from horizontal to vertical is triggered by the up-rushing sprays due to wave-structure interaction, where the maximum vertical velocity is around 1.8 C. The measured velocity caused by the vertical jet is lower than those reported in [31,44] for deep-water breaking wave impacts on floating structures, i.e., 2.9 C and 2.8 C, respectively. Such differences may be partly due to the use of different generating mechanisms of breaking wave and types of vertical structures.
In short, for this case, the process of a shoaling solitary wave impacts on a vertical seawall can be categorized into the following three phases: (1) wave overturning to form a fully developed breaking wave, (2) wave impacts on the seawall with a vertical splashing jet moving upward, and (3) wave overtopping to form a “question mark”-like flow pattern. Since the breaking process is highly turbulent, it is worthy to create different types of breaking wave to study its interactions with the seawall.
3.2. Low-Aerated Case (H/h = 0.30)
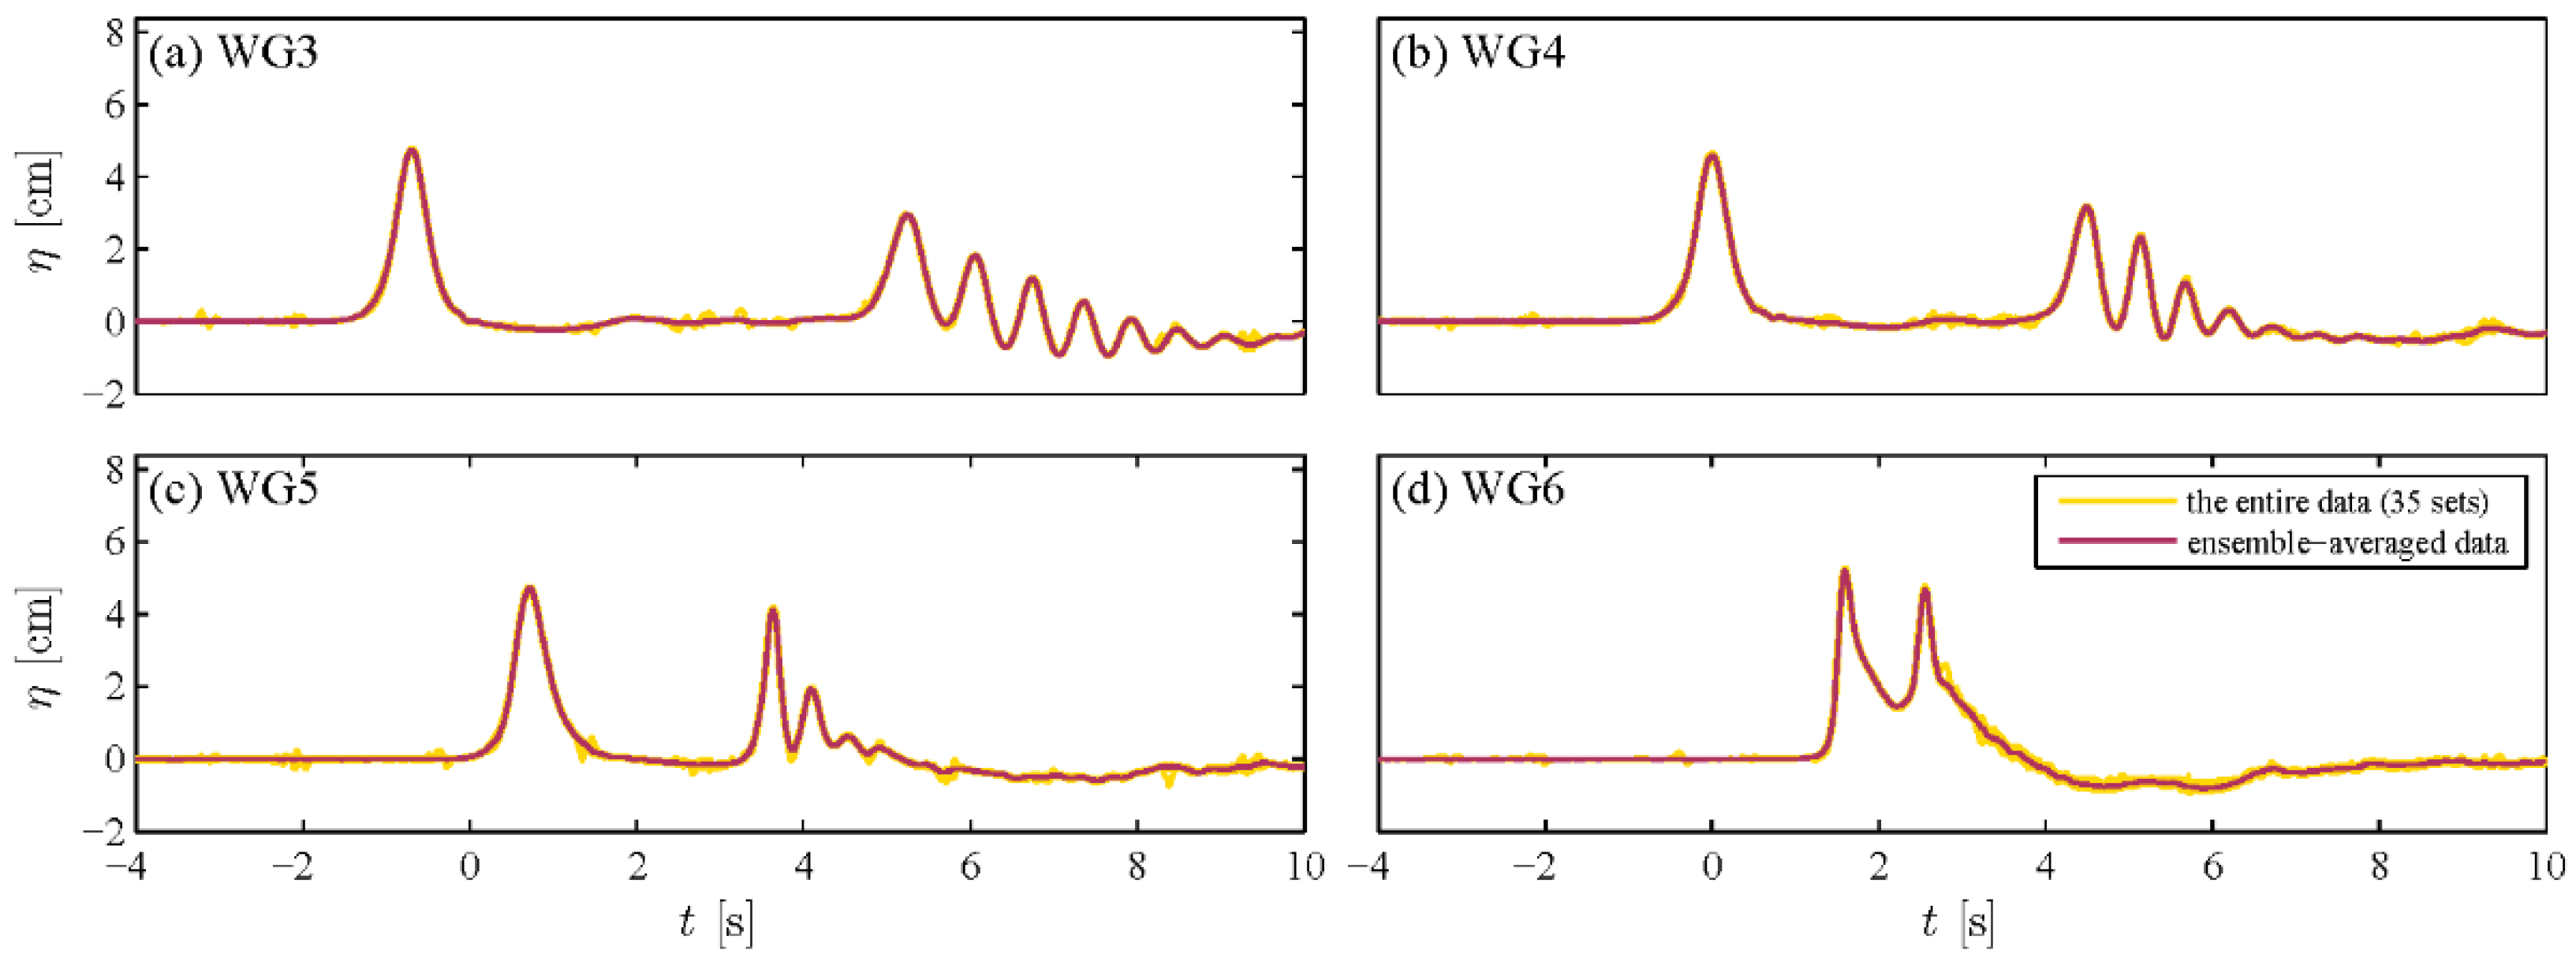
Figure 8 shows the time history of free-surface elevation for the case of H/h = 0.30, in which the associated phase speed is equal to C = 1.42 m/s. Similarly, the entire wave gauge dataset, i.e., 35 repetitions for this case, are plotted along with the ensemble-averaged data. The agreement is again well, showing a high degree of repeatability since the same criterion of less than 2% standard deviation is held to control the quality of the measured data. The overall features of wave gauge recording are almost the same comparing with the case of H/h = 0.46. Specially, after t > 2.1 s, a second peak is recorded by WG6 due to the presence of a vertical wall and the reflected wave height is around 0.9 times the incident wave height. The ratio of the reflected-wave height to the incident-wave height for this case, i.e., 0.9, is higher than the case of H/h = 0.46, i.e., 0.7. Such variation may be due to the fact that, for the case with small wave height, the plunging breaker has not yet fully developed prior to its impacts on the wall, such that less energy loss can be expected whereas, for the case with large wave height, the plunging breaker has fully developed with a large amount of air bubble entrainments, leading to significant level of energy dissipation. Therefore, for a low-aeration flow case, i.e., small wave height, the wave reflection coefficient is expected to be larger than the high-aeration flow case, i.e., large wave height.
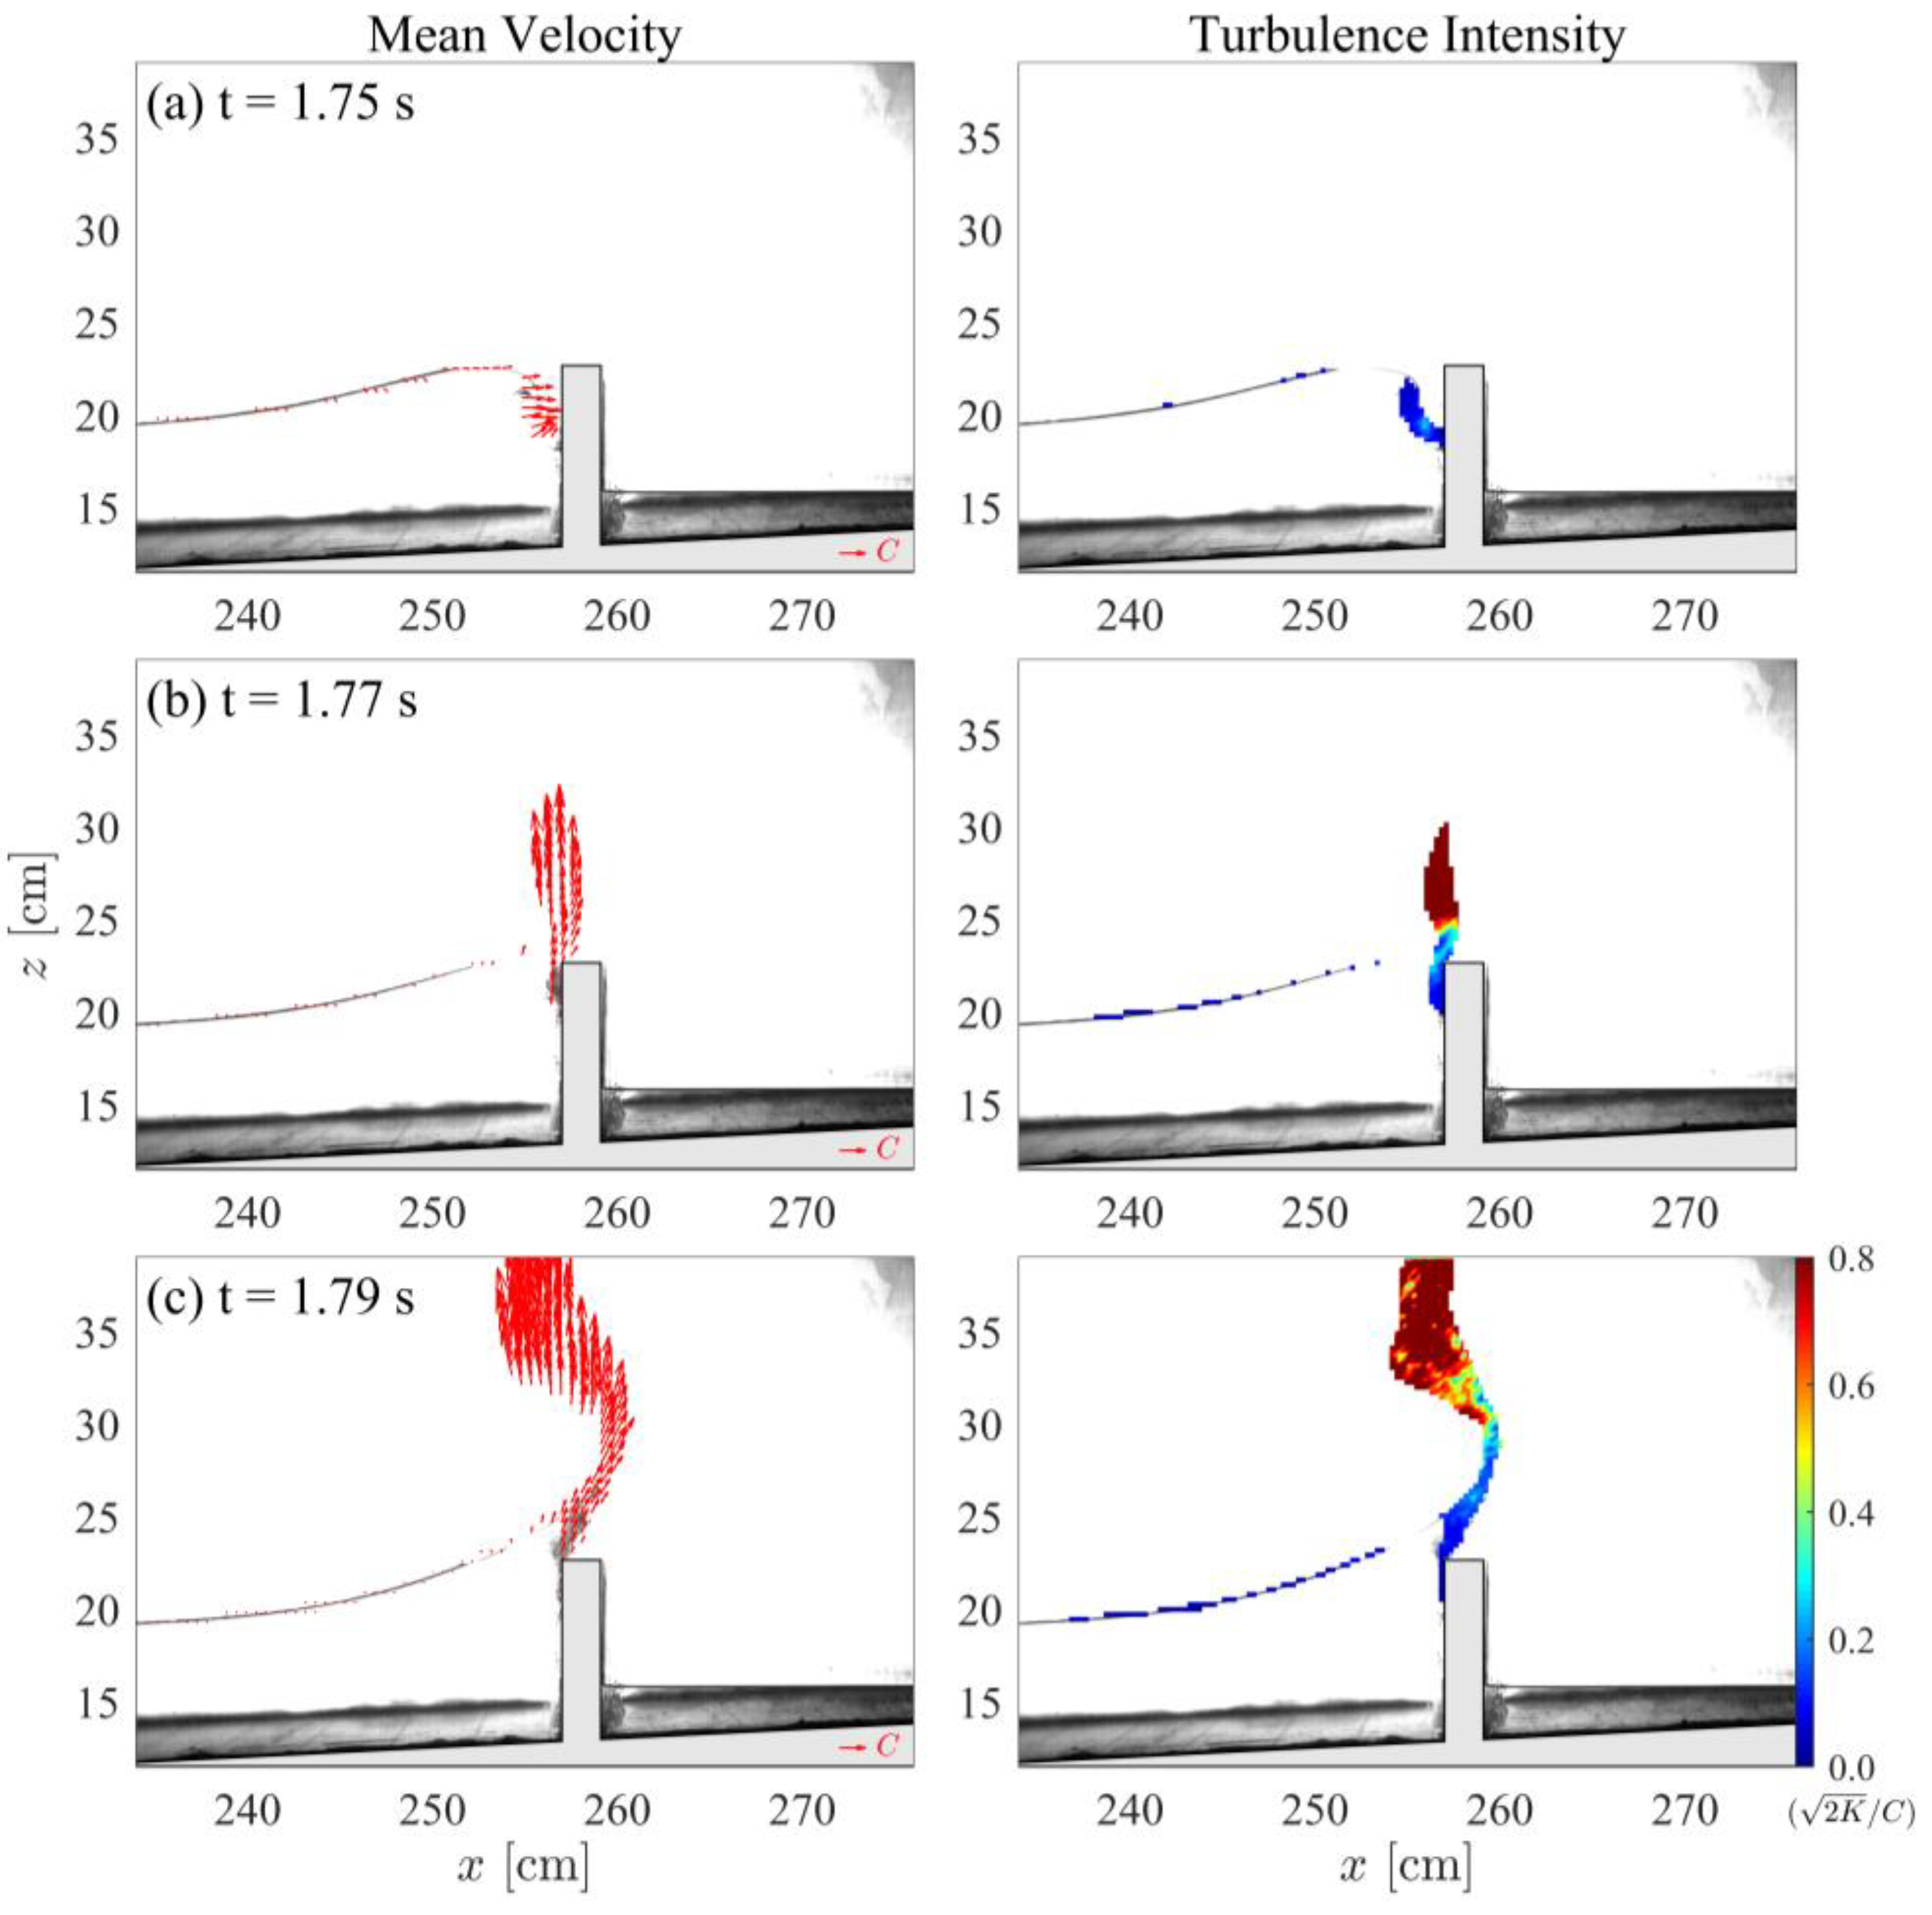
Figure 9 shows the ensemble-averaged velocity fields along with the normalized turbulence intensity for six selected time instants. As mentioned, this case is of a relatively smaller wave height, so the limited air-bubble entrainments of the breaking wave prior to its impacts on the wall can be expected. Limited air-bubble entrainment is associated with limited tracers for velocity determination using BIV. As such, this experiment was repeated up to 35 times in order to have more samples to reduce the random errors caused by the image-based measuring system.
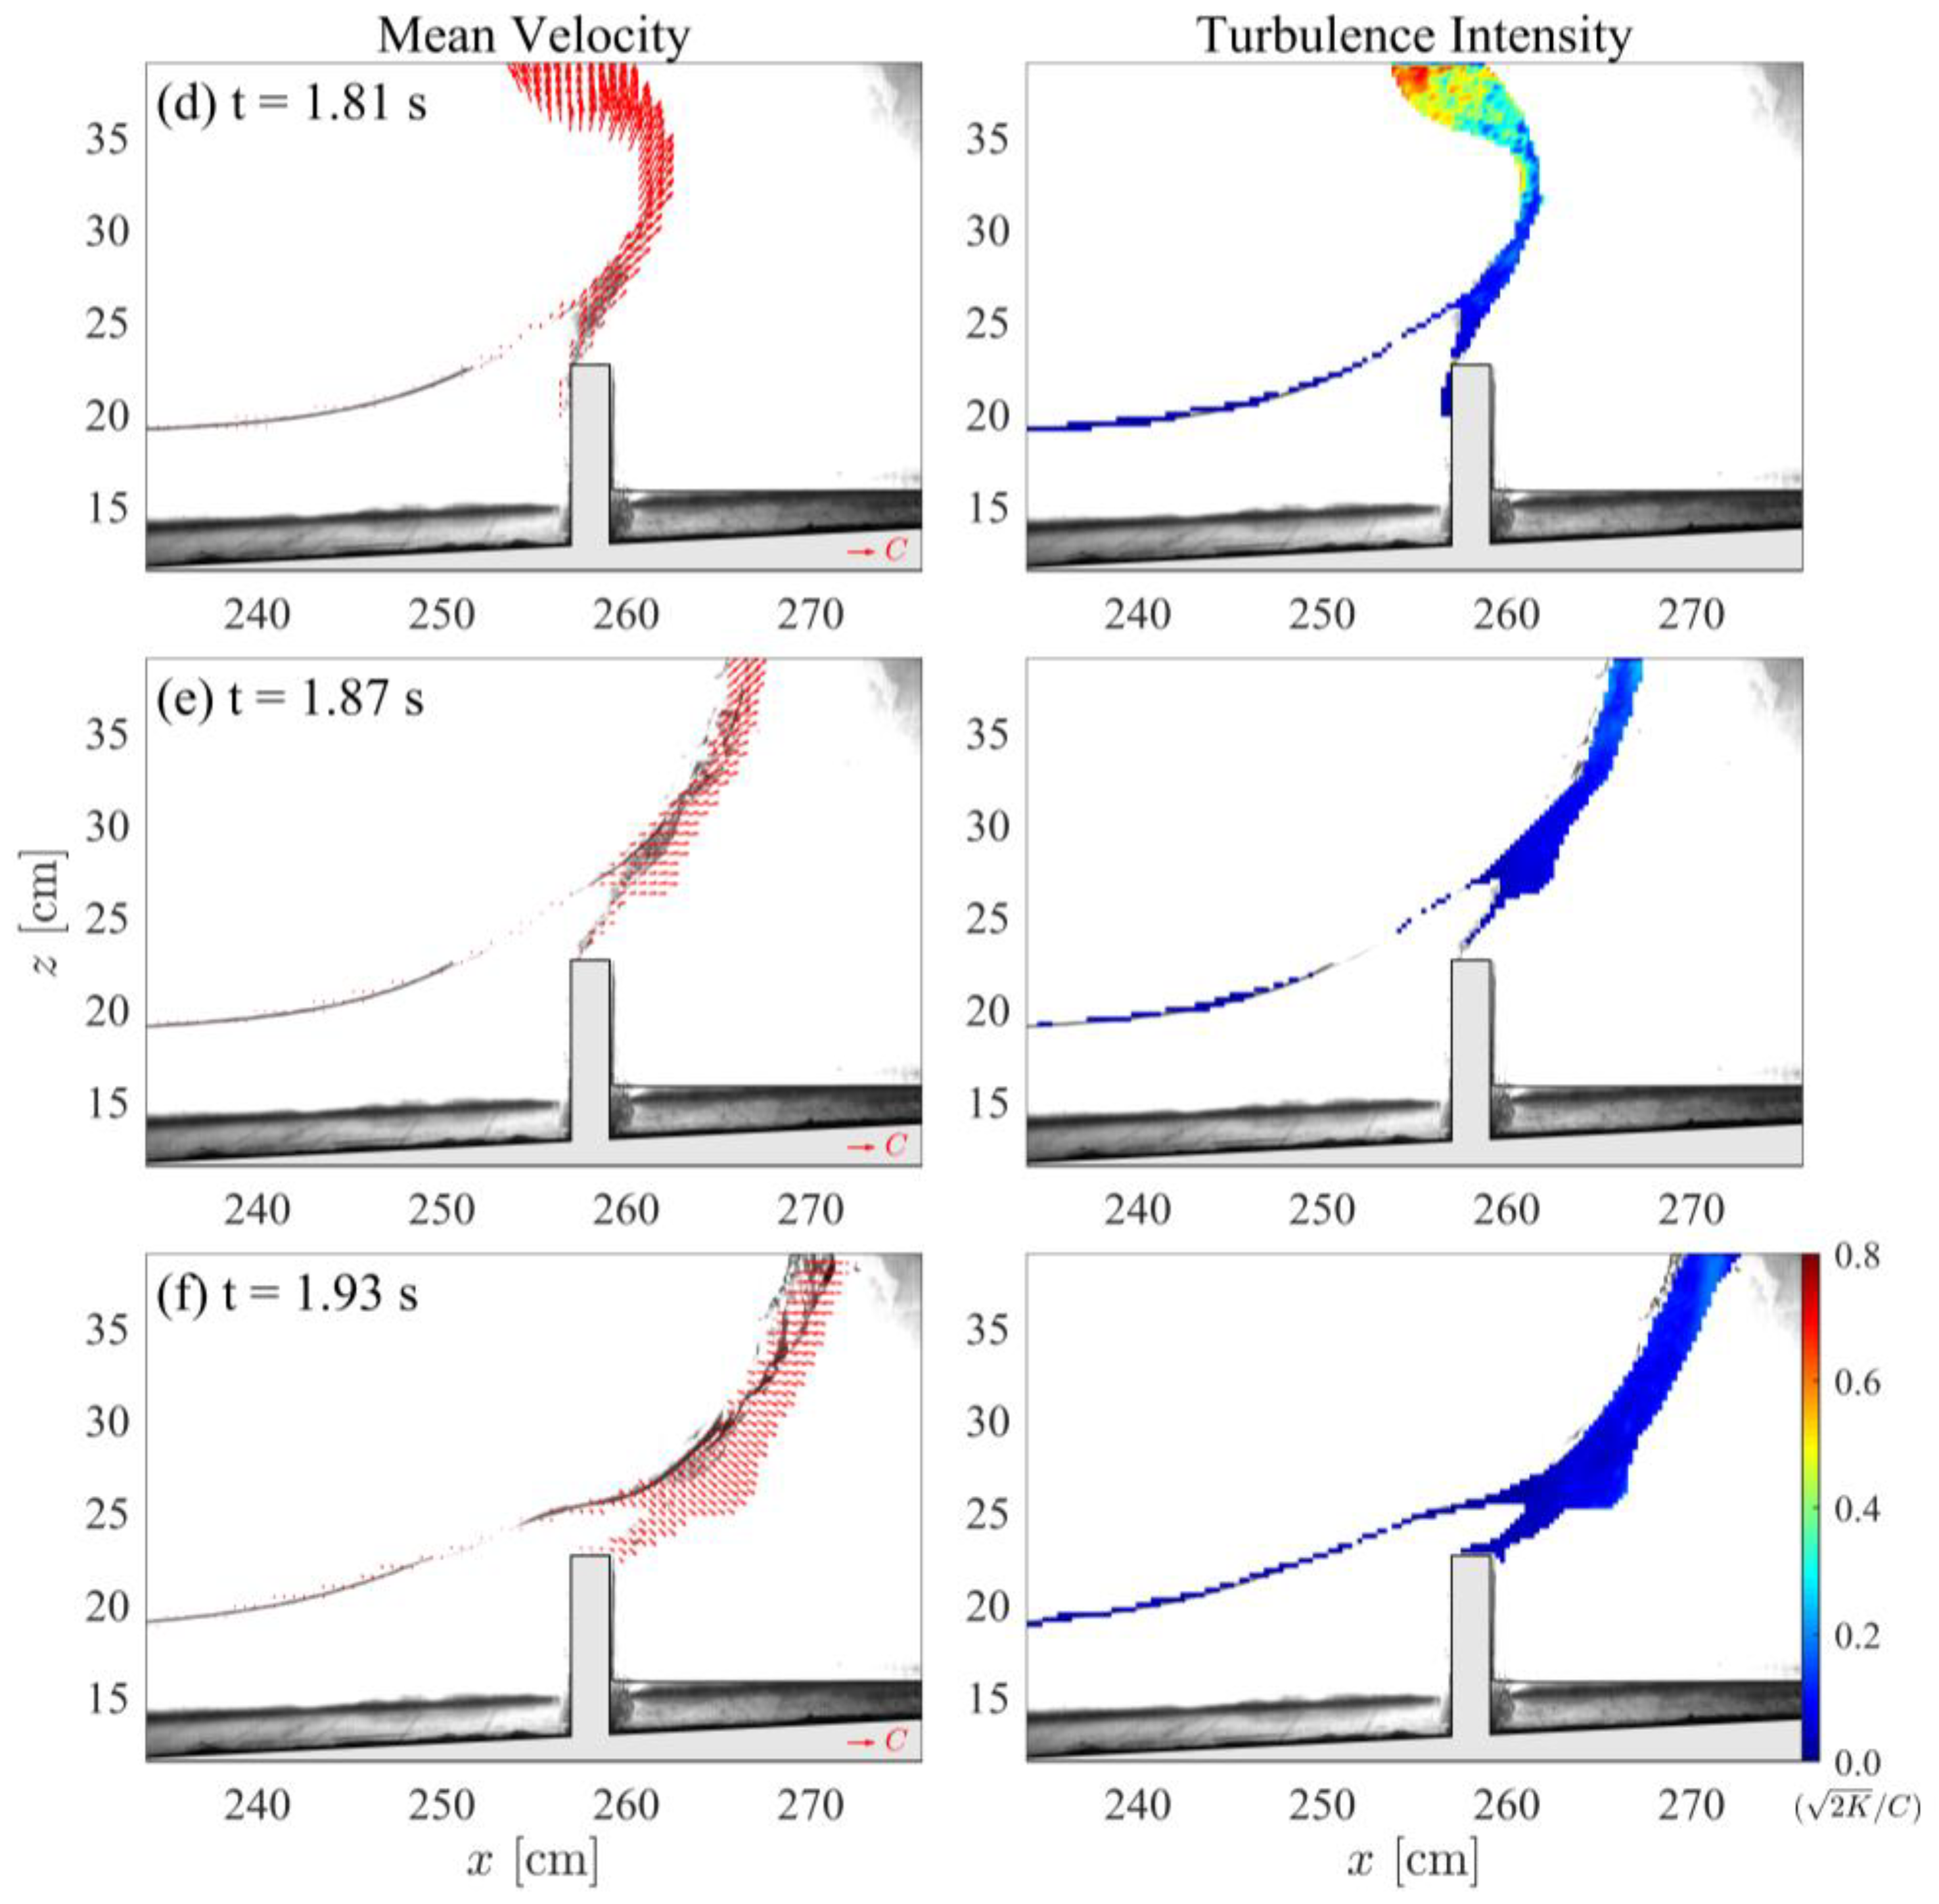
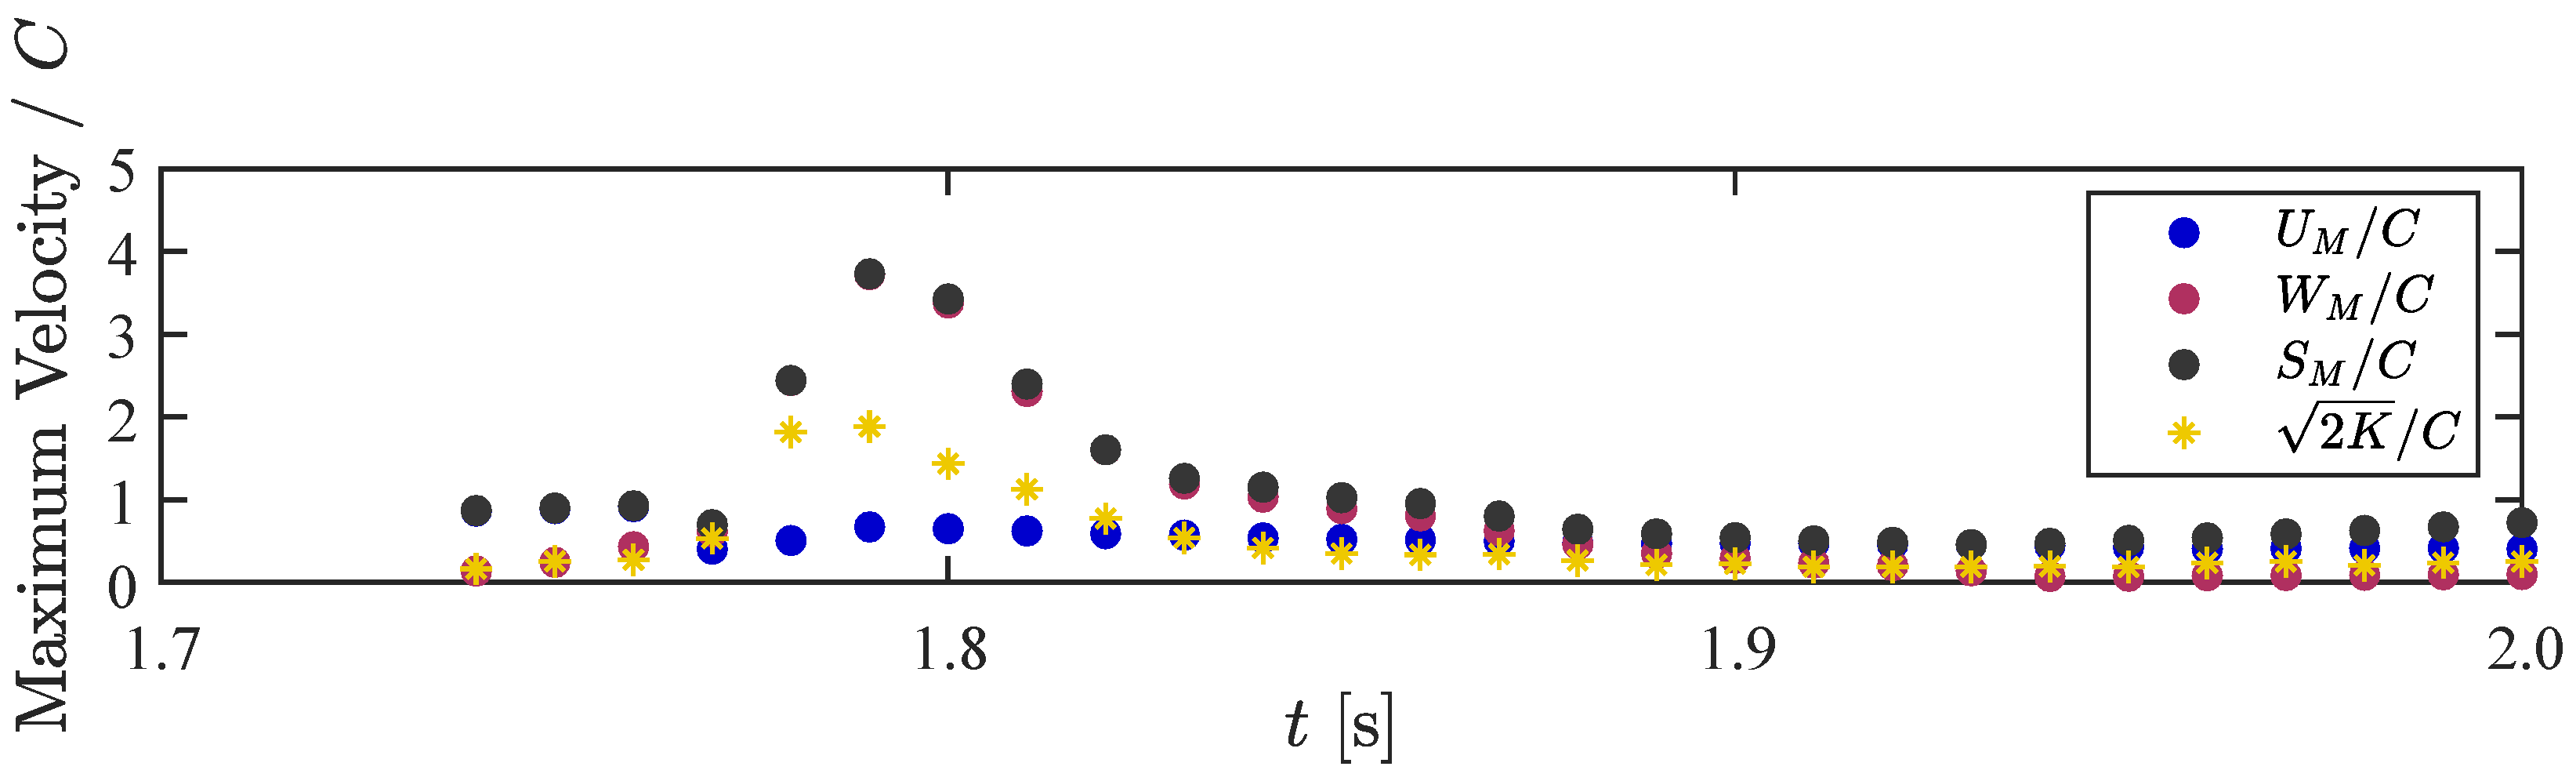
Figure 9a shows that a shoaling solitary wave initiates overturning but the overturning jet has not yet impinged onto the seawall. Additionally, the leading wave, which is free of air bubbles, starts to runup along the vertical wall prior to the occurrence of wave overturning, such that the entrained air bubbles are particularly concentrated near the top region of the seawall instead of close to the still-water level. It is found that the aerated regions are quite limited, such that only a few velocity vectors can be determined at this time instant. Because the breaking wave has not yet fully developed, the velocity is dominated by the wave celerity, which moves horizontally. Its local maximum value is around 0.9 C while the maximum vertical velocity is less than 0.4 C. Right after the wave impacts on the wall, similar to the high-aerated case, the dominated momentum becomes the vertical velocity, which increases from around 0.6 C at t = 1.77 s [Figure 9b], 2.4 C at t = 1.78 s and to its maxima of 3.7 C at t = 1.79 s [Figure 9c]. The corresponding time series of maximum velocities can be seen in Figure 10. For this case, the magnitude of around 4.0 C for vertical velocity during the uprush phase is more close to the previous studies [7]. Obviously, the maximum vertical velocity for a low-aerated case, i.e., 3.7 C, is higher than the high-aerated case, i.e., 1.8 C. Such a noticeable variation of the vertical velocity between high- and low-aerated cases may be attributed to the level of energy dissipation before the breaking wave impacts on the seawall. After t > 1.79 s, the maximum vertical velocity is reduced to values of around 3.4 C at t = 1.80 s, 2.3 C at t = 1.81 s [Figure 9d] and less than 1.0 C after t = 1.85 s [Figure 9e–f]. Probably because the breaking wave has not fully developed, the maximum horizontal velocity during the whole process of wave-structure interactions is around 0.7 C, which is recorded from t = 1.79 s to 1.85 s.
Compared to the high-aerated case, the evolution of wave overtopping of both cases are quite similar—the entrained air bubbles firstly splash upward and overtop the crown of the seawall to the landward side. More specifically, for the case of H/h = 0.30, the aerated flows consist of mostly “clear” fluid and limited air bubble entrainments. Then, the splashing flows drop down due to gravity. Interestingly, for the low-aerated case, the generated sprays and splashing jet are mostly falling down into the landward side of the seawall, which indicates that the overtopping flows are of higher momentum to moving forward than the high-aerated case. According to laboratory observations, the splashing jets produced by the low-aerated case do frequently spread out of the flume although its initial wave height is lower.
In terms of the turbulence intensity, before the wave impacts on the wall, the local maximum value at t = 1.75 s is around 0.25 C [Figure 9a]. During the phases of creating the upward-splashing jet, the maximum value is observed at t = 1.79 s [Figure 9c], with a value of 1.3 C, while it slightly reduces to a value of roughly 1.2 C at t = 1.80 s. After that, the turbulence level rapidly decreases to a value of around 0.2 C from t = 1.85 s to t = 1.95 s [Figure 9e–f]. It is found that the maximum vertical velocity and maximum turbulence intensity are recorded at the same instant, i.e., t = 1.79 s, which is attributed to the vertical jet. This observation is consistent with those of measurements for deep-water breaking wave and floating-platform interactions [44]. Furthermore, Hull and Müller [11] found that, for the flip-through breaker, the particle velocities of wave front close to the wall aimed at one point on the seawall. A similar phenomenon is observed for the low-aerated case, as shown in Figure 9a.
Figure 10 shows the time history of the normalized maximum velocities and turbulence intensities obtained from BIV measured velocity maps. Clearly, the wave-seawall interactions are dominated by the vertical velocity during the impacts and the horizontal velocity only dominates when the wave has not yet interacted with the structure and overtopped the seawall. A comparison between these two cases shows that the low-aerated case produces a much higher vertically up-rushing velocity than that of the high-aerated case, i.e., 3.7 C vs. 1.8 C, whereas the overtopping flow velocity in the horizontal direction is around 0.8 C and 0.7 C for the high- and low-aerated cases, respectively, indicating that the overtopping velocities in the horizontal direction are of the same order of magnitude for both cases investigated in this study.
4. Conclusions
Breaking waves impinging on and overtopping vertical seawalls have been investigated over decades, but there is still a limited understanding of the related wave hydrodynamics in terms of flow velocity and turbulent kinetic energy. In this study, an image-based measuring system BIV was used to measure the flow velocities in the highly aerated regions due to the interactions of a shoaling solitary wave and a vertical seawall. Two scenarios were designed in order to reproduce high- and low-aerated flows, respectively. The experimental results supported the following conclusions.
The wave reflection caused by the vertical seawall for the low-aerated case was higher than that of the high-aerated case. In terms of flow kinematics, it was found that the maximum velocity was dominated by the vertical component only during the phases of wave impacts on the wall and upward-splashing jet. The maximum vertical velocity was around 1.8 C for the high-aerated case and up to 3.7 C for the low-aerated case. Similarly, the maximum turbulence intensity obtained from the low-aerated case was larger than that of the high-aerated case. The maximum turbulence intensity was found at the point the splashing jet was produced, in which this feature is consistent with the existing study investigating deep-water breaking wave impacts a floating structure. Surprisingly, the measured horizontal velocities of overtopping flows were similar for both cases.
Since this study only focuses on breaking waves with different aeration levels interacting with a particularly designed vertical seawall, different types of seawalls along with different impinging points of breaking waves in relation to the wall deserve further investigation in order to develop a deeper understanding of the wave hydrodynamics due to the complicated wave-structure interactions. The measured results can be used to validate numerical simulations to facilitate the development of multi-phase numerical models for coastal and ocean engineering applications.
Funding
This research was funded by the Ministry of Science and Technology, Taiwan (MOST 108-2218-E-006-053-MY3) and, in part, by Higher Education Sprout Project, Ministry of Education to the Headquarters of University Advancement at National Cheng Kung University.
Data Availability Statement
The data presented in this study are available on request from the corresponding author.
Acknowledgments
The author sincerely appreciates Hwung-Hweng Hwung, Ray-Yeng Yang, and the staffs of Tainan Hydraulics Laboratory of National Cheng Kung University for their help in the experiment. Special thanks go to Nans Bujan for allowing the author to use the photograph in Figure 1.
Conflicts of Interest
The author declares no conflict of interest.
References
- Koosheh, A.; Etemad-Shahidi, A.; Cartwright, N.; Tomlinson, R.; van Gent, M.R.A. Individual wave overtopping at coastal structures: A critical review and the existing challenges. Appl. Ocean Res. 2021, 106, 102476. [Google Scholar] [CrossRef]
- Wang, D.; Li, S.; Arikawa, T.; Gen, H. ISPH simulation of scour behind seawall due to continuous tsunami overflow. Coast. Eng. J. 2016, 58, 1650014. [Google Scholar] [CrossRef]
- Mase, H.; Kimura, Y.; Yamakawa, Y.; Yasuda, T.; Mori, N.; Cox, D. Were coastal defensive structures completely broken by an unexpectedly large tsunami? A field survey. Earthq. Spectra 2013, 29, S145–S160. [Google Scholar] [CrossRef]
- Jayaratne, M.P.R.; Premaratne, B.; Adewale, A.; Mikami, T.; Matsuba, S.; Shibayama, T.; Esteban, M.; Nistor, I. Failure mechanisms and local scour at coastal structures induced by tsunami. Coast. Eng. J. 2016, 58, 1640017. [Google Scholar] [CrossRef] [Green Version]
- Xiao, H.; Huang, W.; Tao, J. Numerical modeling of wave overtopping a levee during Hurricane Katrina. Comput. Fluids 2009, 38, 991–996. [Google Scholar] [CrossRef]
- EurOtop. Manual on Wave Overtopping of Sea Defences and Related Structures: An Overtopping Manual Largely Based on European Research, but for Worldwide Application; 2018; Available online: http://www.overtopping-manual.com/assets/downloads/EurOtop_II_2018_Final_version.pdf (accessed on 11 January 2022).
- Chan, E.S.; Melville, W.K. Deep-water plunging wave pressures on a vertical plane wall. Proc. Roy. Soc. A-Math Phy. 1988, 417, 95–131. [Google Scholar]
- Kirkgöz, M.S. An experimental investigation of a vertical wall response to breaking wave impact. Ocean Eng. 1990, 17, 379–391. [Google Scholar] [CrossRef]
- Kirkgöz, M.S. Influence of water depth on the breaking wave impact on vertical and sloping walls. Coast. Eng. 1992, 18, 297–314. [Google Scholar] [CrossRef]
- Hattori, M.; Arami, A.; Yui, T. Wave impact pressure on vertical walls under breaking waves of various types. Coast. Eng. 1994, 22, 79–114. [Google Scholar] [CrossRef]
- Hull, P.; Müller, G. An investigation of breaker heights, shapes and pressures. Ocean Eng. 2002, 29, 59–79. [Google Scholar] [CrossRef]
- Bruce, T.; Pearson, J.; Allsop, W. Hazards at coast and harbour seawalls—velocities and trajectories of violent overtopping jets. In Proceedings of the 28th International Conference on Coastal Engineering, Cardiff, Wales, 7–12 July 2003; pp. 2216–2226. [Google Scholar]
- Jensen, A. Solitary wave impact on a vertical wall. Eur. J. Mech.—B/Fluids 2019, 73, 69–74. [Google Scholar] [CrossRef]
- Watanabe, Y.; Ingram, D.M. Transverse instabilities of ascending planar jets formed by wave impacts on vertical walls. Proc. R. Soc. A Math. Phys. Eng. Sci. 2015, 471, 20150397. [Google Scholar] [CrossRef] [Green Version]
- Watanabe, Y.; Ingram, D.M. Size distributions of sprays produced by violent wave impacts on vertical sea walls. Proc. R. Soc. A Math. Phys. Eng. Sci. 2016, 472, 20160423. [Google Scholar] [CrossRef] [PubMed] [Green Version]
- Bullock, G.N.; Obhrai, C.; Peregrine, D.H.; Bredmose, H. Violent breaking wave impacts. Part 1: Results from large-scale regular wave tests on vertical and sloping walls. Coast. Eng. 2007, 54, 602–617. [Google Scholar] [CrossRef]
- Cuomo, G.; Allsop, W.; Bruce, T.; Pearson, J. Breaking wave loads at vertical seawalls and breakwaters. Coast. Eng. 2010, 57, 424–439. [Google Scholar] [CrossRef] [Green Version]
- Peregrine, D.H. Water-wave impact on walls. Annu. Rev. Fluid Mech. 2003, 35, 23–43. [Google Scholar] [CrossRef]
- Chuang, W.-L.; Chang, K.-A.; Mercier, R. Impact pressure and void fraction due to plunging breaking wave impact on a 2D TLP structure. Exp. Fluids 2017, 58, 68. [Google Scholar] [CrossRef]
- Chang, K.-A.; Liu, P.L.-F. Experimental investigation of turbulence generated by breaking waves in water of intermediate depth. Phys. Fluids 1999, 11, 3390–3400. [Google Scholar] [CrossRef]
- Ryu, Y.; Chang, K.-A.; Lim, H.-J. Use of bubble image velocimetry for measurement of plunging wave impinging on structure and associated greenwater. Meas. Sci. Technol. 2005, 16, 1945–1953. [Google Scholar] [CrossRef]
- Wu, Y.-T.; Liu, P.L.-F.; Hwang, K.-S.; Hwung, H.-H. Runup of laboratory-generated breaking solitary and periodic waves on a uniform slope. J. Waterw. Port Coast. Eng. 2018, 144, 04018023. [Google Scholar] [CrossRef]
- Lin, C.; Wong, W.-Y.; Kao, M.-J.; Tsai, C.-P.; Hwung, H.-H.; Wu, Y.-T.; Raikar, R. Evolution of velocity field and vortex structure during run-down of solitary wave over very steep beach. Water 2018, 10, 1713. [Google Scholar] [CrossRef] [Green Version]
- Tsaousis, T.D.; Chatjigeorgiou, I.K. An analytical approach for the two-dimensional plunging breaking wave impact on a vertical wall with air entrapment. Fluids 2020, 5, 58. [Google Scholar] [CrossRef]
- Wu, Y.-T.; Higuera, P.; Liu, P.L.-F. On the evolution and runup of a train of solitary waves on a uniform beach. Coast. Eng. 2021, 170, 104015. [Google Scholar] [CrossRef]
- Goring, D.G. Tsunamis-the Propagation of Long Waves onto a Shelf. Ph.D. Thesis, California Institute of Technology, Pasadena, CA, USA, 1978. [Google Scholar]
- Wu, Y.-T.; Hsiao, S.-C.; Huang, Z.-C.; Hwang, K.-S. Propagation of solitary waves over a bottom-mounted barrier. Coast. Eng. 2012, 62, 31–47. [Google Scholar] [CrossRef]
- Wu, Y.-T.; Hsiao, S.-C. Generation of stable and accurate solitary waves in a viscous numerical wave tank. Ocean Eng. 2018, 167, 102–113. [Google Scholar] [CrossRef]
- Grimshaw, R. The solitary wave in water of variable depth. Part 2. J. Fluid Mech. 1971, 46, 611–622. [Google Scholar] [CrossRef]
- Grilli, S.T.; Svendsen, I.A.; Subramanya, R. Breaking criterion and characteristics for solitary waves on slopes. J. Waterw. Port Coast. Eng. 1997, 123, 102–112. [Google Scholar] [CrossRef] [Green Version]
- Ryu, Y.; Chang, K.-A.; Mercier, R. Runup and green water velocities due to breaking wave impinging and overtopping. Exp. Fluids 2007, 43, 555–567. [Google Scholar] [CrossRef]
- Wu, Y.-T.; Hsiao, S.-C. Propagation of solitary waves over a submerged slotted barrier. J. Mar. Sci. Eng. 2020, 8, 419. [Google Scholar] [CrossRef]
- Mori, N.; Chang, K.-A. Introduction to MPIV. Available online: http://www.oceanwave.jp/softwares/mpiv/ (accessed on 11 January 2022).
- Chang, K.-A.; Ariyarathne, K.; Mercier, R. Three-dimensional green water velocity on a model structure. Exp. Fluids 2011, 51, 327–345. [Google Scholar] [CrossRef]
- Song, Y.K.; Chang, K.-A.; Ariyarathne, K.; Mercier, R. Surface velocity and impact pressure of green water flow on a fixed model structure in a large wave basin. Ocean Eng. 2015, 104, 40–51. [Google Scholar] [CrossRef]
- Song, Y.K.; Chang, K.-A.; Ryu, Y.; Kwon, S. Experimental study on flow kinematics and impact pressure in liquid sloshing. Exp. Fluids 2013, 54, 1592. [Google Scholar] [CrossRef]
- Lim, H.-J.; Chang, K.-A.; Huang, Z.-C.; Na, B. Experimental study on plunging breaking waves in deep water. J. Geophys. Res. Ocean. 2015, 120, 2007–2049. [Google Scholar] [CrossRef]
- Rivillas-Ospina, G.; Pedrozo-Acuña, A.; Silva, R.; Torres-Freyermuth, A.; Gutierrez, C. Estimation of the velocity field induced by plunging breakers in the surf and swash zones. Exp. Fluids 2012, 52, 53–68. [Google Scholar] [CrossRef]
- Wu, Y.-T.; Huang, K.-W.; Kobayashi, N. Runup of breaking solitary waves on rough uniform slopes. Ocean Eng. 2022, 245, 110551. [Google Scholar] [CrossRef]
- Lin, C.; Hsieh, S.-C.; Lin, I.-J.; Chang, K.-A.; Raikar, R.V. Flow property and self-similarity in steady hydraulic jumps. Exp. Fluids 2012, 53, 1591–1616. [Google Scholar] [CrossRef]
- Boussinesq, M.J. Théorie de l’intumescence liquide, appelée onde solitaire ou de translation, se propageant dans un canal rectangulaire. C. R. Acad. Sci. Paris 1871, 72, 755–759. [Google Scholar]
- Zhao, E.; Qu, K.; Mu, L. Numerical study of morphological response of the sandy bed after tsunami-like wave overtopping an impermeable seawall. Ocean Eng. 2019, 186, 106076. [Google Scholar] [CrossRef]
- Ahmad, N.; Bihs, H.; Myrhaug, D.; Kamath, A.; Arntsen, Ø.A. Numerical modeling of breaking wave induced seawall scour. Coast. Eng. 2019, 150, 108–120. [Google Scholar] [CrossRef]
- Chuang, W.-L.; Chang, K.-A.; Mercier, R. Green water velocity due to breaking wave impingement on a tension leg platform. Exp. Fluids 2015, 56, 139. [Google Scholar] [CrossRef]
Figure 1.
Impact of shoaling waves impinging and overtopping the harbor wall at Anping, Tainan City, Taiwan, on 8 July 2015 (Courtesy of Dr. Nans Bujan, formerly Postdoc fellow at National Cheng Kung University, Taiwan).
Figure 1.
Impact of shoaling waves impinging and overtopping the harbor wall at Anping, Tainan City, Taiwan, on 8 July 2015 (Courtesy of Dr. Nans Bujan, formerly Postdoc fellow at National Cheng Kung University, Taiwan).

Figure 2.
Sketch of experimental setup and instruments used in this study (not to scale).

Figure 3.
Comparison in terms of a wave-profile time series between ensemble-averaged measurements at WG2 and the third order theoretical solution of solitary waves [29] for the cases of (a) H/h = 0.46 and (b) H/h = 0.30.
Figure 3.
Comparison in terms of a wave-profile time series between ensemble-averaged measurements at WG2 and the third order theoretical solution of solitary waves [29] for the cases of (a) H/h = 0.46 and (b) H/h = 0.30.

Figure 4.
Measured time history of free surface elevations at the four locations, for the case of H/h = 0.46.
Figure 4.
Measured time history of free surface elevations at the four locations, for the case of H/h = 0.46.

Figure 5.
Ensemble-averaged velocity fields (left column) and normalized turbulence intensity (right column) superimposed with instantaneous background images, for the case of H/h = 0.46, at (a) t = 1.53 s, (b) t =1.57 s, (c) t = 1.61 s, (d) t = 1.65 s, (e) t = 1.69 s, (f) t = 1.73 s, (g) t = 1.77 s, (h) t = 1.81 s, and (i) t = 1.85 s.


Figure 6.
Ensemble-averaged velocity fields near the toe of the vertical seawall for the case of H/h = 0.46 at (a) t = 1.77 s and (b) t =1.78 s.
Figure 6.
Ensemble-averaged velocity fields near the toe of the vertical seawall for the case of H/h = 0.46 at (a) t = 1.77 s and (b) t =1.78 s.

Figure 7.
Time history of maximum fluid velocities and turbulence intensities normalized by the wave celerity, C, for the case of H/h = 0.46.
Figure 7.
Time history of maximum fluid velocities and turbulence intensities normalized by the wave celerity, C, for the case of H/h = 0.46.

Figure 8.
Measured time history of free surface elevations at the four locations, for the case of H/h = 0.30.
Figure 8.
Measured time history of free surface elevations at the four locations, for the case of H/h = 0.30.

Figure 9.
Ensemble-averaged velocity fields (left column) and normalized turbulence intensity (right column) superimposed with instantaneous background images, for the case of H/h = 0.30, at (a) t = 1.75 s, (b) t =1.77 s, (c) t = 1.79 s, (d) t = 1.81 s, (e) t = 1.87 s, and (f) t = 1.93 s.
Figure 9.
Ensemble-averaged velocity fields (left column) and normalized turbulence intensity (right column) superimposed with instantaneous background images, for the case of H/h = 0.30, at (a) t = 1.75 s, (b) t =1.77 s, (c) t = 1.79 s, (d) t = 1.81 s, (e) t = 1.87 s, and (f) t = 1.93 s.


Figure 10.
Time history of maximum fluid velocities and turbulence intensities normalized by the wave celerity, C, for the case of H/h = 0.30.
Figure 10.
Time history of maximum fluid velocities and turbulence intensities normalized by the wave celerity, C, for the case of H/h = 0.30.

Publisher’s Note: MDPI stays neutral with regard to jurisdictional claims in published maps and institutional affiliations. |
© 2022 by the author. Licensee MDPI, Basel, Switzerland. This article is an open access article distributed under the terms and conditions of the Creative Commons Attribution (CC BY) license (https://creativecommons.org/licenses/by/4.0/).
Share and Cite
MDPI and ACS Style
Wu, Y.-T. Breaking Solitary Wave Impact on a Vertical Seawall. Water 2022, 14, 583. https://0-doi-org.brum.beds.ac.uk/10.3390/w14040583
AMA Style
Wu Y-T. Breaking Solitary Wave Impact on a Vertical Seawall. Water. 2022; 14(4):583. https://0-doi-org.brum.beds.ac.uk/10.3390/w14040583
Chicago/Turabian StyleWu, Yun-Ta. 2022. "Breaking Solitary Wave Impact on a Vertical Seawall" Water 14, no. 4: 583. https://0-doi-org.brum.beds.ac.uk/10.3390/w14040583
Note that from the first issue of 2016, this journal uses article numbers instead of page numbers. See further details here.