
Water Quality Improvement through Rainwater Tanks: A Review and Simulation Study
by
 , , and
Monzur Alam Imteaz
1,* ,
,
Vassiliki Terezinha Galvão Boulomytis
2 ,
,
Abdullah G. Yilmaz
3 and
Abdallah Shanableh
4 1
Department of Civil and Construction Engineering, Swinburne University of Technology, Melbourne, VIC 3122, Australia
2
Department of Water Engineering, Faculty of Civil Engineering, Federal Institute of Science, Education and Technology of São Paulo, Caraguatatuba 11660, Brazil
3
Department of Engineering, La Trobe University, Melbourne, VIC 3550, Australia
4
Department of Civil and Environmental Engineering, University of Sharjah, Sharjah 27272, United Arab Emirates
*
Author to whom correspondence should be addressed.
Water 2022, 14(9), 1411; https://0-doi-org.brum.beds.ac.uk/10.3390/w14091411
Submission received: 7 April 2022
/
Revised: 23 April 2022
/
Accepted: 26 April 2022
/
Published: 28 April 2022
(This article belongs to the Special Issue Review Papers of Urban Water Management)
Abstract
:First, this paper presents a thorough review of water quality data using a rainwater tank, categorizing the data as with and without sedimentation. Data are presented showing minimum, maximum, and mean values for the different parameters. The data measured from several sources reveal that water collected from the tank is much better than the water directly collected from the roof. In addition, to analyse the phenomena through a mathematical model, a hypothetical 5 kL rainwater tank with a 200 m2 roof was modelled with the MUSIC model. The simulations were compared with the measured water quality data from a rainwater tank in Melbourne. In general, we found that MUSIC’s simulations on the mean daily concentrations of total suspended solids (TSS) and total phosphorus (TP) are slight underestimations compared to the measured data from Melbourne. Further MUSIC simulations reveal that significant reductions in the daily maximum concentrations of TSS, TP, and total nitrogen (TN) are expected through a rainwater tank.
1. Introduction
Rainwater tanks have been in use for many centuries in non-arid regions. Traditionally, it is the prime source of water for many remote communities where there is no other suitable water source. Such remote communities even use rainwater for potable purposes after having some basic treatments. Recently, given the tremendous increase in population and the limited sources of potable water, urban water authorities are adopting several measures including demand management and identifying alternative water sources such as stormwater harvesting, grey water, and wastewater reuse. Among all the alternative water sources, stormwater harvesting is the most suitable and easily achievable. Despite having centralised water supply systems, modern urban communities have started adopting rainwater tanks, mainly for non-potable purposes. As such, the original focus of rainwater tanks as being only a means of water supply has shifted to being an alternate source of water augmentation. In Australia, federal, state, and local government authorities have been promoting stormwater harvesting through campaigns as well as offering financial incentives and grants to promote the implementation of such water saving methodologies.
There have been numerous studies on rainwater tanks, with many treating rainwater harvesting potentials or quantifications, among which some recent ones are Imteaz et al. [1], Khan et al. [2], Santos et al. [3], and Imteaz and Moniruzzaman [4]. Continuing from water harvesting potentials, some other studies have investigated the reliability and financial benefits related to rainwater tanks [5,6,7]. There are several studies that have investigated the quality of harvested/captured rainwater, as in many cases, it is used for potable purposes. Boulomytis [8] assessed the quality of harvested rainwater over clay tiles in Brazil, analysing the turbidity, colour, and pH parameters. The author found that due to the antecedent drought prior to the first intense rainfall, the quality of the first flush was poor due to the contaminants initially spread over the roof. However, the samples collected after 30 min had sufficient quality to be used for the purpose of primary food irrigation (e.g., lettuce), in keeping with the potability standards of the Brazilian Federal Law. Farreny et al. [9] investigated the effect of different types of roofs, taking into consideration factors such as the roof slope and material. In addition to investigating the effects on runoff quantity, they have also investigated the physicochemical characteristics of the collected rainwater from different types of roofs. They have reported that sloping roofs provide better quality runoff compared to flat roofs in regard to some of the tested parameters (conductivity, total organic carbon, and total carbonates except for ammonium). Lee et al. [10] investigated the effect of different types of roof material on runoff water quality in South Korea. Among the tested roofing materials (i.e., wooden shingle tiles, concrete tiles, clay tiles, and galvanized steel), they have found that galvanized steel provides the most suitable runoff quality and that even the collected rainwater meets the Korean drinking water quality standard regarding the pH, TSS, NO3, SO4, Al, Cu, Fe, Pb, Zn, and E. coli. Rahman et al. [11] investigated the quality of harvested rainwater on several occasions within a year in Bangladesh. They reported that the quality of harvested water is satisfactory and fulfils the potable water standard for Bangladesh in regard to faecal coliform, total coliform, total suspended solids (TSS), turbidity, NH3–N, lead, and BOD5. Charters et al. [12] investigated stormwater runoff quality from different impervious surfaces including roads and roofs of different materials. They have found that the road surface produces the highest concentrations of TSS, while the highest copper and zinc concentrations are drained from copper and galvanized roofs, respectively. Obviously, these copper and zinc concentrations are derived from the dissolution of copper and galvanized roofing materials. They have also found that the concentrations of pollutants are much higher in the first samples (i.e., first flush). Leong et al. [13] have monitored harvested rainwater quality in six different sites in Malaysia for a period of 8 months. They have reported that the harvested rainwater is not suitable for drinking. However, it was suitable for recreational purposes, although on some occasions it did not even meet the criteria of recreational water in regard to pH, ammonia, phosphates, and total coliforms.
Many of the above-mentioned studies considered the quality of stormwater at the first flush stored in a first-flush diverter. Quality of stormwater at first flush is expected to be much inferior compared to the subsequent collections, as a first-flush diverter is provided to capture higher concentrations of pollutants accumulated from antecedent dry days. However, none of the studies considered treatment and improvement of stormwater quality within the tank. As the harvested water stays within the tank, the sediments tend to settle at the bottom of the tank. Because some nutrients are attached to the sediment particles, settlements of sediments also result in settlements of some nutrients. Moreover, several bacteria are likely to die within the tank after a few days due to a lack of food (i.e., organic matter), if the stored rainwater was not highly enriched with organic matters. With the aim of investigating this phenomenon, earlier rainwater samples collected directly from the roof and from the tank were tested, and similar results were reported by Imteaz et al. [14]. To ascertain such conclusions, this study aimed to thoroughly review the existing literature on the qualities of harvested rainwater from two different sources, i.e., roof and tank, and then to analyse such segregated rainwater quality data to establish the water quality benefit of rainwater tanks. Additionally, the experimental measurements were compared through a mathematical modelling study on the same phenomena applying the widely used simulation software titled Modelling for Urban Stormwater Improvement Conceptualisation, MUSIC [15]. In the past, there were several studies on the experimental measurements of rainwater quality from the roof and/or tank. However, no study has verified such measurements through the simulation model.
2. Methodology
A thorough review of the literature was conducted on the water quality of rainwater harvested through rainwater tanks. Extracted results on the rainwater quality were separated based on the sample collection points, i.e., directly from the roof and/or from the tank. Some studies were conducted solely with the water from the roof, while some other studies were only conducted with the water from the tank. The results from these sole sources were summarised and discussed. In addition, from each study, minimum, maximum, and mean values of the particular water quality parameters were reported. There are some studies that investigated the rainwater qualities both from the roof and from the tank. For the studies that considered both rainwater sample collection points, the improvement (I) in rainwater through sedimentation, which took into consideration the water quality without sedimentation (WQNS) and with sedimentation (WQWS), was calculated using the following equation; note that the outcome from the equation is unitless insofar as the unit of other parameters is usually “mg/L” and may vary depending on the selected water quality parameter:
The experimental findings on these phenomena were compared with a typical mathematical modelling analysis. For the mathematical modelling analysis, the widely used Australian tool MUSIC (Version 6HL) was used. The measurements conducted by Imteaz et al. [14] were used for the comparison, as the MUSIC model was predominantly developed for the Australian environment, incorporating several default parameters that were derived from the Australian catchments.
MUSIC is able to simulate both the quantity and quality of runoff from different types (urban, agricultural, and forest) of catchments. For the current study, the catchment was assumed as urban, having a 100% impervious surface (i.e., roof). Additionally, MUSIC is able to model different types of treatment processes used for typical urban stormwater [16]. MUSIC’s simulations can be event-based or on a continuous basis, which allows for comprehensive analysis and comparisons between short-term and long-term benefits of any stormwater treatment system. Duncan [17] conducted a comprehensive review of stormwater quality in urban catchments, which formed the basis of the default values used in MUSIC and provided default values of the event mean concentrations (EMC) of TSS, total phosphorus (TP), and total nitrogen (TN). In addition to simulating the above-mentioned pollutants including the gross pollutants, MUSIC is able to simulate treatment efficiencies through gross pollutant traps, grassed swale, sand filter, bioretention system, wetland, and sedimentation basin. It can also simulate treatments and flow attenuations through rainwater tanks. The latest version of MUSIC is named as MUSICX, details regarding which are available from eWater [18]. Although primarily developed for Australian catchments, MUSIC has been used in some other countries. Imteaz et al. [19] tested MUSIC using measurements from different treatment systems constructed in Australia, Sweden, New Zealand, and Scotland.
Eventually, the simulations from MUSIC are presented as cumulative frequency curves comparing inflow (to the rainwater tank) and outflow (from the rainwater tank) water concentrations of TSS, TP, and TN, which in fact reveal the treatment efficiencies theoretically expected to be achieved through a rainwater tank.
3. Results
Experimental measurement data focusing on water quality data from rainwater tanks and from roofs used in different countries are collected from the existing literature. The collected measurements were categorised as before sedimentation (the sample collected from the roof) and after sedimentation (the sample collected from the rainwater tank). A wide variety of parameters has been used by different researchers. The following section elaborates on the summaries of the measurements, showing minimum, maximum, and mean values of the selected water quality parameters.
3.1. Review on Measured Water Quality Data
The summary of the reported TSS measurements from different countries are categorised in Table 1 as with (i.e., after) or without (i.e., before) sedimentation. We considered a broad variety of concentrations, such as the TSS concentration of rain water or rain water drained through the roof, as well as how these were influenced by many factors, such as the geographical location, the proximity to urban/industrial activities or high traffic roads, and the roof type. It is not possible to generalise the results of such varied pollutant concentrations. However, in every case, it was commonly observed that the TSS concentration significantly dropped in the samples taken after sedimentation. In the samples without sedimentation, the range of maximum TSS observed was 10–425 mg/L. However, in the samples with sedimentation, the range of maximum TSS was 5–379 mg/L. Except for the case of Sweden, in all other cases, the maximum TSS concentrations after sedimentation were less than half of the TSS concentrations without sedimentation.
Table 2 shows the summary of the reported TP concentrations in the samples, though only two studies reported concentrations before and after sedimentation. In general, the concentrations of TP varied from 0.04 to 2.94 mg/L in the samples without sedimentation, whereas the same concentration varied from 0.03 to 1.01 mg/L in the samples with sedimentation. Similar reductions are observed in the case of the TN concentrations (Table 3). For samples without sedimentation, the TN concentrations varied from 0.64 to 2.4 mg/L, whereas for samples with sedimentation, it varied from 0.15 to 2.80 mg/L. For the studies where both the samples with and without sedimentation were considered, 16–94% reductions in mean TN concentration in the outflow samples were observed.
Regarding the total dissolved solids (TDS), few studies considered this pollutant, as shown in Table 4. Among the few found, only Rahman et al. [11] considered samples from both with and without sedimentation, finding a 37% reduction in the mean TDS concentration after sedimentation.
Among the metals, Table 5 and Table 6 show the concentrations of lead and zinc, respectively, in the samples with and without sedimentation. As for the concentrations of lead, among the measurable values, reductions from 33% to 64% were observed through sedimentation. For zinc, reductions from 30% to 75% were observed through sedimentation. Apart from the mentioned pollutants, Imteaz et al. [14] reported a 33% reduction in the mean copper concentration and a >38% reduction in chemical oxygen demand (COD) concentration through sedimentation.
It is not possible to generalise such a wide variety of results, and the observed generalised relationships of the reductions are not predictable because they vary significantly with many other factors such as geography, roof material, proximity to urban activities, and rainfall characteristics. However, a mathematical modelling analysis would provide indicative results, which would help authorities make some logical decisions towards implementing such sustainable features. The following section describes generalised analysis using a well-establish water quality model, MUSIC.
3.2. Numerical Simulation Results
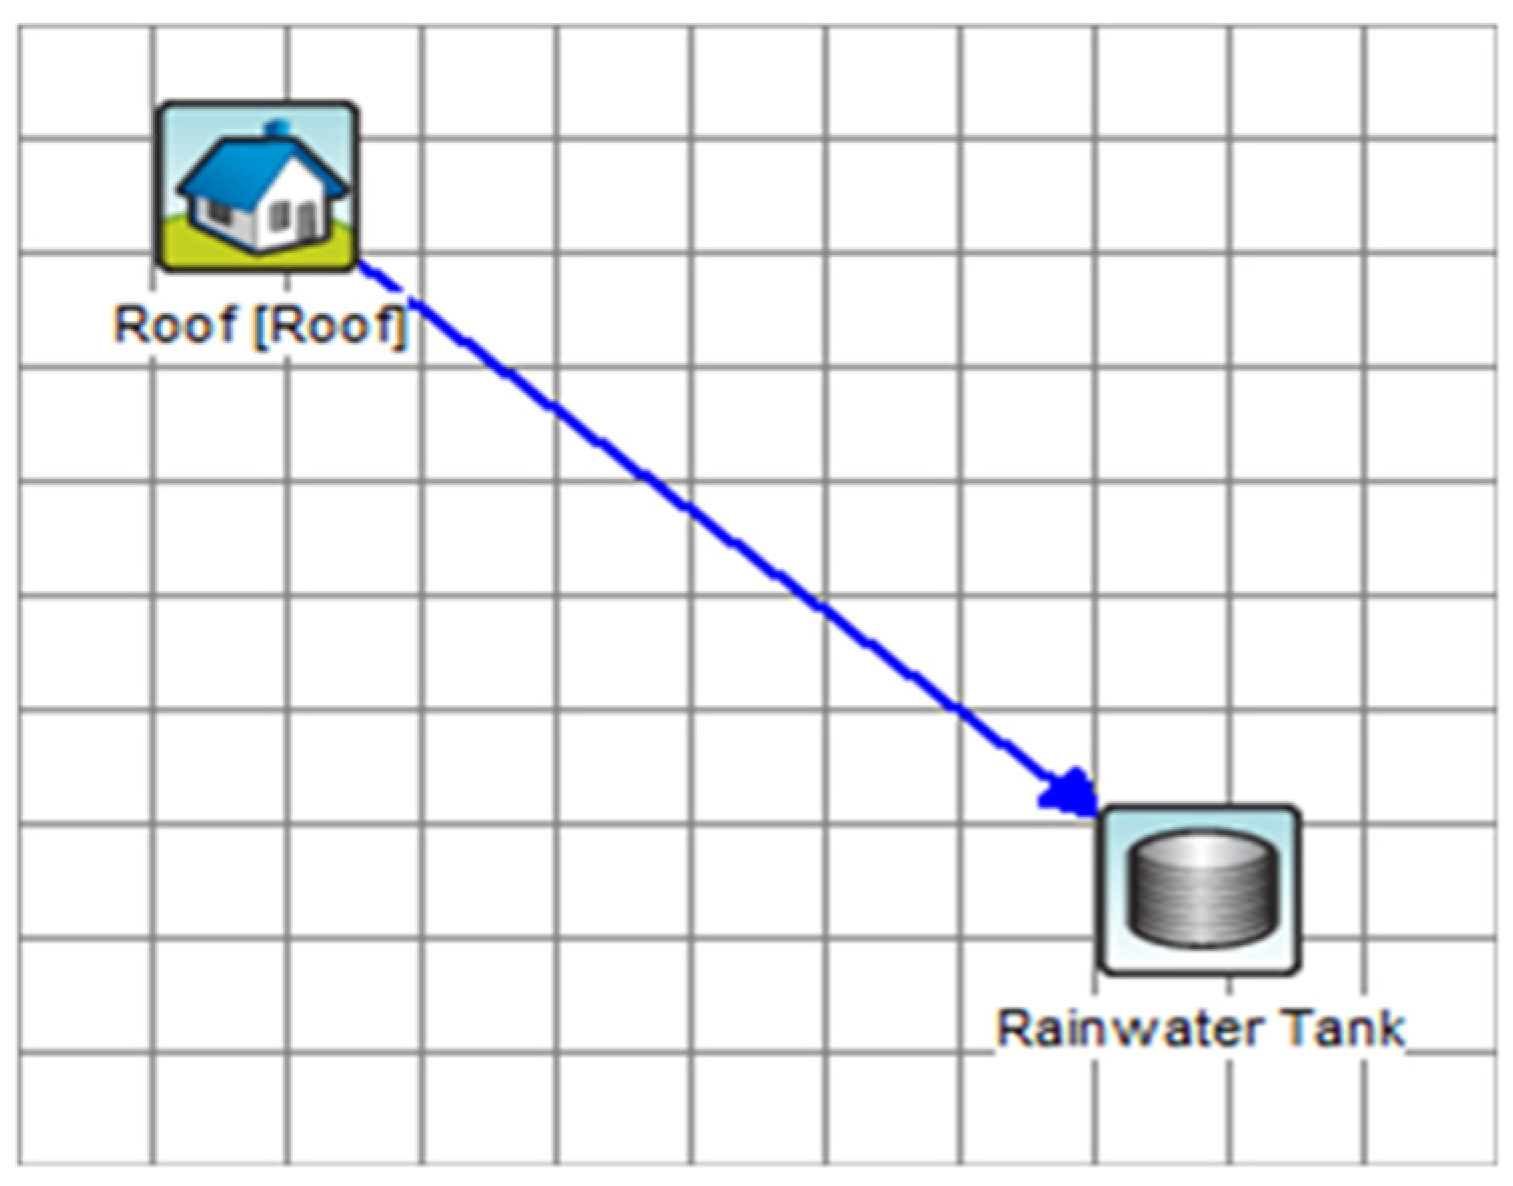
A MUSIC model was set up considering a roof of 200 m2 connected with a rainwater tank of 5 kL. In the MUSIC model, among eleven different surface types, the roof type was exclusively selected with an imperviousness of 100%. MUSIC provides a few years of rainfall data as default data to be used for simulations, while users are allowed to use data from any year provided a complete dataset is available. For this study, a 6 min rainfall data for the year 1969 was selected for Melbourne, as provided with the MUSIC software. For the pollutant generation from the roof surface, the model default mean values were adopted: 19.95 mg/L for TSS, 0.13 mg/L for TP, and 2.0 mg/L for TN. In the model, there is an option for a stochastically generated time series for the estimation of pollutants, which was selected for the current analysis. From different pollutant treatment options provided in the MUSIC, the rainwater tank was selected as a treatment node. Other properties of the selected 5 kL tank were a surface area of 2.5 m2, a depth above overflow corresponding to 0.05 m, an overflow pipe diameter of 50 mm, and no initial water in the tank. Figure 1 shows the model setup as built in the MUSIC software. The model was simulated for the mentioned rainfall year (i.e., 1969).
Table 7 shows the model simulated results concerning the daily mean values, daily maxima values, and mean annual loads of TSS, TP, and TN for inflow (to the tank) and outflow (from the tank) water, which can be represented as with and without sedimentation. From Table 7, it is found that in regard to TSS, the reductions in the daily mean concentration and the mean annual load are 44% and 40%, respectively. Regarding the parameter TP, the reductions in the daily mean concentration and the mean annual load are 18% and 12.5%, respectively.
For TN, the reductions in the daily mean concentration and the mean annual load are 13% and 14%, respectively. However, about the daily maximum concentration, the reductions are expected to be significant: 81% for TSS, 67% for TP, and 57% for TN. In general, such stochastic results are not comparable with a random measurement, which was performed for the case of water quality measurements conducted for a rainwater tank located in Melbourne as reported by Imteaz et al. [4]. Nonetheless, the random measurements conducted for the Melbourne rainwater tank revealed more than a 50% reduction in TSS and a 25% reduction in TP, which are comparable with reductions in the daily mean concentrations as per MUSIC. Regarding the daily mean concentrations, MUSIC simulated a 44% reduction in TSS and an 18% reduction in TP. Though both the simulated results are close to random measurements, MUSIC slightly underestimated the water quality improvements compared to the real measurements. It was not possible to compare MUSIC’s prediction regarding TN concentration reduction because in the selected case study, the TN was not measured.
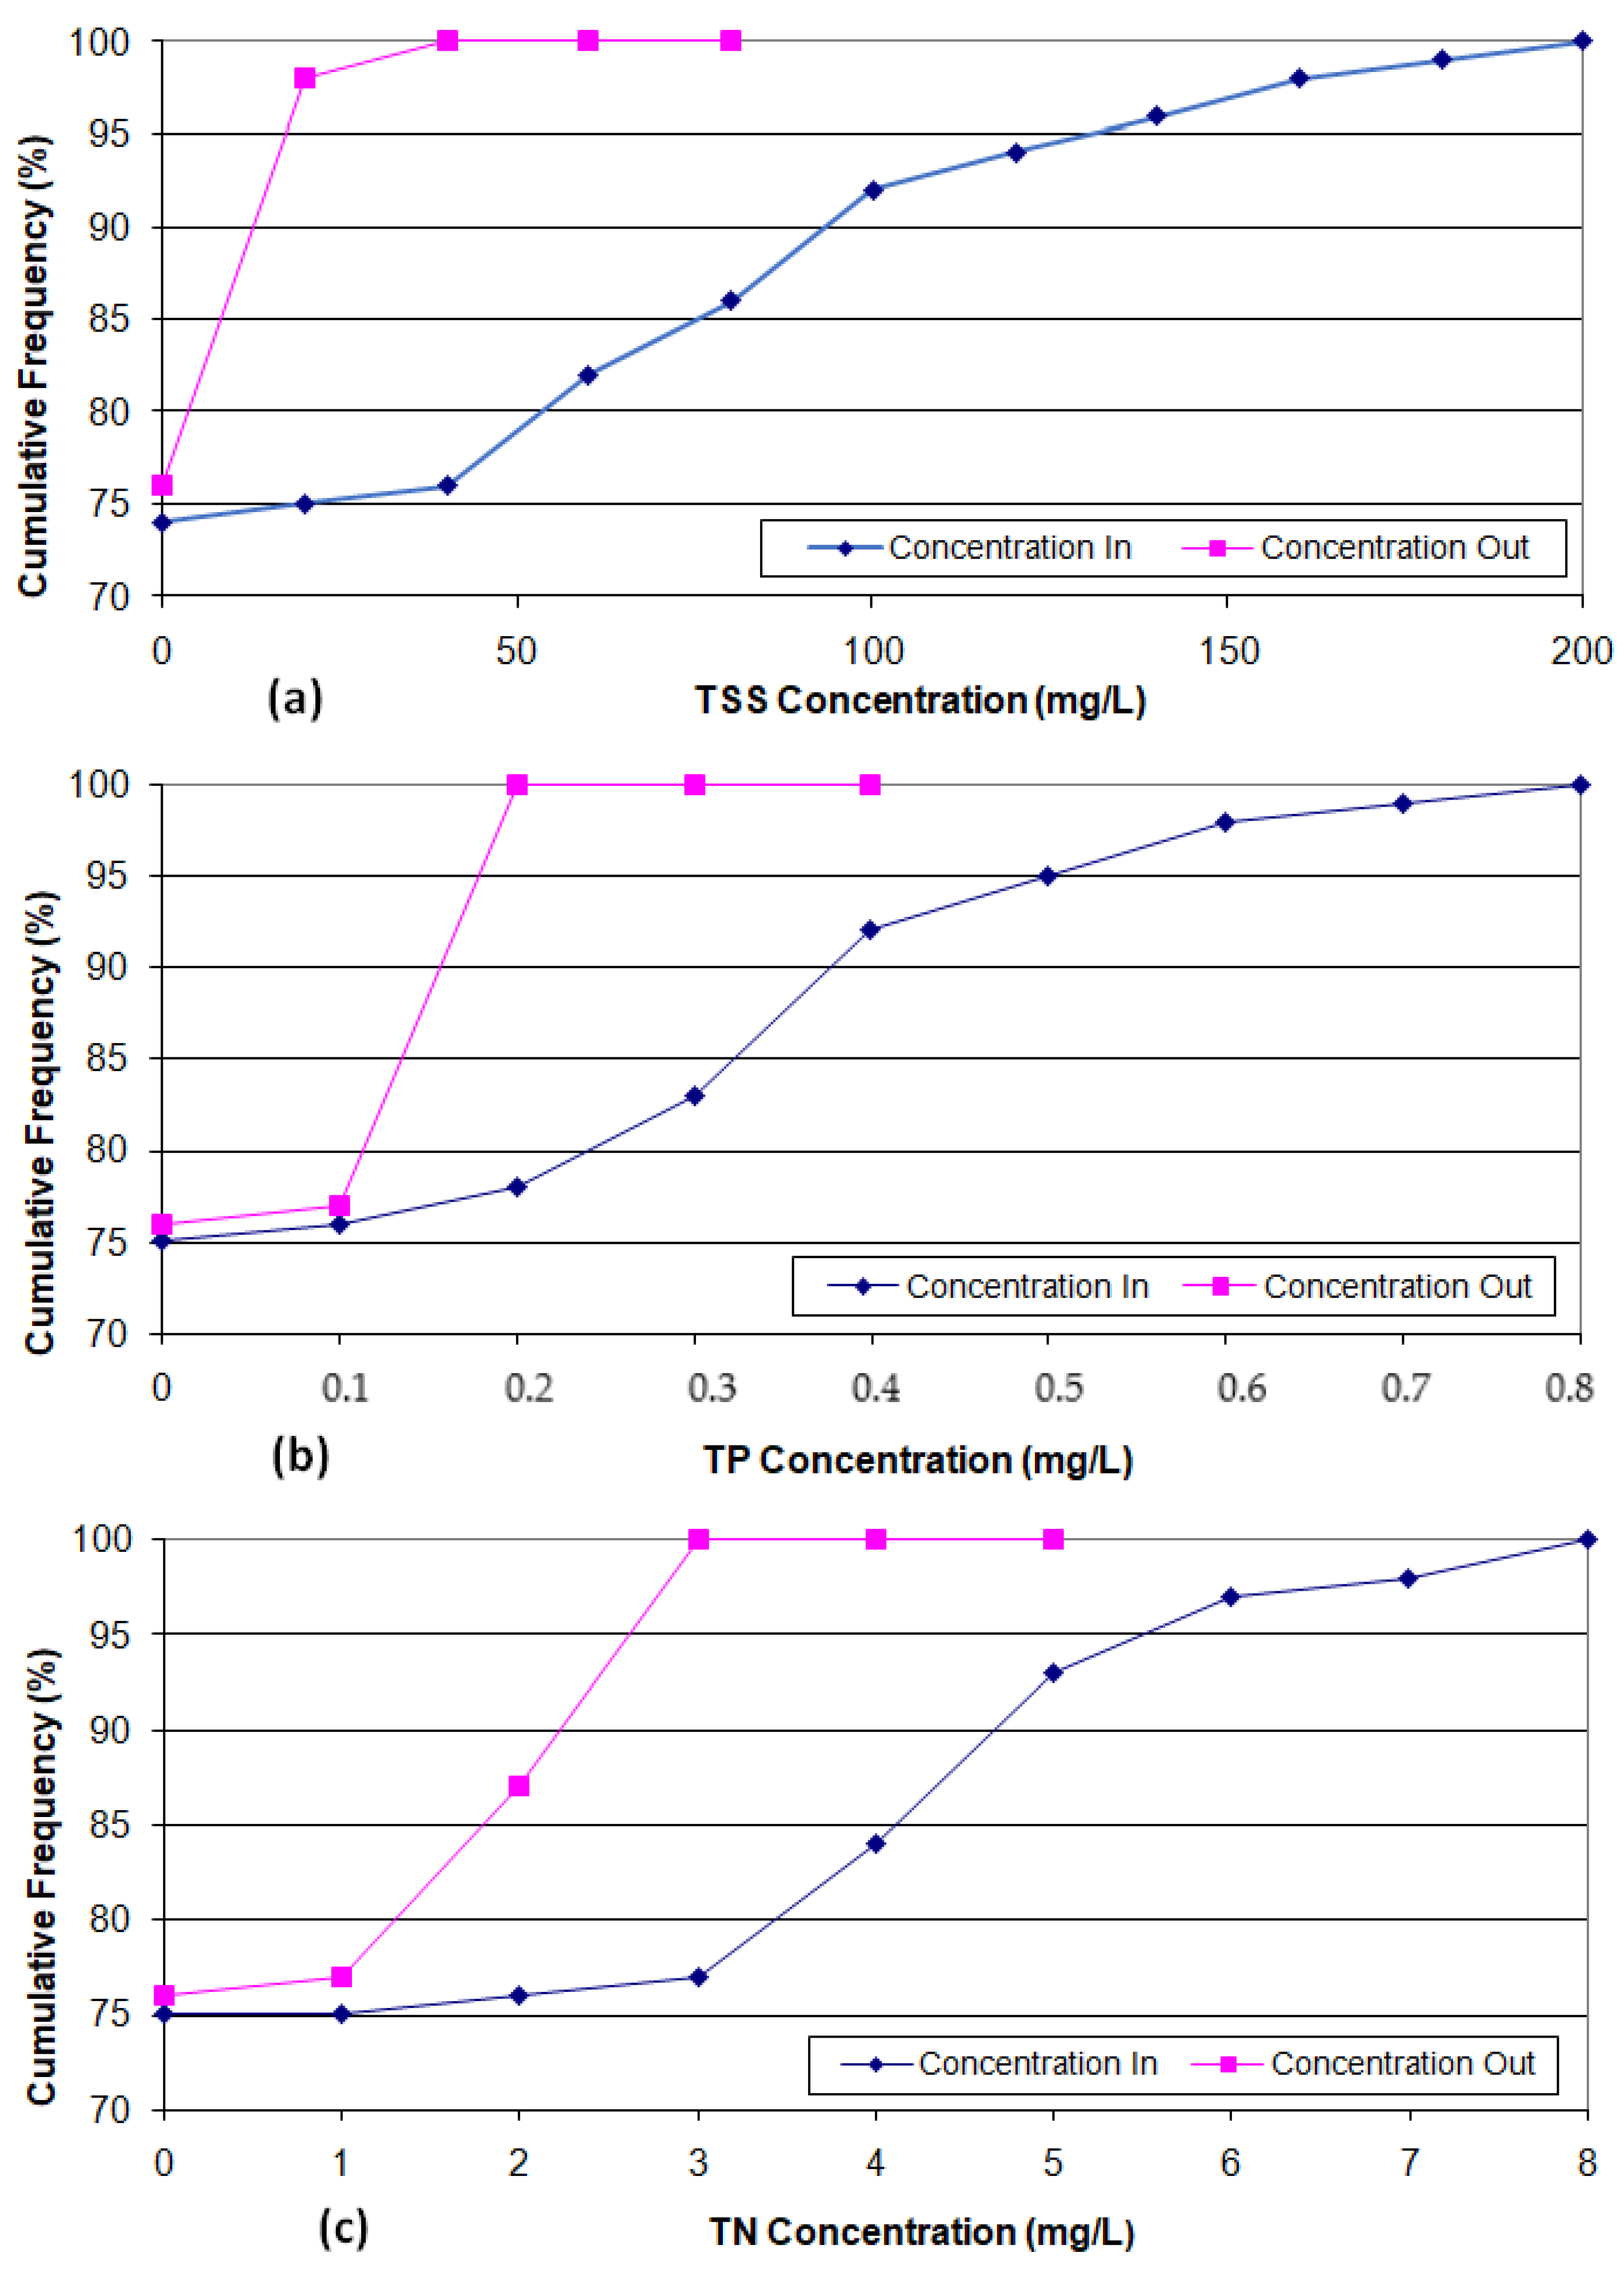
To further visualise the expected water quality benefits, MUSIC simulation results are presented as cumulative frequency curves for daily maximum and daily mean concentrations. Figure 2 shows the frequency curves for the daily maximum concentrations and reveals significant reductions in TSS, TP, and TN daily maximum concentrations. For TSS (Figure 2a), the daily maximum concentration of inflow water is expected to be always less than 200 mg/L, whereas in outflow water, it is expected to be less than 40 mg/L. For TP (Figure 2b), the daily maximum concentration of inflow water is expected to be always less than 0.8 mg/L, whereas in outflow water, it is expected to be less than 0.2 mg/L. For TN (Figure 2c), the daily maximum concentration of inflow water is expected to be always less than 8 mg/L, whereas in outflow water, it is expected to be less than 3 mg/L.
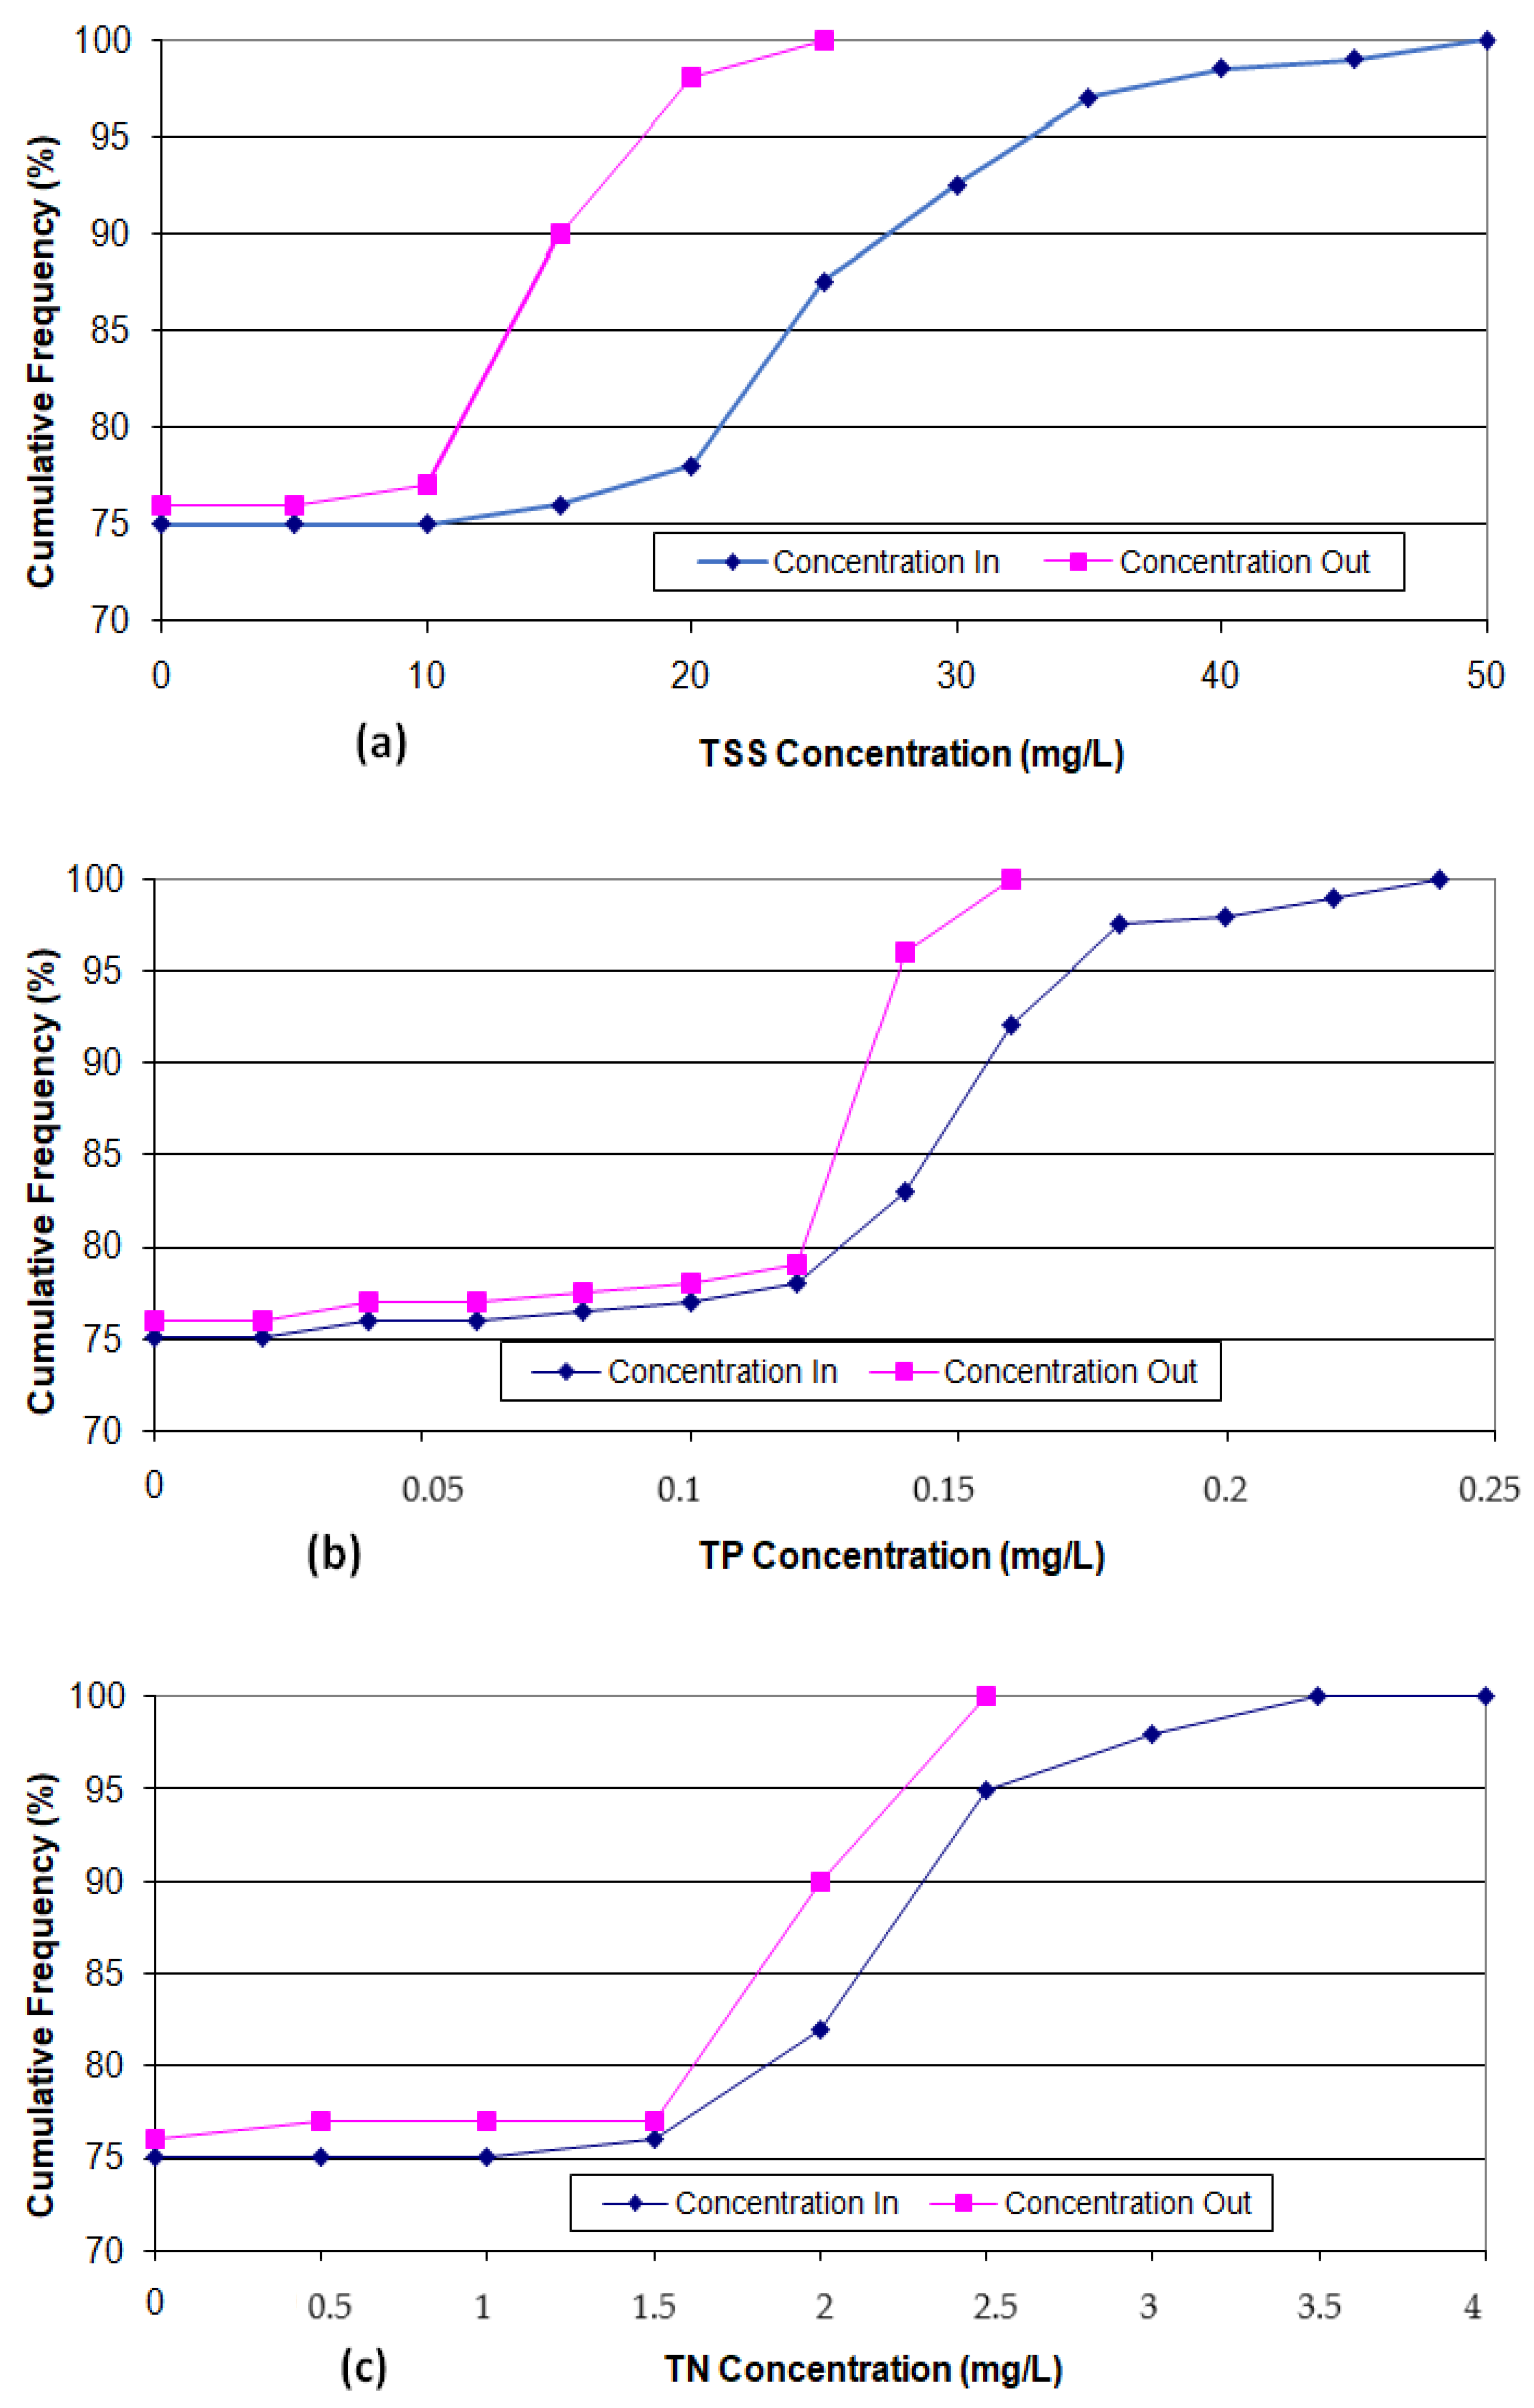
Similar frequency curves for the daily mean concentrations are shown in Figure 3, which reveals moderate reductions in TSS, TP, and TN. For TSS (Figure 3a), the daily mean concentration of inflow water is expected to be always less than 50 mg/L, whereas in outflow water, it is expected to be less than 25 mg/L. For TP (Figure 3b), the daily maximum concentration of inflow water is expected to be always less than 0.24 mg/L, whereas in outflow water, it is expected to be less than 0.16 mg/L. For TN (Figure 3c), the daily maximum concentration of inflow water is expected to be always less than 3.5 mg/L, whereas in outflow water, it is expected to be less than 2.5 mg/L.
4. Discussions
Among the reviewed articles, the tested pollutants were not universal for all the studies. However, we have reviewed measurements from a few of the most common pollutants. Measured pollutant concentrations were presented as minimum, maximum, and mean. From the presented results, it is clear that, except in a few cases, all the pollutant concentrations in the tank water were lower than the corresponding pollutant concentrations in the rainwater from the roof. It is obvious that when water enters into the tank, sediments and heavy particles start falling. Depending on the retention period, the coarser sediments will fall to the bottom of the tank, which will reduce suspended solids in the upper water layer, seeing that water is usually drawn from the upper level (i.e., the outlet tap from the tank is usually placed at approximately 200~300 mm above the tank bottom). As some nutrients and pollutants are attached to the sediments, trapping sediments at the bottom also causes some other nutrients and/or pollutants to be trapped. For the case of TSS from the tanks in Sweden (Table 1), although all the minimum, maximum and mean values were reduced in the tank water, the reduction in the mean value is insignificant. This might be due to the low-retention period in the tank, which was not specified in the literature. Improvement in the tank water heavily depends on the retention period of the rainwater, i.e., the retention period of rainwater in the tank before it is sampled for testing or used. It is to be noted that improvement of rainwater through storing and sedimentation in the tank will be largely influenced by the tank material. However, this matter was not investigated in this study due to a lack of tank material data from the collected literature. Additionally, MUSIC does not consider such a factor in its simulation of rainwater quality through tanks.
5. Conclusions
This paper investigates the effectiveness of rainwater tanks in treating different pollutants through a comprehensive review of the literature on measured water quality data and mathematical simulations using well-established MUSIC software. For the comparison, water quality measurements, which included rainwater samples to and from rainwater tanks, were considered. As pollutants in the roof-collected rainwater depend on many factors including roof material, proximity to urban activities, and geographical location, wide ranges of different concentrations of pollutants are reported in the literature.
For the comparison with mathematical simulations, measured results from a Melbourne household rainwater tank were selected, as the Melbourne rainfall was adopted in the developed MUSIC model. We found that MUSIC’s simulated results concerning the reductions in the mean daily concentrations of TSS and TP are close to the randomly measured reductions in the same pollutants for the Melbourne household tank.
The developed MUSIC model was used for further scenario presentations. From the presented scenario, we found that regarding the reductions in the maximum of the daily mean concentrations, a 50% reduction in TSS, a 33% reduction in TP, and a 29% reduction in TN are expected through a rainwater tank. By contrast, regarding the reductions in the highest daily maximum concentrations with the same rainwater tank, an 80% reduction in TSS, a 75% reduction in TP, and a 63% reduction in TN are expected. It is obvious that TSS reductions are always highest under all scenarios, as TSS is the primary target pollutant to be removed through sedimentation. Nutrient (such as TP and TN) removals are achieved in an indirect way through attachment of some nutrients on the sediment surface, as the efficiency of nutrient removal is always lower than the TSS removal efficiency. Significant reductions in the highest values of the daily maximum concentrations of pollutants are deemed to be important, as in many cases, that is the primary measure for which there are set maximum magnitudes allowed by different environmental regulatory authorities. It is to be noted that the reported findings are valid for the particular roof size of 200 m2 and the tank size of 5 kL. For different roof and tank sizes, the removal efficiency of the mentioned pollutants is likely to vary, which can be a part of future study.
This study was based on a particular geographical area near central Melbourne in Australia. The results would vary with geographical locations, i.e., with different climatic conditions or, in general, with different rainfall intensities and patterns.
Author Contributions
Project administration, supervision, and final paper preparation, M.A.I.; data collection, and model setup and analysis, A.G.Y.; conceptualization and final paper checking, A.S.; original draft preparation, and writing—review and editing, V.T.G.B. All authors have read and agreed to the published version of the manuscript.
Funding
This research received no external funding.
Institutional Review Board Statement
Not applicable.
Informed Consent Statement
Not applicable.
Data Availability Statement
The data are available from the first author upon request.
Conflicts of Interest
The authors declare no conflict of interest.
References
- Imteaz, M.A.; Paudel, U.; Santos, C. Impacts of climate change on weather and spatial variabilities of potential water savings from rainwater tanks. J. Clean. Prod. 2021, 311, 127491. [Google Scholar] [CrossRef]
- Khan, Z.; Alim, M.A.; Rahman, M.M.; Rahman, A. A continental scale evaluation of rainwater harvesting in Australia. Resour. Conserv. Rec. 2021, 167, 105378. [Google Scholar] [CrossRef]
- Santos, C.; Imteaz, M.A.; Ghisi, E.; Matos, C. The effect of climate change on domestic rainwater harvesting. Sci. Total Environ. 2020, 729, 138967. [Google Scholar] [CrossRef] [PubMed]
- Imteaz, M.A.; Moniruzzaman, M. Potential impacts of climate change on future rainwater tank outcomes: A case study for Sydney. J. Clean. Prod. 2020, 273, 123095. [Google Scholar] [CrossRef]
- Karim, M.R.; Sakib, B.M.S.; Sakib, S.S.; Imteaz, M.A. Rainwater harvesting potentials in commercial buildings in Dhaka: Reliability and economic analysis. Hydrology 2021, 8, 9. [Google Scholar] [CrossRef]
- Bashar, M.Z.I.; Karim, M.R.; Imteaz, M.A. Reliability and Economic Analysis of Urban Rainwater Harvesting: A Comparative Study within Six Major Cities of Bangladesh. Resour. Conserv. Rec. 2018, 133, 146–154. [Google Scholar] [CrossRef]
- Imteaz, M.A.; Moniruzzaman, M. Spatial variability of reasonable government rebates for rainwater tank installations: A case study for Sydney. Resour. Conserv. Rec. 2018, 133, 112–119. [Google Scholar] [CrossRef]
- Boulomytis, V.T.G. Estudo da qualidade da água de chuva captada em telhado residencial na área urbana para fins de irrigação de alface. In Proceedings of the 6º Simpósio Brasileiro de Captação e Manejo de Água de Chuva, Belo Horizonte, Brazil, 9–12 July 2007. [Google Scholar]
- Farreny, R.; Gabarrel, X.; Rieradevall, J. Cost-efficiency of rainwater harvesting strategies in dense Mediterranean neighbourhoods. Resour. Conserv. Rec. 2011, 55, 686–694. [Google Scholar] [CrossRef]
- Lee, J.Y.; Bak, G.; Han, M. Quality of roof-harvested rainwater e Comparison of different roofing materials. Environ. Pollut. 2012, 162, 422–429. [Google Scholar] [CrossRef]
- Rahman, S.; Khan, M.T.R.; Akib, S.; Din, N.B.C.; Biswas, S.K.; Shirazi, S.M. Sustainability of Rainwater Harvesting Systemin terms of Water Quality. Sci. World J. 2014, 2014, 721357. [Google Scholar] [CrossRef]
- Charters, F.J.; Cochrane, T.A.; O’Sullivan, A.D. Untreated runoff quality from roof and road surfaces in a low intensity rainfall climate. Sci. Total Environ. 2016, 550, 265–272. [Google Scholar] [CrossRef] [PubMed]
- Leong, J.Y.C.; Chong, M.N.; Poh, P.E.; Hermawan, A.; Talei, A. Longitudinal assessment of rainwater quality under tropical climatic conditions in enabling effective rainwater harvesting and reuse schemes. J. Clean. Prod. 2017, 143, 64–75. [Google Scholar] [CrossRef]
- Imteaz, M.A.; Arulrajah, A.; Yilmaz, A.G. Pollutant treatment efficiencies through rainwater tank, recycled foamed glass and geofabrics. Int. J. Sustain. Eng. 2020, 14, 963–969. [Google Scholar] [CrossRef]
- Wong, T.H.F.; Fletcher, T.D.; Duncan, H.P.; Coleman, J.R.; Jenkins, G.A. A model for urban stormwater improvement conceptualization, in integrated assessment and decision support. In Proceedings of the 1st Biennial Meeting of the International Environmental Modelling and Software Society, Lugano, Switzerland, 24–27 June 2002; Volume 1, pp. 48–53. [Google Scholar]
- Wong, T.H.F.; Fletcher, T.D.; Duncan, H.P.; Jenkins, G.A. Modelling urban stormwater treatment: A unified approach. J. Ecol. Eng. 2006, 27, 58–70. [Google Scholar] [CrossRef]
- Duncan, H.P. Urban Stormwater Quality: A Statistical Overview, Report 99/3; CRC for Catchment Hydrology: Melbourne, Australia, 1999. [Google Scholar]
- eWater. Available online: https://ewater.org.au/products/music/ (accessed on 2 April 2022).
- Imteaz, M.A.; Ahsan, A.; Rahman, A.; Mekanik, F. Modelling Stormwater Treatment Systems using MUSIC: Accuracy. Resour. Conserv. Rec. 2013, 71, 15–21. [Google Scholar] [CrossRef]
- Gikas, G.D.; Tsihrintzis, V.A. Assessment of water quality of first-flush roof runoff and harvested rainwater, Greece. J. Hydrol. 2012, 466–467, 115–126. [Google Scholar] [CrossRef]
- Appan, A. A dual-mode system for harnessing roofwater for non-potable uses, Singapore. Urban Water J. 2000, 1, 317–321. [Google Scholar] [CrossRef]
- Villareal, E.L.; Dixon, A. Analysis of a rainwater collection system for domestic water supply in Sweden. Build. Environ. 2005, 40, 1174–1184. [Google Scholar] [CrossRef]
- Mendez, C.B.; Klenzendorf, J.B.; Afshar, B.R.; Simmons, M.T.; Barrett, M.E.; Kinney, K.A.; Kirisits, M.J. The effect of roofing material on the quality of harvested rainwater. Water Res. 2011, 45, 2049–2059. [Google Scholar] [CrossRef]
- Vialle, C.; Sablayrolles, C.; Lovera, M.; Jacob, S.; Huau, M.C.; Montrejaud-Vignoles, M. Monitoring of water quality from roof runoff: Interpretation using multivariate analysis. Water Res. 2011, 45, 3765–3775. [Google Scholar] [CrossRef] [Green Version]
- Despins, C.; Farahbakhsh, K.; Leidl, C. Assessment of rainwater quality from rainwater harvesting systems in Ontario, Canada. J. Water Supply Res. Technol. 2009, 58, 117–134. [Google Scholar] [CrossRef] [Green Version]
- Pennington, S.L.; Webster-Brown, J.G. Stormwater runoff quality from copper roofing, Auckland, New Zealand. N. Z. J. Mar. Fresh. 2008, 42, 99–108. [Google Scholar] [CrossRef] [Green Version]
- Lee, M.; Kim, M.; Kim, Y.; Han, M. Consideration of rainwater quality parameters for drinking purposes: A case study in Vietnam. J. Environ. Manag. 2017, 200, 400–406. [Google Scholar] [CrossRef] [PubMed]
Figure 1.
Model setup used in the MUSIC software.

Figure 2.
Frequency curves for the daily maximum concentrations of (a) TSS, (b) TP, and (c) TN.

Figure 3.
Frequency curves for the daily mean concentrations of (a) TSS, (b) TP, and (c) TN.


Table 1.
Measurements on TSS concentration.
| Country | TSS Concentration (mg/L) | Reference | |||||
|---|---|---|---|---|---|---|---|
| with Sedimentation | without Sedimentation | ||||||
| Min | Max | Mean | Min | Max | Mean | ||
| Australia * | - | - | <5.00 | - | - | 10.00 | Imteaz et al. [14] |
| Greece | 1.40 | 4.20 | 2.60 | 9.50 | 39.50 | 16.52 | Gikas and Tsihrintzis [20] |
| Korea | 0.20 | 0.65 | 0.42 | 130.00 | 425.00 | 236.00 | Lee et al. [10] |
| Malaysia | 0 | 46.00 | 4.08 | - | - | - | Leong et al. [13] |
| Singapore | 2.50 | 67.00 | 9.10 | - | - | - | Appan [21] |
| Spain | 0 | 38.50 | 5.98 | - | - | - | Farreny et al. [9] |
| Sweden | 33.00 | 379.00 | 220.00 | 60.00 | 421.00 | 227.00 | Villareal and Dixon [22] |
| USA | 12.50 | 62.50 | 39.00 | 20.00 | 220.00 | 50.00 | Mendez et al. [23] |
* Melbourne.
Table 2.
Measurements on TP concentration.
| Country | TP Concentration (mg/L) | Reference | |||||
|---|---|---|---|---|---|---|---|
| with Sedimentation | without Sedimentation | ||||||
| Min | Max | Mean | Min | Max | Mean | ||
| Australia * | - | - | 0.03 | - | - | 0.04 | Imteaz et al. [4] |
| France | 0.10 | 0.54 | 0.17 | - | - | - | Vialle et al. [24] |
| Greece | 0.64 | 1.37 | 1.01 | 1.21 | 7.16 | 2.94 | Gikas and Tsihrintzis [20] |
| Malaysia | 0 | 3.70 | 0.20 | - | - | - | Leong et al. [13] |
| Singapore | 0 | 4.30 | 0.10 | - | - | - | Appan [21] |
| Spain | 0 | 6.60 | 0.32 | - | - | - | Farreny et al. [9] |
* Melbourne.
Table 3.
Measurements on TN concentration.
| Country | TN Concentration (mg/L) | Reference | |||||
|---|---|---|---|---|---|---|---|
| with Sedimentation | without Sedimentation | ||||||
| Min | Max | Mean | Min | Max | Mean | ||
| Canada | 0.30 | 2.30 | 1.26 | - | - | - | Despins et al. [25] |
| France | 0.54 | 7.80 | 2.80 | - | - | - | Vialle et al. [24] |
| Greece | 0.36 | 0.68 | 0.54 | 0.58 | 0.84 | 0.64 | Gikas and Tsihrintzis [20] |
| Korea | 0 | 0.30 | 0.15 | 0.62 | 4.40 | 2.40 | Lee et al. [10] |
| New Zealand | 1.50 | 4.50 | 2.60 | - | - | - | Pennington and Webster-Brown [26] |
| Spain | 0.01 | 9.34 | 1.75 | - | - | - | Farreny et al. [9] |
| USA | 0.47 | 1.50 | 1.18 | 1.00 | 3.30 | 1.80 | Mendez et al. [23] |
| Vietnam | 0.10 | 8.60 | 0.96 | - | - | - | Lee et al. [27] |
Table 4.
Measurements on TDS concentration.
| Country | TDS Concentration (mg/L) | Reference | |||||
| with Sedimentation | without Sedimentation | ||||||
| Min | Max | Mean | Min | Max | Mean | ||
| Bangladesh | 10.00 | 75.00 | 27.38 | 10.00 | 190.00 | 43.58 | Rahman et al. [11] |
| Malaysia | 0 | 139.00 | 33.72 | - | - | - | Leong et al. [13] |
| Singapore | 12.50 | 19.50 | 15.61 | - | - | - | Appan [21] |
| Vietnam | 26.00 | 404.20 | 48.60 | - | - | - | Lee et al. [27] |
Table 5.
Measurements on lead concentration.
| Country | Lead Concentration (mg/L) | Reference | |||||
|---|---|---|---|---|---|---|---|
| with Sedimentation | without Sedimentation | ||||||
| Min | Max | Mean | Min | Max | Mean | ||
| Australia * | - | - | <0.0010 | - | - | 0.0010 | Imteaz et al. [4] |
| Bangladesh | 0.0100 | 0.0300 | 0.0200 | 0.0130 | 0.0480 | 0.0300 | Rahman et al. [11] |
| Korea | 0.0040 | 0.0080 | 0.0050 | 0.0130 | 0.0220 | 0.0140 | Lee et al. [10] |
| Malaysia | 0 | 0.1100 | 0.0100 | - | - | - | Leong et al. [13] |
| USA | 0.0003 | 0.0086 | 0.0023 | - | - | - | Mendez et al. [23] |
| Vietnam | 0.0010 | 0.0030 | 0.0010 | - | - | - | Lee et al. [27] |
* Melbourne.
Table 6.
Measurements on zinc concentration.
| Country | Zinc Concentration (mg/L) | Reference | |||||
|---|---|---|---|---|---|---|---|
| with Sedimentation | without Sedimentation | ||||||
| Min | Max | Mean | Min | Max | Mean | ||
| Australia * | - | - | 0.060 | - | - | 0.090 | Imteaz et al. [4] |
| Korea | 0 | 0.120 | 0.050 | 0.170 | 0.600 | 0.200 | Lee et al. [10] |
| Malaysia | 0 | 0.320 | 0.700 | - | - | - | Leong et al. [13] |
| USA | 0.001 | 0.362 | 0.016 | - | - | - | Mendez et al. [23] |
| Vietnam | 0.03 | 1.460 | 0.050 | - | - | - | Lee et al. [27] |
* Melbourne.
Table 7.
Model simulated results with and without sedimentation.
| Parameter | TSS | TP | TN | ||||||
|---|---|---|---|---|---|---|---|---|---|
| Concentration | Reduction (%) | Concentration | Reduction (%) | Concentration | Reduction (%) | ||||
| In | Out | In | Out | In | Out | ||||
| Daily Mean (mg/L) | 6.60 | 3.69 | 44.1 | 0.039 | 0.032 | 17.9 | 0.552 | 0.478 | 13.4 |
| Daily Maxima (mg/L) | 20.10 | 3.88 | 80.7 | 0.099 | 0.033 | 66.7 | 1.11 | 0.48 | 56.8 |
| Mean Annual Load (kg) | 3.00 | 1.79 | 40.3 | 0.016 | 0.014 | 12.5 | 0.247 | 0.212 | 14.2 |
Publisher’s Note: MDPI stays neutral with regard to jurisdictional claims in published maps and institutional affiliations. |
© 2022 by the authors. Licensee MDPI, Basel, Switzerland. This article is an open access article distributed under the terms and conditions of the Creative Commons Attribution (CC BY) license (https://creativecommons.org/licenses/by/4.0/).
Share and Cite
MDPI and ACS Style
Imteaz, M.A.; Boulomytis, V.T.G.; Yilmaz, A.G.; Shanableh, A. Water Quality Improvement through Rainwater Tanks: A Review and Simulation Study. Water 2022, 14, 1411. https://0-doi-org.brum.beds.ac.uk/10.3390/w14091411
AMA Style
Imteaz MA, Boulomytis VTG, Yilmaz AG, Shanableh A. Water Quality Improvement through Rainwater Tanks: A Review and Simulation Study. Water. 2022; 14(9):1411. https://0-doi-org.brum.beds.ac.uk/10.3390/w14091411
Chicago/Turabian StyleImteaz, Monzur Alam, Vassiliki Terezinha Galvão Boulomytis, Abdullah G. Yilmaz, and Abdallah Shanableh. 2022. "Water Quality Improvement through Rainwater Tanks: A Review and Simulation Study" Water 14, no. 9: 1411. https://0-doi-org.brum.beds.ac.uk/10.3390/w14091411
Note that from the first issue of 2016, this journal uses article numbers instead of page numbers. See further details here.