
Comparison of Critical Shear Stress of Rill Erosion Estimated from Two Methods


1
Sate Key Laboratory of Hydrology-Water Resources and Hydraulic Engineering, Nanjing Hydraulic Research Institute, Nanjing 210029, China
2
Key Laboratory of Wetland Ecology and Environment, Northeast Institute of Geography and Agroecology, Chinese Academy of Sciences, Changchun 130102, China
*
Authors to whom correspondence should be addressed.
Water 2022, 14(12), 1949; https://0-doi-org.brum.beds.ac.uk/10.3390/w14121949
Submission received: 23 May 2022
/
Revised: 11 June 2022
/
Accepted: 15 June 2022
/
Published: 17 June 2022
(This article belongs to the Special Issue Monitoring of the Water and Soil Conservation Using Remote Sensing Techniques)
Abstract
:Various disputes exist regarding the critical shear stress (τc) of rill erosion determined by linear regression. Alternatively, some researchers have attempted to measure critical shear stress (τo) of rill erosion by observing the start of soil particle detachment and showed promising results. However, few studies have been conducted to evaluate the reliability of the method determining τo. Thus, this study was conducted to identify the reliability of the method determining τo by comparing the values of τc and τo and their relationships with rill erodibility (Kr) and influencing factors, using 360 disturbed soil samples (standing for the freshly tilled condition) from six sampling sites along a 330 km transect in the Loess Plateau. Results indicated that the mean τc was 1.90 times greater than that of τo. No significant relationship was found between τc and Kr. An inverse changing trend between Kr and τo was observed from Yijun to Zizhou, while both Kr and τo exhibited increasing trends from Zizhou to Yulin. The τo of six sampling sites all demonstrated increasing trends with slope gradient (S), which contradicted the statement of the WEPP model that τc was independent of S. The relationships between τc and the measured soil properties were poor, whereas the τo increased exponentially with soil organic matter. Generally, τo did not present significantly better results than τc; the reliability of τo also showed some uncertainties, such as the subjective judgment of the beginning detachment of soil particles. This result has great importance for deepening our understanding of the rill erosion mechanism.
1. Introduction
Soil erosion by water leads to land degradation, reduced crop yields, water pollution, threatening biodiversity and sustainability of environmentally protected areas, and other problems, which have made it a serious global problem [1,2,3,4,5]. A soil erosion model is essential for understanding the erosion process and implementing effective soil conservation measures [6,7,8]. The Universal Soil Loess Equation (ULSE) and revised ULSE (RULSE) were widely applied to predict soil erosion [5]. However, ULSE and RUSLE were empirical and lacked deep recognition of erosion processes and erosion mechanisms [5,8]. Thus, many studies in recent decades have been concerned with process-based models, which were physically-based and could model erosion processes [9,10]. In these models, represented by the Water Erosion Prediction Project (WEPP), the rill erosion of overland flow is the most important process that influences sediment production [11]. Rill erodibility (Kr, s m−1) and critical shear stress (τc, Pa) (both refer to soil resistance to overland flow) are crucial parameters for modeling rill erosion [7]. Kr and τc are usually determined by the linear regression of soil detachment capacity (Dc, kg m−2 s−1) and flow shear stress (τ, Pa) [12].
Generally, Kr and τc are greatly influenced by soil properties (such as soil texture, soil cohesion, soil organic matter (SOM), plant roots, etc.) [13,14,15].
In past decades, researchers have done significant work on the influencing factors of Kr and have reached a consensus about the effects of these influencing factors on Kr [16,17,18]). Soil texture was widely used in the prediction of Kr [16]. Geng et al. [18] studied the response of Kr to landscape positions in a small watershed and found Kr decreased and increased with increasing clay content and sand content, respectively. Soil cohesion reflects the cohesive forces among soil particles [19]. Wang et al. [20] found a negative relationship between Kr and soil cohesion. SOM affects soil resistance to overland flow by functioning as a cementing agent among soil particles [17]. Geng et al. [21] proposed a significant correlation between Kr and SOM. Plant roots also impose great influence on Kr due to their chemical bonding effect and physical bonding effect [14,22]. Kr usually increases exponentially with root mass density [20].
Significant disagreement remains, however, regarding other crucially important parameters of soil resistance to overland, namely τc [23,24]. Generally speaking, these disagreements can be categorized as follows: (1) Unlike Kr, the relationships between τc and its potential influencing factors were rather confusing [21,25]. For example, Gilly et al. [25] quantified the τc of 36 soils throughout the United States and indicated that τc could be predicted by clay content, linear extensibility coefficient, and soil water content. Nonetheless, Geng et al. [21] showed no significant relationship between τc and 17 measured soil properties for 36 soil types across Eastern China. (2) There is also no general agreement on the relationship between Kr and τc. Many studies indicated that soils with higher τc correspond to less erodibility [26,27]. Knapen et al. [17] found that no significant relationship existed between Kr and τc for both laboratory (n = 179) and field experiments (n = 151). Additionally, Mamo and Bubenzer’s [27] findings did not support the opinion that when τc was smaller, Kr would be larger. (3) In the WEPP, τc does not change with the variation of slope gradient (S) and hence is considered to be a constant [28]. Nevertheless, in developing a rational method for predicting τc, Lei et al. [29] suggested that τc increased when S changed from 0.087 to 0.423 and attributed this increase to the fact that the force along the slope enhanced when S was raised. Moreover, the critical shear stress of sediment particles in rivers mostly depended on bed S [30,31].
Due to the limitations of determining critical shear stress in rills by linear regression [32,33], some researchers have tried to determine critical shear stress by gradually increasing flow shear stress until an obvious detachment of soil particles is observed [34,35]. The critical shear stress of rill erosion determined by this method was called τo. Nouwakpo et al. [36] considered τc was not capable of detecting small variations in real critical shear stress because of its projected characteristic. Thus, they determined the τo of different hydraulic gradients and demonstrated a good linear relationship with the hydraulic gradient that was in line with the changing trend of Kr. Lei and Nearing [34] designed an apparatus to control flow discharge for well determining the τo of loose material. Although these studies presented satisfactory results, they only used the method of observing the initial detachment of soil particles to determine τo and did not compare these results with the widely used τc [17,21]. Thus, it is of paramount importance to investigate whether the method determining τo in rills is reliable.
Different from determining τo in rills, the method of determining critical shear stress in rivers by observing initial sediments has been extensively used [37,38,39], and a great deal of knowledge has been gained [40,41,42]. However, there are distinct discrepancies in hydraulic environments between rivers and rills [43]. Typical flow depths in rills are several centimeters or less, which is several orders of magnitudes lower than that of rivers [7]. The S of rivers was generally gentle (usually less than 0.01) [31], while it was steep for rills (up to 0.46) [44]. What is more, distinguishing differences exist between soils in rills and sediments in rivers [20,31]. Considering the great discrepancies between rivers and rills, the knowledge obtained from rivers may not be valid in rills [7,43]. Therefore, the reliability of the method determining τo in rills is in need of exploration.
For the purpose of exploring the reliability of the method determining τo in rills, undisturbed soils were preferable, considering the extrapolation of research results [24,45]. However, as mentioned above, Kr and τc of undisturbed soils were affected by numerous soil properties and plant roots [17]. These influencing factors of Kr and τc were various, complicated, and, at times, greatly correlated [21]. Specifically designed experiments, which controlled influenced factors, were usually aimed at establishing an accurate relationship between Kr and τc and their influencing factors [21,27,46]. Clear relationships between τo and τc and their influencing factors were pivotal to estimating the reliability of the method determining τo. Disturbed soils, compared with undisturbed soils, could well control influencing factors, whereby the clear relationships between τo and τc and some fundamental factors (e.g., soil texture and SOM) could be more easily established with relatively lesser soil samples [24,47]. Therefore, disturbed soils, standing for the freshly tilled condition, were used in this study [21].
As mentioned earlier, a lot of disagreement exists regarding the usually used method (linear regression) to determine the critical shear stress of rills (τc), whereas the method measuring critical shear stress of rills by observing the start of soil particle detachment (τo) has shown promising results [36]. However, the reliability of the method determining τo was still unknown. Therefore, this study aimed to identify the reliability of the method determining τo in rills by comparing (1) the values of τo and τc, (2) the relationship between τo and τc, and Kr, and (3) the relationship between τo and τc and their influencing factors. This study’s findings have important implications for recognizing rill erosion mechanisms and enhancing the prediction accuracy of erosion models.
2. Material and Methods
2.1. Soil Sampling
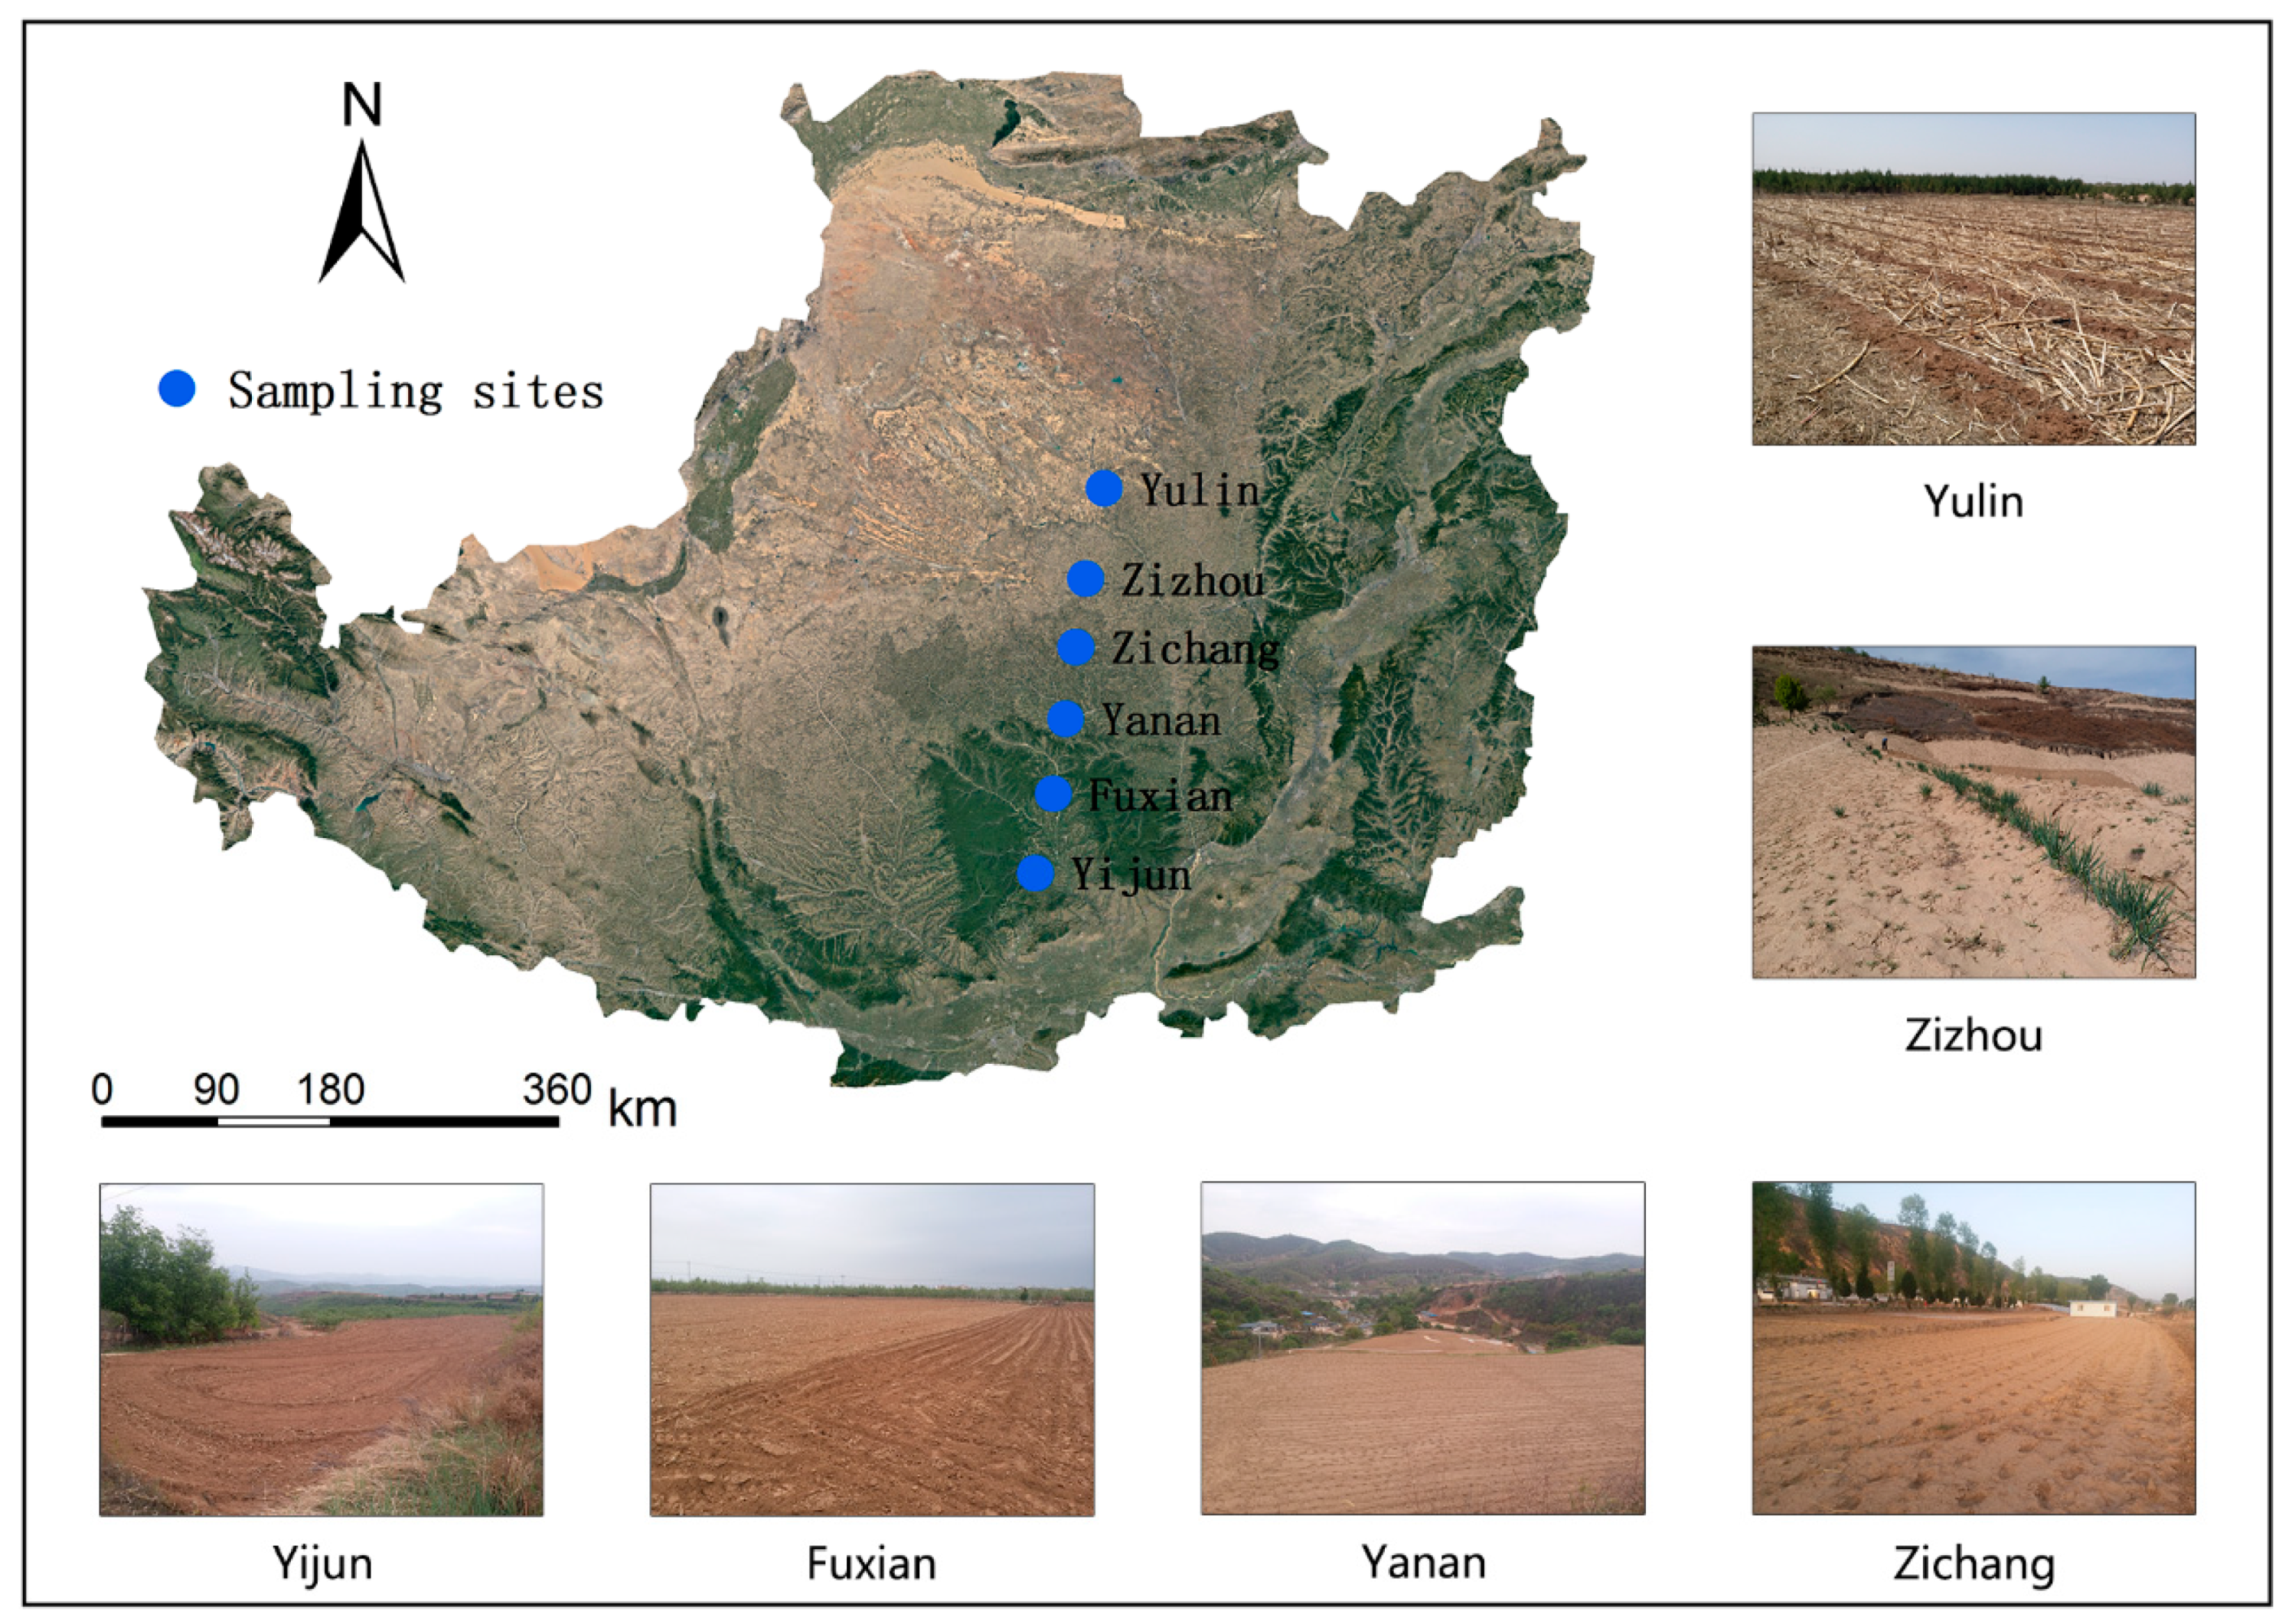
The Loess Plateau (total area of 6.2 × 10⁵ km2) is located in northwestern China. Irrational land use and low coverage of vegetation have made it the most severely eroded region in the world, and the soil erosion rate could be greater than 59,700 t km−2 yr−1 [48]. The Loess Plateau has a temperate and monsoon climate, with annual precipitation and mean temperature changes ranging from 800 mm to less than 200 mm and from 14.3 °C to 3.6 °C, respectively, from the south to the north. The vegetation zones change from forest to steppe desert from the south to the north [49]. Thick loess–paleosol deposits are distributed throughout the Loess Plateau. Clay loam is the most widespread soil, with soil texture becoming more sand and less clay from the south to the north [50]. Additionally, the SOM followed a decreasing trend from south to north [51]. From the south to the north, the decreasing clay content and SOM and the increasing sand content in this region would lead to an increase in Kr and possibly to the corresponding changes in τo and τc [21]. These influencing factors of Kr and τc also showed great variations from south to north [21], which was helpful for establishing accurate relationships between critical shear stresses and their influencing factors. Thus, a line transect with 330 km was laid out from the south to the north in this region (Figure 1). This transect has spread across three vegetation zones: forest, forest steppe, and steppe. Six sampling sites on this transect were chosen, and the interval of the two adjacent sampling sites was about 66 km (Figure 1 and Table 1). The southernmost sampling site was Yijun (a typical forest zone), and the northernmost sampling site was Yulin, the north part of which was the Mu Us desert.
Disturbed soils of cropland (20 cm) on the six sampling sites were selected from April to May 2019. On each sampling site, 100 kg of disturbed soils (top 20 cm of soil layer) were collected in ‘S’ shape (six soil samples). These soil samples were air-dried and sieved with a mesh aperture of 2 mm to simulate the freshly tilled condition [18,52]. A portion of these disturbed soils was used for the measurement of critical shear stress, and the other portion was used for the determination of soil properties.
2.2. Determination of Critical Shear Stress
The water content (150 g kg−1) of sieved soils was obtained by a sprinkling can, and the water was equilibrated for 24 h in a sealed plastic bucket. The same water content was used for the six sampling sites to reduce the effect of the water content and to fill the soil easily [21]. The wetted soils were put into a stainless-steel box (10 cm in diameter) in several steps. The bulk density of the samples from the six sampling sites was kept at 1.19 g kg−1 (i.e., the average bulk density of six sampling sites). For each sampling site, 60 soil samples were made, half of which was used for the determination of τc, and the other half was tested for τo. Altogether, 360 soil samples were collected for all six sampling sites. Before the measurement of critical shear stress, these soil samples were saturated for 12 h and then drained for 12 h.
τo was determined in a hydraulic flume (0.35 m in width, 5 m in length), which was described thoroughly in Su et al. [53]. To explore the effect of S on τo, six S (3.49%, 8.72%, 17.36%, 25.88%, 34.20%, and 42.26%) were set. On each S, τo was determined by gradually increasing the flow discharge until the continuous detachment of soil particles was observed [36,54]. A series of valves was employed to adjust the flow discharge (Q, m3 s−1). The increase of Q was stopped when the continuous detachment of soil particles occurred. The corresponding Q, flow velocity (V, m s−1), and flow depth (H, m) at this moment were termed as critical flow discharge (Qo, m3 s−1), critical flow velocity (Vo, m s−1), and critical flow depth (Ho, m). The measurements of Qo, Vo, and Ho were the same as those obtained by Wang et al. [20] and Geng et al. [55], which have been thoroughly described. τo of each soil sample was calculated based on the following Equation (1):
where ρ (kg m−3) and g (m s−2) are the water density and the gravity constant, respectively. The mean τo of five duplicates under the particular S was used. Table 2 lists the statistical characteristics of the noted hydraulic parameters.
Similar to τo, τc was measured in the same hydraulic flume. The S was kept at a constant value (25.88%) to eliminate the influence of S. Six flow discharges ranging from 2.5 × 10⁻⁴ to 2.5 × 10⁻³ m3 s−1 were applied to determine Dc. After the desired Q with an error of less than 2% was set, V and H were measured. The detailed measuring procedures of Q, V, and H were similar to Qo, Vo, and Ho. τ of each flow discharge was calculated using Equation (1), but the difference was that τo and Ho were replaced by τ and H, respectively. The corresponding hydraulic parameters for each flow discharge are listed in Table 3. Then, the measurement of Dc was taken when the soil sample was put into the sample hole and was stopped when the scouring depth of 2 cm was exceeded. The scoured soil samples were oven-dried for 24 h (105 °C). Dc was calculated by the following equation:
where Mi is initial dry soil mass; Mf is final dry soil mass; A is soil sample area; and T is scouring time. Five duplicates of each flow discharge were measured, and the mean values of five duplicates were used. Kr and τc were obtained by regressing six pairs of Dc and τ by Equation (3). The regressing slope and intercept on the X-axis were Kr and τc, respectively (Table 4).
So as to explore the influencing factors of τo and τc, some basic influencing factors (e.g., soil texture and SOM) were measured. The measurements of soil texture (e.g., clay content, silt content, and sand content) (two duplicates) and SOM (two duplicates) were taken by hydrometer and potassium dichromate colorimetric, respectively. The measured soil properties of six sampling sites are given in Table 5. As shown in Table 5, the clay content, silt content, and SOM generally followed decreasing trends from south to north, whereas sand content followed an increasing trend. Additionally, the soil properties of the six sampling sites presented great variations (Table 5).
2.3. Data Analysis
All statistical analyses were conducted in SPSS 23.0. The difference between τo and τc was detected by the paired sample t-test. Pearson correlation analysis was applied to detect the relationship between measured soil properties and Kr, τo, and τc. Linear regression or nonlinear regression was applied to calculate Kr and τc and to analyze the relationships among S, soil properties, and τo. The coefficient of determination (R2) and Nash–Sutcliffe efficiency (NSE) was employed to evaluate the fitness of the regressing results.
3. Results
3.1. Comparison of the Values of τo and τc
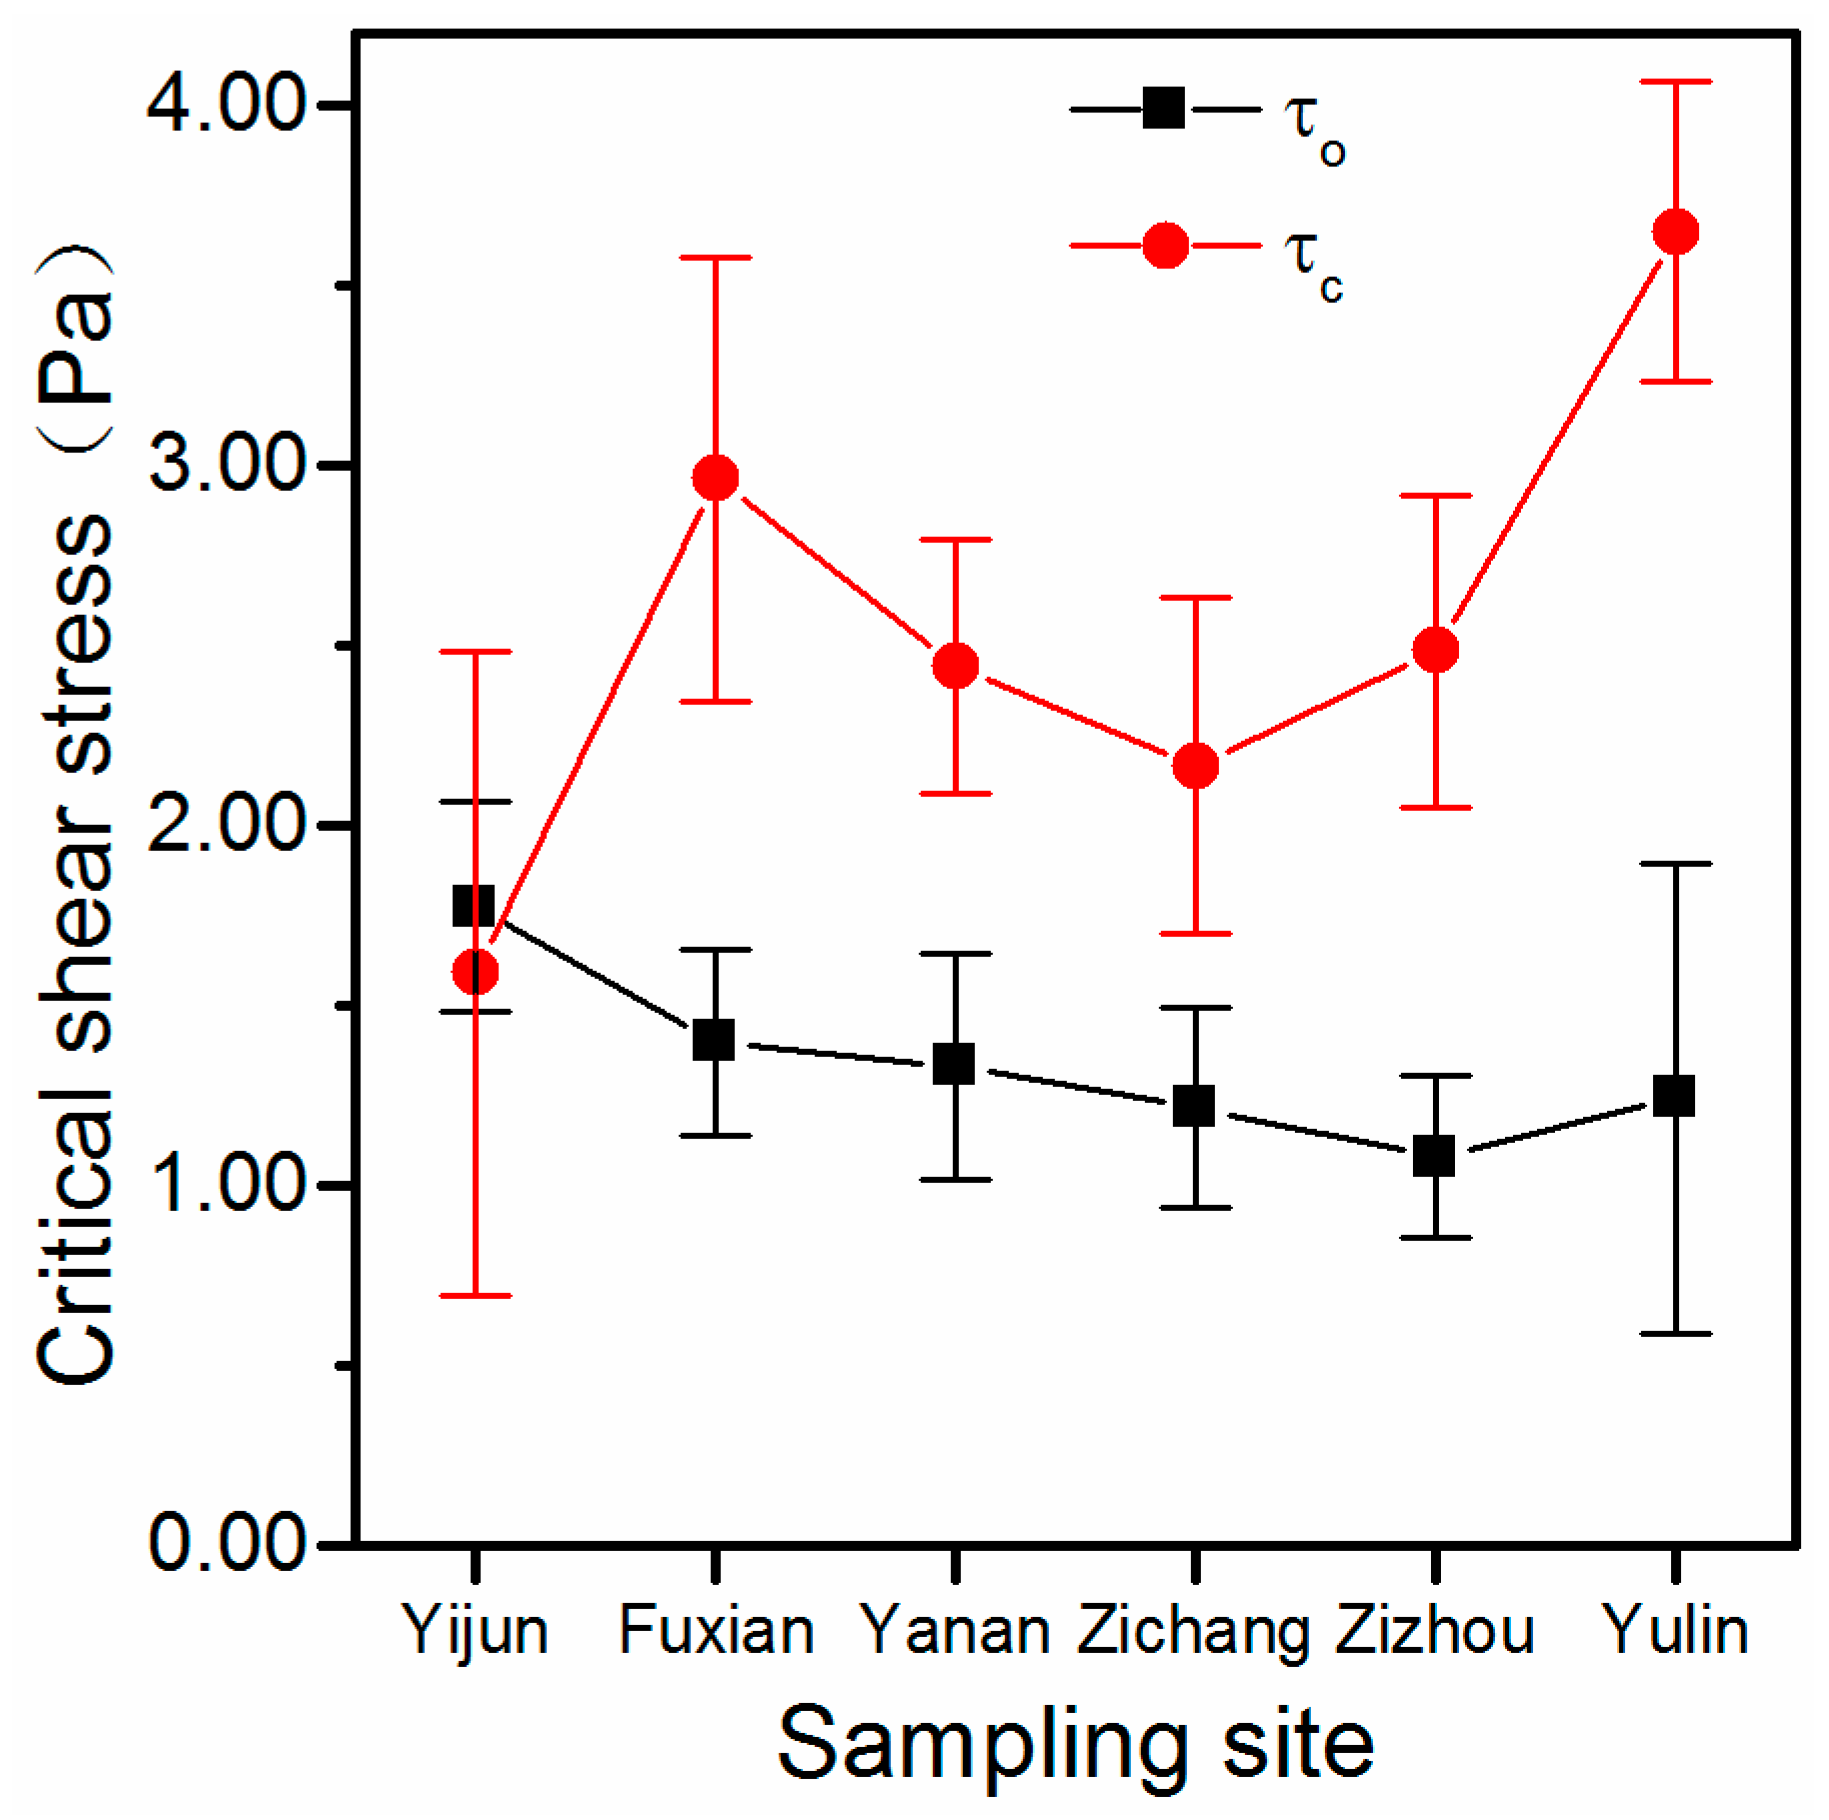
The minimum, mean, and maximum τc of the six sampling sites were 1.59 Pa, 2.55 Pa, and 3.65 Pa, respectively, while τo varied from 1.08 Pa to 1.78 Pa with a mean of 1.34 Pa. On average, the τc was 1.90 times greater than that of τo. τc and τo both showed moderate variability with a coefficient of variance (CV) of 0.25 and 0.16, respectively. As shown in Figure 2, the τc of all sampling sites was greater than τo, except for Yijun, where τo was only slightly greater than τc. The paired sample t-test also demonstrated a significant difference between τo and τc for six sampling sites (p < 0.05). Figure 2 shows that the changing trend of τc was chaotic from south to north. The two largest values appeared at Fuxian and Yulin, whereas the two lowest values appeared at Yijun and Zichang. From south to north, however, τo decreased gradually from Yijun (the maximum τo) to Zizhou (the minimum τo) and increased from Zizhou to Yulin.
3.2. Comparison of the Relationship between τc and τo, and Kr
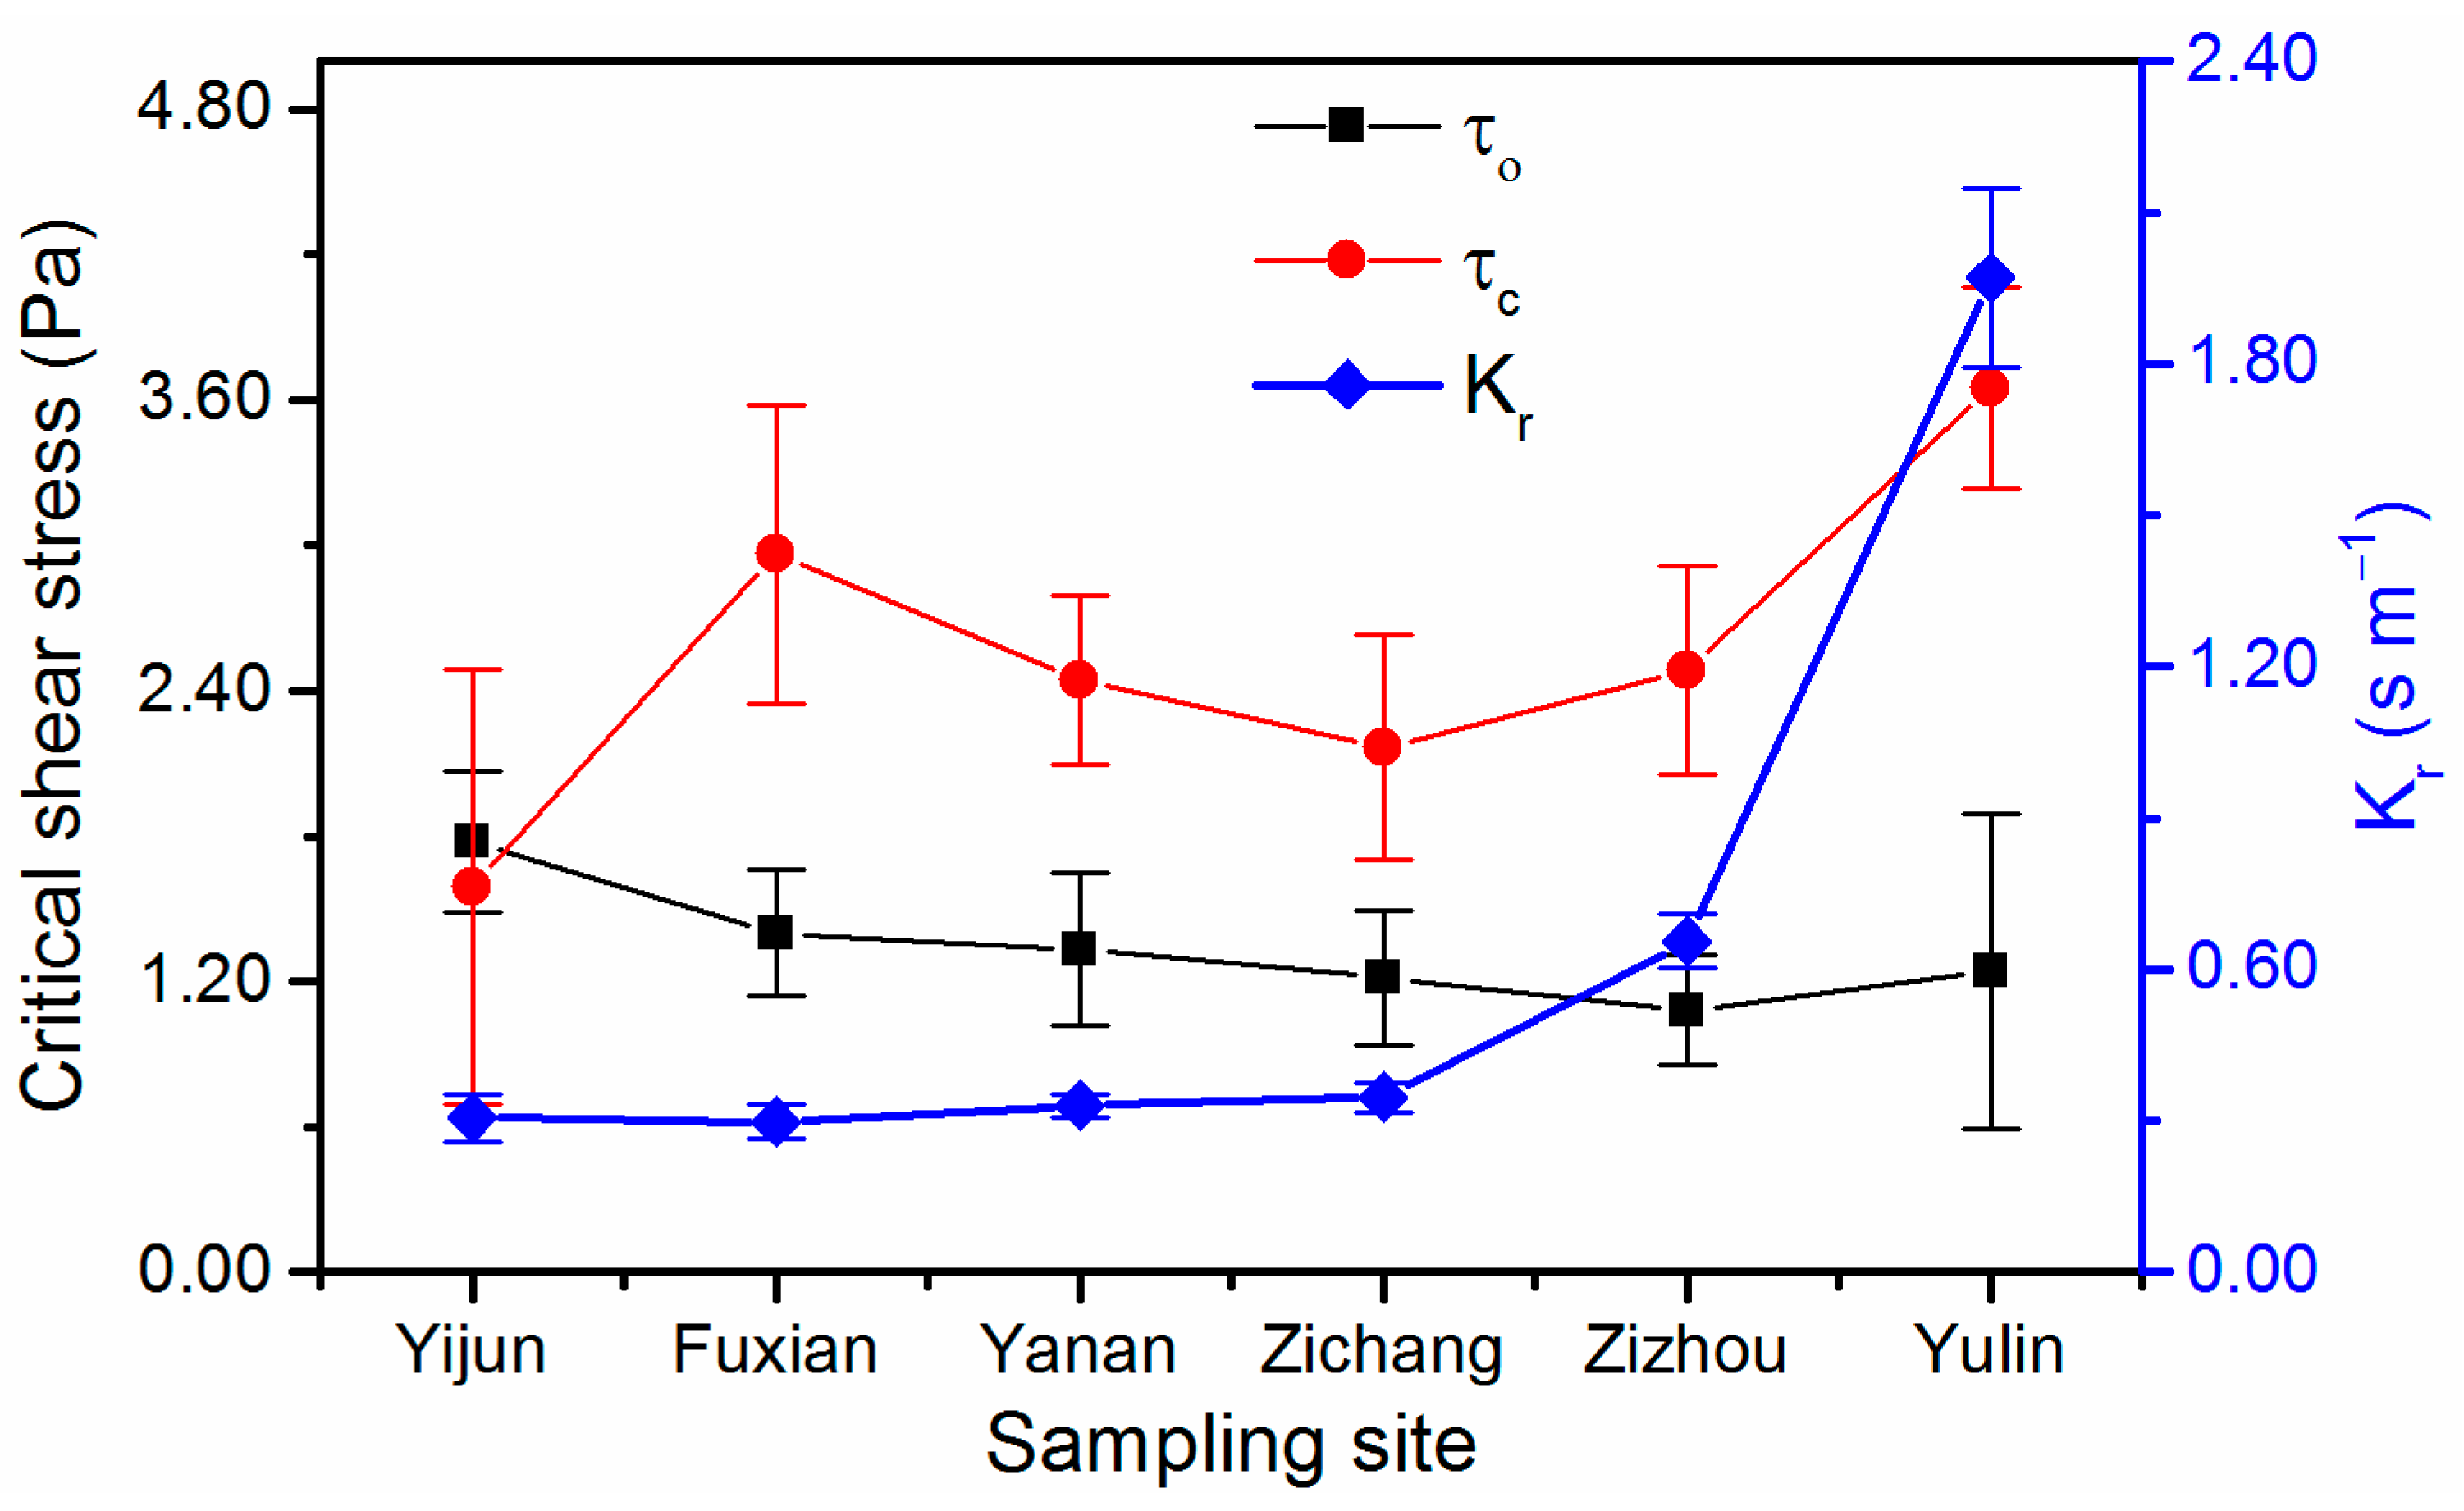
Table 4 lists the calculated results of Kr and τc, which showed satisfactory results with R2 (0.88–0.98) and NSE (0.88–0.98). Kr generally followed an increasing trend from south to north (Figure 3). The increasing trend of Kr was associated with variations in soil texture (Table 6). Kr decreased with clay content and silt content, and it increased with sand content.
As shown in Figure 3, at the sampling site of Yulin, both Kr and τc had the maximum value. Yijun, however, had the lowest Kr and nearly the lowest τc. Fuxian had the lowest Kr and the second-largest τc. No significant relationship existed between Kr and τc since a very different changing trend was observed between τc and Kr (Figure 3). For the relationship between Kr and τo, from Yijun to Yulin, Kr and τo followed increasing and decreasing trends, respectively. From Zizhou to Yulin, however, both Kr and τo followed increasing trends.
3.3. Comparison of the Relationship between τc and τo, and Their Influencing Factors
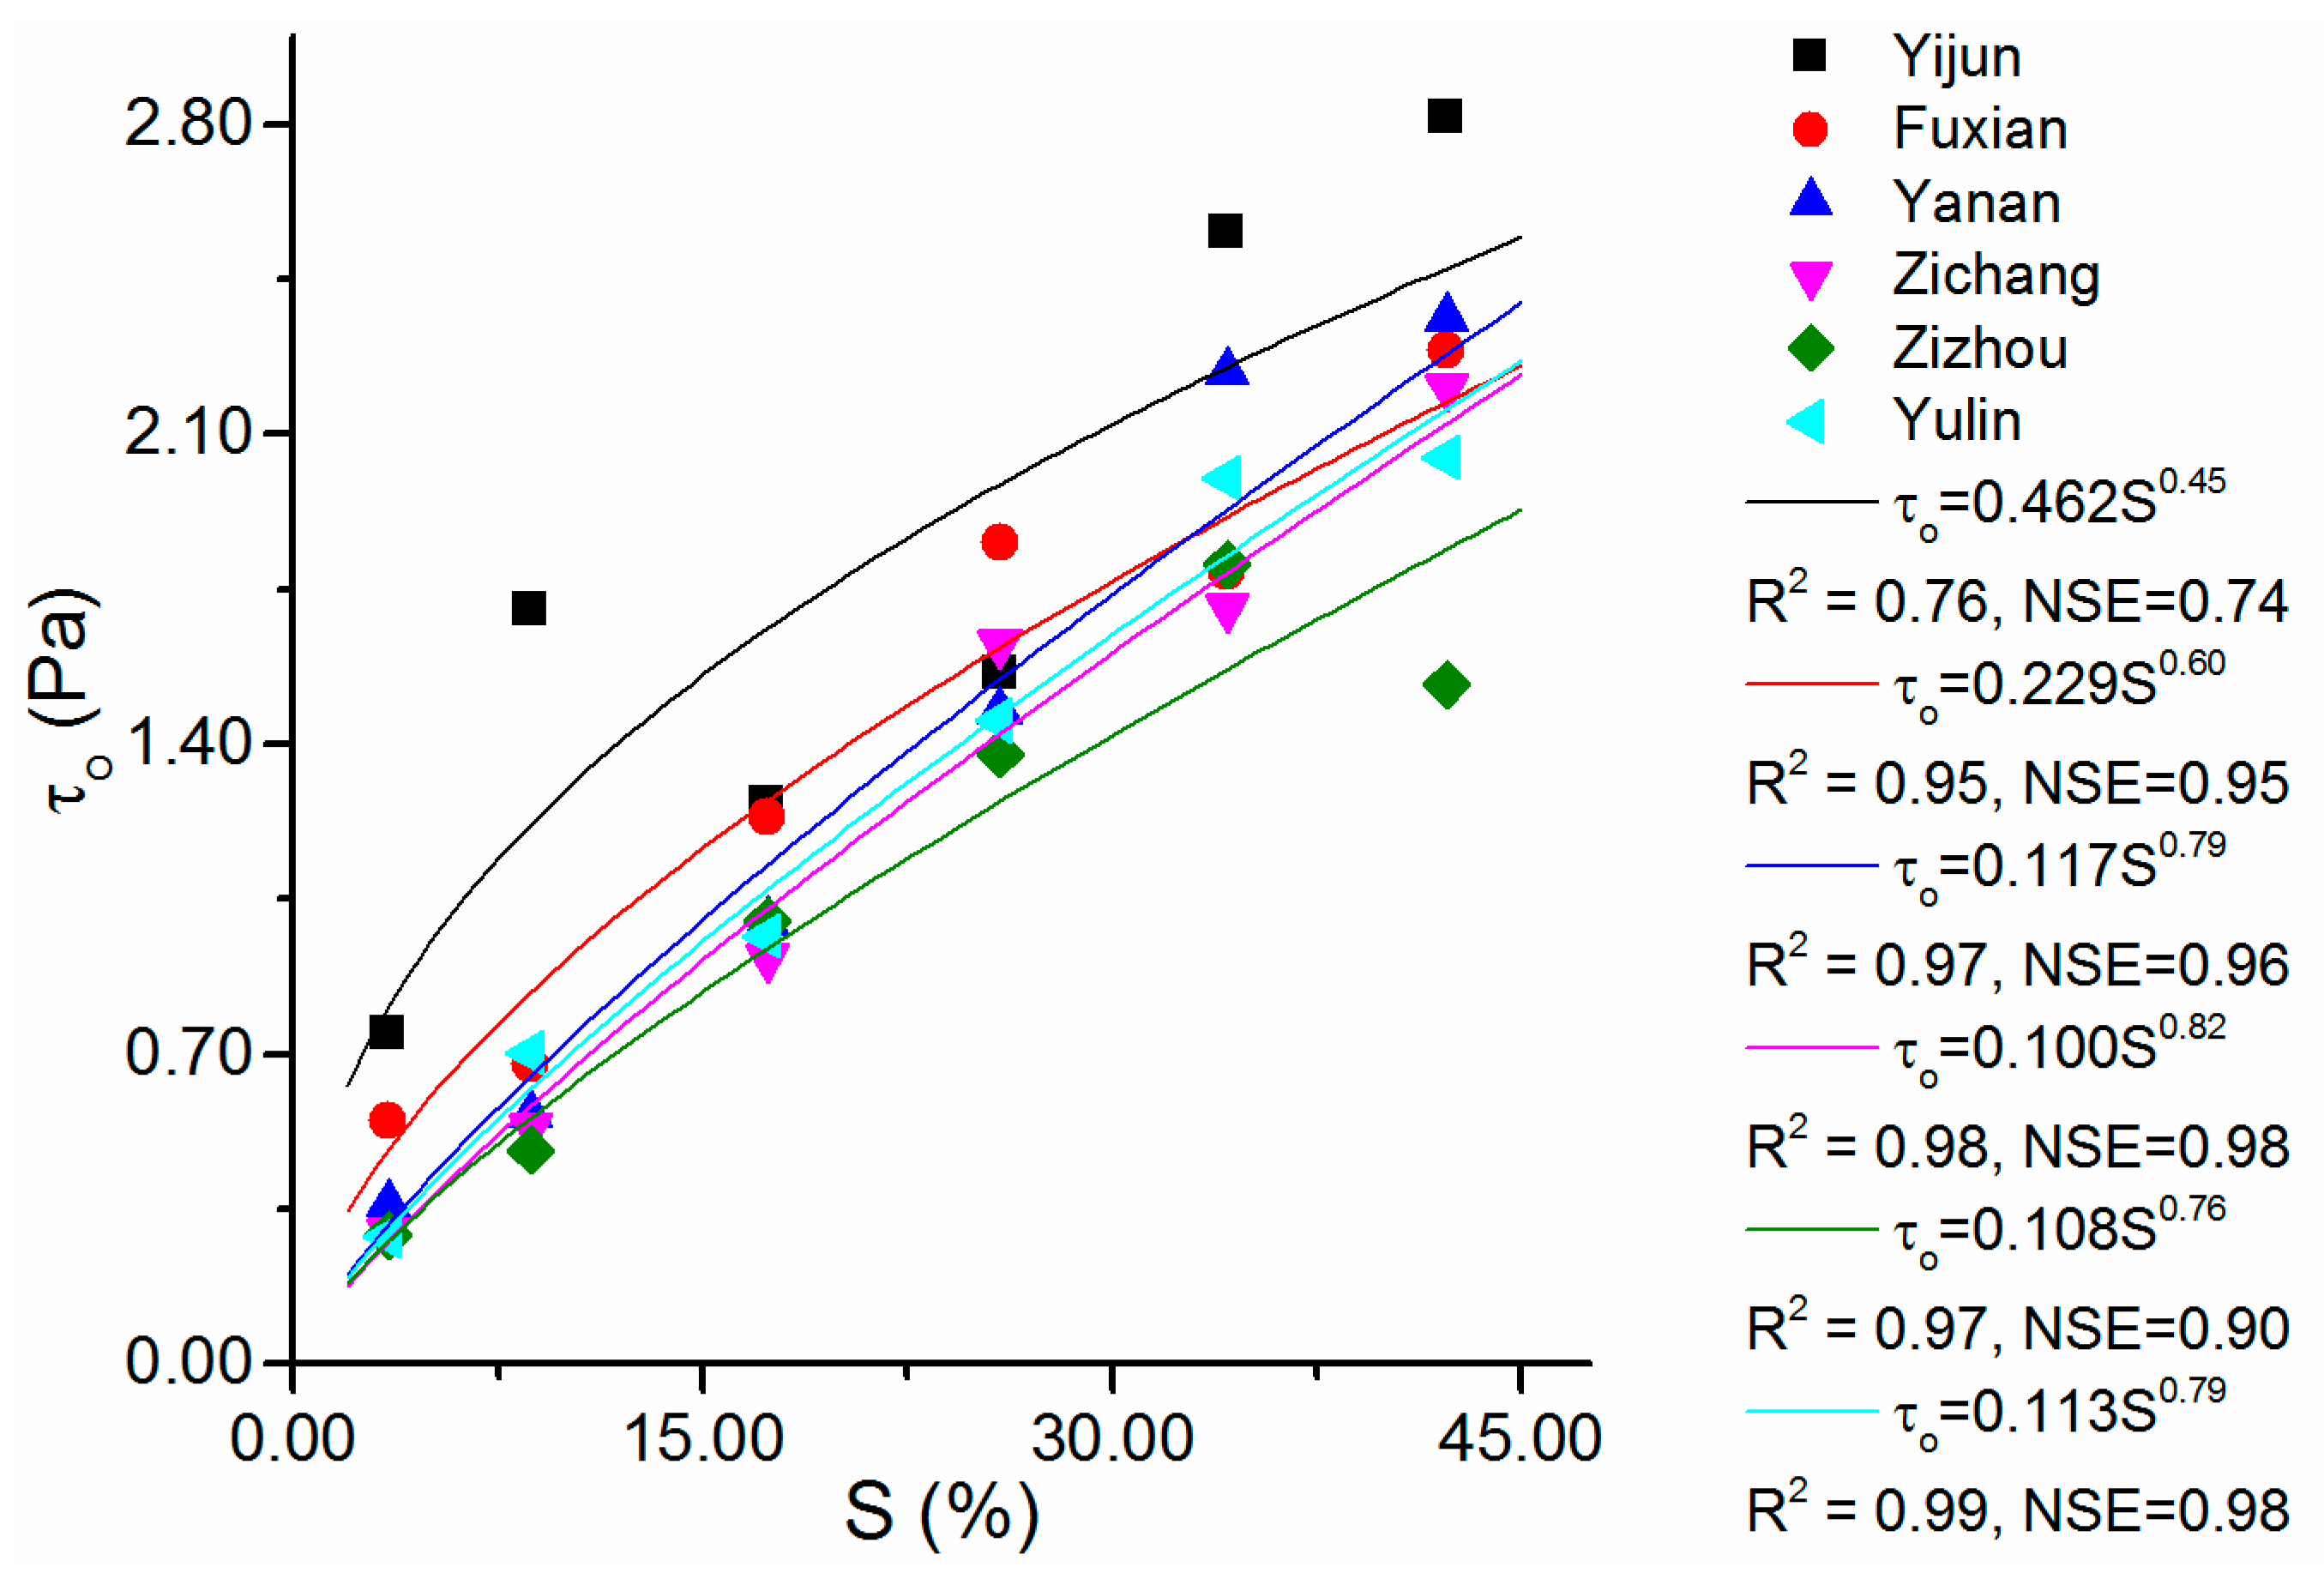
The τc was independent of S in the WEPP model, and thus, only the influence of S on τo was evaluated. As shown in Figure 4, a significant positive relationship existed between τo and S, with R2 ranging from 0.76 to 0.99 and NSE varying from 0.74 to 0.98. All sampling sites showed power functions between τo and S.
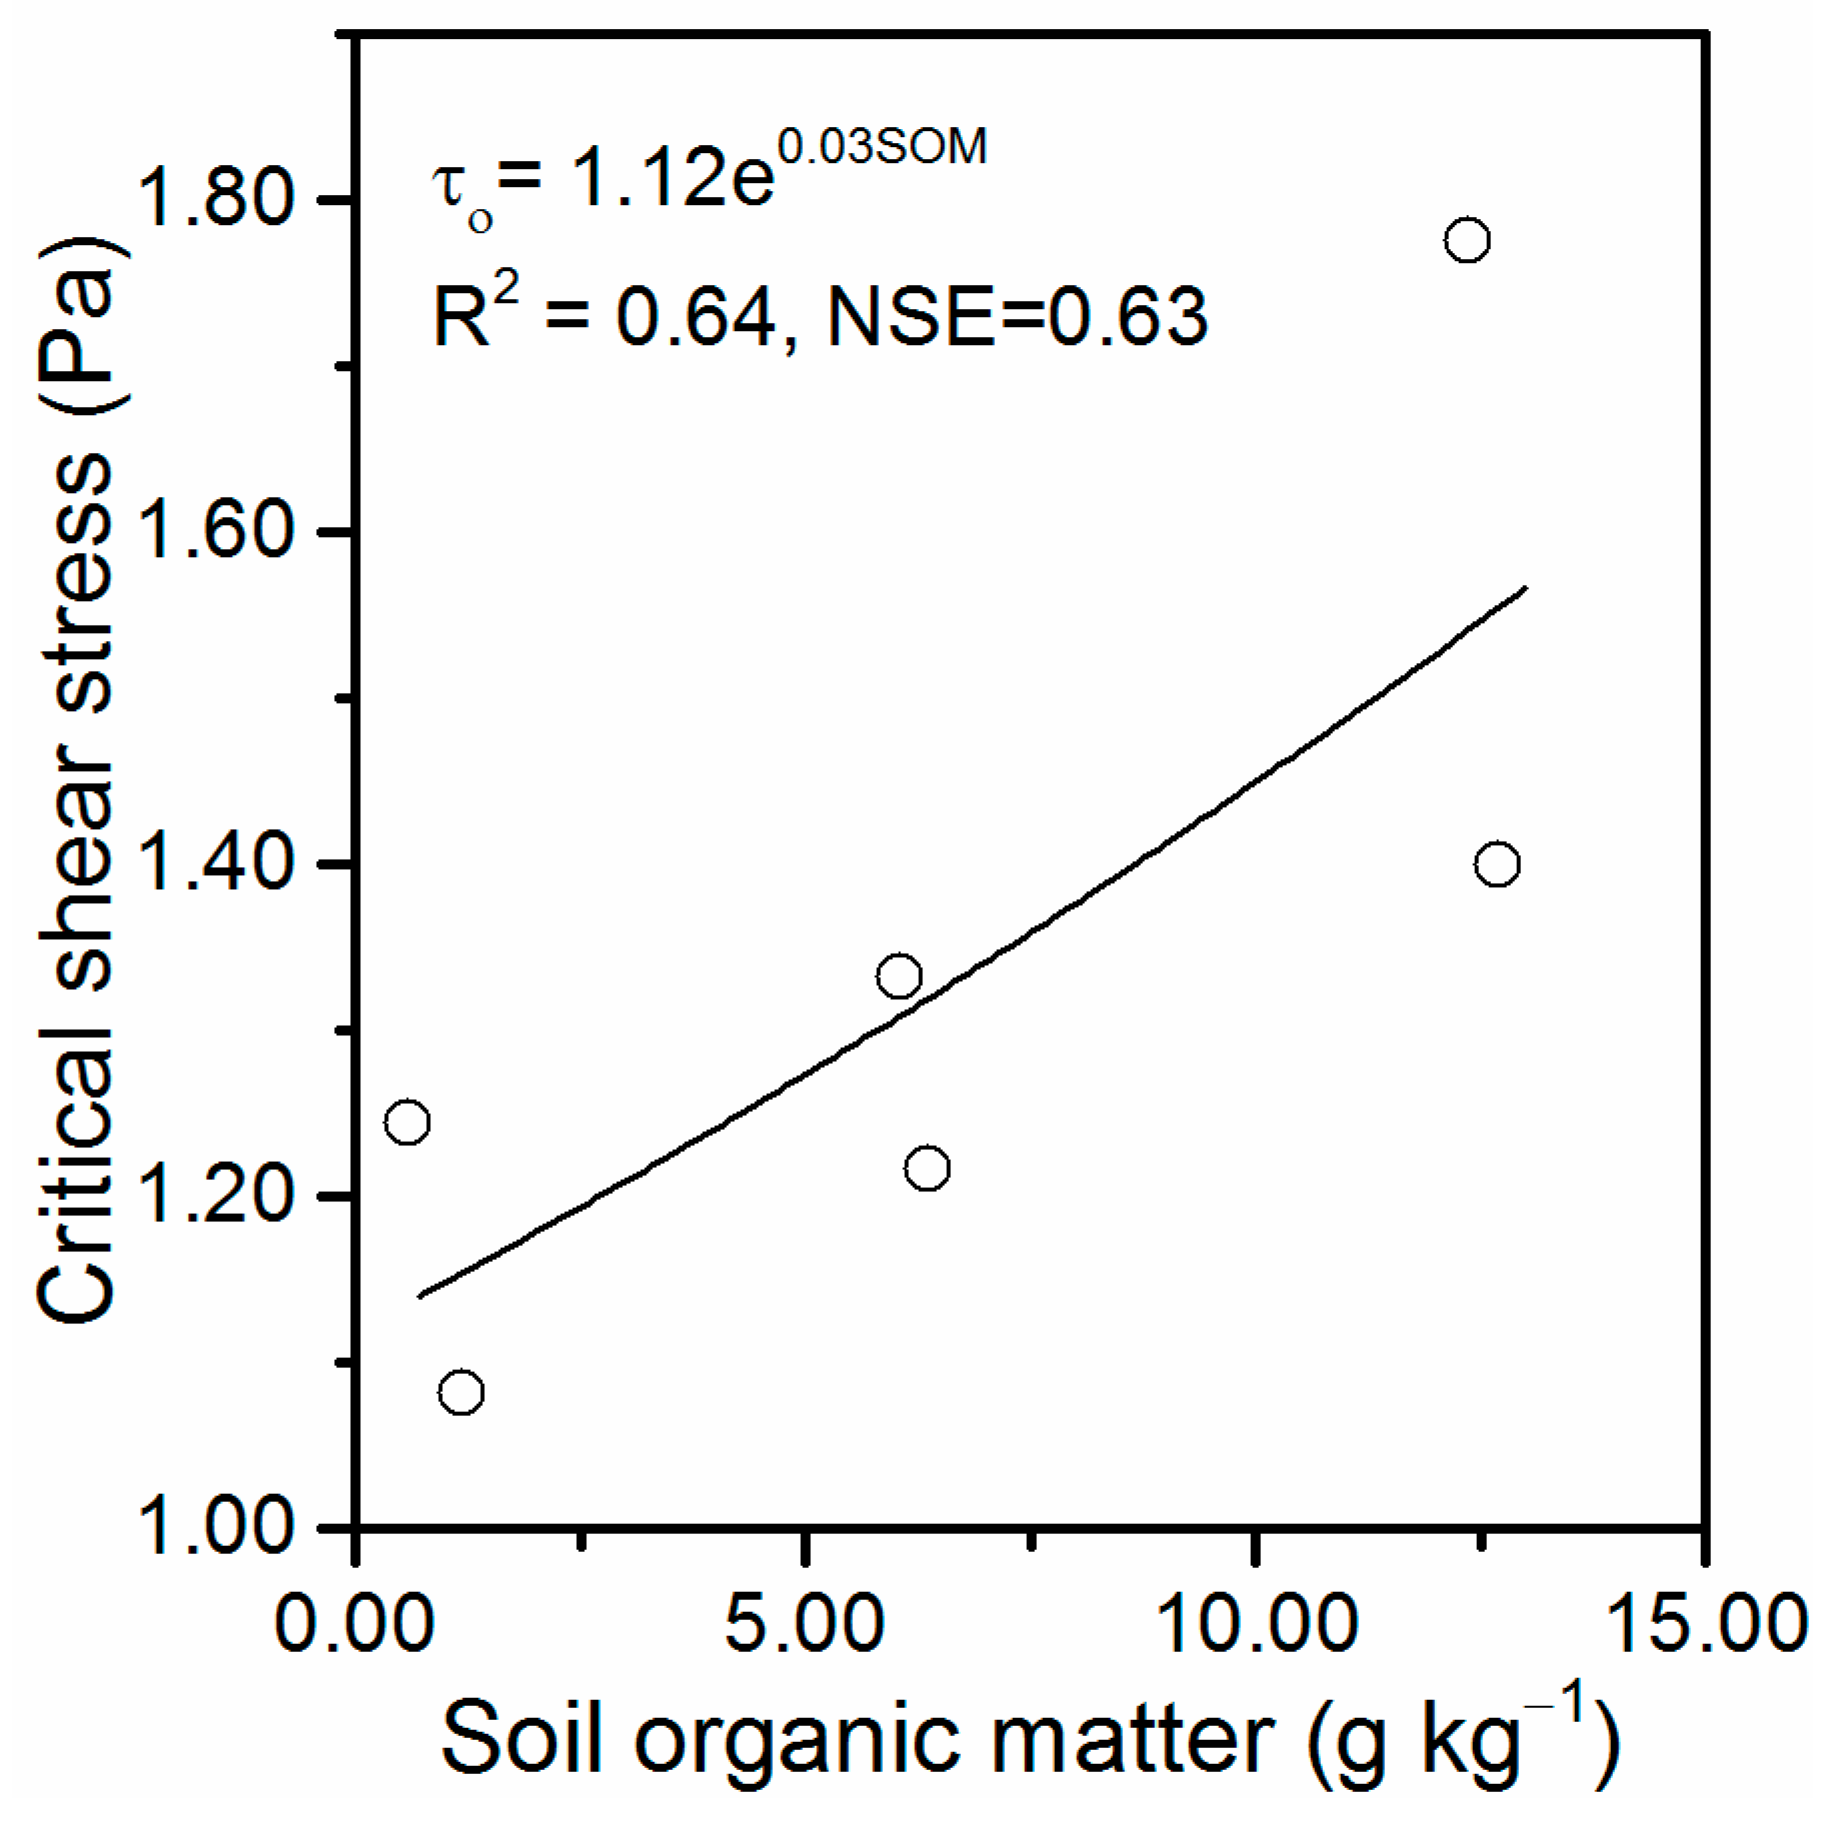
Regarding the impact of soil properties on τo and τc, no significant relationship was found between τc and the measured soil properties. Similarly, no relationships existed among clay content, silt content, and sand content and τo. An exponential function of τo and SOM was expressed (R2 = 0.64, NSE = 0.53; Figure 5).
4. Discussion
Nearing et al. [12] defined τc as the threshold of rill detachment below in which soil detachment is zero. In this study, nearly all sampling sites had obviously greater τc than τo. Interestingly, an obvious soil detachment was apparent for sampling sites with higher τc, which might contradict the definition of τc [12]. This result meant that τc calculated by Equation (3) could not represent the critical condition of the start of soil detachment. The definition of τc has been contested [33,56]. For example, Knapen et al. [46] and Wang et al. [57] have stated that τc represented the appearance of significant detachment, which still did not explain why significant detachment was observed at the sampling sites with higher τc. Therefore, the reliability of τc determined by Equation (3) was probably controversial. Nearing et al. [32] also indicated τc had no actual meaning, as it was calculated by linear regression, and a large regression slope would lead to a large value (τc).
The gradually increasing trend of Kr could be well explained by the soil properties. Specifically, Kr was negatively correlated to clay content and silt content, and a positive relationship was observed between sand content and Kr (Table 6). This finding was consistent with the results of Geng et al. [21]. Some previous studies have shown Kr decreased with τc, implying that factors that influenced Kr also affected τc [58]. Although Kr showed an increasing trend from south to north and had a satisfactory relationship with soil properties, no significant relationship was observed between Kr and τc. Furthermore, Knapen et al. [59] indicated that the Kr of deep noninversion tillage was 10 times lower than that of conventional plowing, but the differences in τc between these two tillage practices were not significant. Additionally, Geng et al. [21] calculated Kr and τc of 36 soil types across eastern China and also found no significant relationship between Kr and τc. For the relationship between Kr and τo, Kr increased with an increase of τc from Yijun to Zizhou, which supported the perception that the higher τo corresponded to the lower Kr. The increasing trends of τo and Kr from Zizhou to Yunlin barely supported the inverse relationship between τo and Kr, which could be attributed to the low clay content and high sand content in Yulin (Table 5). Sand particles need higher flow shear stress to be detached because of their high ratio of mass to surface area [60]. Although Yulin has high τo, Yulin also showed high Kr. The low clay content of this sampling site may explain both the high Kr and τo of Yulin [21].
For τc, the widely applied WEPP model considered that τc did not change with the variation of S [14,25,34]. This study, however, found a significantly positive relationship between τo and S. This result was the opposite of the common-sense understanding that the gravitational force along a flume bed increases with S, which makes soil particles detach more easily [31]. Lei and Nearing [34] also found an increase of τo with S for loose material. In this study, the ratios of the Ho (S, 42.26%) to the Ho (S, 3.49%) for Yijun, Fuxian, Yanan, Zichang, Zizhou, and Yulin were 31.08%, 34.30%, 54.12%, 61.04%, 58.14%, and 58.37%, respectively. Nonetheless, the S (42.26%) was 12.11 times that of the S (3.49%). Thus, the influence of S on τo was much greater than Ho and explained why τo increased with S [34]. This statement was inconsistent with the findings of some researchers who found that the critical shear stress was related only to soil properties [25,28]. Nonetheless, hydraulic parameters and S also have been used to calculate the critical shear stress [24,61]. This discrepancy has probably reflected the lack of clarity regarding the significance of the critical shear stress [7].
Numerous disputes have existed with regard to the influence of soil properties on τc [21,24]. This study demonstrated a poor relationship between τc and measured soil properties. Our results, however, agreed with the findings of Geng et al. [21]. They explored the relationship between τc and 17 soil properties of 36 soil types and also did not find a significant relationship between τc and the 17 soil properties. For the relationship between τo and measured soil properties, τo increased exponentially and SOM (Figure 5), which agreed with the findings of Kimiaghalam et al. [62] and Grabowski et al. [63]. The poor relationship between τo and soil texture was probably caused by the fact that both the cohesive effect of clay particles and the ratio of mass to surface area of sand particles determined τo, and their interaction was complicated [59].
Generally speaking, τo, compared with τc, did not present significantly better results with regard to the relationships with Kr, S, and soil properties. This finding could deepen the recognition of erosion processes and improve the precision of process-based soil erosion models. In this study, however, only the relationships between critical shear stress and some basic soil properties (soil texture and SOM) were established and compared, and the relationships with other key soil properties (such as soil cohesion, aggregate stability, plant root, etc.) were not investigated [64]. Therefore, further research should be conducted to compare the relationships between τo and τc and these influencing factors. Even though τo was more reliable compared to τc, observing the start of soil particle detachment was subjective [54]. Thus, it was meaningful to develop an objective method to ascertain the beginning of soil particle detachment [39,65]. Additionally, some researchers have argued that the critical shear stress had a relationship only with soil properties, which as well revealed the uncertainty of using a method to determine τo that was related to hydraulic parameters and S [28].
5. Conclusions
This study aimed to identify the reliability of critical shear stress in rills by observing the start of soil particle detachment. τc was determined by linear regression, and τo was measured by observing the soil particle detachment of six sampling sites along a transect of the Loess Plateau. The results showed that the mean τc (2.55 Pa) was 1.90 times that of τo (1.34 Pa). τc changed irregularly from south to north along the transect, and τo decreased from Yijun to Zizhou and then increased from Zizhou to Yulin. No significant relationship was observed between τc and rill erodibility (Kr). Kr increased with a decrease of τo from Yijun to Zizhou, whereas both Kr and τo followed increasing trends from Zizhou to Yulin. Although τc was deemed unchanged with S, τo followed an obviously increasing trend with the increase of S with great R2 (0.76 to 0.99) and NSE (0.74 to 0.98). No significant relationship existed between τc and measured soil properties (p > 0.05); however, τo exhibited exponentially increasing functions with SOM (R2 = 0.64; NSE = 0.63). Overall, τo displayed no significantly better results compared with τc, considering the relationships with Kr, S, and soil properties. Additionally, some uncertainties also remained regarding the method used to determine τo. The results of this study were helpful for the accurate measurement of critical shear stress in rills and for improving the prediction accuracy of the process-based soil erosion model.
Author Contributions
Experiment, Analysis, writing, R.G.; Conceptualization, methodology, supervision, Q.J.; experiment, revision, S.L.; methodology, revision, H.L.; experiment, B.L. and M.X. All authors have read and agreed to the published version of the manuscript.
Funding
This work was supported by the National Natural Science Foundation of China (nos. 41907049, 42007065, and 42101384) and the Research Foundation of Nanjing Hydraulic Research Institute (no. Y922001).
Institutional Review Board Statement
Not applicable.
Informed Consent Statement
Not applicable.
Data Availability Statement
The data supporting the results of this study are available from the corresponding author on the condition of reasonable request.
Acknowledgments
The authors appreciate Guanghui Zhang for his valuable suggestions, which were of great importance to this article.
Conflicts of Interest
The authors declare that they have no known competing financial interest or personal relationships that could have appeared to influence the work reported in this paper.
References
- Stefanidis, S.; Alexandridis, V.; Ghosal, K. Assessment of Water-Induced Soil Erosion as a Threat to Natura 2000 Protected Areas in Crete Island, Greece. Sustainability 2022, 14, 2738. [Google Scholar] [CrossRef]
- Orgiazzi, A.; Panagos, P. Soil biodiversity and soil erosion: It is time to get married: Adding an earthworm factor to soil erosion modelling. Global Ecol. Biogeogr. 2018, 27, 1155–1167. [Google Scholar] [CrossRef]
- Li, Z.; Xu, X.; Zhu, J.; Xu, C.; Wang, K. Sediment yield is closely related to lithology and landscape properties in heterogeneous karst watersheds. J. Hydrol. 2019, 568, 437–446. [Google Scholar] [CrossRef]
- Ma, Q.; Zhang, K.; Cao, Z.; Wei, M.; Yang, Z. Soil detachment by overland flow on steep cropland in the subtropical region of China. Hydrol. Process. 2020, 34, 1810–1820. [Google Scholar] [CrossRef]
- Zhang, K.; Lian, L.; Zhang, Z. Reliability of soil erodibility estimation in areas outside the US: A comparison of erodibility for main agricultural soils in the US and China. Environ. Earth Sci. 2016, 75, 252. [Google Scholar] [CrossRef]
- Trimble, S.W.; Crosson, P. US soil erosion rates—Myth and reality. Science 2000, 289, 248–250. [Google Scholar] [CrossRef] [Green Version]
- Govers, G.; Giménez, R.; van Oost, K. Rill erosion: Exploring the relationship between experiments, modelling and field observations. Earth Sci. Rev. 2007, 84, 87–102. [Google Scholar] [CrossRef]
- Lee, J.H.; Heo, J.H. Evaluation of estimation methods for rainfall erosivity based on annual precipitation in Korea. J. Hydrol. 2011, 409, 30–48. [Google Scholar] [CrossRef]
- Li, P.; Mu, X.; Holden, J.; Wu, Y.; Irvine, B.; Wang, F.; Gao, P.; Zhao, G.; Sun, W. Comparison of soil erosion models used to study the Chinese Loess Plateau. Earth Sci. Rev. 2017, 170, 17–30. [Google Scholar] [CrossRef] [Green Version]
- Chen, X.Y.; Huang, Y.H.; Zhao, Y.; Mo, B.; Mi, H.X.; Huang, C.H. Analytical method for determining rill detachment rate of purple soil as compared with that of loess soil. J. Hydrol. 2017, 549, 236–243. [Google Scholar] [CrossRef]
- Nicosia, A.; Di Stefano, C.; Pampalone, V.; Palmeri, V.; Ferro, V.; Nearing, M.A. Testing a new rill flow resistance approach using the Water Erosion Prediction Project experimental database. Hydrol. Process. 2019, 33, 616–626. [Google Scholar] [CrossRef]
- Nearing, M.A.; Foster, G.R.; Lane, L.J.; Finkner, S.C. A process-based soil erosion model for USDA-Water Erosion Prediction Project technology. Trans. Am. Soc. Agric. Eng. 1989, 32, 1587–1593. [Google Scholar] [CrossRef]
- Al-Hamdan, O.Z.; Pierson, F.B.; Nearing, M.A.; Williams, C.J.; Stone, J.J.; Kormos, P.R.; Boll, J.; Weltz, M.A. Concentrated flow erodibility for physically based erosion models: Temporal variability in disturbed and undisturbed rangelands. Water Resour. Res. 2012, 48, W07504. [Google Scholar] [CrossRef] [Green Version]
- Jiang, F.; He, K.; Huang, M.; Zhang, L.; Lin, G.; Zhan, Z.; Li, H.; Lin, J.; Ge, H.; Huang, Y. Impacts of near soil surface factors on reducing soil detachment process in benggang alluvial fans. J. Hydrol. 2020, 590, 25274. [Google Scholar] [CrossRef]
- Ma, Q.; Zhang, K.; Jabro, J.D.; Ren, L.; Liu, H. Freeze–thaw cycles effects on soil physical properties under different de-graded conditions in Northeast China. Environ. Earth Sci. 2019, 78, 321. [Google Scholar] [CrossRef]
- Sheridan, G.J.; So, H.B.; Loch, R.J.; Walker, C.M. Estimation of erosion model erodibility parameters from media properties. Soil Res. 2000, 38, 265–284. [Google Scholar] [CrossRef]
- Knapen, A.; Poesen, J.; Govers, G.; Gyssels, G.; Nachtergaele, J. Resistance of soils to concentrated flow erosion: A review. Earth Sci. Rev. 2007, 80, 75–109. [Google Scholar] [CrossRef]
- Geng, R.; Zhang, G.H.; Ma, Q.H.; Wang, H. Effects of landscape positions on soil resistance to rill erosion in a small catchment on the loess plateau. Biosyst. Eng. 2017, 160, 95–108. [Google Scholar] [CrossRef]
- Fattet, M.; Fu, Y.; Ghestem, M.; Ma, W.; Foulonneau, M.; Nespoulous, J.; le Bissonnais, Y.; Stokes, A. Effects of vegetation type on soil resistance to erosion: Relationship between aggregate stability and shear strength. Catena 2011, 87, 60–69. [Google Scholar] [CrossRef]
- Wang, B.; Zhang, G.H.; Shi, Y.Y.; Zhang, X.C. Soil detachment by overland flow under different vegetation restoration models in the Loess Plateau of China. Catena 2014, 116, 51–59. [Google Scholar] [CrossRef]
- Geng, R.; Zhang, G.H.; Ma, Q.H.; Wang, L.J. Soil resistance to runoff on steep croplands in Eastern China. Catena 2017, 152, 18–28. [Google Scholar] [CrossRef]
- De Baets, S.; Poesen, J.; Knapen, A.; Galindo, P. Impact of root architecture on the erosion-reducing potential of roots during concentrated flow. Earth Surf. Process. Landf. 2007, 32, 1323–1345. [Google Scholar] [CrossRef]
- Nearing, M.A.; Bradford, J.M.; Parker, S.C. Soil detachment by shallow flow at low slopes. Soil Sci. Soc. Am. J. 1991, 55, 339–344. [Google Scholar] [CrossRef]
- Wirtz, S.; Seeger, M.; Remke, A.; Wengel, R.; Wagner, J.F.; Ries, J.B. Do deterministic sediment detachment and transport equations adequately represent the process-interactions in eroding rills? An experimental field study. Catena 2013, 101, 61–78. [Google Scholar] [CrossRef]
- Gilley, J.E.; Elliot, W.J.; Laflen, J.M.; Simanton, J.R. Critical shear stress and critical flow rates for initiation of rilling. J. Hydrol. 1993, 142, 251–271. [Google Scholar] [CrossRef] [Green Version]
- Foster, G.R. Modeling the erosion process. In Hydrologic Modeling of Small Watersheds; ASAE Monograph No. 5.; Haan, C.T., Ed.; American Society of Agricultural Engineers: St. Joseph, MI, USA, 1982; pp. 296–380. [Google Scholar]
- Mamo, M.; Bubenzer, G.D. Detachment rate, soil erodibility, and soil strength as influenced by living plant roots part I: Laboratory study. Trans. Am. Soc. Agric. Eng. 2001, 44, 1167. [Google Scholar] [CrossRef]
- Flanagan, D.C.; Nearing, M.A. USDA-Water Erosion Prediction Project: Hillslope Profile and Watershed Model Documentation; Nserl Rep, 10; USDA-ARS National Soil Erosion Research Laboratory: West Lafayette, IN, USA, 1995; pp. 1–123.
- Lei, T.W.; Zhang, Q.W.; Yan, L.J.; Zhao, J.; Pan, Y.H. A rational method for estimating erodibility and critical shear stress of an eroding rill. Geoderma 2008, 144, 628–633. [Google Scholar] [CrossRef]
- Dey, S.; Debnath, K. Influence of streamwise bed slope on sediment threshold under stream flow. J. Irrig. Drain Eng. 2000, 126, 255–263. [Google Scholar] [CrossRef]
- Lamb, M.P.; Dietrich, W.E.; Venditti, J.G. Is the critical Shields stress for incipient sediment motion dependent on chan-nel-bed slope? J. Geophys. Res. 2008, 113, F2. [Google Scholar] [CrossRef] [Green Version]
- Nearing, M.A.; Lane, L.J.; Lopes, V.L. Modeling soil erosion. In Soil Erosion Research Methods, 2nd ed.; Lal, R., Ed.; Soil and Water Conservation Society and St. Lucie Press: Delray Beach, FL, USA, 1994; pp. 127–156. [Google Scholar]
- Zhu, J.C.; Gantzer, C.J.; Anderson, S.H.; Peyton, R.L.; Alberts, E.E. Comparison of concentrated-flow detachment equations for low shear stress. Soil Tillage Res. 2001, 61, 203–212. [Google Scholar] [CrossRef]
- Lei, T.W.; Nearing, M.K. Laboratory experiments of rill initiation and critical shear stress in loose soil material. Trans. Chin. Soc. Agric. Eng. 2000, 16, 26–30, (In Chinese with English Abstract). [Google Scholar]
- Wang, C.; Wang, B.; Wang, Y.; Wang, Y.; Zhang, W.; Yan, Y. Impact of near-surface hydraulic gradient on the interrill erosion process. Eur. J. Soil Sci. 2020, 71, 598–614. [Google Scholar] [CrossRef]
- Nouwakpo, S.K.; Huang, C.H.; Bowling, L.; Owens, P. Impact of vertical hydraulic gradient on rill erodibility and critical shear stress. Soil Sci Soc. Am. J. 2010, 74, 1914–1921. [Google Scholar] [CrossRef]
- Lavelle, J.W.; Mofjeld, H.O. Do critical stresses for incipient motion and erosion really exist? J. Hydraul. Eng. 1987, 113, 70–385. [Google Scholar] [CrossRef]
- Buffington, J.M.; Dietrich, W.E.; Kirchner, J.W. Friction angle measurements on a naturally formed gravel streambed: Implications for critical boundary shear stress. Water Resour. Res. 1992, 28, 411–425. [Google Scholar] [CrossRef]
- Righetti, M.; Lucarelli, C. May the Shields theory be extended to cohesive and adhesive benthic sediments? J. Geophys. Res. 2007, 112, C5. [Google Scholar] [CrossRef] [Green Version]
- Buffington, J.M. The legend of AF Shields. J. Hydraul. Eng. 1999, 125, 376–387. [Google Scholar] [CrossRef]
- García, M.H. Discussion of The Legend of AF Shields. J. Hydraul. Eng. 2000, 126, 718–720. [Google Scholar] [CrossRef] [Green Version]
- Zhang, M.; Yu, G. Critical conditions of incipient motion of cohesive sediments. Water Resour. Res. 2017, 53, 7798–7815. [Google Scholar] [CrossRef]
- Nearing, M.A.; Norton, L.D.; Bulgakov, D.A.; Larionov, G.A.; West, L.T.; Dontsova, K.M. Hydraulics and erosion in eroding rills. Water Resour. Res. 1997, 33, 865–876. [Google Scholar] [CrossRef]
- Shi, Z.H.; Fang, N.F.; Wu, F.Z.; Wang, L.; Yue, B.J.; Wu, G.L. Soil erosion processes and sediment sorting associated with transport mechanisms on steep slopes. J. Hydrol. 2012, 454, 123–130. [Google Scholar] [CrossRef]
- Giménez, R.; Govers, G. Flow detachment by concentrated flow on smooth and irregular beds. Soil Sci. Soc. Am. J. 2002, 66, 1475–1483. [Google Scholar] [CrossRef]
- Knapen, A.; Poesen, J.; Govers, G.; de Baets, S. The effect of conservation tillage on runoff erosivity and soil erodibility during concentrated flow. Hydrol. Process. 2008, 22, 1497–1508. [Google Scholar] [CrossRef]
- Stroosnijder, L. Measurement of erosion: Is it possible? Catena 2005, 64, 162–173. [Google Scholar] [CrossRef]
- Geng, R.; Zhang, G.H.; Hong, D.L.; Ma, Q.H.; Jin, Q.; Shi, Y.Z. Response of soil detachment capacity to landscape positions in hilly and gully regions of the Loess Plateau. Catena 2021, 196, 104852. [Google Scholar] [CrossRef]
- Liu, Z.P.; Shao, M.A.; Wang, Y.Q. Spatial patterns of soil total nitrogen and soil total phosphorus across the entire Loess Plateau region of China. Geoderma 2013, 197, 67–78. [Google Scholar] [CrossRef]
- Yang, Y.; Jia, X.; Wendroth, O.; Liu, B.; Shi, Y.; Huang, T.; Bai, X. Noise-assisted multivariate empirical mode decomposition of saturated hydraulic conductivity along a south-north transect across the Loess Plateau of China. Soil Sci. Soc. Am. J. 2019, 83, 311–323. [Google Scholar] [CrossRef]
- Liu, Z.P.; Shao, M.A.; Wang, Y.Q. Large-scale spatial variability and distribution of soil organic carbon across the entire Loess Plateau, China. Soil Res. 2012, 50, 114–124. [Google Scholar] [CrossRef]
- Liu, H.; Wang, J.; Zhang, K.; Kong, Y. Effectiveness of geotextiles for road slope protection under simulated rainfall. Environ. Earth Sci. 2016, 75, 1–11. [Google Scholar] [CrossRef]
- Su, Z.-L.; Zhang, G.-H.; Yi, T.; Liu, F. Soil Detachment Capacity by Overland Flow for Soils of the Beijing Region. Soil Sci. 2014, 179, 446–453. [Google Scholar] [CrossRef]
- Salem, H.; Rennie, C.D. Practical determination of critical shear stress in cohesive soils. J. Hydraul. Eng. 2017, 143, 04017045. [Google Scholar] [CrossRef]
- Geng, R.; Zhang, G.H.; Li, Z.W.; Wang, H. Spatial variation in soil resistance to flowing water erosion along a regional transect in the Loess Plateau. Earth Surf. Process. Landf. 2015, 40, 2049–2058. [Google Scholar] [CrossRef]
- Khanal, A.; Klavon, K.R.; Fox, G.A.; Daly, E.R. Comparison of linear and nonlinear models for cohesive sediment detachment: Rill erosion, hole erosion test, and streambank erosion studies. J. Hydraul. Eng. 2016, 142, 04016026. [Google Scholar] [CrossRef]
- Wang, J.G.; Li, Z.X.; Cai, C.F.; Yang, W.; Ma, R.M.; Zhang, G.B. Predicting physical equations of soil detachment by simulated concentrated flow in Ultisols (subtropical China). Earth Surf. Process. Landf. 2012, 37, 633–641. [Google Scholar] [CrossRef]
- Nearing, M.A.; West, L.T.; Brown, L.C. A consolidation model for estimating changes in rill erodibility. Trans. Am. Soc. Agric. Eng. 1988, 31, 696–700. [Google Scholar]
- Knapen, A.; Poesen, J.; de Baets, S. Seasonal variations in soil erosion resistance during concentrated flow for a lo-ess-derived soil under two contrasting tillage practices. Soil Tillage Res. 2007, 94, 425–440. [Google Scholar] [CrossRef]
- Poesen, J.; de Luna, E.; Franca, A.; Nachtergaele, J.; Govers, G. Concentrated flow erosion rates as affected by rock fragment cover and initial soil moisture content. Catena 1999, 36, 315–329. [Google Scholar] [CrossRef]
- De Ploey, J. Threshold conditions for thalweg gullying with special reference to loess areas. Catena 1990, 17, 147–151. [Google Scholar]
- Kimiaghalam, N.; Clark, S.P.; Ahmari, H. An experimental study on the effects of physical, mechanical, and electro-chemical properties of natural cohesive soils on critical shear stress and erosion rate. Int. J. Sediment. Res. 2016, 31, 1–15. [Google Scholar] [CrossRef]
- Grabowski, R.C.; Droppo, I.G.; Wharton, G. Erodibility of cohesive sediment: The importance of sediment properties. Earth Sci. Rev. 2011, 105, 101–120. [Google Scholar] [CrossRef]
- Vannoppen, W.; Vanmaercke, M.; de Baets, S.; Poesen, J. A review of the mechanical effects of plant roots on concentrated flow erosion rates. Earth Sci. Rev. 2015, 150, 666–678. [Google Scholar] [CrossRef] [Green Version]
- Ternat, F.; Boyer, P.; Anselmet, F.; Amielh, M. Erosion threshold of saturated natural cohesive sediments: Modeling and experiments. Water Resour. Res. 2008, 44, W11434. [Google Scholar] [CrossRef]
Figure 1.
The six sampling sites.

Figure 2.
Comparison of critical shear stress determined by observed soil particles detachment (τo) and critical shear stress measured by linear regression (τc).
Figure 2.
Comparison of critical shear stress determined by observed soil particles detachment (τo) and critical shear stress measured by linear regression (τc).

Figure 3.
Comparison of the relationships between rill erodibility (Kr) and τo and τc.

Figure 4.
The relationship between τo and slope gradient (S).

Figure 5.
The relationship between τo and soil organic matter (SOM).


Table 1.
Description of six sampling sites.
| Sampling Site | Longitude | Latitude | Elevation (m) | Temperature (°C) | Precipitation (mm) | Coverage (%) | Crop |
|---|---|---|---|---|---|---|---|
| Yijun | 109°22′40″ | 35°23′22″ | 1002 | 10.3 | 591 | 1 | Corn |
| Fuxian | 109°27′19″ | 35°57′50″ | 1183 | 10.2 | 542 | 2 | Corn |
| Yanan | 109°34′34″ | 36°40′37″ | 980 | 9.9 | 514 | 5 | Corn |
| Zichang | 109°40′15″ | 37°10′31″ | 1058 | 9.6 | 437 | 3 | Corn |
| Zizhou | 109°44′19″ | 37°42′40″ | 1077 | 9.3 | 411 | 5 | Corn |
| Yulin | 109°48′10″ | 38°12′42″ | 1132 | 8.8 | 383 | 3 | Corn |
Table 2.
Critical hydraulic parameters for τo test of six sampling sites.
| Items | Minimum | Maximum | Mean | Standard Deviation | CV |
|---|---|---|---|---|---|
| Qo (m3 s−1) | 0.000040 | 0.000140 | 0.000065 | 0.000039 | 0.59 |
| Ho (m) | 0.00060 | 0.00133 | 0.00078 | 0.00028 | 0.35 |
| Vo (m s−1) | 0.18 | 0.25 | 0.21 | 0.03 | 0.13 |
| τo (Pa) | 1.08 | 1.78 | 1.34 | 0.24 | 0.18 |
Note: Qo, critical flow discharge of τo test; Ho, critical flow depth of τo test; Vo, critical flow velocity of τo test; CV, coefficient of variance.
Table 3.
Hydraulic parameters for τc test.
| Q (m3 s−1) | V (m s−1) | H (m) | τ (Pa) |
|---|---|---|---|
| 0.00025 | 0.53 | 0.0014 | 3.45 |
| 0.0005 | 0.73 | 0.0020 | 5.00 |
| 0.001 | 1.01 | 0.0028 | 7.20 |
| 0.0015 | 1.26 | 0.0034 | 8.62 |
| 0.002 | 1.42 | 0.0040 | 10.22 |
| 0.0025 | 1.61 | 0.0044 | 11.26 |
Table 4.
Calculated results of soil erosion resistance to overland flow of six sampling sites.
| Sampling Sites | Regression Equations | R2 | NSE |
|---|---|---|---|
| Yijun | Dc = 0.31 (τ − 1.59) | 0.88 | 0.88 |
| Fuxian | Dc = 0.30 (τ − 2.96) | 0.95 | 0.95 |
| Yanan | Dc = 0.33 (τ − 2.44) | 0.98 | 0.98 |
| Zichang | Dc = 0.35 (τ − 2.17) | 0.96 | 0.98 |
| Zizhou | Dc = 0.65 (τ − 2.48) | 0.98 | 0.98 |
| Yulin | Dc = 1.97 (τ − 3.65) | 0.98 | 0.97 |
Table 5.
Soil properties of six sampling sites.
| Sampling Site | Clay Content (%) | Silt Content (%) | Sand Content (%) | SOM (g kg−1) |
|---|---|---|---|---|
| Yijun | 10.11 | 77.36 | 12.53 | 12.37 |
| Fuxian | 9.47 | 76.66 | 13.87 | 12.69 |
| Yanan | 13.55 | 76.67 | 9.79 | 6.05 |
| Zichang | 11.56 | 62.33 | 26.11 | 6.37 |
| Zizhou | 5.43 | 39.97 | 54.60 | 1.19 |
| Yulin | 1.12 | 4.68 | 94.20 | 0.59 |
Table 6.
Relationship between Kr and soil properties by Pearson Correlation Coefficient.
| Items | Clay Content (%) | Silt Content (%) | Sand Content (%) | SOM (g kg−1) |
|---|---|---|---|---|
| Kr | −0.884 * | −0.946 ** | 0.947 ** | −0.687 |
Note: ** and * indicate significance at the 0.05 level and 0.01 level, respectively.
Publisher’s Note: MDPI stays neutral with regard to jurisdictional claims in published maps and institutional affiliations. |
© 2022 by the authors. Licensee MDPI, Basel, Switzerland. This article is an open access article distributed under the terms and conditions of the Creative Commons Attribution (CC BY) license (https://creativecommons.org/licenses/by/4.0/).
Share and Cite
MDPI and ACS Style
Geng, R.; Jin, Q.; Lei, S.; Liu, H.; Lu, B.; Xie, M. Comparison of Critical Shear Stress of Rill Erosion Estimated from Two Methods. Water 2022, 14, 1949. https://0-doi-org.brum.beds.ac.uk/10.3390/w14121949
AMA Style
Geng R, Jin Q, Lei S, Liu H, Lu B, Xie M. Comparison of Critical Shear Stress of Rill Erosion Estimated from Two Methods. Water. 2022; 14(12):1949. https://0-doi-org.brum.beds.ac.uk/10.3390/w14121949
Chicago/Turabian StyleGeng, Ren, Qiu Jin, Shaohua Lei, Hongyuan Liu, Bin Lu, and Meixiang Xie. 2022. "Comparison of Critical Shear Stress of Rill Erosion Estimated from Two Methods" Water 14, no. 12: 1949. https://0-doi-org.brum.beds.ac.uk/10.3390/w14121949
Note that from the first issue of 2016, this journal uses article numbers instead of page numbers. See further details here.