

Assessment of Meteorological Drought Trends in a Selected Coastal Basin Area in Poland—A Case Study

 , , and
Abstract
:1. Introduction
2. Materials and Methods
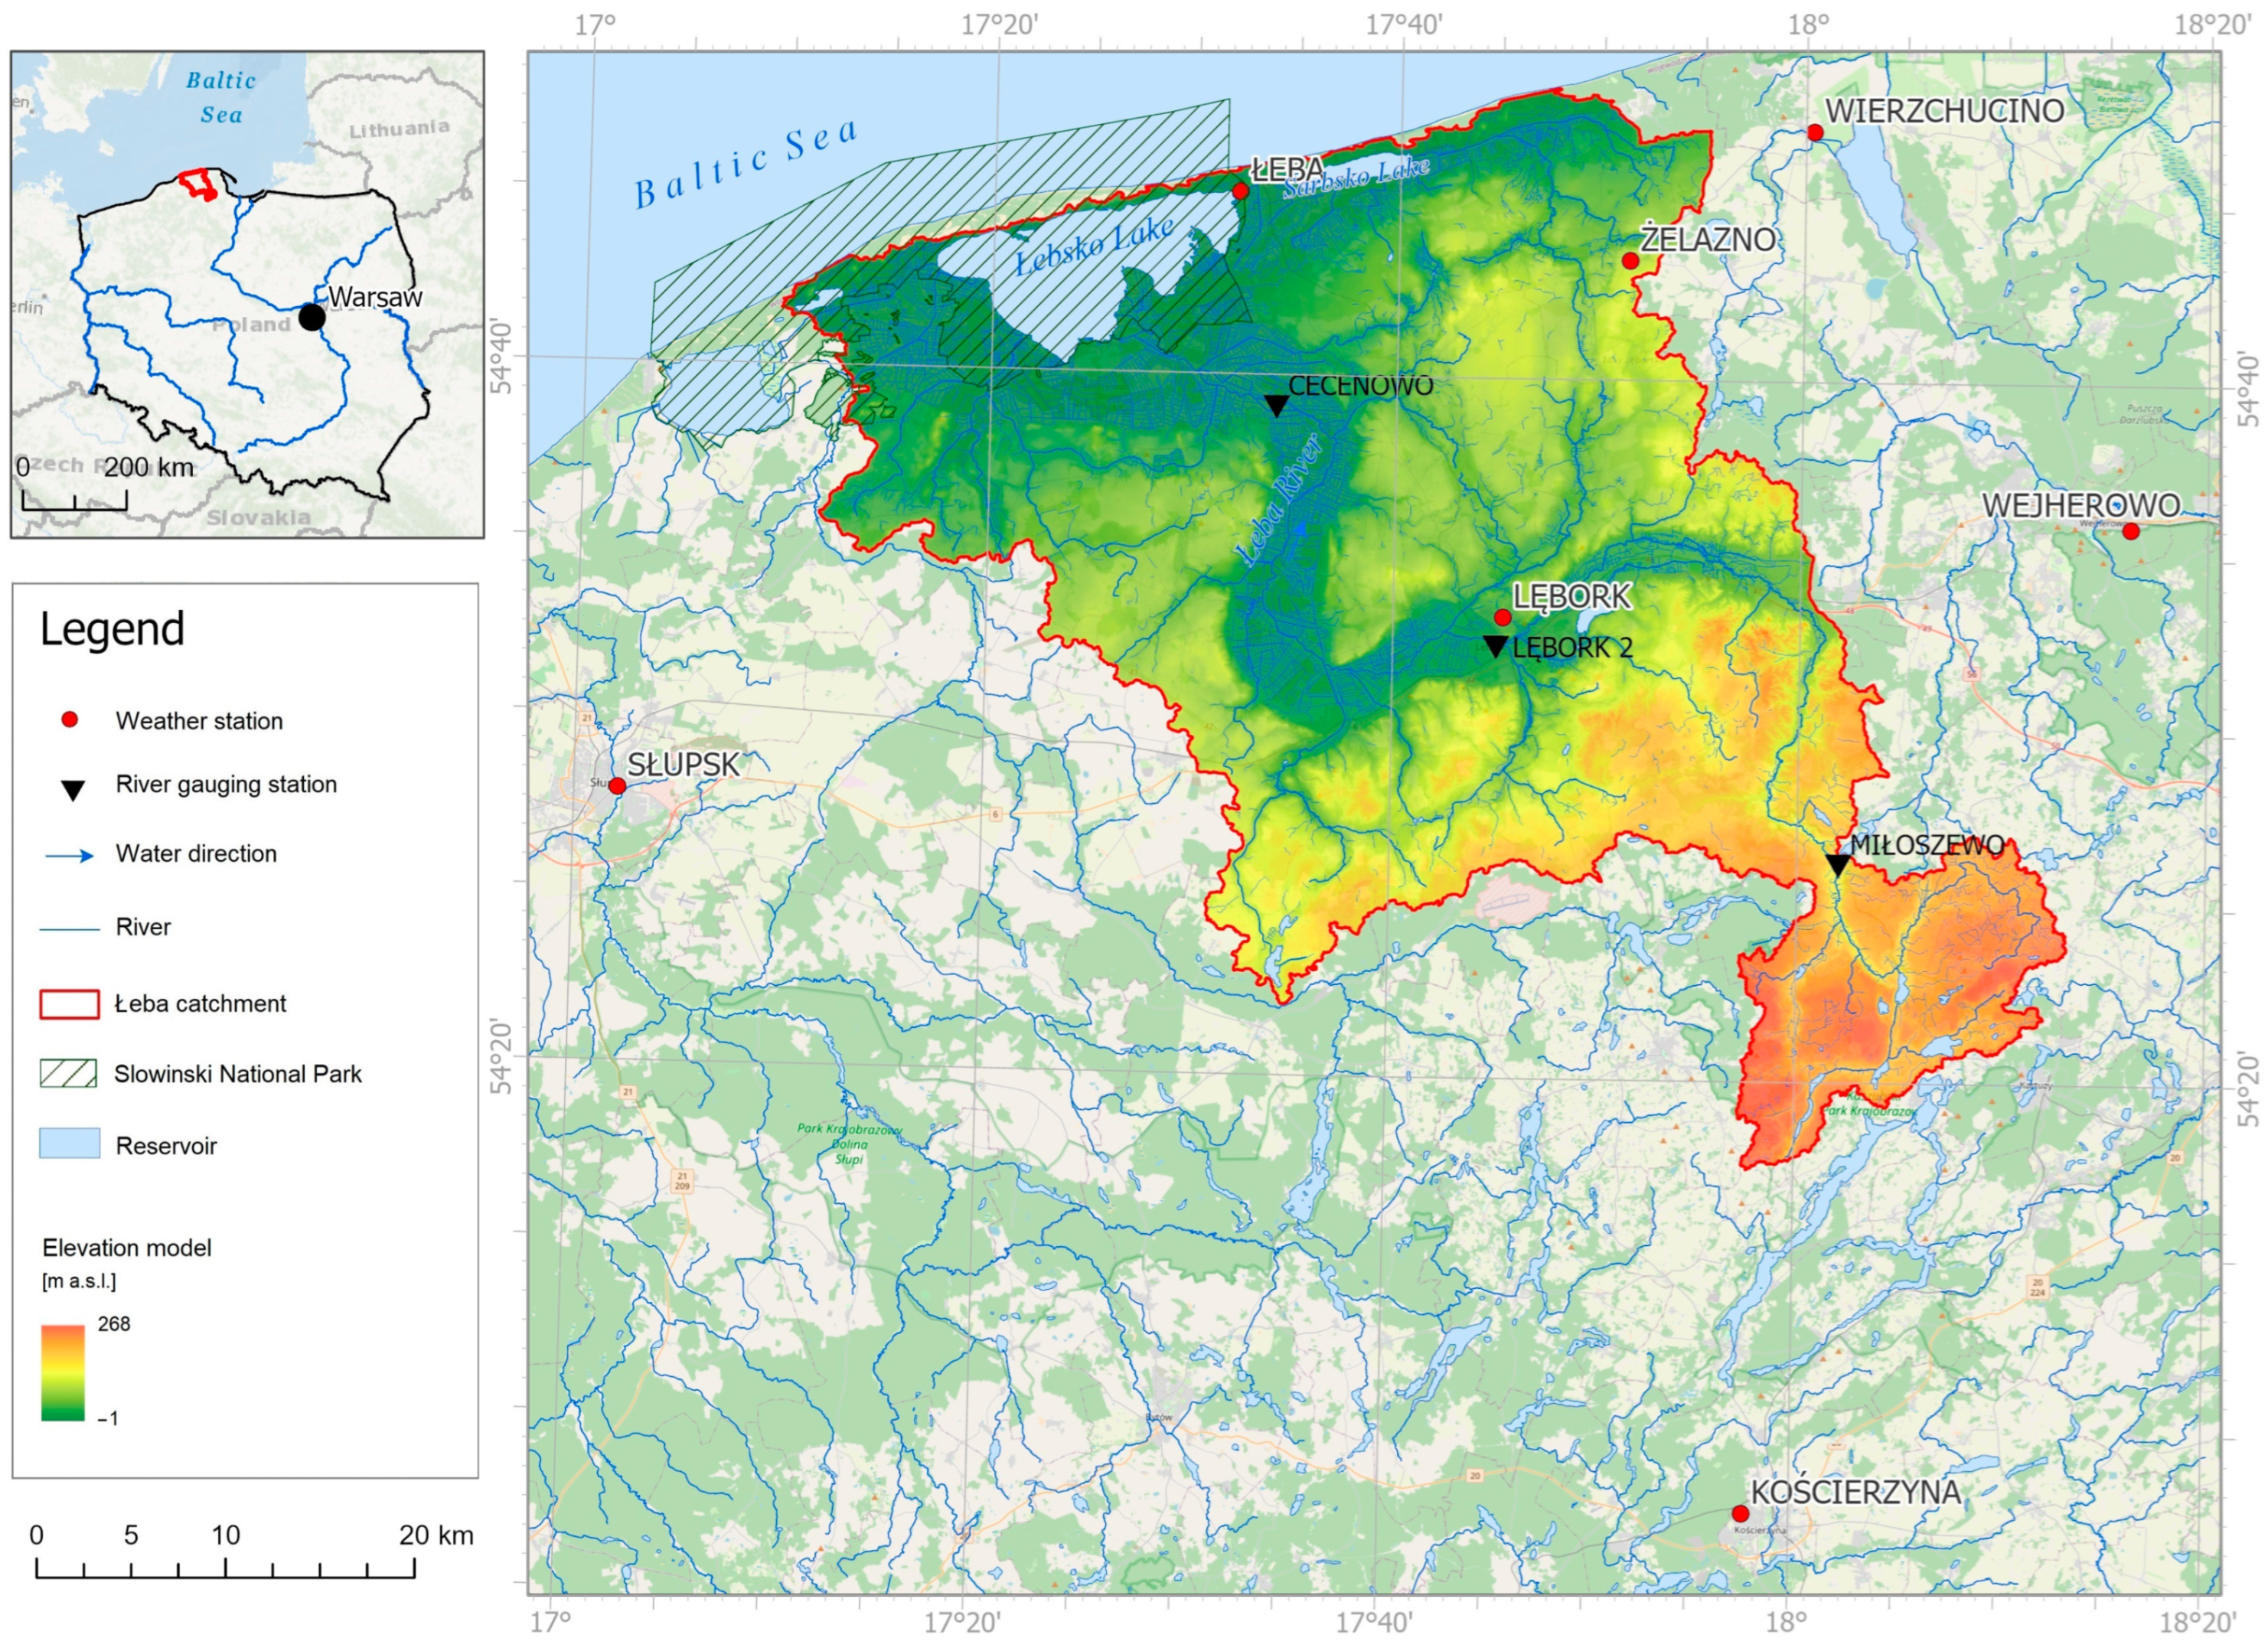
2.1. Study Area
2.2. Data
2.3. Research Methods
3. Results
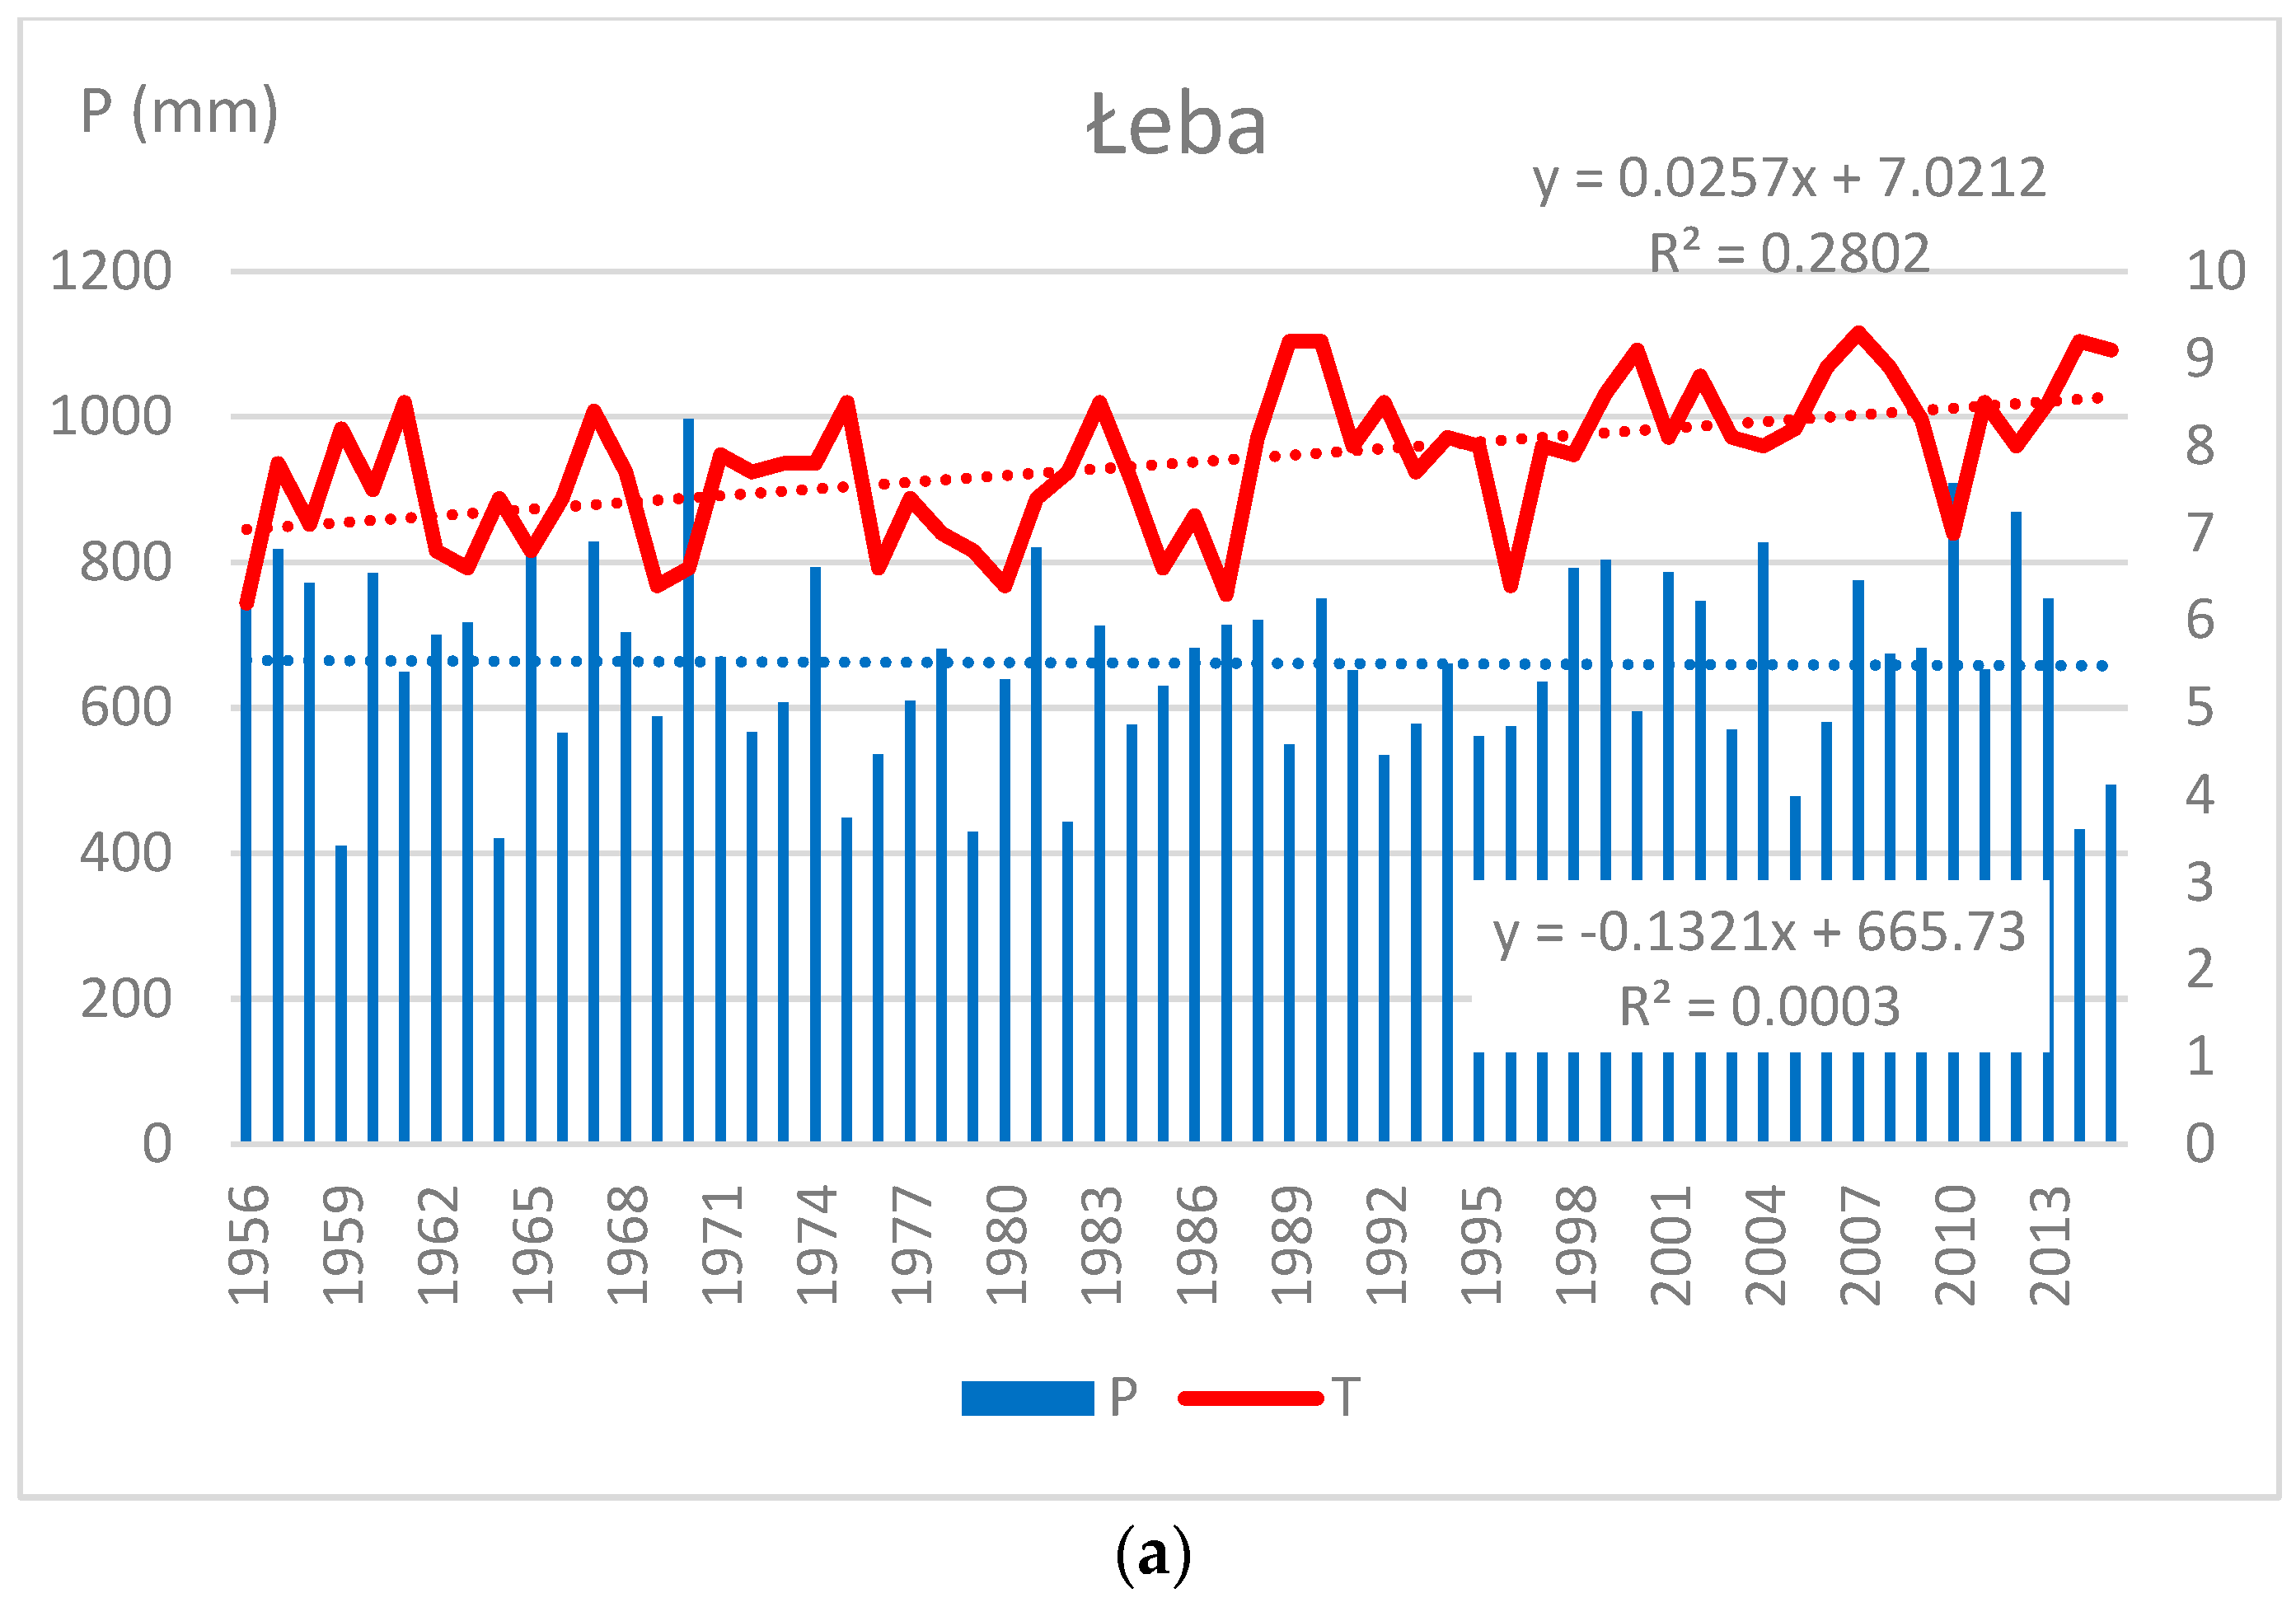
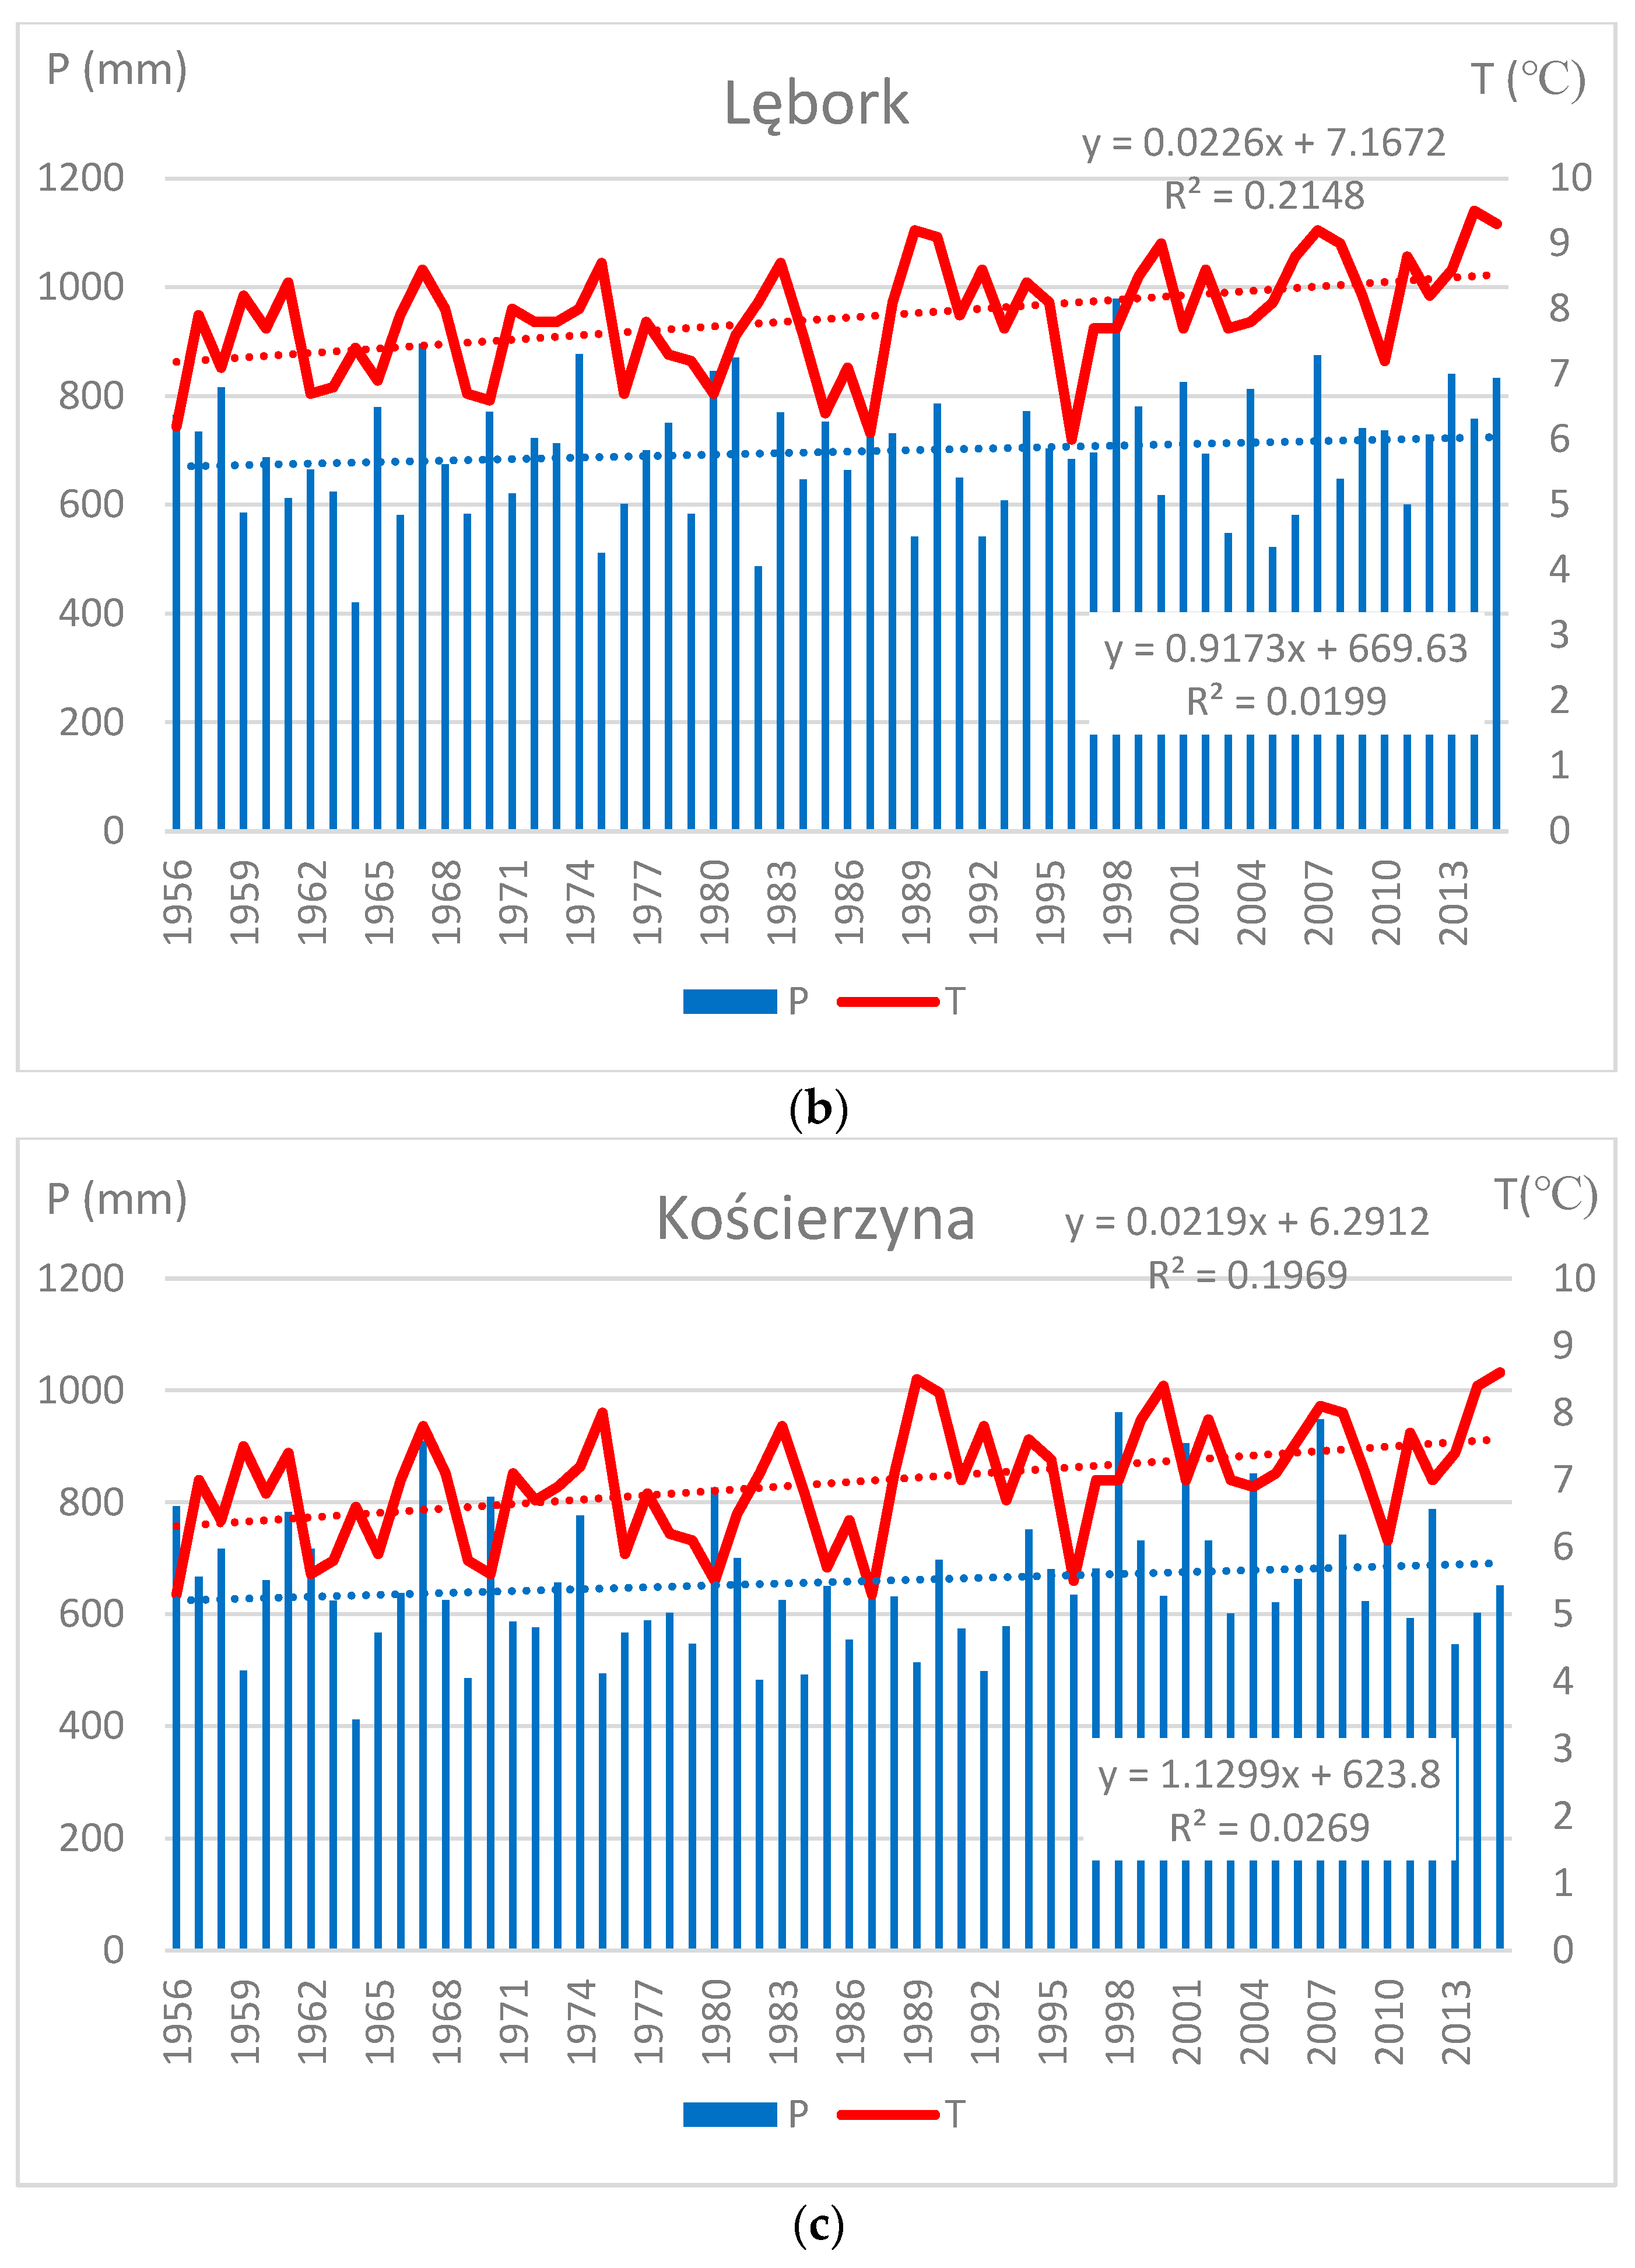
3.1. Precipitation and Air Temperature in the Years 1956–2015
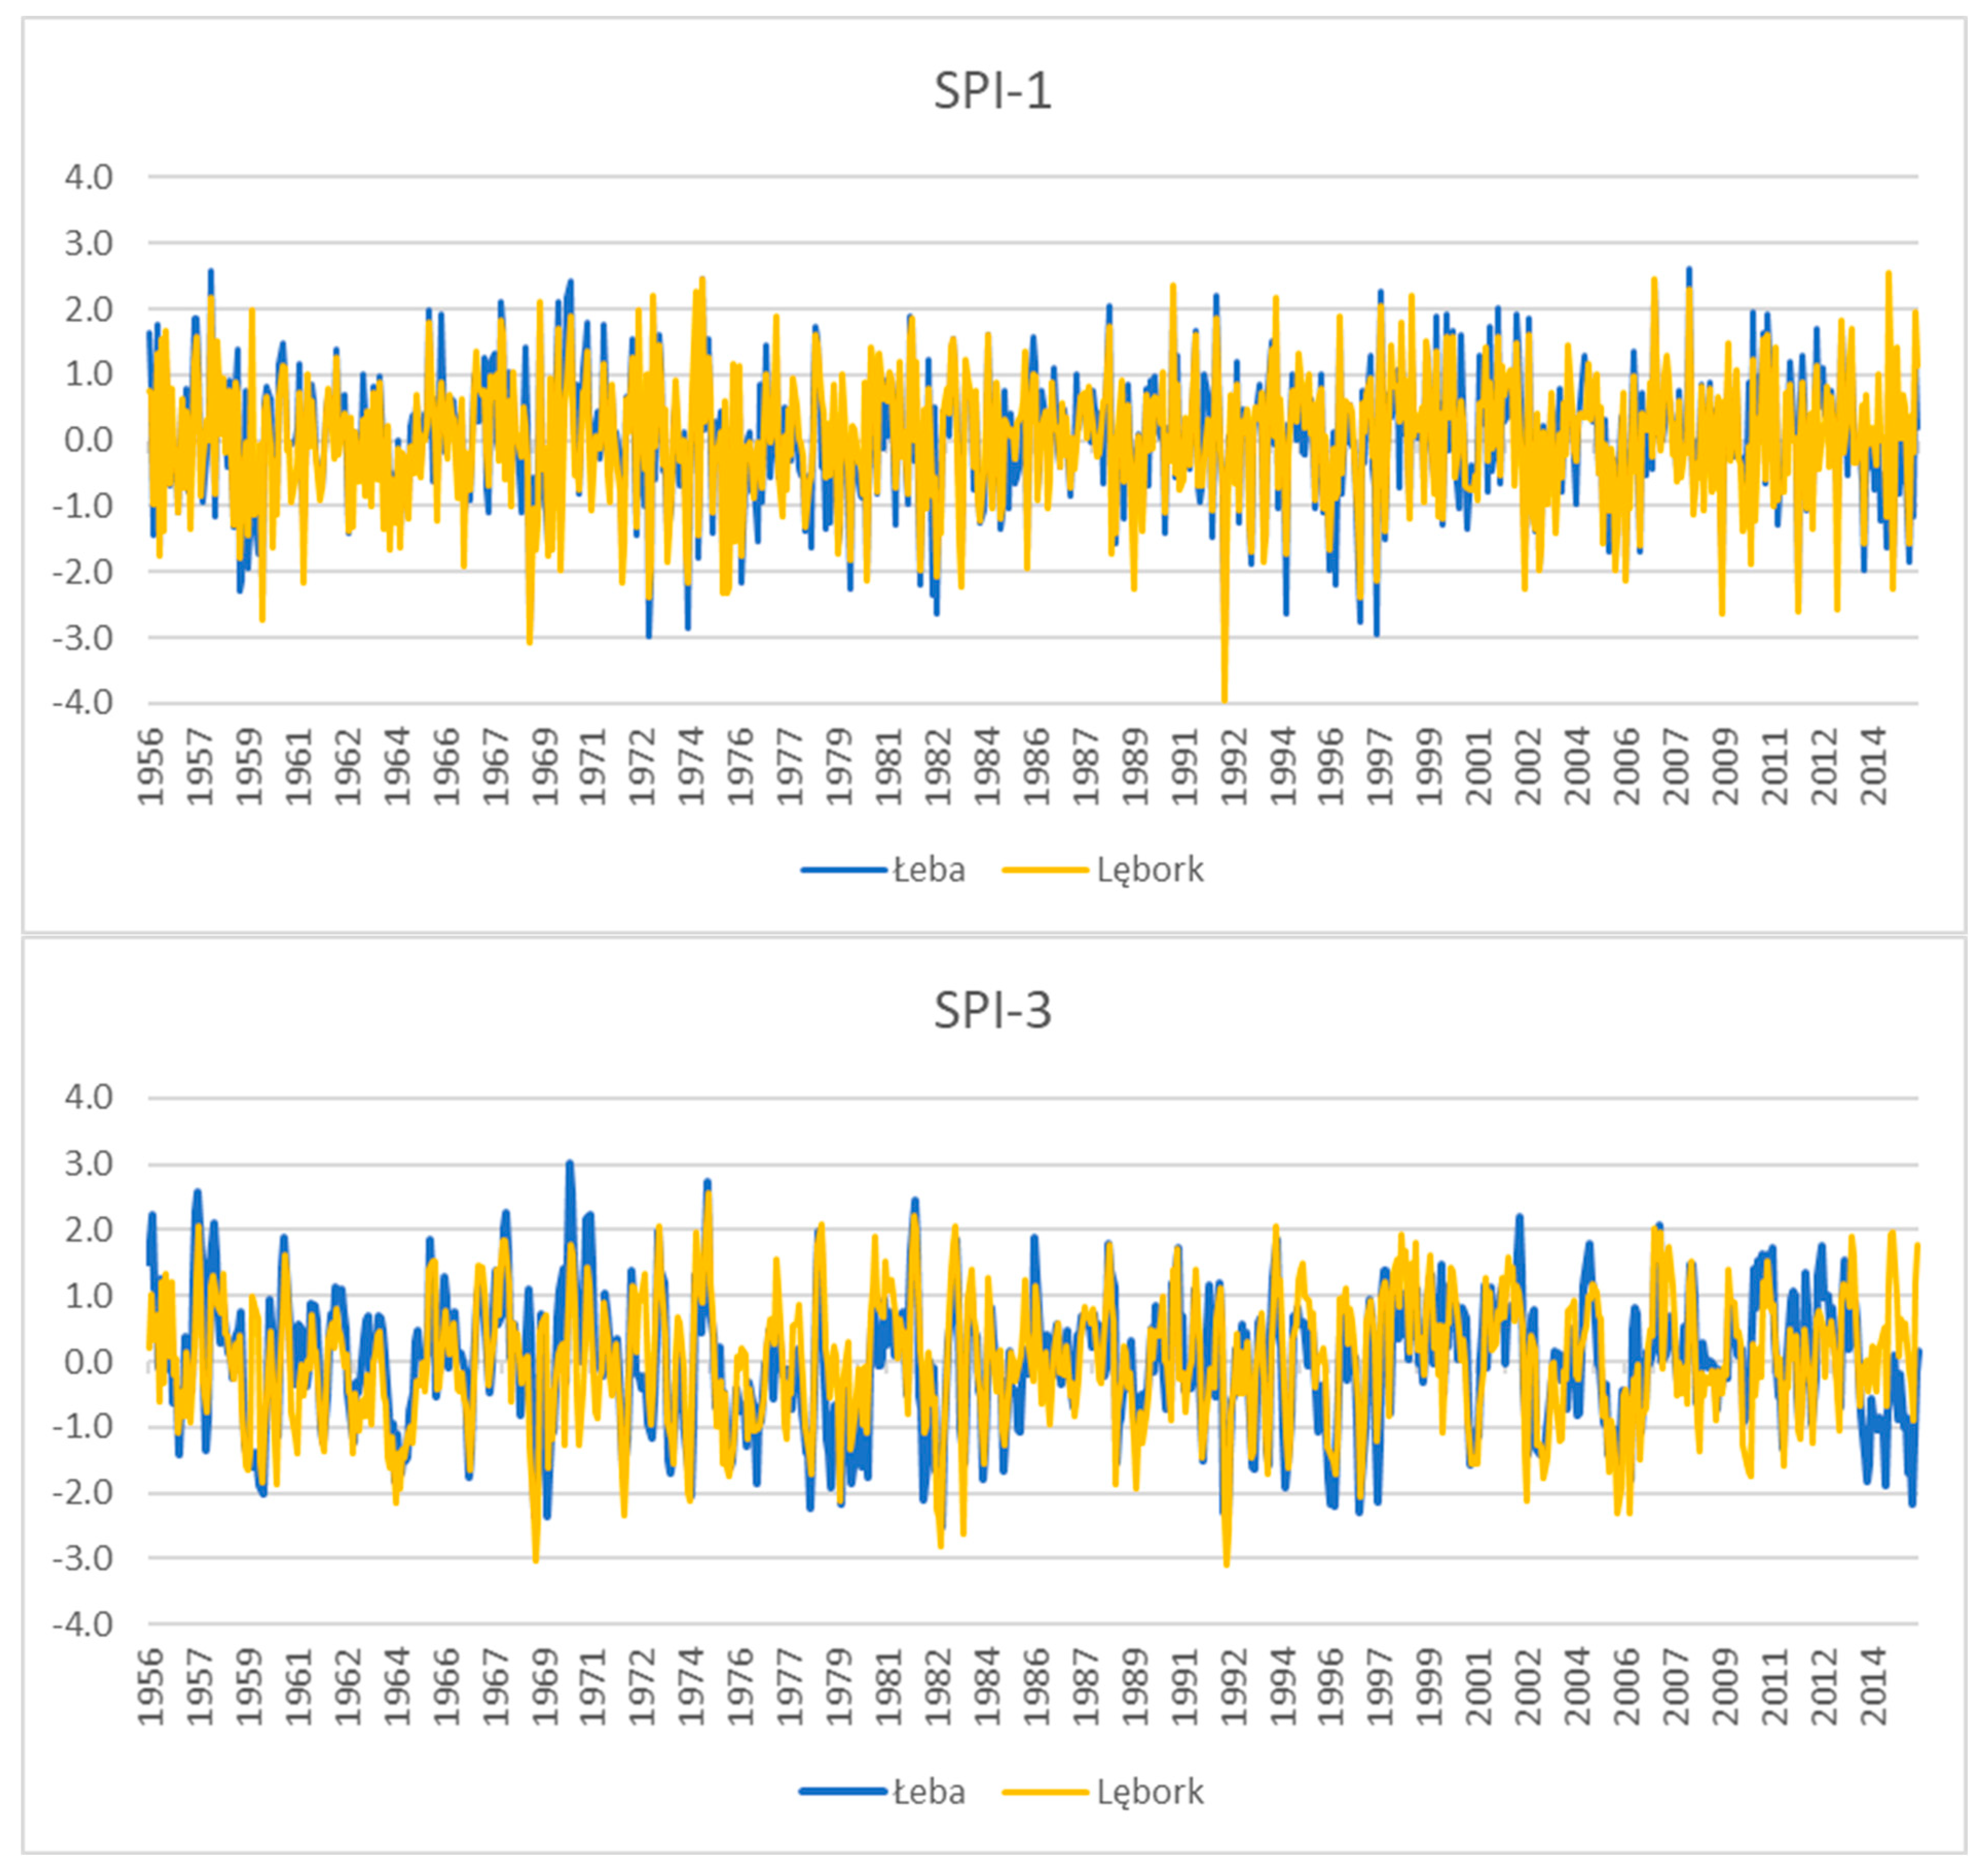
3.2. Meteorological Drought
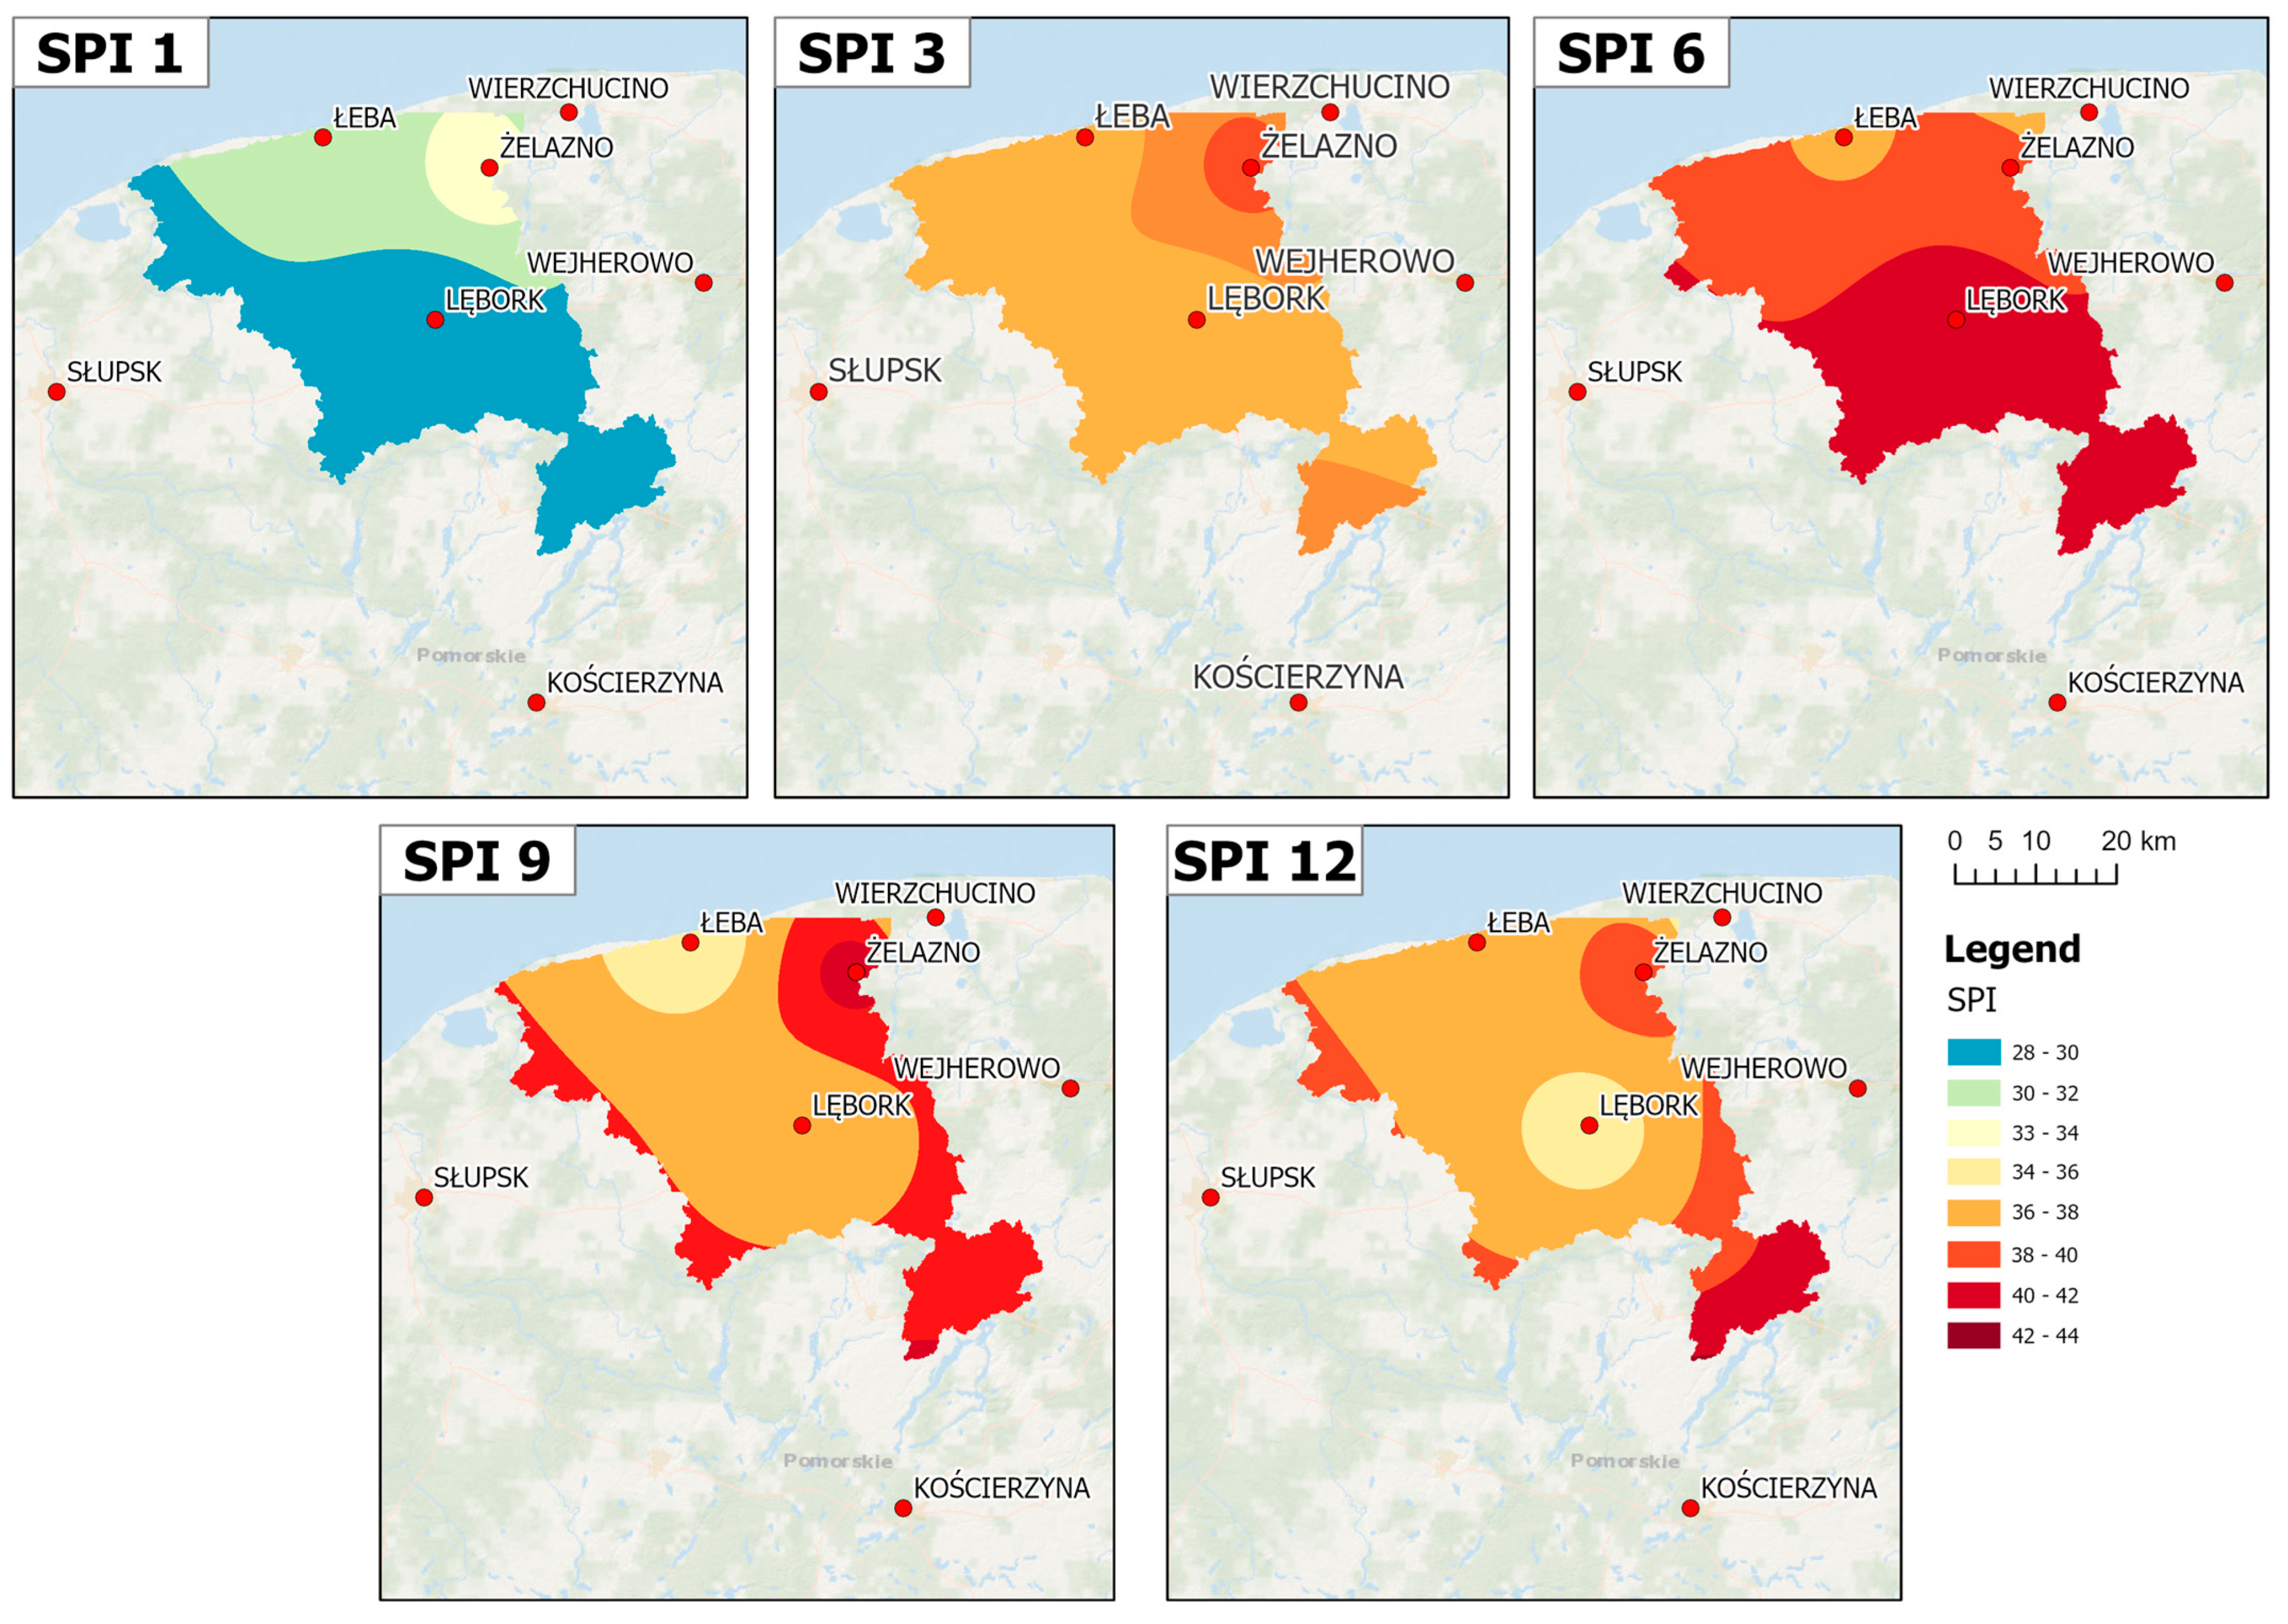
3.3. Types of Droughts and Their Spatial Distribution
3.4. Analysis of Meteorological Drought Trends
3.5. Discussion
4. Conclusions
Supplementary Materials
Author Contributions
Funding
Data Availability Statement
Conflicts of Interest
References
- United Nations Convention to Combat Desertification (UNCCD). Drought Resilience, Adaptation and Management Policy Framework: Supporting Technical Guidelines; Tsegai, D., Ed.; UNCCD: Bonn, Germany, 2019; pp. 1–37. Available online: https://catalogue.unccd.int/1246_UNCCD_drought_resilience_technical_guideline_EN.pdf (accessed on 20 May 2023).
- Douville, H.; Raghavan, K.; Renwick, J.; Allan, R.P.; Arias, P.A.; Barlow, M.; Cerezo-Mota, R.; Cherchi, A.; Gan, T.Y.; Gergis, J.; et al. Water Cycle Changes. In IPCC Climate Change 2021: The Physical Science Basis. Contribution of Working Group I to the Sixth Assessment Report of the Intergovernmental Panel on Climate Change; Masson-Delmotte, V.P., Zhai, A., Pirani, S.L., Connors, C., Péan, S.B., Berger, S., Caud, N., Chen, Y., Goldfarb, L., Gomis, M.I., et al., Eds.; Cambridge University Press: Cambridge, UK; New York, NY, USA, 2021. [Google Scholar] [CrossRef]
- Wilhite, D.A.; Glantz, M.H. Understanding the drought phenomenon: The role of definitions. Water Int. 1985, 10, 111–120. Available online: http://digitalcommons.unl.edu/droughtfacpub?utm_source=digitalcommons.unl.edu%2Fdroughtfacpub%2F20&utm_medium=PDF&utm_campaign=PDFCoverPages (accessed on 15 May 2023). [CrossRef] [Green Version]
- Kubiak-Wójcicka, K.; Juśkiewicz, W. Relationships between meteorological and hydrological drought in a young-glacial zone based on Standardised Precipitation Index (SPI) and Standardised Runoff. Acta Montan. Slovaca 2020, 25, 517–531. [Google Scholar] [CrossRef]
- Isia, I.; Hadibarata, T.; Jusoh, M.N.H.; Bhattacharjya, R.K.; Shahedan, N.F.; Bouaissi, A.; Fitriyani, N.L.; Syafrudin, M. Drought Analysis Based on Standardized Precipitation Evapotranspiration Index and Standardized Precipitation Index in Sarawak, Malaysia. Sustainability 2023, 15, 734. [Google Scholar] [CrossRef]
- Jaagus, J.; Briede, A.E.; Rimkus, E.M.; Sepp, M. Changes in precipitation regime in the Baltic countries in 1966–2015. Theor. Appl. Climatol. 2018, 131, 433–443. [Google Scholar] [CrossRef]
- Pendergrass, A.G.; Meehl, G.A.; Pulwarty, R.; Hobbins, M.; Hoell, A.; AghaKouchak, A.; Bonfils, C.J.W.; Gallant, A.J.E.; Hoerling, M.; Hoffmann, D.; et al. Flash droughts present a new challenge for subseasonal-to-seasonal prediction. Nat. Clim. Chang. 2020, 10, 191–199. [Google Scholar] [CrossRef] [Green Version]
- Seneviratne, S.I.; Zhang, X.; Adnan, M.; Badi, W.; Dereczynski, C.; Di Luca, A.; Ghosh, S.; Iskandar, I.; Kossin, J.; Lewis, S.; et al. Weather and Climate Extreme Events in a Changing Climate. In Climate Change 2021: The Physical Science Basis. Contribution of Working Group I to the Sixth Assessment Report of the Intergovernmental Panel on Climate Change; Masson-Delmotte, V., Zhai, P., Pirani, A., Connors, S.L., Péan, C., Berger, S., Caud, N., Chen, Y., Goldfarb, L., Gomis, M.I., et al., Eds.; Cambridge University Press: Cambridge, UK; New York, NY, USA, 2021; pp. 1513–1766. [Google Scholar] [CrossRef]
- Bachmair, S.; Stahl, K.; Collins, K.; Hannaford, J.; Acreman, M.; Svoboda, M.; Knutson, C.; Smith, K.H.; Wall, N.; Fuchs, B.; et al. Drought indicators revisited: The need for a wider consideration of environment and society. Wiley Interdiscip. Rev. Water 2016, 3, 516–536. [Google Scholar] [CrossRef] [Green Version]
- Olsen, J.R.; Dettinger, M.D.; Giovannetton, J.P. Drought Attribution Studies and Water Resources Management. Bull. Am. Meteorol. Soc. 2023, 104, E435–E441. [Google Scholar] [CrossRef]
- Łabędzki, L. Estimation of local drought frequency in Central Poland using the Standardized Precipitation Index SPI. Irrig. Drain. 2007, 56, 67–77. [Google Scholar] [CrossRef]
- Caloiero, T.; Coscarelli, R.; Ferrari, E.; Sirangelo, B. Analysis of Dry Spells in Southern Italy (Calabria). Water 2015, 7, 3009–3023. [Google Scholar] [CrossRef]
- McKee, T.B.; Doesken, N.J.; Kleist, J. The relationship of drought frequency and duration to time scale. In Proceedings of the 8th Conference on Applied Climatology, Anaheim, CA, USA, 17–22 January 1993; pp. 179–184. Available online: https://www.droughtmanagement.info/literature/AMS_Relationship_Drought_Frequency_Duration_Time_Scales_1993.pdf (accessed on 16 May 2023).
- McKee, T.B.; Doesken, N.J.; Kleist, J. Drought monitoring with multiple time scales. In Proceedings of the 9th Conference of Applied Climatology, Dallas, TX, USA, 15–20 January 1995; pp. 233–236. [Google Scholar]
- Tokarczyk, T. Wskaźniki oceny suszy stosowane w Polsce i na świecie (Widly applied indices for drought assessment and Polish application, in Polish). Infrastrukt. I Ekol. Teren. Wiej. 2008, 7, 167–182. Available online: http://agro.icm.edu.pl/agro/element/bwmeta1.element.agro-022a7dd5-95bc-4472-aaa8-9cfc9148ac0b?q=bwmeta1.element.agro-ab1b192f-42cc-4726-ab2b-5c14eb44426a;20&qt=CHILDREN-STATELESS (accessed on 15 May 2023).
- World Meteorological Organization (WMO). Standardized Precipitation Index, User Guide, WMO No 1090, Geneva, Switzerland 2012. Available online: https://library.wmo.int/doc_num.php?explnum_id=7768 (accessed on 16 May 2023).
- World Meteorological Organization (WMO); Global Water Partnership (GWP). Handbook of Drought Indicators and Indices; Svoboda, M., Fuchs, B.A., Eds.; Integrated Drought Management Programme (IDMP), Integrated Drought Management Tools and Guidelines Series 2; World Meteorological Organization: Geneva, Switzerland, 2016; Available online: https://www.droughtmanagement.info/literature/GWP_Handbook_of_Drought_Indicators_and_Indices_2016.pdf (accessed on 15 May 2023).
- Chong, K.L.; Huang, Y.F.; Koo, C.H.; Ahmed, A.N.; El-Shafie, A. Spatiotemporal variability analysis of standardized precipitation indexed droughts using wavelet transform. J. Hydrol. 2022, 605, 127299. [Google Scholar] [CrossRef]
- Huang, Y.F.; Ahmed, A.N.; Ng, J.L.; Tan, K.W.; Kumar, P.; El-Shafie, A. Rainfall Variability Index (RVI) analysis of dry spells in Malaysia. Nat. Hazards 2022, 112, 1423–1475. [Google Scholar] [CrossRef]
- European Drought Observatory (EDO). Available online: https://edo.jrc.ec.europa.eu/edov2/php/index.php?id=1010 (accessed on 20 May 2023).
- National Drought Mitigation Center (NDMC). Available online: https://drought.unl.edu/monitoring/SPI.aspx (accessed on 20 May 2023).
- Northern Australia Climate Program (NACP). Available online: https://www.nacp.org.au/static/pdf/Drought%20Monitor%20Documentation.pdf (accessed on 20 May 2023).
- Spinoni, J.; Naumann, G.; Carrao, H.; Barbosa, P.; Vogt, J. World drought frequency, duration, and severity for 1951–2010. Int. J. Climatol. 2014, 34, 2792–2804. [Google Scholar] [CrossRef] [Green Version]
- Spinoni, J.; Barbosa, P.; De Jager, A.; McCormick, N.; Naumann, G.; Vogt, J.V.; Magni, D.; Masante, D.; Mazzeschi, M. A new global database of meteorological drought events from 1951 to 2016. J. Hydrol. Reg. Stud. 2019, 22, 100593. [Google Scholar] [CrossRef] [PubMed]
- Nouri, M.; Homaee, M. Drought trend, frequency and extremity across a wide range of climates over Iran. Meteorol. Appl. 2020, 2, e1899. [Google Scholar] [CrossRef]
- Haile, G.G.; Tang, Q.; Hosseini-Moghari, S.; Liu, X.; Gebremicael, T.G.; Leng, G.; Kebede, A.; Xu, X.; Yun, X. Projected impacts of climate change on drought patterns over East Africa. Earth’s Future 2020, 8, e2020EF001502. [Google Scholar] [CrossRef]
- Elouissi, A.; Benzater, B.; Dabanli, I.; Habi, M.; Harizia, A.; Hamimed, A. Drought investigation and trend assessment in Macta watershed (Algeria) by SPI and ITA methodology. Arab. J. Geosci. 2021, 14, 1329. [Google Scholar] [CrossRef]
- Dabar, O.A.; Adan, A.-B.I.; Ahmed, M.M.; Awaleh, M.O.; Waberi, M.M.; Camberlin, P.; Pohl, B.; Mohamed, J. Evolution and Trends of Meteorological Drought and Wet Events over the Republic of Djibouti from 1961 to 2021. Climate 2022, 10, 148. [Google Scholar] [CrossRef]
- Yu, X.; He, X.; Zheng, H.; Guo, R.; Ren, Z.; Zhang, D.; Lin, J. Spatial and temporal analysis of drought risk during the crop-growing season over northeast China. Nat. Hazards 2013, 71, 275–289. [Google Scholar] [CrossRef]
- Xu, C.; McDowell, N.G.; Fisher, R.A.; Wei, L.; Sevanto, S.; Christoffersen, B.O.; Weng, E.; Middleton, R.S. Increasing impacts of extreme droughts on vegetation productivity under climate change. Nat. Clim. Chang. 2019, 9, 948–953. [Google Scholar] [CrossRef] [Green Version]
- Xu, Y.; Zhang, X.; Wang, X.; Hao, Z.; Singh, V.P.; Hao, F. Propagation from meteorological drought to hydrological drought under the impact of human activities: A case study in northern China. J. Hydrol. 2019, 579, 124147. [Google Scholar] [CrossRef]
- Wang, Q.; Zhang, R.; Qi, J.; Zeng, J.; Wu, J.; Shui, W.; Wu, X.; Li, J. An improved daily standardized precipitation index dataset for mainland China from 1961 to 2018. Sci. Data 2022, 9, 124. [Google Scholar] [CrossRef] [PubMed]
- Kamruzzaman, M.; Almazroui, M.; Salam, M.A.; Mondol, A.H.; Rahman, M.; Deb, L.; Kundu, P.K.; Zaman, A.U.; Islam, A.R.M.T. Spatiotemporal drought analysis in Bangladesh using the standardized precipitation index (SPI) and standardized precipitation evapotranspiration index (SPEI). Sci. Rep. 2022, 12, 20694. [Google Scholar] [CrossRef]
- Moazzam, M.F.U.; Rahman, G.; Munawar, S.; Farid, N.; Lee, B.G. Spatiotemporal Rainfall Variability and Drought Assessment during Past Five Decades in South Korea Using SPI and SPEI. Atmosphere 2022, 13, 292. [Google Scholar] [CrossRef]
- Spinoni, J.; Naumann, G.; Vogt, J.; Barbosa, P. European drought climatologies and trends based on a multi-indicator approach. Glob. Planet. Chang. 2015, 127, 50–57. [Google Scholar] [CrossRef]
- Spinoni, J.; Naumann, G.; Vogt, J.V.; Barbosa, P. The biggest drought events in Europe from 1950 to 2012. J. Hydrol. Reg. Stud. 2015, 3, 509–524. [Google Scholar] [CrossRef]
- Cammalleri, C.; Spinoni, J.; Barbosa, P.; Toreti, A.; Vogt, J.V. The effects of non-stationarity on SPI for operational drought monitoring in Europe. Int. J. Clim. 2021, 42, 3418–3430. [Google Scholar] [CrossRef]
- Jaagus, J.; Aasa, A.; Aniskevich, S.; Boincean, B.; Bojariu, R.; Briede, A.; Danilovich, I.; Castro, F.D.; Dumitrescu, A.; Labuda, M.; et al. Long-term changes in drought indices in eastern and central Europe. Int. J. Clim. 2021, 42, 225–249. [Google Scholar] [CrossRef]
- Spinoni, J.; Antofie, T.; Barbosa, P.; Bihari, Z.; Lakatos, M.; Szalai, S.; Szentimrey, T.; Vogt, J. An overview of drought events in the Carpathian Region in 1961–2010. Adv. Sci. Res. 2013, 10, 21–32. [Google Scholar] [CrossRef] [Green Version]
- Brázdil, R.; Trnka, M.; Mikšovský, J.; Řezníčková, L.; Dobrovolný, P. Spring-summer droughts in the Czech Land in 1805–2012 and their forcings. Int. J. Clim. 2014, 35, 1405–1421. [Google Scholar] [CrossRef]
- Touma, D.; Ashfaq, M.; Nayak, M.A.; Kao, S.-C.; Diffenbaugh, N.S. A multi-model and multi-index evaluation of drought characteristics in the 21st century. J. Hydrol. 2015, 526, 196–207. [Google Scholar] [CrossRef]
- Spinoni, J.; Vogt, J.V.; Naumann, G.; Barbosa, P.; Dosio, A. Will drought events become more frequent and severe in Europe? Int. J. Climatol. 2018, 38, 1718–1736. [Google Scholar] [CrossRef] [Green Version]
- Spinoni, J.; Barbosa, P.; Bucchignani, E.; Cassano, J.; Cavazos, T.; Christensen, J.H.; Christensen, O.B.; Coppola, E.; Evans, J.; Geyer, B.; et al. Future Global Meteorological Drought Hot Spots: A Study Based on CORDEX Data. J. Clim. 2020, 33, 3635–3661. [Google Scholar] [CrossRef]
- Łabędzki, L. Ocena zagrożenia suszą w regionie bydgosko-kujawskim przy użyciu wskaźnika standaryzowanego opadu (SPI) (Assessment of drought hazard in the Bydgoszcz-and Kujawy region using the standardized precipitation index (SPI), in Polish). Wiadomości Melior. I Łąkarskie 2000, 43, 102–103. [Google Scholar]
- Bąk, B.; Łabędzki, L. Assessing drought severity with the relative precipitation index (RPI) and the standardised precipitation index (SPI). J. Water Land Dev. 2002, 6, 89–105. Available online: http://www.nawadnianie.inhort.pl/add/article/303.pdf (accessed on 16 May 2023).
- Kubiak-Wójcicka, K. Dynamics of meteorological and hydrological droughts in the agricultural catchments. Res. Rural. Dev. Water Manag. 2019, 1, 111–117. [Google Scholar] [CrossRef]
- Tokarczyk, T.; Szalińska, W.; Otop, I. Ocena Zagrożenia Suszą w Polsce i Prognoza jej Rozwoju (Assessment of Drought Hazard in Poland and Its Forecast, in Polish); Lorenc, H., Ed.; Klęski żywiołowe a bezpieczeństwo wewnętrzne kraju, IMGW PIB: Warszawa, Poland, 2012; Series: Monografie; pp. 151–175. [Google Scholar]
- Radzka, E. The Assessment of atmospheric drought during vegetation season (according to standardized precipitation index SPI) in central-eastern Poland. J. Ecol. Eng. 2015, 16, 87–91. [Google Scholar] [CrossRef] [Green Version]
- Kubiak-Wójcicka, K.; Bąk, B. Monitoring of meteorological and hydrological droughts in the Vistula basin (Poland). Environ. Monit Assess 2018, 190, 691. [Google Scholar] [CrossRef] [PubMed] [Green Version]
- Bokwa, A.; Klimek, M.; Krzaklewski, P.; Kukułka, W. Drought Trends in the Polish Carpathian Mts. in the Years 1991–2020. Atmosphere 2021, 12, 1259. [Google Scholar] [CrossRef]
- Karamuz, E.; Bogdanowicz, E.; Senbeta, T.B.; Napiórkowski, J.J.; Romanowicz, R.J. Is It a Drought or Only a Fluctuation in Precipitation Patterns?—Drought Reconnaissance in Poland. Water 2021, 13, 807. [Google Scholar] [CrossRef]
- Kalbarczyk, R.; Kalbarczyk, E. Research into Meteorological Drought in Poland during the Growing Season from 1951 to 2020 Using the Standardized Precipitation Index. Agronomy 2022, 12, 35. [Google Scholar] [CrossRef]
- Araźny, A.; Bartczak, A.; Maszewski, R.; Krzemiński, M. The influence of atmospheric circulation on the occurrence of dry and wet periods in Central Poland in 1954–2018. Theor. Appl. Clim 2021, 146, 1079–1095. [Google Scholar] [CrossRef]
- Osuch, M.; Romanowicz, R.J.; Lawrence, D.; Wong, W.K. Trends in projections of standardized precipitation indices in a future climate in Poland. Hydrol. Earth Syst. Sci. 2016, 20, 1947–1969. [Google Scholar] [CrossRef] [Green Version]
- Meresa, H.K.; Osuch, M.; Romanowicz, R. Hydro-Meteorological Drought Projections into the 21st Century for Selected Polish Catchments. Water 2016, 8, 206. [Google Scholar] [CrossRef] [Green Version]
- Łabędzki, L.; Bąk, B. Impact of meteorological drought on crop water deficit and crop yield reduction in Polish agriculture. J. Water Land Dev. Sect. Land Reclam. Environ. Eng. Agric. 2017, 34, 181–190. [Google Scholar] [CrossRef]
- Kuśmierek-Tomaszewska, R.; Żarski, J. Assessment of Meteorological and Agricultural Drought Occurrence in Central Poland in 1961–2020 as an Element of the Climatic Risk to Crop Production. Agriculture 2021, 11, 855. [Google Scholar] [CrossRef]
- Przybylak, R.; Oliński, P.; Koprowski, M.; Filipiak, J.; Pospieszyńska, A.; Chorążyczewski, W.; Puchałka, R.; Dąbrowski, H.P. Droughts in the area of Poland in recent centuries in the light of multi-proxy data. Clim. Past 2020, 16, 627–661. [Google Scholar] [CrossRef] [Green Version]
- Kubiak-Wójcicka, K.; Pilarska, A.; Kamiński, D. The Analysis of Long-Term Trends in the Meteorological and Hydrological Drought Occurrences Using Non-Parametric Methods—Case Study of the Catchment of the Upper Noteć River (Central Poland). Atmosphere 2021, 12, 1098. [Google Scholar] [CrossRef]
- Młyński, D.; Wałęga, A.; Kuriqi, A. Influence of meteorological drought on environmental flows in mountain catchments. Ecol. Indic. 2021, 133, 108460. [Google Scholar] [CrossRef]
- Otop, I.; Adynkiewicz-Piragas, M.; Zdralewicz, I.; Lejcuś, I.; Miszuk, B. The Drought of 2018–2019 in the Lusatian Neisse River Catchment in Relation to the Multiannual Conditions. Water 2023, 15, 1647. [Google Scholar] [CrossRef]
- Mapa Podziału Hydrograficznego Polski (MPHP). 2021, Poland’s Data Portal. Available online: https://dane.gov.pl/pl/dataset/2167,mapa-podzialu-hydrograficznego-polski-w-skali-110 (accessed on 15 May 2023).
- Rotnicka, J. Reżim wodny rzeki przymorskiej na przykładzie Łeby (The Water Regime of a Coastal River Examplified by the Łeba River, in Polish). Badania Fizjograficzne nad Polska Zachodnią 1980, XXXIII, 101–116. [Google Scholar]
- Wrzesiński, D.; Brychczyński, A. Zróżnicowanie reżimu odpływu rzek w północno-zachodniej Polsce. Badania Fizjogr. Geogr. Fiz. R. V Ser. A 2015, 65, 261–274. Available online: https://hdl.handle.net/10593/23610 (accessed on 10 May 2023).
- Łabędzki, L.; Bąk, B. Standaryzowany klimatyczny bilans wodny jako wskaźnik suszy (Standardized climatic water balance as drought index, in Polish). Acta Agroph. 2004, 3, 117–124. [Google Scholar]
- Guttman, N.B. Accepting the Standardized Precipitation Index: A calculation algorithm. J. Am. Water Resour. Assoc. 1999, 35, 311–322. [Google Scholar] [CrossRef]
- Wang, W.; Wang, J.; Romanowicz, R. Uncertainty in SPI Calculation and Its Impact on Drought Assessment in Different Climate Regions over China. J. Hydrometeorol. 2021, 22, 1369–1383. [Google Scholar] [CrossRef]
- Gąsiorek, E.; Grządziel, M.; Musiał, E.; Rojek, M. Porównanie wskaźnika standaryzowanego opadu (SPI) wyznaczonego za pomocą rozkładu gamma i rozkładu normalnego dla miesięcznych sum opadów (The comparison of standardized precipitation index (SPI) evaluated by gamma and normal distribution for monthly precipitation sums., in Polish). Infrastrukt. I Ekol. Teren. Wiej. (Infrastruct. Ecol. Rural. Areas) 2012, 3, 197–208. Available online: http://agro.icm.edu.pl/agro/element/bwmeta1.element.agro-1bb64e74-d5fc-4e45-9d41-cf41163a3853/c/17.pdf (accessed on 16 May 2023).
- Bąk, B.; Kubiak-Wójcicka, K. Impact of meteorological drought on hydrological drought in Toruń (central Poland) in the period of 1971–2015. J. Water Land Dev. 2017, 32, 3–12. [Google Scholar] [CrossRef] [Green Version]
- Gocic, M.; Trajkovic, S. Analysis of trends in reference evapotranspiration data in a humid climate. Hydrol. Sci. J. 2014, 59, 165–180. [Google Scholar] [CrossRef]
- Lin, H.; Wang, J.; Li, F.; Xie, Y.; Jiang, C.; Sun, L. Drought Trends and the Extreme Drought Frequency and Characteristics under Climate Change Based on SPI and HI in the Upper and Middle Reaches of the Huai River Basin, China. Water 2020, 12, 1100. [Google Scholar] [CrossRef] [Green Version]
- Liu, C.; Yang, C.; Yang, Q.; Wang, J. Spatiotemporal drought analysis by the standardized precipitation index (SPI) and standardized precipitation evapotranspiration index (SPEI) in Sichuan Province, China. Sci. Rep. 2021, 11, 1280. [Google Scholar] [CrossRef]
- Tomasella, J.; Cunha, A.P.M.A.; Simões, P.A.; Zeri, M. Assessment of trends, variability and impacts of droughts across Brazil over the period 1980–2019. Nat. Hazards 2023, 116, 2173–2190. [Google Scholar] [CrossRef] [PubMed]
- Kubiak-Wójcicka, K.; Nagy, P.; Pilarska, A.; Zeleňáková, M. Trend Analysis of Selected Hydroclimatic Variables for the Hornad Catchment (Slovakia). Water 2023, 15, 471. [Google Scholar] [CrossRef]
- IPCC, Möller, V.; van Diemen, R.; Matthews, J.B.R.; Méndez, C.; Semenov, S.; Fuglestvedt, J.S.; Reisinger, A. Climate Change 2022: Impacts, Adaptation and Vulnerability. Contribution of Working Group II tothe Sixth Assessment Report of the Intergovernmental Panel on Climate Change; Pörtner, H.-O., Roberts, D.C., Tignor, M., Poloczanska, E.S., Mintenbeck, K., Alegria, A., Craig, M., Langsdorf, S., Löschke, S., Möller, S., et al., Eds.; Cambridge University Press: Cambridge, UK; New York, NY, USA, 2022. [CrossRef]
- Łupikasza, E.; Małarzewski, Ł. Precipitation Change. In Climate Change in Poland; Falarz, M., Ed.; Springer: Cham, Switzerland, 2021. [Google Scholar] [CrossRef]
- Trnka, M.; Balek, J.; Štěpánek, P.; Zahradníček, P.; Možný, M.; Eitzinger, J.; Žalud, Z.; Formayer, H.; Turňa, M.; Nejedlík, P.; et al. Drought trends over part of Central Europe between 1961 and 2014. Clim. Res. 2016, 70, 143–160. [Google Scholar] [CrossRef] [Green Version]
- Owczarek, M.; Filipiak, J. Contemporary changes of thermal conditions in Poland, 1951–2015. Bull. Geogr. Phys Geogr. Ser. 2016, 10, 31–50. [Google Scholar] [CrossRef] [Green Version]
- Kubiak-Wójcicka, K.; Jamorska, I. An analysis of groundwater drought in combination with meteorological droughts. Case study of the Gwda River catchment (northern Poland). Acta Montan. Slovaca 2022, 27, 667–684. [Google Scholar] [CrossRef]
- Laaha, G.; Gauster, T.; Tallaksen, L.M.; Vidal, J.-P.; Stahl, K.; Prudhomme, C.; Heudorfer, B.; Vlnas, R.; Ionita, M.; Van Lanen, H.A.J.; et al. The European 2015 drought from a hydrological perspective. Hydrol. Earth Syst. Sci. 2017, 21, 3001–3024. [Google Scholar] [CrossRef] [Green Version]
- Hanel, M.; Rakovec, O.; Markonis, Y.; Máca, P.; Samaniego, L.; Kyselý, J.; Kumar, R. Revisiting the recent European droughts from a long-term perspective. Sci. Rep. 2018, 8, 9499. [Google Scholar] [CrossRef] [Green Version]
- Ewert, A. O obliczaniu kontynentalizmu termicznego klimatu (On calculations of thermic continentality of the climate, in Polish). Przegl. Geograf. 1972, 44, 273–288. Available online: https://rcin.org.pl/dlibra/publication/16349/edition/14231/content (accessed on 15 May 2023).
- Kwiecień, K. Warunki klimatyczne Południowego Bałtyku (The Climate of the Southern Baltic, in Polish). In Bałtyk Południowy; Augustowski, B., Ed.; Gdańskie Towarzystwo Naukowe: Ossolineum, Poland, 1987. [Google Scholar]
- Styszyńska, A.; Krośnicka, K.; Marsz, A. Współczesne zmiany klimatyczne i ich wpływ na funkcjonowanie systemów miejskich (na przykładzie miast strefy nadmorskiej Polski) [Contemporary climate changes and their impact on functioning of urban systems] (on the example of Polish Coastal Zone, in Polish). Stud. Kom. Przestrz. Zagospod. Kraj. PAN 2018, 187, 51–80. Available online: https://cejsh.icm.edu.pl/cejsh/element/bwmeta1.element.ojs-issn-0079-3507-year-2018-volume-187-article-bwmeta1_element_oai-journals-pan-pl-110309 (accessed on 20 May 2023).
- Ionita, M.; Nagavciuc, V.; Kumar, R.; Rakovec, O. On the curious case of the recent decade, mid-spring precipitation deficit in central Europe. NPJ Clim. Atmos. Sci. 2020, 3, 49. [Google Scholar] [CrossRef]
- Meier, H.E.M.; Kniebusch, M.; Dieterich, C.; Gröger, M.; Zorita, E.; Elmgren, R.; Myrberg, K.; Ahola, M.P.; Bartosova, A.; Bonsdorff, E.; et al. Climate change in the Baltic Sea region: A summary. Earth Syst. Dynam. 2022, 13, 457–593. [Google Scholar] [CrossRef]


| Parameter | Unit | Value |
|---|---|---|
| River length | km | 126.7 |
| Basin area | km2 | 1764.0 |
| River network density | km·km2 | 2.2 |
| Lake surface | km2 | 86.1 |
| Maximum basin height | meters at sea level | 268.6 |
| Minimum basin height | meters at sea level | 0.0 |
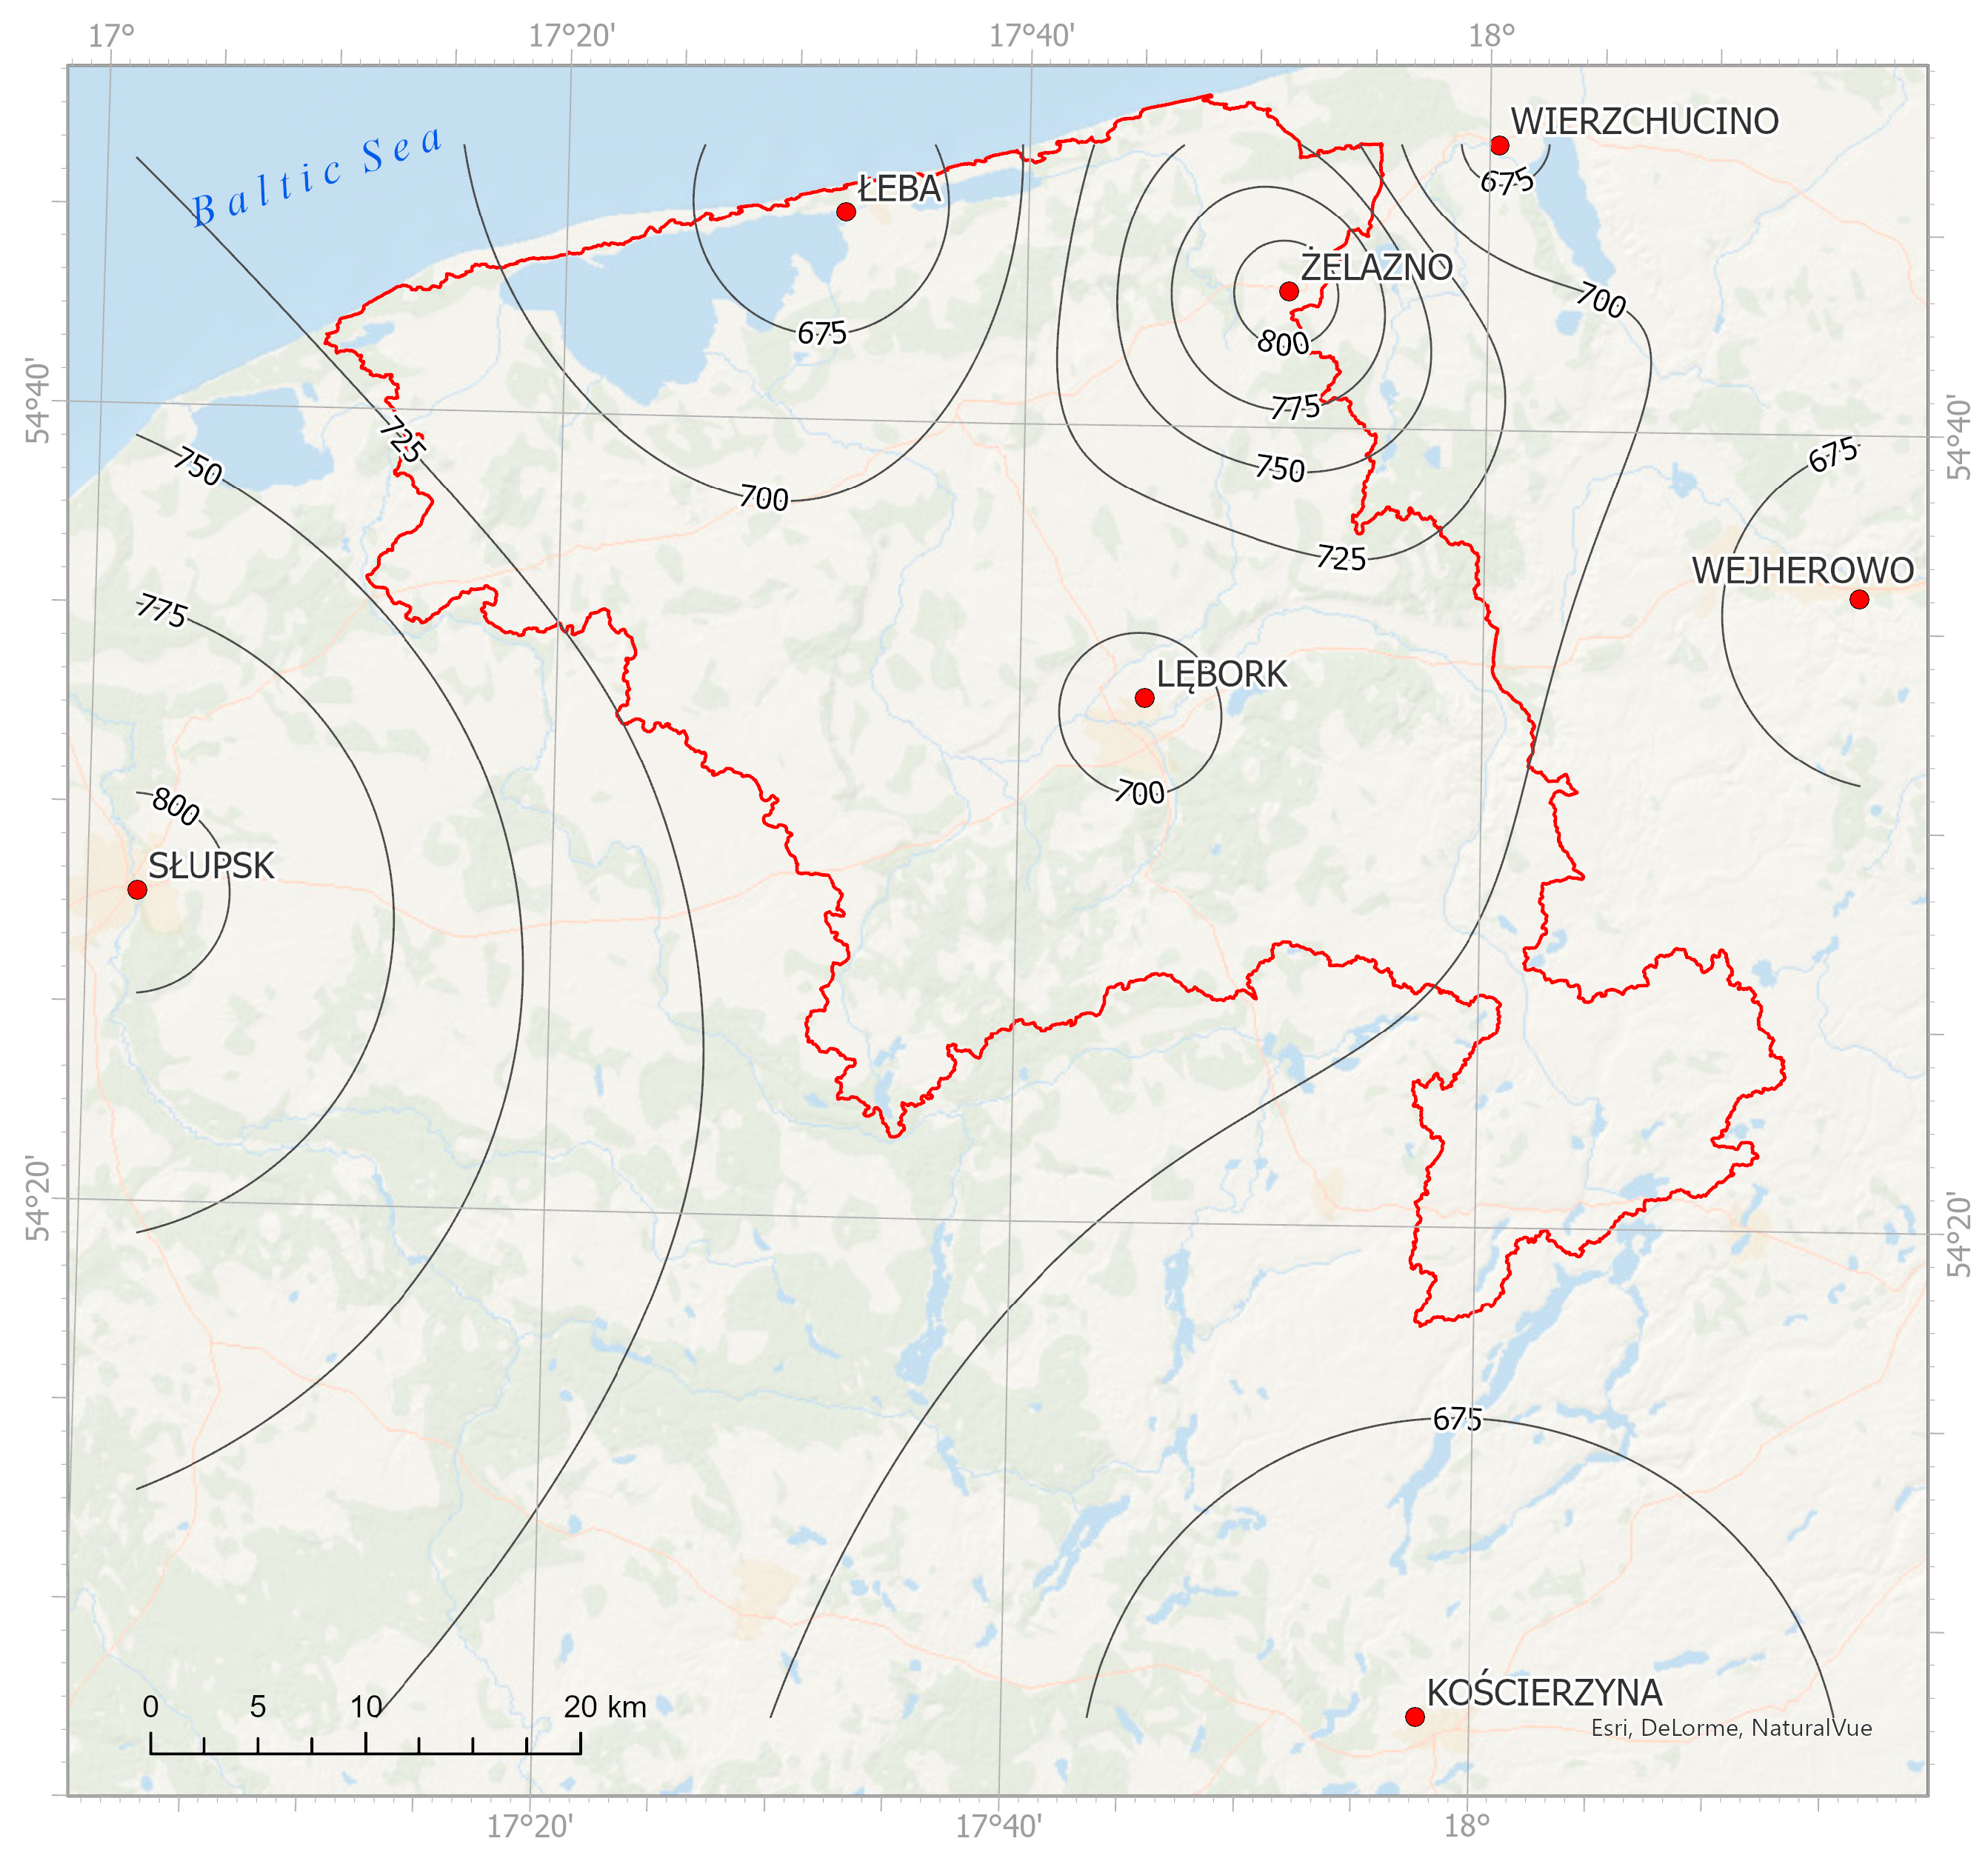
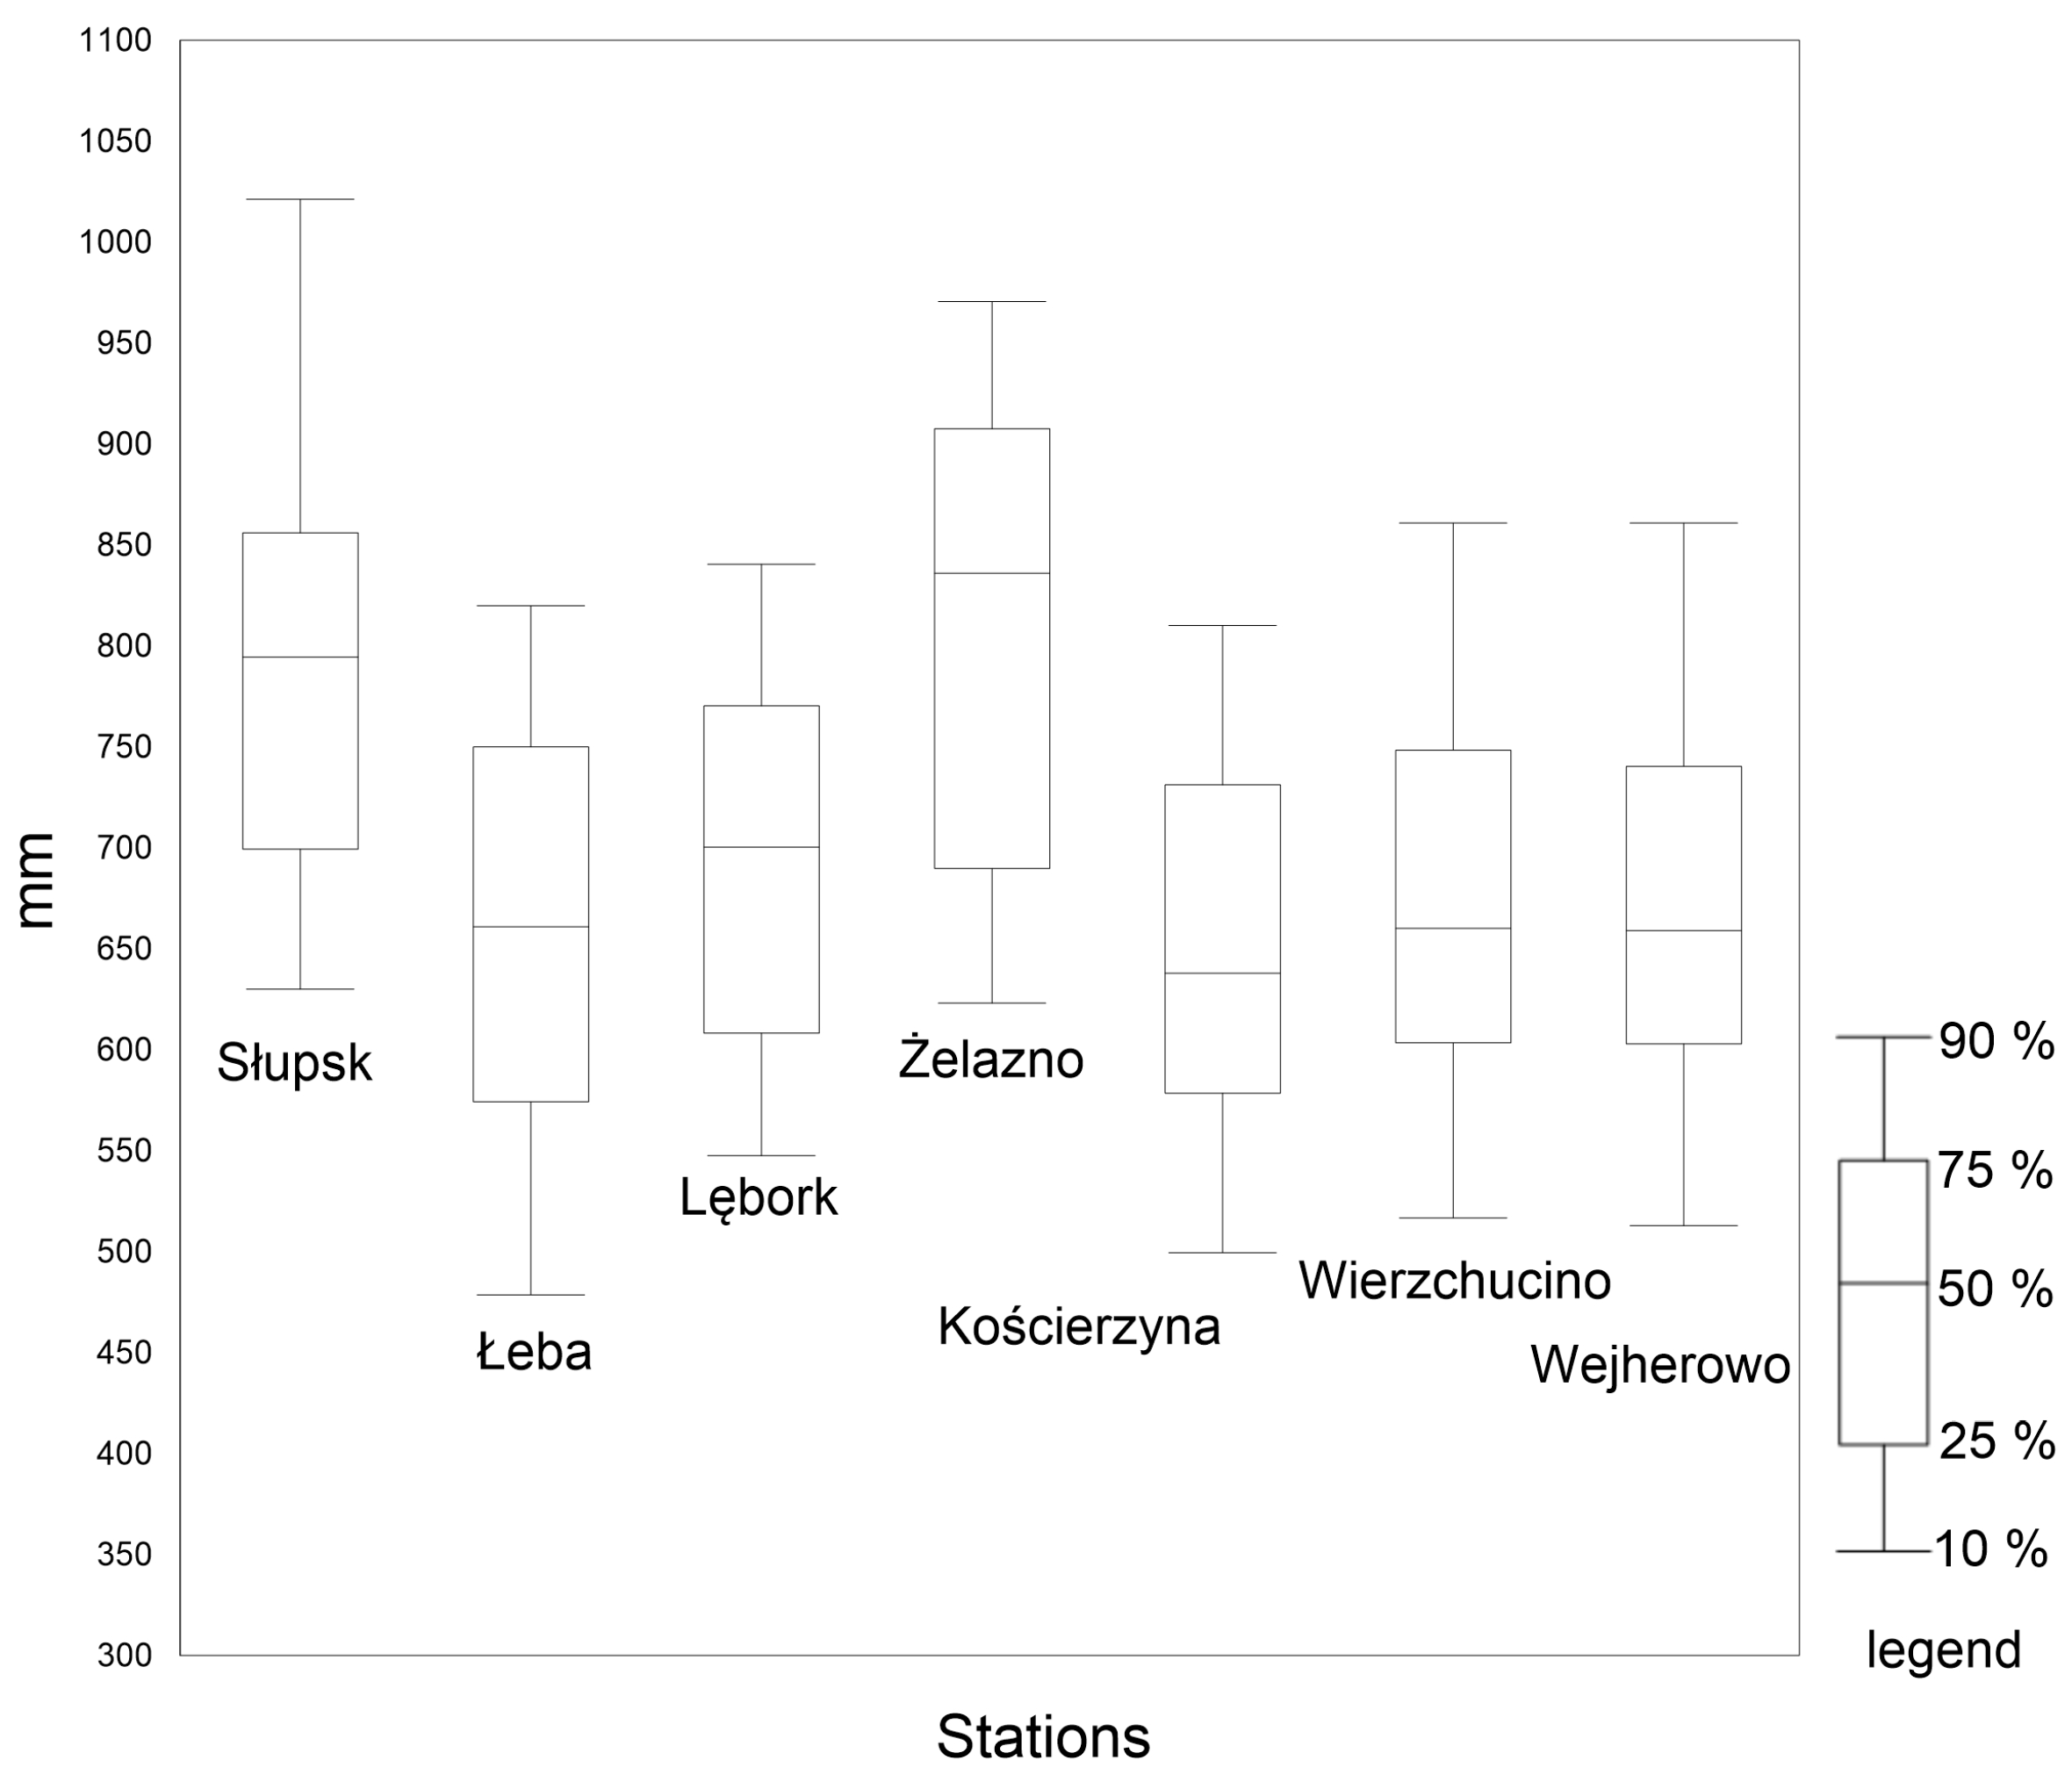
| Station | Longitude | Latitude | Height above Sea Level | Average Annual Precipitation in Years 1956–2015 [mm] | Standard Deviation of the Annual Precipitation in Years 1956–2015 [mm] |
|---|---|---|---|---|---|
| Wierzchucino | 18°00′23″ E | 54°47′11″ N | 8 | 671.1 | 138.2 |
| Łeba | 17°32′05″ E | 54°45′13″ N | 2 | 661.7 | 131.1 |
| Żelazno | 17°51′23″ E | 54°43′26″ N | 95 | 810.0 | 146.4 |
| Wejherowo | 18°16′13″ E | 54°35′54″ N | 22 | 664.8 | 142.0 |
| Słupsk | 17°02′08″ E | 54°27′48″ N | 17 | 803.9 | 151.8 |
| Lebork | 17°45′25″ E | 54°33′11″ N | 39 | 697.6 | 113.7 |
| Kościerzyna | 17°57′43″ E | 54°07′43″ N | 190 | 658.3 | 120.4 |
| SPI Value Range | Drought Category |
|---|---|
| 0 to −0.99 | mild |
| −1.00 to −1.49 | moderate |
| −1.50 to −1.99 | severe |
| ≤−2.00 | extreme |
| Station | I | II | III | IV | V | VI | VII | VIII | IX | X | XI | XII | Year |
|---|---|---|---|---|---|---|---|---|---|---|---|---|---|
| Łeba | −0.6 | −1.9 | 1.5 | −2.9 | 1.6 | 0.8 | −3.8 | −0.5 | 2.6 | 1.0 | 1.0 | −0.1 | −1.3 |
| Wierzchucino | 3.1 | 1.5 | 3.3 | −0.6 | 3.1 | 1.6 | −2.4 | 0.5 | 5.4 | 1.0 | 3.2 | 5.0 | 24.7 |
| Żelazno | 1.9 | 0.6 | 2.5 | −2.1 | 2.1 | 0.6 | −4.9 | −3.2 | 1.7 | −0.8 | 0.2 | 1.6 | 0.1 |
| Wejherowo | 3.3 | −0.1 | 4.3 | −1.6 | 2.8 | 1.4 | 2.0 | 0.3 | 2.6 | 1.0 | 0.8 | 3.1 | 28.7 |
| Lębork | 1.7 | −1.2 | 2.7 | −1.4 | 1.7 | 1.6 | −2.3 | −3.0 | 3.2 | 1.4 | 2.1 | 2.8 | 9.2 |
| Słupsk | 3.9 | 0.3 | 2.9 | −2.7 | 0.5 | 2.7 | −3.4 | −2.1 | 1.8 | 0.0 | 0.6 | 2.9 | 7.4 |
| Kościerzyna | 4.4 | 0.1 | 3.9 | −1.0 | 1.4 | 0.6 | 0.8 | −2.9 | −0.6 | 0.7 | 0.8 | 3.1 | 11.3 |
| Station | I | II | III | IV | V | VI | VII | VIII | IX | X | XI | XII | Year |
|---|---|---|---|---|---|---|---|---|---|---|---|---|---|
| Łeba | 0.27 | 0.37 | 0.31 | 0.43 | 0.37 | 0.13 | 0.29 | 0.33 | 0.16 | 0.01 | 0.18 | 0.22 | 0.26 |
| Lębork | 0.27 | 0.41 | 0.30 | 0.40 | 0.26 | −0.01 | 0.32 | 0.33 | 0.13 | −0.04 | 0.15 | 0.24 | 0.23 |
| Kościerzyna | 0.26 | 0.38 | 0.31 | 0.42 | 0.28 | −0.01 | 0.34 | 0.35 | 0.09 | −0.09 | 0.13 | 0.22 | 0.22 |
| Station | Total Number Events | Number of Months with Drought (<−1.0) | Longest Drought (Month) | The Maximum Intensity of Drought |
|---|---|---|---|---|
| SPI-1 | ||||
| Lębork | 84 | 205 | 11 (March 1964–January 1965) | −3.96 (June 1992) |
| Łeba | 83 | 219 | 8 (March 1964–October 1964) | −3.09 (June 1992) |
| Kościerzyna | 75 | 203 | 8 (March 1964–October 1964) | −3.70 (June 1992) |
| Słupsk | 87 | 203 | 8 (March 1964–October 1964) | −3.68 (June 1992) |
| Wejherowo | 85 | 199 | 6 (May 1964–_October 1964) | −4.17 (June 1992) |
| Wierzchucino | 69 | 219 | 10 (February 1987–November 1987) | −3.93 (August 1977) |
| Żelazno | 79 | 243 | 9 (December 2000–August 2001) | −3.11 (October 1996) |
| SPI-3 | ||||
| Lębork | 48 | 262 | 19 (December 1963–June1965) | −3.10 (July 1992) |
| Łeba | 40 | 256 | 19 (December 1978–June 1980) | −2.51 (November 1982) |
| Kościerzyna | 53 | 272 | 17 (February 1964–June 1965) | −2.92 (July 1992) |
| Słupsk | 49 | 254 | 22 (February 1975–November 1976) | −3.04 (July 1969) |
| Wejherowo | 39 | 251 | 21 (November 1958–July 1980) | −3.19 (July 1969) |
| Wierzchucino | 45 | 263 | 18 (December 1963–May 1965) | −3.45 (July 1969) |
| Żelazno | 45 | 270 | 32 (October 1962–May 1965) | −3.29 (July 1969) |
| SPI-6 | ||||
| Lębork | 31 | 287 | 19 (December 1963–June 1965 19 (June 2005–December 2006) | −2.95 (August 1964) |
| Łeba | 23 | 257 | 23 (February 2014–December 2015) | −2.72 (March 1996) |
| Kościerzyna | 25 | 298 | 28 (March 1964–June 1966) | −2.93 (April 1996) |
| Słupsk | 28 | 284 | 24 (April 1975–March 1977) | −2.36 (May 1964) |
| Wejherowo | 24 | 292 | 32 (December 1991–March 1994) | −2.55 (June 1957) |
| Wierzchucino | 24 | 230 | 21 (July 1968–March 1970) | −3.0 (June 1959) |
| Żelazno | 29 | 263 | 33 (October 1962–October 1965) | −2.94 (July 1963) |
| SPI-9 | ||||
| Lębork | 19 | 264 | 33 (October 1962–June 1965) | −3.20 (August 1964) |
| Łeba | 17 | 249 | 27 (July 1995–September 1997) | −2.86 (May 1980) |
| Kościerzyna | 22 | 309 | 32 (July 1991–February 1994) | −2.78 (August 1964) |
| Słupsk | 22 | 306 | 31 (June 2013–December 2015) | −2.64 (August 1964) |
| Wejherowo | 17 | 283 | 34 (November 1959–August 1961) | −2.74 (July 1964) |
| Wierzchucino | 18 | 264 | 38 (July 1975–August 1978) | −3.42 (July 1969) |
| Żelazno | 23 | 295 | 39 (April 1962–June 1965) | −3.01 (July 1969) |
| SPI-12 | ||||
| Lębork | 15 | 251 | 49 (July 1961–July 1965) | −2.98 (November 1964) |
| Łeba | 15 | 259 | 35 (October 1975–August 1978) | −2.39 (January 1960; August 2015) |
| Kościerzyna | 17 | 332 | 46 (March 1963–December 1966) 46 (July 1975–April 1979) | −2.43 (November 1964) |
| Słupsk | 20 | 299 | 28 (July 2013–October 2015) | −2.16 (April 1960, October 1969) |
| Wejherowo | 15 | 320 | 97 (January 1956–January 1964) | −2.47 (October 1969) |
| Wierzchucino | 14 | 235 | 34 (October 1975–July 1978) | −3.30 (September 1959) |
| Żelazno | 17 | 286 | 36 (July 1962–June 1965) | −2.67 (October 1964; November 1964) |
| SPI-1 | ||||||||||||
| Station | I | II | III | IV | V | VI | VII | VIII | IX | X | XI | XII |
| Łeba | −0.003 | −0.007 | 0.007 | −0.010 | 0.006 | 0.002 | −0.005 | 0.000 | 0.006 | 0.003 | 0.002 | 0.002 |
| Wierzchucino | −0.007 | −0.016 | −0.016 | −0.004 | 0.001 | −0.012 | −0.005 | 0.002 | 0.011 | 0.000 | 0.010 | −0.001 |
| Żelazno | 0.000 | −0.012 | −0.009 | −0.002 | −0.001 | −0.014 | −0.011 | −0.002 | 0.012 | −0.002 | 0.006 | 0.000 |
| Wejherowo | 0.009 | 0.000 | 0.018 | −0.008 | 0.010 | 0.004 | 0.002 | 0.000 | 0.006 | 0.003 | 0.005 | 0.012 |
| Lębork | 0.004 | −0.005 | 0.011 | −0.006 | 0.006 | 0.004 | −0.002 | −0.006 | 0.007 | 0.004 | 0.005 | 0.010 |
| Słupsk | 0.009 | 0.001 | 0.010 | −0.006 | 0.003 | 0.005 | −0.005 | −0.004 | 0.006 | 0.001 | 0.001 | 0.010 |
| Kościerzyna | 0.013 | 0.001 | 0.018 | −0.008 | 0.006 | 0.000 | 0.004 | −0.005 | −0.002 | 0.001 | 0.004 | 0.013 |
| SPI-3 | ||||||||||||
| Station | I | II | III | IV | V | VI | VII | VIII | IX | X | XI | XII |
| Łeba | -0.002 | -0.007 | -0.003 | -0.008 | 0.002 | -0.002 | -0.001 | -0.003 | -0.001 | 0.004 | 0.007 | 0.005 |
| Wierzchucino | 0.022 | 0.020 | 0.020 | 0.013 | 0.015 | 0.008 | 0.005 | 0.001 | 0.005 | 0.009 | 0.013 | 0.017 |
| Żelazno | 0.006 | 0.008 | 0.011 | 0.004 | 0.007 | 0.002 | 0.000 | −0.006 | −0.005 | −0.002 | 0.002 | 0.003 |
| Wejherowo | 0.012 | 0.011 | 0.015 | 0.007 | 0.013 | 0.005 | 0.009 | 0.005 | 0.007 | 0.007 | 0.006 | 0.010 |
| Lębork | 0.009 | 0.005 | 0.007 | 0.001 | 0.008 | 0.003 | 0.001 | −0.004 | −0.003 | 0.002 | 0.010 | 0.012 |
| Słupsk | 0.010 | 0.011 | 0.012 | 0.002 | 0.003 | 0.002 | 0.001 | −0.003 | −0.004 | 0.000 | 0.004 | 0.007 |
| Kościerzyna | 0.013 | 0.013 | 0.018 | 0.008 | 0.011 | 0.001 | 0.004 | −0.001 | −0.003 | −0.004 | 0.001 | 0.011 |
| SPI-6 | ||||||||||||
| Station | I | II | III | IV | V | VI | VII | VIII | IX | X | XI | XII |
| Łeba | 0.005 | 0.002 | 0.000 | −0.007 | −0.004 | −0.002 | −0.005 | −0.003 | −0.002 | 0.002 | 0.001 | 0.001 |
| Wierzchucino | 0.020 | 0.024 | 0.023 | 0.024 | 0.023 | 0.019 | 0.010 | 0.008 | 0.008 | 0.009 | 0.009 | 0.012 |
| Żelazno | 0.004 | 0.006 | 0.008 | 0.006 | 0.009 | 0.008 | 0.001 | −0.004 | −0.004 | −0.002 | −0.004 | −0.003 |
| Wejherowo | 0.012 | 0.011 | 0.015 | 0.012 | 0.015 | 0.013 | 0.011 | 0.011 | 0.008 | 0.009 | 0.007 | 0.009 |
| Lębork | 0.008 | 0.011 | 0.011 | 0.007 | 0.008 | 0.008 | 0.002 | −0.001 | −0.001 | 0.002 | 0.003 | 0.005 |
| Słupsk | 0.009 | 0.010 | 0.011 | 0.009 | 0.010 | 0.010 | 0.002 | −0.002 | −0.003 | 0.000 | 0.000 | 0.000 |
| Kościerzyna | 0.006 | 0.009 | 0.017 | 0.014 | 0.015 | 0.012 | 0.007 | 0.004 | −0.002 | 0.000 | −0.001 | 0.003 |
| SPI-9 | ||||||||||||
| Station | I | II | III | IV | V | VI | VII | VIII | IX | X | XI | XII |
| Łeba | 0.004 | 0.001 | 0.002 | 0.002 | 0.002 | 0.000 | −0.006 | −0.006 | −0.002 | −0.001 | 0.001 | 0.000 |
| Wierzchucino | 0.018 | 0.018 | 0.019 | 0.023 | 0.028 | 0.024 | 0.019 | 0.015 | 0.014 | 0.012 | 0.013 | 0.014 |
| Żelazno | 0.003 | 0.002 | 0.004 | 0.005 | 0.008 | 0.007 | 0.003 | 0.000 | 0.000 | −0.001 | −0.002 | −0.002 |
| Wejherowo | 0.015 | 0.012 | 0.015 | 0.013 | 0.015 | 0.014 | 0.014 | 0.014 | 0.013 | 0.010 | 0.010 | 0.009 |
| Lębork | 0.008 | 0.005 | 0.007 | 0.008 | 0.013 | 0.011 | 0.006 | 0.002 | 0.003 | 0.003 | 0.006 | 0.005 |
| Słupsk | 0.008 | 0.007 | 0.008 | 0.009 | 0.010 | 0.010 | 0.007 | 0.005 | 0.004 | 0.001 | 0.001 | 0.001 |
| Kościerzyna | 0.007 | 0.005 | 0.009 | 0.008 | 0.013 | 0.013 | 0.012 | 0.009 | 0.007 | 0.003 | 0.003 | 0.003 |
| SPI-12 | ||||||||||||
| Station | I | II | III | IV | V | VI | VII | VIII | IX | X | XI | XII |
| Łeba | 0.002 | 0.001 | 0.002 | 0.002 | 0.001 | 0.001 | 0.000 | −0.002 | −0.002 | −0.002 | −0.001 | −0.001 |
| Wierzchucino | 0.020 | 0.020 | 0.020 | 0.020 | 0.020 | 0.021 | 0.021 | 0.021 | 0.020 | 0.019 | 0.017 | 0.018 |
| Żelazno | 0.004 | 0.003 | 0.004 | 0.004 | 0.004 | 0.004 | 0.003 | 0.001 | 0.001 | 0.001 | 0.001 | 0.001 |
| Wejherowo | 0.015 | 0.015 | 0.015 | 0.016 | 0.015 | 0.015 | 0.015 | 0.015 | 0.015 | 0.014 | 0.013 | 0.013 |
| Lębork | 0.008 | 0.007 | 0.007 | 0.008 | 0.007 | 0.008 | 0.007 | 0.007 | 0.007 | 0.007 | 0.007 | 0.008 |
| Słupsk | 0.008 | 0.007 | 0.007 | 0.008 | 0.007 | 0.008 | 0.007 | 0.006 | 0.005 | 0.005 | 0.005 | 0.006 |
| Kościerzyna | 0.010 | 0.009 | 0.009 | 0.009 | 0.008 | 0.008 | 0.008 | 0.008 | 0.009 | 0.008 | 0.008 | 0.010 |
Disclaimer/Publisher’s Note: The statements, opinions and data contained in all publications are solely those of the individual author(s) and contributor(s) and not of MDPI and/or the editor(s). MDPI and/or the editor(s) disclaim responsibility for any injury to people or property resulting from any ideas, methods, instructions or products referred to in the content. |
© 2023 by the authors. Licensee MDPI, Basel, Switzerland. This article is an open access article distributed under the terms and conditions of the Creative Commons Attribution (CC BY) license (https://creativecommons.org/licenses/by/4.0/).
Share and Cite
Kubiak-Wójcicka, K.; Owczarek, M.; Chlost, I.; Olszewska, A.; Nagy, P. Assessment of Meteorological Drought Trends in a Selected Coastal Basin Area in Poland—A Case Study. Water 2023, 15, 2836. https://0-doi-org.brum.beds.ac.uk/10.3390/w15152836
Kubiak-Wójcicka K, Owczarek M, Chlost I, Olszewska A, Nagy P. Assessment of Meteorological Drought Trends in a Selected Coastal Basin Area in Poland—A Case Study. Water. 2023; 15(15):2836. https://0-doi-org.brum.beds.ac.uk/10.3390/w15152836
Chicago/Turabian StyleKubiak-Wójcicka, Katarzyna, Małgorzata Owczarek, Izabela Chlost, Alicja Olszewska, and Patrik Nagy. 2023. "Assessment of Meteorological Drought Trends in a Selected Coastal Basin Area in Poland—A Case Study" Water 15, no. 15: 2836. https://0-doi-org.brum.beds.ac.uk/10.3390/w15152836