
Evaluating Effects of Terraces on Flow Regimes in a Hilly and Mountainous Basin
by
 ,
,
Feng Zhou
1,
Wanshun Zhang
1,2,3,*,
Xin Liu
1,
Anna Jiang
1,
Gang Chen
1,
Ao Li
1 and
Hong Peng
4 1
School of Resource and Environmental Sciences, Wuhan University, Wuhan 430079, China
2
China Institute of Development Strategy and Planning, Wuhan University, Wuhan 430079, China
3
State Key Laboratory of Water Resources and Hydropower Engineering Science, Wuhan University, Wuhan 430072, China
4
School of Water Resources and Hydropower Engineering, Wuhan University, Wuhan 430072, China
*
Author to whom correspondence should be addressed.
Water 2023, 15(22), 3980; https://0-doi-org.brum.beds.ac.uk/10.3390/w15223980
Submission received: 15 October 2023
/
Revised: 9 November 2023
/
Accepted: 14 November 2023
/
Published: 16 November 2023
(This article belongs to the Special Issue Water and Associated Surface Land Processes across Changing Landscapes)
Abstract
:Terraces play a crucial role in regulating the water cycle. The management and restoration of, and the conservation strategies and plans for basins rely heavily on the assessment of alterations in hydrological characteristics, whether natural or man-made, within these basin systems. This study centers on evaluating the impact of terraces on temporal variations in the hydrological regime within the Laixi River basin, within the context of climate variability. To achieve this, we employed a hydrological model and applied the Indicators of Hydrologic Alteration and Range of Variability Approach (IHA–RVA). The results show that, under the influence of terraces, the annual flow exhibited an overall decreasing trend. There was a noticeable decrease in streamflow from March to July, while from October to December, there was a clear upward trend, with increases ranging from 4.76% to 8.10% at the Guanshenxindi (GSXD) and Watershed outlet (WO) cross-sections. The indicators related to the minimum flow showed an overall increasing trend, whereas all indicators related to the maximum flow exhibited a clear decreasing trend. Both high and low flow pulse counts decreased, while high and low pulse durations increased overall. The overall trend of flow reversal counts also showed a decrease. All hydrological indicators exhibited low levels of alteration, with hydrologic alteration values lower than 33.33%. However, the influence of terraces on the upstream hydrological conditions was more pronounced than their downstream effect. The terraces in the study area have played a beneficial role in the flood regulation, drought mitigation, and water resource conservation of the Laixi River. They have contributed to stabilizing the daily average flow during high flow periods and have had a positive impact on the ecological base flow during low flow periods, thereby improving the aquatic ecological environment. This study provides theoretical support for river regulation within the framework of soil and water conservation measures.
1. Introduction
To some extent, the hydrological regime of a river plays a role in influencing the community structure, biological composition, and ecological functioning of an aquatic ecosystem [1,2,3]. Understanding the variability and modifications within hydrological processes in response to environmental changes is of utmost significance for water resource planning and management [4]. In recent years, with the escalating intensity of human activities, approximately 24% of the world’s river discharge has undergone noteworthy fluctuations [5]. Land development stands as a primary driver of the transformation of river streamflow [6,7]. Terracing, a prevalent agricultural landscape practice in hilly and mountainous areas, has been employed for water conservation, the mitigation of flooding hazards, erosion reduction, the expansion of high-quality cropland, and the restoration of degraded habitats [8,9,10,11]. According to the Second National Land Survey of China, the extent of terraced fields in China was estimated to be 18,610 thousand hectares (approximately 280 million acres), constituting 13.7% of the total arable land area. The total area of terraced fields in the provinces (municipalities) along the Yangtze River Basin is approximately 6075 km2, constituting 48.97% of the national expanse of terraced fields [12]. The partitioning of slopes into shorter and more gradual segments through the implementation of terraces significantly influences surface and soil hydrological processes [13,14,15], encompassing phenomena such as surface runoff, groundwater recharge, infiltration, and base flow [16]. Consequently, the hydrological conditions within rivers are correspondingly affected [4,10]. Some studies have highlighted that mountainous regions exhibit a heightened sensitivity to climate variability, with discernible and substantial impacts from ongoing global climate change on mountainous ecosystems discovered [17,18]. Amidst the influence of climate change, the alterations to river hydrological conditions brought about by terrace construction become imbued with greater complexity. As such, the heterogeneity of catchment characteristics, combined with the limitations of hydro-climatological data, constitutes the primary scientific challenge in achieving a comprehensive understanding of these intricate relationships [4,19].
Altering river hydrological regimes and their primary driving factors in order to fulfill the water demands of ecosystems has been examined. Research in this field has investigated the effects of factors such as dam operation [20], land use types [4], and soil and water conservation programs [21] on hydrological variables including low flows, base flows, and annual runoff coefficients. Gebremicael et al. (2020) revealed that the continuous implementation of intensive soil and water conservation measures within the Geba catchment has significantly improved low-flow conditions while concurrently leading to a reduction in total streamflow [21]. However, there is limited research assessing the varying impacts of different soil and water conservation measures on the hydrological regime of river runoff, especially in the context of terrace construction. Under the influence of terraces, various components of the hydrological regime are altered. These components primarily encompass the frequency, dimensions, and duration of extreme flows, along with shifts in the dynamics of water flow [20]. Gathagu et al. (2018) illustrated that, within the Thika–Chania catchment in Kenya, the implementation of terracing led to a 30% reduction in surface runoff, in comparison to the annual average of 202 mm [22]. The effect of gully land consolidation on the runoff concentration within the Loess Plateau in China was particularly pronounced during the flooding period, resulting in a runoff interception efficiency of 169,350 m3/(km2·yr) [23]. Moreover, the findings suggested that the impacts are not universally applicable, as they are contingent upon the local context of the catchment area [24]. The magnitude of the influence of terraces on the hydrological regime is contingent upon several factors, including the terrace size, their placement within the catchment, and their intended purpose, among other factors. Consequently, the effects of the hydrological changes caused by terracing under climate change are still uncertain in the hilly and mountainous regions of the Yangtze River Basin. Hence, there is a compelling need to explore the spatial and temporal correlations between terraces and hydrological responses to facilitate well-informed interventions for land and water management.
Among the frequently employed methodologies, the indicators of hydrologic alteration (IHA), developed by Richter et al. (1996) [25], encompass five categories comprising a total of 33 hydrological indicators. These indicators cover aspects such as monthly flow conditions, the magnitude and timing of extreme flows, flow pulses, and rates of change. The IHA methodology has been widely utilized in the assessment and research of river hydrological variability and its ecological impacts. The merit of utilizing these indicators lies in their capacity to encompass an extensive spectrum of river flow characteristics, a crucial aspect when evaluating transformations. The range of variability approach (RVA), based on the IHA evaluation criteria, enables a quantitative analysis of the varying levels of various indicators [26,27]. The IHA–RVA method is extensively applied, especially in the evaluation of alterations in hydrological processes resulting from human activities and climate change, including the construction of large reservoirs and power stations.
Assessing alterations in hydrological characteristics caused by climate change and the construction of terraces within a watershed system is a prerequisite for formulating strategies and plans pertaining to watershed management, restoration, and conservation [28,29]. Consequently, this study centered on the Laixi River basin (LRB) as the study area, aiming to analyze the impact of terraces on the temporal variations of the hydrological regime (including magnitude, duration, frequency, timing, and rate) under the influence of the climate variability from 2000 to 2020. This analysis employed a long-term dataset and utilized the IHA–RVA approach. The potential effects of human activities on hydrological alterations were investigated by assessing the correlations between hydrological indices and the distribution of terraces. The findings of this study can serve as a valuable reference for making informed decisions regarding water resource allocation and guiding future initiatives in soil and water conservation.
2. Materials and Methods
2.1. Study Area and Data
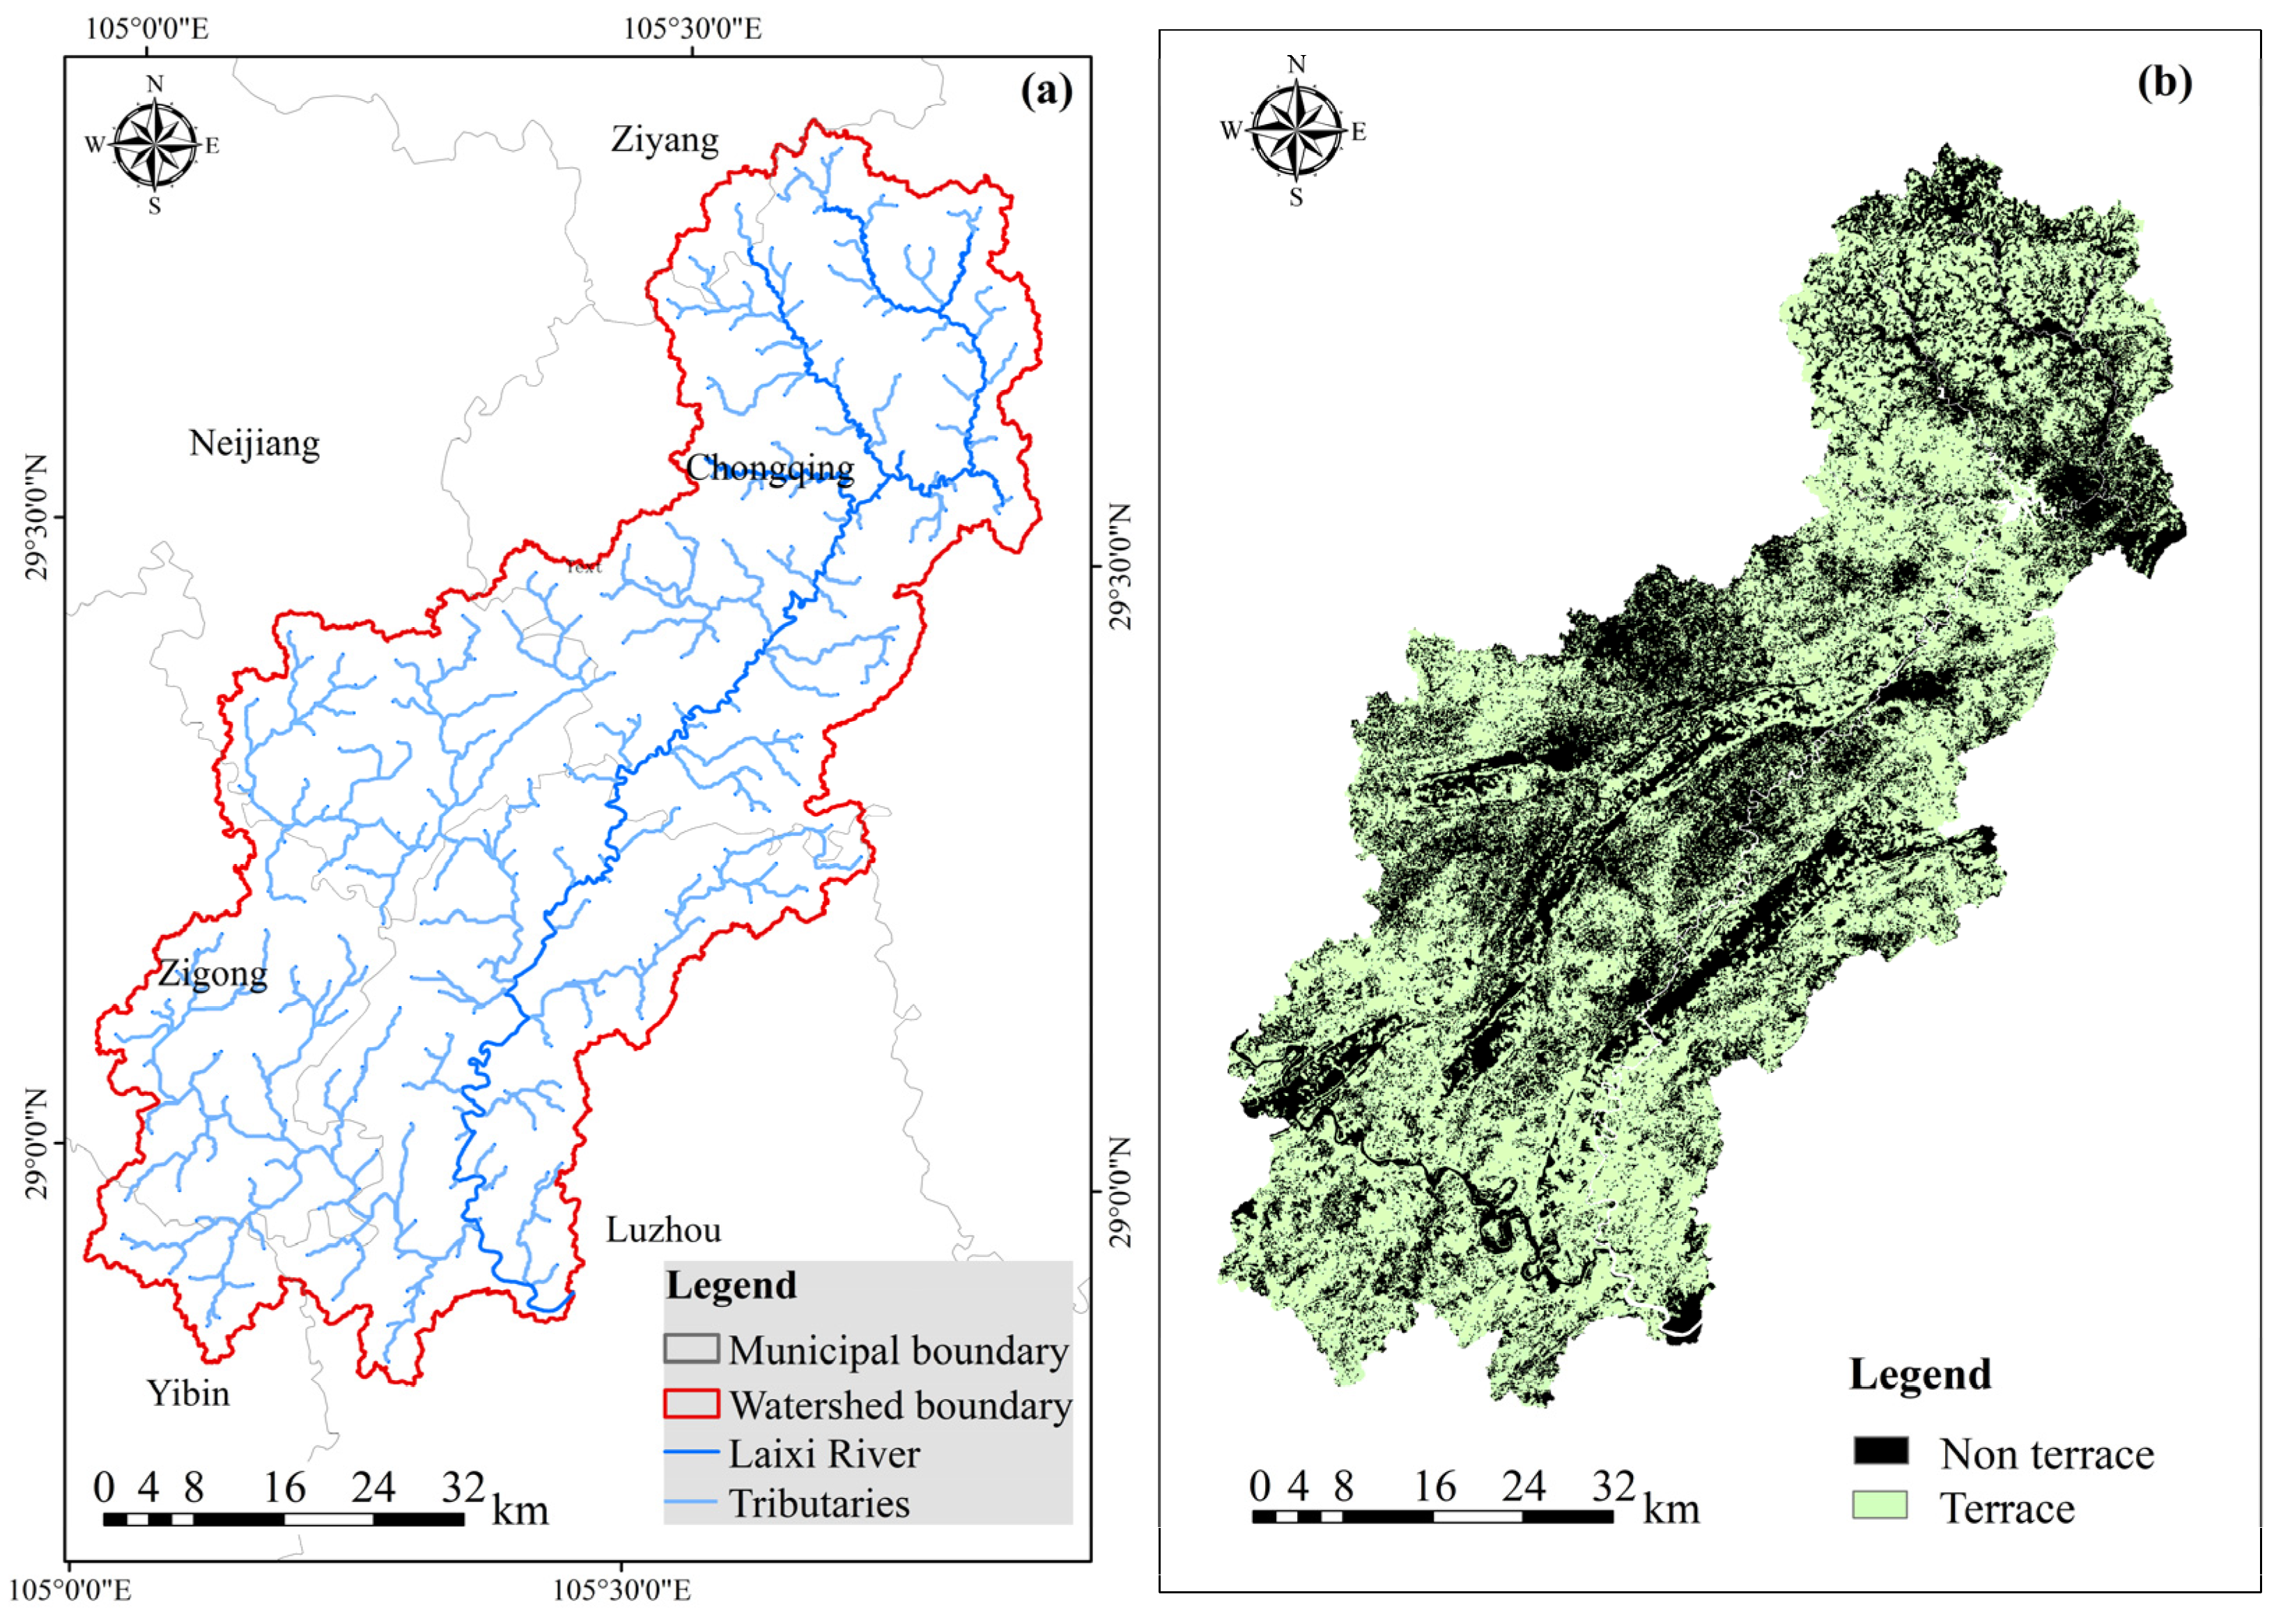
The Laixi River is a first-class tributary on the left bank of the Tuojiang River, originating from Zhongao Town, Dazu District, Chongqing (Figure 1a). The LRB catchment is characterized by traditional agricultural practices, rapid industrial development, and a widespread distribution of terraces. The main channel of the Laixi River (LR) extends for 195 km, with an average gradient of 0.50‰, and drains an area of 3257 km2. The topography of the LRB is primarily characterized by gentle hills, with an average elevation ranging from 180 to 900 m above sea level. The Laixi River is situated within the subtropical humid climate zone, characterized by relatively abundant annual precipitation, albeit unevenly distributed throughout the year. The multi-year averages for rainfall, temperature, and runoff amount to 800 to 1200 mm, 14.2 to 22.3 °C, and 1.17 billion m3, respectively. The terraces spatial distribution data in the LRB were based on the work of Cao et al. (2021) [30]. In 2018, the spatial distribution of terraces within the watershed exhibited significant variation, as depicted in Figure 1b. Most areas with substantial proportions of terraces were found near the outlet of the Yutan Reservoir and in the downstream area of the watershed.
The model database primarily included daily meteorological data from 1998 to 2020 and daily hydrological and water quality monitoring data from 2016 to 2020. Geospatial data from 2018 were also included, which consisted of a Digital Elevation Model (DEM) with a resolution of 30 × 30 m, land use data with a resolution of 100 m, and soil type data at a scale of 1:500,000. These geospatial data were obtained from the Geospatial Data Cloud, National Earth System Science Data Sharing Infrastructure, and the Nanjing Institute of Soil Science (Chinese Academy of Sciences). The database further included the harmonized world soil database (HWSD) and point–source pollutants emission data from 2018 (Chongqing Academy of Environmental Science), as well as population and socio-economic data (Chongqing Academy of Environmental Science; the Chongqing and Sichuan Statistics yearbooks of 2018; and a spot investigation) and the terrace spatial distribution data in the LRB [30].
2.2. Hydrological Model Implementation in the Laixi River Basin
2.2.1. Model Setup
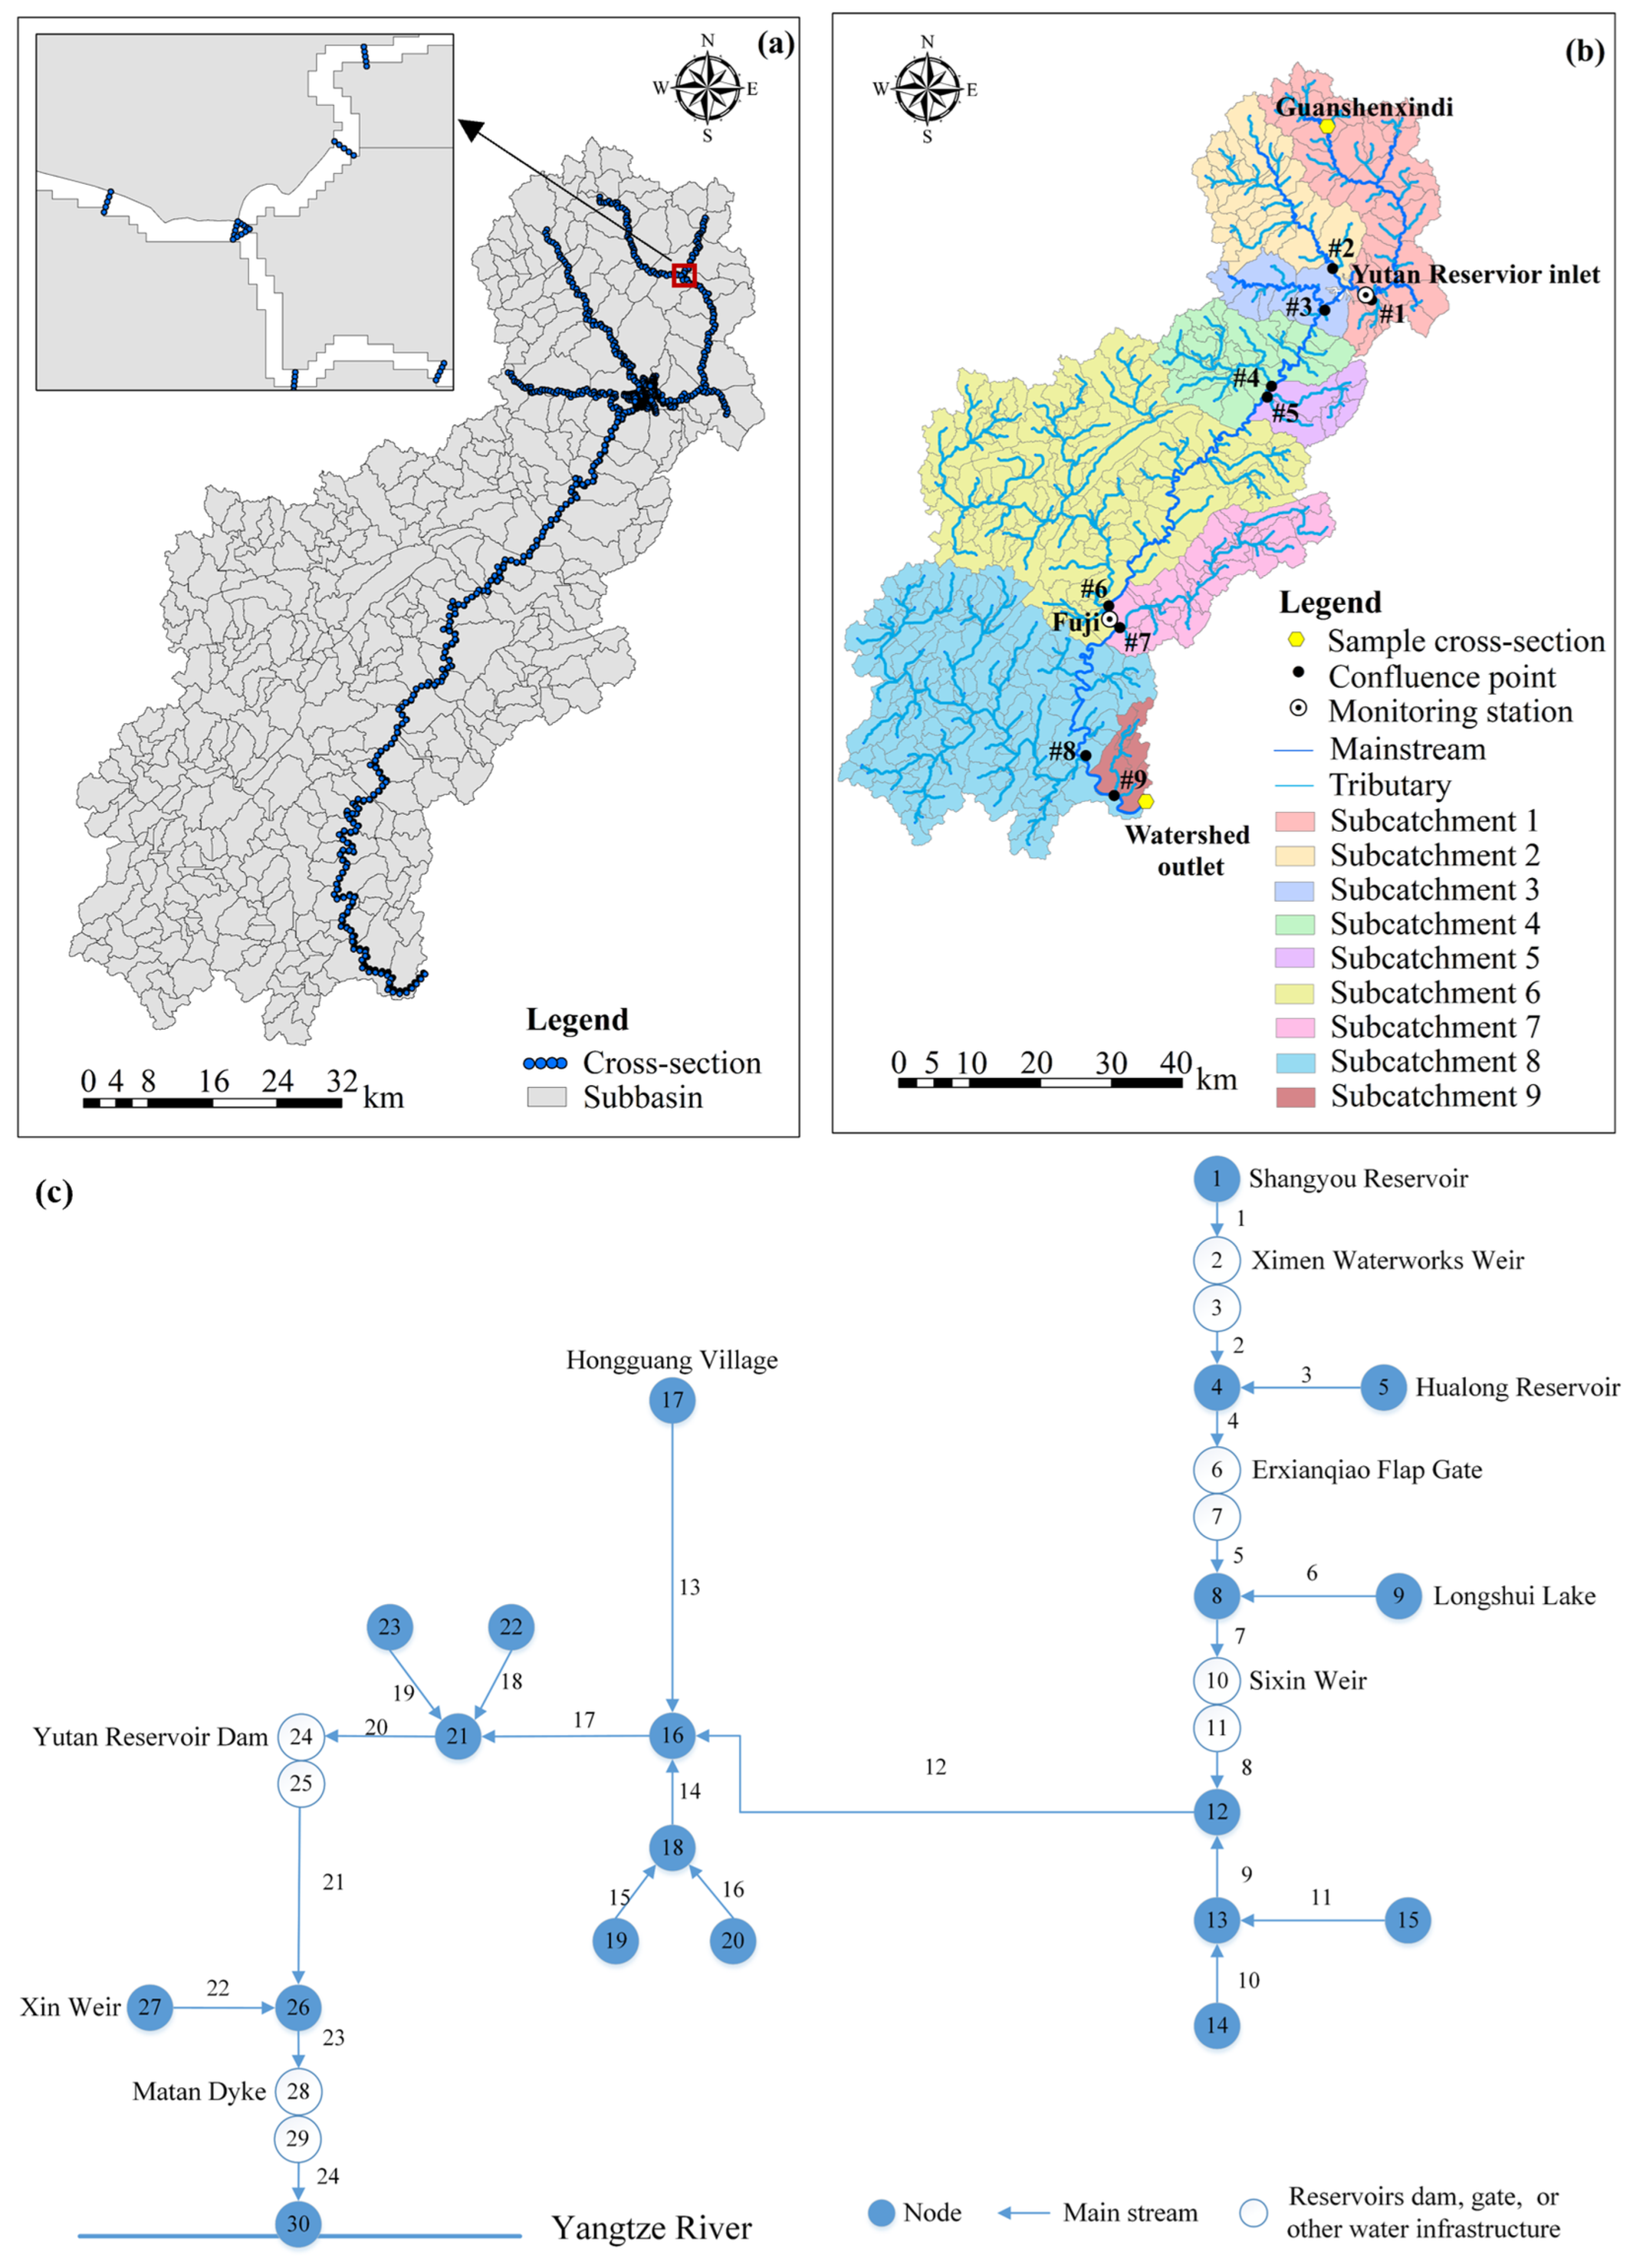
In this study, a distributed hydrological model based on an ALWM (air–land–water model) framework was developed, to evaluate the influence of terraces on streamflow dynamics [31,32,33]. This model was a coupled model of the meteorological model, watershed model, and river model. Specifically, for the simulation of terrestrial areas including terraces, the improved SWAT model was employed as described by Zhang et al. (2022, 2021) [33,34] and Zhou (2023) [35]. To simulate the quantity and quality of water in river channels, a one-dimensional river network hydrodynamic and water quality model was developed, utilizing the Saint-Venant equations to describe the hydraulic processes and the effects of pollutant advection, dispersion, and degradation in water bodies. The terrestrial area of the LRB was divided into 438 subbasins (Figure 2a). Building upon the delineation outcomes of these subbasins, the land was further categorized into nine subcatchments based on the river confluence relationship, as depicted in Figure 2b. Figure 2c shows the configuration of these river segments and nodes. Within the water module of the ALWM, the primary river system was generalized into 24 river sections, 30 nodes (where two adjacent empty circles denote the upstream and downstream points of a gate/dam), and 539 cross-sections. Among these, the cross-sections served as the computational units simulated by the one-dimensional river network hydrodynamic and water quality model.
2.2.2. Model Agreement
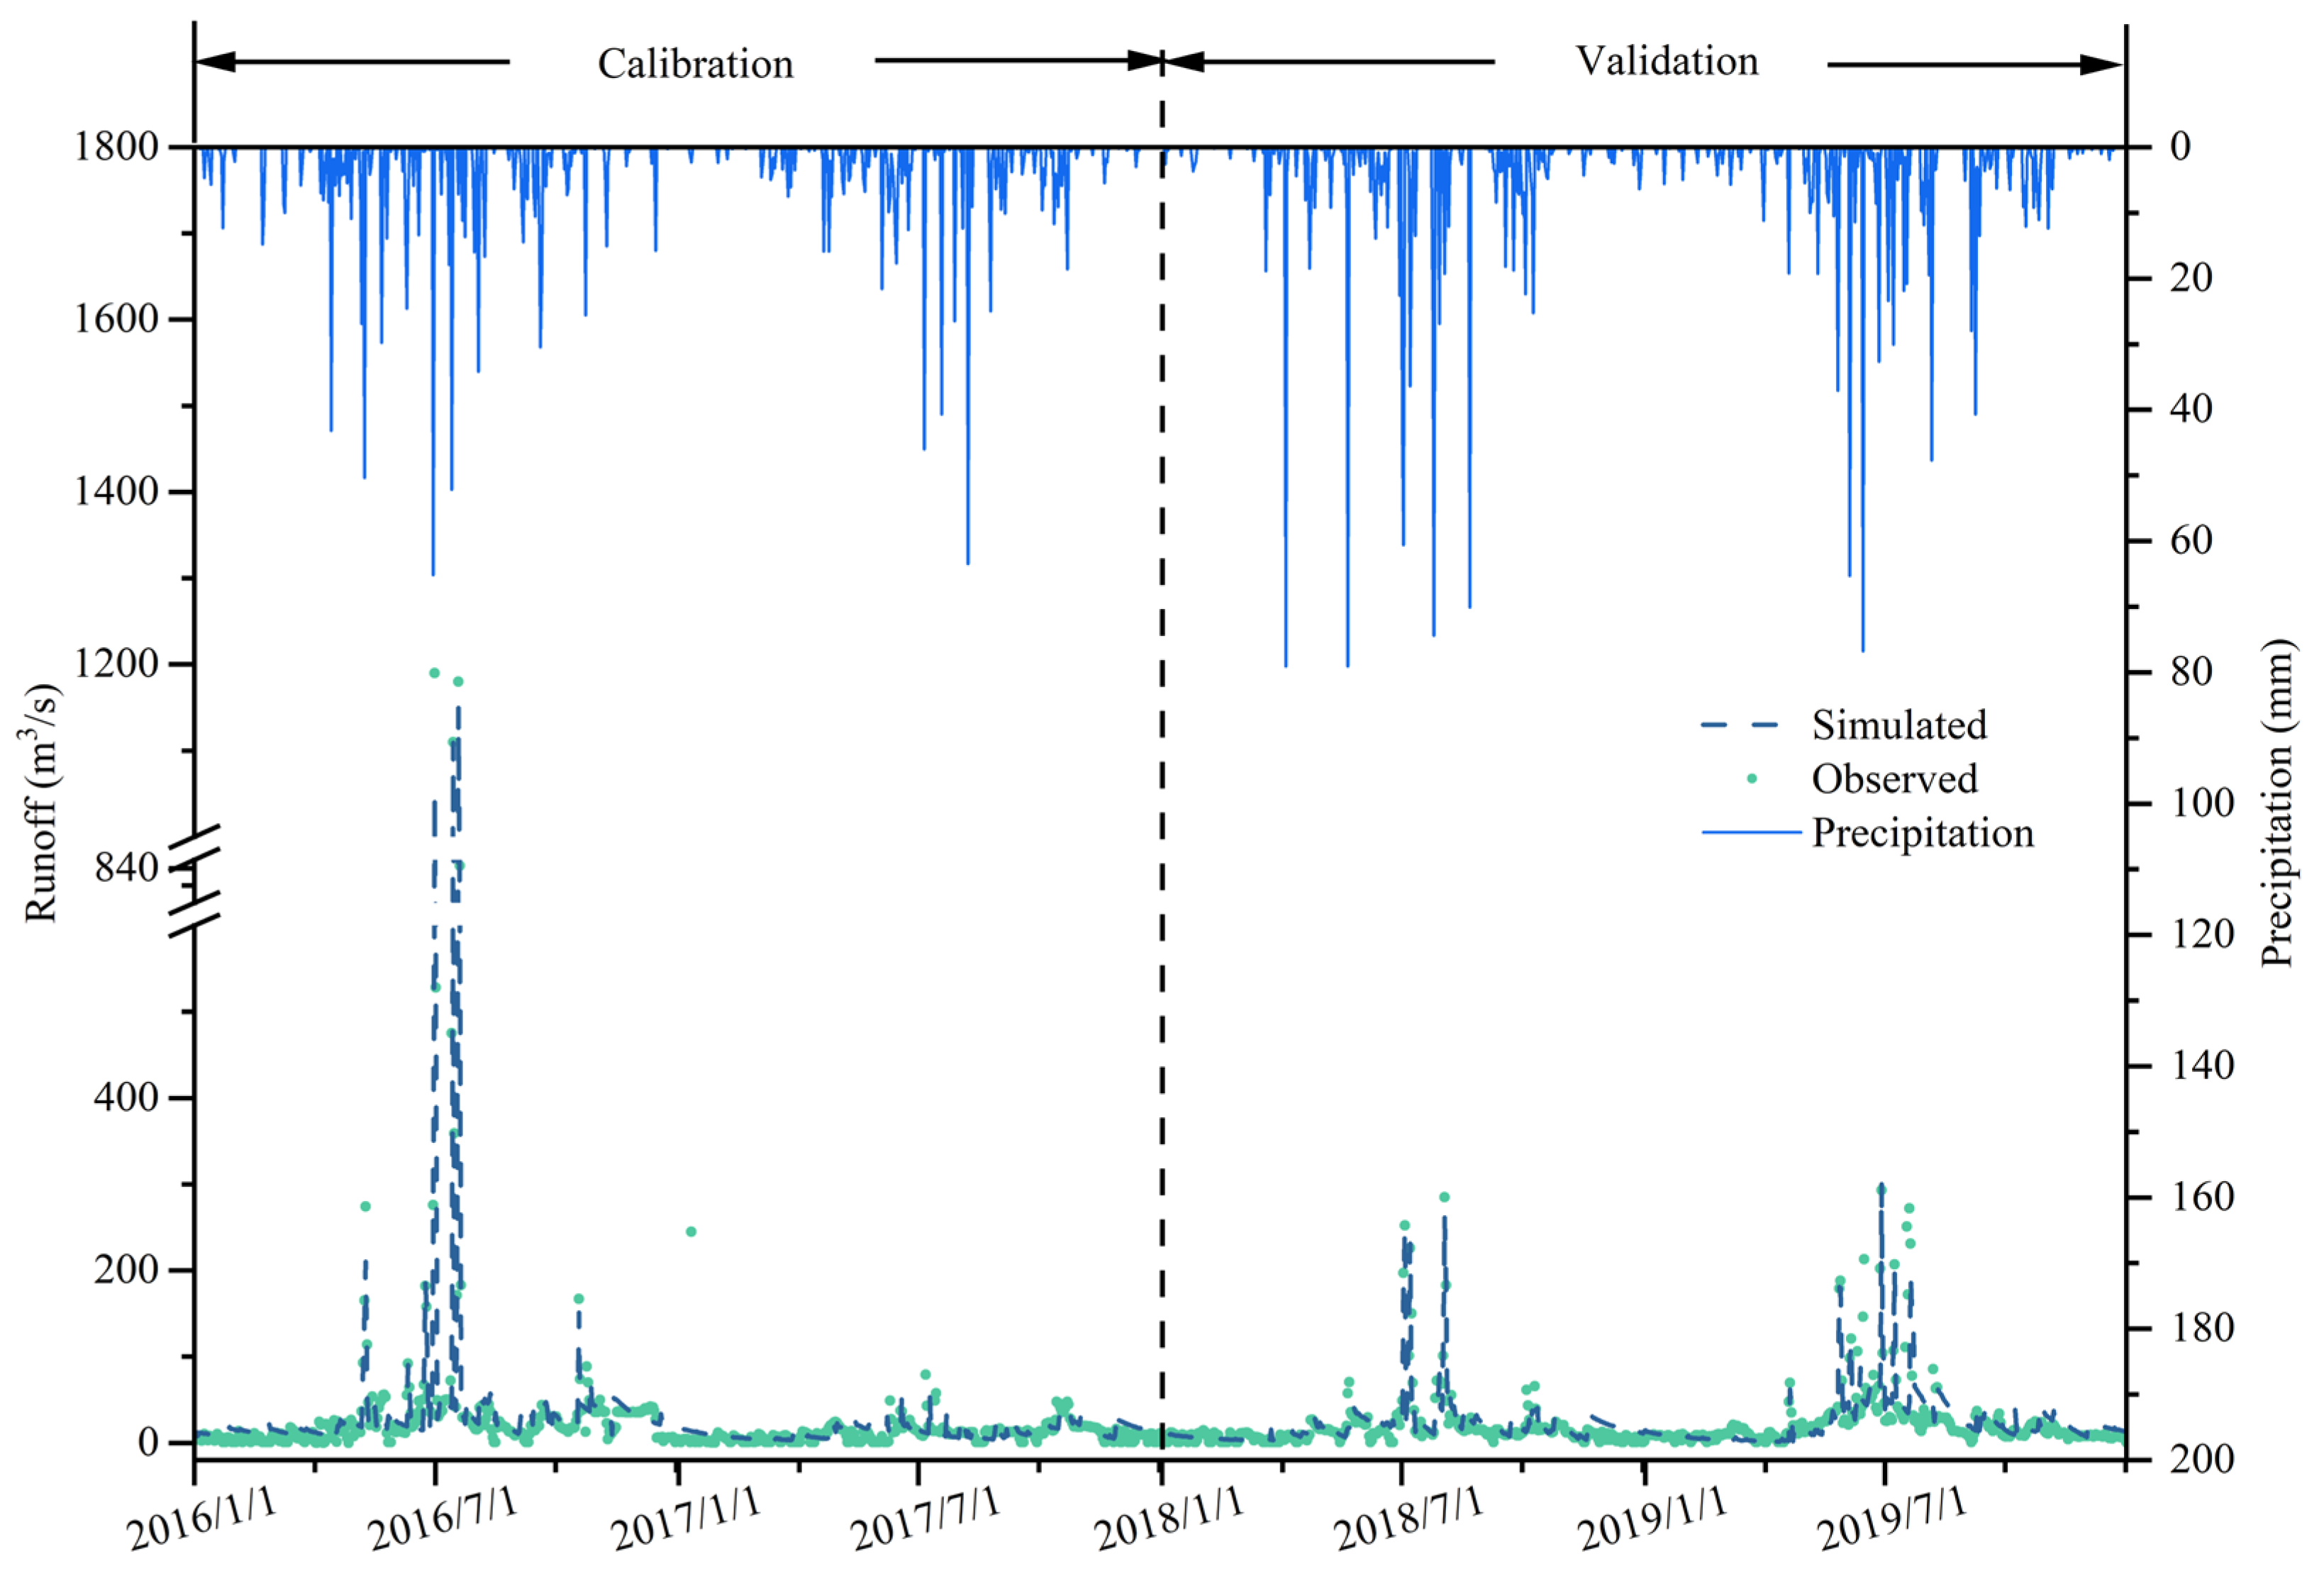
The model’s usability was contingent upon its rationality. Parameters within distinct terrestrial areas and rivers were calibrated through a process of comparison between monitoring station observations and simulated data. The calibration and validation of daily flow were conducted using the period from 2016 to 2019 (Figure 3). To assess the model’s accuracy, two key indicators, namely, the coefficient of determination (R2) and the Nash–Sutcliffe efficiency (NSE), were employed. These metrics were computed at the hydrological station (Fuji). In general, the NSE values fell within the range of 0.64 to 0.69, while the R2 values ranged from 0.80 to 0.85 for the flow data, indicating a satisfactory level of model performance [36].
2.3. Evaluation of Hydrologic Alterations in Streamflow Regime
2.3.1. Indicators of Hydrologic Alteration (IHA)
The alteration in streamflow dynamics resulting from the presence of terraces, as simulated by the hydrological models, was also quantified using the indicators of hydrologic alteration (IHA).
The IHA software program (Version 7.1), created by the United States Nature Conservancy (TNC), functions as a tool for quantifying the characteristics of hydrological regimes, whether they are in their natural states or have been altered [37]. This program summarizes extensive sets of daily hydrological data into more manageable and ecologically pertinent series of hydrologic indicators. Characterizing these hydrological parameters is essential for comprehending the variations in hydrological systems both prior to and following environmental changes. The IHA, as proposed by Richter et al. (1996) [25], encompass 33 hydrological parameters and classify hydrological metrics based on five fundamental characteristics of hydrological regimes. In this study, due to the absence of zero flow days in the Laixi River, a detailed analysis of this parameter was not conducted. Therefore, 32 IHA parameters (Table 1) were utilized to characterize the simulated flow variations spanning the period from 2000 to 2020.
2.3.2. Range of Variability Approach (RVA)
Within an RVA analysis, flow management and restoration targets are established by taking into account the scope of natural variability demonstrated by the IHA before interference. The RVA target range for each indicator is determined using percentile levels (for a non-parametric analysis) or as a multiple of the indicator’s standard deviation (for a parametric analysis) as observed before the interference [26]. If some of the hydrological variation in flow after interference still falls within the RVA target range, it indicates that the hydrological variation has a minor impact on the river and that the river remains within the natural range of flow variability. However, if the affected flow values fall outside the RVA target range, it indicates that the hydrological variation has a significant impact on the river’s ecosystem. The extent to which the RVA target range is not achieved during the impact period is regarded as an indicator of hydrological alteration.
2.3.3. Hydrologic Alteration (HA)
The formula for calculating the degree of change in a single indicator is as follows:
where Di is the degree of hydrological alteration of the i-th IHA indicator; Noi is the actual number of years in which the i-th IHA indicator remained within the RVA target range after the indicator’s variation; Ne is the expected number of years in which the i-th IHA indicator was predicted to remain within the RVA target range after the indicator’s variation; r is the proportion of years before the variation in which the i-th IHA indicator remained within the RVA target range; and NT is the total number of years in the affected runoff records after the variation.
The formula for calculating the total degree of hydrological alteration (D) in the sequence after variation is as follows:
where D is the degree of hydrological change for groups or overall; n is the number of indicators for each group or overall; 0 ≤ D < 33% indicates no change or a low level of change; 33% ≤ D < 67% suggests moderate change; and 67% ≤ D ≤ 100% indicates a high level of change.
2.4. Scenario Setting
Two scenarios, without terraces and with terraces, were set to simulate the river flow in the LRB from 2000 to 2020 using the watershed water quantity model. The hydrological response was subsequently quantified using the IHA method. The IHA–RVA approach was employed, with the upper-reach Guanshenxindi (GSXD) cross-section and the watershed outlet (WO) cross-section selected as samples (Figure 2b), to conduct a comparative analysis of the regulatory effects of terraces on the hydrology of the watershed. In the figures in the Section 3, Pre and Post represent the scenarios without and with terraces, respectively.
In this study, the hydrological year runs from April to March of the following year (http://www.cqyc.gov.cn/zwgk_204/zfxxgkmls/zcwj_147152/qtwj_1/202208/t20220829_11048206.html, accessed on 17 July 2023). Based on the seasonal division scheme for Chongqing and Sichuan Province, the cycle was separated into the low (January to April and December), normal (May and November), and abundant (June to October) water periods of the year.
3. Results
3.1. Changes in Hydrologic Indicators
3.1.1. Monthly Streamflow Alteration
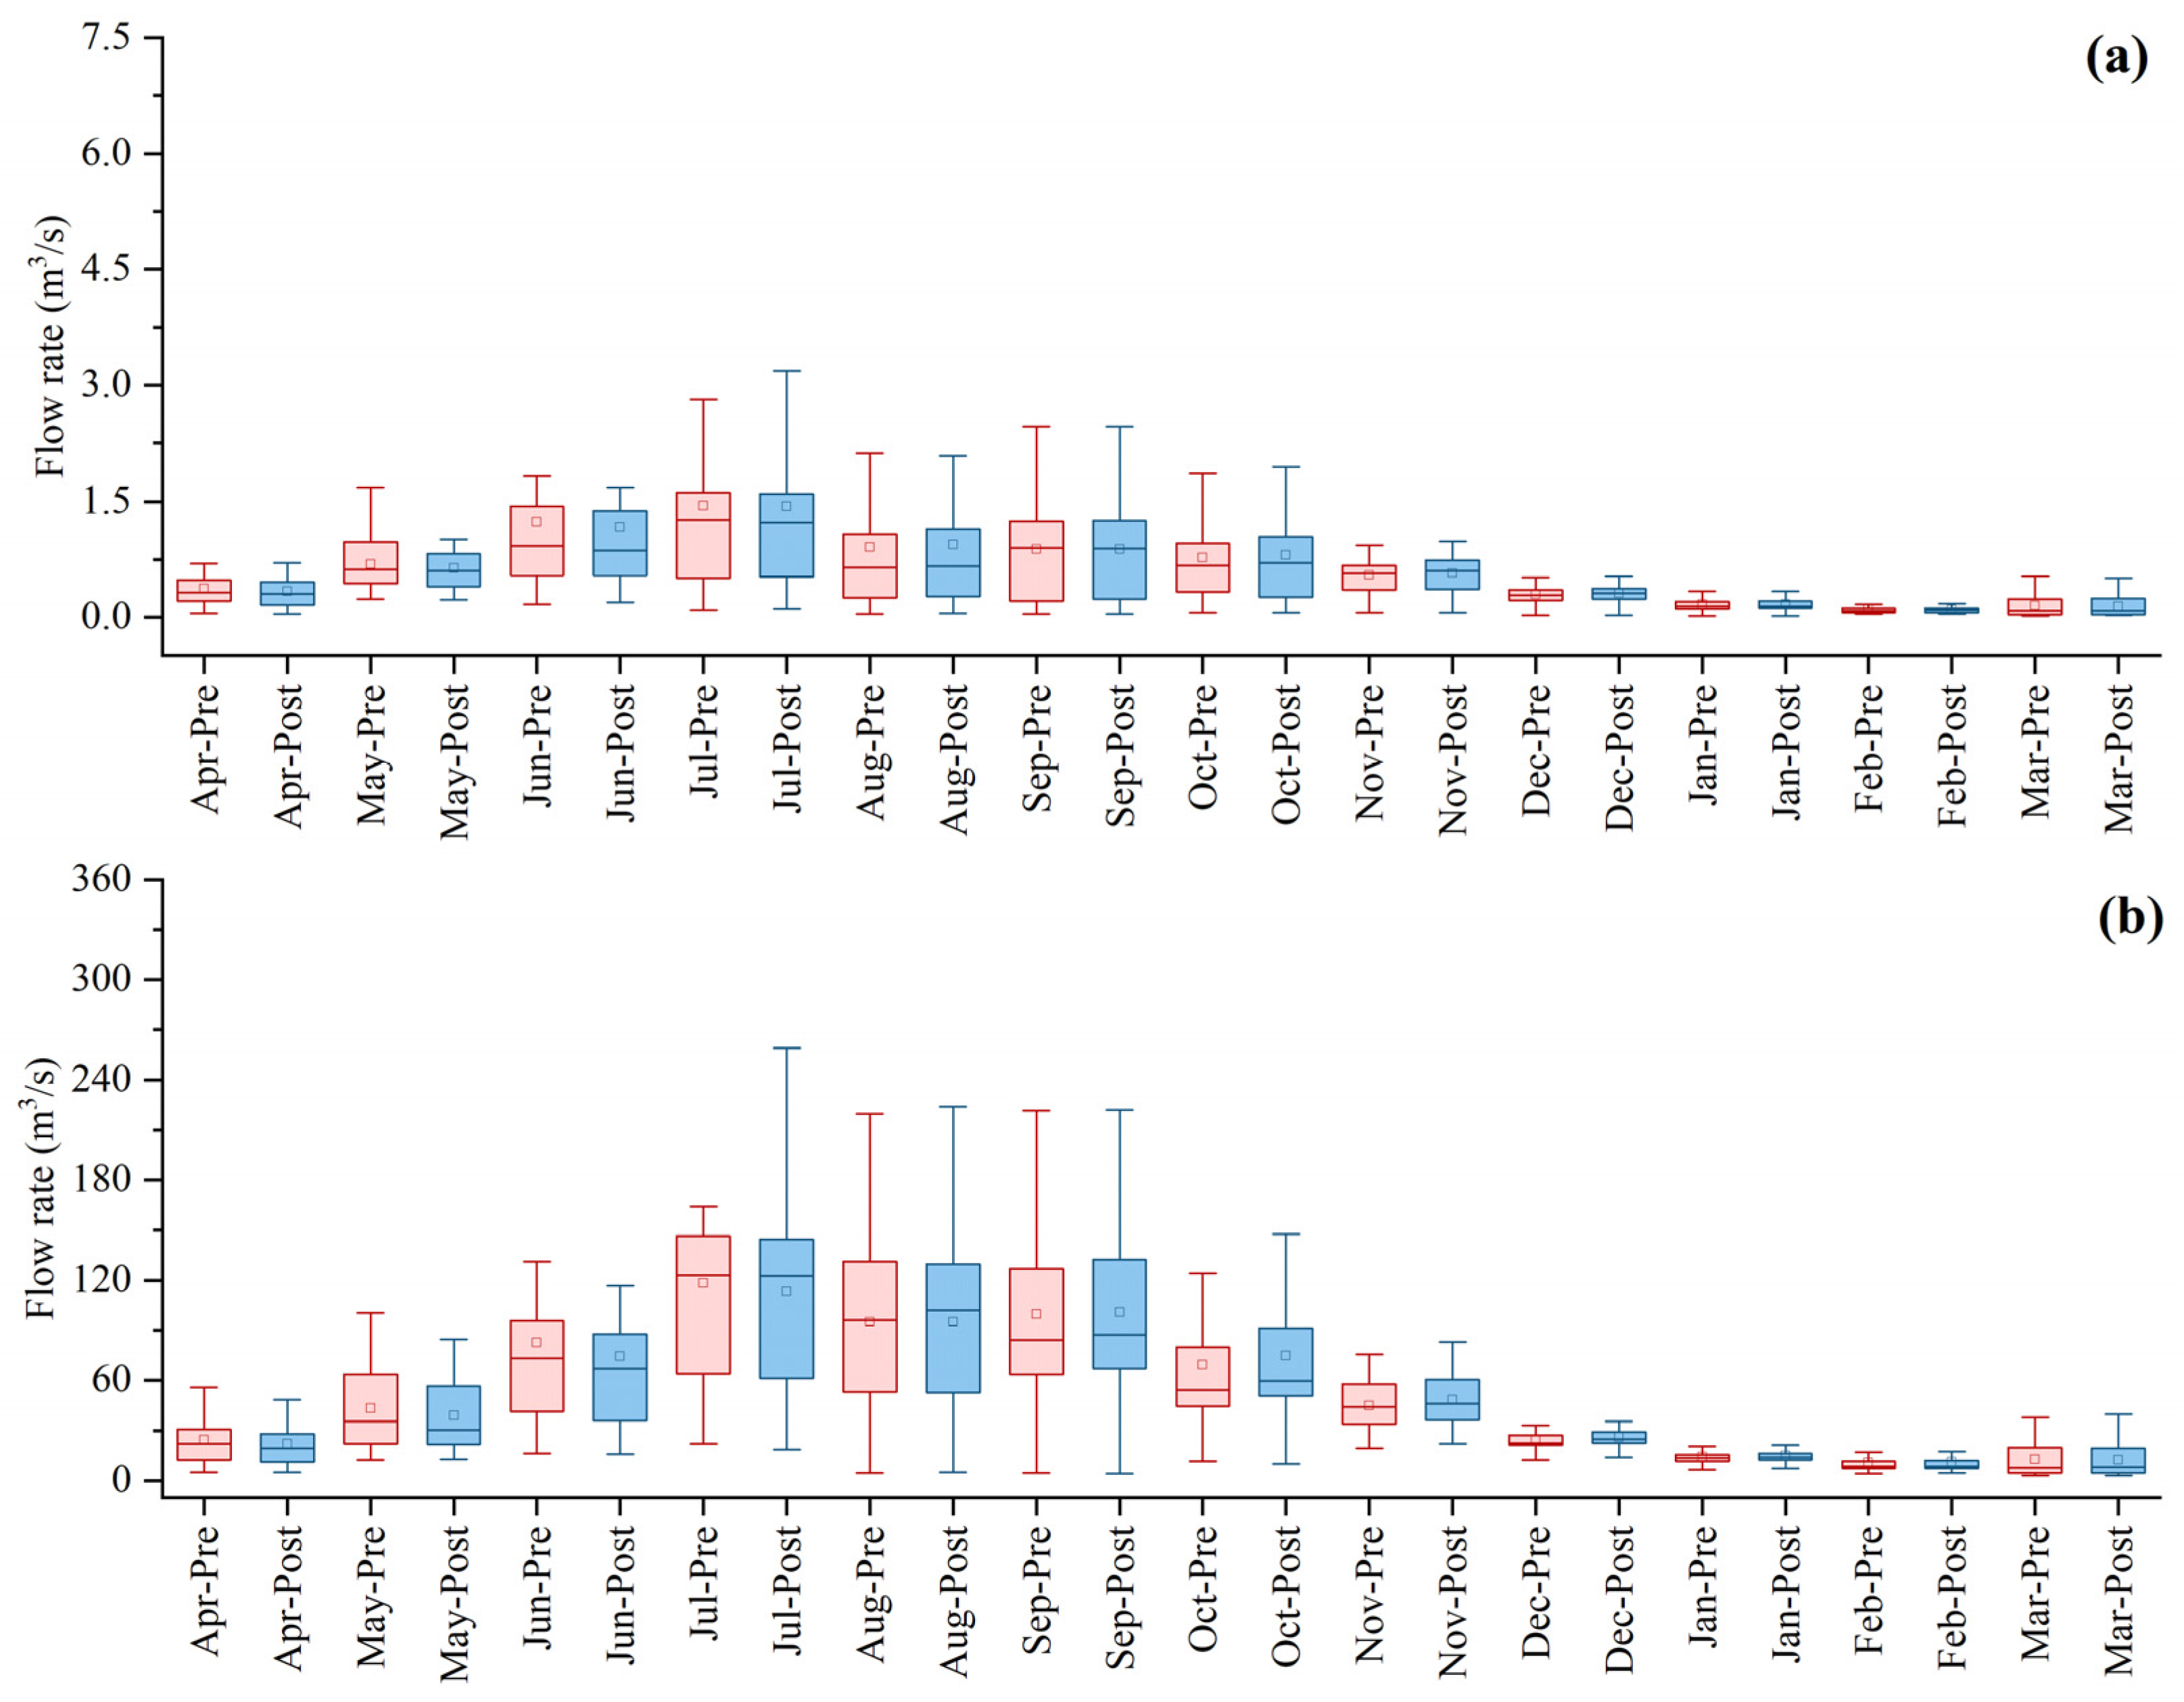
Figure 4 and Figure 5a show the monthly streamflow alteration of the GSXD and WO cross-sections. Comparing the hydrographs obtained with and without terraces revealed a substantial impact of the terrace changes on the streamflow in the LRB. During the years from 2000 to 2020, terraces led to an overall decreasing trend in annual flow. The decrease in watershed runoff was largely within the range of less than 2%. The distribution trends at a monthly scale appeared similar in scenarios both with and without terraces. Under the influence of terraces, there was a noticeable decrease in streamflow from March to July. Specifically, at the GSXD and WO cross-sections, the streamflow reductions from March to July ranged from 0.57% to 8.69% and from 0.41% to 10.04%, respectively. Notably, from April to June, there was a decrease in flow of approximately 10.00% at the WO section. From October to December, there was a clear upward trend, with the GSXD and WO cross-sections showing increases ranging from 4.76% to 8.10%. Both the reductions and increases at the WO cross-section were noticeably greater than at the GSXD cross-section. It is worth noting that, in September, the GSXD cross-section experienced a decrease in monthly average flow, whereas the WO cross-section exhibited an increasing trend.
3.1.2. Extreme Streamflow Alteration
The extreme streamflow alterations relative to the terrace interventions are illustrated in Figure 5b and Figure 6. The indicators related to minimum flow (I13–I17) showed an overall increasing trend, with variations ranging from −1.15% to 6.56% and from 0.60% to 5.84% at the GSXD and WO cross-sections, respectively. The most significant increases were observed in the 1d min indicator at the GSXD cross-section and the 3d min indicator at the WO cross-section, at 6.56% and 5.84%, respectively. The impact on the 90d min indicator at the WO cross-section was relatively minor, as it only increased by 0.60% under the influence of terraces. All indicators related to maximum flow (I18–I22) exhibited a clear decreasing trend, with changes ranging from −10.43% to −1.48% and from −15.25% to −3.01% at the GSXD and WO cross-sections, respectively. The most significant reduction effects were observed in the 1d max indicator at the GSXD section (10.43%) and the WO section (15.25%). Terraces exhibited more pronounced increases in the minimum-flow-related indicators for the GXSD cross-section compared to the WO cross-section. However, for the reduction effects on the maximum-flow-related indicators, the trend was reversed, with a greater impact observed at the WO section.
Under the influence of terraces, the means of the base flow index at the GSXD and WO cross-sections from 2000 to 2020, as well as the BFI values for some years, showed a clear upward trend (Figure 7). Between 2000 and 2020, the base flow index for the GSXD and WO cross-sections changed from 0.01–0.12 to 0.01–0.14 and from 0.03–0.16 to 0.04–0.18, respectively. The means of the base flow index at the GSXD and WO sections increased by 0.004 and 0.006 to 0.06 and 0.09, respectively. The maximum values of the base flow index for both cross-sections increased by 0.02. The number of years in which the downstream WO cross-section fell within the RVA threshold values was generally higher than that of the GSXD cross-section. Additionally, the base flow index and its increase were notably superior in the downstream compared to the upstream. At the GSXD cross-section, the base flow index approached the low RVA boundary for four years. Under the influence of terraces, the GSXD and WO cross-sections exceeded the high RVA boundary in 2001 and 2018, respectively.
3.1.3. Annual Extreme Flow Time Alteration
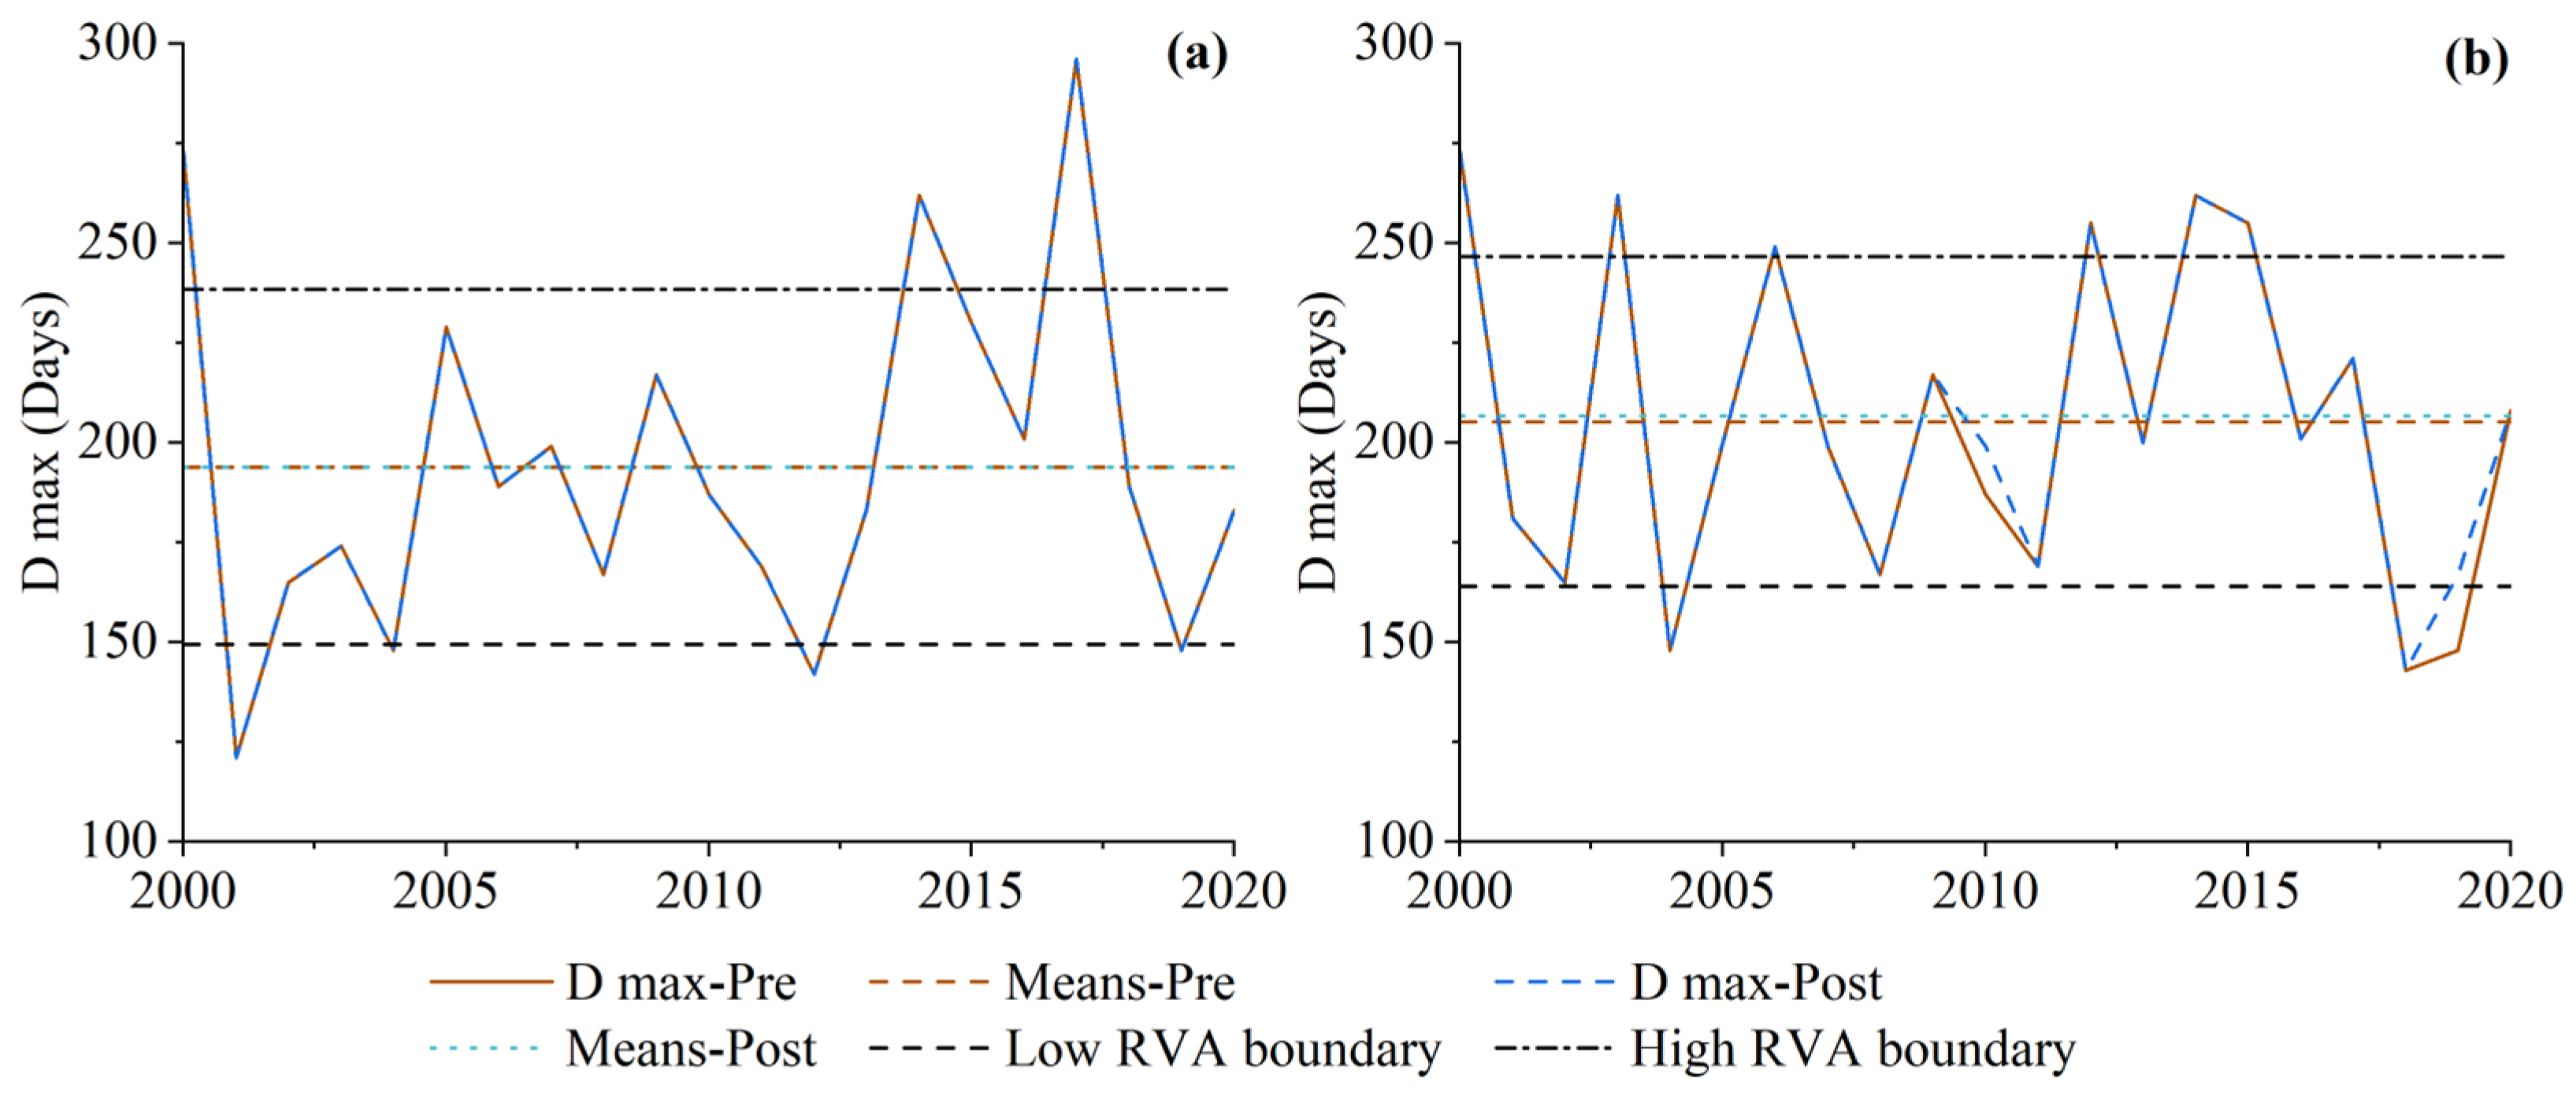
Figure 8 and Figure 9 show the annual extreme flow time at the GSXD and WO cross-sections. From 2000 to 2020, terraces had a relatively minor impact on the dates of annual extreme flow. The GSXD cross-section exhibited greater variability in the dates of both the minimum and maximum flow compared to the WO cross-section. The mean values of D min and D max for the WO cross-section exhibited a slight upward trend (1.5 days), while there was no significant change in the GSXD cross-section. The date of the minimum flow at the watershed outlet section was delayed by 9 days in 2014, while the date of the maximum flow was delayed by 12 days in 2010 and by 19 days in 2019. Moreover, in 2019, the date of the maximum flow transitioned from being outside the low RVA boundary to within the RVA threshold range.
3.1.4. Pulses and Patterns of Streamflow Alterations
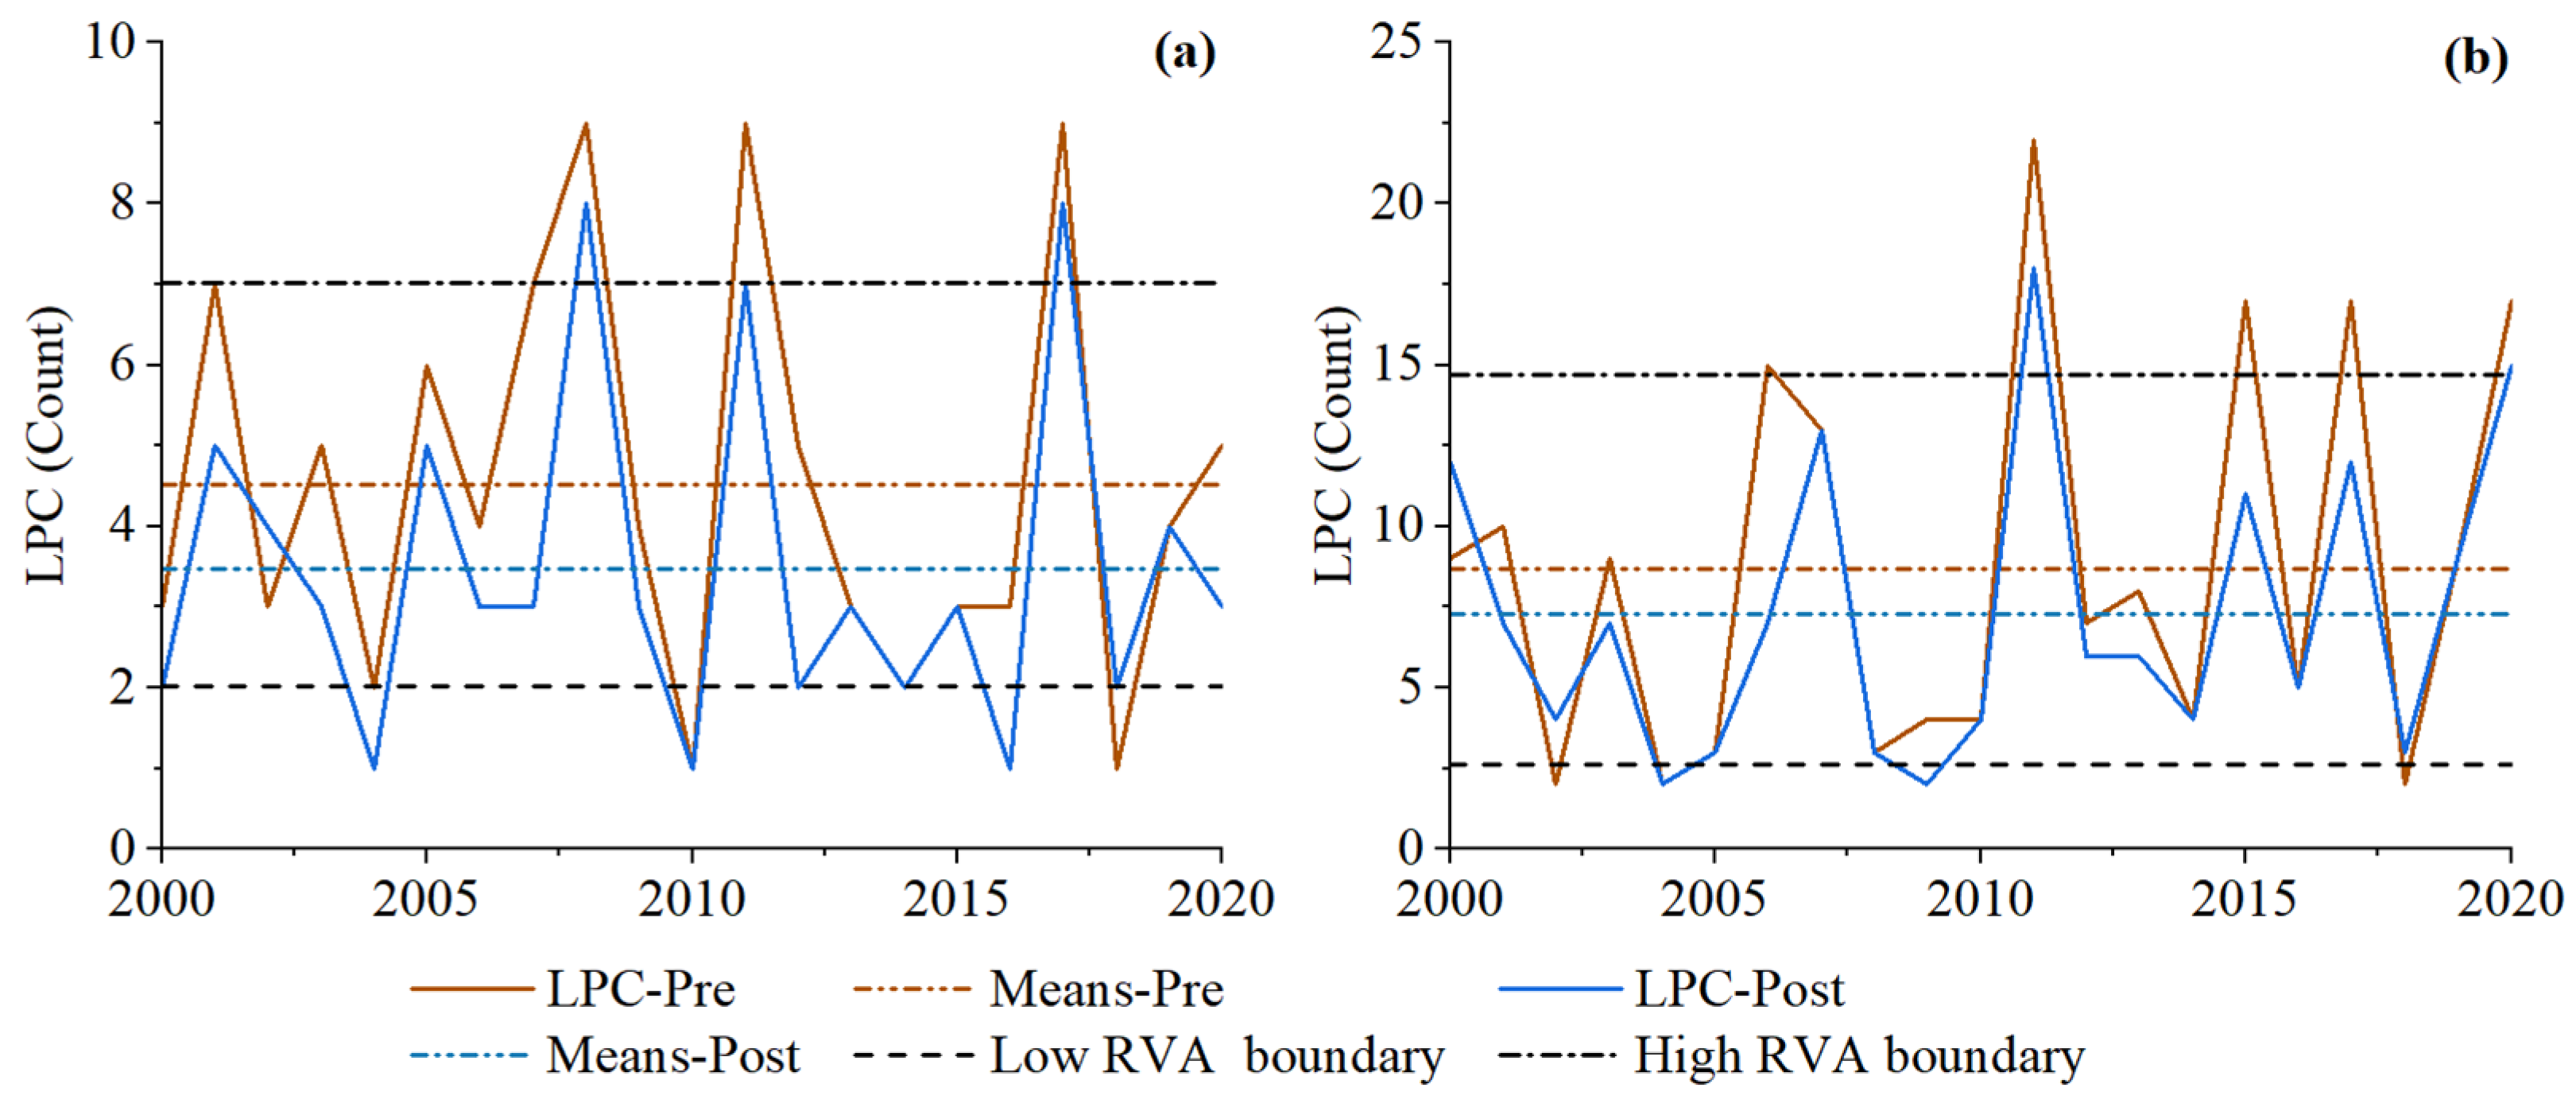
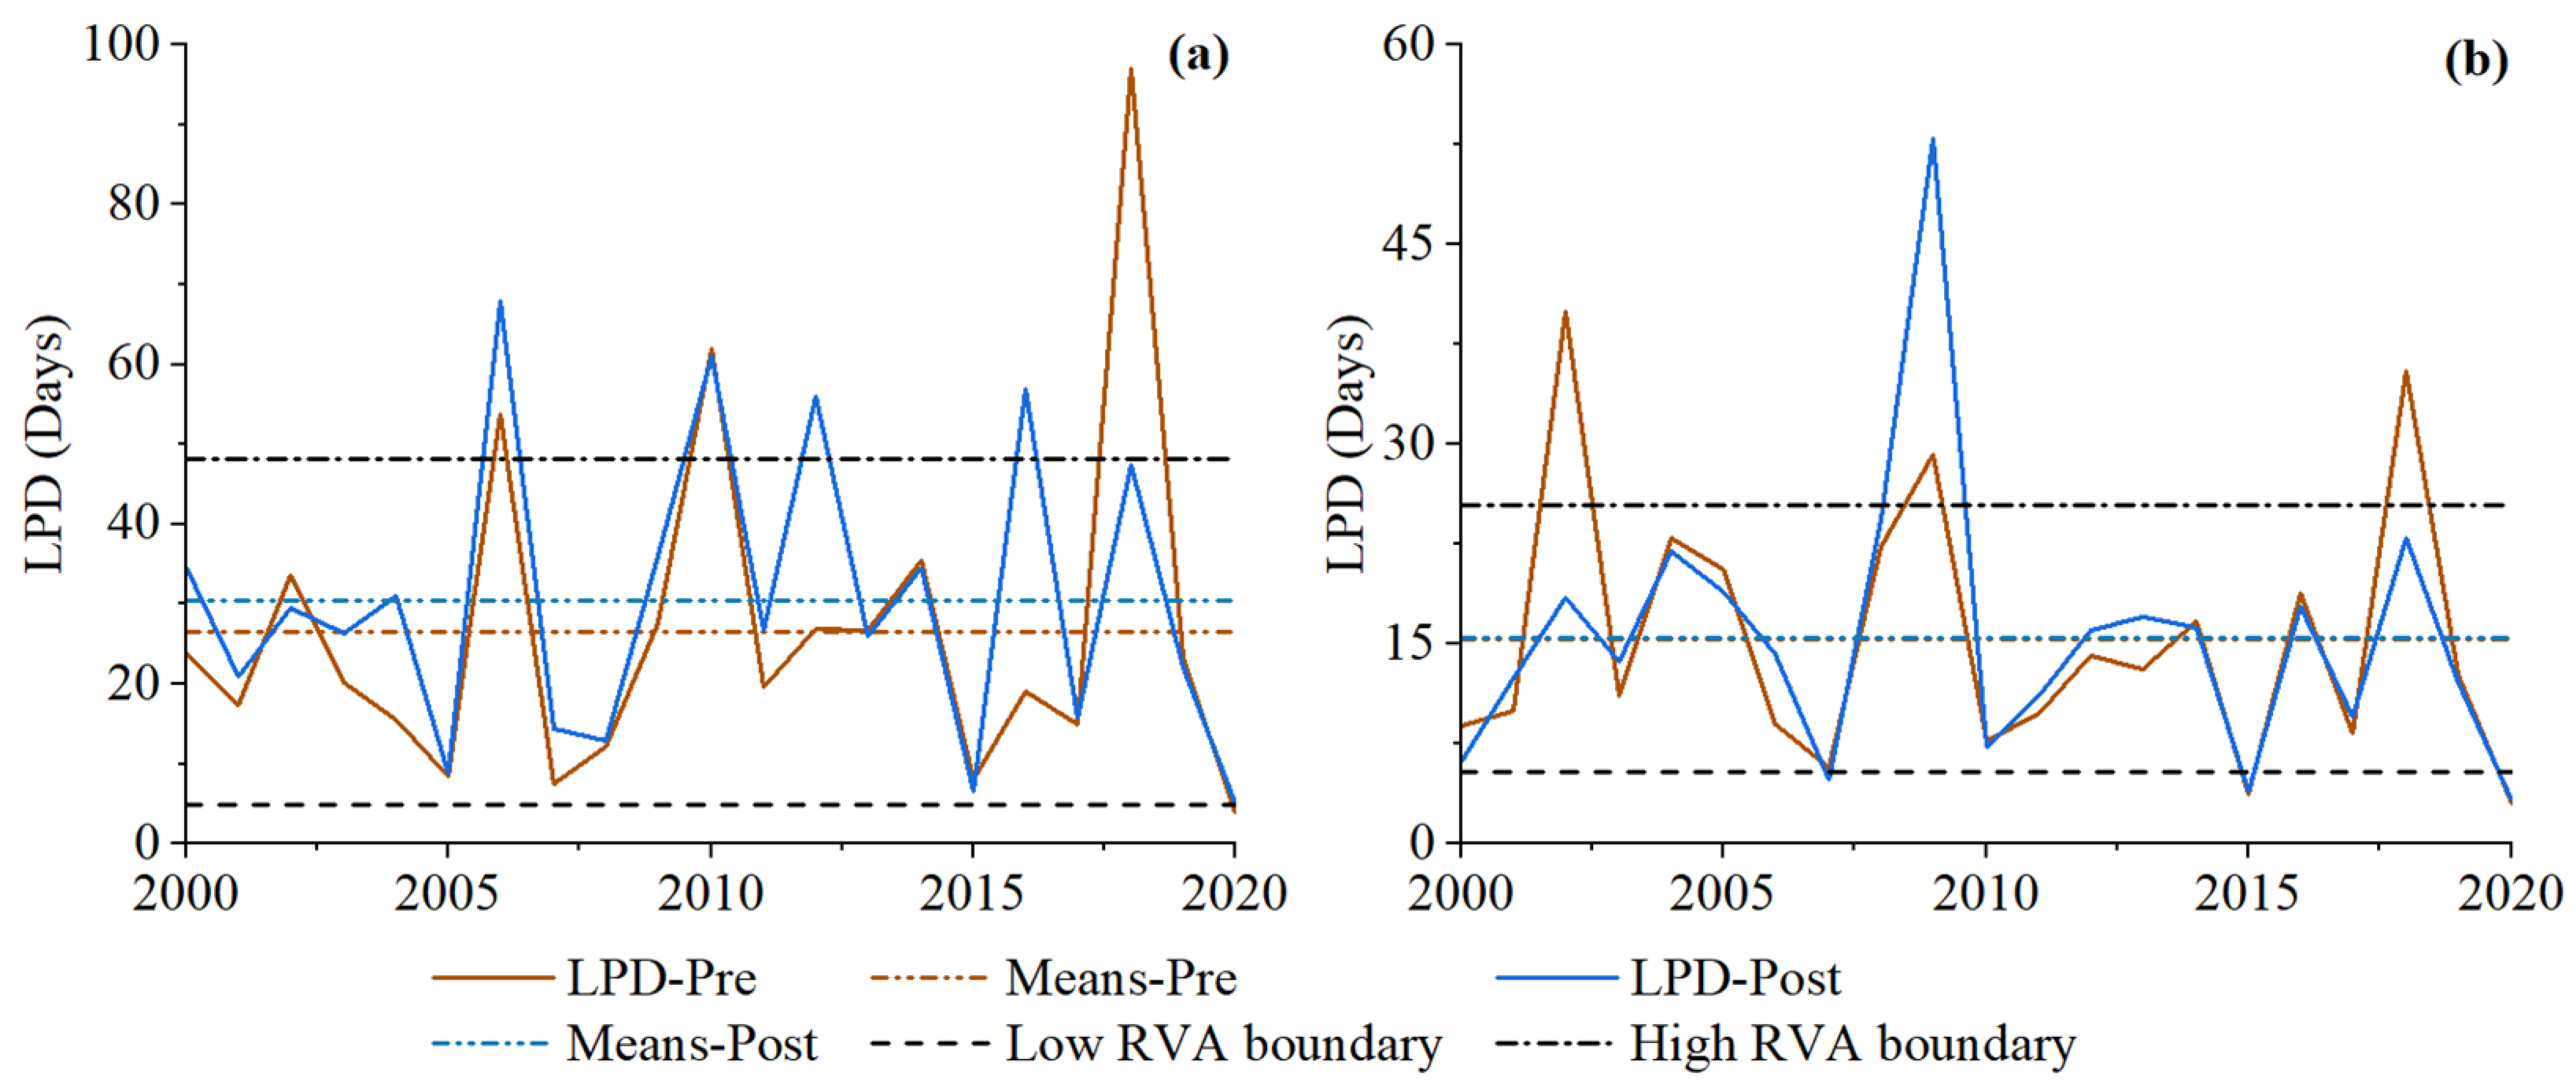
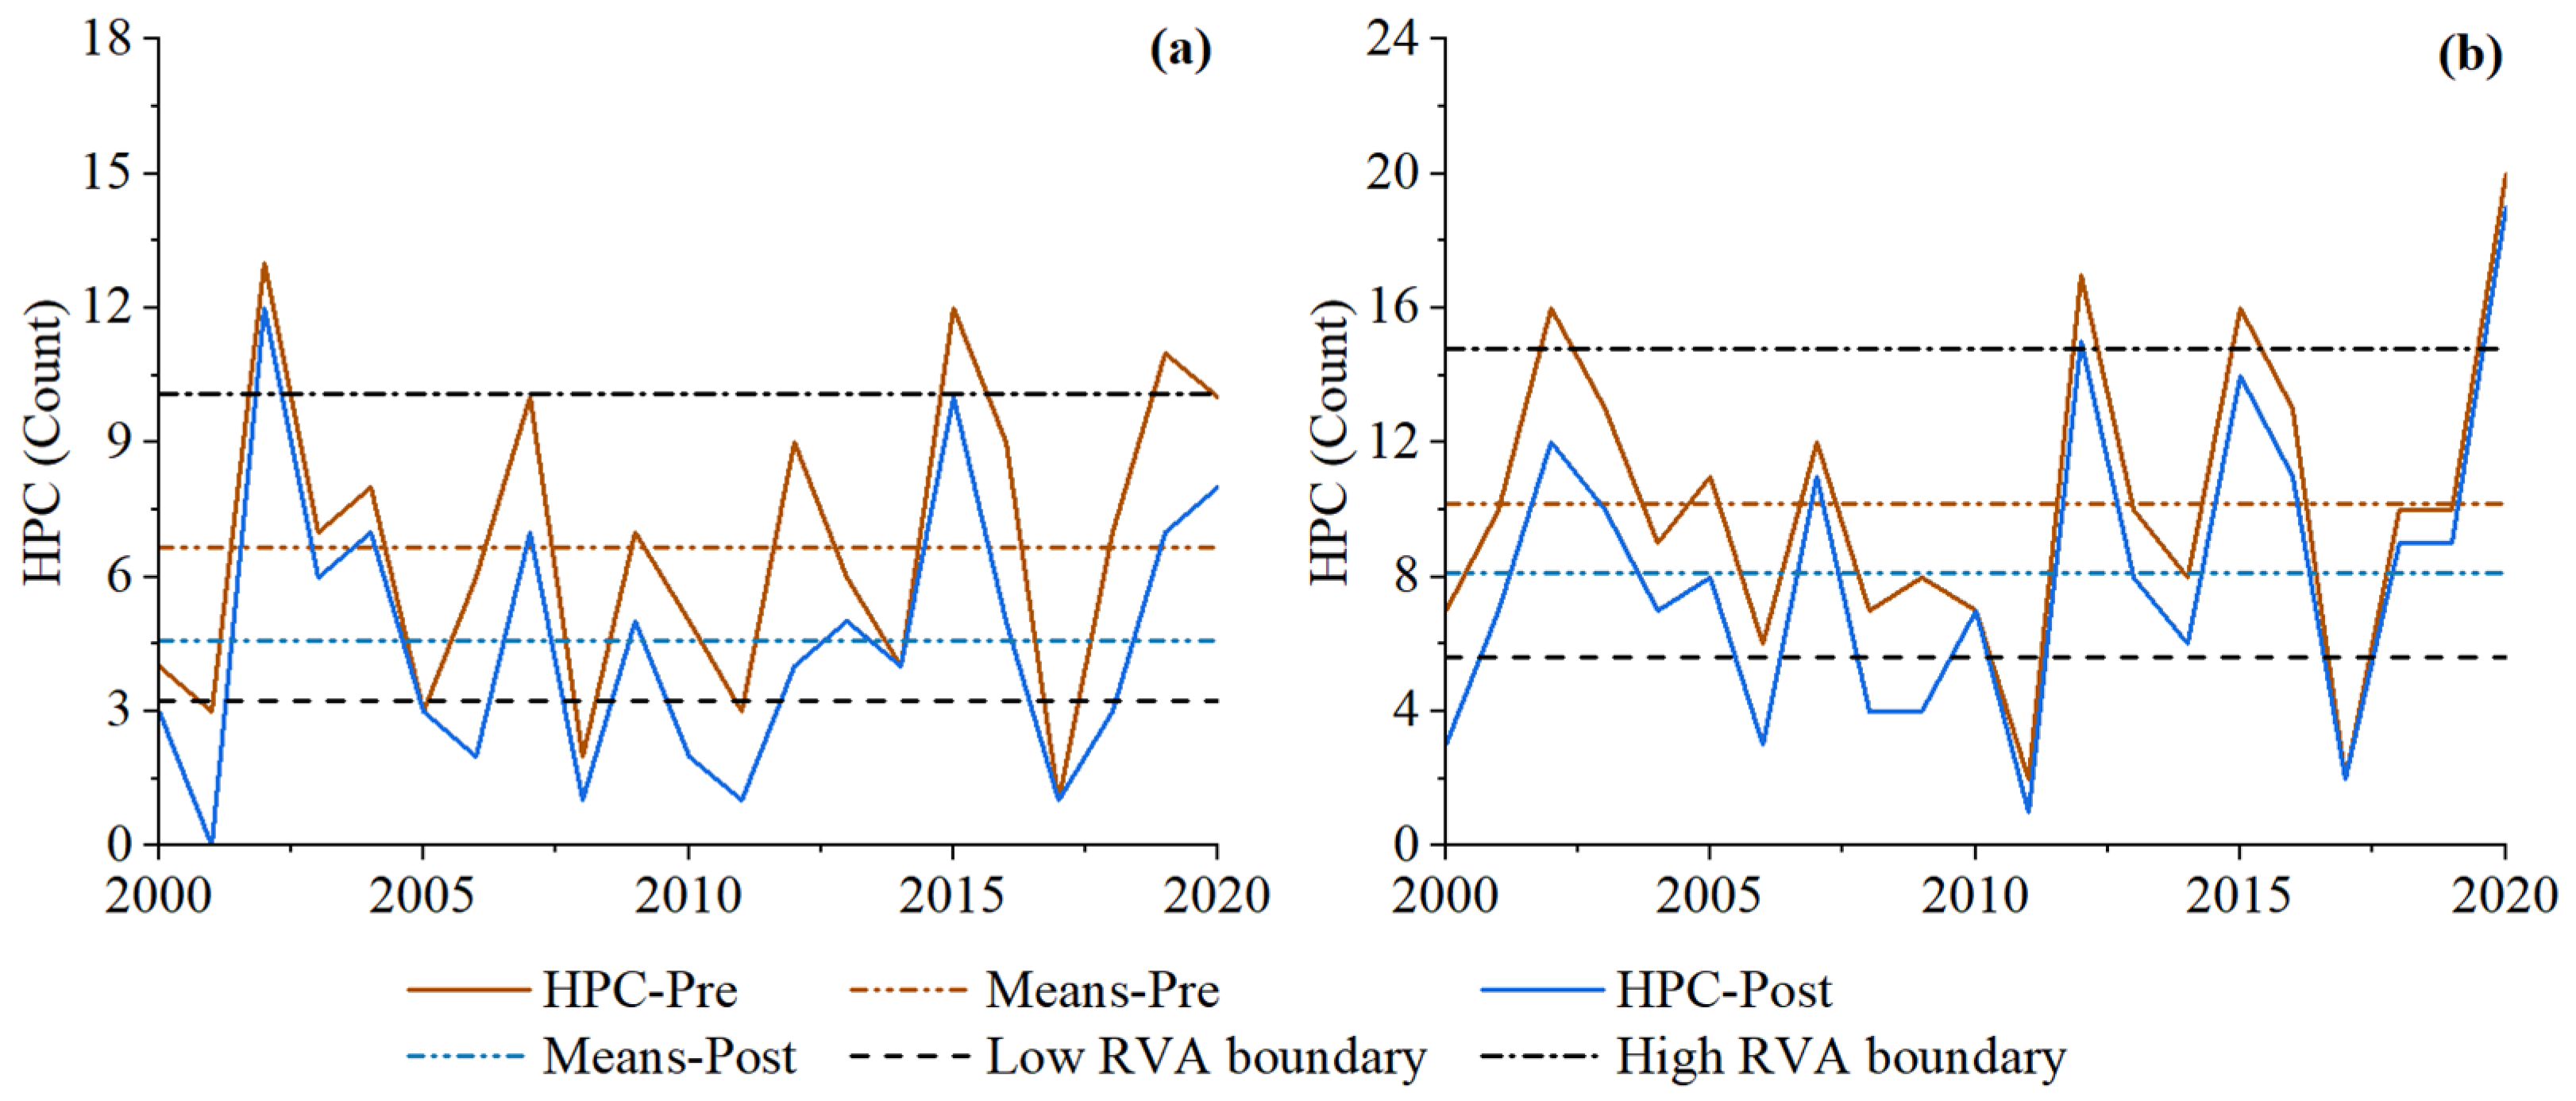
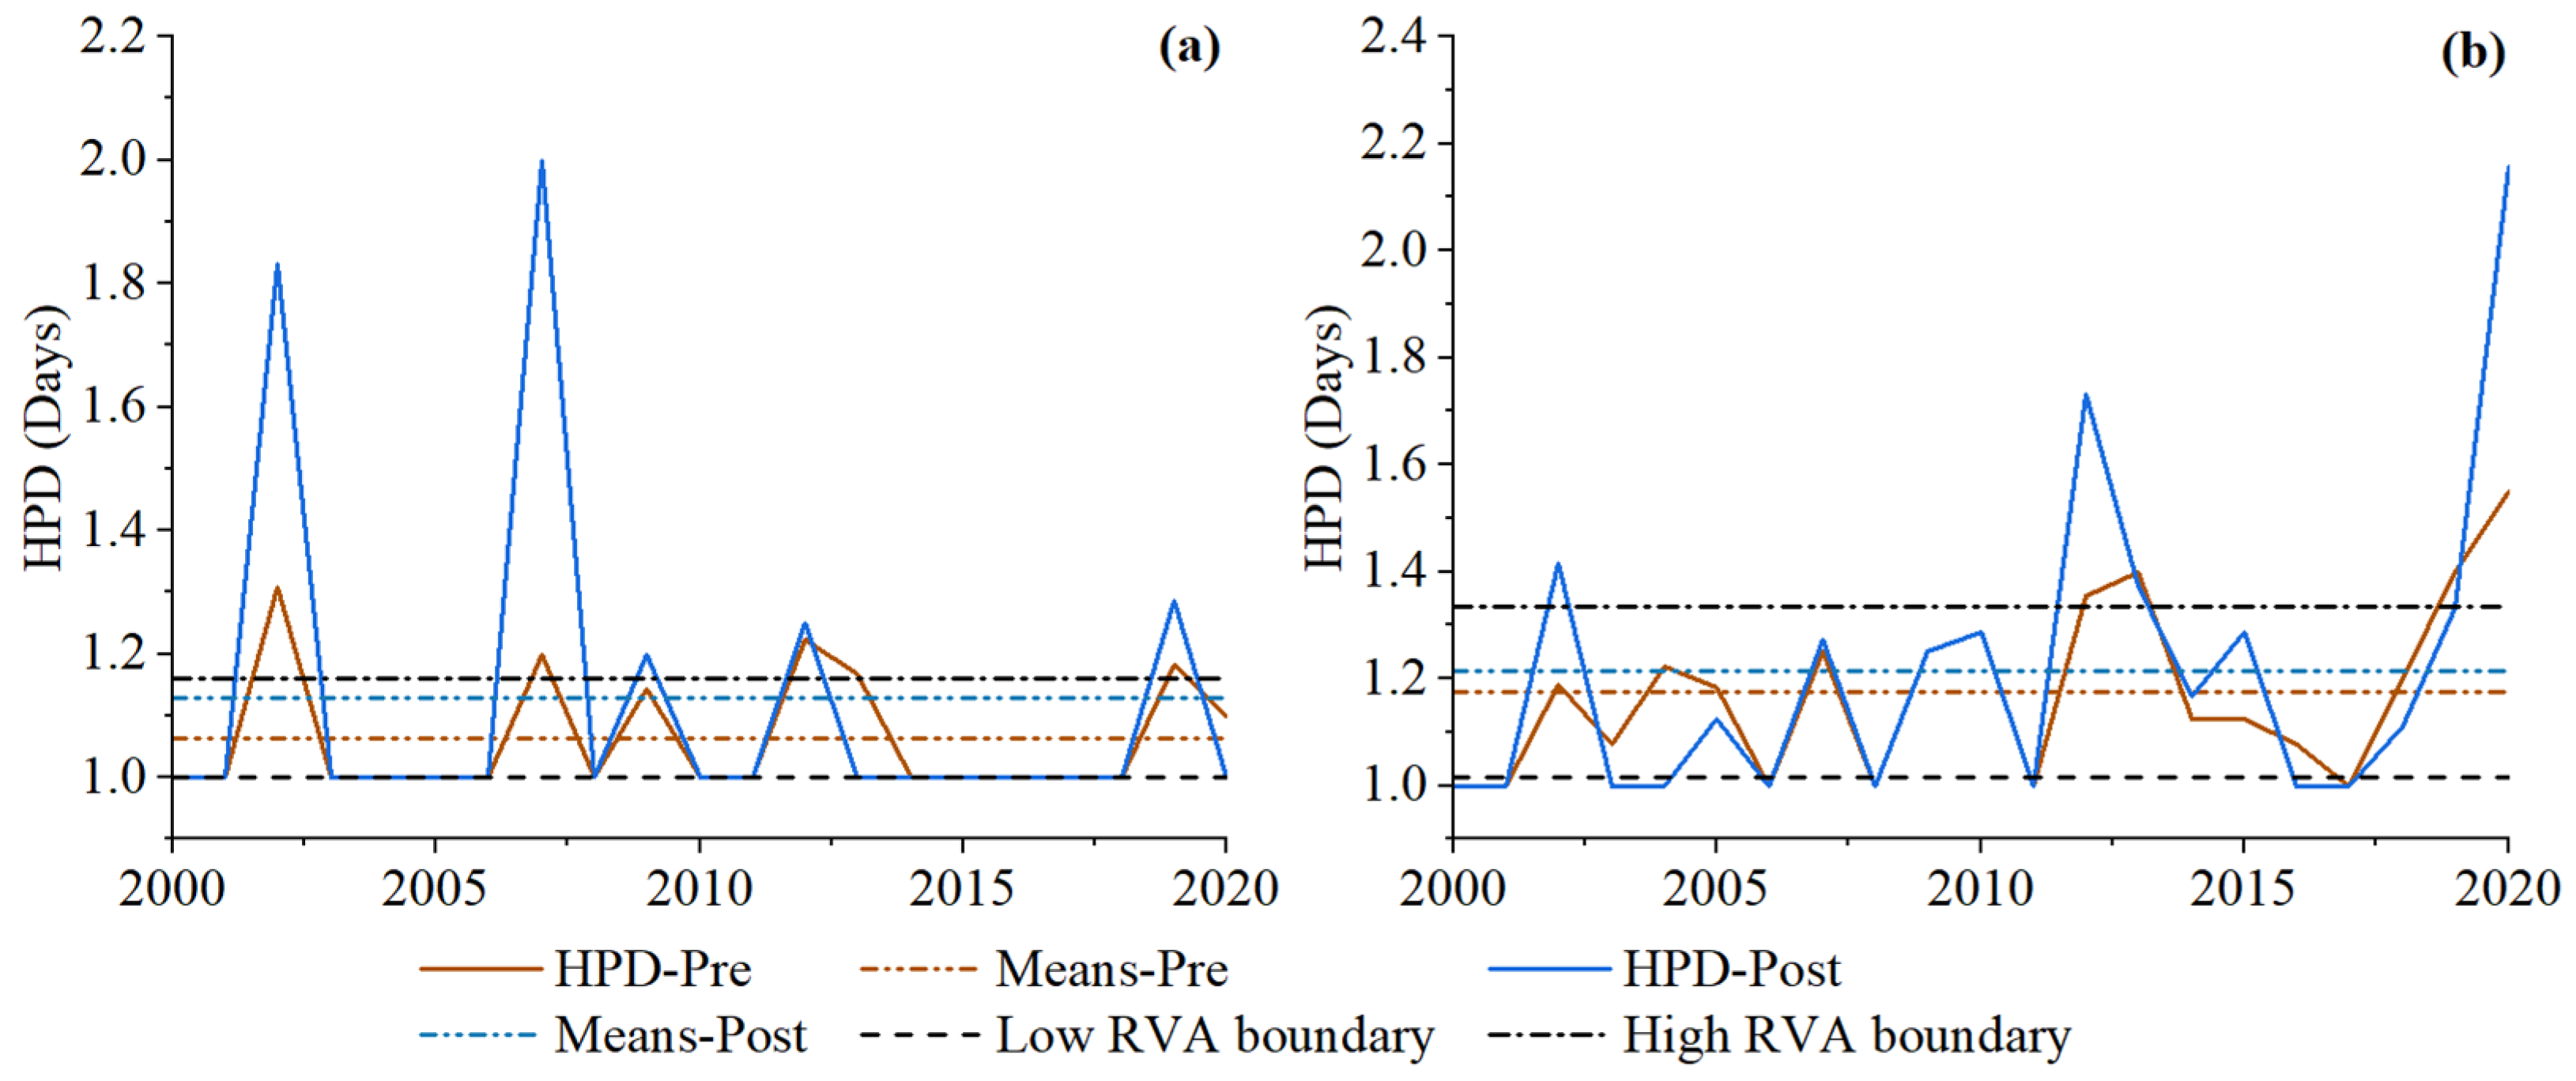
The variations in low and high pulse counts and durations are shown in Figure 10, Figure 11, Figure 12 and Figure 13. Within a hydrological year, flow rates exceeding the 75th percentile were categorized as high-flow, while those falling below the 75th percentile were classified as low-flow. Under the influence of terraces, the frequency of both high and low flow counts in the Laixi River decreased overall. At the GSXD and WO cross-sections, the means of LPC decreased by 1.05 and 1.38 counts, representing reductions of 23.16% and 15.93%, respectively. The means of HPC both decreased by 2.10 counts, representing reductions of 31.43% and 20.56%, respectively. At the GSXD cross-section, both LPD and HPD increased, whereas in the WO section, there were instances of both increases and decreases in pulse duration. The means of LPD at the WO cross-section showed an inconspicuous trend, with only a slight increase of 0.09 days, representing a minimal increase of 0.60%. At the GSXD cross-section, there was an increase of 3.98 days, marking a substantial rise of 14.99% in LPD. At the WO cross-section, the maximum increase in LPD occurred in 2009, reaching 23.75 days. The most significant decreases were observed in 2002 and 2018, with reductions of 21.5 and 12.5 days, respectively. The means of HPD at the GSXD and WO cross-sections increased by 6.17% and 3.36%, reaching 1.13 and 1.22 days, respectively. The increase in HPD was notably greater than the decrease, with the highest increase occurring in 2007 at the GSXD cross-section, reaching 66.67%, while the largest decrease was observed in 2004 at the WO section, amounting to 18.17%.
3.1.5. Rates and Probability of Flow Alterations
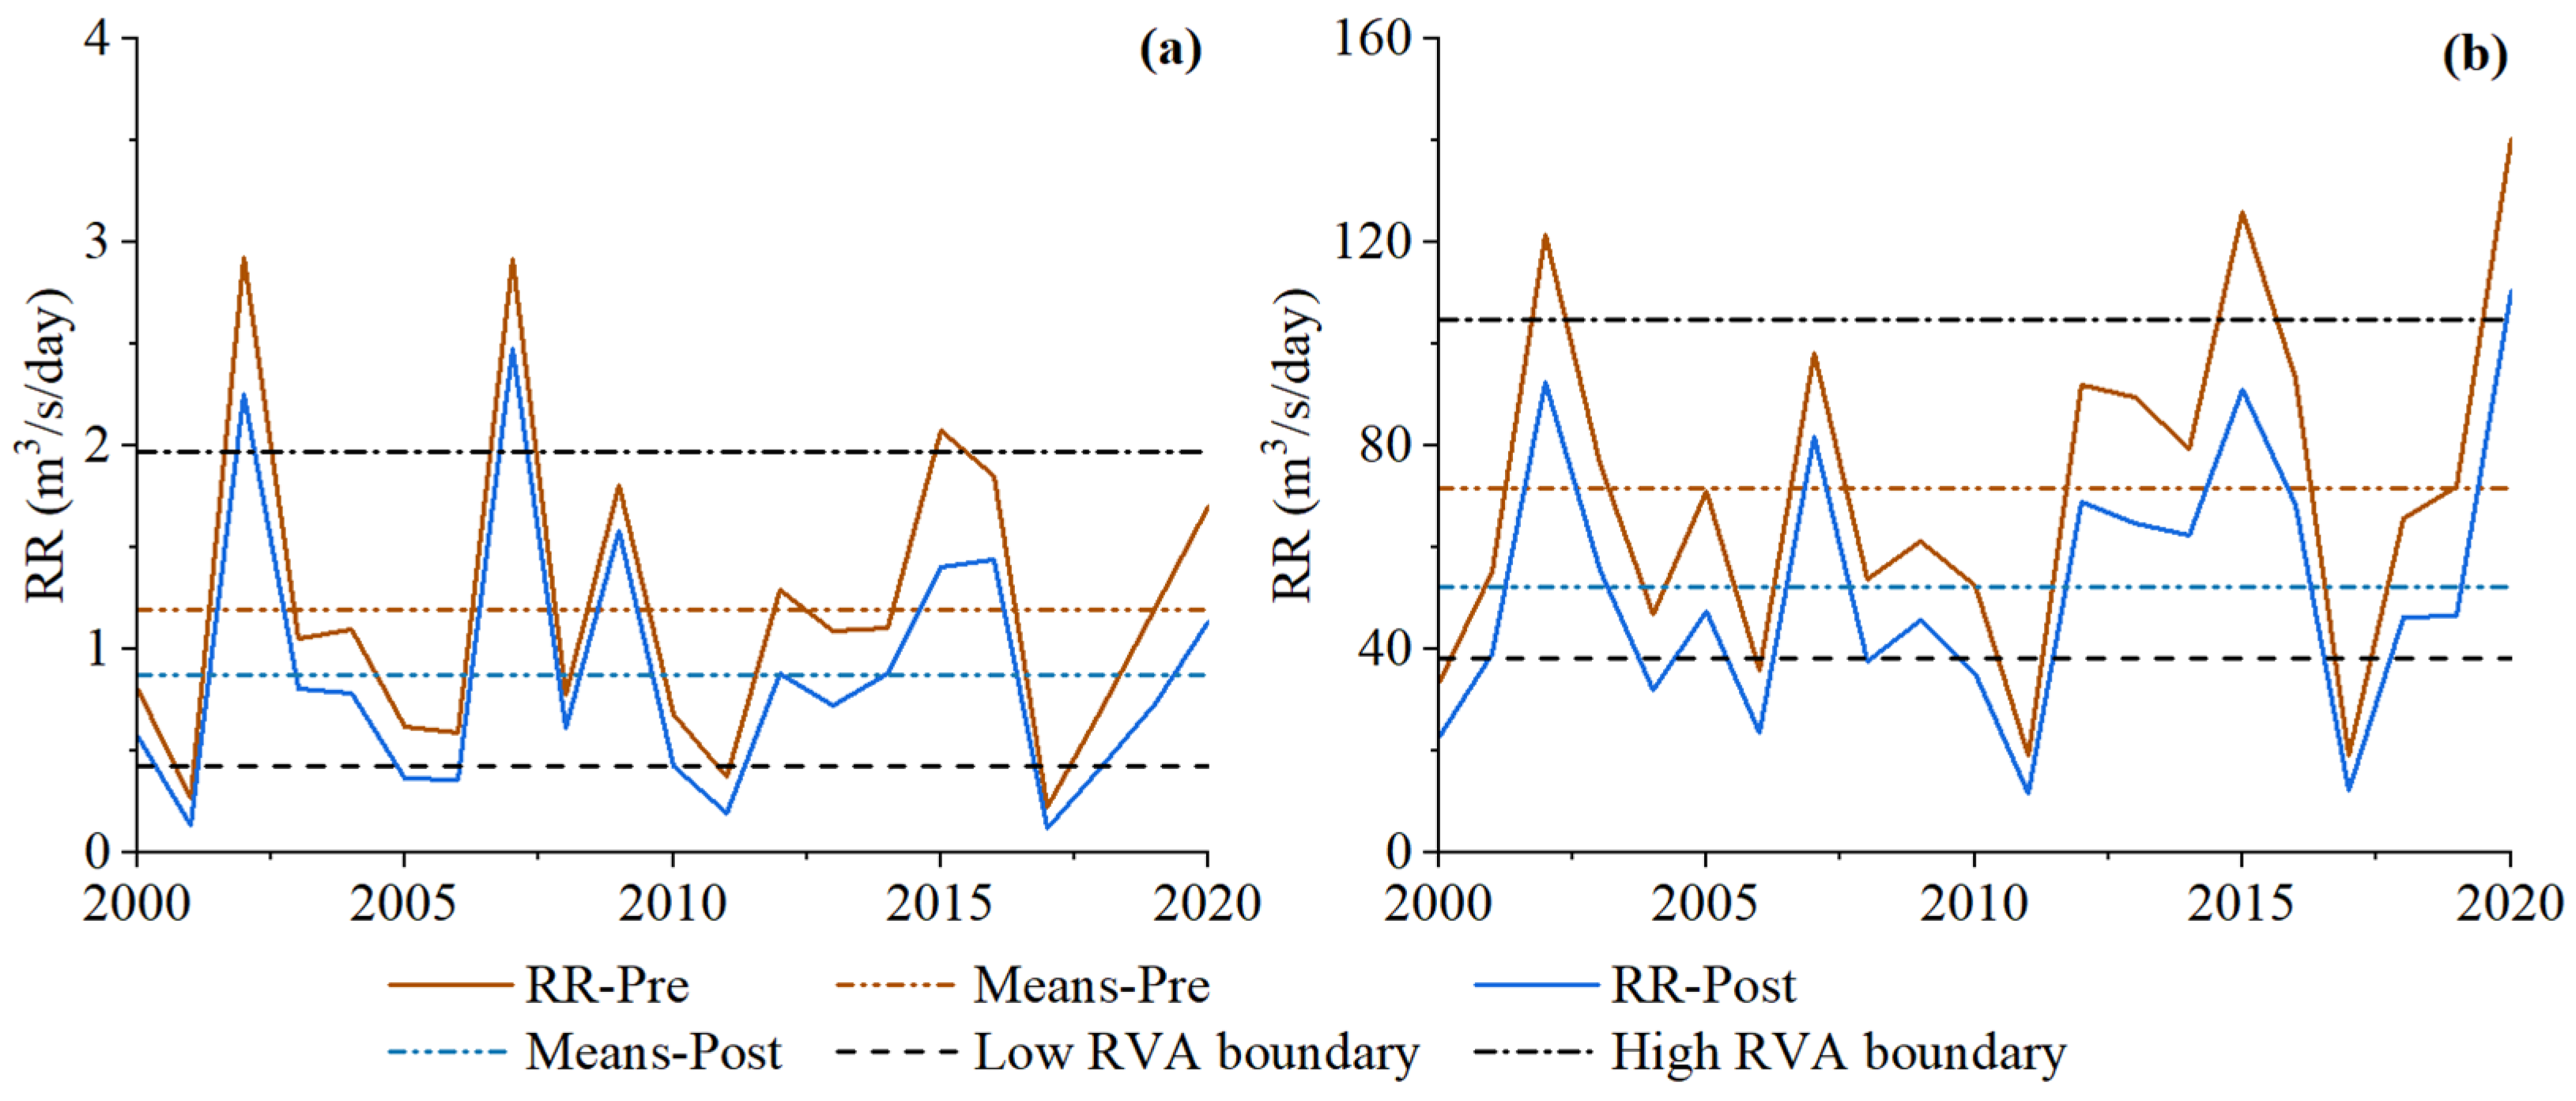
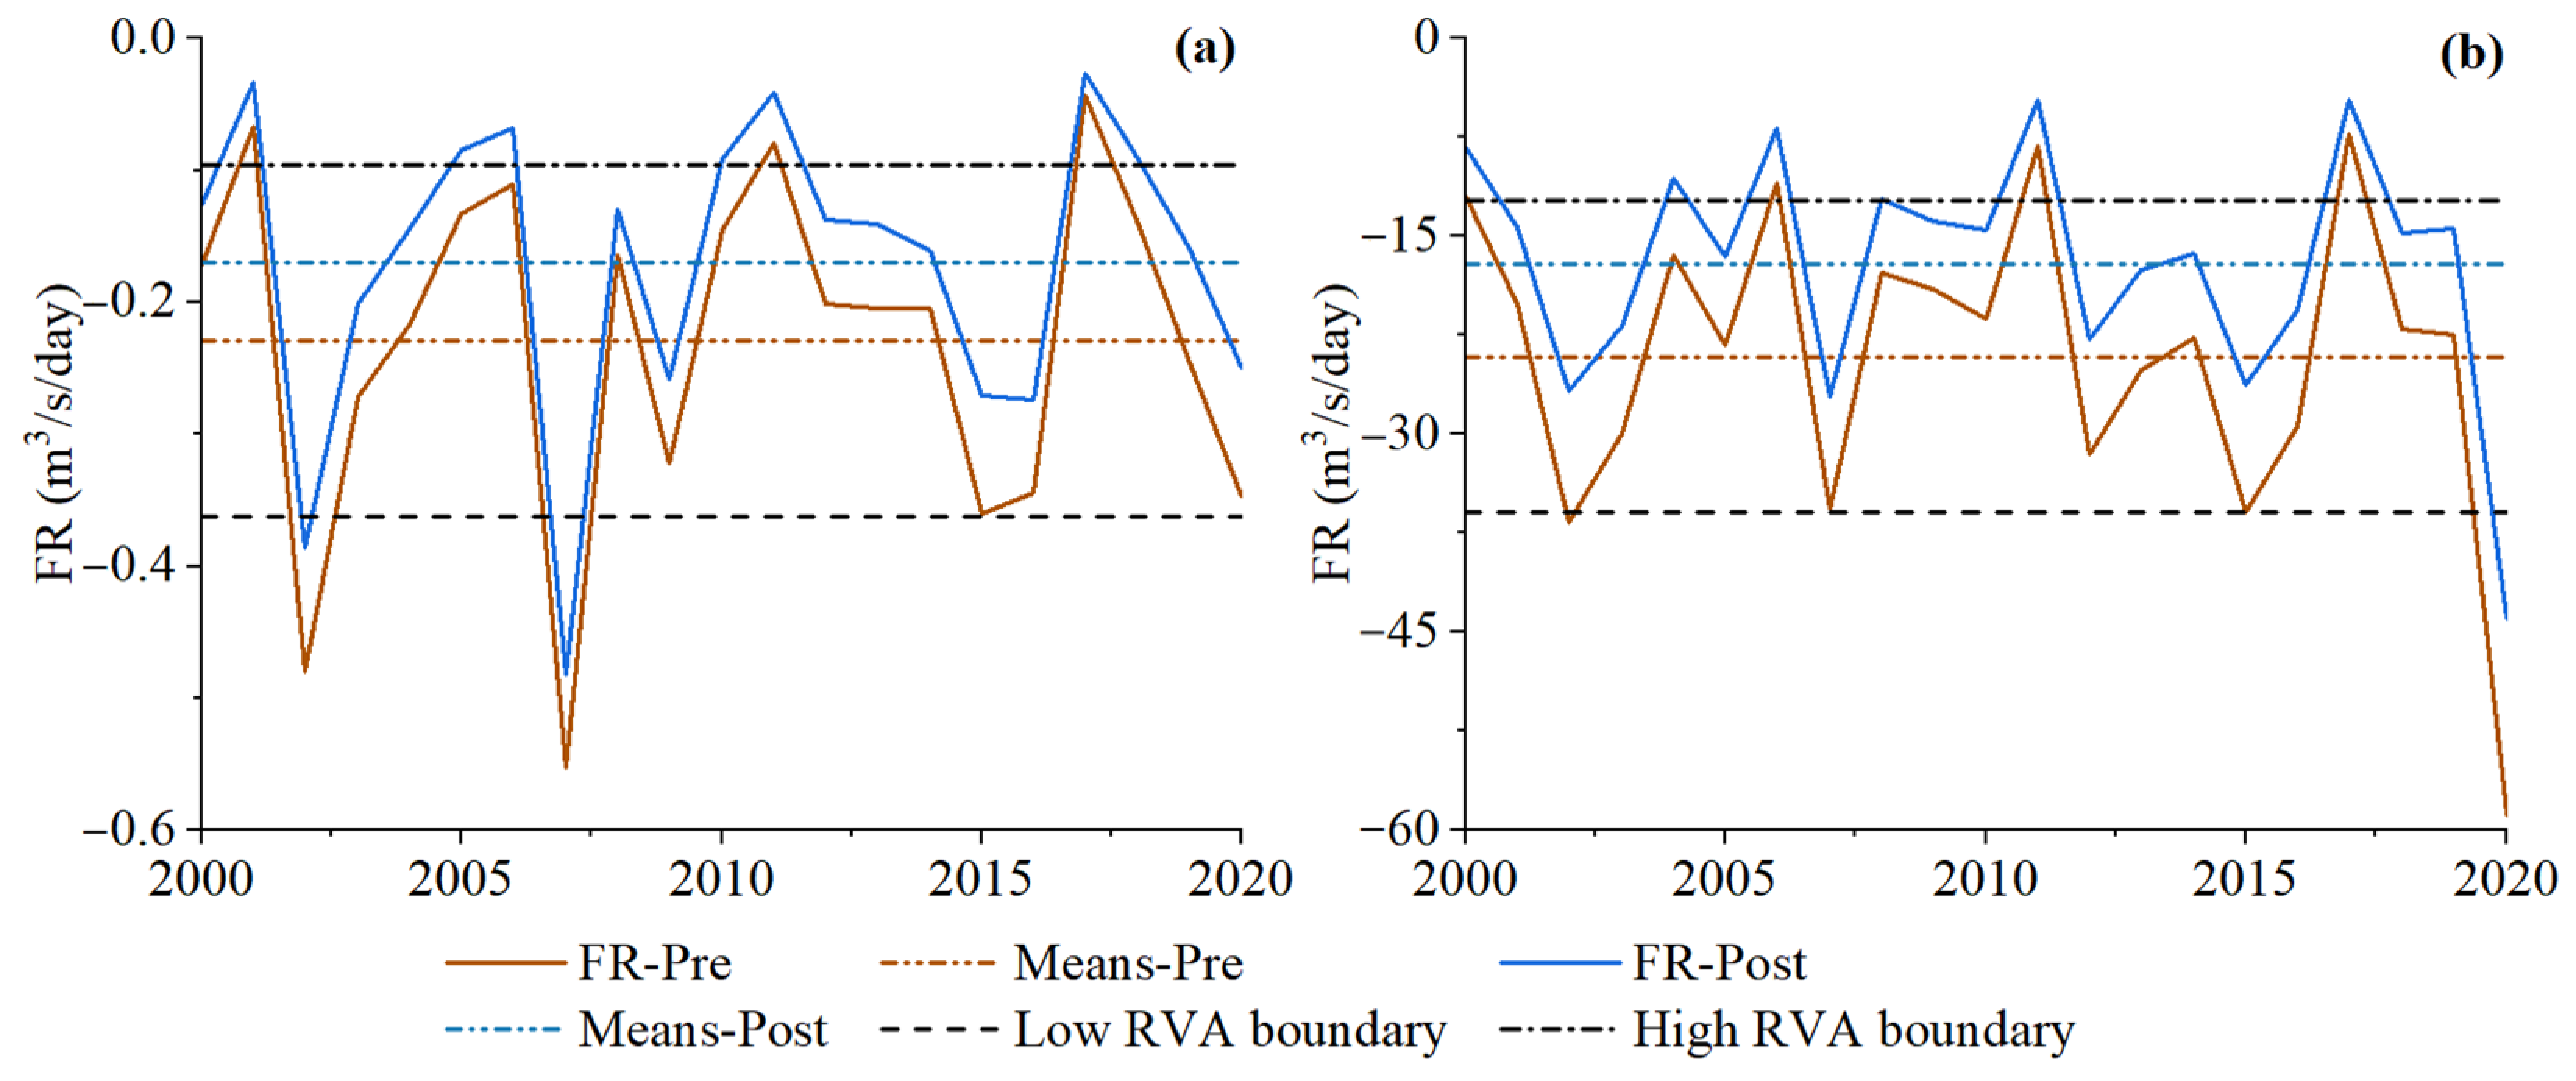
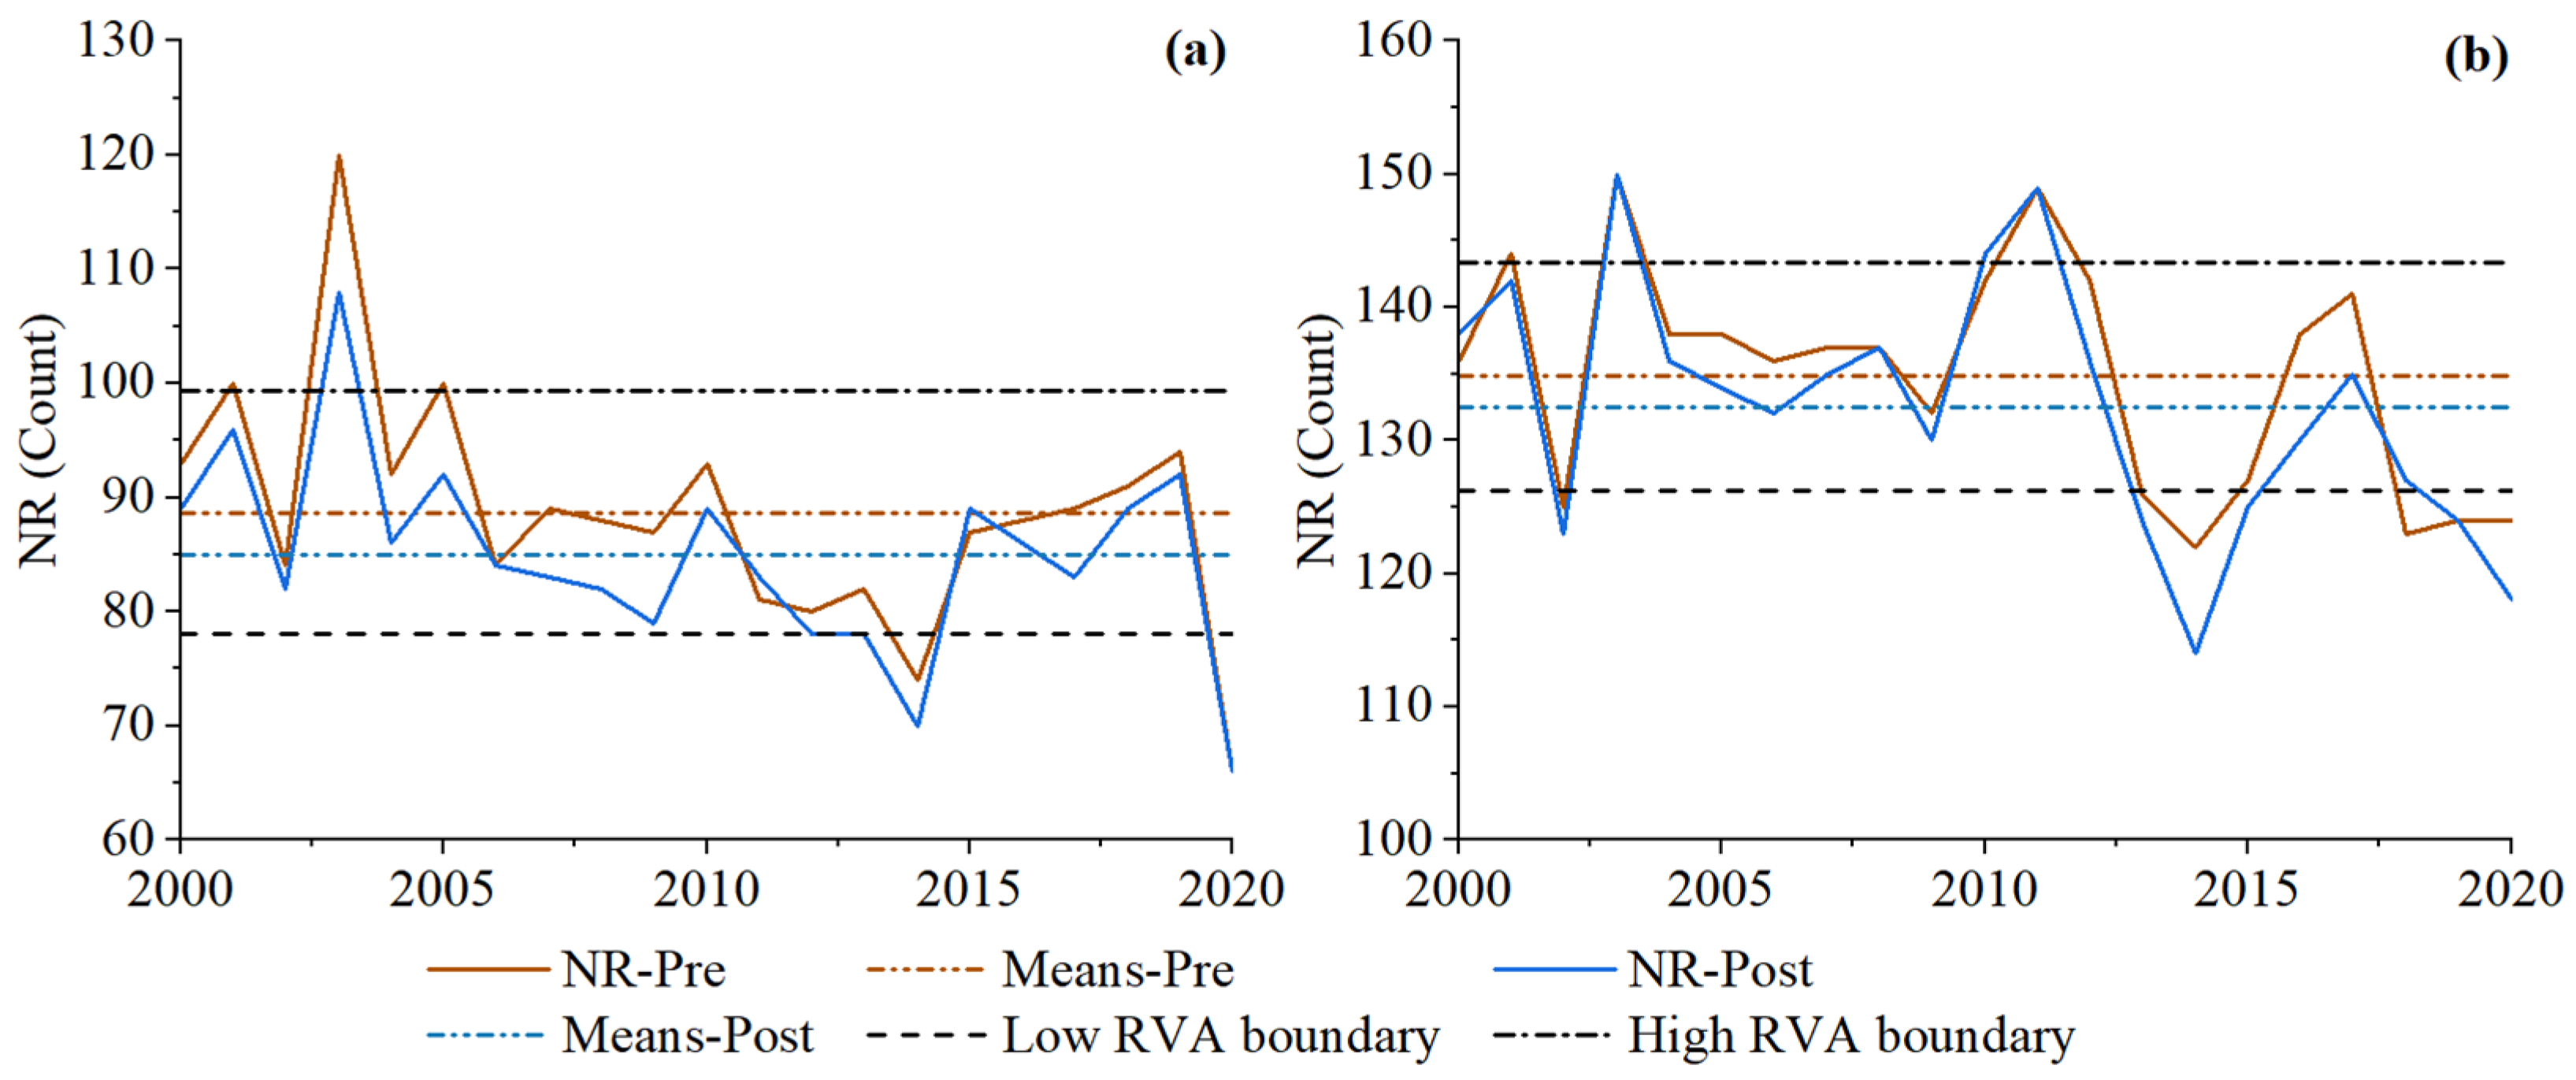
As presented in Figure 14, Figure 15 and Figure 16, at the GSXD and WO cross-sections, the RR exhibited a noticeable decreasing trend, while the FR demonstrated a significant rising trend. The overall trend for the NR also showed a decrease, with only a few years exhibiting minor increases. At the GSXD cross-section, the ranges of the RR, FR, and NR changed from 0.23–2.93 m3/s/day to 0.12–2.48 m3/s/day, from −0.55–−0.04 m3/s/day to −0.48–−0.03 m3/s/day, and from 66–120 counts to 66–108 counts, respectively; at the WO cross-section, they changed from 19.08–140.40 m3/s/day to 11.71–110.40 m3/s/day, from −58.82–−7.24 m3/s/day to −43.97–−4.67 m3/s/day, and from 122–150 counts to 114–150 counts, respectively. The means of the RR decreased by 27.16% to 0.87 m3/s/day, the means of the FR increased by 25.98% to 16.95 m3/s/day, and the means of the NR decreased by 4.19% to 84.95 counts. At the WO cross-section, they changed by 27.02% to 52.23 m3/s/day, 29.13% to 17.09 m3/s/day, and 1.70% to 132.5 counts, respectively. Under the influence of terraces, at the GSXD cross-section, the number of years in which the RR, FR, and NR exceeded the RVA thresholds was notably higher than at the WO cross-section. Furthermore, the variation in these indicators at the WO cross-section exhibited a smoother trend from 2000 to 2020.
3.2. Hydrologic Alteration
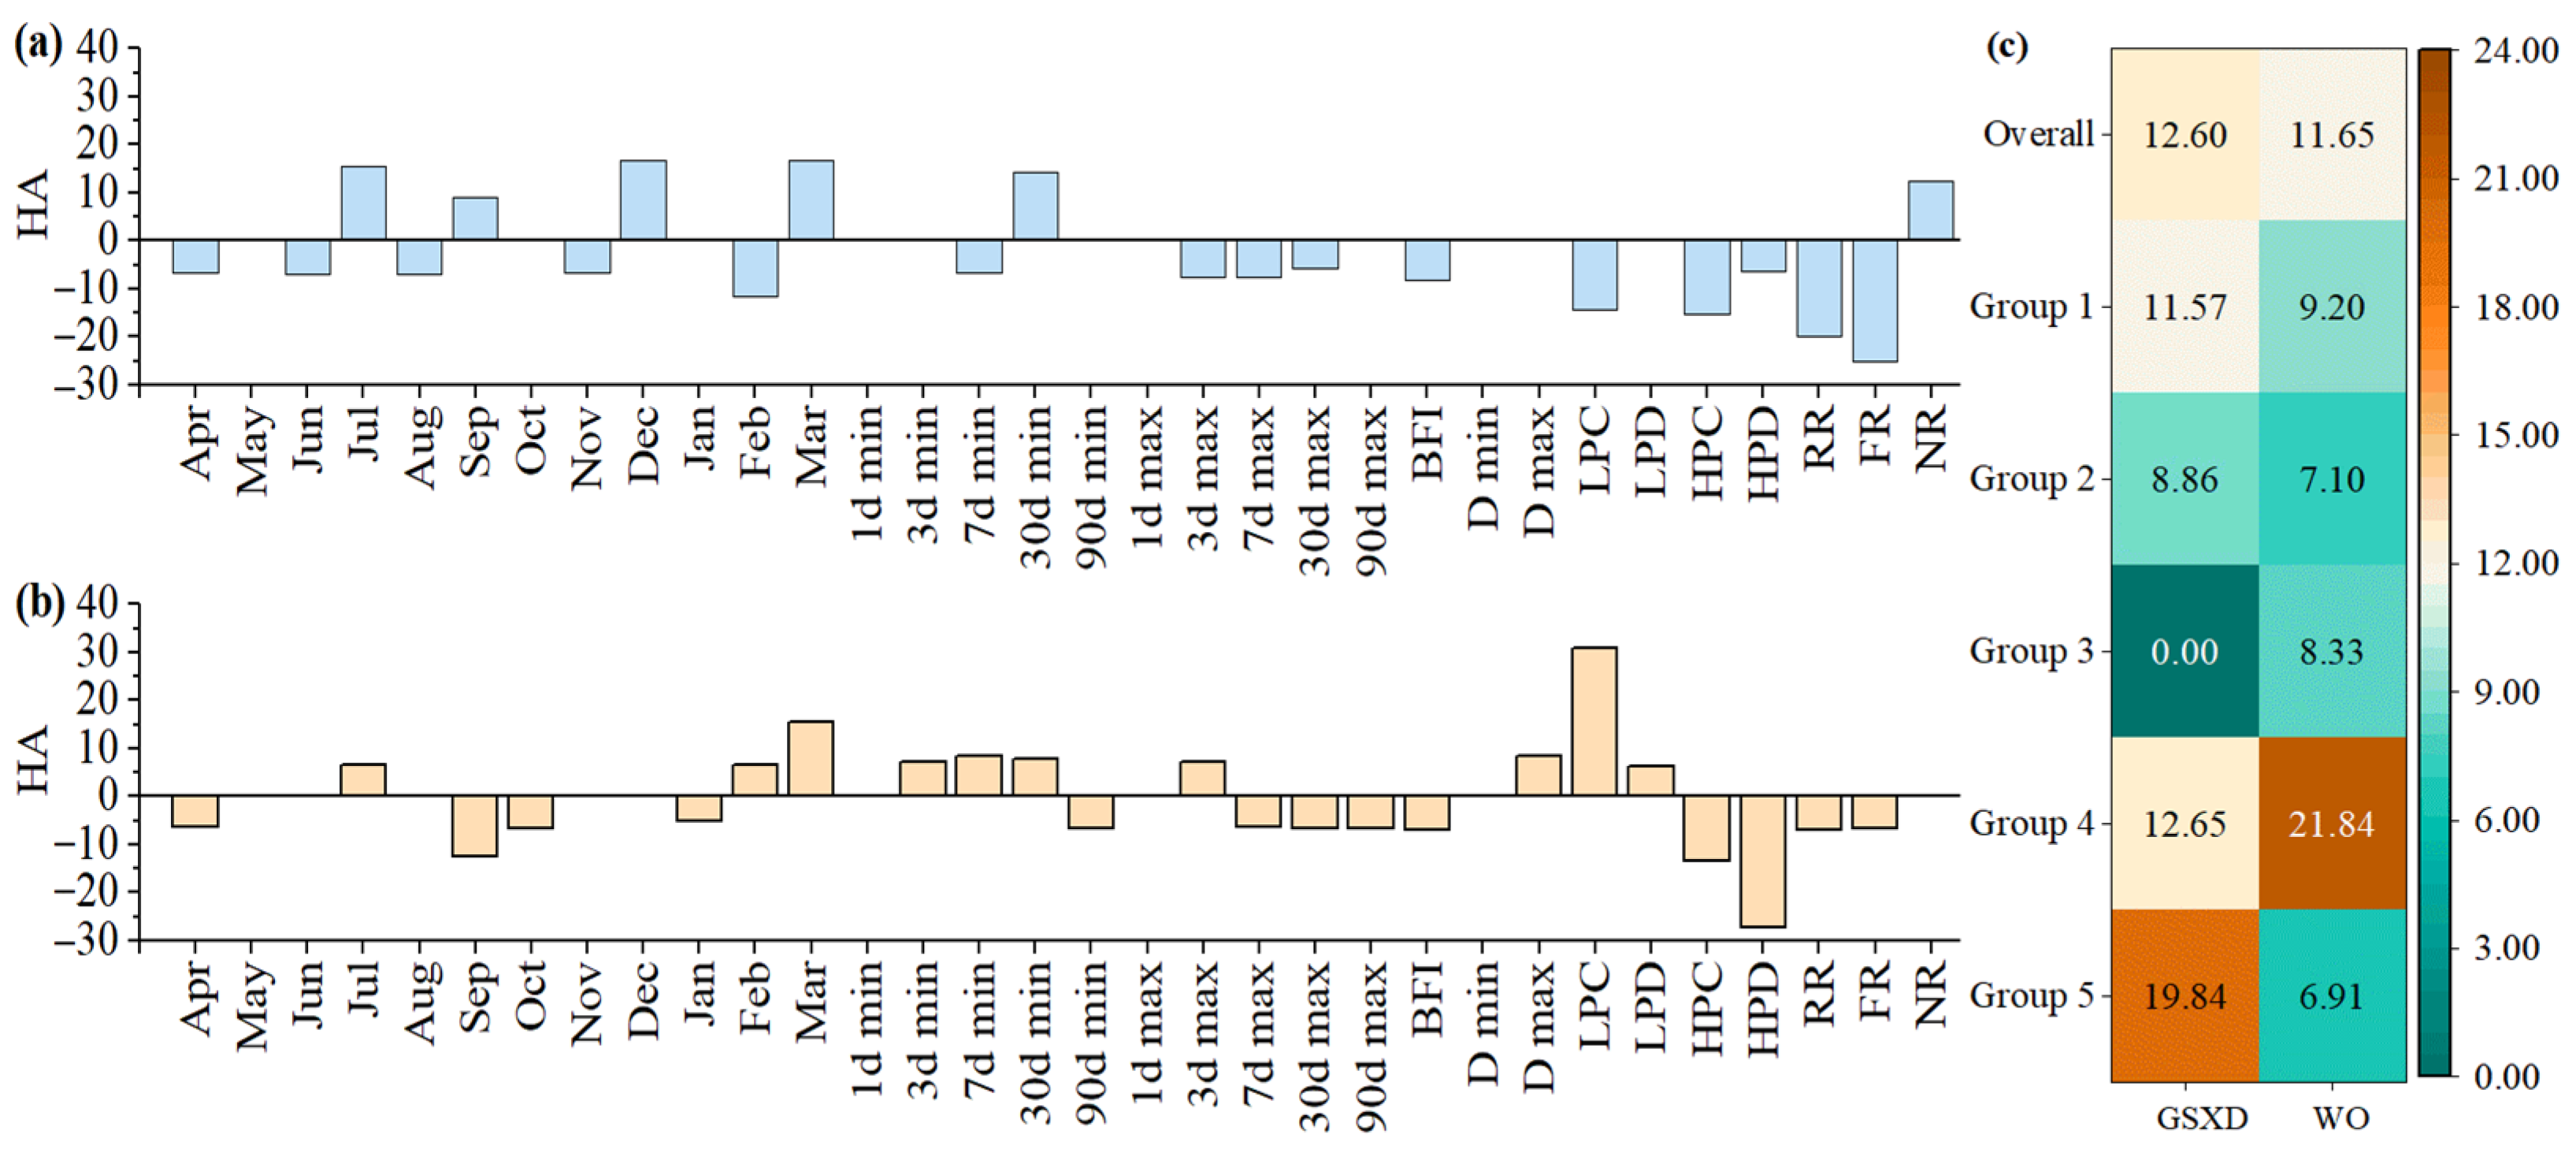
The findings of the IHA–RVA analysis revealed a multifaceted alteration of hydrological variables in the LRB following the implementation of terrace interventions (Figure 17). All hydrological indicators had low levels of alteration (the values of hydrologic alteration were lower than 33.33%), while there was significant heterogeneity observed across various hydrological indicators and between the upstream and downstream areas of the basin. At the GSXD cross-section, the values of hydrologic alteration in Groups 1 to 5 ranged from 0.00% to 19.84%. No change occurred in the date of the annual extreme flow for Group 3. The most significant change was observed in Group 5, where the HA values of the RR, FR, and NR were −20.00%, −25.00%, and 12.50%, respectively, primarily due to notable variation in the streamflow change rates. At the WO cross-section, the range of HA values for Groups 1 to 5 were between 6.91% and 21.84%. The most significant changes were observed in the flow pulse and pattern variations, resulting in HA values of 30.77% and −27.27% for LPC and HPD, respectively. Conversely, the smallest changes were found in Group 5, which pertained to flow change rates and probabilities. At both the GSXD and WO cross-sections, the HA values for the Group 2 extreme flow indicators were consistently small, with almost none exceeding 10%. As presented in Figure 17a,b, the number of instances where some indicators remained within the RVA threshold range did not change, and this quantity was greater for GSXD than for WO. The hydrological alteration index values for GSXD and WO were 12.60% and 11.65%, respectively. This indicates that spatially, the impact of terraces on the hydrological regime at the GSXD cross-section was greater.
4. Discussion
The analysis of changes in the hydrological regime of the LRB during the hydrological years 2000–2022 showed diverse impacts of the terraces on the regime’s features. The varying degrees of hydrological change reflect the extent to which hydrological shifts impact the hydrological regime in the river. The prominent variations in the hydrological regime are particularly evident in the changes in annual streamflow processes and the attenuation of peak flows. The spatial distribution of terraces also influences the hydrological alteration capacity of terraces during the runoff process. The hydrological changes at the watershed outlet influenced by terraced fields are more stable, which is to a certain extent due to the cumulative effect of terraces in upstream to downstream areas.
The impact of terraces on the hydrological cycle is primarily evident in their alteration of slope morphology and modification of runoff pathways [38]. Additionally, they facilitate the in situ storage and infiltration of rainfall runoff and store intercepted runoff in the soil, thereby reducing surface runoff [22]. This, in turn, promotes further infiltration and evaporation, leading to increases in soil moisture, subsurface flow, and baseflow. Soil evaporation and plant transpiration also benefit from the stored soil moisture, ultimately resulting in a reduction in total watershed runoff. A number of studies [21,39,40] showed that surface runoff volumes were significantly reduced after catchment management interventions, while the overall water yield from the watershed were only slightly decreased. Gathagu’s research indicated that the total water from the watershed only decreased by 0.40% [39]. This finding is consistent with the results of this study. As a result, the reduction in river streamflow will precipitate alterations in the extent of water storage areas and the riparian boundary, consequently reshaping the riparian habitat’s environment. These changes are likely to impact the abundance and composition of riparian vegetation species [3].
The variations in the monthly streamflow and extreme annual streamflow indicate that terrace measures have played a role in flood attenuation and water resource conservation. The HA values for the Group 2 indicators were all less than 10%, indicating that terraces have a limited impact on the transformation of extreme flow. This is consistent with the findings of Gierszewski et al. [20] and Gebremicael et al. [4]. However, this impact is still of significant importance. Research suggests that terrace systems effectively promote rainfall infiltration, reduce surface runoff, and increase soil and groundwater flow [41]. The increase in soil and groundwater flow extends the basin’s flow duration, which, during the flood season, can mitigate peak flows and supplement streamflow during dry periods [42]. Terraces have increased base flow (BFI ≥ 0.06) while mitigating the occurrence of river disconnectivity, thereby influencing the timing of extreme streamflow. These effects are consistent with findings from previous studies on streamflow [23,41,43]. The magnitude of extreme low flows, specifically the 7-day and 30-day minimum flows, is linked to biodiversity [44,45,46]. The 7-day and 30-day minimum flows in the LRB increased by 5.43% and 2.61% at the WO cross-section, respectively. Therefore, the increase in low-flow discharge has a positive impact on the aquatic ecological environment downstream.
The date of the minimum flow exhibits instability due to climate variations, and the mean and trend differences between the GSXD and WO cross-sections from 2000 to 2020 are relatively small. The date of the maximum flow is influenced not only by climate but also by factors such as the lag effect of basin runoff [47,48]. The mean date of the maximum flow is delayed by 1.5 days at the WO cross-section compared to the GSXD cross-section. The tightening of the threshold range for the date of the maximum flow at the WO cross-section suggests that hydrological variability has maintained the stability of the timing of maximum flow events. Primarily due to the flood control and regulation effects of terraces, the downstream flow during high-flow periods exhibits a more stabilized daily average flow.
The terrace measures reduced the counts of high and low flow pulses by 2.10 and 1.38 counts, increased the average duration by 0.09 days, and decreased the rise rate and number of reversals by 27.16% and 4.19%. This signifies decreases in both the variability and frequency of flow. These have had a relatively positive impact on the annual runoff processes, playing a role in peak flow attenuation and smoothing. These indicators play a crucial role in reflecting alterations to ecological flow regimes. For instance, a high pulse duration is associated with the survival rates of organisms, while the rise rate is linked with the spawning habitat [46,49].
Terraces constructed in terrestrial areas can alter the river channel water processes downstream [47,50,51]. While previous research has examined the influence of terraces on runoff and sediment, there has been limited focus on the relationship between terraces and downstream channel flow. In general, this study highlights the modification of water characteristics by terraces, illustrating the key factors for hydrologic variability across river cross-sections and seasons. This contributes to our understanding of the relationship between terraces and downstream channel hydrology in the world. Additionally, the coupling effect of human activities and climate change on hydrological alteration is also an important aspect that warrants further exploration. This is an issue that cannot be ignored in the context of sustainable development.
5. Conclusions
Terraces provide a variety of ecosystem services, encompassing streamflow regulation, pollutant removal, and soil preservation, among others. The objective of this study was to investigate the impact of terraces on the alteration of the hydrological regime within an agricultural catchment, i.e., the Laixi River basin. The results show that the influence of terraces on the hydrological regime of runoff is particularly evident in the alterations to the annual runoff processes and the attenuation of peak flows. The terraces reduced the annual total flow and peak discharges. At the GSXD and WO cross-sections, the streamflow reduction from March to July ranged from 0.57% to 8.69% and from 0.41% to 10.04%. The most notable decrease (15.25%) was observed in the 1d max indicator at the WO section. The maximum values of the base flow index for both cross-sections increased by 0.02. The means of the low pulse counts and high pulse counts decreased by 15.93–31.43%. The terraces also changed the timing of the yearly maximum flow and reduced the rate and probability of flow change. The hydrological indicators demonstrated low alteration, with values for hydrologic alteration consistently below 33.33%. In conclusion, this study demonstrates that terrace interventions can lead to an increase in dry-season flows while decreasing wet-season flows in the LRB. Dry season flows are of paramount importance to stakeholders, as they occur when water is most needed. Furthermore, the impact of terraces on the hydrological conditions is more pronounced upstream compared to downstream. However, the hydrological responses to terrace construction were complex, and more refined terrace distribution data and temporal scales are needed to quantitatively analyze channel evolution in future studies. The outputs presented in this paper could provide support for optimizing the distribution of terraces in future scenarios and implementing watershed water resource management based on the ecological services provided by terraces.
Author Contributions
Conceptualization, F.Z., W.Z. and X.L.; methodology, F.Z., X.L. and A.J.; software, F.Z. and G.C.; validation, F.Z., X.L. and A.L.; formal analysis, F.Z., A.J. and X.L.; investigation, F.Z., X.L. and G.C.; data curation, F.Z., X.L. and A.J.; writing—original draft preparation, F.Z.; writing—review and editing, F.Z., W.Z., X.L. and A.J.; visualization, F.Z. and A.L.; supervision, W.Z. and H.P.; project administration, W.Z. and H.P.; funding acquisition, W.Z. and H.P. All authors have read and agreed to the published version of the manuscript.
Funding
This research was funded by the National Natural Science Foundation of China, grant number 41877531.
Data Availability Statement
Data is contained within the article.
Conflicts of Interest
The authors declare no conflict of interest.
References
- Rolls, R.J.; Heino, J.; Ryder, D.S.; Chessman, B.C.; Growns, I.O.; Thompson, R.M.; Gido, K.B. Scaling biodiversity responses to hydrological regimes. Biol. Rev. Camb. Philos. Soc. 2018, 93, 971–995. [Google Scholar] [CrossRef] [PubMed]
- Horne, A.C.; Nathan, R.; Poff, N.L.; Bond, N.R.; Webb, J.A.; Wang, J.; John, A. Modeling flow-ecology responses in the anthropocene: Challenges for sustainable riverine management. Bioscience 2019, 69, 789–799. [Google Scholar] [CrossRef]
- Wang, L.; Zhang, J.; Shu, Z.; Bao, Z.; Jin, J.; Liu, C.; He, R.; Liu, Y.; Wang, G. Assessment of future eco-hydrological regime and uncertainty under climate changes over an alpine region. J. Hydrol. 2023, 620, 129451. [Google Scholar] [CrossRef]
- Gebremicael, T.G.; Mohamed, Y.A.; Van der Zaag, P. Attributing the hydrological impact of different land use types and their long-term dynamics. Sci. Total Environ. 2019, 660, 1155–1167. [Google Scholar] [CrossRef]
- Li, L.; Ni, J.; Chang, F.; Yue, Y.; Frolova, N.; Magritsky, D.; Borthwick, A.G.L.; Ciais, P.; Wang, Y.; Zheng, C.; et al. Global trends in water and sediment fluxes of the world’s large rivers. Sci. Bull. 2020, 65, 62–69. [Google Scholar] [CrossRef]
- Tian, X.; Zhao, G.; Mu, X.; Zhang, P.; Tian, P.; Gao, P.; Sun, W. Hydrologic alteration and possible underlying causes in the Wuding River, China. Sci. Total Environ. 2019, 693, 133556. [Google Scholar] [CrossRef]
- Zhang, X.; Yang, H.; Zhang, W.; Fenicia, F.; Peng, H.; Xu, G. Hydrologic impacts of cascading reservoirs in the middle and lower Hanjiang River basin under climate variability and land use change. J. Hydrol. Reg. Stud. 2022, 44, 101253. [Google Scholar] [CrossRef]
- Ore, G.; Bruins, H.J. Design features of ancient agricultural terrace walls in the Negev desert: Human-made geodiversity. Land Degrad. Dev. 2012, 23, 409–418. [Google Scholar] [CrossRef]
- Garcia-Franco, N.; Wiesmeier, M.; Goberna, M.; Martínez-Mena, M.; Albaladejo, J. Carbon dynamics after afforestation of semiarid shrublands: Implications of site preparation techniques. For. Ecol. Manag. 2014, 319, 107–115. [Google Scholar] [CrossRef]
- Wei, W.; Chen, D.; Wang, L.; Daryanto, S.; Chen, L.; Yu, Y.; Lu, Y.; Sun, G.; Feng, T. Global synthesis of the classifications, distributions, benefits and issues of terracing. Earth-Sci. Rev. 2016, 159, 388–403. [Google Scholar] [CrossRef]
- Arnáez, J.; Lana-Renault, N.; Lasanta, T.; Ruiz-Flaño, P.; Castroviejo, J. Effects of farming terraces on hydrological and geomorphological processes. A review. Catena 2015, 128, 122–134. [Google Scholar] [CrossRef]
- Dong, S.; Xin, L.; Li, S.; Xie, H.; Zhao, Y.; Wang, X.; Li, X.; Song, H.; Lu, Y. The extent and spatial distribution of terrace abandonment in China. Acta Geogr. Sin. 2023, 78, 3–15. [Google Scholar] [CrossRef]
- Morgan, J.M.; Condon, A.G. Water-use, grain-yield, and osmoregulation in wheat. Aust. J. Plant Physiol. 1986, 13, 523–532. [Google Scholar] [CrossRef]
- Van Dijk, A.; Bruijnzeel, L.A. Runoff and soil loss from bench terraces. 1. An eventbased model of rainfall infiltration and surface runoff. Eur. J. Soil Sci. 2004, 55, 299–316. [Google Scholar] [CrossRef]
- Li, X.H.; Yang, J.; Zhao, C.Y.; Wang, B. Runoff and sediment from orchard terraces in Southeastern China. Land Degrad. Dev. 2014, 25, 184–192. [Google Scholar] [CrossRef]
- Moser, K.F.; Ahn, C.; Noe, G.B. The influence of microtopography on soil nutrients in created mitigation wetlands. Restor. Ecol. 2009, 17, 641–651. [Google Scholar] [CrossRef]
- Ernakovich, J.G.; Hopping, K.A.; Berdanier, A.B.; Simpson, R.T.; Kachergis, E.J.; Steltzer, H.; Wallenstein, M.D. Predicted responses of arctic and alpine ecosystems to altered seasonality under climate change. Glob. Chang. Biol. 2014, 20, 3256–3269. [Google Scholar] [CrossRef]
- Hotaling, S.; Finn, D.S.; Joseph Giersch, J.; Weisrock, D.W.; Jacobsen, D. Climate change and alpine stream biology: Progress, challenges, and opportunities for the future. Biol. Rev. Camb. Philos. Soc. 2017, 92, 2024–2045. [Google Scholar] [CrossRef]
- Gashaw, T.; Tulu, T.; Argaw, M.; Worqlul, A.W. Modeling the hydrological impacts of land use/land cover changes in the Andassa watershed, Blue Nile Basin, Ethiopia. Sci. Total Environ. 2018, 619, 1394–1408. [Google Scholar] [CrossRef]
- Gierszewski, P.J.; Habel, M.; Szmańda, J.; Luc, M. Evaluating effects of dam operation on flow regimes and riverbed adaptation to those changes. Sci. Total Environ. 2020, 710, 136202. [Google Scholar] [CrossRef]
- Gebremicael, T.G.; Mohamed, Y.A.; van der Zaag, P.; Hassaballah, K.; Hagos, E.Y. Change in low flows due to catchment management dynamics—Application of a comparative modelling approach. Hydrol. Process. 2020, 34, 2101–2116. [Google Scholar] [CrossRef]
- Gathagu, J.; Mourad, K.; Sang, J. Effectiveness of contour farming and filter strips on ecosystem services. Water 2018, 10, 1312. [Google Scholar] [CrossRef]
- Kang, Y.; Gao, J.; Shao, H.; Zhang, Y.; Li, J.; Gao, Z. Evaluating the flow and sediment effects of gully land consolidation on the Loess Plateau, China. J. Hydrol. 2021, 600, 126535. [Google Scholar] [CrossRef]
- Haregeweyn, N.; Tesfaye, S.; Tsunekawa, A.; Tsubo, M.; Meshesha, D.T.; Adgo, E.; Elias, A. Dynamics of land use and land cover and its effects on hydrologic responses: Case study of the Gilgel Tekeze catchment in the highlands of Northern Ethiopia. Environ. Monit. Assess. 2015, 187, 4090. [Google Scholar] [CrossRef]
- Richter, B.D.; Baumgartner, J.V.; Powell, J.; Braun, D.P. A method for assessing hydrologic alteration within ecosystems. Conserv. Biol. 1996, 10, 1163–1174. [Google Scholar] [CrossRef]
- Richter, B.D.; Baumgartner, J.V.; Wigington, R.; Braum, D.P. How much water does a river need? Freshw. Biol. 1997, 37, 231–249. [Google Scholar] [CrossRef]
- Richter, B.D.; Baumgartnerb, J.V.; Braun, D.P.; Powell, J. A spatial assessment of hydrologic alteration within a river network. Regul. Rivers Res. Manag. 1998, 14, 329–340. [Google Scholar] [CrossRef]
- Richter, B.D.; Warner, A.T.; Meyer, J.L.; Lutz, K. A collaborative and adaptive process for developing environmental flow recommendations. River Res. Appl. 2006, 22, 297–318. [Google Scholar] [CrossRef]
- Sheikh, V.; Sadoddin, A.; Najafinejad, A.; Zare, A.; Hollisaz, A.; Siroosi, H.; Tajiki, M.; Gholipouri, M.; Sheikh, J. The density difference and weighted RVA approaches for assessing hydrologic regime alteration. J. Hydrol. 2022, 613, 128450. [Google Scholar] [CrossRef]
- Cao, B.; Yu, L.; Naipal, V.; Ciais, P.; Li, W.; Zhao, Y.; Wei, W.; Die, C.; Liu, Z.; Gong, P. A 30 m terrace mapping in China using landsat 8 imagery and digital elevation model based on the google earth engine. Earth Syst. Sci. Data 2021, 13, 2437–2456. [Google Scholar] [CrossRef]
- Chen, G.; Zhang, W.; Liu, X.; Peng, H.; Zhou, F.; Wang, H.; Ke, Q.; Xiao, B. Development and application of a multi-centre cloud platform architecture for water environment management. J. Environ. Manag. 2023, 344, 118670. [Google Scholar] [CrossRef]
- Wang, Y.; Li, Q.; Zhang, W.; Hu, S.; Peng, H. The architecture and application of an automatic operational model system for basin scale water environment management and design making supporting. J. Environ. Manag. 2021, 290, 112577. [Google Scholar] [CrossRef]
- Zhang, W.; Bu, S.; Peng, H.; Xia, H.; Zhu, L.; Liu, X. Prediction of non-point source pollution in Pengxi River basin based on WRF model. Water Resour. Prot. 2022, 38, 160–167. [Google Scholar]
- Zhang, W.; Zhang, Z.; Peng, H.; Li, L.; Zhang, X.; Xia, H.; Zhang, L. Water quality variations of Jinshan Lake basin in Guangdong, Hong kong and Macao great bay area. Water Resour. Prot. 2021, 37, 1–8. [Google Scholar]
- Zhou, F. Study on the Regulatory Effect of Terrace on Non-Point Pollution in Typical Watershed in the Hilly Mountains of the Yangtze River. Ph.D. Thesis, Wuhan University, Wuhan, China, 2023. [Google Scholar]
- Moriasi, D.N.; Arnold, J.G.; Van Liew, M.W.; Bingner, R.L.; Harmel, R.D.; Veithmodel, T.L. Evaluation guidelines for systematic quantification of accuracy in watershed simulations. Am. Soc. Agric. Biol. Eng. 2007, 50, 885–900. [Google Scholar]
- The Nature Conservancy. Tnc Indicators of Hydrologic Alteration Version 7 User’s Manual; The Nature Conservancy: Arlington, VR, USA, 2009. [Google Scholar]
- Calsamiglia, A.; Fortesa, J.; García-Comendador, J.; Lucas-Borja, M.E.; Calvo-Cases, A.; Estrany, J. Spatial patterns of sediment connectivity in terraced lands: Anthropogenic controls of catchment sensitivity. Land Degrad. Dev. 2018, 29, 1198–1210. [Google Scholar] [CrossRef]
- Gathagu, J.N.A.A.; Sang, J.K.; Maina, C.W. Modelling the impacts of structural conservation measures on sediment and water yield in Thika-Chania catchment, Kenya. Int. Soil Water Conserv. Res. 2018, 6, 165–174. [Google Scholar] [CrossRef]
- Nyssen, J.; Clymans, W.; Descheemaeker, K.; Poesen, J.; Vandecasteele, I.; Vanmaercke, M.; Zenebe, A.; Van Camp, M.; Haile, M.; Haregeweyn, N.; et al. Impact of soil and water conservation measures on catchment hydrological response-a case in north Ethiopia. Hydrol. Process. 2010, 24, 1880–1895. [Google Scholar] [CrossRef]
- Dong, Y.; Wang, S.; Mu, X.; Wang, Z. Assessment on impact of ecological management on runoff evolution based on IHA-RVA method. Res. Soiland Water Conserv. 2023, 30, 193–200. [Google Scholar]
- Ran, Q.; Chen, X.; Hong, Y.; Ye, S.; Gao, J. Impacts of terracing on hydrological processes: A case study from the Loess Plateau of China. J. Hydrol. 2020, 588, 125045. [Google Scholar] [CrossRef]
- Ben Khelifa, W.; Strohmeier, S.; Benabdallah, S.; Habaieb, H. Evaluation of bench terracing model parameters transferability for runoff and sediment yield on catchment modelling. J. Afr. Earth Sci. 2021, 178, 104177. [Google Scholar] [CrossRef]
- Yang, Y.; Zhang, M.; Sun, Z.; Han, J.; Wang, J. The relationship between water level change and river channel geometry adjustment in the downstream of the Three Gorges Dam. J. Geogr. Sci. 2018, 28, 1975–1993. [Google Scholar]
- Lu, M.; Zhao, Q.; Ding, S.; Wang, S.; Hong, Z.; Jing, Y.; Wang, A. Hydro-geomorphological characteristics in response to the water-sediment regulation scheme of the Xiaolangdi Dam in the lower Yellow River. J. Clean. Prod. 2022, 335, 130324. [Google Scholar] [CrossRef]
- Zhang, Z.; Zhang, Q.; Gu, X.; Kong, D.; Li, B.; Liu, T. Changes of eco-flow due to hydrological alterations in the Yellow River basin. J. Nat. Resour. 2016, 31, 2021–2033. [Google Scholar]
- Zhang, S.; Zhao, G.; Mu, X.; Tian, P.; Gao, P.; Sun, W. Hydrologic regime change and its attribution analysis of river runoff in typical watershed on Loess Plateau. Bull. Soil Water Conserv. 2021, 41, 1–8. [Google Scholar]
- Dakhlalla, A.O.; Parajuli, P.B. Evaluation of the best management practices at the watershed scale to attenuate peak streamflow under climate change scenarios. Water Resour. Manag. 2016, 30, 963–982. [Google Scholar] [CrossRef]
- Xie, X.; Zhang, J.; Lian, Y.; Lin, K.; Gao, X.; Lan, T.; Luo, J.; Song, F. Cloud model combined with multiple weighting methods to evaluate hydrological alteration and its contributing factors. J. Hydrol. 2022, 610, 127794. [Google Scholar] [CrossRef]
- Strehmel, A.; Jewett, A.; Schuldt, R.; Schmalz, B.; Fohrer, N. Field data-based implementation of land management and terraces on the catchment scale for an eco-hydrological modelling approach in the Three Gorges Region, China. Agric. Water Manag. 2016, 175, 43–60. [Google Scholar] [CrossRef]
- Chen, D.; Wei, W.; Chen, L. Effects of terracing practices on water erosion control in China: A meta-analysis. Earth-Sci. Rev. 2017, 173, 109–121. [Google Scholar] [CrossRef]
Figure 1.
Watershed and administrative boundaries (a), and terrace distribution in the Laixi River basin (b).
Figure 1.
Watershed and administrative boundaries (a), and terrace distribution in the Laixi River basin (b).

Figure 2.
Subbasins of the terrestrial area and river cross-section (a), subcatchments (b) and generalized scheme of the Laixi River network (c) in the hydrological model within the Laixi River basin (LRB).
Figure 2.
Subbasins of the terrestrial area and river cross-section (a), subcatchments (b) and generalized scheme of the Laixi River network (c) in the hydrological model within the Laixi River basin (LRB).

Figure 3.
Observed versus simulated values of flow for the Laixi River basin during the calibration and validation periods.
Figure 3.
Observed versus simulated values of flow for the Laixi River basin during the calibration and validation periods.

Figure 4.
Comparison of monthly streamflow responses at (a) Guanshenxindi (GSXD) and (b) watershed outlet (WO) cross-sections before (red) and after (blue) terrace intervention from 2000 to 2020.
Figure 4.
Comparison of monthly streamflow responses at (a) Guanshenxindi (GSXD) and (b) watershed outlet (WO) cross-sections before (red) and after (blue) terrace intervention from 2000 to 2020.

Figure 5.
Rate of monthly streamflow and extreme streamflow changes at Guanshenxindi (GSXD) (a) and watershed outlet (WO) (b) cross-sections after terrace interventions.
Figure 5.
Rate of monthly streamflow and extreme streamflow changes at Guanshenxindi (GSXD) (a) and watershed outlet (WO) (b) cross-sections after terrace interventions.

Figure 6.
Comparison of minimum streamflow (a) and maximum streamflow (b) responses at GSXD cross-section and minimum streamflow (c) and maximum streamflow (d) responses at watershed outlet (WO) cross-section before (red) and after (blue) terrace interventions.
Figure 6.
Comparison of minimum streamflow (a) and maximum streamflow (b) responses at GSXD cross-section and minimum streamflow (c) and maximum streamflow (d) responses at watershed outlet (WO) cross-section before (red) and after (blue) terrace interventions.

Figure 7.
Comparison of base flow index (BFI) responses at Guanshenxindi (GSXD) (a) and watershed outlet (WO) (b) cross-sections before and after terrace interventions.
Figure 7.
Comparison of base flow index (BFI) responses at Guanshenxindi (GSXD) (a) and watershed outlet (WO) (b) cross-sections before and after terrace interventions.

Figure 8.
Comparison of dates of minimum (D min) flow responses at Guanshenxindi (GSXD) (a) and watershed outlet (WO) (b) cross-sections before and after terrace interventions.
Figure 8.
Comparison of dates of minimum (D min) flow responses at Guanshenxindi (GSXD) (a) and watershed outlet (WO) (b) cross-sections before and after terrace interventions.

Figure 9.
Comparison of dates of maximum (D max) flow responses at Guanshenxindi (GSXD) (a) and watershed outlet (WO) (b) cross-sections before and after terrace interventions.
Figure 9.
Comparison of dates of maximum (D max) flow responses at Guanshenxindi (GSXD) (a) and watershed outlet (WO) (b) cross-sections before and after terrace interventions.

Figure 10.
Comparison of low pulse count (LPC) responses at Guanshenxindi (GSXD) (a) and watershed outlet (WO) (b) cross-sections before and after terrace interventions.
Figure 10.
Comparison of low pulse count (LPC) responses at Guanshenxindi (GSXD) (a) and watershed outlet (WO) (b) cross-sections before and after terrace interventions.

Figure 11.
Comparison of low pulse duration (LPD) responses at Guanshenxindi (GSXD) (a) and watershed outlet (WO) (b) cross-sections before and after terrace interventions.
Figure 11.
Comparison of low pulse duration (LPD) responses at Guanshenxindi (GSXD) (a) and watershed outlet (WO) (b) cross-sections before and after terrace interventions.

Figure 12.
Comparison of high pulse count (HPC) responses at Guanshenxindi (GSXD) (a) and watershed outlet (WO) (b) cross-sections before and after terrace interventions.
Figure 12.
Comparison of high pulse count (HPC) responses at Guanshenxindi (GSXD) (a) and watershed outlet (WO) (b) cross-sections before and after terrace interventions.

Figure 13.
Comparison of high pulse duration (HPD) responses at Guanshenxindi (GSXD) (a) and watershed outlet (WO) (b) cross-sections before and after terrace interventions.
Figure 13.
Comparison of high pulse duration (HPD) responses at Guanshenxindi (GSXD) (a) and watershed outlet (WO) (b) cross-sections before and after terrace interventions.

Figure 14.
Comparison of rise rate (RR) responses at Guanshenxindi (GSXD) (a) and watershed outlet (WO) (b) cross-sections before and after terrace interventions.
Figure 14.
Comparison of rise rate (RR) responses at Guanshenxindi (GSXD) (a) and watershed outlet (WO) (b) cross-sections before and after terrace interventions.

Figure 15.
Comparison of fall rate (FR) responses at Guanshenxindi (GSXD) (a) and watershed outlet (WO) (b) cross-sections before and after terrace interventions.
Figure 15.
Comparison of fall rate (FR) responses at Guanshenxindi (GSXD) (a) and watershed outlet (WO) (b) cross-sections before and after terrace interventions.

Figure 16.
Comparison of number of reversal (NR) responses at Guanshenxindi (GSXD) (a) and watershed outlet (WO) (b) cross-sections before and after terrace interventions.
Figure 16.
Comparison of number of reversal (NR) responses at Guanshenxindi (GSXD) (a) and watershed outlet (WO) (b) cross-sections before and after terrace interventions.

Figure 17.
Values of hydrologic alteration (HA) for 32 indicators at Guanshenxindi (GSXD) (a) and watershed outlet (WO) (b) cross-sections and groups (c) from 2000 to 2020.
Figure 17.
Values of hydrologic alteration (HA) for 32 indicators at Guanshenxindi (GSXD) (a) and watershed outlet (WO) (b) cross-sections and groups (c) from 2000 to 2020.


Table 1.
Indicators of streamflow parameters for the IHA.
| IHA Parameter Group | Numbers | Hydrologic Parameters | Abbreviations | Unit |
|---|---|---|---|---|
| Group 1: monthly streamflow | I1 | Average streamflow in April | Apr. | m3/s |
| I2 | Average streamflow in May | May. | ||
| I3 | Average streamflow in June | Jun. | ||
| I4 | Average streamflow in July | Jul. | ||
| I5 | Average streamflow in August | Aug. | ||
| I6 | Average streamflow in September | Sep. | ||
| I7 | Average streamflow in October | Oct. | ||
| I8 | Average streamflow in November | Nov. | ||
| I9 | Average streamflow in December | Dec. | ||
| I10 | Average streamflow in January | Jan. | ||
| I11 | Average streamflow in February | Feb. | ||
| I12 | Average streamflow in March | Mar. | ||
| Group 2: magnitude and duration of annual extreme hydrologic conditions | I13 | 1-day minimum | 1d min | m3/s |
| I14 | 3-day minimum | 3d min | ||
| I15 | 7-day minimum | 7d min | ||
| I16 | 30-day minimum | 30d min | ||
| I17 | 90-day minimum | 90d min | ||
| I18 | 1-day maximum | 1d max | ||
| I19 | 3-day maximum | 3d max | ||
| I20 | 7-day maximum | 7d max | ||
| I21 | 30-day maximum | 30d max | ||
| I22 | 90-day maximum | 90d max | ||
| I23 | Base flow index | BFI | / | |
| Group 3: time of annual extreme hydrological conditions | I24 | Date of minimum | D min | day of year |
| I25 | Date of maximum | D max | ||
| Group 4: frequency and duration of high and low pulses | I26 | Low pulse count | LPC | count of year |
| I27 | Low pulse duration | LPD | day of year | |
| I28 | High pulse count | HPC | count of year | |
| I29 | High pulse duration | HPD | day of year | |
| Group 5: rate and frequency of streamflow change | I30 | Rise rate | RR | m3/s/day |
| I31 | Fall rate | FR | ||
| I32 | Number of reversals | NR | count of year |
Disclaimer/Publisher’s Note: The statements, opinions and data contained in all publications are solely those of the individual author(s) and contributor(s) and not of MDPI and/or the editor(s). MDPI and/or the editor(s) disclaim responsibility for any injury to people or property resulting from any ideas, methods, instructions or products referred to in the content. |
© 2023 by the authors. Licensee MDPI, Basel, Switzerland. This article is an open access article distributed under the terms and conditions of the Creative Commons Attribution (CC BY) license (https://creativecommons.org/licenses/by/4.0/).
Share and Cite
MDPI and ACS Style
Zhou, F.; Zhang, W.; Liu, X.; Jiang, A.; Chen, G.; Li, A.; Peng, H. Evaluating Effects of Terraces on Flow Regimes in a Hilly and Mountainous Basin. Water 2023, 15, 3980. https://0-doi-org.brum.beds.ac.uk/10.3390/w15223980
AMA Style
Zhou F, Zhang W, Liu X, Jiang A, Chen G, Li A, Peng H. Evaluating Effects of Terraces on Flow Regimes in a Hilly and Mountainous Basin. Water. 2023; 15(22):3980. https://0-doi-org.brum.beds.ac.uk/10.3390/w15223980
Chicago/Turabian StyleZhou, Feng, Wanshun Zhang, Xin Liu, Anna Jiang, Gang Chen, Ao Li, and Hong Peng. 2023. "Evaluating Effects of Terraces on Flow Regimes in a Hilly and Mountainous Basin" Water 15, no. 22: 3980. https://0-doi-org.brum.beds.ac.uk/10.3390/w15223980
Note that from the first issue of 2016, this journal uses article numbers instead of page numbers. See further details here.