Article

Application of Judgmental Sampling Approach for the Monitoring of Groundwater Quality and Quantity Evolution in Mediterranean Catchments

by
Maria Margarita Ntona
1,2,*,
Konstantinos Chalikakis
3,
Gianluigi Busico
1,
Micòl Mastrocicco
1,
Kyriaki Kalaitzidou
4 and
Nerantzis Kazakis
5
1
Department of Environmental, Biological and Pharmaceutical Sciences and Technologies, Campania University “Luigi Vanvitelli”, Via Vivaldi 43, 81100 Caserta, Italy
2
Department of Geology, Laboratory of Engineering Geology & Hydrogeology, Aristotle University of Thessaloniki, 54124 Thessaloniki, Greece
3
UMR 1114 EMMAH (AU-INRAE), Avignon University, 84000 Avignon, France
4
Department of Chemical Engineering, Analytical Chemistry Laboratory, Aristotle University of Thessaloniki, 54124 Thessaloniki, Greece
5
Department of Geology, Laboratory of Hydrogeology, University of Patras, 26500 Patras, Greece
*
Author to whom correspondence should be addressed.
Submission received: 29 September 2023 / Revised: 9 November 2023 / Accepted: 18 November 2023 / Published: 20 November 2023

Abstract

:
Groundwater monitoring is critically important, even though it is costly and often neglected. In this study, a judgmental monitoring of groundwater offering solutions based on a cost and time-effective research approach is presented. The method was performed in three Mediterranean areas in Greece and Italy to examine its advantages and disadvantages. As a first step, a multi-statistical analysis was practiced to assess and apportion the potential contributions of pollution sources of groundwater. Pearson correlation, principal component analysis, and factor analysis were applied to groundwater samples to characterize the evolution of hydrochemical processes. High concentrations of chlorides and nitrates highlight that salinization and the extensive use of nitrate fertilizers dominate in the coastal part of Eastern Thermaikos Gulf, the dissolution of carbonate rocks and livestock/industrial activities drive the groundwater quality status in the Upper Volturno basin, while in the Mouriki basin thermal power plant and the use of zinc fertilizers are the main factors of groundwater quality degradation. The determination of the critical sampling points was applied, considering the land use and hydrogeological and morphological characteristics of the areas. The application of the judgmental sampling approach provides reliable results regarding groundwater evolution. These results were compared to previous works and found that a non-probability sampling technique can provide the same results as a more costly method in the Mediterranean region. Thus, judgmental sampling is crucial for the optimal application of water resource management and control techniques in basins to avoid gaps in data collection.

1. Introduction

Groundwater quality is defined by physical, chemical, and biological characteristics, which are a complex function of many natural and anthropogenic influences on the surface and subsurface environment [1]. The chemical composition of groundwater is affected by recharge and discharge conditions, where the mineral contents found in groundwater samples are closely related to the dissolution processes of predominant materials in the soils [2]. External factors, for instance, socioeconomic parameters due to agricultural activities, industrial structure, and urbanization, affect the groundwater sources qualitatively and quantitatively [3]. Thus, the frequency, quality, and quantity of field measurements are of utmost importance as they affect the performance of deduction [4]. For this purpose, each sampling campaign has to be organized based on the research target, specific hydrogeological conditions of the area, and the general limitations of the research approach.
In recent years, different techniques have been performed to investigate groundwater quality worldwide. Stable isotope analysis has been applied to identify nitrate pollution [5] and strontium contamination [6], while Voltaggio et al. [7] applied stable and unstable isotopes for the assessment of groundwater pollution from ash ponds. Another approach that has seen significant development in recent years is hydrological modeling, which can represent the transport and transformation processes of pollutants in the environment [8]. Groundwater quality indices (GQIs) have proven to be a straightforward and effective methodology for assessing the overall groundwater quality being performed in numerous studies in different regions of the world [9]. Artificial intelligence (AI) and machine learning for groundwater quality prediction and simulation also proved to produce accurate results [10,11]. The reliability of these methods for the determination of the hydrochemical process in different and complex aquifer systems is not certain since they all have advantages and drawbacks that can limit their application. Thus, the first step to identifying water quality variables responsible for spatial and temporal changes and the processes controlling groundwater quality should be the statistical analysis. Multivariate analytical statistical methods were used to characterize the hydrochemistry of surface [12] and groundwater systems [13,14,15]. A combination of methods, like electrical resistivity tomography (ERT) monitoring and physicochemical water analysis techniques to investigate groundwater vulnerability [16], as well as Bayesian isotope mixing model (SIAR) and multivariate statistical analysis (MSA) [17,18], have been applied for the enrichment of the results.
A multi-statistical analysis applied as a low-cost process and without complex input parameters can provide reliable results [19]. The application of various multivariate statistical techniques, including cluster analysis (CA), factor analysis (FA), principal component analysis (PCA), and/or a combination thereof [20,21,22], as well as the incorporation of AI models [23], has received significant attention in the study of water quality, especially in simplifying complex datasets. Therefore, the application of factors/clusters can identify the aspects that affect the water quality and offer a valuable tool for the reliable management of water resources [24]. Nevertheless, direct comparisons of localized studies are often hindered by inconsistencies in datasets and methodologies.
This study aims to investigate the main factors that affect groundwater quality in different semi-arid basins of the Mediterranean region under a multi-statistical analysis of the judgmental sampling approach. The selection of this method is dependent on the necessity for (i) the absence of pauses in data collection, (ii) quick and easy field measurements, and (iii) low-cost techniques. In this regard, groundwater samples were collected from three Mediterranean areas in Greece and Italy to analyze the characteristics and genesis of groundwater hydrochemical evolution. Based on the continuity of the sampling-detected results, Pearson correlation and PCA/FA were used to distinguish the contribution of different natural mineralization and human pollutants to the groundwater quality in the three study areas. Among these, groundwater level measurements were also implemented in all the study areas to determine the recharge and discharge conditions compared to previous years’ accessible data.
Taking into consideration the drawbacks and limitations of the multi-statistical analysis, we decided to take the challenge and compare these three regions due to their different and interesting characteristics under the aspect of a non-probability sampling technique. In this term, a non-random sampling technique was practiced for the investigation of spatial and temporal groundwater quality status in the study areas. The validity and reliability of the results throughout the entire study were achieved based on the results of previous works. The current research can provide a pathway for water resources management and early warning under a low-cost and time-effective approach in Mediterranean regions.

2. Materials and Methods
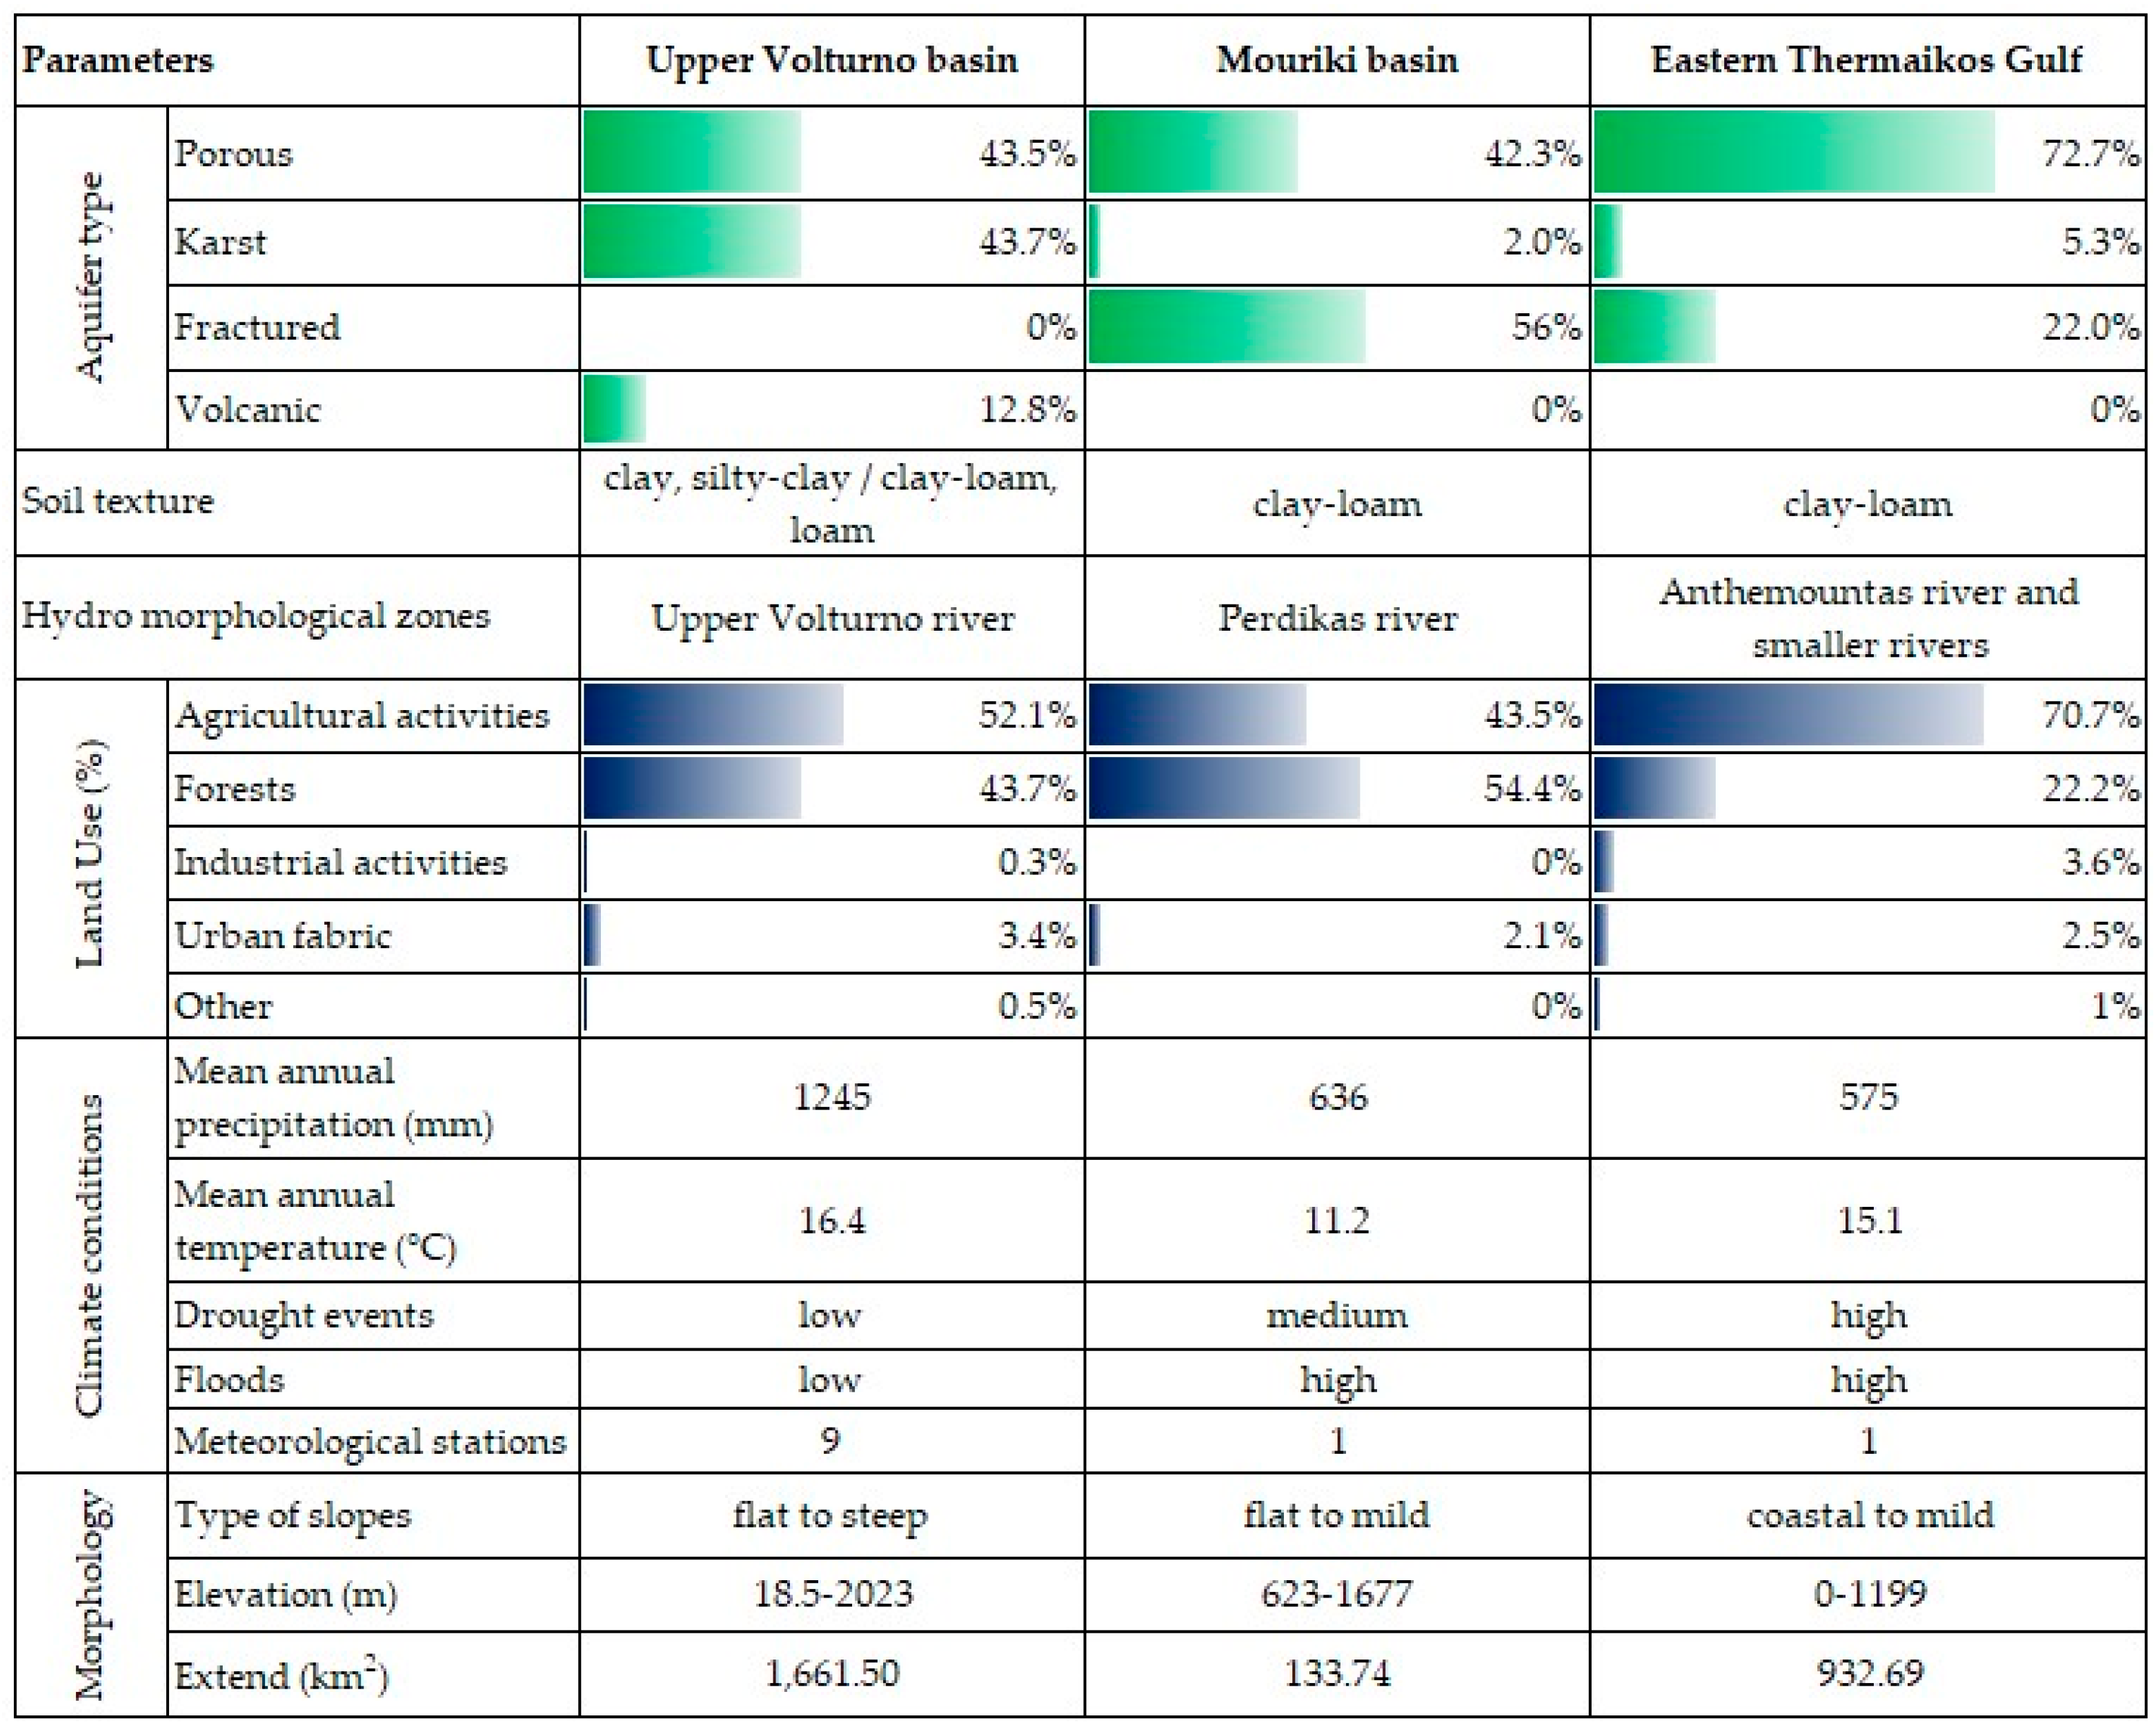
2.1. Study Areas

The study areas are located in the Mediterranean region (Figure 1a–c) and are affected by different combinations of anthropogenic factors, geological formations, and meteorological conditions, which have already been analyzed in previous works [25,26]. The Eastern Thermaikos Gulf (Greece) includes the coastal area of Epanomi–Sozopoli and the Anthemountas basin and covers an extent of 932.7 km2.
The decision to combine the Anthemountas basin with the coastal part as a unified research area was driven by two main factors: (i) the hydrogeological connection of these systems and (ii) the great amount of previous data. The Mouriki basin (Greece) is in Macedonia Province and covers an area of 100 km2. The Volturno basin (Italy) is located in the Campania region and covers an area of 5613 km2, while the extent of the study area considered is around 1661 km2. The Upper Volturno–Calore basin is characterized mainly as strongly asymmetric with steep slopes. This study focused on the outlet of the Upper Volturno–Calore basin to assess the potential interaction between the river and the groundwater in the alluvial plain.

2.2. Sample Collection and Groundwater Level Measurements

Groundwater samples were collected during the wet and dry periods of 2021–2022 from the Greek regions and the dry period of 2021 from the Italian basin (Figure 1). The sampling points are shown in the maps below and were chosen to focus on the potential influence of agricultural activities and surface water on groundwater quality. Forty-seven groundwater samples were collected and analyzed. Seventeen samples were from boreholes in TG, eight in the Mouriki basin, and twenty-two from the Upper Volturno basin.
After consideration of the local hydrochemical properties and hydrogeological conditions, 21 groundwater quality parameters were selected, including pH, electrical conductivity (EC), calcium (Ca), magnesium (Mg), potassium (K), sodium (Na), bicarbonate (HCO3), chloride (Cl), sulfates (SO4), nitrates (NO3), ammonia (NH4), strontium (Sr), phosphate (PO4), iron (Fe), manganese (Mn), arsenic (As), chromium (Cr), zinc (Zn), boron (B), molybdenum (Mo), and silicon dioxide (SiO2). The Chemical Balance Error (CBE) was applied for the internal consistency test. Under ideal conditions, cations and anions should exactly balance; thus, in satisfactory analysis, cations and anions should not differ by more than 5% [27]. Following the calculation of CBE, all the samples had relative errors within ±5%.
The design of groundwater level monitoring networks is essential for groundwater modeling and management. In most cases, the lack of monitoring is due to financial constraints [28]. Issues in the field, such as transportation and work under different climate conditions, finding boreholes in and out of operation, and contact with farmers, make field research difficult. To avoid the high cost of monitoring and missing time series, the selection of specific boreholes that are easily accessible is suggested. For this purpose, boreholes that are already monitored in previous published works were selected. In the current work, the comparison of GWL measurements during the last decades is provided. Measurements of groundwater depth were applied in 68 and 20 boreholes in the TG and Mouriki basins, respectively. In the Upper Volturno basin, the selection of 15 boreholes was possible based on previous data to achieve the optimum spatial variation in GWL during the years.
In all sites, available data were considered from research projects and scientific publications. Specifically, a detailed time series (starting from 2011) of GWL was evaluated for the aquifers of TG. On the contrary, in the Mouriki basin, a comparison was obtained for the periods between 2004–2007 and 2021–2022, while in the Upper Volturno region, the comparison was obtained for the periods 2006 and 2016. All sites have representative sampling points for monitoring of water quality and quantity from national authorities in the framework of EU regulation for water sustainability. However, the number of sampling points per study area is limited and inappropriate for spatial analysis at the aquifer scale. For instance, in the Mouriki basin, there is one measurement point (http://nmwn.ypeka.gr/ accessed on 10 July 2023).

2.3. Systematic Judgmental Sampling

The determination of groundwater quality and quantity monitoring networks is crucial to conducting accurate research at a low cost and time [29,30]. Vast sampling points and/or generic random sampling are high-cost methods and rely less on prior specific knowledge. On the other hand, in judgmental sampling, the hydrogeologists have to analyze general and detailed information about the area and select the optimum sampling campaign, minimizing the limits and biases that affect the reliability of the findings [31]. The main positive and negative effects of this method are provided in Figure 2. The weight of each effect may vary between regions, while each sampling campaign should be organized based on the results of the previous ones. By employing this cost-effective and time-efficient method, the researcher can gain useful insights by selecting the most representative points considering various site-specific factors and research queries (Table 1). The combination of multiple analysis techniques can improve the representativeness of the samples and provide accurate and reliable research outcomes. The main drawbacks are the unknown errors that can be detected after the chemical analysis and the scarce availability of previous hydrogeological analyses in less well-known areas.
In the current research, the sampling points are selected based on their relevance to the research question and their ability to provide meaningful information [32]. These points are selected with precision to ensure that they accurately represent the groundwater regime of the basin being studied. The main queries of Table 1 for the study areas are answered below, while the monitoring points were selected according to the characteristics of the study areas (Figure 3).
-
The principal purpose of the current work is the determination of groundwater qualitative and quantitative status of the Mediterranean regions to provide a fundamental river basin protocol for management. The selection of the research period was performed to protect the groundwater systems from the expected droughts according to the future climate scenarios and current human activities.
-
The pressures in the study areas, as well as the drawbacks of previously published works, are provided in the previous work of Ntona et al. [26].
-
Monitoring points were selected according to (i) the extent of the basin for the optimum distribution of the points, (ii) land use, (iii) geology, (iii) the easy access to boreholes to avoid gaps in time scale, and (iv) budget. The selection of the data is based on its use in groundwater modeling in the next steps of the research.
-
For the investigation of the variations during the year, a minimum of two sampling campaigns during the wet and dry period is suggested. Thus, the minimum period for field data collection is at least one hydrological year.

2.4. Statistical Analysis

Pearson correlation and principal component analysis (PCA)/factor analysis (FA) were used to find inter-relationships among the chemical parameters of the groundwater samples in the three basins. The PCA/FA was performed using R statistical software (version 4.2.1; R Foundation for Statistical Computing, Vienna, Austria).
In recent years, PCA has been widely used in hydrogeological studies to address a variety of environmental problems, including a comprehensive assessment of temporal and spatial changes in groundwater quality [33,34]. PCA is a multivariate statistical analysis method that depends on the orthogonal transformation to convert a set of observations of possibly correlated variables [35]. This method is applied to transform the original variables into new, uncorrelated variables (axes), which are linear compositions of the primary variables. FA is similar to PCA in the calculation principle. This internal analysis is the most widely used for its ability to directly obtain the common component number in a complex sample [36]. FA uses a lower number of unobserved variables to explain more complex relationships in the observed variables. In this study, PCA/FA was performed on the normalized variables for 2021 and 2022.
The Kaiser–Meyer–Olkin measure (KMO) test was applied to assess the suitability of the data for PCA/FA. According to the Kaiser [37] standard, the principle of eigenvalues being >1 was used to determine the number of principal components. Furthermore, values between 0.5 and 0.7 are mediocre, values from 0.7 to 0.8 are good, values between 0.8 and 0.9 are great, and values above 0.9 are superb. Values more than 0.5 signify a good justification for running factor analysis.
During the statistical analysis, samples characterized by over-high concentrations of a parameter were separated from the data base as they had a negative impact on the varifactor’s separation. Thus, two sampling points characterized by salinization with extremely high values of EC and Cl, around 8806–10,522 μS/cm and 2703–3195 mg/L, respectively, were eliminated before PCA/FA calculation.

3. Results

3.1. Basic Statistical Analysis

Basic statistical analysis was practiced as a first step to investigate the hydrochemical conditions of the study areas. The basic statistics of the groundwater quality parameters are summarized in Table S1. The geochemical evolution of groundwater can be recognized by plotting the concentrations of major cations and anions in a Piper diagram [38]. On average, the cation concentrations of groundwater in Eastern Thermaikos Gulf (TG) were in the order Ca2+ > Mg2+ > Na+ > K+, and those of the anions were in the order HCO3 > Cl > SO42− > NO3. In the other two areas, the order is almost similar: Ca2+ > Mg2+ > Na+ for cations and HCO3 > SO42− for anions (Figure 4). No significant variations are noted during the wet and dry period of 2021–2022 in the Mouriki basin and TG.
According to the chemical analysis, pH ranges from 5.9 to 7.9 in the Italian region, while in Greek regions, it varies between 6.8 and 8.3. Higher concentrations of Ca appeared in the Mouriki and Upper Volturno basins, with values ranging from 30 mg/L to 97 mg/L and from 21 mg/L to 288 mg/L, respectively. The predominant cation in all the areas is HCO3, fluctuating from 57% to 83% of the samples’ concentration. The concentrations of Na and Cl in TG are up to 1365 mg/L and 3195 mg/L, respectively, highlighting the seawater intrusion phenomenon in the coastal part of the area (Figure 5a).
The concentration of SO4 in the Mouriki basin ranges from 9 mg/L to 35 mg/L, with an average value of 28 mg/L. In the same basin, the concentration of Fe ranges between 25 μg/L and 218 μg/L, with an average value of 117 μg/L, while Zn fluctuates from 5 μg/L to 550 μg/L (Figure 5b). Both chemical elements are related to the fertilization of apple trees, which cover a large extent of the basin. High concentrations of As occur mainly due to the geological formations of TG [39,40]. Moreover, variations between the wet and dry periods appeared in the concentrations of Fe and As in TG, as well as in Zn and Ni in the Mouriki basin. The concentration of NO3 in the Upper Volturno basin fluctuated from 0 to 128 mg/L (Figure 5c), with an average value of 27 mg/L.

3.2. Pearson Correlation Analysis

The Pearson correlation coefficient is the most common method to measure the linear relationship between pairs of variables and then identify the associations between parameters. The correlation matrix based on Pearson’s correlation coefficient was applied to display the relationships between 10 main variables (Figure 6). A positive correlation is presented for the values close to +1, values approximately −1 indicate a strong negative correlation, and equal to zero designate no correlation. In the Mouriki basin, the negative weighting of K with all other components was observed, apart from pH, with a positive but weak correlation (r = 0.19), possibly due to the dissolution of clay minerals. A high positive correlation between Ca and SO4 (r = 0.95) indicates the presence of gypsum and the thermal power plant of Amyntaio close to the NE part of the basin [41]. The presence of carbonates can explain the strong correlation found for Ca, Mg, and HCO3 varying from 0.81 to 0.89.
In the Eastern Thermaikos Gulf, the pH has a negative correlation with all variables that can be explained by the pollutants released from industrial activities, which increases the concentrations of the rest of the ions. The high positive correlations between EC and the predominant ions (Na, K, Mg, Cl, SO4), with correlation coefficients higher than 0.9, indicate that the progressively increasing EC values may be ascribed to these ions released by the aquifer material as well as by seawater intrusion due to the high correlation between Na, Cl, and EC. Another strong correlation appeared between NO3, Na, Cl, and SO4 (r = 0.89 in all the cases), indicating the extensive use of N fertilizers in the area.
In the Upper Volturno basin, the dissolution of carbonate rocks is highlighted by the high correlation of HCO3 with Ca (r = 0.98), Mg (r = 0.83), and EC (r = 0.92). A negative correlation of NO3 with Na and Cl and a weak positive correlation with SO4 (r = 0.09) indicates the low N loading from fertilizers. In addition, potassium sulfate (K2SO4) and potassium chloride (KCl) fertilizers are absent according to the negative correlation between these components, with a range of values from −0.32 to −0.35. The correlation between Na and Cl (r = 0.76) can be attributed to some non-natural processes, such as leachates derived from the disposal of industrial waste septic tanks in rural areas and the use of manure.
In the third step of the proposed approach, ionic ratios were applied and plotted to confirm the current results. Figure 7a,b shows that the main hydrochemical composition of the sampling points in TG is evaporite rocks, while the samples from the Mouriki basin ranged between the silicate rock and evaporite rock, occurring in the silicate rock area. The samples from the Upper Volturno basin correspond mainly to carbonate rocks. The Na/Cl molar ratio (Figure 7c) was applied to recognize the evaporation state of the groundwater samples. Most groundwater samples plot in the freshwater evaporation line. Samples below the line correspond to Cl dissolution conditions (mainly halite dissolution). The results of the (Ca + Mg)/(HCO3 + SO4) ratio greater than unity further support the contribution of silicate weathering toward a higher concentration of Na instead of halite dissolution (Figure 7d). Additionally, climate conditions can affect the amount of evapotranspiration in a basin. The current results agree with those of Ntona et al. [26], where the rate of evapotranspiration in the Anthemountas basin is higher than in the other two basins. Since the Na/Cl ratio is commonly greater than 1, the excess of Na over Cl suggests additional contributions of Na from other sources. The (Ca + Mg)/Na scatter plot (Figure 7e) supports the ion exchange process in all the areas except four samples in TG. A strong correlation between NO3, SO4, and Na is observed in TG due to the excessive use of fertilizers in contrast to the Mouriki basin (Figure 7f).

3.3. Multivariate Statistical Analysis (MSA)

Multivariate statistical techniques are a tool for analyzing and interpreting datasets related to water quality and its temporal and spatial variations [42]. The multivariate statistical analysis (MSA) was employed to investigate the primary factors influencing the quality of groundwater in three Mediterranean regions. PCA/FA was used to identify potential pollution sources and their spatial distribution in the dry and wet periods of 2021–2022 and to evaluate the contribution of individual potential pollution sources. FA, with PCA as the extraction procedure, was applied to the datasets of all the parameters. Then, parameter commonalities were used to limit the number of variables that are significant contributors to the final factor model [43]. The varifactors (VFs) were extracted, including the variables EC, pH, NO3, NH4, Cl, SO4, Na, K, Mg, and Ca. The samples with very high EC and Cl concentrations from TG had a negative impact on the varifactors separation in the first run of PCA/FA; therefore, they were eliminated. The results of this process are individually presented for each area for both sampling periods and one period for the Italian region and are also compared with previously published research.

Data Structure Determination Using PCA and FA

PCA/FA analysis aims at data standardization and compares the composition patterns between groundwater samples to determine the important factors that affect each sample. The determined initial VFs in all the study areas are presented in Tables S2–S7, with their eigenvalues and cumulative % of the variance for the 2021–2022 periods. Based on the Kaiser Rule, in the samples of the Mouriki basin, the first two principal components were obtained with eigenvalue > 1 in the datasets of 2021 and 2022. This summarized 71.25% and 16.80% of the total variance in the 2021 groundwater quality datasets, respectively (Table S2), while for the groundwater samples of 2022, the variance of the VFs is 61.24% and 28.51%, respectively (Table S3). On the other hand, the samples from TG provide three VFs of 45.77%, 26.86%, and 15.15% of the total variance for the period 2021 (Table S4). The same number of VFs was obtained for samples in 2022, where an increase is observed in the first VF (63.66%), as shown in Table S5. Three VFs were obtained also in the Italian region of 49.07%, 20.56%, and 15.62% of the total variance for the period 2021 (Table S6). The variance factor rotation loading matrix of the selected groundwater quality parameters is presented in Table 2, where factor loadings > 0.75, 0.50–0.75, and 0.30–0.50 are considered to be strong, moderate, and weak, respectively. The results of the KMO test are provided in Table S7.
In the framework of MSA, the PCA/FA method was also applied using the data from all study areas. The results indicated that there might be a statistically significant interrelationship between variables (chemical parameters), which rendered the PCA/FA valid. The KMO value was 0.69, and the statistical analysis provided only two VFs, underestimating the contribution of the variables. Thus, in this case, the combination of limited data from different areas cannot be successfully performed in the investigation for the determination of the hydrogeological complexities in the basins/areas. In addition, multi-statistical analysis with all 21 variables was avoided as the VFs could not be separated. Therefore, in the cases of limited available data, a multi-statistical analysis of a maximum of ten variables is suggested.

3.4. Identification of Varifactors

In the Mouriki basin for the dry period of 2021, VF1 was influencing the groundwater quality, accounting for 71.25% of the total variance. Its eigenvalue was 7.13, and it had strong and positive loadings on Na, Ca, Mg, K, SO4, HCO3, and EC. It showed moderately positive loading on NO3. VF2, accounting for 16.80% of the total variance, had strong and positive loadings on Cl, NO3, and Na and strong negative loadings on pH. In 2022, VF1 accounted for 61.24% of the total variance, its eigenvalue was 6.12, and it had strong and positive loadings on Cl, SO4, NO3, Na, and EC, while strong negative loadings on pH. VF2 for the period 2022, accounting for 28.51% of the total variance with an eigenvalue of 2.85, provided strong positive loading on HCO3, Ca, Mg, and EC. In Eastern Thermaikos Gulf, VF1 accounted for 74.85% and showed strong positive loadings on all the variables except pH and HCO3. VF2 accounted for 18.70% with strong negative and positive loadings on pH and HCO3, respectively. The same results with few alterations appeared for the samples of 2022, where strong negative loadings were noticed only on pH. For the Upper Volturno basin, water samples were collected only during the dry period of 2021. VF1 accounted for 49.07% of the total variance with an eigenvalue of 4.9, and it had strong and positive loadings on HCO3, Ca, Mg, and EC. VF2 had strong positive loadings on Cl and Na, medium positive on SO4. VF3 had strong positive loadings on pH, medium on SO4, and weak on NO3.

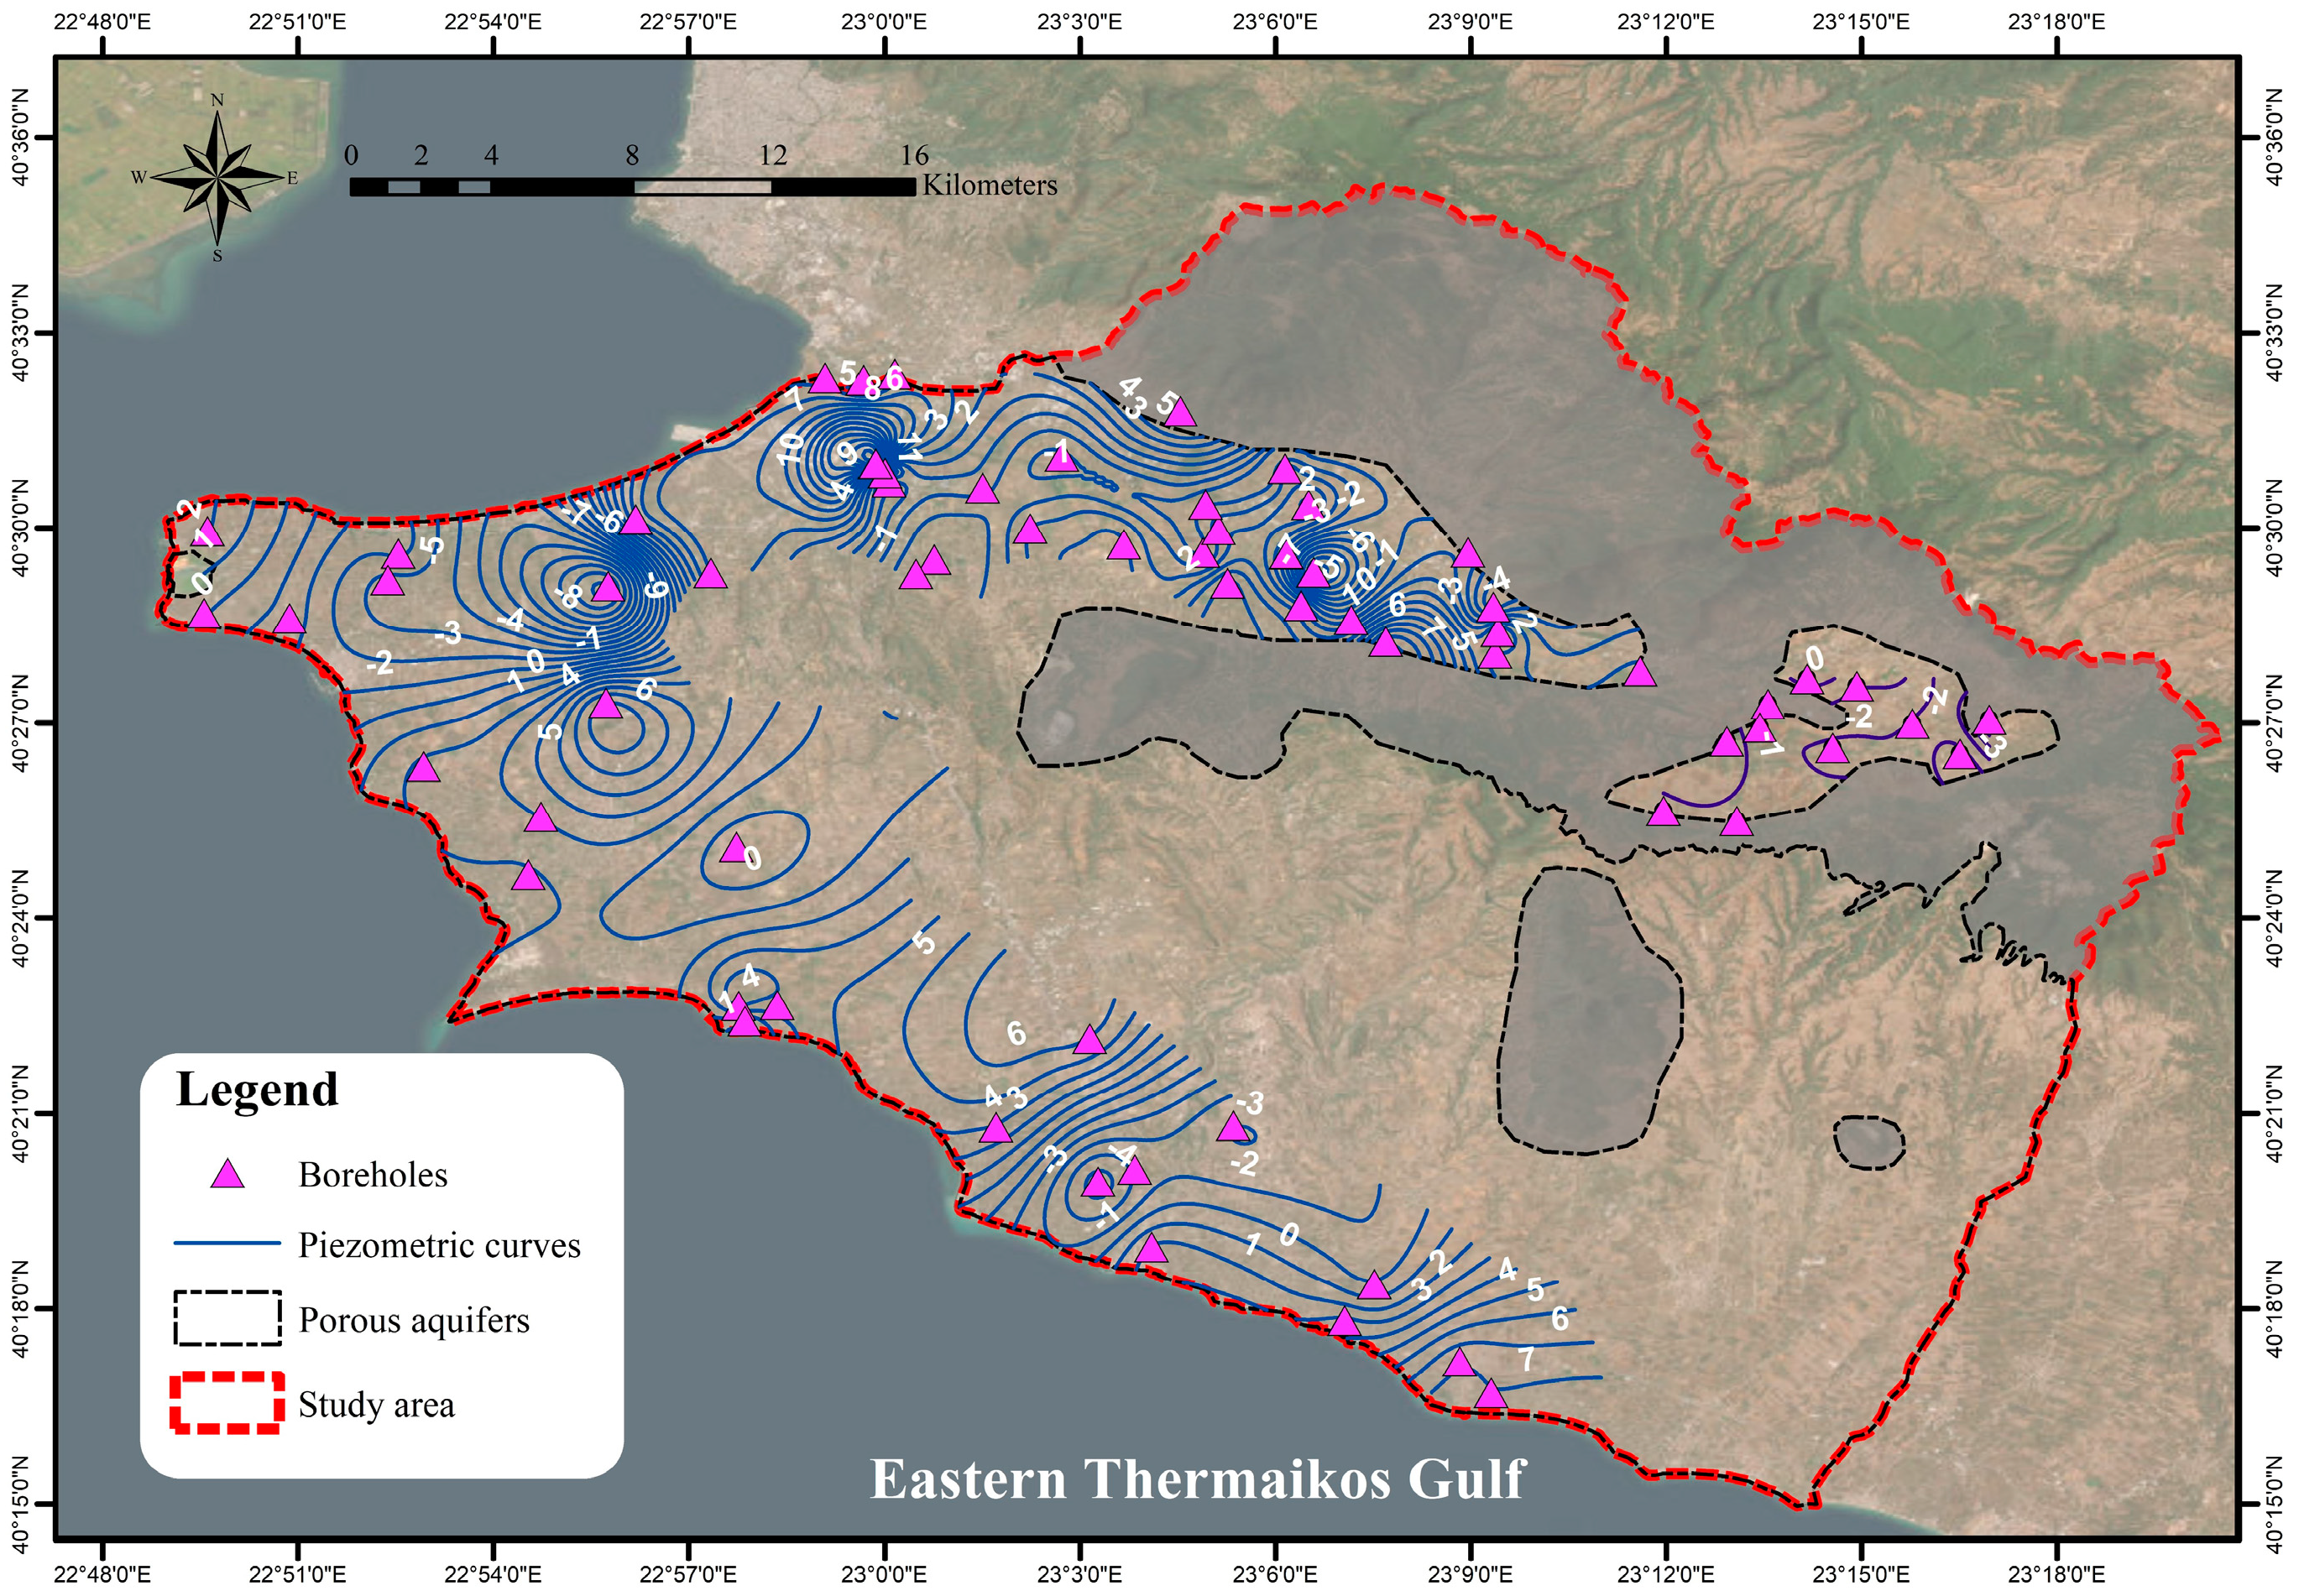
3.5. Groundwater Level Measurements

Long-period monitoring data of GWL measurements and rainfall data are provided in Figure 6 for TG. Wet and dry periods are separated to provide a clear view of the variations in each season over time. Two boreholes in the coastal (11 m above sea level) and inland (85 m above sea level) areas of TG were chosen to demonstrate the variations in the piezometric head from 2011 to 2022. The seasonal variation in the piezometric head in the coastal borehole is approximately 4 m during the wet and dry periods of the monitoring years (Figure 8a). On the other hand, minor GWL fluctuations are noted in the inland borehole (Figure 8b), where the over-pumping limits the increase in GWL. In addition, a significant decline in GWL is observed over time due to the over-pumping in the coastal/agricultural areas. In both cases, the variation in rainfall during the years affects the groundwater piezometry. In particular, the high values of 754 mm during 2014 contributed to the increase in the piezometric head.
In the Mouriki basin, the GWL data were used to provide the variations in the groundwater depth during the years 2004 and 2022 (Figure 9). In TG, the variation in the piezometric head between the wet periods of 2011 and 2022 is provided in Figure 10, considering previously published data. Figure 11 shows the GWL variation during the years 2006 and 2016 in the study area of the Upper Volturno basin. Groundwater depth in the Mouriki basin varies from 0 m to 19.7 m during the wet periods of the monitoring years. Figure 8 depicts the negative variation in piezometric heads over 18 years in the Mouriki basin based on the available GWL data.
The same trend is observed in TG over 11 years (Figure 8), where groundwater depth varies from 0.4 m to 125.3 m based on the measurements in the spring period. In the coastal area, the increase in the piezometric head is probably caused by the reduction in pumping due to the high salinity of water. The opposite condition of negative piezometric curves appears in the areas affected by agricultural activities, highlighting the results of the overexploitation during the years. Groundwater depth in the Upper Volturno basin varies from 25.5 m to 149 m during the monitoring periods. The variation in GWL in porous aquifers varies between −4.8 m and 8.1 m (Figure 9).

4. Discussion

Adopting new approaches, namely critical sampling, was tested within this study. This concept follows the current trend of global interest in research techniques to control the dynamics of groundwater pollution [44]. The assessment of groundwater quality and quantity variations is essential for groundwater management and protection [45]; however, the creation of a large database and the application of different methodological approaches make the analysis costly [46]. MSA of physicochemical parameters is suggested in the current work as a low-cost technique to achieve a more accurate evaluation of pollution sources based on judgmental sampling. This method was practiced in three different areas in the Mediterranean region to test it in different hydrological and hydrogeological environments. Pearson correlation, PCA, and FA were conducted to analyze the relationship between the variables and evaluate the factors (natural and anthropogenic) affecting hydrochemical components. These methods have been widely used for such analysis around the world to explore the relationship among water quality variables and optimize the monitoring network and basin management [47,48,49].
MSA requires a larger number of samples to obtain higher reliability [50]. Nevertheless, the results of the current work show that in cases where the hydrogeological characteristics and pressures of the study areas are well known, fewer and more specific groundwater samples could be collected for the investigation of the temporal groundwater variability. More specifically, this research approach highlights the importance of comparison of full-field hydrogeological studies.
According to the results, most of the samples are affected by a combination of factors. For instance, cultivable lands in TG have a distance of a few meters from the coastline; consequently, both seawater intrusion due to the over-pumping of groundwater and the unregulated use of fertilizers affect the water quality. As expected, the results of the multi-statistical analysis showed that the geological formations and livestock activities are the main influences in the area. The selection of samples (even in low distribution compared to the whole extent of the basin) illustrated the factors’ degree of influence. Thus, selecting the most representative sampling points plays a vital role in the optimal determination of groundwater quality status.
Positive and negative GWL variations are noted in all the study areas, while the most significant variations are observed in the TG. In the last years, coastal urban and agricultural zones have been the main study areas for climate-related ocean and sea level changes, with significant impacts on groundwater resources. The causes of GW rise in the coastal part of TG are not easy to identify with the current results. In a similar case, the determination of the extent of sea level and groundwater rise interaction was investigated by De Biase et al. [51] with numerical modeling.
According to Li et al. [52], the establishment of a monitoring network is of utmost importance to investigate spatiotemporal variations in groundwater systems. This point is confirmed by the current work, where the pressures in the study areas are validated by Ntona et al. [26]. The critical sampling analysis provides a lower-cost approach with the same results as other more expensive approaches due to a great deal of samples. The results of the applied methodology are in agreement with previous studies [53,54], where a larger amount of data was collected to depict the GW status of the areas. A reduction of around 80% in the sampling points was chosen in the TG and Mouriki basin. Nevertheless, even more detailed sampling methods are crucial in the first research steps in unexplored areas. The framework of judgmental sampling was conducted based on the characteristics of semi-arid areas of the Mediterranean region.
Based on our knowledge, the random and capture–recapture sampling methods have not been applied for groundwater monitoring. Patently, the random method is characterized by a high percentage of errors. On the other hand, the capture–recapture method can be applied in the field but increases the difficulty of the fieldwork due to the frequency of the sampling collection and different sampling points in time. As concern the limitations of this methodology, it should be noted that the effectiveness of this application can be prosperous and with low risks in cases where the study areas have already been investigated. More details about the judgmental method can be found in Hannover [55]. Moreover, the application of PCA/FA in different study areas with the same analysis approach does not provide satisfactory results due to the limited points. Along these, a multi-statistical analysis of a maximum of ten variables is suggested to avoid misinterpretations. The spatial distribution of the water variables has limitations due to the long distance between the monitoring points, so this approach is not recommended in cases where the spatial extent of pollution is investigated. Combined qualitative and quantitative groundwater measurements can eliminate the errors of the critical sampling approach by jointly analyzing the hydrological and hydrogeological characteristics of the study area. Thus, the methodology with the optimum results is applied according to the data availability and critical thought of the researchers. In the last decades, efforts have been made to create and enrich open databases for widely available data and avoid repeated chemical analyses by different agencies. In this way, the possible hazards of the current work could be minimized in future approaches.
We strongly believe that the current results can play a vital role in the decision making of stakeholders for groundwater management [56] and pollution control. This research approach proves that valuable information about the variations in the main parameters of groundwater can also be obtained by judgmental sampling approaches.
This research will support future studies and practices. In future works, forecasting methods can be performed to explore predictive and normative scenarios. For instance, environmental scanning could generate the background information from which to forecast or develop scenarios. Overall, this standard information can be used in a primary monitoring stage, while in future steps, more detailed chemical analysis can be performed, including BOD, COD, microbiological, and isotope analysis, depending on the needs of each research. In addition, to specify the causes of positive GWL variations in the coastal part of TG, future research is suggested for the investigation of the sea level and groundwater rise interaction based on numerical modeling, including the MODFLOW model.

5. Conclusions

In the current work, an MSA approach was adopted based on a non-probability sampling technique to identify the groundwater hydrochemical evolution in three Mediterranean regions. The selection of the optimal groundwater monitoring technique in a study area is related to the natural characteristics of groundwater, the pressures, the available scientific data, and the financial budget. The judgmental sampling approach was applied for the conceptualization of the hydrogeological regime, concluding the following:
(1)
The judgmental sampling approach can contribute to a cost and time-effective groundwater monitoring plan of a basin.
(2)
The application of the judgemental sampling approach provides reliable results regarding groundwater evolution. This information is crucial for the optimal application of water resource management and control techniques.
(3)
The implementation of a judgemental sampling approach should be performed periodically to minimize bias.
(4)
The methodological approach applied within this study is flexible and can be modified according to the specific characteristics of the site.
The results were verified by using PCA/FA and Pearson correlation analysis. The selected groundwater samples highlight the quality of groundwater in three study areas, the results of which are summarized below:
(1)
No significant variations in the physicochemical parameters of groundwater samples appeared between the two sampling periods.
(2)
Variations between the wet and dry periods appeared in the concentrations of Fe and As in Eastern Thermaikos Gulf as well as in Zn and Ni in the Mouriki basin.
(3)
NO3 pollution occurs in all the areas except the Mouriki basin, where mainly Zn fertilizers are applied.
(4)
Salinization dominates as a pollution process in the coastal aquifer of Eastern Thermaikos Gulf.
(5)
Groundwater quality decline has been observed in Eastern Thermaikos Gulf and Mouriki basin over the years due to overexploitation for agricultural activities.
The data from groundwater level measurements collected in the field and from previous works highlight the following results:
(1)
A significant decline in GWL is observed over time in Eastern Thermaikos Gulf due to the over-pumping in the coastal/agricultural areas.
(2)
Negative and positive variations in GWL during the last decades appeared in all the areas.
(3)
Maximum recovery of GWL was noted in the Mouriki basin for the period 2014–2022.

Supplementary Materials

The following supporting information can be downloaded at: https://0-www-mdpi-com.brum.beds.ac.uk/article/10.3390/w15224018/s1, Table S1: Basic statistics of groundwater quality parameters in the study areas; Table S2: Total Variance Explained in Mouriki basin (2021); Table S3: Total Variance Explained in Mouriki basin (2022); Table S4: Total Variance Explained in Thermaikos Gulf (2021); Table S5: Total Variance Explained in Thermaikos Gulf (2022); Table S6: Total Variance Explained in Upper Volturno basin (2021); Table S7: The results of KMO test.

Author Contributions

Conceptualization, M.M.N., N.K., K.C. and M.M.; Data collection, M.M.N, K.K. and G.B; Software, M.M.N.; Formal analysis, K.K. and M.M.N.; Writing—original draft preparation, M.M.N.; Writing—review and editing, M.M.N., N.K., M.M. and G.B.; Visualization, M.M.N.; Methodology, M.M.N.; Supervision, N.K., M.M. and K.C.; Project administration, N.K. and M.M.; Funding acquisition, N.K., M.M. and M.M.N. All authors have read and agreed to the published version of the manuscript.

Funding

This research project was supported financially by the Hellenic Foundation for Research and Innovation (H.F.R.I.) under the “Second Call for H.F.R.I. Research Projects to support Post- Doctoral Researchers” (Project Number: 00138, Title: Groundwater Depletion. Are Eco-Friendly Energy Recharge Dams a Solution?). The scholarship and research activities of Maria Margarita Ntona were part of the Environment, Design, and Innovation Ph.D. Program funded by the V:ALERE 2020 Program (VAnviteLli pEr la RicErca) of the University of Campania “Luigi Vanvitelli”.

Data Availability Statement

Data are contained within the article and supplementary materials.

Acknowledgments

We acknowledge the financial support by the Hellenic Foundation for Research and Innovation (H.F.R.I.) under the “Second Call for H.F.R.I. Research Projects to support Post- Doctoral Researchers” (Project Number: 00138, Title: Groundwater Depletion. Are Eco-Friendly Energy Recharge Dams a Solution?). The scholarship and research activities of Maria Margarita Ntona were part of the Environment, Design, and Innovation Ph.D. Program funded by the V:ALERE 2020 Program (VAnviteLli pEr la RicErca) of the University of Campania “Luigi Vanvitelli”.

Conflicts of Interest

The authors declare no conflict of interest.

References

  1. Chandnani, G.; Gandhi, P.; Kanpariya, D.; Parikh, D.; Shah, M.A. A comprehensive analysis of contaminated groundwater: Special emphasis on nature-ecosystem and socio-economic impacts. Ground. Sustain. Dev. 2022, 19, 100813. [Google Scholar] [CrossRef]
  2. Modibo Sidibé, A.; Lin, X.; Koné, S. Assessing Groundwater Mineralization Process, Quality, and Isotopic Recharge Origin in the Sahel Region in Africa. Water 2019, 11, 789. [Google Scholar] [CrossRef]
  3. Luetkemeier, R.; Söller, L.; Frick-Trzebitzky, F. Anthropogenic Pressures on Groundwater. In Encyclopedia of Inland Waters, 2nd ed.; Elsevier: Amsterdam, The Netherlands, 2022; pp. 548–559. [Google Scholar]
  4. Chaudhary, A.; Dwivedi, A.; Bhaskarwar, A.N. Qualitative and Quantitative Analysis of Water. Appl. Water Sci. 2021, 1, 469–502. [Google Scholar]
  5. Zhang, Q.; Wang, H.; Wang, L. Tracing nitrate pollution sources and transformations in the over-exploited groundwater region of north China using stable isotopes. J. Contam. Hydrol. 2018, 218, 1–9. [Google Scholar] [CrossRef]
  6. He, X.; Li, P.; Shi, H.; Xiao, Y.; Guo, Y.; Zhao, H. Identifying strontium sources of flowback fluid and groundwater pollution using 87Sr/86Sr and geochemical model in Sulige gasfield, China. Chemosphere 2022, 306, 135594. [Google Scholar] [CrossRef]
  7. Voltaggio, M.; Spadoni, M.; Sacchi, E.; Sanam, R.; Pujari, P.R.; Labhasetwar, P.K. Assessment of groundwater pollution from ash ponds using stable and unstable isotopes around the Koradi and Khaperkheda thermal power plants (Maharashtra, India). Sci. Total Environ. 2015, 518–519, 616–625. [Google Scholar] [CrossRef]
  8. Zhao, X.; Wang, D.; Xu, H.; Ding, Z.; Shi, Y.; Lu, Z.; Cheng, Z. Groundwater pollution risk assessment based on groundwater vulnerability and pollution load on an isolated island. Chemosphere 2022, 289, 133134. [Google Scholar] [CrossRef]
  9. Giao, N.T.; Nhien, H.T.H.; Anh, P.K.; Thuptimdang, P. Groundwater quality assessment for drinking purposes: A case study in the Mekong Delta, Vietnam. Sci. Rep. 2023, 13, 4380. [Google Scholar] [CrossRef]
  10. Che Nordin, N.F.; Mohd, N.S.; Koting, S.; Ismail, Z.; Sherif, M.; El-Shafie, A. Groundwater quality forecasting modelling using artificial intelligence: A review. Groundw. Sustain. Dev. 2021, 14, 100643. [Google Scholar] [CrossRef]
  11. Haggerty, R.; Sun, J.; Yu, H.; Li, Y. Application of machine learning in groundwater quality modelling—A comprehensive review. Water Res. 2023, 233, 119745. [Google Scholar] [CrossRef]
  12. Abuzaid, A.S.; Jahin, H.S. Combinations of multivariate statistical analysis and analytical hierarchical process for indexing surface water quality under arid conditions. J. Contam. Hydrol. 2022, 248, 104005. [Google Scholar] [CrossRef] [PubMed]
  13. Busico, G.; Cuoco, E.; Kazakis, N.; Colombani, N.; Mastrocicco, M.; Tedesco, D.; Voudouris, K. Multivariate statistical analysis to characterize/discriminate between anthropogenic and geogenic trace elements occurrence in the Campania Plain, Southern Italy. Environ. Pollut. 2018, 234, 260–269. [Google Scholar] [CrossRef] [PubMed]
  14. Liu, F.; Zhao, Z.; Yang, L.; Ma, Y.; Xu, Y.; Gong, L.; Liu, H. Geochemical characterization of shallow groundwater using multivariate statistical analysis and geochemical modeling in an irrigated region along the upper Yellow River, Northwestern China. J. Geochem. Explor. 2020, 215, 106565. [Google Scholar] [CrossRef]
  15. Parisi, A.; Alfio, M.R.; Balacco, G.; Güler, C.; Fidelibus, M.D. Analyzing spatial and temporal evolution of groundwater salinization through Multivariate Statistical Analysis and Hydrogeochemical Facies Evolution-Diagram. Sci. Total Environ. 2023, 862, 160697. [Google Scholar] [CrossRef] [PubMed]
  16. Park, S.; Tsourlos, P.; Shin, S. Electrical resistivity tomography (ERT) monitoring of leachate seepage from an animal carcass waste (ACW) facility, South Korea. J. Appl. Geoph. 2022, 206, 104809. [Google Scholar] [CrossRef]
  17. Matiatos, I. Nitrate source identification in groundwater of multiple land-use areas by combining isotopes and multivariate statistical analysis: A case study of Asopos basin (Central Greece). Sci. Total Environ. 2016, 541, 802–814. [Google Scholar] [CrossRef]
  18. Meghdadi, A.; Javar, N. Quantification of spatial and seasonal variations in the proportional contribution of nitrate sources using a multi-isotope approach and Bayesian isotope mixing model. Environ. Poll. 2018, 235, 207–222. [Google Scholar] [CrossRef]
  19. Banda, T.D.; Kumarasamy, M. Application of Multivariate Statistical Analysis in the Development of a Surrogate Water Quality Index (WQI) for South African Watersheds. Water 2020, 12, 1584. [Google Scholar] [CrossRef]
  20. Davis, H.T.; Marjorie Aelion, C.; McDermott, S.; Lawson, A.B. Identifying natural and anthropogenic sources of metals in urban and rural soils using GIS-based data, PCA, and spatial interpolation. Environ. Poll. 2019, 157, 2378–2385. [Google Scholar] [CrossRef]
  21. Machiwal, D.; Jha, M.K. Identifying sources of groundwater contamination in a hard-rock aquifer system using multivariate statistical analyses and GIS-based geostatistical modeling techniques. J. Hydrol. Reg. Stud. 2015, 4, 80–110. [Google Scholar] [CrossRef]
  22. Meng, L.; Zuo, R.; Wang, J.; Yang, J.; Teng, Y.; Shi, R.; Zhai, Y. Apportionment and evolution of pollution sources in a typical riverside groundwater resource area using PCA-APCS-MLR model. J. Contam. Hydrol. 2018, 218, 70–83. [Google Scholar] [CrossRef] [PubMed]
  23. Tizro, A.T.; Fryar, A.E.; Vanaei, A.; Kazakis, N.; Voudouris, K.; Mohammadi, P. Estimation of total dissolved solids in Zayandehrood River using intelligent models and PCA. Sustain. Water Res. Manag. 2021, 7, 22. [Google Scholar] [CrossRef]
  24. Xiao, Y.; Hao, Q.; Zhang, Y.; Zhu, Y.; Yin, S.; Qin, L.; Li, X. Investigating sources, driving forces and potential health risks of nitrate and fluoride in groundwater of a typical alluvial fan plain. Sci. Total Environ. 2022, 802, 149909. [Google Scholar] [CrossRef] [PubMed]
  25. Busico, G.; Ntona, M.M.; Carvalho, S.C.P.; Patrikaki, O.; Voudouris, K.; Kazakis, N. Simulating future groundwater recharge in coastal and inland catchments. Water Resour. Manag. 2021, 35, 3617–3632. [Google Scholar] [CrossRef]
  26. Ntona, M.M.; Busico, G.; Mastrocicco, M.; Kazakis, N. Coupling SWAT and DPSIR models for groundwater management in Mediterranean catchments. J. Environ. Manag. 2023, 344, 118543. [Google Scholar] [CrossRef]
  27. Appelo, C.A.J.; Postma, D. Geochemistry, Groundwater and Pollution, 2nd ed.; A.A. Balkema: Rotterdam, The Netherlands, 2005; p. 649. [Google Scholar]
  28. Retike, I.; Bikse, J.; Kalvans, A.; Delina, A.; Avotniece, Z.; Zaadnoordijk, W.J.; Jeme janova, M.; Popovs, K.; Babre, A.; Zelenkevics, A.; et al. Rescue of groundwater level time series: How to visually identify and treat errors. J. Hydrol. 2022, 605, 127294. [Google Scholar] [CrossRef]
  29. Leach, J.M.; Coulibaly, P.; Guo, Y. Entropy based groundwater monitoring network design considering spatial distribution of annual recharge. Adv. Water Resour. 2016, 96, 108–119. [Google Scholar] [CrossRef]
  30. Azadi, S.; Amiri, H.; Ataei, P.; Javadpour, S. Optimal design of groundwater monitoring networks using gamma test theory. Hydrogeol. J. 2020, 28, 1389–1402. [Google Scholar] [CrossRef]
  31. Ayvaz, M.T.; Elçi, A. Identification of the optimum groundwater quality monitoring network using a genetic algorithm based optimization approach. J. Hydrol. 2018, 563, 1078–1091. [Google Scholar] [CrossRef]
  32. Ayhan, H.Ö. Non-probability Sampling Survey Methods. In International Encyclopedia of Statistical Science; Springer: Berlin/Heidelberg, Germany, 2011; pp. 979–982. [Google Scholar] [CrossRef]
  33. Jiang, Y.; Guo, H.; Jia, Y.; Cao, Y.; Hu, C. Principal component analysis and hierarchical cluster analyses of arsenic groundwater geochemistry in the Hetao basin, Inner Mongolia. Geochemistry 2015, 75, 197–205. [Google Scholar] [CrossRef]
  34. Zhang, H.; Cheng, S.; Li, H.; Fu, K.; Xu, Y. Groundwater pollution source identification and apportionment using PMF and PCA-APCA-MLR receptor models in a typical mixed land-use area in Southwestern China. Sci. Total Environ. 2020, 741, 140383. [Google Scholar] [CrossRef] [PubMed]
  35. Sun, X.; Zhou, Y.; Yuan, L.; Li, X.; Shao, H.; Lu, X. Integrated decision-making model for groundwater potential evaluation in mining areas using the cusp catastrophe model and principal component analysis. J. Hydrol. Reg. Stud. 2021, 37, 100891. [Google Scholar] [CrossRef]
  36. Audet, C.; Bigeon, J.; Cartier, D.; Le Digabel, S.; Salomon, L. Performance indicators in multi objective optimization. Eur. J. Oper. Res. 2020, 292, 397–422. [Google Scholar] [CrossRef]
  37. Kaiser, H.F. An index of factorial simplicity. Psychometrika 1974, 39, 31–36. [Google Scholar] [CrossRef]
  38. Piper, A.M. A graphical procedure in the geochemical interpretation of water analysis. Eos Trans. Am. Geophys. Union 1944, 25, 914. [Google Scholar] [CrossRef]
  39. Kouras, A.; Katsoyiannis, I.; Voutsa, D. Distribution of arsenic in groundwater in the area of Chalkidiki, Northern Greece. J. Hazar. Mat. 2007, 147, 890–899. [Google Scholar] [CrossRef]
  40. Kazakis, N.; Busico, G.; Ntona, M.M.; Philippou, K.; Kaprara, E.; Mitrakas, M.; Bannenberg, M.; Ioannidou, A.; Pashalidis, I.; Colombani, N.; et al. The origin of uranium in groundwater of the eastern Halkidiki region, northern Greece. Sci. Total Environ. 2022, 812, 152445. [Google Scholar] [CrossRef]
  41. Tzampoglou, P.; Loupasakis, C. Hydrogeological Hazards in Open Pit Coal Mines–Investigating Triggering Mechanisms by Validating the European Ground Motion Service Product with Ground Truth Data. Water 2023, 15, 1474. [Google Scholar] [CrossRef]
  42. Li, M.; Liu, Z.; Zhang, M.; Chen, Y. A workflow for spatio-seasonal hydro-chemical analysis using multivariate statistical techniques. Water Res. 2021, 188, 116550. [Google Scholar] [CrossRef]
  43. Okiongbo, K.S.; Douglas, R.K. Evaluation of major factors influencing the geochemistry of groundwater using graphical and multivariate statistical methods in Yenagoa city, southern Nigeria. Appl. Water Sci. 2015, 5, 27–37. [Google Scholar] [CrossRef]
  44. Zhu, X.; Miao, P.; Qin, J.; Li, W.; Wang, L.; Chen, Z.; Zhou, J. Spatio-temporal variations of nitrate pollution of groundwater in the intensive agricultural region: Hotspots and driving forces. J. Hydrol. 2023, 623, 129864. [Google Scholar] [CrossRef]
  45. Taghavi, N.; Niven, R.K.; Paull, D.J.; Kramer, M. Groundwater vulnerability assessment: A review including new statistical and hybrid methods. Sci. Total Environ. 2022, 822, 153486. [Google Scholar] [CrossRef] [PubMed]
  46. Guo, Z.; Chen, K.; Yi, S.; Zheng, C. Response of groundwater quality to river-aquifer interactions during managed aquifer recharge: A reactive transport modeling analysis. J. Hydrol. 2023, 616, 128847. [Google Scholar] [CrossRef]
  47. Haji Gholizadeh, M.; Melesse, A.M.; Reddi, L. Water quality assessment and apportionment of pollution sources using APCS-MLR and PMF receptor modeling techniques in three major rivers of South Florida. Sci. Total Environ. 2016, 566–567, 1552–1567. [Google Scholar] [CrossRef] [PubMed]
  48. Abdelaziz, S.; Gad, M.I.; El Tahan, A.H.M.H. Groundwater quality index based on PCA: Wadi El-Natrun, Egypt. J. Afr. Earth Sci. 2020, 172, 103964. [Google Scholar] [CrossRef]
  49. Chen, Z.; Zhou, Q.; Lv, J.; Jiang, Y.; Yang, H.; Yang, H.; Mei, S.; Jia, Z.; Zhang, H.; Jin, Y.; et al. Assessment of Groundwater Quality Using APCS-MLR Model: A Case Study in the Pilot Promoter Region of Yangtze River Delta Integration Demonstration Zone, China. Water 2023, 15, 225. [Google Scholar] [CrossRef]
  50. Thurston, G.D.; Spengler, J.D. A quantitative assessment of source contributions to inhalable particulate matter pollution in metropolitan Boston. Atmos. Environ. 1985, 19, 9–25. [Google Scholar] [CrossRef]
  51. De Biase, M.; Chidichimo, F.; Maiolo, M.; Micallef, A. The Impact of Predicted Climate Change on Groundwater Resources in a Mediterranean Archipelago: A Modelling Study of the Maltese Islands. Water 2021, 13, 3046. [Google Scholar] [CrossRef]
  52. Li, H.; Gu, J.; Hanif, A.; Dhanasekar, A.; Carlson, K. Quantitative decision making for a groundwater monitoring and subsurface contamination early warning network. Sci. Total Environ. 2019, 683, 498–507. [Google Scholar] [CrossRef]
  53. Kazakis, N.; Mattas, C.; Pavlou, A.; Patrikaki, O.; Voudouris, K. Multivariate statistical analysis for the assessment of groundwater quality under different hydrogeological regimes. Environ. Earth Sci. 2017, 76, 349. [Google Scholar] [CrossRef]
  54. Patrikaki, O.; Kazakis, N.; Voudouris, K. Vulnerability map: A useful tool for groundwater protection: An example from Mouriki basin, North Greece. Fresenius Environ. Bull. 2012, 21, 2516–2521. [Google Scholar]
  55. Hannover, B. Evaluation of Performance: A Judgmental Approach; Springer: New York, NY, USA, 1988. [Google Scholar]
  56. Karakatsanis, D.; Patsialis, T.; Kalaitzidou, K.; Kougias, I.; Ntona, M.M.; Theodossiou, N.; Kazakis, N. Optimization of dam operation and interaction with groundwater. An overview focusing on Greece. Water 2023, 15, 3852. [Google Scholar] [CrossRef]
Figure 1. Location of the three study areas.
Water 15 04018 g001
Figure 2. Positive and negative effects of judgmental sampling.
Water 15 04018 g002
Figure 3. Parameters for selection and judgmental groundwater sampling in the study areas.
Water 15 04018 g003
Figure 4. Groundwater hydrochemical facies for the wet and dry periods in the three study areas.
Water 15 04018 g004
Figure 5. Distribution of Cl in the Eastern Thermaikos Gulf (a), Zn in the Mouriki basin (b), and NO3 in the Upper Volturno basin (c).
Water 15 04018 g005
Figure 6. Correlation matrix of chemical parameters in groundwater samples of (a) Mouriki basin, (b) East Thermaikos Gulf, and (c) Upper Volturno basin.
Water 15 04018 g006
Figure 7. Ionic ratio plots relative to groundwater samples from M = Mouriki basin, TG = Eastern Thermaikos Gulf, and V = Upper Volturno basin: (a) (Mg/Na)/(Ca/Na), (b) (HCO3/Na)/(Ca/Na), (c) Na/Cl, (d) (Ca + Mg)/(HCO3 + SO4), (e) (Ca + Mg)/Na, and (f) NO3/SO4 with Na.
Water 15 04018 g007
Figure 8. Rain and piezometric head variation in monitoring boreholes of (a) coastal and (b) inland areas of Eastern Thermaikos Gulf during 2011–2022.
Water 15 04018 g008
Figure 9. Variation in the piezometric head in the Mouriki basin between May 2004 and 2022.
Water 15 04018 g009
Figure 10. Variation in the piezometric head in Eastern Thermaikos Gulf between May 2011 and 2022.
Water 15 04018 g010
Figure 11. Variation in the piezometric head in the Upper Volturno basin between May 2006 and 2016.
Water 15 04018 g011
Table 1. Parameters for judgmental groundwater sampling.
ParameterDescription
Definition of the target
-
What is the main purpose of the research?
-
Why now?
Aquifer types
-
Groundwater level
-
Porosity
-
Aquifers complexity
Hydro morphological zonesImpacts of hydro morphological pressures (e.g., soil erosion)
Land Use
-
Land use footprint
-
Spatial and temporal variation
Previous data
-
Available and missing data
-
Methodologies and Results evaluation
-
Unanswered questions
Point representativenessComparison of sampling points
Study area
-
Determination of the extent of the basin/area
-
Morphology
CostFunds availability
Time
-
Research timetable
-
Repetition of sampling
-
Researchers’ availability
Field issues
-
Sampling point accessibility
-
Number and reliability of sampling points
Table 2. Loadings of the selected groundwater quality parameters on varimax rotated factors in 2021 and 2022 sampling periods in the study areas.
Mouriki basinThermaikos GulfVolturno basin
20212022202120222021
ParametersComponentComponentComponentComponentComponent
12121212123
pH−0.040−0.962−0.8820.268−0.156−0.910−0.107−0.990−0.006−0.0930.867
EC0.9450.3230.6520.7510.9960.0710.9700.1870.9370.239−0.006
HCO30.8460.148−0.2760.925−0.1320.9150.9070.1860.9650.103−0.202
Cl0.2860.8700.9470.2900.998−0.0180.9780.1090.4480.848−0.064
SO40.9470.2190.9610.0660.986−0.0290.9760.0820.0630.5810.696
SO40.6850.6570.9610.0660.915−0.1540.9730.044−0.493−0.1450.491
Na+0.3750.7670.8260.3930.9880.0440.9540.155−0.1350.961−0.033
K+−0.804−0.409−0.458−0.5930.9660.1620.8830.323−0.8650.007−0.373
Ca2+0.9820.149−0.0220.9870.8690.4260.8740.3980.9510.161−0.114
Mg2+0.9100.3190.5830.8080.973−0.0350.8920.0410.890−0.158−0.075
Eigenvalue7.131.686.122.857.491.878.211.034.92.061.56
Disclaimer/Publisher’s Note: The statements, opinions and data contained in all publications are solely those of the individual author(s) and contributor(s) and not of MDPI and/or the editor(s). MDPI and/or the editor(s) disclaim responsibility for any injury to people or property resulting from any ideas, methods, instructions or products referred to in the content.

