1. Introduction
As a fundamental resource for life, water has represented a key factor for human development and a central issue for the international community for many years. Nowadays, “scarcity” is one of the adjectives most associated with the word “water” [
1]. Many areas of the world have reached critical levels and can be considered water scarce [
2].
The Intergovernmental Panel on Climate Change (IPCC) Fourth Assessment Report identifies climate change, future population growth, and economic and land-use change as the most inherent reasons for the increase in water stress [
3]. The perspective in the world population growth rate [
4] states that the higher food demand will imply a direct effect on agricultural water usage in the future.
It is estimated that agriculture is currently responsible for 70% of global water withdrawals [
5], and nearly a third of that is attributed to livestock production and, in turn, a third of this is related to beef cattle [
6]. Today, livestock production inflicts great ecological damage, such as GHG (greenhouse gas) emissions, acidification, nitrification and erosion of soil, eutrophication, biodiversity loss, and global freshwater stress [
7,
8,
9]. In addition, the FAO (Food and Agriculture Organization of the United Nations) has foreseen that global meat production and consumption will double by 2050, compared to 2000 [
7]. This increase in consumption will have a further negative impact on the amount of freshwater available in the coming decades [
10].
According to the FAO, the world population is steadily increasing and will reach the threshold of 9 billion people by 2050. This will involve, first of all, a greater need for food, especially for animal protein sources (from cattle, pork, poultry, and fish), and greater consequences on freshwater resources, environment, and sustainability [
11,
12].
In this context, there is the need, for example, to rethink our current food patterns and habits for the future, in order to reduce the pressure on freshwater resources. The need to quantify and take into account the water consumption needed for the production of a particular good comes from the fact that, the reserves of fresh water on our planet are evidently very scarce and are critical to the survival of the species, and to ensure human development in the future generations.
Among the several available indicators able to take into account the water consumption of production cycles, the WF is relatively easy to calculate and communicate, and it allows us to compare different products and services on the basis of the volume of water required to produce them [
13].
The aim of this work is to assess the WF of the production of edible insects with a focus also on the water consumption linked to their protein content and, finally, to provide a comparison with other animal protein sources.
Entomophagy, in fact, could represent a good alternative source of quality proteins and nutrients—such as unsaturated and essential fatty acids (especially omega 3 and 6), vitamins (the same high content of B12 of fish), fibers, and minerals (15% more iron than spinach)—even for the inhabitants of developed countries [
14,
15,
16].
In fact, for several centuries in many regions of the world, insects have been a very popular component of the diet, both as an effective source of essential nutrients and as a functional food [
17,
18]. Nowadays, there are about 2000 species of insects regularly eaten in the world by about two billion people (over 3000 ethnic groups),
i.e., one third of the world population, in approximately 80% of countries [
19,
20].
In this paper, we have determined the water footprint of two types of mealworms (
Coleoptera:
Tenebrionidae) that are of great interest for human consumption: the yellow mealworm (
Tenebrio molitor L.) and the super worm (
Zophobas morio L.). Both mealworms are promising and valid alternative sources of nutrients for humans [
11] and both can be reared very well on organic side streams [
20].
2. Materials and Methods
For the aim of this paper, we have considered two farmed mealworm species, which have easy rearing methods and have been commercially produced as larvae on an industrial scale for several years, representing an important source of food [
21], and we have then estimated the total feed amounts and the total water footprints.
A cradle-to-farm gate approach was chosen, which means that the water impact was assessed up to the moment that the fresh product leaves the farm gate.
Our paper is based on an Oonincx and de Boer study [
22], which considers a commercial mealworm producer (van de Ven Insectenkwekerij, Deurne, The Netherlands), who produces the two mealworm species (
T. molitor L. and
Z. morio L.) in the same way and in equal proportions (kg/year). The production system considered in this paper, including the diet, is identical for both mealworm species. The diet consisted of a mixed grain substrate (
i.e., wheat bran, oats, soy, rye and corn, supplemented with beer yeast) with pieces of fresh carrots on top [
23]. The quantities of all inputs and the output of the production system (
Table 1) were extracted from Oonincx and de Boer [
22].
Table 1.
Resource use per year of the mealworm farm considered in the study.
Table 1.
Resource use per year of the mealworm farm considered in the study.
| Resource Input | Turnover/Year |
|---|
| Carrots (kg) | 260,000 |
| Mixed grains (kg) | 182,000 |
| Direct real water (m3) | 211 |
| Mealworms output (kg) | 83,200 |
We followed the water footprint definitions and methodology as set out in Aldaya
et al. [
24]. The WF represents, in particular, the total amount of freshwater required to produce or consume, directly or indirectly, goods and services including production, harvesting, processing, packaging, and distribution. The WF consists of three components: blue water, which is irrigation water; green water, which is the rainwater either used by plants or evapotranspirated; grey water, namely the amount of water required to dilute pollutants. Of these three components, certainly the one that is the most responsible for environmental problems (such as the consumption of water resources, loss of agricultural land, and salinization) is blue water [
24].
The water footprint of a live animal generally consists of different components: the indirect water footprint of the feed, the direct water footprint related to the drinking water, and service water consumed during the farming stage [
25,
26]. The water footprint of an animal is expressed as:
where WF
feed, WF
drink and WF
serv represent, respectively, the water footprint of an animal related to feed, drinking water, and service-water consumption, which, in turn, refers to the water used to clean the farmyard and carry out other services necessary to support the production process and to maintain the environment. The water footprint of an animal and its three components can be expressed in terms of m
3/year/animal, or, when divided by the lifetime of the animal, in terms of m
3/animal.
The water footprint of an animal related to the feed consumed consists of two parts: the water footprint of the various feed ingredients and the water that is used to mix the feed [
6]:
Feed represents the annual amount of feed ingredients consumed by the animal category considered in the production system (t/year). WF*prod is the water footprint of feed ingredients (m3/t), WFmixing is the volume of water consumed for mixing the feed (m3/year/animal), and Pop* is the number of animals produced per year.
Even if the water footprints of the feed may vary in relation to the production origin, the different productive systems, and the different diets, since it does not imply significant variation for the aim of this study, which represents a first assessment, we have considered global average values as already done in previous scientific literature [
6] in order to simplify the comparison of our results.
The water footprints of the different crops, roughages, and crop by-products (WF*
prod, m
3/t) that are eaten by the insect categories considered in this study were extracted from Mekonnen and Hoekstra [
27,
28], considering their average global value.
Since the actual mixed grain feed is a commercial secret and the single ingredient percentages are not disclosed by Oonincx and de Boer in their article due to agreements between the authors and the producer [
22], we assumed that the mixed grain feed consists of an equal quantity of each component, but we also conducted a sensitivity analysis in order to take into account the water footprint variability related to the different concentrations of the ingredients.
Reasonably, due to the fact that the mixed grain feed is composed of five different ingredients, we assume that the concentration of each of them in the mix is equiprobable and cannot be less than 5% of the total.
Based on this analysis, we observed that with a probability of 95%, the mixed grain water footprint value ranges between its average expected value ±188 m3/t.
Subsequently, we multiplied the global average water footprint of a ton of concentrates and a ton of carrots by the quantity of mixed grain feed and carrots required for the annual production farming. In this way, we obtained the annual virtual water (i.e., the use of indirect water to support the feeding of mealworms) expressed in terms of m3.
We then summed this value of virtual water to the direct use of real water needed by the insects for growth and for cleaning the farmyard and carrying out other services necessary to support the production process and to maintain the environment.
From this computation, we obtained the quantity of (direct and indirect) water consumed to support the annual production of mealworms. Dividing this value by the annual output of the farming process expressed in ton of mealworms per year, we obtained the water footprint of a ton of mealworms in terms of m3/t.
In order to obtain the water footprint of an individual animal, in this case a mealworm we multiplied the value of the water footprint of a ton of mealworms by the average mass of a single mealworm at the end of its life cycle. In this way we obtained the average value of the water footprint of each mealworm at the end of its useful life expressed in m3/t. Furthermore, dividing this value by the average lifespan of farmed mealworms expressed in years, we extracted the average annual water footprint of a mealworm.
To compute the value of water footprint per unit of edible protein, firstly we multiplied the quantity of output expressed in kg of fresh mealworms produced with the average reported dry matter content (
T. molitor 38%;
Z. morio 43%) and the average percentage of reported crude protein in the dry matter (
T. molitor 53%;
Z. morio 45%) [
29,
30,
31].
Crude protein in the dry matter is estimated as total nitrogen concentration multiplied by a coefficient assumed to represent the density of nitrogen in an average protein (6.25). In the specific case of insects, nitrogen occurs both in proteins and also in the exoskeleton, bound in chitin. Chitin-bound nitrogen has already been measured in scientific literature for
T. molitor and
Z. morio, corresponding to the value of 5%–6% of the total nitrogen [
29,
32]. We therefore estimated the total nutritional content of the mealworms in terms of protein detracting the chitin-bound nitrogen.
Subsequently, we multiplied the obtained value of available dietary proteins by the edible portion, which we consider to be 100% for mealworms since humans consume the whole animal. The protein content and edible portion of common production animals vary depending on the breed, country of production, and other factors. In this study we used the data reported by de Vries and de Boer [
33] and Smil [
34].
The results obtained from the analysis were compared with the same values reported in literature by Mekonnen and Hoekstra [
6] for other types of animals raised for human food consumption, in order to extract the results useful in the discussion of the hypotheses of this paper.
3. Results
The WF of a specific farmed insect is determined by the water consumption and pollution in each farming process step within the supply chain of the final product. From the perspective of water consumption and pollution, the most important contributors are: water used for growing the feed, water necessary for the animals’ growth, and water used on the farm for cleaning. Actually, in the supply chain of an animal farming system there are more processes than these, but all these processes imply a very small percentage of the total WF of the final animal product [
6].
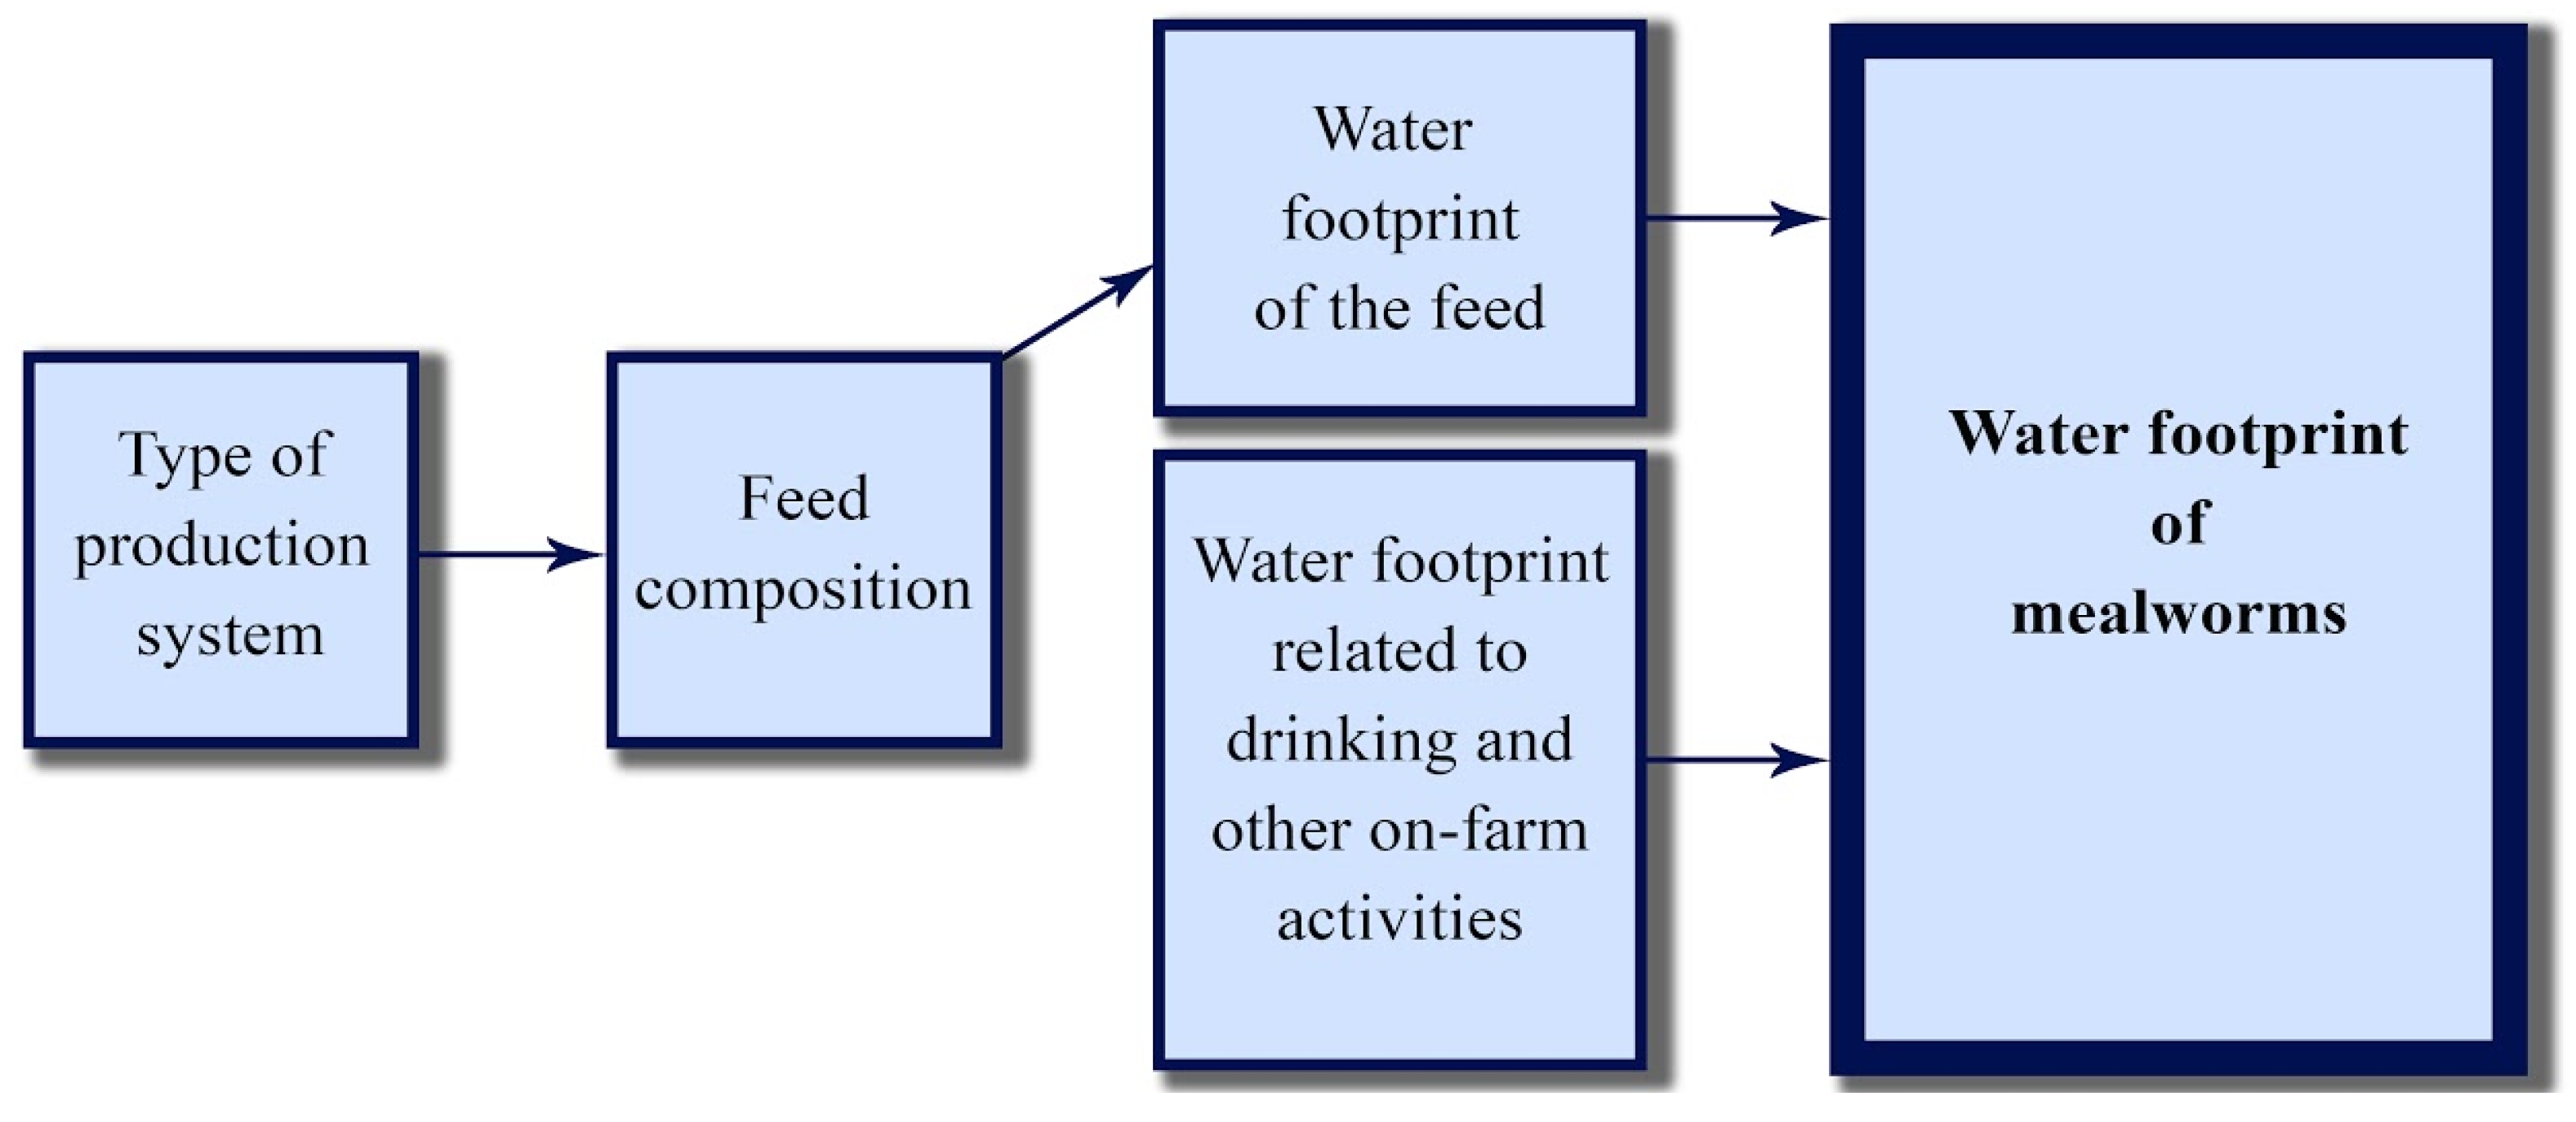
Among the three processes studied here—feed production, growing, and farm cleaning—the first one represents the largest factor. The WF of farmed animal products depends on three main factors: (i) how much the animals eat; (ii) what the animals eat, i.e., the feed composition; and (iii) the feed origin that determines the WF of the livestock feed.
The WF at a specific location is determined by local climatic conditions, such as rainfall, moisture, and temperature, in combination with soil conditions and agricultural practice. In general, high yield levels go along with relatively small WFs and the inverse is also true. The WF of the total feed package depends on the feed composition and the origin of the various feed ingredients.
The water use for mealworm production in the rest of the chain is a minor part of the total WF of animal products.
Figure 1 schematically shows the factors determining the WF of mealworms.
Figure 1.
Factors determining the water footprint of farmed mealworms.
Figure 1.
Factors determining the water footprint of farmed mealworms.
An important underlying factor for animal meat is the type of production system, since the type of system influences the feed conversion efficiency, the feed composition, and the origin of the feed.
Feed conversion efficiencies depend on the type of production system. In general, feed conversion efficiency improves from grazing to mixed systems to industrial systems.
The second main factor influencing the WF of mealworms is the WF of the animal feed. This depends on the composition and the origin of the feed.
The farming system analyzed in this study is an industrial production with a relatively large fraction of concentrates in the animal feed [
35]. The WF of the feed considered in the analysis is assumed to be the global average, not taking into account the origin of the feed.
Since the WF of mealworms is dominated by the WF of the animal feed, the composition of the feed is an important factor.
Table 2 gives the main components contained in feed concentrates and roughages, and shows that there are large differences between the WFs (m
3 of water per ton of feed) of mixed grain feed and carrots. Mixed grain feed has a relatively large WF, while carrots have a relatively small WF. On average, the WF of mixed grain feed is almost nine times larger than the WF of carrots. While carrots have a WF of around 195 m
3/t (global average), the value for the mix grain feed is about 1704.6 m
3/t (with a variation of ±188 m
3/t based on the differences in terms of ingredient concentration observed through the sensitivity analysis). As the incidence of green WF for the mixed grains and the carrots are respectively 84% and 54.36% of the total WF, it implies that carrots need much more irrigation than mixed grain feed. Even if the green, blue, and grey WF components of the mixed grains are respectively 13.5, 5 and 2.6 times larger than those of carrots, in relative terms the percentage of the grey component of the total WF for carrots is 31.28%, this meaning a relevant incidence of pollutants in the cultivation of carrots.
Considering an annual consumption of food for the mealworms equal to 182 t of mixed grains and 260 t of carrots [
22], we obtained the two values of consumption of virtual water amounting to 310,237.2 m
3 for mixed grains and 50,700 m
3 for carrots. Summing up these values we calculated the value of virtual water consumed to sustain the complete diet of insects, as shown in
Table 3.
Table 2.
Global average water footprints of the different crops, roughages, and crop by-products included in the mealworm farming system.
Table 2.
Global average water footprints of the different crops, roughages, and crop by-products included in the mealworm farming system.
| Crops, Roughages and Crop by-Products | Global Average Water Footprint in m3/t |
|---|
| Green | Blue | Grey | Total WF |
|---|
| Maize (corn) | 947 | 81 | 194 | 1222 |
| Rye | 1419 | 25 | 99 | 1543 |
| Oats | 1479 | 181 | 128 | 1788 |
| Soybeans | 2037 | 70 | 37 | 2144 |
| Wheat bran | 1277 | 342 | 207 | 1826 |
| Mixed grain | 1431.8 | 139.8 | 133 | 1704.6 |
| % of WF component for the mixed grain feed | 84 | 8.2 | 7.8 | 100 |
| Carrots and turnips | 106 | 28 | 51 | 195 |
| % of WF component for the carrots | 54.36 | 14.36 | 31.28 | 100 |
Table 3.
Annual virtual water consumption of the farmed insect diet.
Table 3.
Annual virtual water consumption of the farmed insect diet.
| Diet components | Total WF in m3/t | Farming Consumption in Ton of Product | Virtual Water Consumption in m3 |
|---|
| Mixed grain feed | 1704.6 | 182 | 310,237.2 |
| Carrots and turnips | 195 | 260 | 50,700 |
| Complete diet | – | – | 360,937.2 |
The value of virtual water for the overall diet planned for breeding mealworms, amounting to 360,937.2 m
3, has been added to the direct use of real water equal to 211 m
3 as indicated in
Table 1, for mealworm life (WF
drink) and farm services (WF
serv), in order to obtain a total value of real and virtual water consumption amounting to 361,148.2 m
3. This result, divided by the output of livestock production amounted to 83.2 t of mealworms as extracted from Oonincx and de Boer [
22] and shown in
Table 1, gives rise to the water footprint for the production of mealworms, which is equal to 4341 m
3/t, as indicated in
Table 4.
Table 4.
Virtual water consumption of the farmed insect diet.
Table 4.
Virtual water consumption of the farmed insect diet.
| Type of production | Water Consumption in m3 (Virtual + Real) | Mealworms Output per Year in Ton | Water Footprint of a Ton of Farmed Mealworms in m3/ton |
|---|
| Production of mealworms for humans | 361,148.2 | 83.2 | 4341 |
If we compare the average total annual water footprint per animal (WF
feed + WF
drink + WF
serv) of different animal categories (
Table 5), we find that beef cattle have the largest (631 m
3/year/animal) among farm animal production, followed by pigs (521 m
3/year/animal), broiler chickens (26 m
3/year/animal), and mealworms, which obviously have the lowest water impact (0.003 m
3/year/animal) due to their very low weight.
Table 5.
Average annual water footprint of a single animal per animal category.
Table 5.
Average annual water footprint of a single animal per animal category.
| Animal Category | Water Footprint of Live Animal at the End of Life (m3/t) | Average Animal Weight at the End of Life Time (kg) | Average Water Footprint of One Animal at the End of Life Time (m3/t) | Average Life Time (year) | Average Annual Water Footprint of One Animal (m3/year/animal) |
|---|
| Mealworms | 4341 | 1.81 × 10⁻⁴ * | 7.81 × 10⁻⁴ | 0.25 ** | 0.003 |
| Pigs a | 3831 | 102 | 390.76 | 0.75 | 521.016 |
| Broiler Chickens a | 3364 | 1.9 | 6.39 | 0.25 | 25.566 |
| Beef cattle a | 7477 | 253 | 1891.68 | 3.00 | 630.560 |
Even if the WF per ton of live animals for mealworms seems to be higher than other animals, it is important to underline that the edible portion for mealworms is considered to be 100% since humans consume the whole animal, contrary to the other food products, as revealed by the difference in water footprint values between live animals (
Table 5) and their related edible portions (
Table 6). This leads to the WF values expressed per edible ton reported in
Table 6, in which it is evident that the values for mealworms are comparable to chicken meat and lower than all the other animal meat categories.
Table 6.
The water footprint of food products from animal origin in terms of protein value.
Table 6.
The water footprint of food products from animal origin in terms of protein value.
| Food Item | Water Footprint per Edible Ton (m3/t) | Nutritional Content in Terms of Protein (g/edible kg) | Water Footprint per Unit of Nutritional Value (L/g Protein) |
|---|
| Mealworms | 4341 | 186 * | 23 |
| Pig meat a | 5988 | 105 | 57 |
| Chicken meat a | 4325 | 127 | 34 |
| Beef a | 15,415 | 138 | 112 |
If we look at the water requirements from a different perspective, in terms of protein, we find that the water footprint per gram of protein for beef, pig, and chicken meat is larger than for mealworms, as shown in
Table 6. For beef, the water footprint per gram of protein is five times larger than of mealworms, while the least water-impacting food item, excluding mealworms (23 liters per gram of protein), is represented by chicken meat. This result depends on the high conversion efficiency of mealworms in transforming food into protein, compared to other animals, as well as on their high output turnover due to their high fecundity.
4. Discussion and Conclusions
In consideration of the global need for changing food consumption patterns due to the growing concerns about environmental pollution and scarcity of natural resources, and in particular soil and water, we have explored the possibility of substituting traditional meat products with insects as an alternative source of protein, in order to reduce the human pressure on water. We decided to consider the water footprint as a reliable indicator usable for comparisons. In the present study we have taken into account only two species of edible insects (T. molitor and Z. morio mealworms) because they are also commercially produced even in Western countries, and for this reason it is possible to find specific data in literature about their diets. The results reported in this paper come from the analysis made on a single farm, so additional research using data from different mealworm farms and rearing systems should be carried out. Our results represent, in any case, a very interesting finding to be taken into account for further discussion.
In general, the main environmental impact of animal protein production is linked to the feed quality and the type of production system [
39]. Livestock farming systems can be categorized into three types: grazing, mixed, and industrial systems [
40]. Going from one system to the other, the consumption of feed concentrates increases, leading to growing pressure on the natural environment and water resources, due to crop cultivation and feed mixing. Feed concentrates have, in fact, larger WFs than roughages, due to the fact that intensive crops need more irrigation and use of fertilizers; this causes an increase in particular of the grey and blue WF components [
35]. The current global trends in meat consumption require more and more industrial farming systems in order to satisfy the demand, but this generally goes in the opposite direction of sustainability. On the other hand, it has been observed that only considering water impact, the high productivity of industrial systems in which the conversion efficiency of feed inputs into meat outputs is very high may offset the negative effects of high concentrate consumption. In this case, the total WF per unit of animal product may be lower [
6].
The interest in insects comes from their very high efficiency in transforming phytomass into protein-rich animal biomass, their high fecundity, their very fast growth rates, and also their ability to absorb all the water they need from just their food [
37,
38,
41]. It has also been reported that mealworms do not need any additional drinking water if they are farmed in appropriate humidity conditions and provided with carrots and the appropriate ratio of bran/grains [
42]. All these characteristics can lead to an advantage in environmental terms over other animal categories, even when insects are farmed in industrial systems, as currently required by the market.
Considering the water issue, the WF of reared insects (mealworms in our case) is dominated by the WF of the animal feed as we have reported in the paper, so the composition of the feed is an important factor to be taken into account in order to increase the sustainability of meat production. The biggest contributing factor to the total WF related to feed is the mixed grains used in the diet of mealworms (see
Table 1), but we emphasized that the carrots added to the mixed grains to provide the necessary moisture have a relative high grey WF component (see
Table 2).
If we take into consideration the results of the sensitivity analysis related to the unknown recipe of the mixed grain feed, the variability interval around the average value of the water footprint of farmed mealworms would be ±411 m3/t. Even considering the minimum and maximum of this interval we obtain values of the water footprint of farmed mealworms respectively equal to 3930 m3/t and 4752 m3/t, which are not in contrast with our results based on the assumed average value of the mixed grain.
In addition, other authors have found that the feed conversion rate of mealworms is dependent on the external temperature during the farming and on the humidity of the substrate, as well as on the diet composition. The use of temperature-controlled rearing containers is then necessary to guarantee optimal results, which in turn translates into a lower WF value [
43]. It has also been observed that the consumption of carrots increases when their diet is based on low protein and high starch feeds [
44]. These findings give important input for further research aimed at looking for the best combination of feed that could reduce the WF of this meat product, in particular the blue and the grey components, as a sustainable meat production means their reduction. Another relevant aspect to be further investigated is the possibility of using organic by-products to integrate the mealworm diet, which would result in two positive effects: reducing the amount of grains and giving value to waste.
In the present study we calculated and compared the WF of live animals and of edible tons, for different categories of traditional meat sources and mealworms. One relevant characteristic of mealworms is that the edible portion corresponds to 100% of the weight of the live animal, while in pigs, beef, and chickens the edible portion is much less than their live weight, so this contributes to further reducing the WF value of mealworm edible products (see
Table 5 and
Table 6).
Even if the WF for each animal category may vary in different regions, in different productive systems, and with different diets, considering global average values for industrial systems we have demonstrated that from a freshwater resource perspective, it is more efficient to obtain protein through mealworms rather than other traditional farmed animals (see
Table 6). This is due to the fact that mealworms have very high feed conversion rates and in addition they have a very high content of protein. The WF of mealworms expressed in terms of liters/g protein results is 23, compared to that of chicken which is 34 and that of beef which is 112, as shown in
Table 6.
One additional property to be taken into consideration when we think of substituting traditional protein sources with insects, is that mealworm proteins are also of good quality in terms of nutritional value, as they contain all the 20 essential amino acids (beef, for example, compared to mealworms has a higher content of only three of these) [
11].
In conclusion, we can say that integrating diets with insects and, in particular, with mealworms can contribute to a more sustainable way of feeding the growing human population [
45]. The debate on sustainable food is definitely much broader than just water consumption and pollution, but water is a very important resource for life and we have to commit ourselves to saving it as much as we can, even by changing our food habits and meat consumption patterns.
Further research could be addressed to assessing the water footprint of mealworm production with a regional approach to test the productive specialization of different areas around the world, from a water stress reduction perspective.


