Article

Spatiotemporal Impacts of Climate, Land Cover Change and Direct Human Activities on Runoff Variations in the Wei River Basin, China

State Key Laboratory Base of Eco-hydraulic Engineering in Arid Area, Xi’an University of Technology, Xi’an 710048, China
*
Author to whom correspondence should be addressed.
Submission received: 3 March 2016 / Revised: 18 May 2016 / Accepted: 19 May 2016 / Published: 25 May 2016
(This article belongs to the Special Issue Tackling Complex Water Problems in China under Changing Environment)

Abstract

:
Previous studies that quantified variations in runoff have mainly focused on the combined impacts of climate and human activities or climate and land cover change. Few have separated land cover change from human activities, which is critical for effective management of water resources. This study aims to investigate the impact of changing environmental conditions on runoff using the Soil and Water Assessment Tool (SWAT) model; we examined three categories: climate, land cover change and direct human activities. The study area was the Wei River Basin, a typical arid to semi-arid basin that was divided into five sub-zones (UZ, MZ, DZ, JZ and BZ). Our results showed the following: (1) the calibrated SWAT model produced satisfactory monthly flow processes over the baseline period from 1978 to 1986; (2) compared to the baseline period, the impact of climatic variations decreased and the impact of direct human activities increased from the 1990s to the 2000s, while the impact of land cover change was generally stable; and (3) climatic variations were the main cause of runoff declines over the entire basin during the 1990s and in the UZ, MZ and JZ areas during the 2000s, while direct human activities were most important in the DZ and BZ areas during the 2000s.

1. Introduction

Natural runoff from many rivers has decreased remarkably in recent decades because of the effects of climate change and human activities [1,2,3,4,5,6,7]. The demand for water resources, however, has increased rapidly because of increasing population, rapid economic development and urbanization. The shortage of water resources has become severe in many regions, leading to water stress [8,9,10]. Hence, understanding how runoff is affected by changing environmental factors is critically important to effective management of limited water resources.
Many recent studies have examined the driving factors in the hydrological cycle and quantified various factors that impact water resources [11,12,13,14,
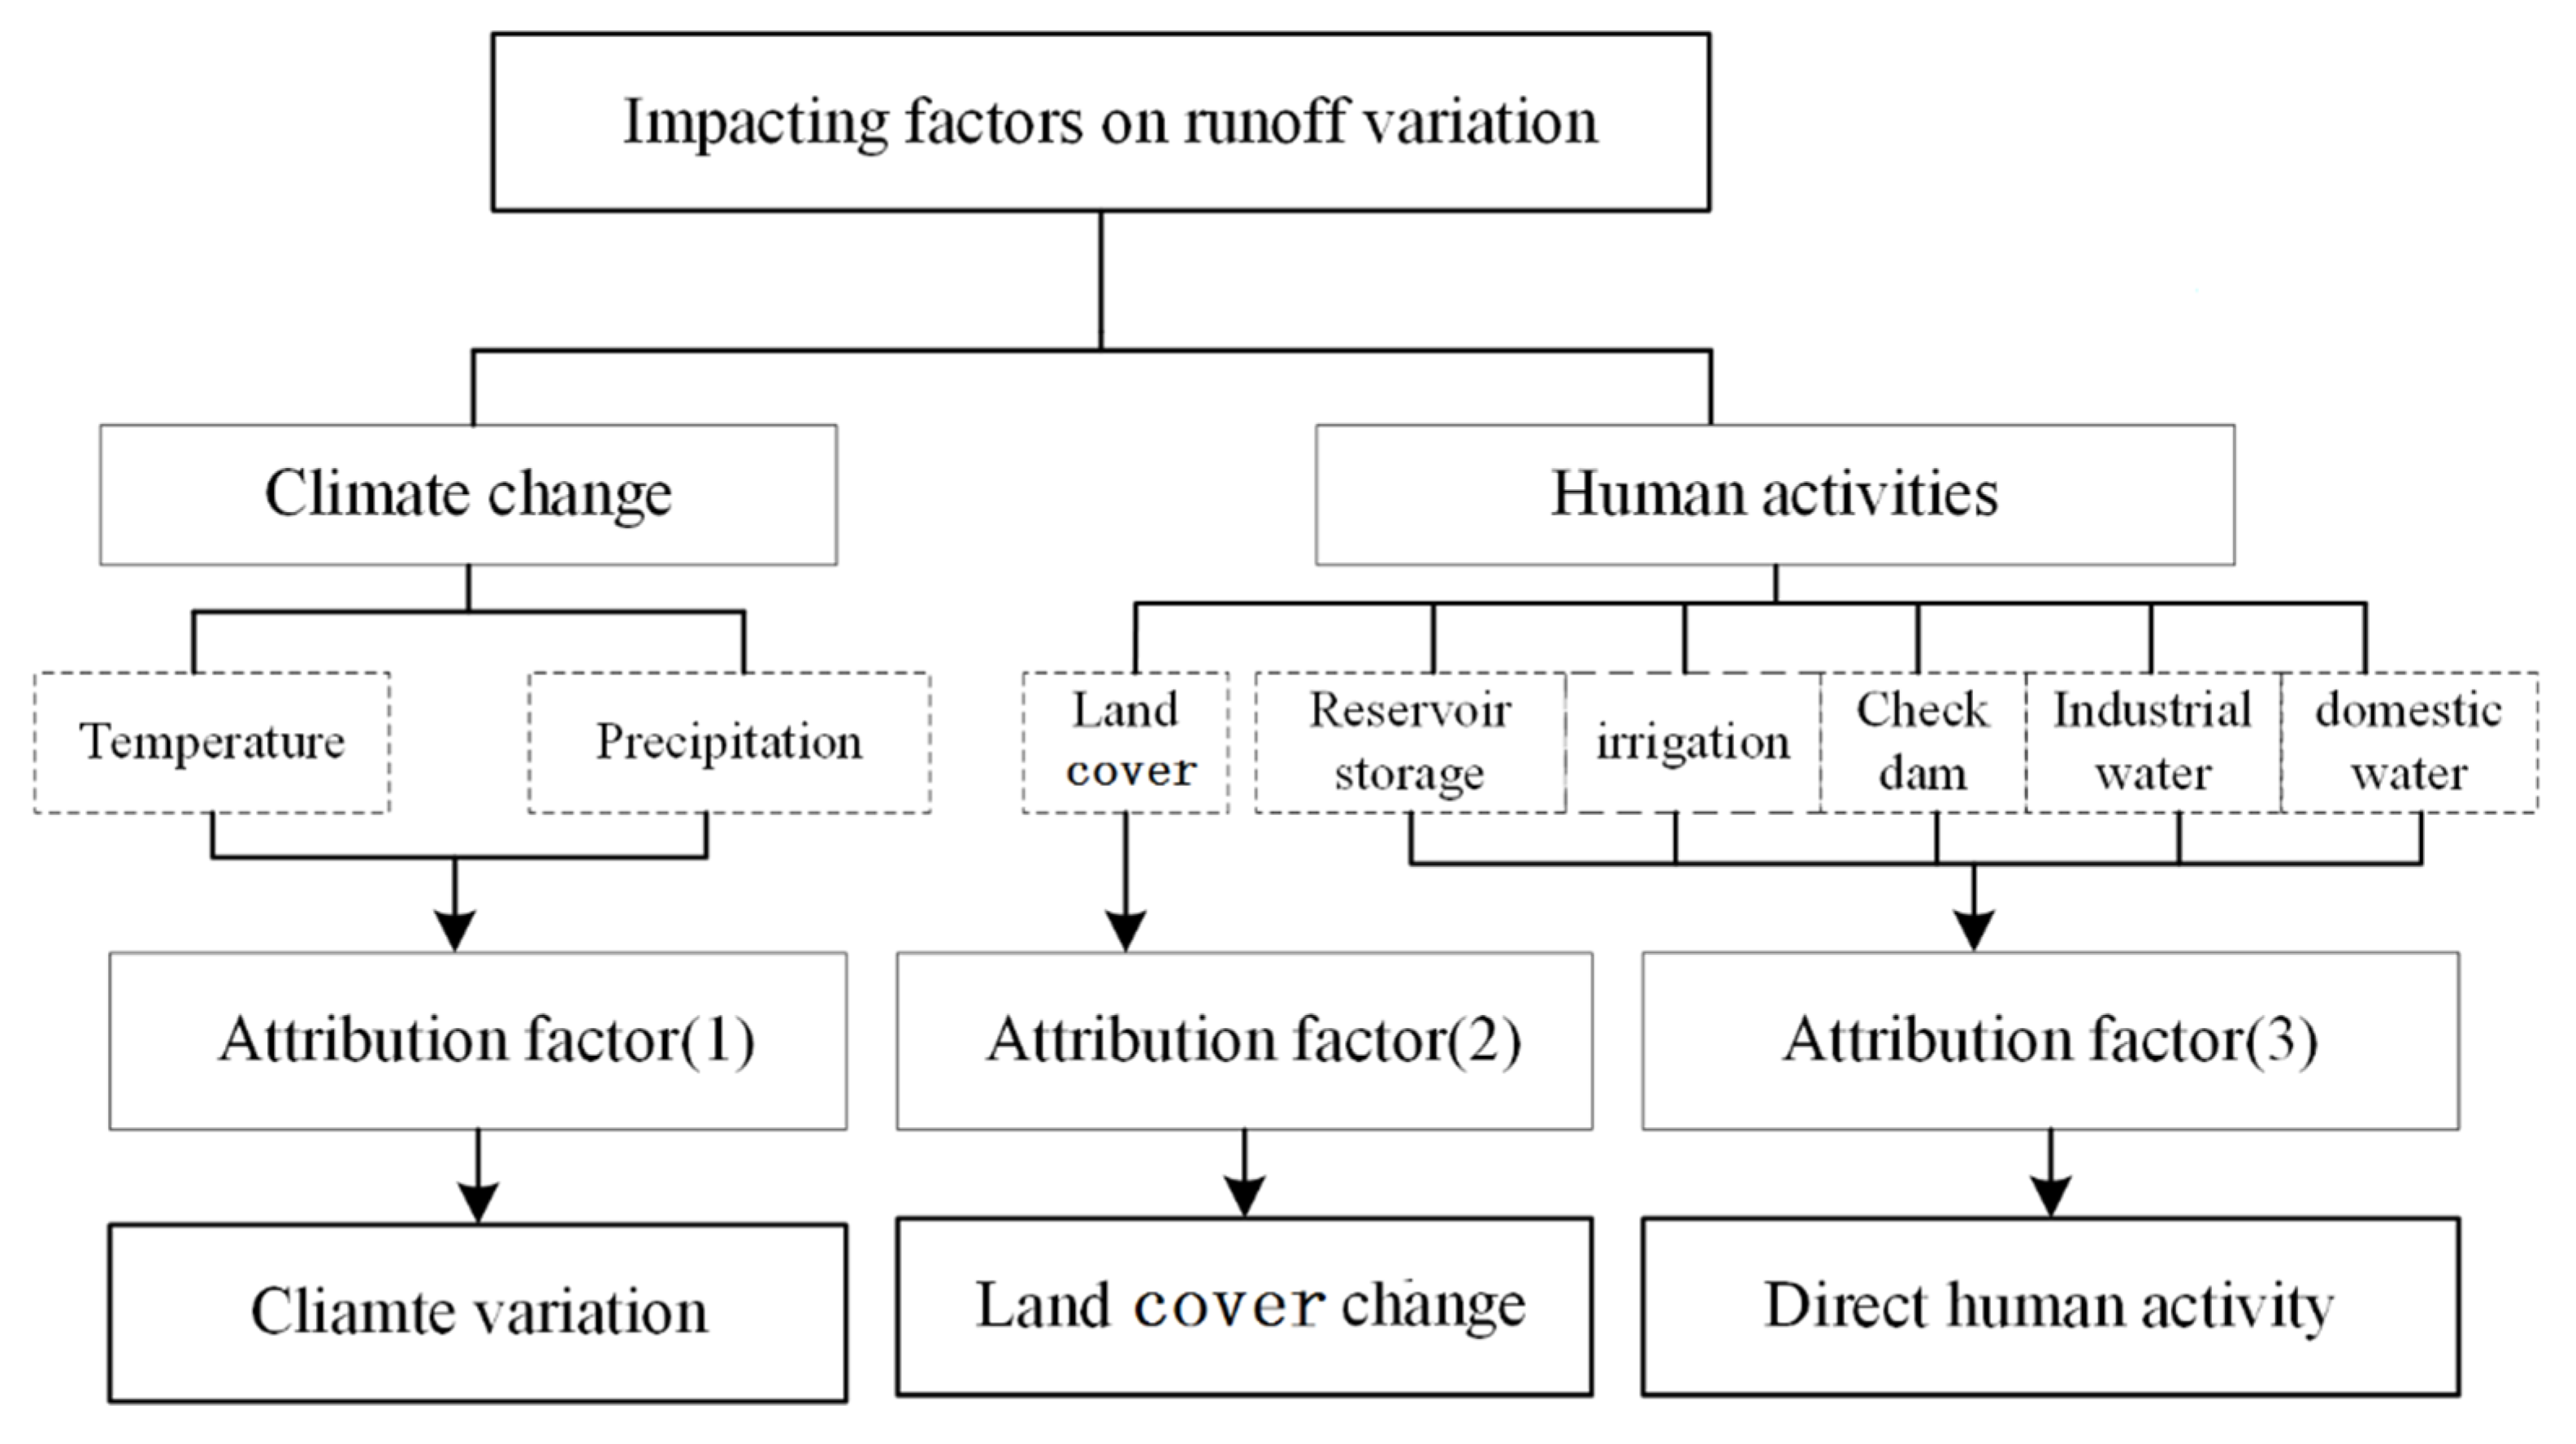
15]. However, most of these studies have focused on comprehensively quantifying the impacts of climate or human activities on runoff. Environmental changes can be divided into two categories: climate-driven and human-driven forces. Climate impacts on runoff can include many factors such as precipitation and temperature. However, the impacts of human activities on runoff are more complex and include changes to land cover, reservoir storage, irrigation and industrial and domestic water. Separating the impacts from these various factors on runoff, especially land cover change caused by rapid modernization and urbanization, is important for understanding the mechanisms that cause variations in flow and thus planning for sustainable utilization of water resources. Because of this need, many studies [16,17,18,19] have also quantified the impacts of land cover change on runoff. For example, Guo et al. [20] explored the effects of changes in climate and land cover on runoff in a watershed in northern China. Their results showed that the contributions of climate and land cover change to runoff were, respectively, 82.75% and 17.25% in the 2000s compared to the 1980s. Yuan et al. [21] assessed the impacts of climate and land cover change on runoff in the Liuxihe watershed, showing that from 2001 to 2010, the contributions of climate and land cover change to annual runoff were 105.52% and −5.52, respectively, compared to the baseline period from 1991 to 2000.
However, these studies grouped land cover change with human activities, which is probably insufficient for quantifying influencing factors. Human activities are complex and include land cover change but also impact other factors such as reservoir storage, irrigation, and industrial and domestic water. Thus, the impacts of land cover change cannot represent the full scope of human activities; in other words, the summed impacts of climate and land cover change on runoff should be less than, rather than equal to, 100%. To date, few studies have separated the impact of land cover change from human activities; two exceptions are the studies of He et al. [22] and Zhang et al. [23]. However, both papers calculated the changes in runoff caused by climate and land cover by comparing simulated values. This may not be reasonable because simulated values might differ from real values to an unknown extent, and neither study could analyze this error. Therefore, in this study we used simulated values as intermediate variables when calculating the relative proportions of climate versus land cover change. Finally, previous studies did not examine the spatial impact of changing environmental factors (mainly land cover) on runoff, which is important for planning land cover. Therefore, we attempted to characterize the spatial and temporal impacts of changing environmental factors on runoff; we classified these impacts into categories of climate, land cover and direct human activities (Figure 1). The direct human activities in this study refer to all human activities except land cover change. This characterization will help managers address extreme events such as droughts in arid regions of China, which is the major motivation of this study.
The methods currently applied in this field can be divided into three general classes: statistical analysis, paired catchment approaches and hydrological modeling. Statistical analysis is considered the simplest method and involves examining hydro-climatic trends using observation stations in a given area. However, this approach usually ignores the physical processes of the hydrologic cycle in the basin. [24]. The paired catchment approach is often applicable to areas that are less than 100 km2 because it is difficult to find two large, similar basins [25]. Hydrological modeling overcomes the limitations of the above two methods and considers the relationships between climate, land cover and hydrological factors [26]. Therefore, hydrological modeling has been widely applied to study issues that arise during the planning, design, operation, and management of water resources; it has also been used to quantify the impacts of climate and land cover change on hydrological factors. Overall, hydrological models are popular and useful tools to analyze complex phenomena.
The Soil and Water Assessment Tool (SWAT) developed by the Agricultural Research Service of the United States Department of Agriculture (USDA-ARS), has proven to be an effective tool for hydrological impact studies around the world. It is a process-based, continuous-time, semi-distributed hydrology and sediment simulator that can model complex watersheds with diverse weather, land cover, soils and topography conditions over a long period of time and various time steps at the large basin scale [27]. SWAT has been successfully used to simulate the hydrological cycle in various regions all over the world [28,29,30,31,32,33]. Previous studies have shown that SWAT can reflect the spatial heterogeneity of a watershed’s climatic factors and underlying surface composition. For these reasons, SWAT 2009 was used to simulate runoff processes in the study area.
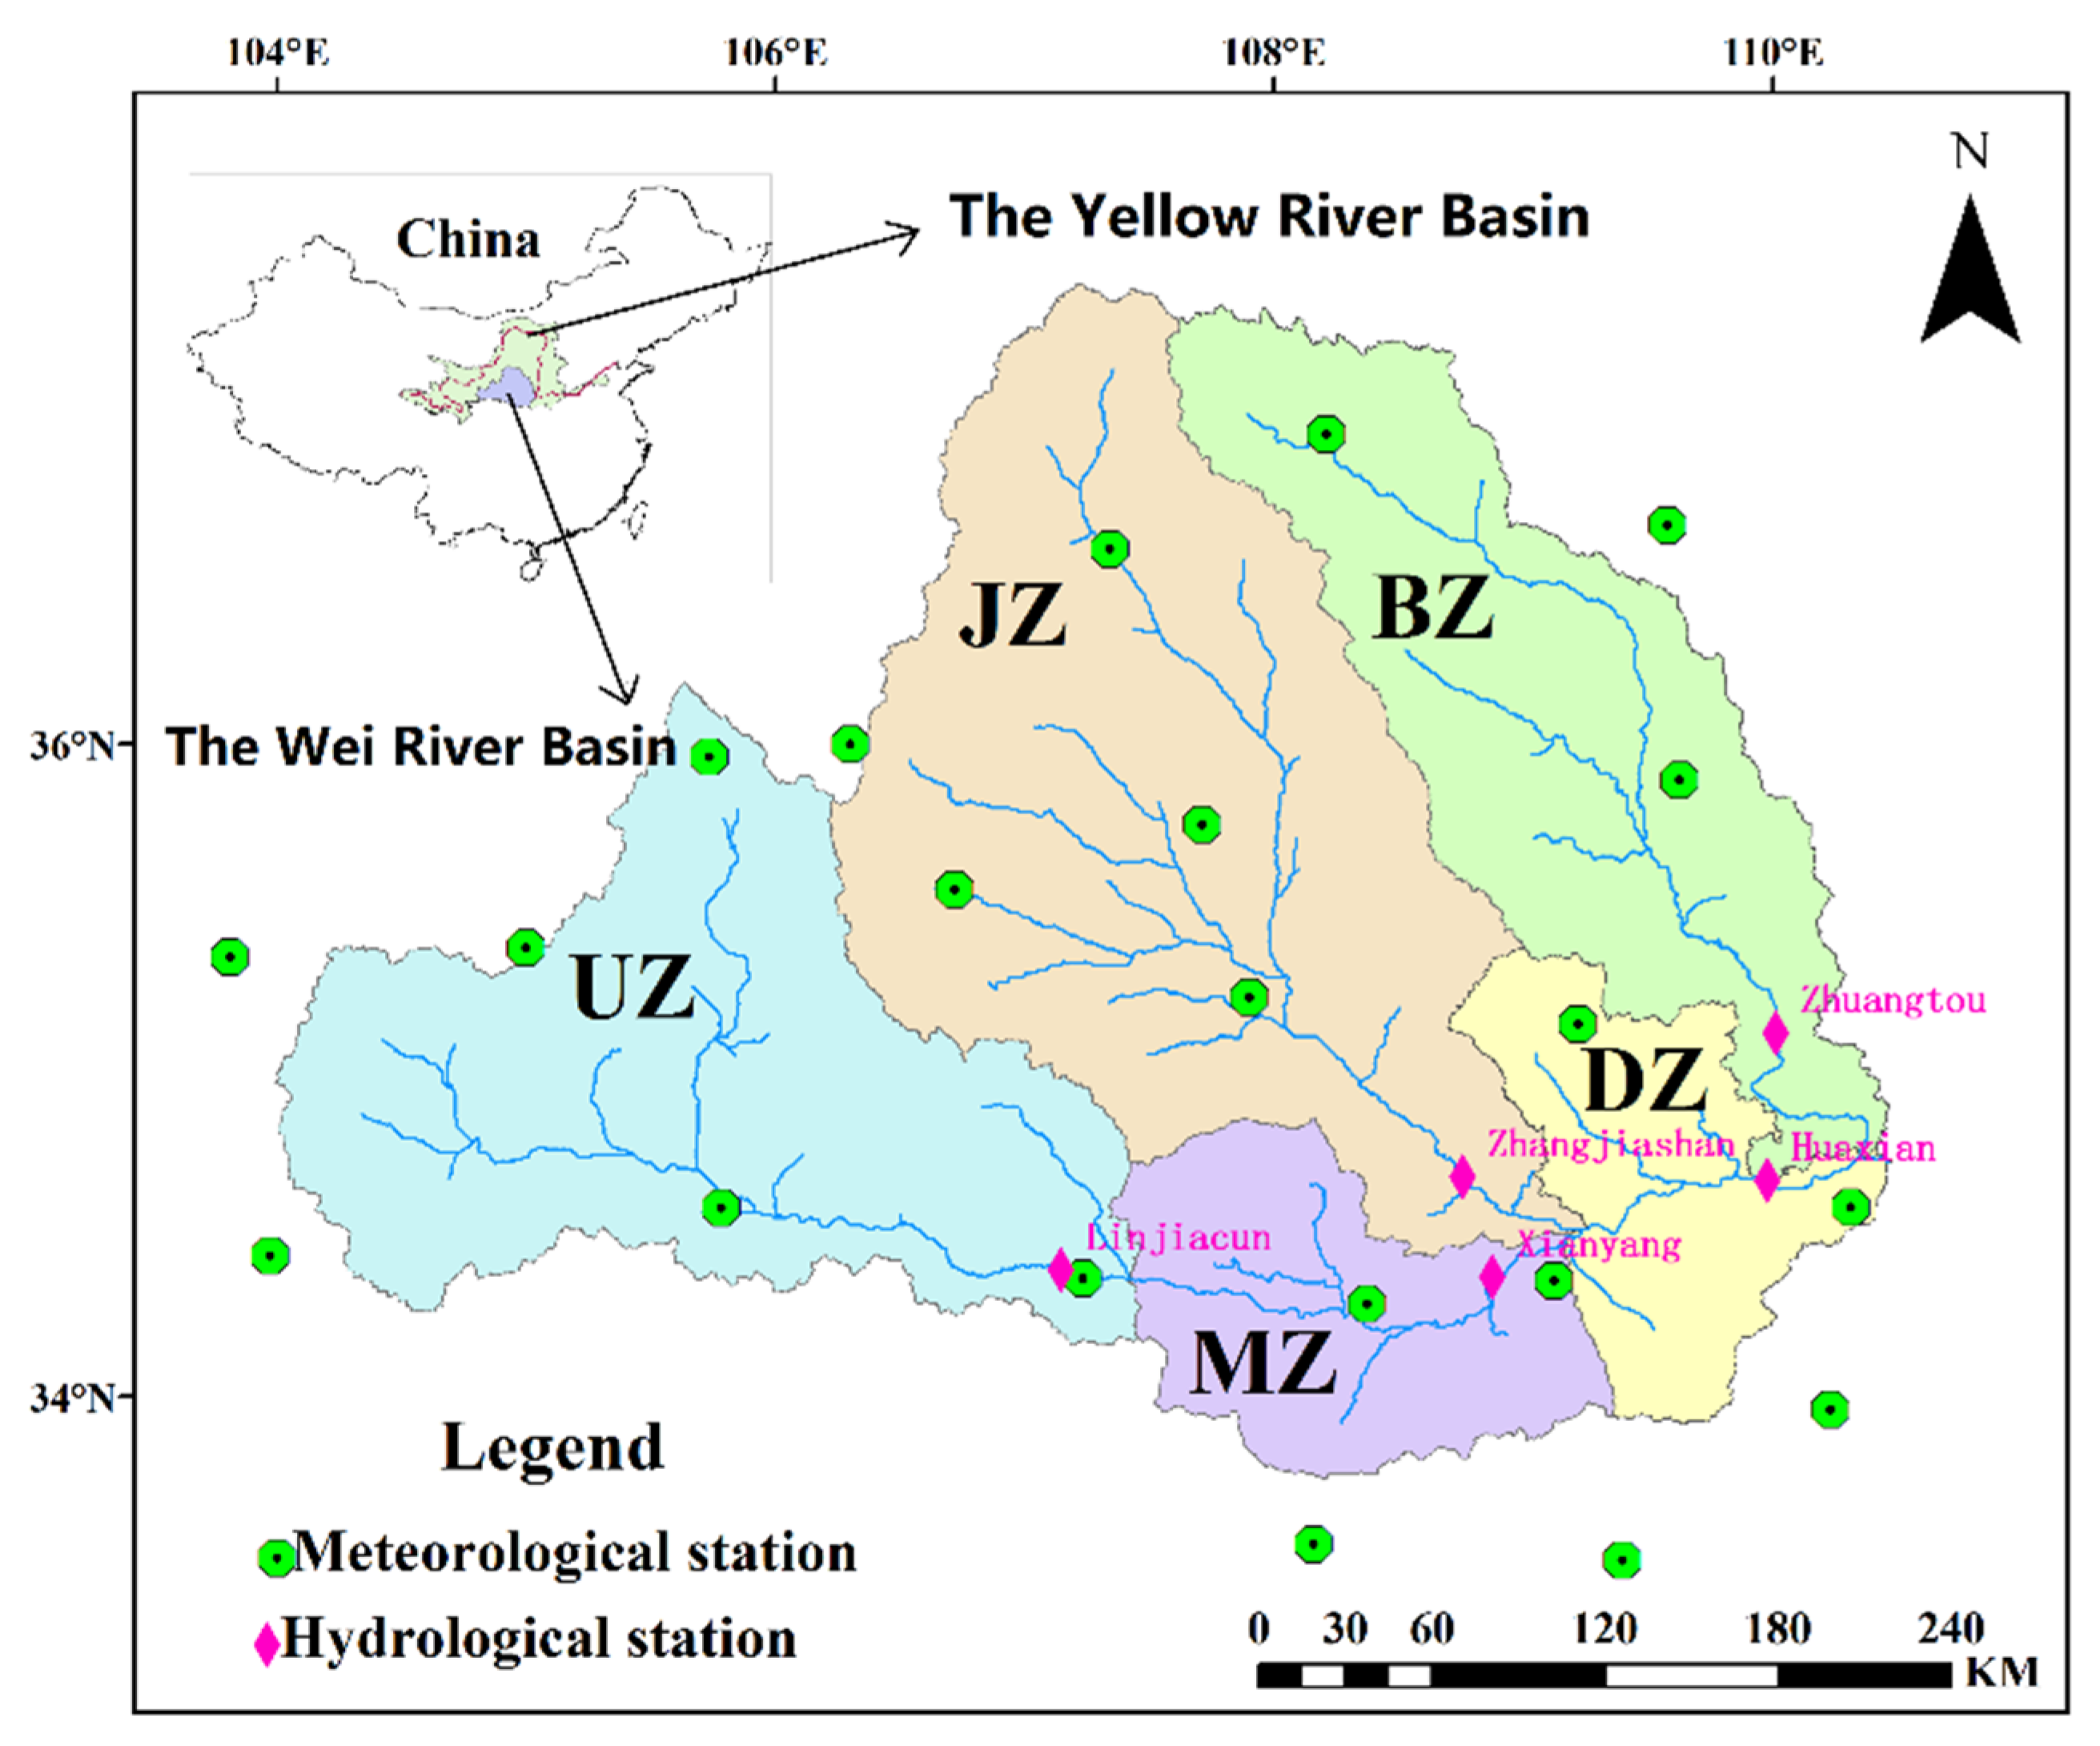
The Wei River Basin (WRB), a typical arid to semi-arid region in northwest China, is a key economic development zone and an important agricultural production area. It hosts 76 major cities with a total population of 22 million people. Furthermore, the Wei River, known as the “mother river” of Shaanxi Province, is a major source of domestic and industrial water. In recent decades, many studies [34,35,36] have shown that runoff in the Wei River decreased dramatically because of extreme climate variations and extensive human activities. These factors have had significant and long-lasting negative impacts on natural and human systems, from economic losses and humanitarian disasters to stress on natural ecosystems. For example, the longest zero days happened in the middle stream of the Wei River in 1997, causing severe environmental impacts such as river sedimentation and extinction of aquatic animals. Extreme drought events have occurred frequently since the 1990s. For instance, droughts as long as 200 days occurred during 2013–2014, impacting more than 3.3 km2 of farmland and causing a complete loss of the harvest, thus harming society and the economy in the WRB. Therefore, research is needed concerning the temporal and spatial impacts of changing environmental factors on runoff in this basin. The resulting information will provide a scientific reference for decision makers, facilitating water resources management and policymaking.
Numerous studies have quantified the impacts of climatic variation and human activities on runoff in the WRB [12,37,38,39,40]. However, to our knowledge, only Zhao et al. [41] have studied land cover change, investigating the effects of land cover change and climatic variability on green and blue water resources. Although Zhao et al. examined the combined impacts of land cover change, expansion of agricultural irrigation and climatic variations on water resources; however, they did not quantify the individual impacts of these factors. In addition, Zhao only studied the main stream and did not consider the entire basin. Therefore, it is necessary to quantify the separate impacts of climatic variations, land cover change and direct human activities on runoff in the entire WRB. This will have implications for water resources management and planning, helping to mitigate the negative influence of changing environmental factors throughout the basin and thereby promoting its economic, societal and environmental development.
The primary objectives of this study are: (1) to identify abrupt change points in annual hydro-meteorological series from 1960 to 2010; (2) to quantify the temporal and spatial impacts of climate, land cover and direct human activities on runoff in the WRB using SWAT model; and (3) to assess our results based on the characteristics of climate, land cover and direct human activity in the WRB.

2. Study Area and Data

2.1. Study Area

The Wei River (Figure 2) extends from 103°05′ E to 110°05′ E and from 33°50′ N to 37°05′ N. It begins north of Niaoshu Mountain on the Tibetan Plateau and flows eastward along the north flank of the Qinling Mountains into the Yellow River. Its total length is 818 km and its drainage area is 134,800 km2. The Jing River and Beiluo River are the two largest tributaries in the basin, with drainage areas of 45,400 km2 and 26,900 km2, respectively. Because the Wei River Basin is in the continental monsoon zone, it experiences highly variable climatic conditions on an annual as well as a seasonal basis. The multi-year average precipitation is approximately 559 mm, which is concentrated during the rainy season, causing floods. The mean temperature is approximately 10.6 °C and maximum and minimum temperatures of 42.8 °C and −28.1 °C occur in July and January, respectively. The average annual natural runoff is approximately 10.4 billion m3, accounting for 17.3% of the total discharge of the Yellow River.
There are twenty-one meteorological stations and five hydrological stations in the basin. Detailed information on the hydrological stations (Linjiacun, Xianyang, Huaxian, Zhangjiashan and Zhuangtou) is listed in Table 1. The Linjiacun, Xianyang and Huaxian stations are located in the upper, middle and lower reaches of the main stream, respectively; the Zhangjiashan and Zhuangtou stations are located on the Jing River and the Beiluo River, respectively. To analyze the spatial impacts of changing environmental variables on runoff, the entire basin was divided into five sub-zones based on the five hydrological stations. These are the upstream zone (UZ), middle stream zone (MZ), downstream zone (DZ), Jing zone (JZ) and Beiluo zone (BZ) (Figure 2). Precipitation and temperature in each sub-zone was computed using Tessellation Polygons.

2.2. Data

We used two types of datasets in this study, hydro-meteorological and spatial data. Hydro-meteorological data include precipitation, temperature and flow data. Daily precipitation and temperature data from 1960 to 2010 for 21 Meteorological stations were provided by the National Climatic Centre of China. Monthly flow data for the same period from the five hydrological stations were obtained from the Shaanxi Hydrometric and Water Resource Bureau. Spatial data include a digital elevation model (DEM), a digital stream network, a soil map and three land cover maps. The DEM data were extracted from the SRTM Digital Elevation Model (SRTM) with a resolution ratio of 90 m. The digital stream network (1:250,000) was derived from resource and environmental science data of Chinese Academy of Sciences.The soil map (1:1,000,000), which were obtained from the China Soil Scientific Database (CSSD), and properties of the soil types are from the Chinese Soil Database of the Institute of Soil Science. Land cover maps (1:100,000) for 1985, 1995 and 2005 are shown in Figure 3 and were provided by the Chinese Academy of Sciences (CAS); their properties were directly obtained from the SWAT model database.

3. Methodology

The study methodology included three parts: abrupt change analysis, hydrologic modeling and impact quantification. We note that the meteorological and hydrological series are stable and linear in hydrological models although they may be unstable or nonlinear in reality because of changing environmental factors. The simulation period for parameter calibration and validation in the hydrological model should therefore avoid periods including abrupt changes as much as possible. The aim of abrupt change analysis of the hydro-meteorological series was to help select an appropriate simulation period. Details regarding the abrupt change analysis, hydrologic simulation and impact quantification are provided below.

3.1. The Modified Mann-Kendall (MMK) Test Method

The initial Mann-Kendall (MK) trend test method recommended by the World Meteorological Organization [42] is a nonparametric approach used to determine the trend and identify abrupt changes in a time series. We note that the MK test can be affected by persistence in hydro-meteorological series. Therefore, we used a modified Mann–Kendall (MMK) test method provided by Hamed and Rao [43] that takes into account the lag-i autocorrelation to overcome the effects of persistence. Daufresne et al. [44] found that the MMK test method was more reliable in identifying abrupt change points in hydro-meteorological series. The detailed calculation procedures of MMK are described in the Appendix.

3.2. Soil and Water Assessment Tool (SWAT) Model

3.2.1. Model Description and Setup

The SWAT model, developed by USDA-ARS in the early 1990s, is a continuous hydrological model that can evaluate the long-term influence of land management on water resources, sediments and agricultural yields in large and complex basins with varying land covers, soils and management conditions. The major components of SWAT include climate, hydrology, sediment movement, crop growth, nutrient cycling and agricultural management. Spatial parameterization for SWAT is conducted by dividing the basin into numerous sub-basins based on topography, after which the sub-basins are further subdivided into a series of Hydrologic Response Units (HRU) with unique soil, land cover and slope characteristics. The runoff generated in each HRU is calculated individually, aggregated at the corresponding sub-basin scale and then routed to the associated reach and watershed monitoring outlet through the channel network.
The processes simulated by SWAT include surface runoff, infiltration, evaporation and percolation to shallow and deep aquifers. Surface runoff is estimated using a modified Soil Conservation Service (SCS) curve number (CN) equation that takes into account daily precipitation data, land cover characteristics and soil structure.
The input data needed by SWAT include a DEM, land cover map, soil map and daily meteorological observations. Based on the DEM, digital stream network and the previous study [45], a minimum drainage area of 800 km2 was set before dividing the WRB into 95 sub-basins (Figure 4). Next, the model automatically determined the watershed morphology, stream parameterization and overlay of land cover and soil. Finally, the 95 sub-basins were further discretized into 447 HRUs with unique land cover, soil and slope characteristics. To give a clear idea about in what level the land cover change has been reflected in the SWAT model, it is very necessary to conduct a comparison of the HRU land cover type between different land cover scenarios. Hence, the change number and degree of HRUs’ land cover/use types in the 1990s and 2000s have been calculated compared to the baseline period, and the results are shown in Table 2. From Table 2, we can see that compared to the baseline period, a total of 371 (83%) and 356 (80%) HRUs’ land cover types have changed in the 1990s and 2000s, respectively. That is to say, more than 80% of land cover changes can be reflected in the SWAT model.

3.2.2. Parameter Sensitivity Analysis and Calibration

Numerous parameters influence the simulation results in SWAT; in total, 26 parameters are associated with hydrological processes. Because it is difficult and time consuming to calibrate all parameters at the same time, sensitivity analysis was performed for the monthly flow series from 1960 to 2010 at the five hydrological stations using the method embedded in the SWAT interface, Latin Hypercube One-factor-At-a-Time (LH-OAT). This analysis identified the key parameters influencing the model output. Based on the sensitivity analysis, the SUFI-2 algorithm in SWAT-CUP and an artificial trial and error method were used to calibrate the key parameters for the Linjiacun, Xianyang, Zhangjiashan, Huaxia and Zhuangtou hydrological stations.

3.2.3. Performance Evaluation

The performance of SWAT was evaluated by three statistical indicators [25], the Nash–Sutcliffe efficiency (NSE) [46], coefficient of determination (R2) and percentage of bias (PB; Gupta et al. 1999) [47]. The NSE is widely used in hydrograph assessment to measure the “goodness-of-fit” between the observed and simulated runoff. NSE values from 0 to 1 (ideal) are considered to indicate acceptable performance, while values from - to 0 indicate unacceptable performance. The R2 value assesses the correlation between two variables and ranges from 0 to 1 (ideal). The PB represents the average deviation of the simulated from the observed values; 0 is the ideal value. A negative (positive) value suggests that the simulated values underestimate (overestimate) the observed values. According to Moriasi et al. [48] and Guo et al. [49], the performance of the SWAT model at the monthly scale can be considered satisfactory if NSE > 0.5, R2 > 0.6, and PB < ±25%.

3.3. Quantifying Impacts on Runoff

Runoff simulated by the SWAT model is affected by climate and land cover (i.e., the model parameter values only involve those two factors). Therefore, the impacts of climate and land cover on runoff determined by SWAT cannot be directly used to represent the true impacts. Instead, we use the impacts of climate and land cover calculated by the SWAT model as intermediate variables when quantifying the effects of these variables in reality.
We note that the impacts of climate, land cover and direct human activities on runoff were quantified based on comparing runoff data between a baseline and a study period. The runoff series observed for the baseline period was used to calibrate the simulated series; if the performance of SWAT in this period was judged to be acceptable, the factors influencing runoff during the baseline period could be generalized into two categories of climate and land cover. In this study, the influencing factors during the study period were divided into climate, land cover and direct human activity categories. The steps involved are as follows:
  • Step (1): Calculate the relative influence of climate versus land cover on runoff in the SWAT model
In this step, we changed one factor at a time while holding the others constant [26] to calculate the relative impacts of climate and land cover on runoff. We ran the following four scenarios and compared their outputs:
S1:
Climate data during the baseline period and land cover data during the baseline period (baseline)
S2:
Climate data during the study period and land cover data during the baseline period (climate change)
S3:
Climate data during the baseline period and land cover data during the study period (land cover change)
S4:
Climate data during the study period and land cover data during the study period (climate and land cover change)
The difference in outputs between scenarios S2 (S3) and S1 indicates the impact of climate change (land cover variability) on runoff in SWAT. The detailed formula for determining the impact is as follows:
Δ R c l i a m t e 0 = R ¯ S 2 R ¯ S 1 Δ R l a n d u s e 0 = R ¯ S 3 R ¯ S 1 Δ R t o t a l 0 = Δ R c l i a m t e 0 + Δ R l a n d u s e 0 η c l i a m t e 0 = Δ R c l i a m t e 0 Δ R t o t a l 0 η l a n d u s e 0 = Δ R l a n d u s e 0 Δ R t o t a l 0
where R ¯ S 1 , R ¯ S 2 and R ¯ S 3 are the average runoff from scenarios S1, S2 and S3, respectively; Δ R c l i a m t e 0 ( Δ R l a n d u s e 0 ) is the difference in SWAT output between scenarios S2 (S3) and S1; and η c l i a m t e 0 and η l a n d u s e 0 are the relative impact from climate and land cover change, respectively. Note that the sum of η c l i a m t e 0 and η l a n d u s e 0 equals 100%. Δ R t o t a l 0 is the relative total impacts of climate and land cover change in the SWAT model.
  • Step (2): Quantify the impact of direct human activity during the study period
Because the simulated runoff is only affected by climate and land cover change, we assumed that any difference between the simulated and observed runoff was caused by direct human activity. Thus, the impact of direct human activity during the study period was calculated as follows:
Δ R h u m a n = R ¯ o b s R ¯ s i m Δ R t o t a l = R ¯ o b s R ¯ o b s 0 = Δ R c l i m a t e + Δ R l a n d u s e + Δ R h u m a n η h u m a n = Δ R h u m a n Δ R t o t a l × 100 %
where Δ R h u m a n is the effect on runoff caused by direct human activities; R ¯ o b s and R ¯ s i m are the observed and simulated runoff during the study period, respectively; R ¯ o b s 0 is the observed runoff during the baseline period; and η h u m a n is the impact of direct human activity during the study period.
  • Step (3): Calculate the total impacts of climate and land cover change during the study period
Based on Equation (2), the total impacts of climate and land cover change can be calculated as follows:
η C L = 100 % η h u m a n
where η C L represents the total impacts of climate and land cover change during the study period.
  • Step (4): Quantify the impact of climate versus land cover change in the study period
Based on Equations (1) and (2), the impact of climate and land cover change can be calculated as follows:
η c l i a m t e = η c l i a m t e 0 × η C L η l a n d u s e = η l a n d u s e 0 × η C L
where η c l i a m t e and η l a n d u s e are the impact of climate and land cover, respectively.

4. Results

4.1. Abrupt Changes in the Hydro-Meteorological Series

The MMK method was used to identify abrupt changes in the annual precipitation and temperature series from 1960 to 2010 for each sub-zone. The results are shown in Table 3. Abrupt changes were also calculated for the annual runoff data for the same period at the five hydrological stations; results are shown in Table 4. Table 2 shows that the precipitation series have no abrupt changes with the exception of one in 1990 in the UZ; the temperature series in all the sub-zones have an abrupt change that occurred from 1992 to 1994. Table 3 shows that the runoff series at the five hydrological stations all have abrupt changes at various times, but these are mainly concentrated in the early 1970s and the mid-1980s to the early 1990s.

4.2. Selection of the Simulation Period

Because the meteorological and hydrological series are stable and linear in the hydrological model, the simulation period for parameter calibration and validation in SWAT should therefore avoid the years with abrupt changes. Thus, based on the MMK results, 1970, 1987 and 1990–1994 should not be included in the simulation period. The period of 1960–1969 includes no abrupt changes and is also relatively close to the natural state; it would be a good choice for parameter calibration and validation, but was unsuitable because there is no land cover map for the 1960s. Considering that the earliest land cover map is from 1985, a relatively stable period of 11 years, from 1976 to 1986, was selected as the simulation period. The period from 1976 to 1977 was used as a warm-up period to mitigate the effects of unknown initial conditions, and the periods from 1978 to 1982 and 1983 to 1986 were used for parameter calibration and validation, respectively. Table 5 is the comparison results of observed and natural runoff in the base period. As the natural runoffs are the sum of observed and water intake runoff, the differences between observed and natural runoff are caused by water intake projects (including reservoir storage, irrigation, industrial and domestic use). From Table 5, we can obtain that the average impacting degree of water intake projects is approximately 10%; that is to say, the impacts of reservoirs and dams are less than 10%, indicating that the impacts of reservoirs and dams in the simulation period are not obvious.

4.3. Model Calibration and Validation

Table 6 shows the results of sensitivity analysis and the best fit values of parameters for the Linjiacun, Xianyang, Huaxian, Zhangjiashan and Zhuangtou stations. To illustrate the model calibration and validation, measured and observed monthly runoff data from the five hydrological stations for the calibration (1978–1982) and validation (1983–1986) periods are plotted in Figure 5. It is clear that the simulated series are consistent with the observed series during both the calibration and validation periods. Furthermore, the results of the three statistical indicators indicated satisfactory performance of the SWAT model at all five stations (Table 7) based on to suggestions of Tan et al. [25].
The validation period has better temporal performance than the calibration period, which may be because the 1985 land cover map could more accurately reflect the land cover patterns during the validation period. In terms of spatial performance, the simulation for the main stream is better thanfor the tributaries, which is probably because the spatial distribution of precipitation and temperature is more accurately reflected in the main stream, which has more weather stations. In the main stream, the simulation at Linjiacun station is inferior to the simulations at Xianyang and Huaxian stations; this could be due to water diversion from the Baojixia project. Similarly, the Jinghuiqu and Luohuiqu projects, located on the Jing River and Beiluo River, respectively, may have negatively affected the simulations in these tributaries.
In general, the monthly simulation results for the five hydrological stations perform well during both the calibration and validation periods, which indicates that the SWAT model is applicable in the WRB and can be used for further analysis.

4.4. Quantification of Temporal and Spatial Impacts

In this study, the climate datasets from 1987 to 2000 were divided into two periods from 1987 to 2000 (representing the 1990s) and 2001 to 2010 (representing the 2000s). The land cover maps from 1995 and 2005 were used to reflect land cover patterns for the 1990s and the 2000s, respectively. According to the procedures described in Section 3.3, we quantified the impacts of climate, land cover change and direct human activities on runoff in each sub-zone during the 1990s and 2000s compared with the baseline period (1978–1986). Seven scenarios (listed in Table 8) were used to run the calibrated SWAT model and their outputs were compared to calculate the relative effects of climate and land cover change in the SWAT model using step (1), and the results are presented in Table 9. Next, the impacts of climate, land cover change and direct human activities on runoff were quantified with steps (2)–(4), and the results are shown in Table 10.
Table 9 shows that the relative impact of climate in the five sub-zones ranges from 88.93% to 97.95% during the 1990s and from 81.57% to 107.22% during the 2000s. This indicates that climatic variations had greater effects on runoff than land cover in the SWAT model. In addition, the error values calculated with Equation (2) are all less than 20%, verifying that this partitioning of impacts between climate and land cover is reasonable, according to Guo [49]. It is clear from Table 10 that the runoff in each sub-zone was significantly reduced in the 1990s and 2000s compared with the baseline period. Compared to the 1990s, then, there was less of a decrease in runoff during the 2000s over the entire basin, with the exception of Jing zone (JZ). The impact of each factor did not vary much in the five sub-zones during the 1990s. For example, the effects of climatic variation, land cover change and direct human activities ranged from 63.43% to 89.26%, 3.81% to 11.17% and 6.27% to 28.68%, respectively. In contrast, the impact of each factor had a larger range during the 2000s. The contributions of climatic variation, land cover change and direct human activities varied between 39.95% and 65.48%, 2.69% and 12.95%, and 29.21% and 62.74%, respectively. We note that the impact of climatic variation decreased from the 1990s to the 2000s while the impact of direct human activities increased; the impact of land cover change was stable within 10%.
To analyze the spatial impacts of climate, land cover and direct human activities on runoff, we plotted the proportional impact of the three factors in the five sub-zones for the 1990s and 2000s (Figure 6). Figure 6a shows that climatic variation was the main cause of runoff decline in the five sub-zones during the 1990s, accounting for approximately 75%; direct human activities had the second greatest impact, accounting for approximately 15%. During the 2000s, climatic variation was still the main cause of runoff decline in the UZ, MZ and JZ, accounting for approximately 60%, and direct human activities was a secondary factor, accounting for approximately 30% (Figure 6b). However, in the DZ, direct human activities were the primary cause of runoff declines, accounting for approximately 60%, and climatic variation had the second greatest impact, accounting for approximately 40%. In the BZ, climatic variation and direct human activities contributed equally to reductions in runoff; both account for approximately 45%. Land cover change had a slight positive contribution of 2.69% to the increase in runoff in the DZ during the 2000s. Otherwise, though, land cover change had a small but consistent impact on runoff decline, accounting for approximately 10% in the other sub-zones. In general, climatic variation was the main factor leading to runoff declines over the entire basin during the 1990s and remained dominant in the UZ, MZ and JZ during the 2000s. Direct human activities were the primary cause of runoff decline in the DZ and BZ during the 2000s.

5. Discussion

5.1. Model Uncertainty Analysis

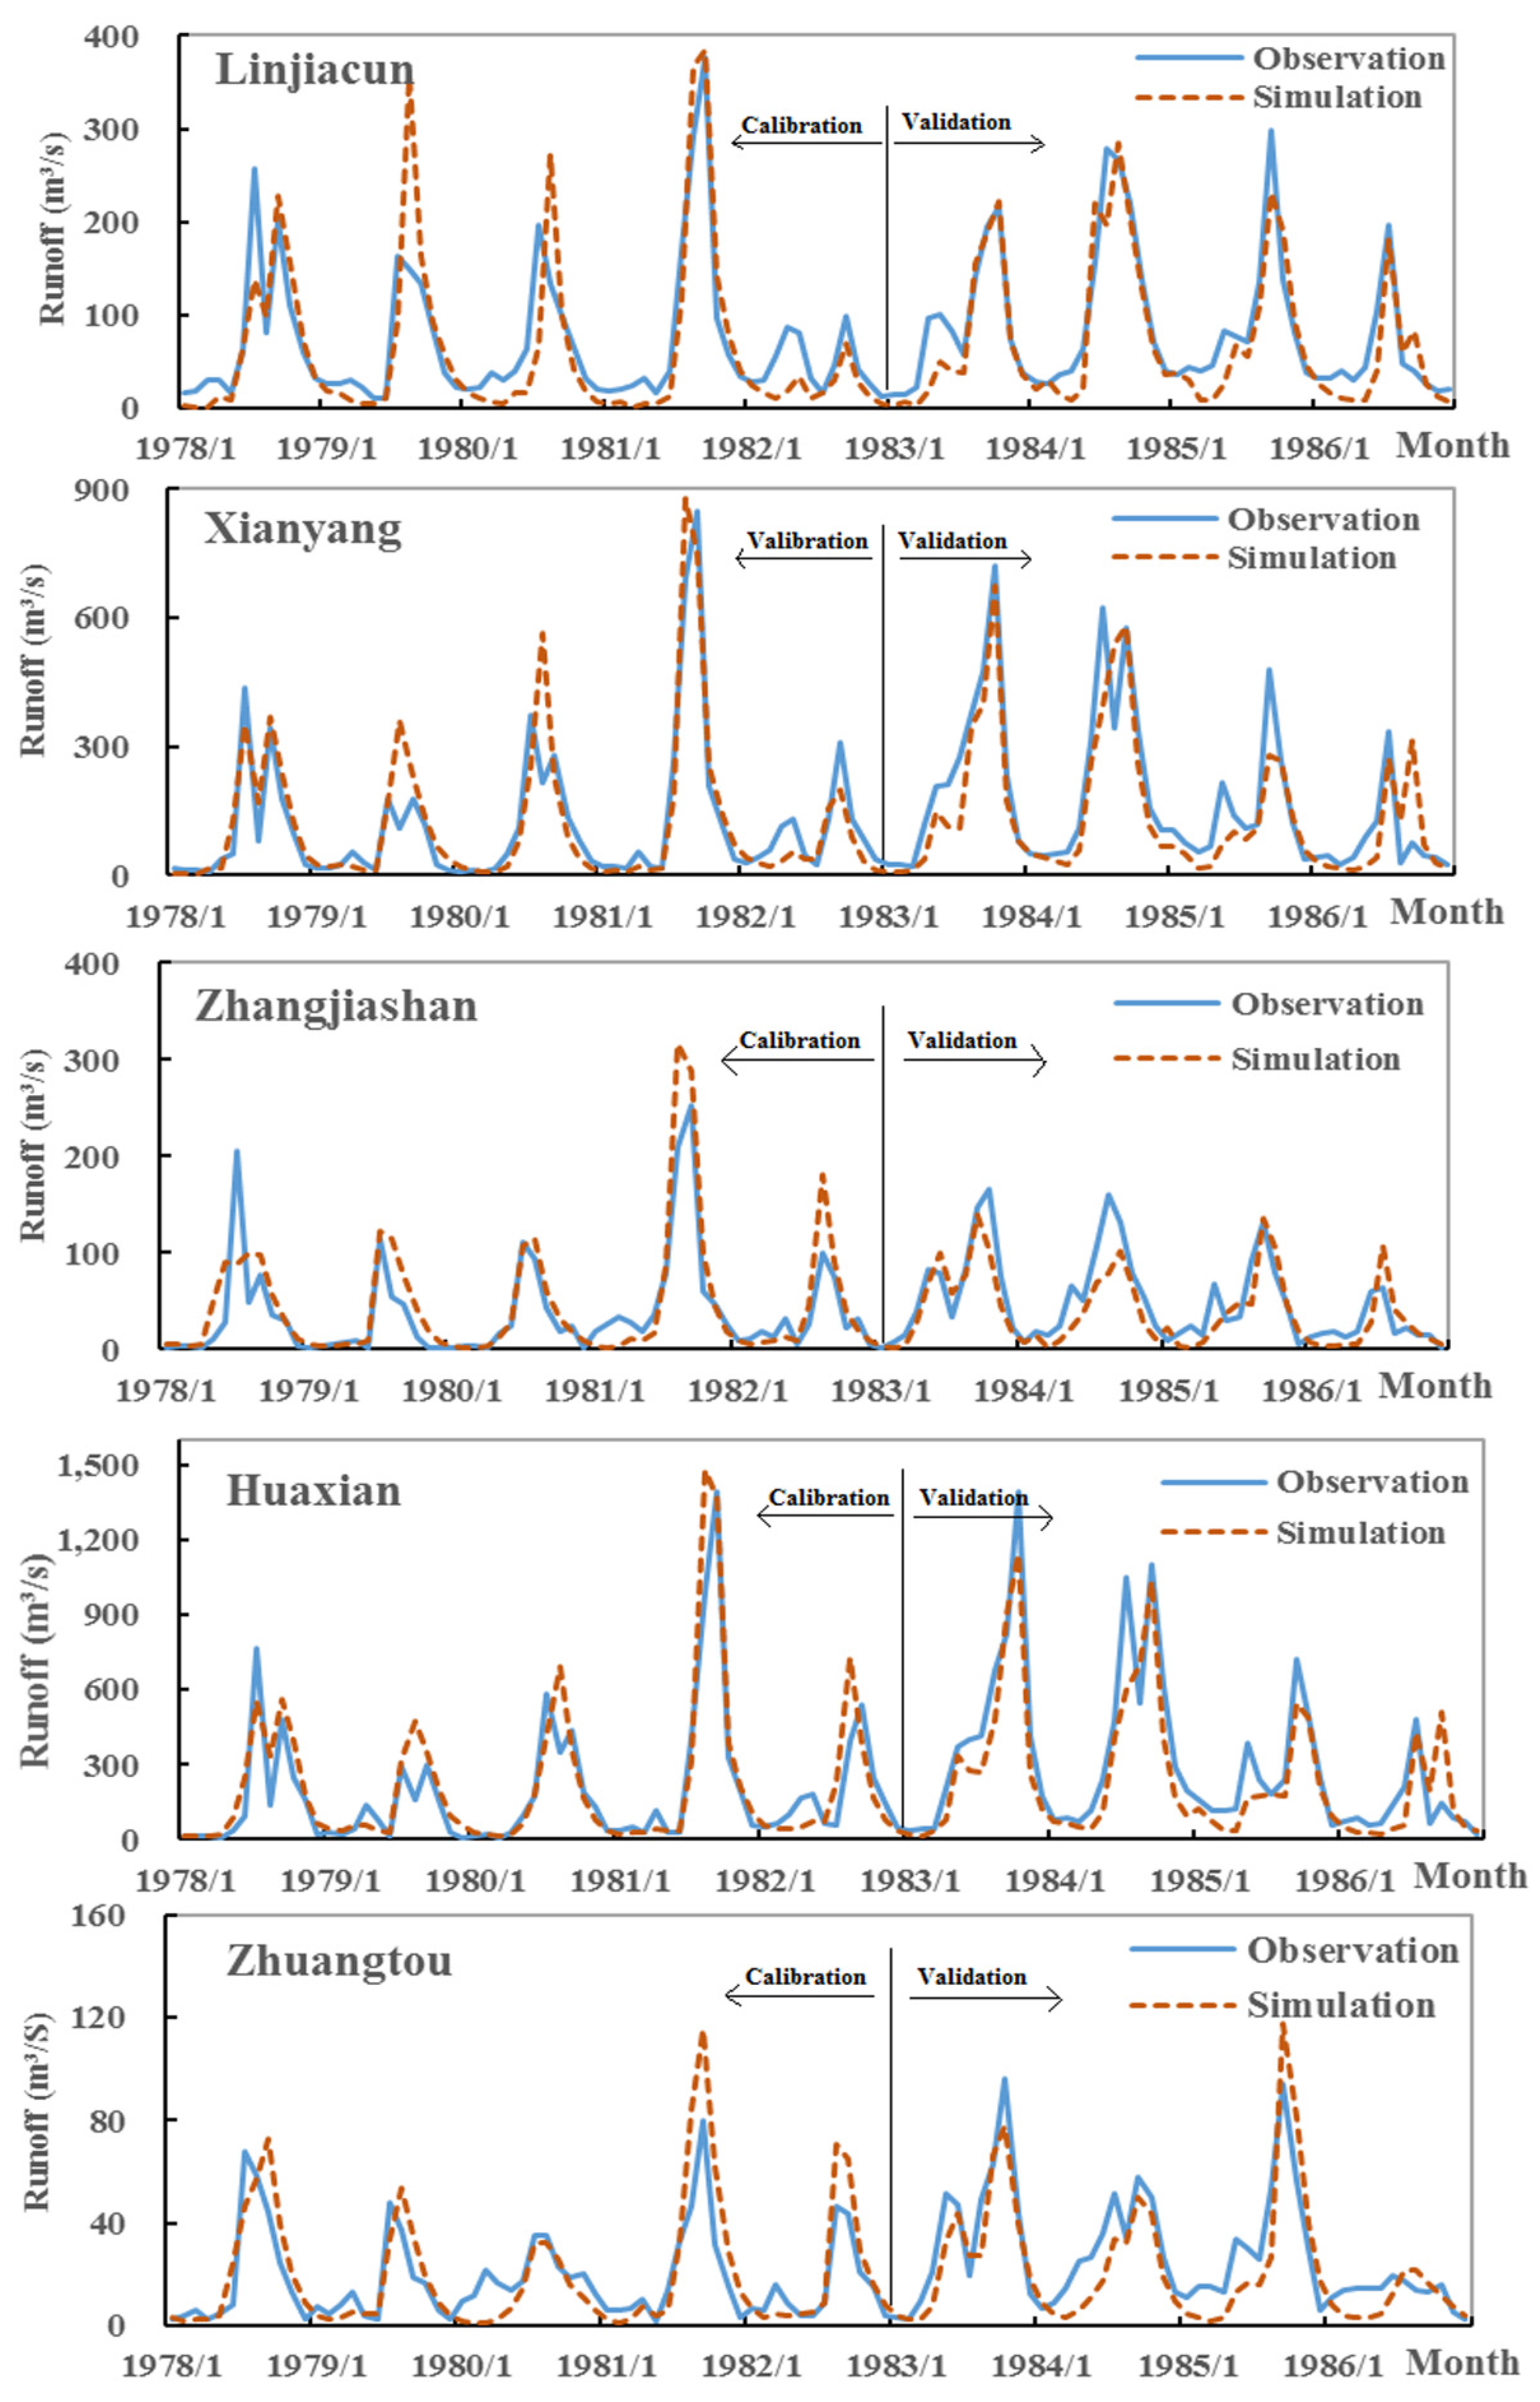
In this study, simulation performance was limited by three factors. First, there are many uncertain factors within the model; these include the spatial data (the DEM and soil and land cover maps) and the meteorological data (precipitation and temperature). Second, the model uses numerous generalized and empirical formulas to characterize complex hydrological processes, which can negatively affect the results. Finally, the hydrological model is highly complex, with 26 parameters, and a calibration period including nine years of data is likely too short to properly calibrate and validate the model at a monthly scale.

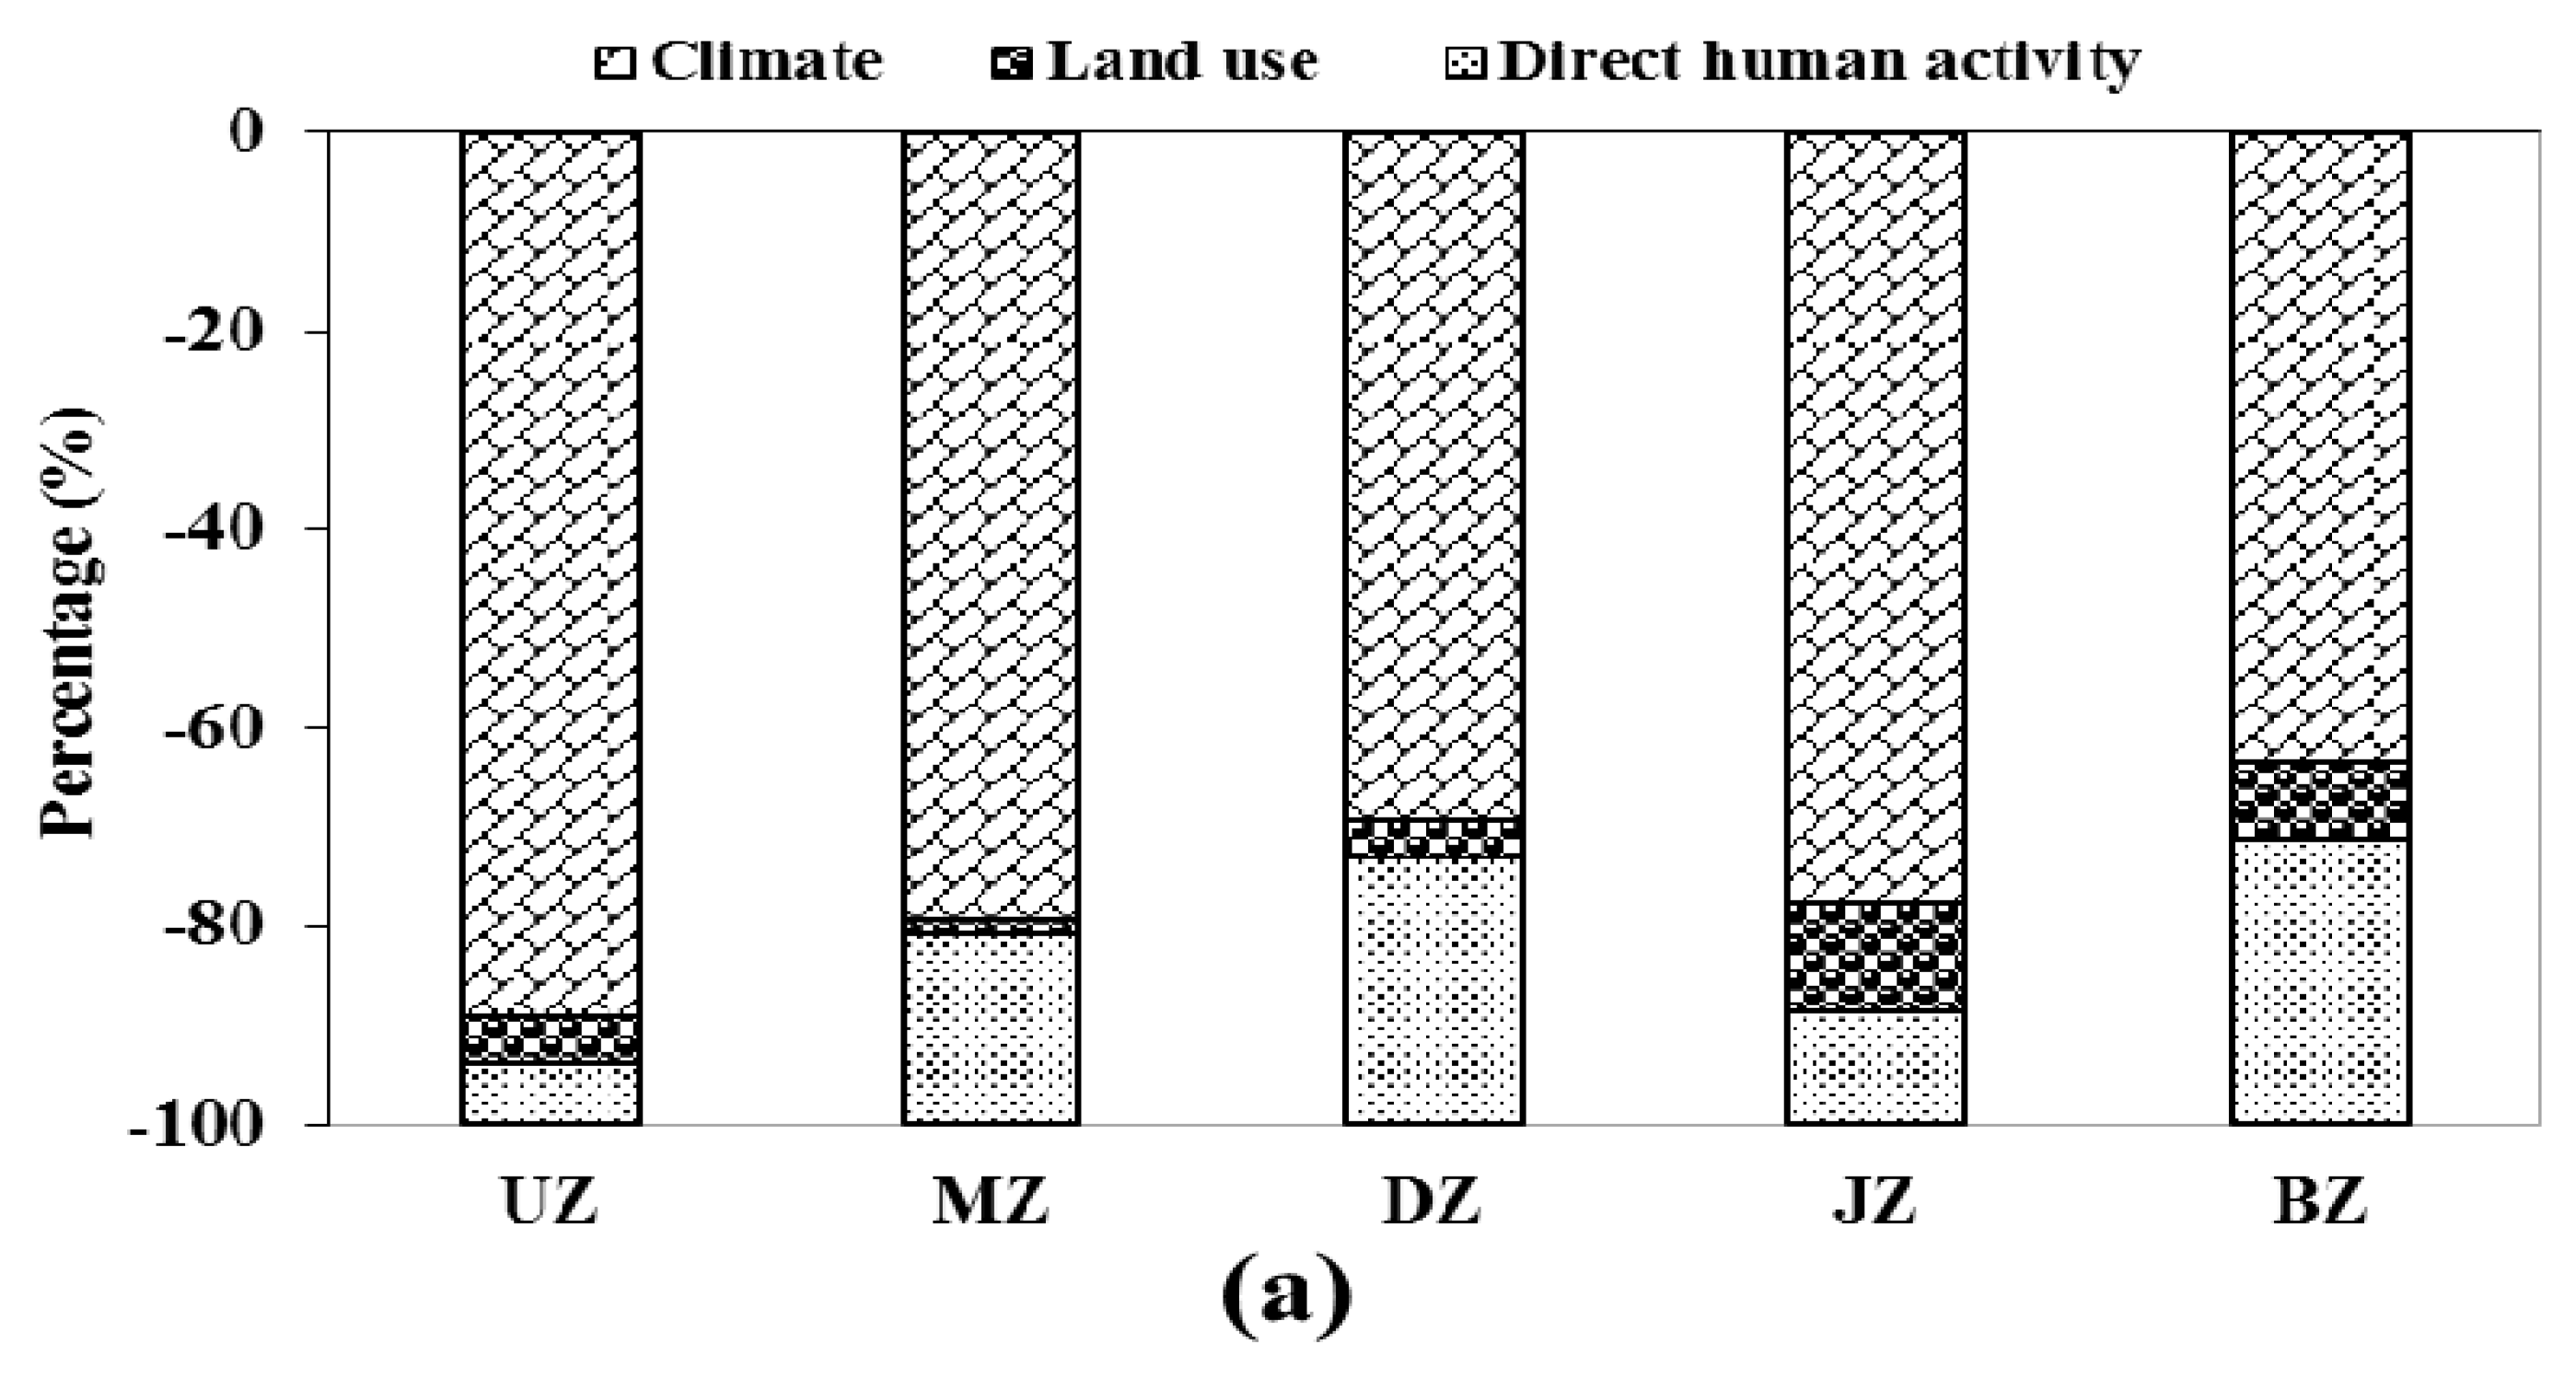
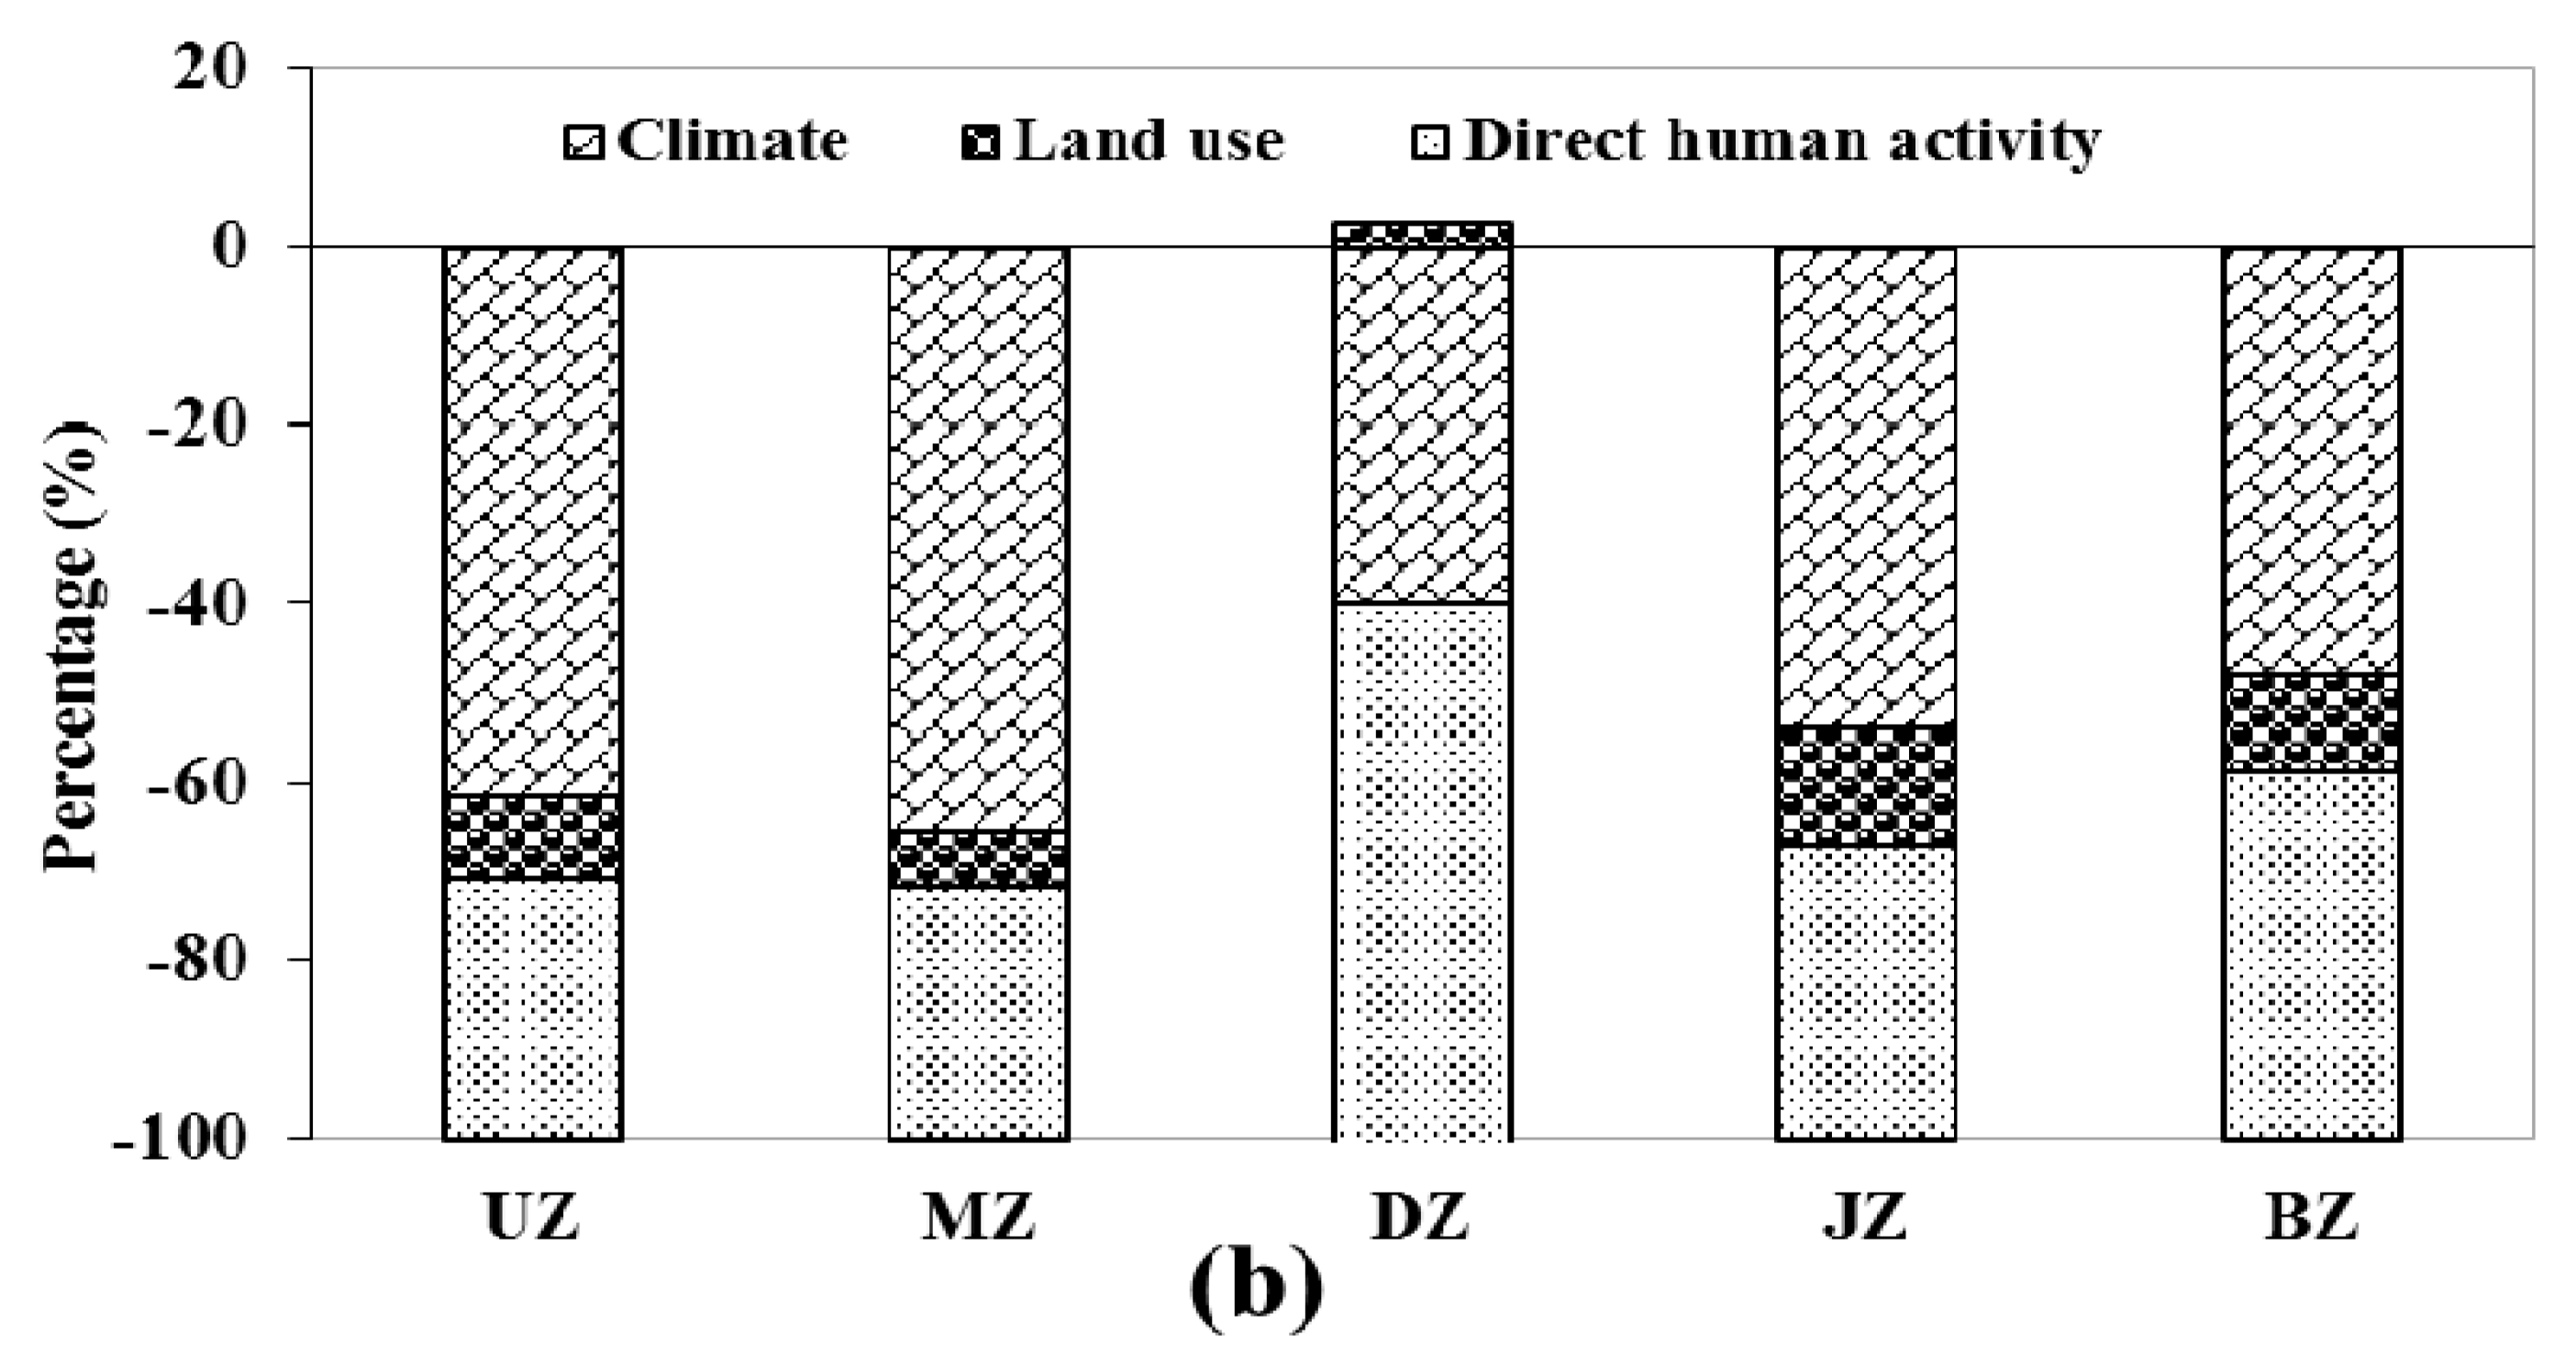
5.2. Assessment of the Impacts of Climatic Variation

Viewed spatially, the impacts of climatic variation in the UZ were greatest for the main stream; in the tributaries, its impacts were greater in the JZ than in the BZ. Temporally, the impacts of climatic variation were greater during the 1990s than during the 2000s. To evaluate these results, we calculated the average variations in precipitation and temperature in the five sub-zones during the 1990s and 2000s compared with the baseline period (Table 11).
During the 1990s, the temperature in all sub-zones increased by 0.5 °C–0.6 °C; precipitation decreased sharply, ranging from 40 mm to 60 mm. Precipitation in the UZ decreased the most, by 60 mm, while precipitation in the BZ decreased the least, by 40 mm. These data explain why the impact of climatic variation on runoff during the 1990s is largest in the UZ at 89.26%. In the BZ, its impact is smallest (60%). During the 2000s, temperatures in all sub-zones continued to increase, from 1.0 °C to 1.2 °C. Precipitation also decreased but by a similar amount over all five sub-zones, ranging from 20 mm to 30 mm. Compared to the 1990s, precipitation in all sub-zones increased slightly, which could account for the weakened impact of climatic variation during the 2000s. Overall, the reduction in runoff due to climatic variation is the consequence of increased temperature and decreased precipitation. Spatial discrepancies in the impact of climate are mainly caused by differences in precipitation among the five sub-zones.

5.3. Assessment of the Impacts of Land Cover Change

Spatially, the impact of land cover change in the tributaries is greater than in the main stream. Land cover change was also a more important factor during the 2000s than the 1990s. In general, the impacts of land cover change in the five sub-zones during the 1990s and 2000s are small and relatively constant, within 10%.
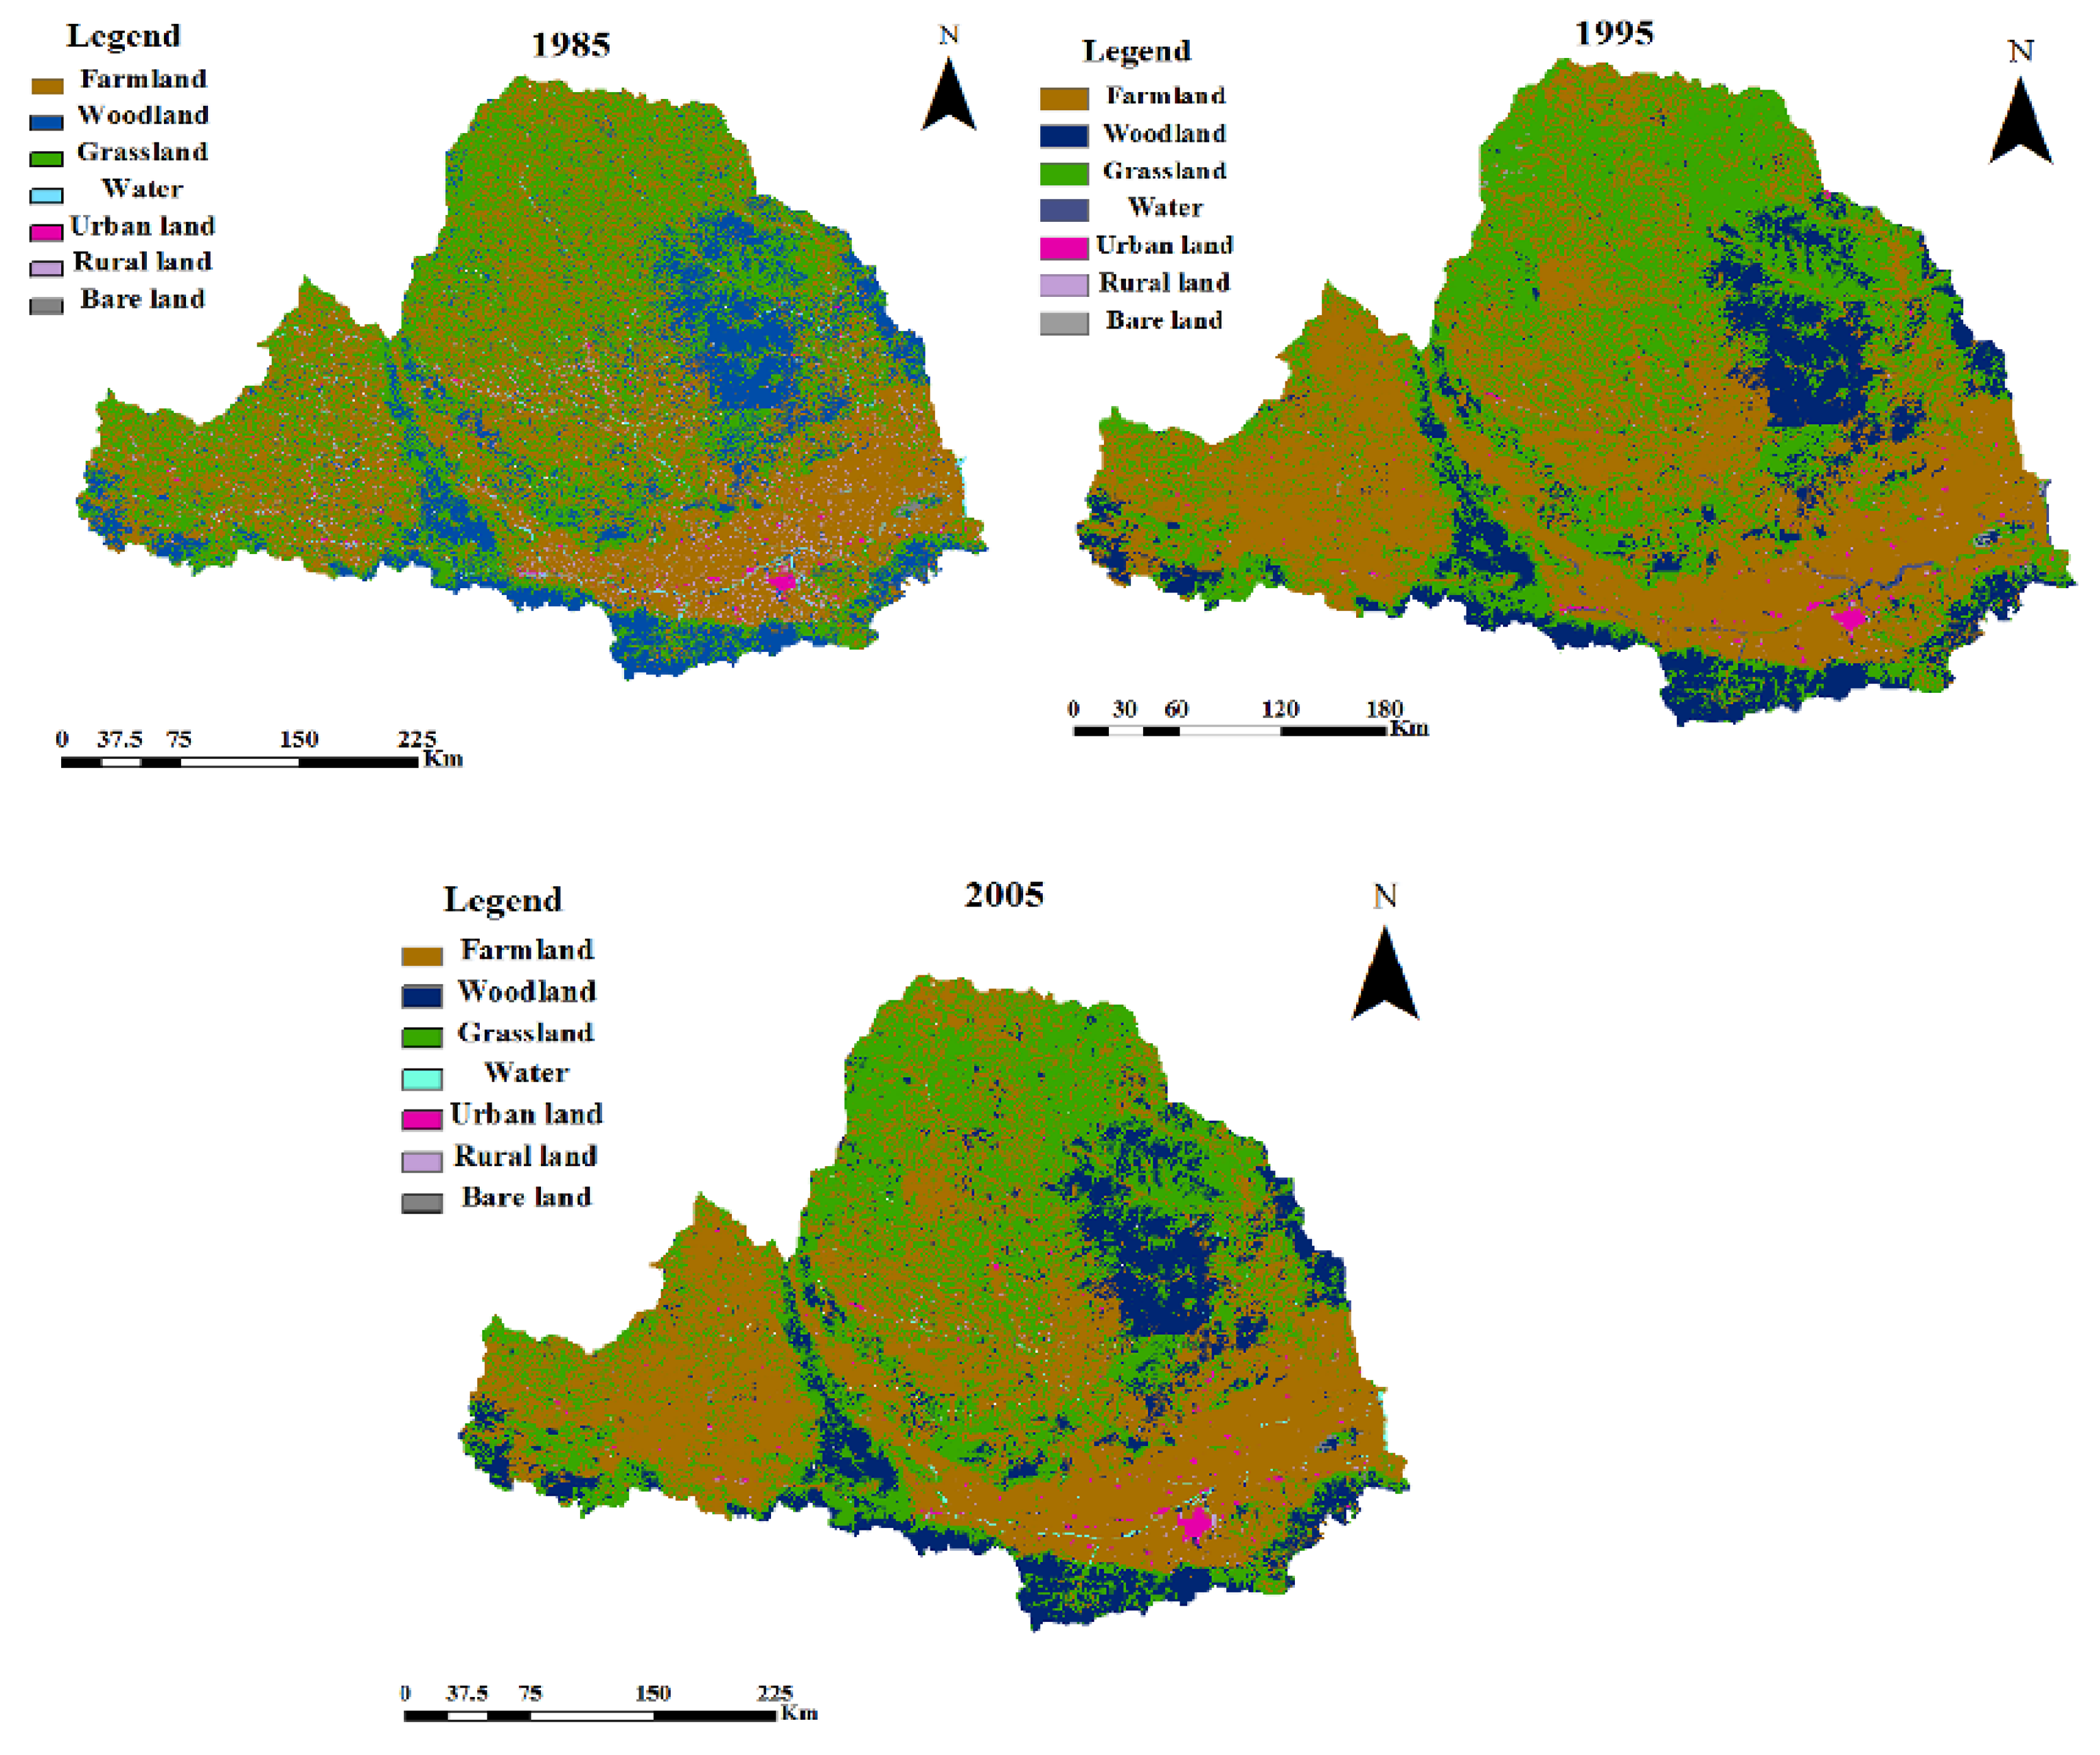
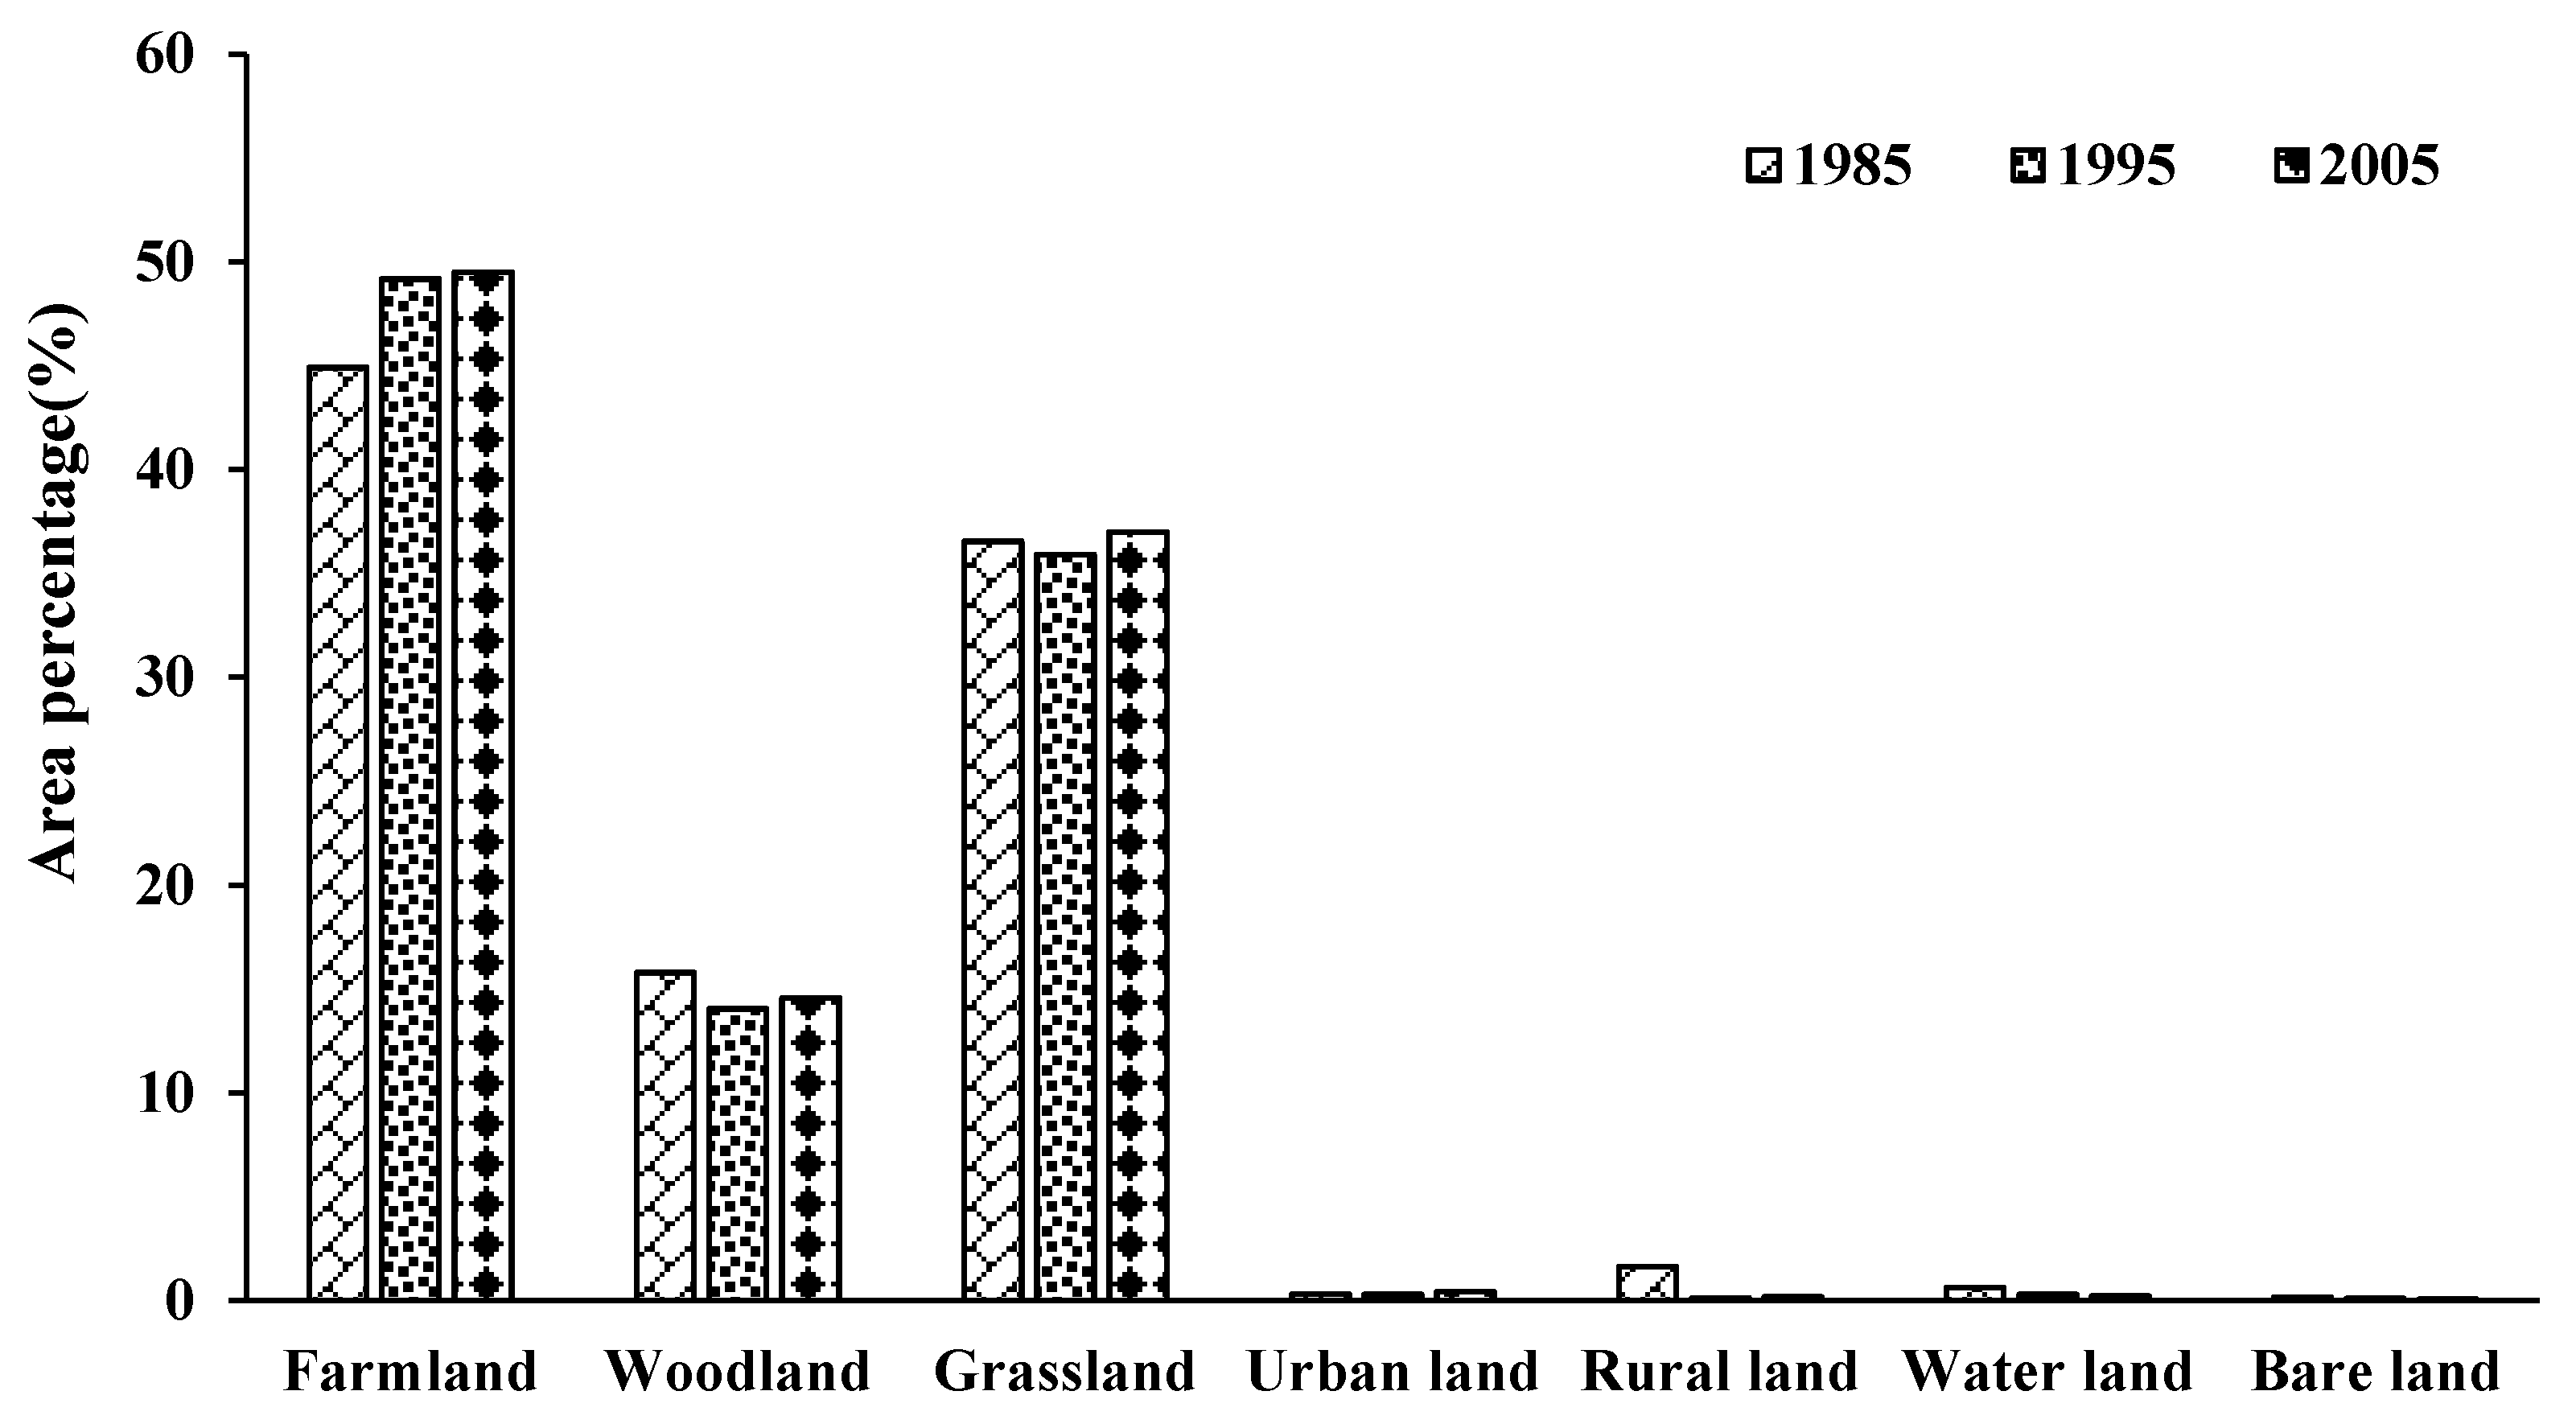
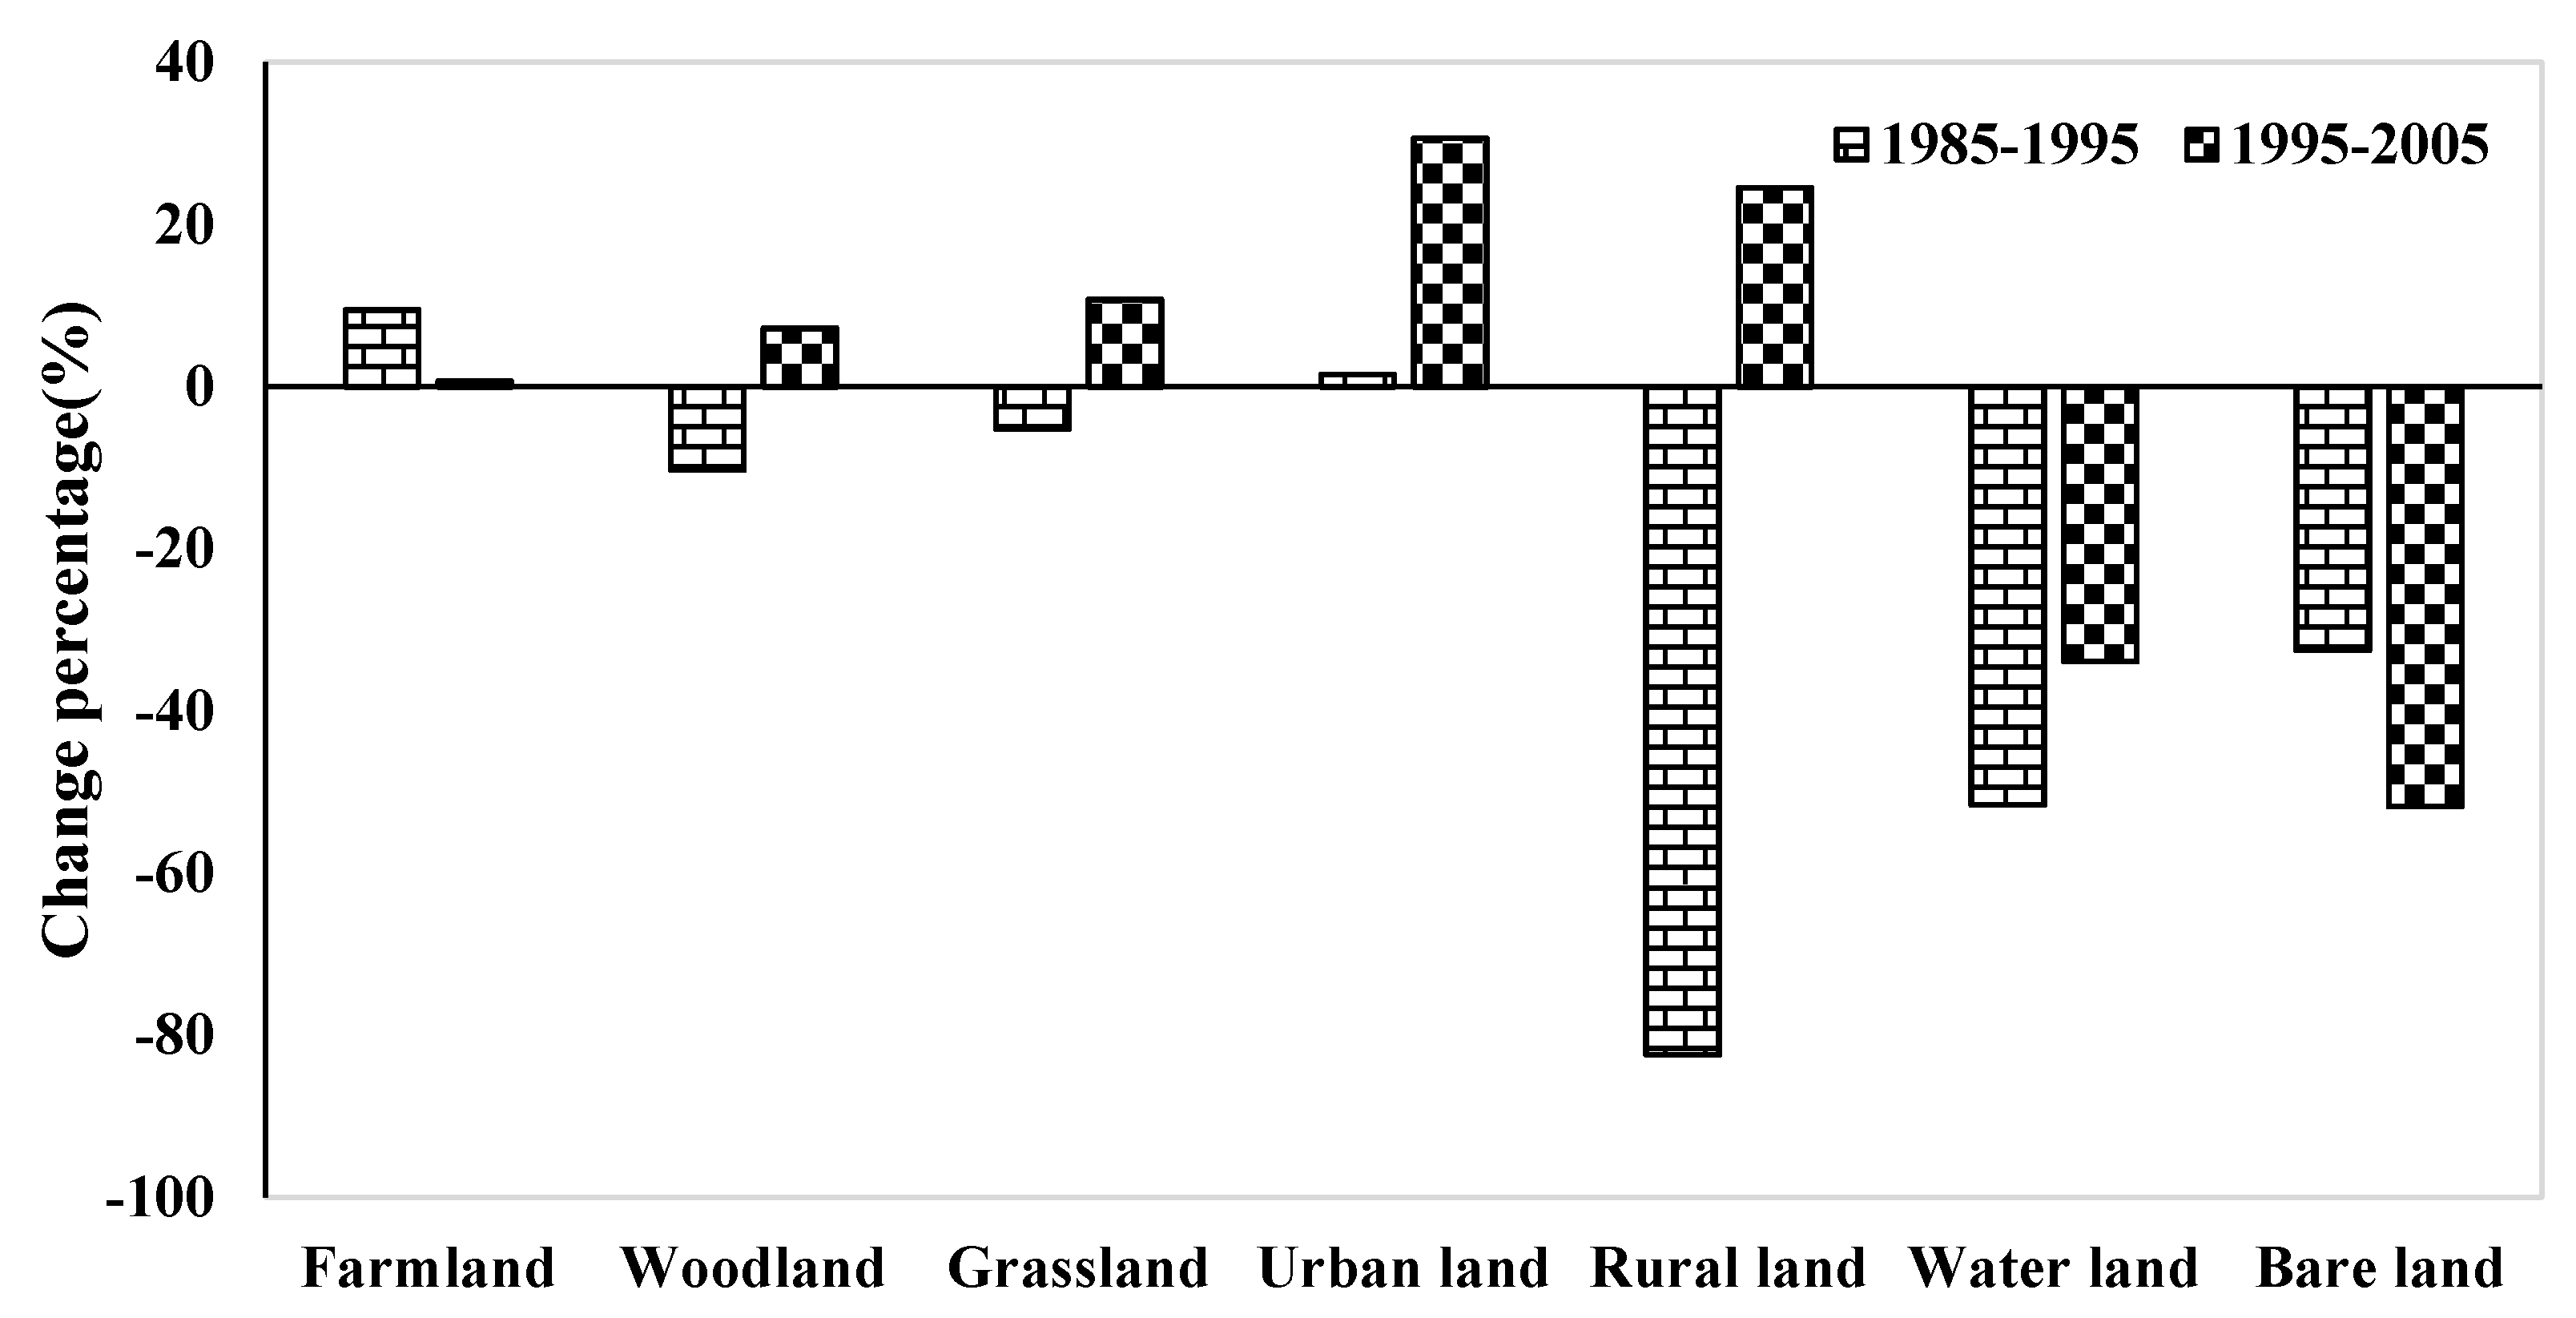
To explain these patterns, we analyzed variations in three land cover maps (from 1985, 1995 and 2005) during the baseline period, the 1990s and the 2000s using spatial analysis techniques in ArcGIS (Figure 7). The results show that the dominant land cover types during the three periods were farmland, woodland and grassland, which together account for approximately 98% of the entire basin. Compared to the baseline period, there is little percentage change (less than 10%) in the area occupied by these land cover types during the 1990s and 2000s (Figure 8). This consistency explains why land cover has little impact on runoff during the 1990s and the 2000s. In contrast, the runoff increase due to land cover change in the DZ during the 2000s is because of rapid urban development (mainly Xi’an City in the DZ) in this period. Figure 8 shows that the urban area in the DZ increased by 36% during the 2000s compared to the baseline period.

5.4. Assessment of the Impacts of Direct Human Activities

Spatially, the impact of direct human activities increases gradually from UZ to DZ along the main stream, and in the tributaries, it is greater in the BZ than in the JZ. The impact of direct human activities was greater during the 2000s than the 1990s.
In the WRB, direct human activities include reservoir storage, irrigation and industrial and domestic water use. According to statistical data from the Ministry of Water Resources, 1635 diversion projects had been built by 2015. These include three nationally famous projects, the Baojixia, Jinghuiqu and Luohuiqu projects, which are located in the UZ, JZ and BZ, respectively. In addition, 129 large and moderately sized reservoirs have also been constructed in the WRB. These include four large reservoirs, the Shitouhe, Fengjiashan, Yangmaowan and Jinpen reservoirs, which are all located in the MZ. The zones of urban construction and industrial activity are mainly concentrated in the DZ, and especially Xi’an City, which has a rapidly growing population and economy.
Table 12 shows the average change in water consumption during the 1990s and 2000s compared to the baseline period caused by the above human activities. It is clear that agricultural irrigation and industrial and domestic water use are the main reasons for the reductions in runoff caused by direct human activities. The rapid development of urban areas over the last 20 years, especially in the DZ, explains why the impact of direct human activities increases downstream and from the 1990s to the 2000s.

6. Conclusions

Investigating the temporal and spatial impacts of changing environmental variables on runoff in the WRB, will help managers effectively cope with extreme events such as droughts in arid regions of China. We divided the factors influencing runoff into three categories of climate, land cover change and direct human activities. We compared changes during the 1990s and the 2000s to a baseline period (1978–1986) and examined five sub-zones of the WRB (UZ, MZ, DZ, JZ and BZ). The MMK test was used to identify abrupt changes in the annual hydro-meteorological series and thus help select the simulation period. The SWAT model was calibrated and validated using observed monthly flow data from five hydrological stations to model hydrological processes. We evaluated the SWAT model results by examining variations in climate, land cover change and direct human activities. Our conclusions are as follows:
(1)
Based on the presence of abrupt changes and the fact that the earliest land cover map available was for 1985, the SWAT model was calibrated and validated in 1978–1982 and 1983–1986, respectively. Our results demonstrate that the performance of the SWAT model at the five stations was satisfactory; the three statistical indicators examined were within the required range (NSE > 0.5, R2 > 0.6, and PB < ±25%).
(2)
Compared to the baseline period from 1978 to 1986, the effects of climatic variation, land cover change and direct human activities on runoff were similar among the five sub-zones during the 1990s; the impacts were approximately 75%, 10% and 15%, respectively. During the 2000s there were significant spatial differences in these impacts; respectively, these were approximately 60%, 10% and 30% in the UZ, MZ and JZ; 40%, −3% and 63% in the DZ; and 41%, 11% and 48% in the BZ.
(3)
In general, climatic variation was the main cause of runoff decline over the entire basin during the 1990s; it remained the dominant forcing in the UZ, MZ and JZ during the 2000s. However, direct human activities largely accounted for the decline in runoff in the DZ and BZ during the 2000s. The impact of climatic variation has decreased and the impact of direct human activities has increased from the 1990s to the 2000s. The impact of land cover change has been fairly stable, changing by less than 10%.
(4)
The reduction in runoff due to climatic variation is the consequence of increased temperature and decreased precipitation. The reductions from direct human activities are mainly because of increasing demand for irrigation and industrial and domestic water. The basic reason that land cover change had a limited impact on runoff both during the 1990s and the 2000s is that the dominant land cover types in the WRB are farmland, woodland and grassland. Together, these land cover types account for approximately 98% of the basin and their areas have changed by less than 10% compared to the baseline period.

Acknowledgments

This research was supported by the Natural Science Foundation of China (51190093), the Key Laboratory Project of Shaanxi Education Department (13JS069), the Key Laboratory of Science and Technology Innovation Project of Shaanxi (2013SZS02-Z02), and the Key Innovation Group of Science and Technology of Shaanxi (2012KCT-10). We thank the editor and anonymous reviewers for their professional comments and corrections.

Author Contributions

Modeling and analysis was performed by Yunyun Li and Jianxia Chang; the paper was written by Yimin Wang and Yunyun Li; and data were provided and basic calculations were performed by Wenting Jin and Aijun Guo.

Conflicts of Interest

The authors declare no conflict of interest.

Appendix

Technical Details of the Modified Mann–Kendall (MMK) Test Method

For a time series of m observations X = x 1 , x 2 , x 3 , ... x m , the trend statistic S of MK is calculated as follows:
S = i < j s n g ( x j x i )
where
s n g ( x j x i ) = { 1 , x j > x i 0 , x j > x i 1 , x j < x i
Then
V a r ( S ) = m ( m 1 ) ( 2 m + 5 ) 18
The standardized test statistic Z = S V a r ( S ) with the standard normal variable under a desired significance level is computed to analyze the significance trend of the time series. Hamed and Rao [43] noted that autocorrelation in a time series could affect the results of the variance of S. To remove the influence of autocorrelation, Hamed and Rao [43] proposed extracting a nonparametric trend estimator from the original time series to rank the autocorrelation coefficients of the new time series by size. Autocorrelation coefficients ( σ s at l a g ( i ) ) that are significantly different from zero at the 5% significance level are applied to calculate the modified variance of S; next, V ' ( S ) is calculated as follows:
V ' ( S ) = V a r ( S ) C o r
where C o r is the correction due to the autocorrelation of a time series, and it is computed as follows:
C o r = 1 + 2 m ( m 1 ) ( m 2 ) i = 1 m 1 ( m 1 ) ( n i 1 ) ( n i 2 ) σ s ( i )
The time series trend of the MMK test is evaluated at the 5% significance level.

References

  1. Chiew, F.H.S.; McMahon, T.A. Detection of trend or change in annual flow of Australian rivers. Int. J. Climatol. 2006, 13, 643–653. [Google Scholar] [CrossRef]
  2. Khaliq, M.N.; Ouarda, T.B.M.J.; Gachon, P. Identification of temporal trends in annual and seasonal low flows occurring in Canadian rivers: The effect of short and long-term persistence. J. Hydrol. 2009, 369, 183–197. [Google Scholar] [CrossRef]
  3. Sang, Y.F.; Wang, D.; Wu, J.C.; Zhu, Q.P.; Wang, L. Human impacts on runoff regime of middle and lower Yellow River. Water Sci. Eng. 2011, 4, 36–45. [Google Scholar]
  4. Gu, Y.; Lin, J.; Wang, X.L.; Zhang, X.J. Trend of Annual Runoff for Major Rivers in China under Climate Change. Procedia Eng. 2012, 28, 564–568. [Google Scholar] [CrossRef]
  5. Velpuri, N.M.; Senay, G.B. Analysis of long-term trends (1950–2009) in precipitation, runoff and runoff coefficient in major urban watersheds in the United States. Environ. Res. Lett. 2013, 8, 024020. [Google Scholar] [CrossRef]
  6. Ling, H.B.; Xu, H.L.; Fu, J.Y. Changes in intra-annual runoff and its response to climate variation and human activities in the headstream areas of the Tarim River Basin, China. Quat. Int. 2014, 336, 158–170. [Google Scholar] [CrossRef]
  7. Huang, S.Z.; Chang, J.X.; Leng, G.Y.; Qiang, H. Integrated index for drought assessment based on variable fuzzy set theory: A case study in the Yellow River basin, China. J. Hydrol. 2015, 527, 608–618. [Google Scholar] [CrossRef]
  8. Milly, P.C.D.; Betancourt, J.; Falkenmark, M.; Hirsch, R.M.; Kundzewicz, Z.W.; Lettenmaier, D.P.; Stouffer, R.J. Stationarity is dead: Whither water management? Science 2008, 319, 573–574. [Google Scholar] [CrossRef] [PubMed]
  9. Wang, D.B.; Hagen, S.C.; Alizad, K. Climate variation impact and uncertainty analysis of extreme rainfall events in the Apalachicola River basin, Florida. J. Hydrol. 2013, 480, 125–135. [Google Scholar] [CrossRef]
  10. Yang, H.B.; Qi, J.; Xu, X.Y.; Yang, D.W.; Lv, H.F. The regional variation in climate elasticity and climate contribution to runoff across China. J. Hydrol. 2014, 517, 607–616. [Google Scholar] [CrossRef]
  11. Ma, Z.M.; Kang, S.Z.; Zhang, L.; Tong, L.; Su, X.L. Analysis of impact of climate variability and human activities on streamflow for a river basin in arid region of northwest China. J. Hydrol. 2008, 352, 239–249. [Google Scholar] [CrossRef]
  12. Jun, D.; Shi, C.X. Effects of climatic factors and human activities on runoff of the Weihe River in recent decades. Quat. Int. 2012, 282, 58–65. [Google Scholar]
  13. Ye, X.C.; Zhang, Q.; Liu, J.; Li, X.H.; Xu, C.Y. Distinguishing the relative impacts of climate change and human activities on variation of streamflow in the Poyang Lake catchment, China. J. Hydrol. 2013, 494, 83–95. [Google Scholar] [CrossRef]
  14. Zhao, G.J.; Tian, P.; Mu, X.M.; Jiao, J.Y.; Wang, F.; Gao, P. Quantifying the impact of climate variability and human activities on streamflow in the middle reaches of the Yellow River basin, China. J. Hydrol. 2014, 519, 387–398. [Google Scholar] [CrossRef]
  15. Jiang, C.; Xiong, L.H.; Wang, D.B.; Pan, L.; Guo, S.L.; Xu, C.Y. Separating the impacts of climate variation and human activities on runoff using the Budyko-type equations with time-varying parameters. J. Hydrol. 2015, 522, 326–338. [Google Scholar] [CrossRef]
  16. Mango, L.M.; Melesse, A.M.; McClain, M.E. Land use and climate change impacts on the hydrology of the upper Mara River Basin, Kenya: Results of a modeling study to support better resource management. Hydrol. Earth Syst. Sci. 2011, 15, 2245–2258. [Google Scholar] [CrossRef]
  17. Zhao, Y.; Yu, X.X.; Zheng, J.K.; Wu, Q.Y. Quantitative effects of climate variations and land-use changes on annual streamflow in Chaobai river basin. Trans. Chin. Soc. Agric. Eng. 2012, 28, 252–260, (In Chinese with English Abstract). [Google Scholar]
  18. Shi, P.; Ma, X.X.; Hou, Y.B. Effects of land-use and climate change on hydrological processes in the upstream of Huai River, China. Water Resour. Manag. 2013, 27, 1263–1278. [Google Scholar] [CrossRef]
  19. Wang, R.Y.; Kalin, L.; Kuang, W.H. Individual and combined effects of land use/ cover and climate change on Wolf Bay watershed streamflow in southern Alabama. Hydrol. Process. 2014, 28, 5530–5546. [Google Scholar] [CrossRef]
  20. Guo, A.J.; Chang, J.X.; Huang, Q.; Sun, J.L. Quantitative analysis of the impacts of climate change and human activities on runoff change in Weihe Basin. Nat. Sci. Ed. 2014, 42, 212–220, (In Chinese with English Abstract). [Google Scholar]
  21. Yuan, Y.Z.; Zhang, Z.D.; Meng, J.H. Impact of changes in land use and climate on the runoff in Liuxihe Watershed based on SWAT model. Chin. J. Appl. Ecol. 2015, 26, 989–998, (In Chinese with English Abstract). [Google Scholar]
  22. He, Y.; Lin, K.; Chen, X. Effect of Land Use and Climate Change on Runoff in the Dongjiang Basin of South China. Math. Probl. Eng. 2013, 14. [Google Scholar] [CrossRef]
  23. Zhang, L.; Li, L.; Xia, J.; Wang, R. Quantitative Assessment of the Impact of Climate Variability and Human Activities on Runoff Change in the Luanhe River Catchment. J. Nat. Resour. 2015, 30, 664–672. (In Chinese) [Google Scholar]
  24. Wei, X.H.; Liu, W.F.; Zhou, P.C. Quantifying the relative contributions of forest change and climatic variability to hydrology in large watersheds: A critical review of research methods. Water 2013, 5, 728–746. [Google Scholar] [CrossRef]
  25. Tan, M.L.; Ibrahim, A.L.; Yusop, Z.; Duan, Z.; Ling, L. Impacts of land-use and climate variability on hydrological components in the Johor River basin, Malaysia. Hydrol. Sci. J. 2015, 60, 873–889. [Google Scholar] [CrossRef]
  26. Khoi, D.N.; Suetsugi, T. Impact of climate and land-use changes on hydrological processes and sediment yield-a case study of the Be River catchment, Vietnam. Hydrol. Sci. J. 2014, 59, 1095–1108. [Google Scholar] [CrossRef]
  27. Arnold, J.G.; Srinivasan, R.; Muttiah, R.S.; Williams, J.R. Large area hydrologic modeling and assessment-partI: Model development. J. Am. Water Resour. Assoc. 1998, 34, 73–89. [Google Scholar] [CrossRef]
  28. Abbaspour, K.C.; Yang, J.; Maximov, I.; Siber, R.; Bogner, K.; Mieleitner, J.; Zobrist, J.; Srinivasan, R. Modelling hydrology and water quality in the pre-alpine/alpine watershed using SWAT. J. Hydrol. 2007, 333, 413–430. [Google Scholar] [CrossRef]
  29. Abbaspour, K.C.; Rouholahnejad, E.; Vaghefi, S.; Srinivasan, R.; Yang, H. A continental-scale hydrology and water quality model for Europe: Calibration and uncertainty of a high-resolution large-scale SWAT model. J. Hydrol. 2015, 524, 733–752. [Google Scholar] [CrossRef]
  30. Lin, B.Q.; Chen, X.W.; Yao, H.X.; Chen, Y.; Liu, M.B.; Gao, L.; James, A. Analyses of landuse change impacts on catchment runoff using different time indicators based on SWAT model. Ecol. Ind. 2015, 58, 55–63. [Google Scholar] [CrossRef]
  31. Rajib, M.A.; Merade, V. Improving soil moisture accounting and streamflow prediction in SWAT by incorporating a modified time-dependent Curve Number method. Hydrol. Process. 2016, 30, 603–624. [Google Scholar]
  32. Zhang, L.; Nan, Z.T.; Yu, W.J. Hydrological Responses to Land-Use Change Scenarios under Constant and Changed Climatic Conditions. Environ. Manag. 2016, 57, 412–431. [Google Scholar] [CrossRef] [PubMed]
  33. Havrylenko, S.B.; Bodoque, J.M.; Srinivasan, R. Assessment of the soil water content in the Pampas region using SWAT. Catena 2016, 137, 298–309. [Google Scholar] [CrossRef]
  34. Gao, H.S.; Liu, X.F.; Pan, B.T.; Wang, Y.; Yu, Y.T.; Li, J.J. Stream response to Quaternary tectonic and climatic change: Evidence from the upper Weihe River, central China. Quat. Int. 2008, 186, 123–131. [Google Scholar] [CrossRef]
  35. Wei, S.K.; Yang, H.; Song, J.X.; Karim, C.; Xu, Z.X. System dynamics simulation model for assessing socio-economic impacts of different levels of environmental flow allocation in the Weihe River Basin, China. Eur. J. Oper. Res. 2012, 221, 248–262. [Google Scholar] [CrossRef]
  36. Zhao, J.; Huang, Q.; Chang, J.X.; Liu, D.F.; Huang, S.Z.; Shi, X.Y. Analysis of temporal and spatial trends of hydro-climatic variables in the Wei River Basin. Environ. Res. 2015, 139, 55–64. [Google Scholar] [CrossRef] [PubMed]
  37. Zuo, D.P.; Xu, Z.X.; Sui, C.H.; Wu, W.; Zhao, F.F. Impact of climate change and human activities on stream flow in the Wei River Basin. J. Beijing Normal Univ. 2013, 49, 115–123. (In Chinese) [Google Scholar]
  38. Su, X.L.; Kang, S.Z.; Wei, X.M.; Xing, D.W.; Cao, H.X. Impact of climate change and human activity on the runoff of Wei River basin to the Yellow River. Nat. Sci. Ed. 2007, 35, 153–159. (In Chinese) [Google Scholar]
  39. Chang, J.X.; Wang, Y.M.; Istanbulluoglu, E.; Bai, T.; Huang, Q.; Yang, D.W.; Huang, S.Z. Impact of climate variation and human activities on runoff in the Weihe River Basin, China. Quat. Int. 2015, 380–381, 169–179. [Google Scholar] [CrossRef]
  40. Shao, H.; Gao, J.E.; Zhang, Y.X.; Wang, F. Preliminary assessment of the human activity impact on Weihe River runoff using SWAT model. Water Resour. Environ. Prot. 2011, 2, 1136–1139. [Google Scholar]
  41. Zhao, A.Z.; Zhu, X.F.; Liu, X.F.; Pan, Y.Z.; Zuo, D.P. Impacts of land use change and climate variability on green and blue water resources in the Weihe River Basin of northwest China. Catena 2016, 137, 318–327. [Google Scholar] [CrossRef]
  42. Mitchell, J.M.; Dzerdzeevskii, B.; Flohn, H. Climate Change, WHO Technical Note 79; World Meteorological Organization: Geneva, Switzerland, 1966; p. 79. [Google Scholar]
  43. Hamed, K.H.; Rao, A.R. A modified Mann-Kendall trend test for autocorrelated data. J. Hydrol. 1998, 204, 182–196. [Google Scholar] [CrossRef]
  44. Daufresne, M.; Lengfellner, K.; Sommer, U. Global warming benefits the small in aquatic ecosystems. Proc. Natl. Acad. Sci. USA 2009, 106, 12788–12793. [Google Scholar] [CrossRef] [PubMed] [Green Version]
  45. Li, J.K.; Liu, J.; Qin, Y.M.; Li, H.E. Distributed simulation on nitrogen non-point source pollution in the Wei River Watershed based on SWAT model. J. Xi’an Univ. Technol. 2008, 24, 278–285, (In Chinese with English abstract). [Google Scholar]
  46. Nash, J.E.; Sutcliffe, J.V. River flow forecasting through conceptual models, part I-a discussion of principles. J. Hydrol. 1970, 10, 282–290. [Google Scholar] [CrossRef]
  47. Gupta, H.; Sorooshian, S.; Yapo, P. Status of automatic calibration for hydrologic models: Comparison with multilevel expert calibration. J. Hydrol. Eng. 1999, 4, 135–143. [Google Scholar] [CrossRef]
  48. Moriasi, D.N.; Arnold, J.G.; Van Liew, M.W.; Bingner, R.L.; Harmel, R.D.; Veith, T.L. Model evaluation guidelines for systematic quantififi cation of accuracy in watershed simulations. Trans. Am. Soc. Agric. Biol. Eng. 2007, 50, 885–900. [Google Scholar]
  49. Guo, J.T. Hydrological Responses to Land Use Change and Climate Variability in the Chaohe Watershed. Ph.D. Thesis, Beijing Forestry University, Beijing, China, 2012. [Google Scholar]
Figure 1. Classification of factors that influence runoff.
Water 08 00220 g001
Figure 2. Map of the Wei River Basin and the five sub-zones.
Water 08 00220 g002
Figure 3. Three land cover maps of the Wei River Basin.
Water 08 00220 g003
Figure 4. Sub-basins of the Wei River Basin (WRB) in the Soil and Water Assessment Tool (SWAT) model.
Water 08 00220 g004
Figure 5. Observed versus simulated monthly flows during the calibration and validation periods.
Water 08 00220 g005
Figure 6. Proportional impact of the three factors influencing runoff during: (a) the 1990s; and (b) the 2000s.
Water 08 00220 g006aWater 08 00220 g006b
Figure 7. Area percentages of land cover types during the three periods.
Water 08 00220 g007
Figure 8. Change in area percentages of land cover types during the 1990s and 2000s compared to the baseline period.
Water 08 00220 g008
Table 1. Details of the five hydrological stations.
StationsElevation (m)LocationDrainage Area Limited by the Station (km2)
Linjiacun615Main stream (UZ)32.850
Xianyang390Main stream (MZ)49.822
Huaxian342Main stream (DZ)107.900
Zhangjiashan342Tributary (JZ)45.400
Zhuangtou1082Tributary (BZ)26.900
Table 2. The change numbers and percentages of land cover types of Hydrologic Response Units (HRU) between different land cover scenarios.
Land Cover Types1980s1990s2000s
NumbersChange NumbersChange PercentagesChange NumbersChange Percentages
Farmland20119095%18391%
Woodland674466%5176%
Grassland16012880%11471%
Urban land3133%267%
Rural land9556%333%
Water land5240%360%
Bare land2150%150%
Total44737183%35680%
Table 3. Abrupt changes in the meteorological series from 1960 to 2010.
Sub-ZoneAbrupt Change Points
PrecipitationTemperature
UZ19901994
MZ/1992
DZ/1994
JZ/1994
BZ/1993
Notes: The ‘/’ indicates that there is no abrupt change in the corresponding sub-zone.
Table 4. Abrupt changes in the runoff series from 1960 to 2010.
Hydrological StationAbrupt Points
Linjiacun1970, 1990
Xianyang1970, 1987
Huaxian1990
Zhangjiashan1970, 1990
Zhuangtou1992
Table 5. Comparison results of observed and natural runoff in the simulation period.
Hydrological StationObserved Runoff (108 m3)Natural Runoff (108 m3)Impacting Degree (%)
Linjiacun242711
Xianyang444910
Huaxian758313
Zhangjiashan13.314.89
Zhuangtou6.77.510
Table 6. Key parameters and best fit values for the five sub-zones.
Change TypeParameterDescriptionRangeSub-Zone
UZMZDZJZBZ
rCN2.mgtCurve number for moisture condition II(−0.5, 0.5)0.030.140.150.02−0.22
rSOL_AWC.solAvailable water capacity of the soil layer(−0.5, 0.5)−0.25−0.38−0.310.22−0.04
rSOL_Z.solSoil depth(−0.5, 0.5)0.16/−0.21−0.36−0.20
rSOL_K.solSaturated hydraulic conductivity(−0.8, 0.8)0.18−0.31−0.170.190.36
vESCO.hruSoil evaporation compensation factor(0.01, 1)0.920.490.6850.850.41
vCANMX.hruMaximum canopy storage(0, 100)/3.786.676.493.25
vHRU_SLP.hruAverage slope(10, 150)//24.504.0415.04
vCH_K2.rteMain channel conductivity(0, 150)100.0/11.2539.6667.19
vALPHA_BF.gwBase flow alpha factor(0, 1)0.300.450.550.800.90
vREVAPMN.gwThreshold of evaporation in shallow aquifer(0, 500)426.0416.0385.0355.0/
vGW_DELAY.gwGroundwater delay time(0, 500)59.873.35117.076.0/
vGW_REVAP.gwGroundwater ‘revap’ coefficient(−0.02, 0.2)/0.090.08//
vRCHRG_DP.gwOsmosis ratio in deep aquifer(0, 1)///0.003/
vGWQMN.gwThreshold depth of water in shallow aquifer required for return flow to occur(0, 5000)20.042.025.020.076.62
Notes: r indicates that the default parameter multiplies 1 + given value as a percentage; v indicates that the default parameter is replaced by the given value; “/” means that the given parameter is not the key parameter at the station.
Table 7. Results for the three statistical indicators at the five hydrological stations.
PeriodCoefficientHydrological Station
LinjiacunXianyangHuaxiaZhangjiashanZhuangtou
Calibration (1978–1982)PB (%)10.73−2.73−11.20−19.95−10.80
NSE0.580.750.770.650.51
R20.730.810.860.790.79
Validation (198–1986)PB (%)16.8117.9519.9119.7219.87
NSE0.800.770.820.680.69
R20.870.810.860.750.79
Table 8. Input data for the seven scenarios.
ScenarioInput Data
S1Climate from 1978 to 1986 and land cover in 1985 (baseline)
S2Climate in the 1990s and land cover in 1985 (climate change in the 1990s)
S3Climate from 1978 to 1986 and land cover in 1995 (land cover change in the 1990s)
S4Climate in the 1990s and land cover in 1995 (climate and land cover change in the 1990s)
S5Climate in the 2000s and land cover in 1985 (climate change in the 2000s)
S6Climate from 1978 to 1986 and land cover in 2005 (land cover change in the 2000s)
S7Climate in the 2000s and land cover in 2005 (climate and land cover change in the 2000s)
Table 9. Relative impacts of climate and land cover change on runoff in the SWAT model.
Sub-ZoneSimulated Runoff (108 m3) Δ S total 0 (108 m3)Relative Proportions (%)
ClimateLand Cover
1990sS1S2S3S4
UZ21.0811.9620.6212.029.0795.224.78
MZ40.4923.6940.1423.9116.5997.952.05
DZ70.3048.7069.1148.9021.4094.805.20
JZ13.3412.8513.2712.850.5387.4212.5
BZ6.655.676.535.491.1788.9311.07
2000sS1S5S6S7
UZ21.0814.4820.0714.266.8386.7513.25
MZ40.4930.2339.5230.0710.4291.378.63
DZ70.3063.1170.7864.603.66107.22−7.22
JZ13.3410.5012.669.685.6980.6919.31
BZ6.655.716.445.581.0881.5718.43
Table 10. Impacts of climate, land cover change and direct human activities on runoff.
Sub-ZoneObserved Runoff (108 m3)Total Decline (108 m3)Impacts
Baseline1990s2000sClimate ChangeLand Cover ChangeDirect Human Activities
(108 m3)(%)(108 m3)(%)(108 m3)(%)
1990s (1987–2000)
UZ24.3311.19 13.1411.7389.260.594.480.826.27
MZ44.0819.19 24.8919.7679.400.411.664.7218.95
DZ74.7639.45 35.3124.5269.441.353.819.4526.75
JZ13.3012.76 0.540.4277.610.0611.170.0611.22
BZ6.734.98 1.851.1163.430.147.900.5028.68
2000s (2001–2010)
UZ24.33 10.1014.248.7461.411.349.384.1629.21
MZ44.08 24.5319.5512.8065.481.216.185.5428.33
DZ74.76 47.5027.2610.8939.95−0.73−2.6917.1062.74
JZ13.30 7.915.392.9254.310.7012.951.7832.96
BZ6.73 4.771.960.9447.960.2110.830.8141.21
Table 11. Annual average change in temperature and precipitation during the 1990s and 2000s compared with the baseline period.
Meteorological FactorSub-Zone
UZMZDZJZBZ
T 1 (°C)0.50.60.60.50.6
T 2 (°C)1.11.01.01.21.1
P 1 (mm)−59−53−52−55−41
P 2 (mm)−32−35−19−28−24
Notes: T 1 and T 2 are the average change in temperature during the 1990s and 2000s, respectively. P 1 and P 2 are the average change in precipitation during the 1990s and 2000s, respectively.
Table 12. Average change in water consumption from the baseline period caused by direct human activities.
Average Change in Water Consumption (108 m3)
1990s2000s
Reservoir storage0.540.65
Agricultural irrigation3.032.09
Industrial and domestic water use9.0411.22

