
Harmonious Development between Socio-Economy and River-Lake Water Systems in Xiangyang City, China

Abstract
:1. Introduction
2. Study Area and Data
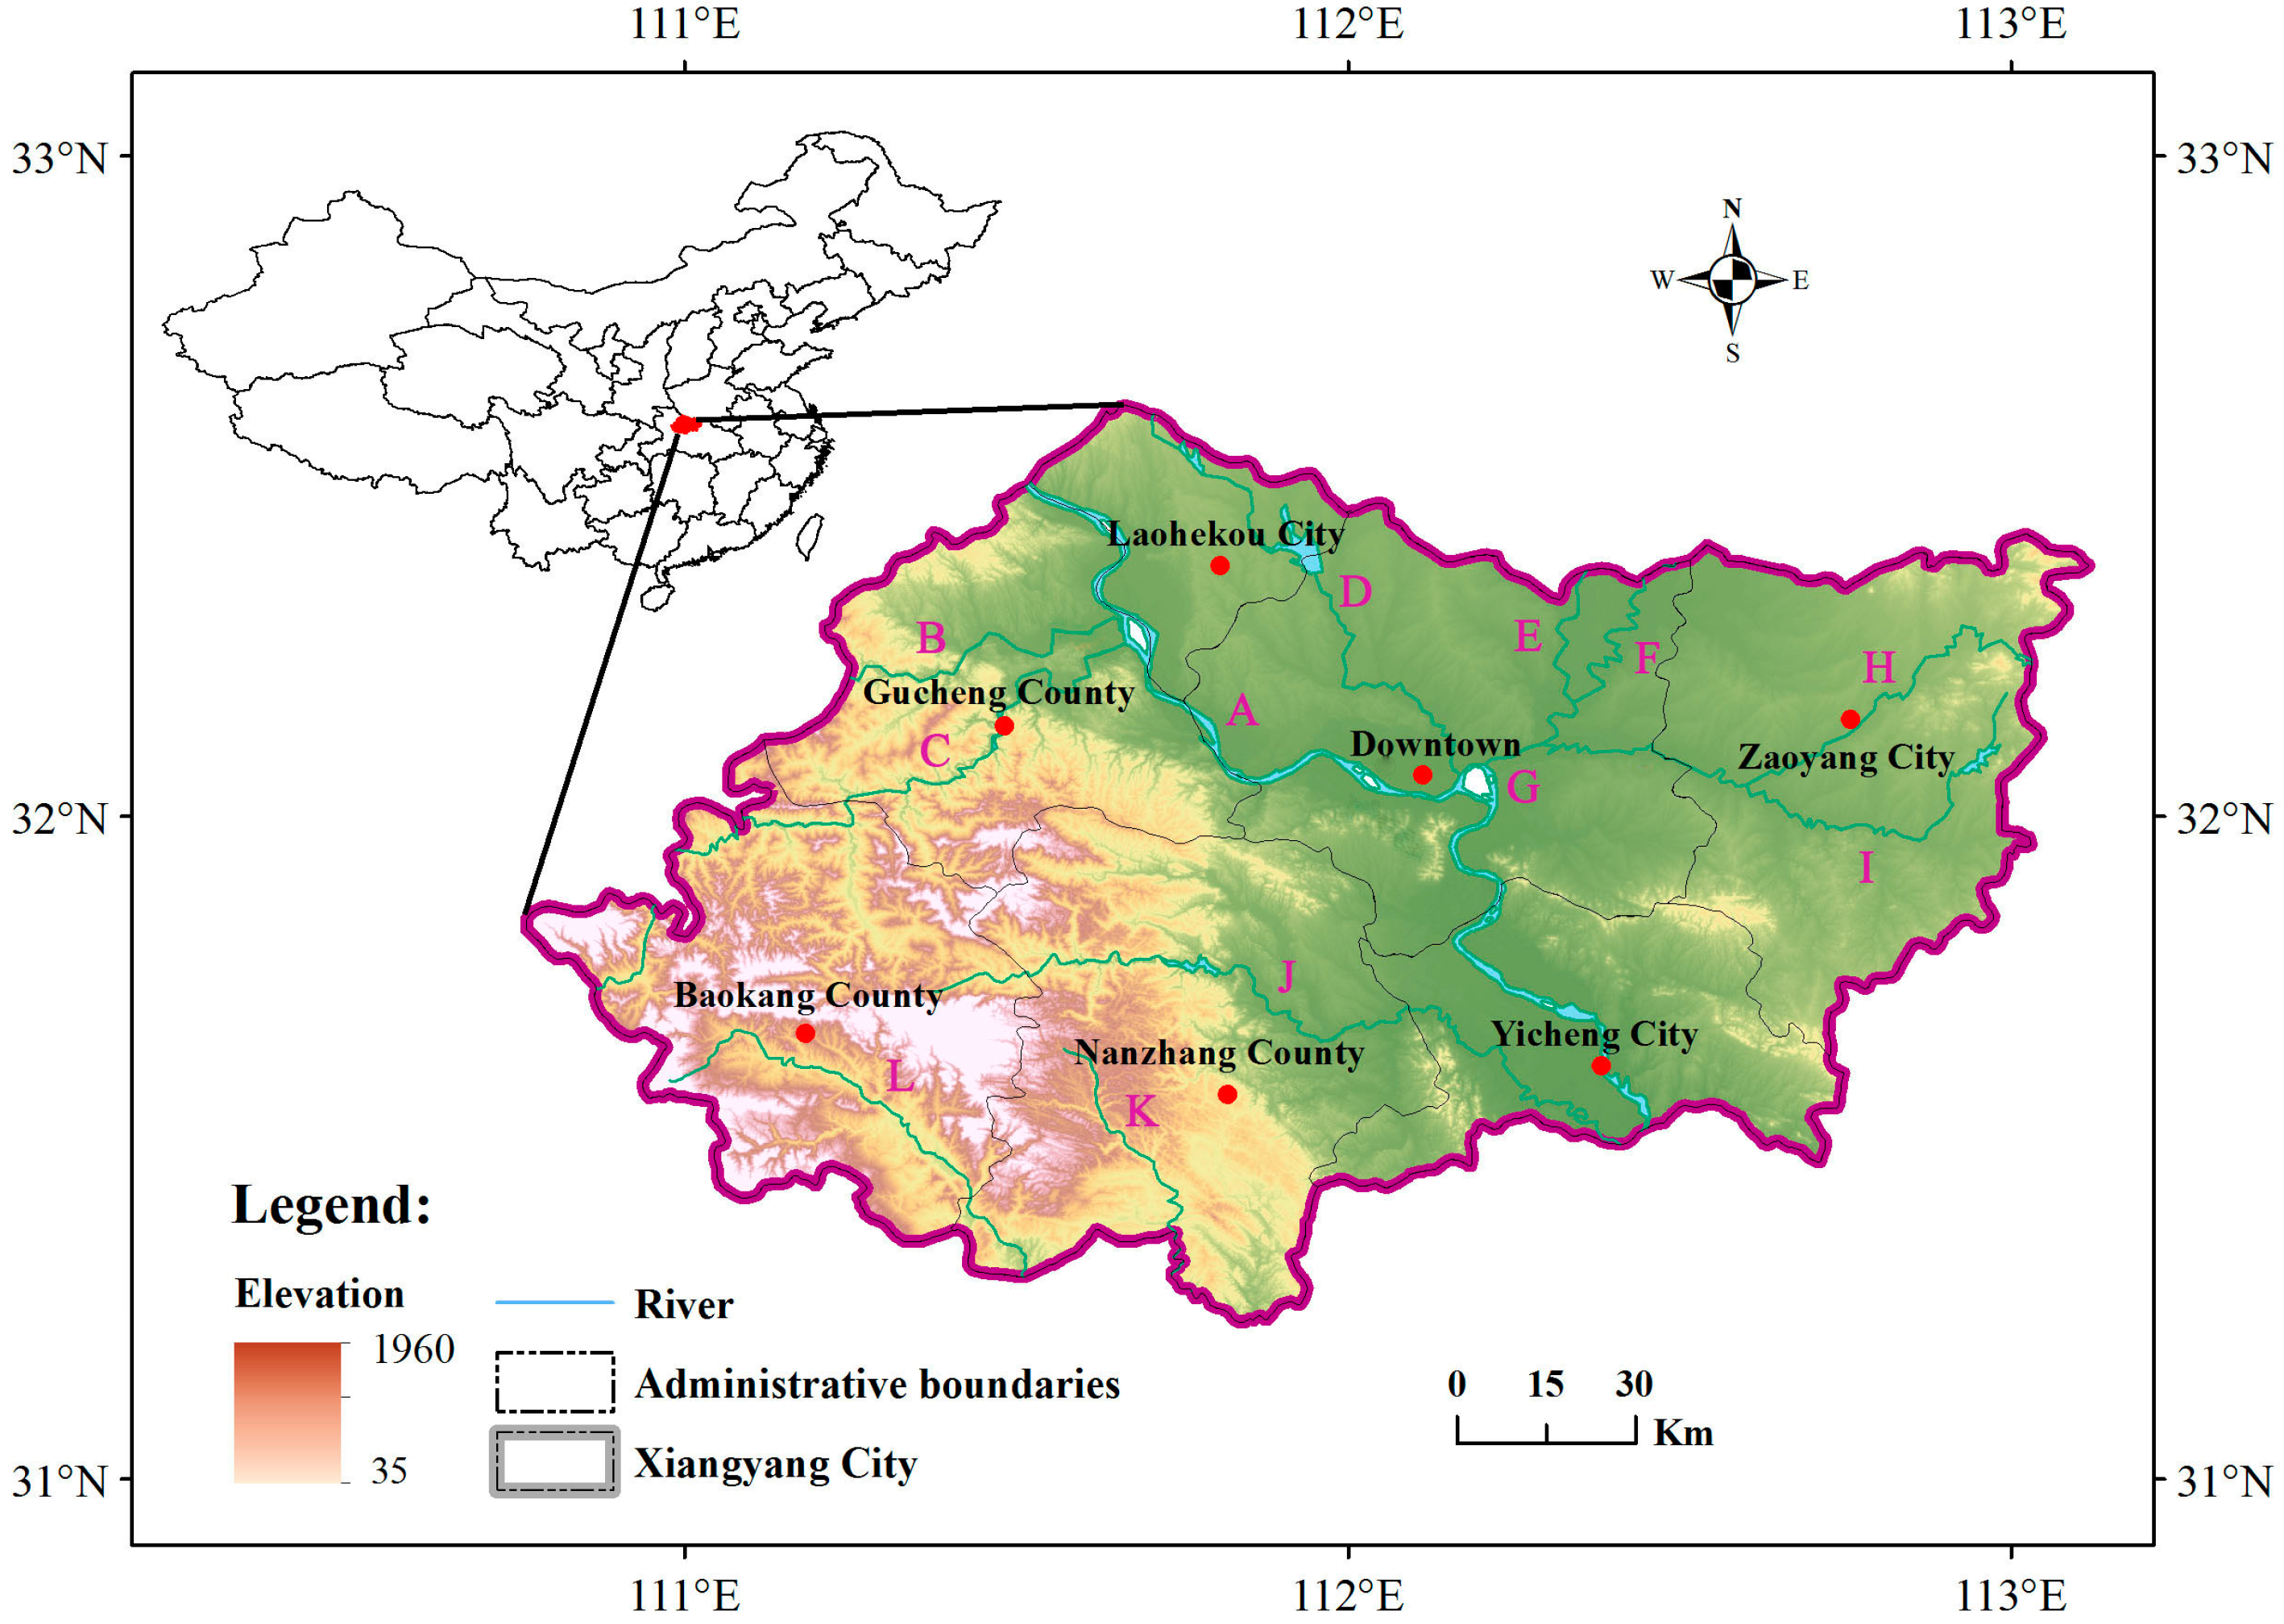
2.1. Study Area
2.2. Data
3. Methodology
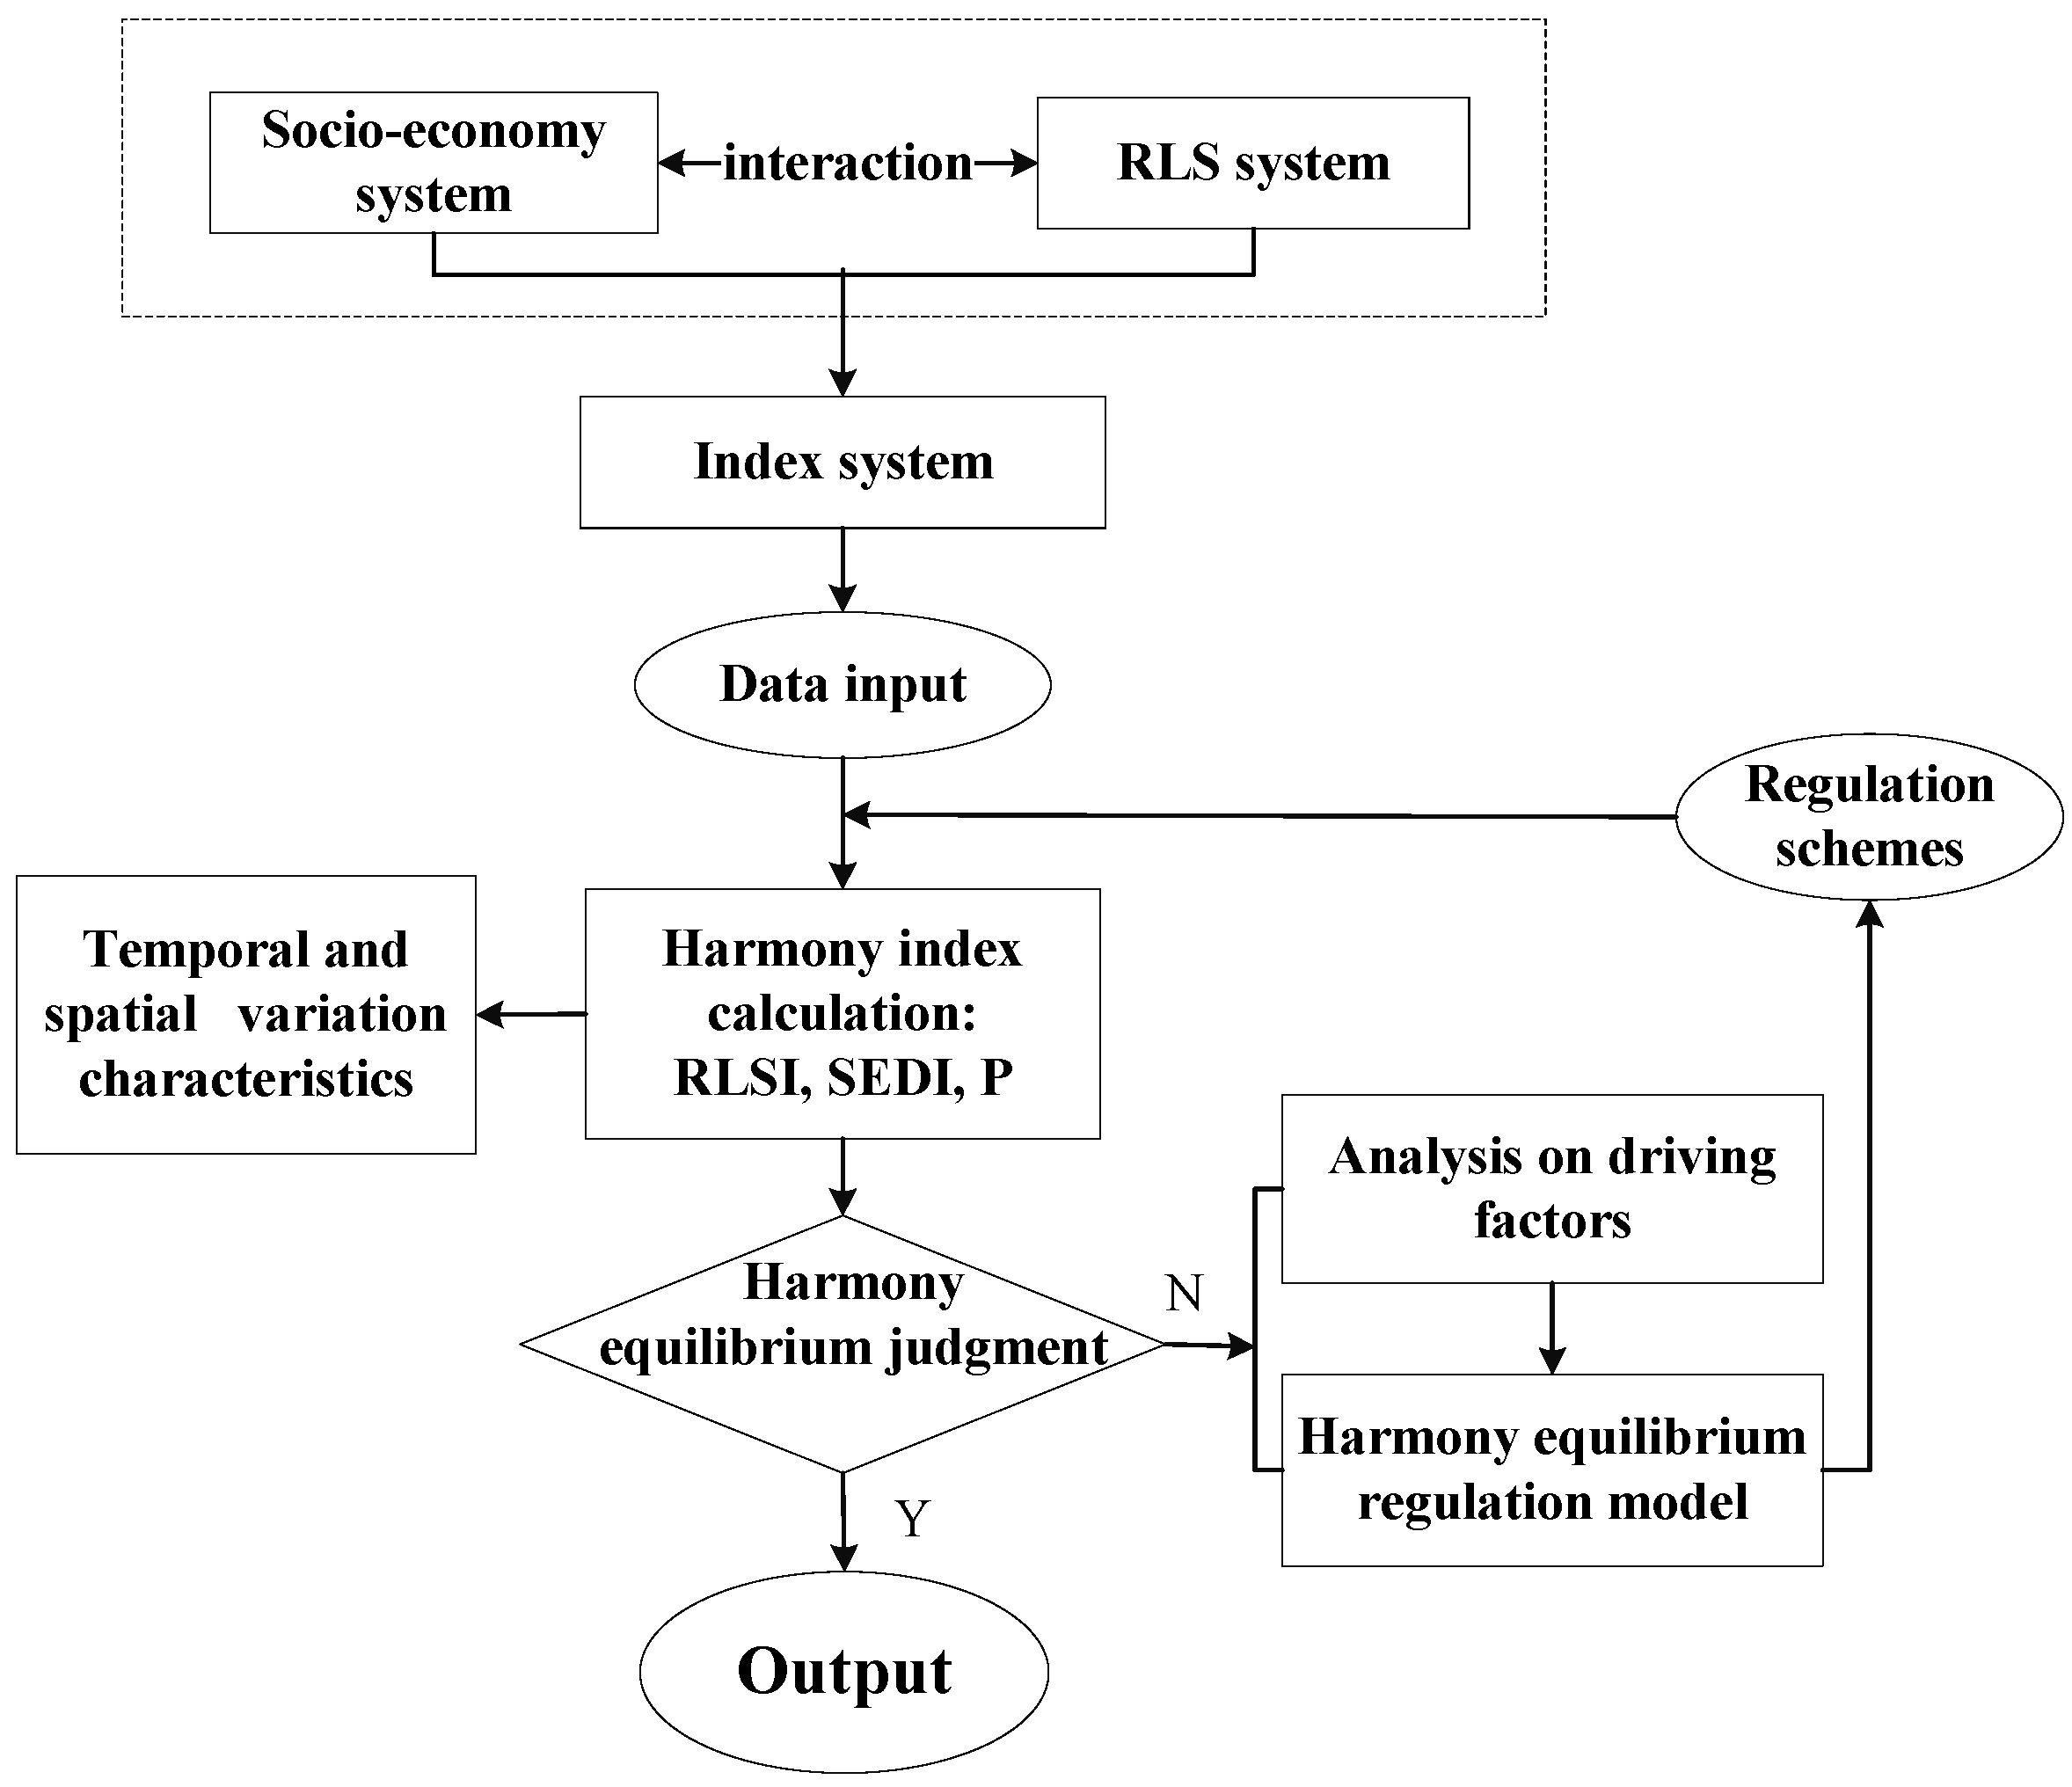
3.1. Research Idea
3.1.1. Theory Basis
3.1.2. Research Framework
3.2. Construction of Index System
3.3. Calculation of RLSI and SEDI
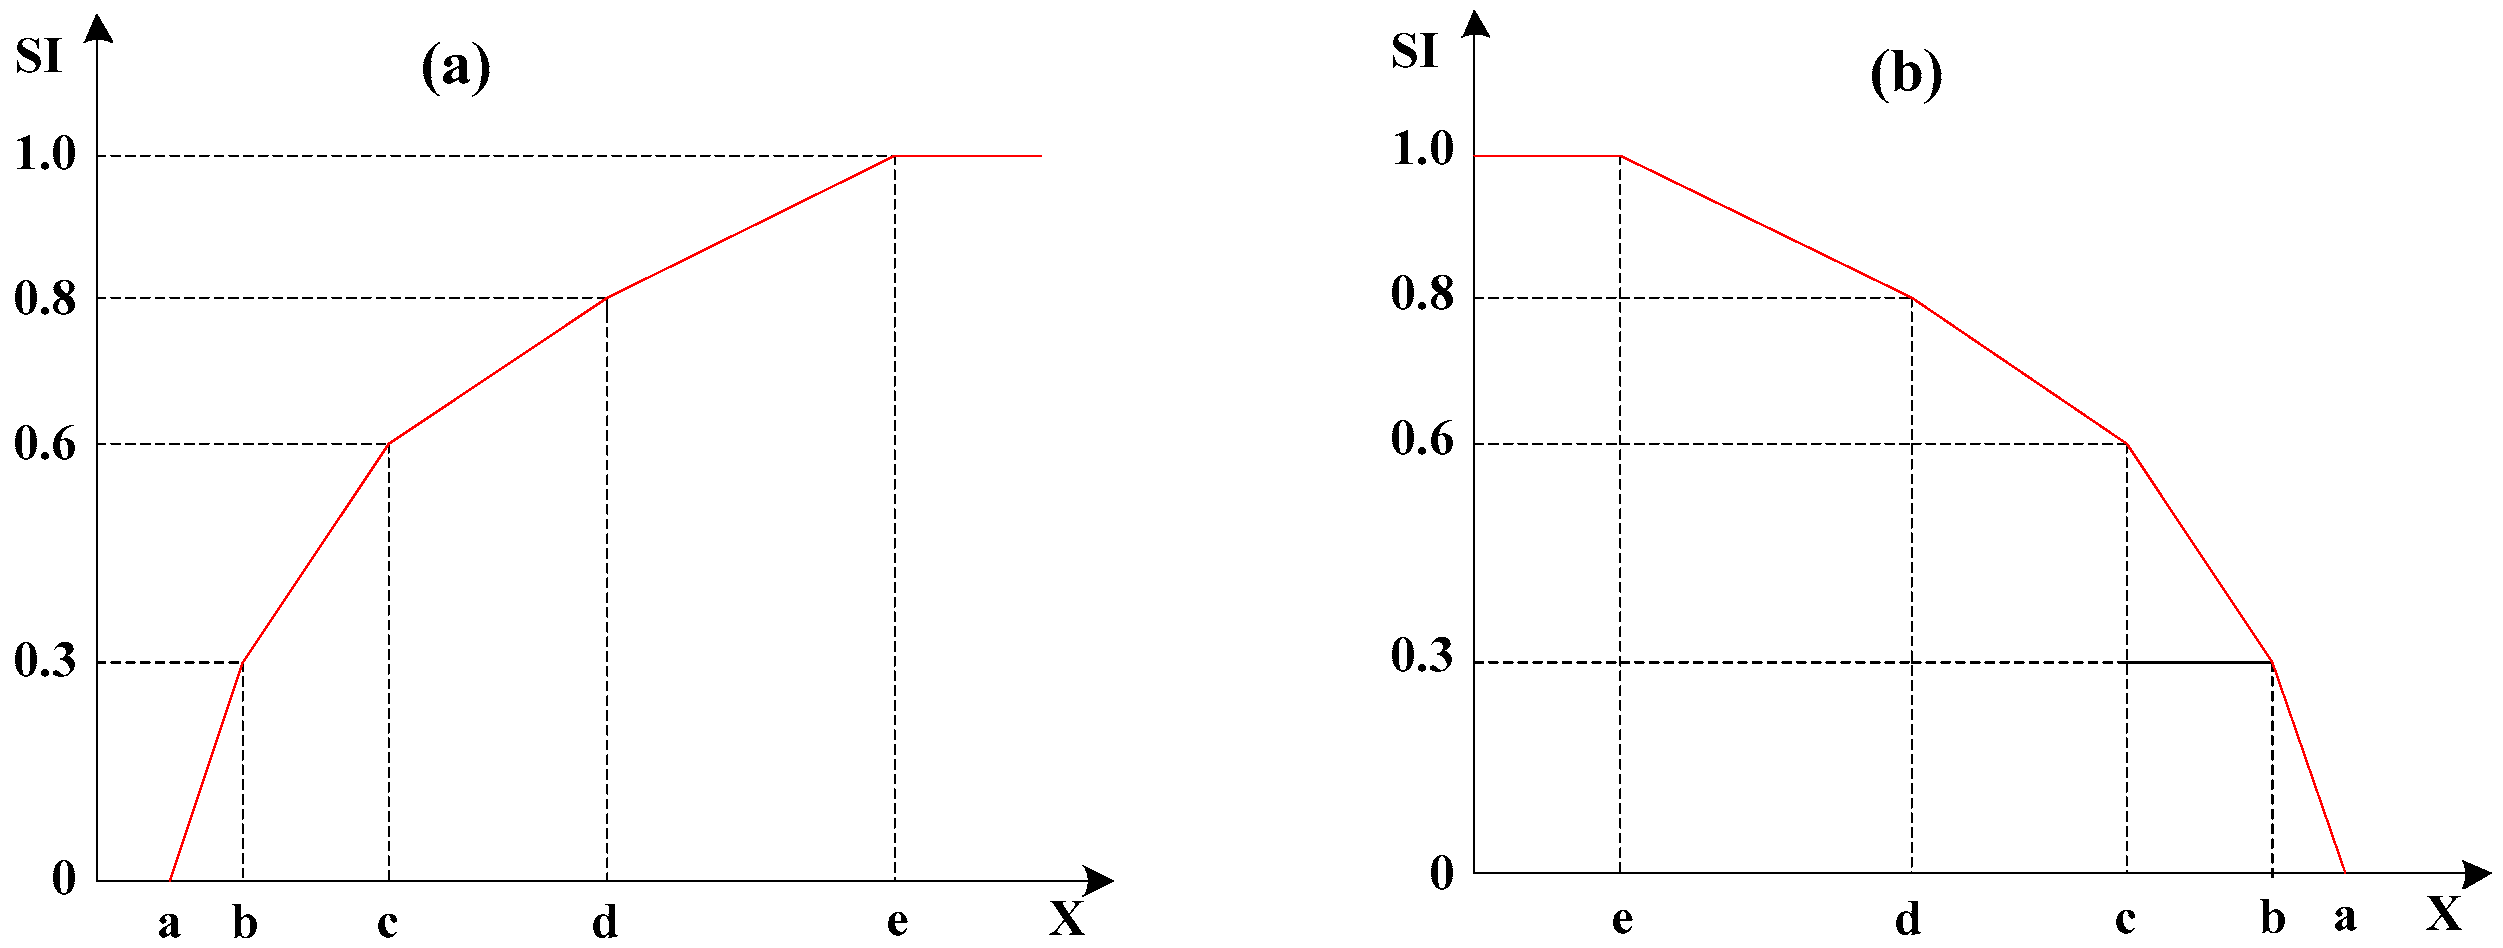
3.3.1. Harmony Index of Single Indexes
3.3.2. RLSI
3.3.3. SEDI
3.4. Calculation of Harmonious Development Index
3.5. Optimization Method of Harmony Regulation Scheme
4. Results and Discussion
4.1. Temporal and Spatial Variation Characteristics of the RLS State
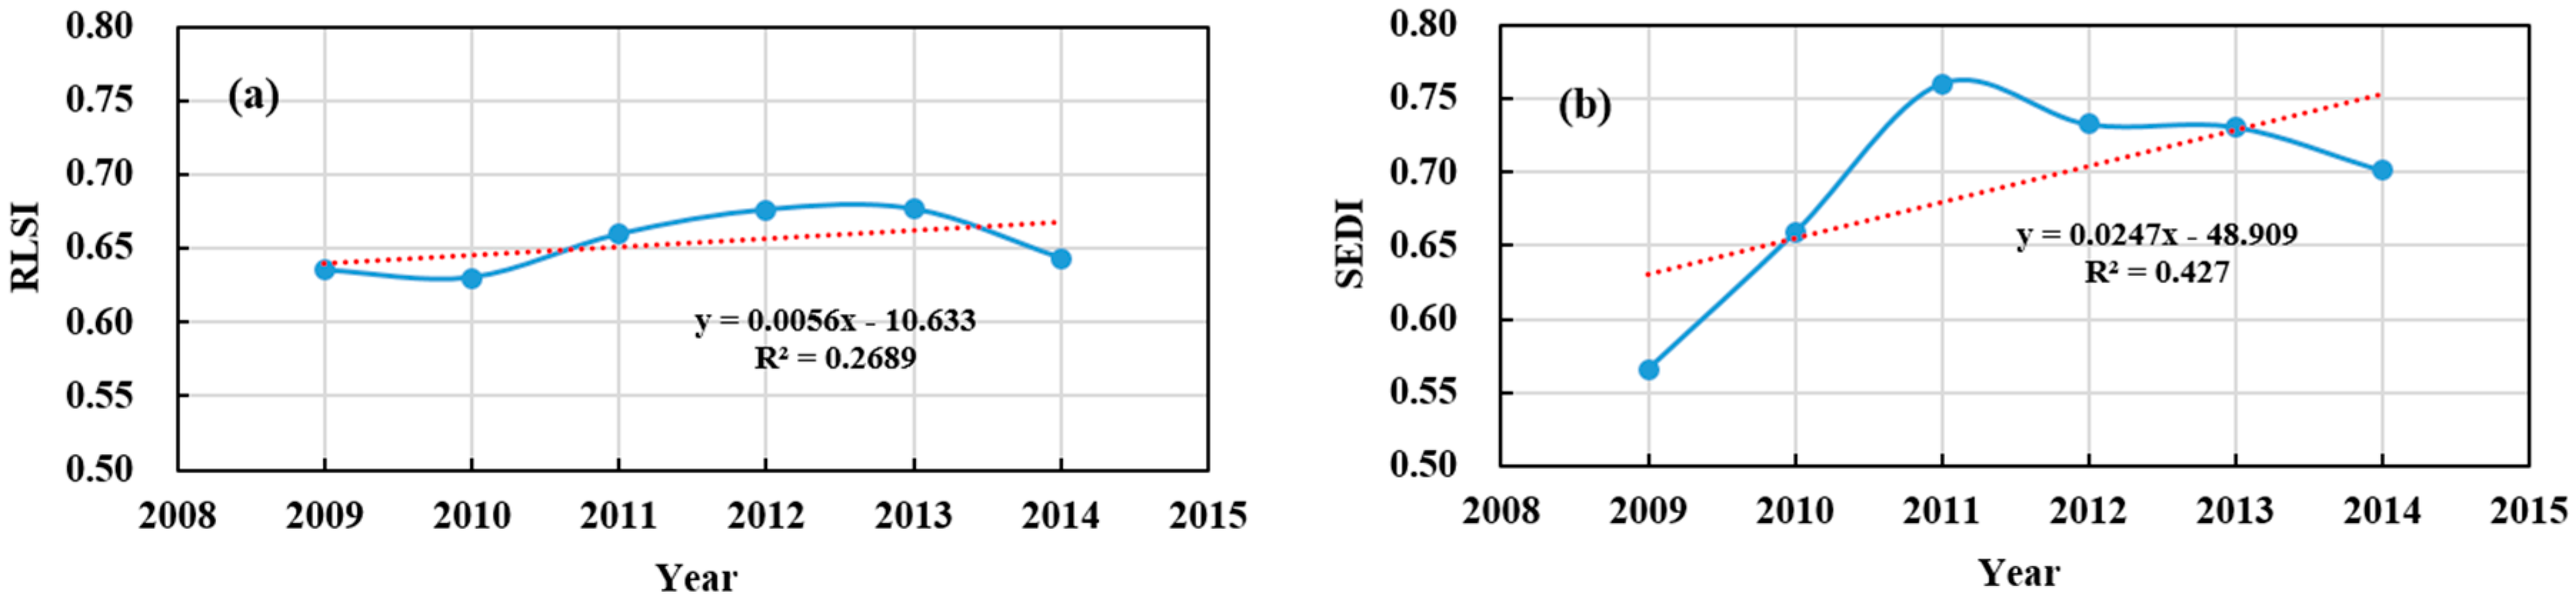
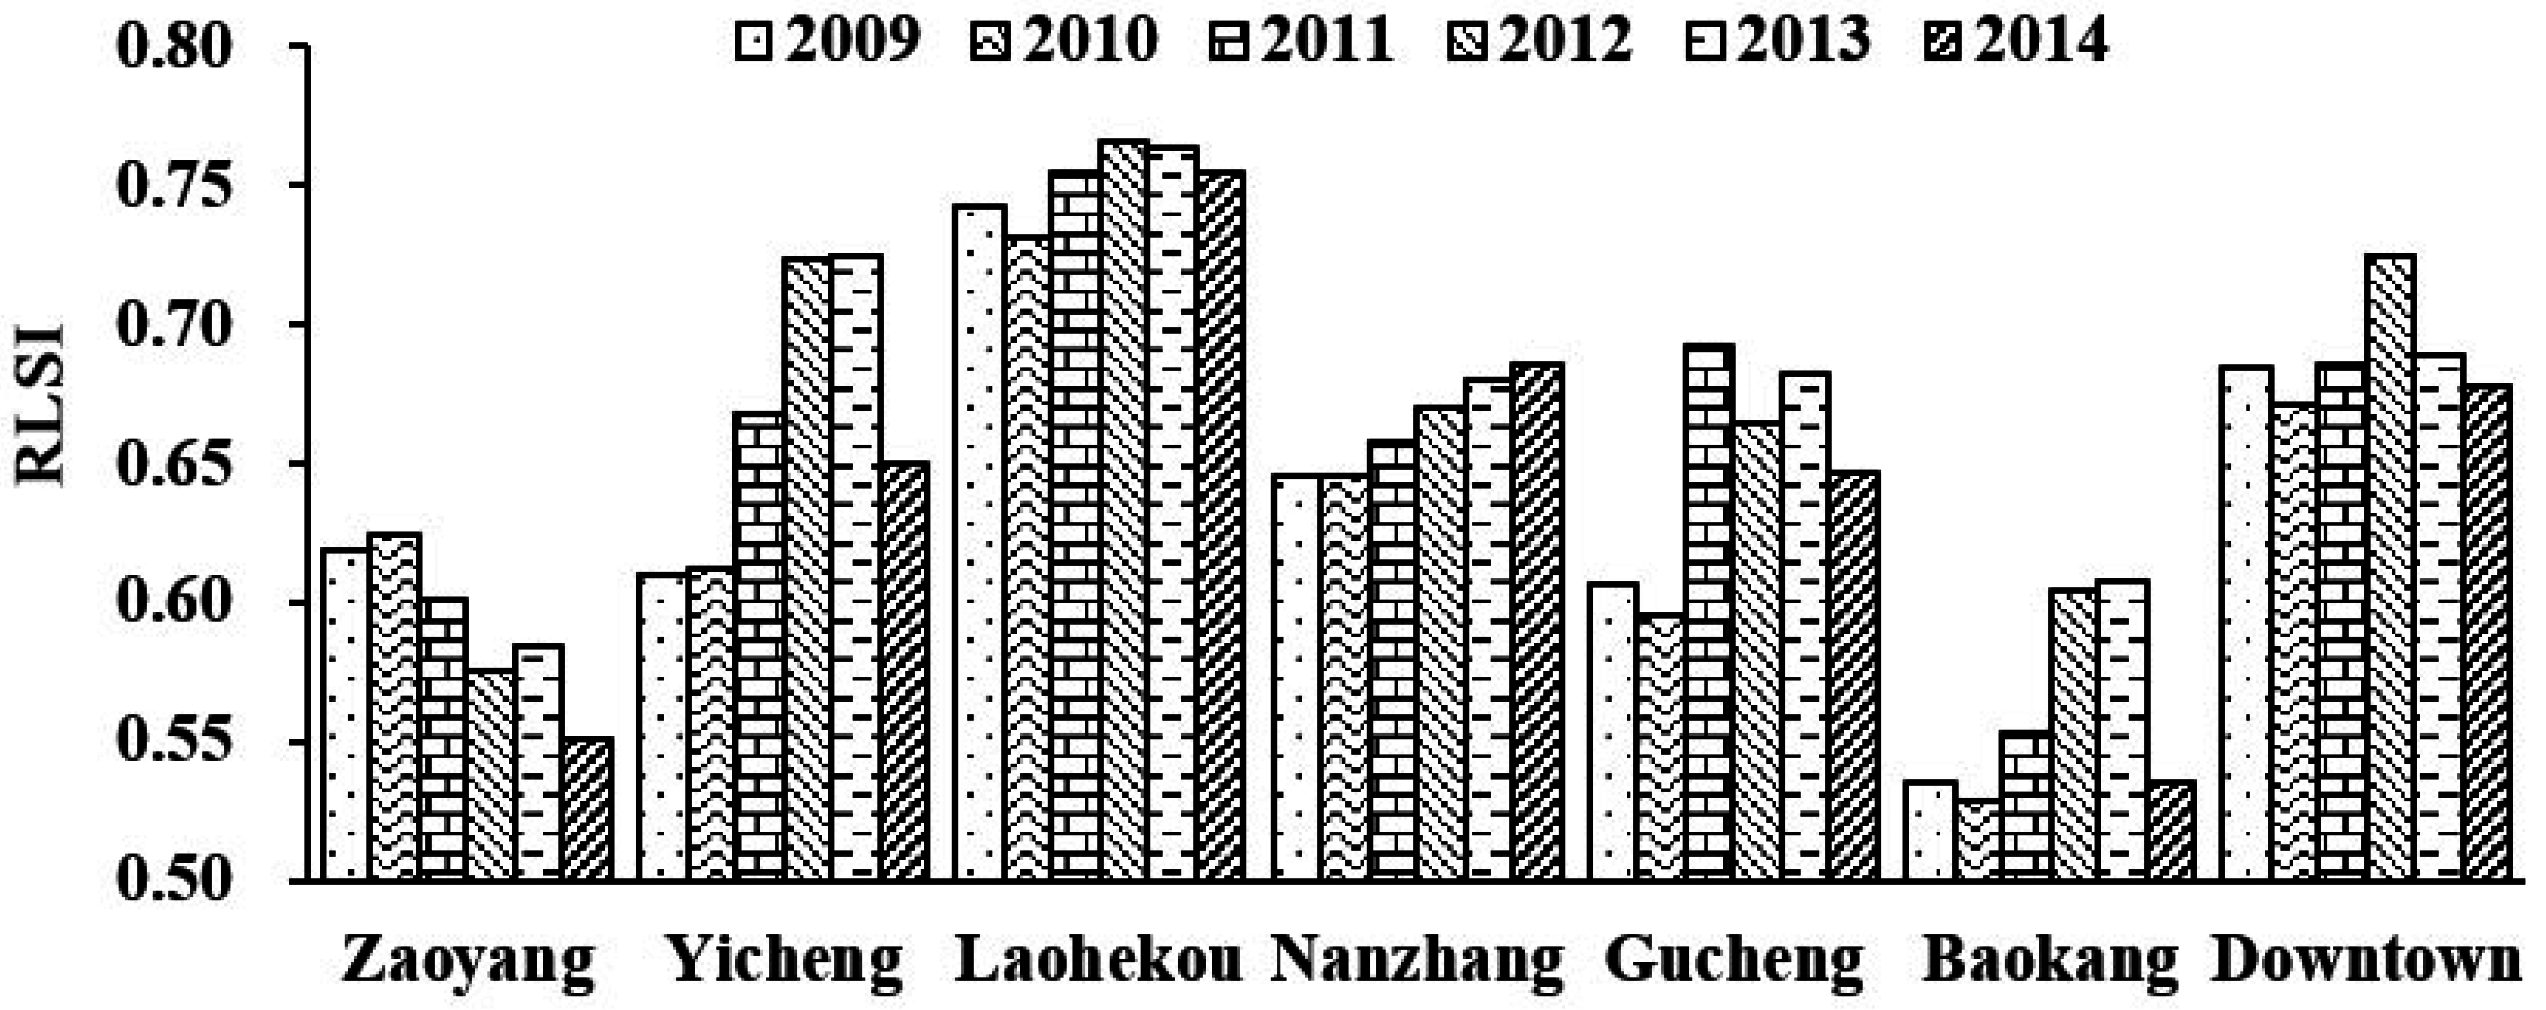
4.1.1. Temporal Variation Characteristics
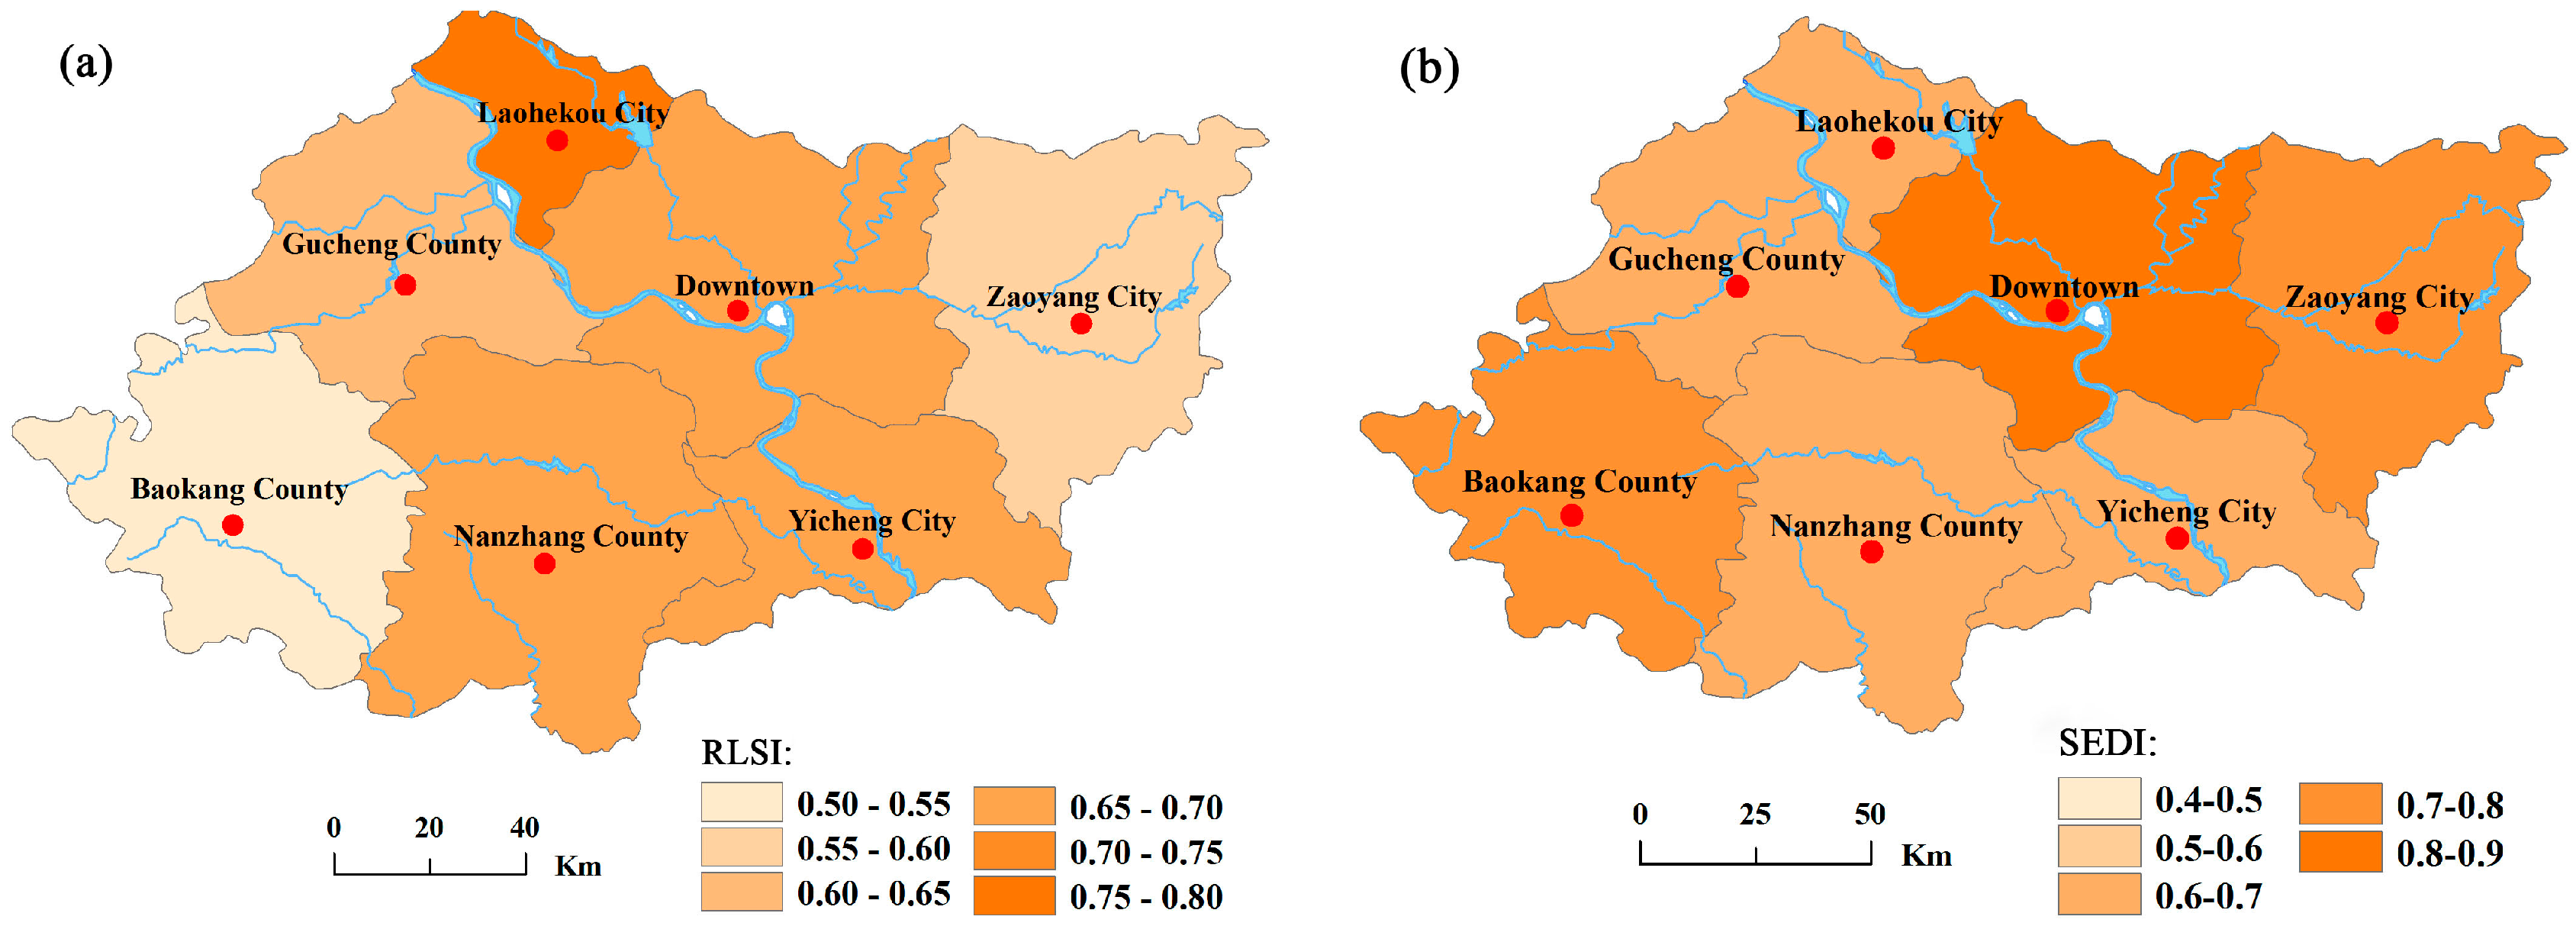
4.1.2. Spatial Variation Characteristics
4.2. Temporal and Spatial Variation Characteristics of Socio-Economic Development
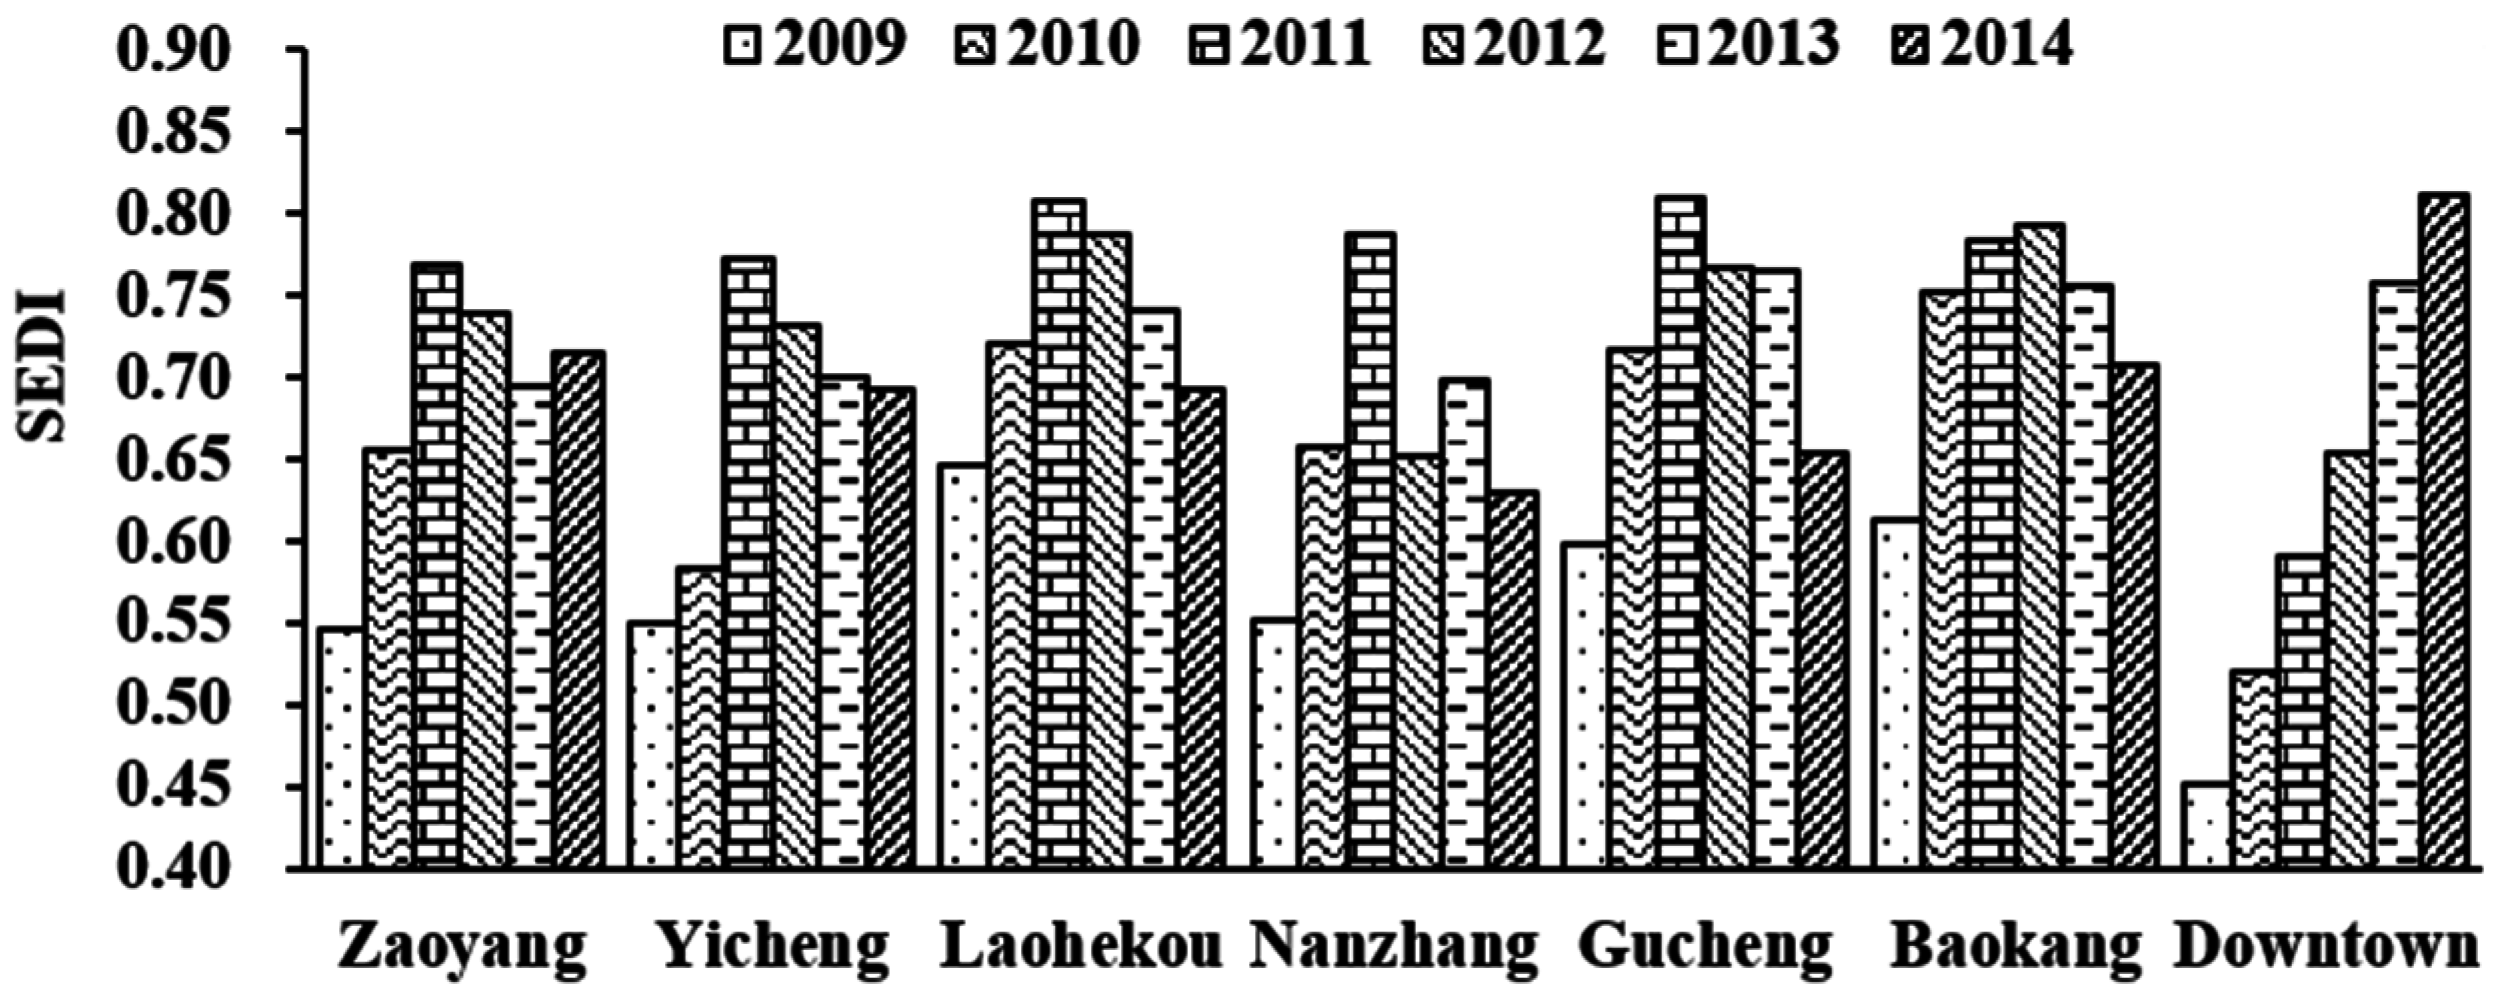
4.2.1. Temporal Variation Characteristics
4.2.2. Spatial Variation Characteristics
4.3. Temporal and Spatial Variation Characteristics of the Overall Harmonious Development Degree
4.3.1. Temporal Variation Characteristics
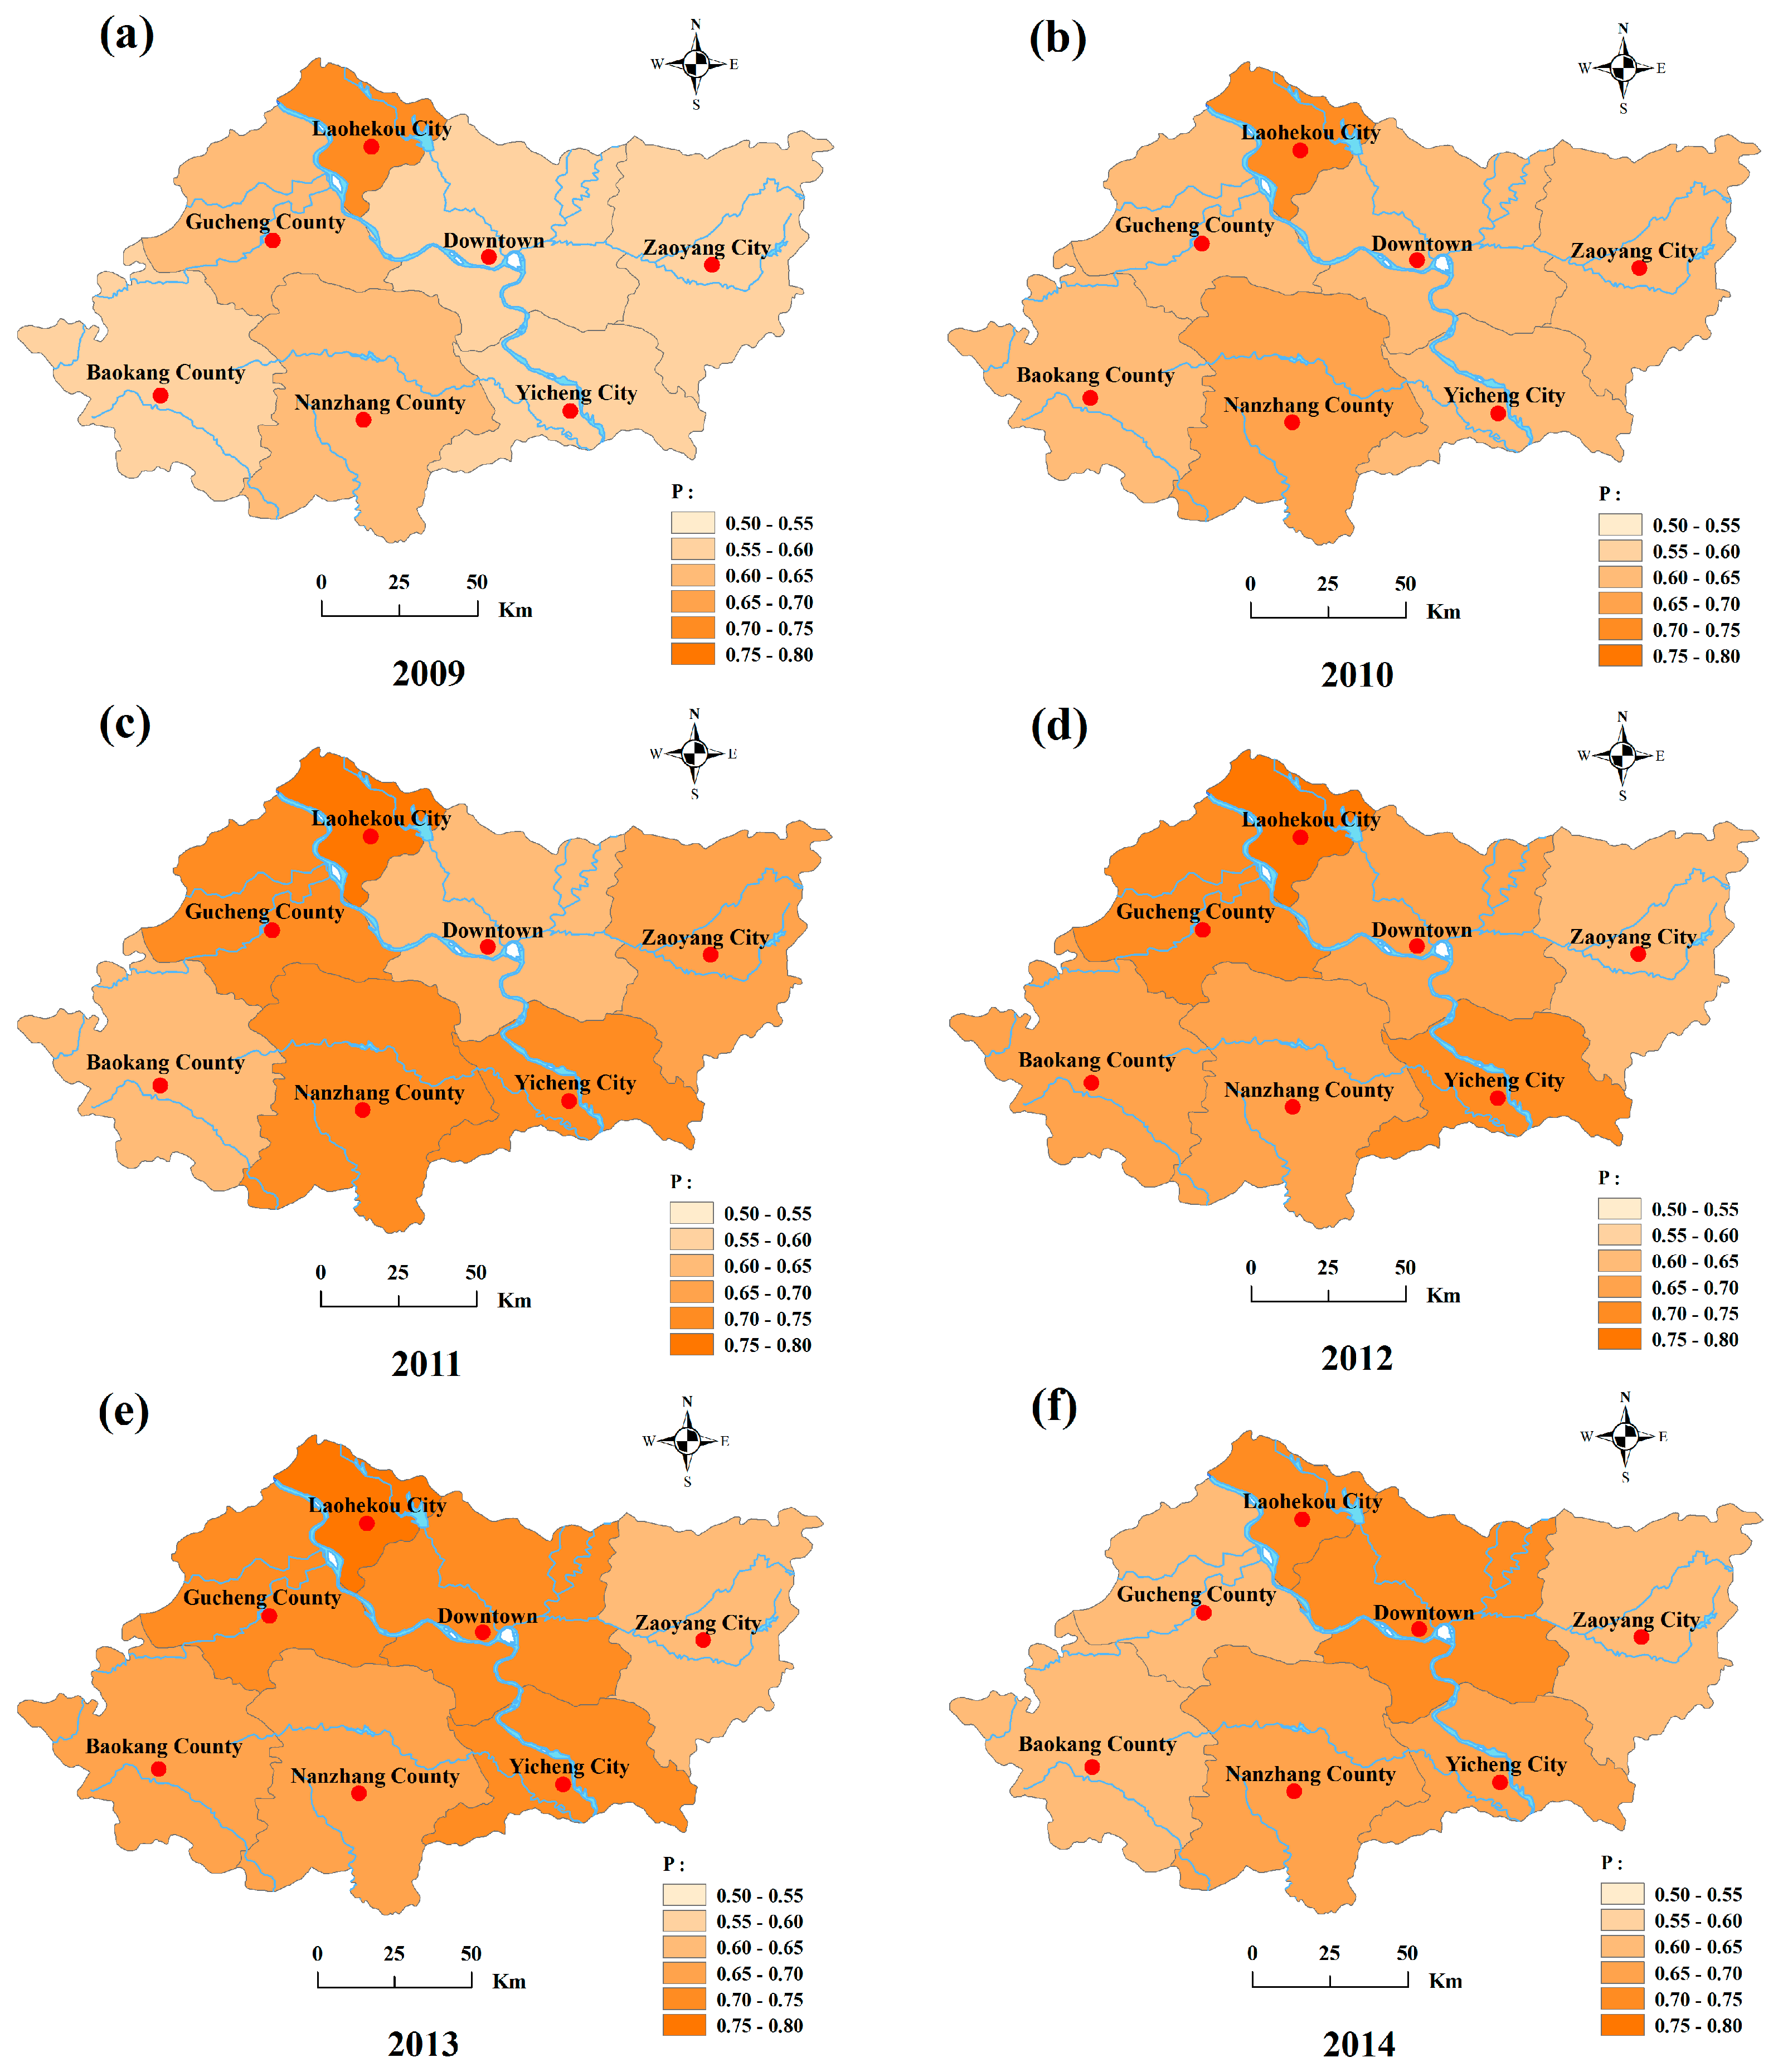
4.3.2. Spatial Variation Characteristics
4.4. Harmony Regulation Schemes
4.4.1. Analysis of Main Driving Factors
4.4.2. Optimization of Harmonious Regulation Schemes
5. Conclusions
- The state of RLS in Xiangyang City shows a spatial distribution pattern with the Han River as the central axis decreases on both its sides. The Han River system, the main river system within Xiangyang City, is the major support of socio-economic development in Xiangyang City. The structural and functional state of the river systems had been changed due to human activities. In spite of this, the micro layout of the river systems formed under the action of natural evolution has not changed greatly in Xiangyang city. Therefore, the spatial distribution pattern of river systems in Xiangyang City still takes the Han River as the center. This is consistent with the natural distribution law of river systems.
- When the influence of socio-economic development on the state of RLS is small, the former is the main factor driving the variation of degree of the overall regional harmonious development. However, when the influence is big, socio-economic development and RLS both drive the variation of degree of regional overall harmonious development. The driving force of socio-economic development in Xiangyang City mainly originated in the surrounding areas such as Laohekou, Zaoyang, and Gucheng before 2011. However, after 2011, it shifted towards Downtown, and reached the maximum in 2014. Socio-economic development is the main driving factor for the change of the overall harmonious degree.
- The overall harmonious development degree is higher in Downtown and Laohekou City. Downtown is mainly driven by socio-economic development, so the state of RLS should be the focus for further construction. Laohekou is mainly driven by the state of RLS, and has a great potential for socio-economic development which should be the focus for further construction. The level of socio-economic development in Zaoyang and Baokang is high, and RLS should be the focus for further construction. Coordinate development of socio-economy and RLS should be considered in Nanzhang, Gucheng, and Yicheng.
- The factors affecting the overall harmonious degree in Xiangyang City mainly include: river length, standard ratio of water quality, water consumption per capita, reservoir regulation capability, Mu of farmland irrigation, water consumption, and sewage treatment rate. These indexes should be treated as the main regulation objectives for harmonious development between socio-economy and RLS in Xiangyang City.
Acknowledgments
Author Contributions
Conflicts of Interest
References
- Deng, X.; Xu, Y.; Han, L.; Yang, M.; Yang, L.; Song, S.; Wang, Y. Spatial–temporal evolution of the distribution pattern of river systems in the plain river network region of the Taihu Basin, China. Quat. Int. 2016, 392, 178–186. [Google Scholar] [CrossRef]
- Papadakis, E.N.; Vryzas, Z.; Kotopoulou, A.; Kintzikoglou, K.; Makris, K.C.; Papadopoulou-Mourkidou, E. A pesticide monitoring survey in rivers and lakes of northern Greece and its human and ecotoxicological risk assessment. Ecotoxicol. Environ. Saf. 2015, 116, 1–9. [Google Scholar] [CrossRef] [PubMed]
- Costanza, R.; d’Arge, R.; De Groot, R.; Farber, S.; Grasso, M.; Hannon, B.; Limburg, K.; Naeem, S.; Oneill, R.V.; Paruelo, J.; et al. The value of the world’s ecosystem services and natural capital. Nature 1997, 387, 253–260. [Google Scholar] [CrossRef]
- Nilsson, C.; Reidy, C.A.; Dynesius, M.; Revenga, C. Fragmentation and flow regulation of the world’s large river systems. Science 2005, 308, 405–408. [Google Scholar] [CrossRef] [PubMed]
- Jiang, Q.; Deng, X.; Zhan, J.; Yan, H. Impacts of economic development on ecosystem risk in the Yellow River Delta. Procedia Environ. Sci. 2011, 5, 208–218. [Google Scholar] [CrossRef]
- Koundouri, P.; Ker Rault, P.; Pergamalis, V.; Skianis, V.; Souliotis, I. Development of an integrated methodology for the sustainable environmental and socio-economic management of river ecosystems. Sci. Total Environ. 2016, 540, 90–100. [Google Scholar] [CrossRef] [PubMed]
- Haken, H. Laser and synergetics. Physikalische Blätter 1976, 32, 583–590. (In German) [Google Scholar] [CrossRef]
- Von Bertalanffy, L. An outline of general system theory. Br. J. Philos. Sci. 1950, 1, 134–165. [Google Scholar] [CrossRef]
- Robbet, G. Environmental sustainability in agriculture: Diet matters. Ecol. Econ. 1997, 23, 189–200. [Google Scholar]
- Keqin, Z. Set pair analysis and its preliminary application. Explor. Nat. 1994, 13, 67–71. [Google Scholar]
- Arthur, W. Complexity and the economy. Science 1999, 284, 107–109. [Google Scholar] [CrossRef] [PubMed]
- Monticino, M.; Acevedo, M.; Callicott, B.; Travis, C.; Christopher, L. Coupled human and natural systems: A multi-agent-based approach. Environ. Model. Softw. 2007, 22, 656–663. [Google Scholar] [CrossRef]
- Ren, G.Z.; Wan, C.G. System coupling and desert—Oasis agro—Ecosystem. Pratacult. Sci. 1994, 3, 1–8. (In Chinese) [Google Scholar]
- Liu, J.G.; Dietz, T.; Carpenter, S.R.; Alberti, M.; Folke, C.; Moran, E.; Pell, A.N.; Deadman, P.; Kratz, T.; Lubchenco, J.; et al. Complexity of coupled human and natural systems. Science 2007, 317, 1513–1516. [Google Scholar] [CrossRef] [PubMed]
- Alberti, M.; Asbjornsen, H.; Baker, L.A.; Brozović, N.; Drinkwater, L.E.; Drzyzga, S.A.; Fragoso, J.; Holland, D.S.; Jantz, C.A.; Kohler, T.A.; et al. Research on coupled human and natural systems (CHANS): Approach, challenges, and strategies. Bull. Ecol. Soc. Am. 2011, 92, 218–228. [Google Scholar] [CrossRef]
- An, L. Modeling human decisions in coupled human and natural systems: Review of agent-based models. Ecol. Model. 2012, 229, 25–36. [Google Scholar] [CrossRef]
- Vo, N.D.; Gourbesville, P.; Vu, M.T.; Raghavan, S.V.; Liong, S.-Y. A deterministic hydrological approach to estimate climate change impact on river flow: Vu Gia–Thu Bon catchment, Vietnam. J. Hydro-Environ. Res. 2016, 11, 59–74. [Google Scholar] [CrossRef]
- Andreopoulos, D.; Damigos, D.; Comiti, F.; Fischer, C. Estimating the non-market benefits of climate change adaptation of river ecosystem services: A choice experiment application in the Aoos basin, Greece. Environ. Sci. Policy 2015, 45, 92–103. [Google Scholar] [CrossRef]
- Snaddon, C.D.; Wishart, M.J.; Davies, B.R. Some implications of inter-basin water transfers for river ecosystem functioning and water resources management in southern Africa. Aquat. Ecosyst. Health Manag. 1998, 1, 159–182. [Google Scholar] [CrossRef]
- Zhou, S.; Huang, Y.; Yu, B.; Wang, G. Effects of human activities on the eco-environment in the middle Heihe River Basin based on an extended environmental Kuznets curve model. Ecol. Eng. 2015, 76, 14–26. [Google Scholar] [CrossRef]
- Wei, Y.-L.; Bao, L.-J.; Wu, C.-C.; He, Z.-C.; Zeng, E.Y. Assessing the effects of urbanization on the environment with soil legacy and current-use insecticides: A case study in the Pearl River Delta, China. Sci. Total Environ. 2015, 514, 409–417. [Google Scholar] [CrossRef] [PubMed]
- Wang, Y.; Hu, J.; Pan, H.; Li, S.; Failler, P. An integrated model for marine fishery management in the Pearl River Estuary: Linking socio-economic systems and ecosystems. Mar. Policy 2016, 64, 135–147. [Google Scholar] [CrossRef] [Green Version]
- Zuo, Q.T.; Ma, J.X.; Tao, J. Chinese water resource management and application of the harmony theory. J. Resour. Ecol. 2013, 4, 165–171. [Google Scholar]
- Zuo, Q.T.; Zhang, Y.; Lin, P. Index system and quantification method of human-water harmony. J. Hydraul. Eng. 2008, 39, 440–447. (In Chinese) [Google Scholar]
- Zuo, Q.T.; Jin, R.F.; Ma, J.X.; Cui, G.T. Description and application of a mathematical method for the analysis of harmony. Sci. World J. 2015, 6, 1–9. [Google Scholar] [CrossRef] [PubMed]
- Zuo, Q.T.; Zhao, H.; Ma, J.X. Study on harmony equilibrium between water resources and economic society development. J. Hydraul. Eng. 2014, 45, 785–792. (In Chinese) [Google Scholar]
- Zadeh, L.A. Fuzzy sets. Inf. Control 1965, 8, 338–353. [Google Scholar] [CrossRef]
- Brahic, C. China battles to be first ‘ecological civilisation’. New Sci. 2014, 222, 12. [Google Scholar] [CrossRef]
- Zhang, W.; Wei, Z.; Hulin, L.; Xuebing, A. 2010 International Conference on Energy, Environment and Development—ICEED 2010 Ecological Civilization Construction Is the Fundamental Way to Develop Low-carbon Economy. Energy Procedia 2011, 5, 839–843. [Google Scholar]
- Zhang, X.; Wang, Y.; Qi, Y.; Wu, J.; Liao, W.; Shui, W.; Qi, H. Evaluating the trends of China’s ecological civilization construction using a novel indicator system. J. Clean. Prod. 2016, 133, 910–923. [Google Scholar] [CrossRef]
- Zhang, W.; Li, H.L.; An, X.B. Ecological civilization construction is the fundamental way to develop low-carbon economy. Energy Procedia 2011, 5, 839–843. [Google Scholar]
- Zuo, Q.T.; Zhao, H.; Mao, C.C.; Ma, J.X.; Cui, G.T. Quantitative analysis of human-water relationships and harmony-based regulation in the Tarim River Basin. J. Hydrol. Eng. 2015, 20, 1–11. [Google Scholar] [CrossRef]


| Type | RLSI | SEDI | Description |
|---|---|---|---|
| I | ≥0.7 | ≥0.7 | Good state of RLS and high level of socio-economic development |
| II | ≥0.7 | <0.7 | Good state of RLS and low level of socio-economic development |
| III | <0.7 | ≥0.7 | Poor state of RLS and high level of socio-economic development |
| IV | ≤0.7 | ≤0.7 | Poor state of RLS and low level of socio-economic development |
| Goal Level | Category Level | Subsystem Level | Index Level | Number |
|---|---|---|---|---|
| Harmonious development of socio-economy and RLS | Socio-economy | Social subsystem | Water consumption per capita (m3/person) | X11 |
| Water consumption per 10,000 yuan of GDP (m3/10,000 yuan) | X12 | |||
| Mu of farmland irrigation water consumption (m3/mu) | X13 | |||
| Water consumption per 10,000 yuan of industrial added value (m3/10,000 yuan) | X14 | |||
| Sewage treatment rate (%) | X15 | |||
| Economic subsystem | GDP per capita (yuan) | X21 | ||
| GDP growth rate (%) | X22 | |||
| RLS | Structural subsystem | Drainage density (1/km) | X41 | |
| Water surface rate (%) | X42 | |||
| Area and length ratio of backbone rivers (km) | X43 | |||
| River network development coefficient (-) | X44 | |||
| Riverbank stability (-) | X45 | |||
| Longitudinal connectivity (-) | X46 | |||
| Functional subsystem | Surface water supply (108 m3) | X51 | ||
| Reservoir regulation ability (-) | X52 | |||
| Environmental subsystem | Water quality standard river length ratio (%) | X53 |
| Administrative Divisions | 2009 | 2010 | 2011 | 2012 | 2013 | 2014 |
|---|---|---|---|---|---|---|
| Zaoyang City | 0.62 | 0.62 | 0.60 | 0.58 | 0.58 | 0.55 |
| Yicheng City | 0.61 | 0.61 | 0.67 | 0.72 | 0.73 | 0.65 |
| Laohekou City | 0.74 | 0.73 | 0.76 | 0.77 | 0.76 | 0.75 |
| Nanzhang County | 0.65 | 0.65 | 0.66 | 0.67 | 0.68 | 0.69 |
| Gucheng County | 0.61 | 0.60 | 0.69 | 0.67 | 0.68 | 0.65 |
| Baokang County | 0.54 | 0.53 | 0.55 | 0.60 | 0.61 | 0.54 |
| Downtown | 0.68 | 0.67 | 0.69 | 0.72 | 0.69 | 0.68 |
| Administrative Divisions | 2009 | 2010 | 2011 | 2012 | 2013 | 2014 |
|---|---|---|---|---|---|---|
| Zaoyang City | 0.55 | 0.66 | 0.77 | 0.74 | 0.69 | 0.72 |
| Yicheng City | 0.55 | 0.58 | 0.77 | 0.73 | 0.70 | 0.69 |
| Laohekou City | 0.65 | 0.72 | 0.81 | 0.79 | 0.74 | 0.69 |
| Nanzhang County | 0.55 | 0.66 | 0.79 | 0.65 | 0.70 | 0.63 |
| Gucheng County | 0.60 | 0.72 | 0.81 | 0.77 | 0.76 | 0.65 |
| Baokang County | 0.61 | 0.75 | 0.78 | 0.79 | 0.76 | 0.71 |
| Downtown | 0.45 | 0.52 | 0.59 | 0.65 | 0.76 | 0.81 |
| Administrative Divisions | 2009 | 2010 | 2011 | 2012 | 2013 | 2014 |
|---|---|---|---|---|---|---|
| Zaoyang City | 0.59 | 0.64 | 0.67 | 0.64 | 0.63 | 0.62 |
| Yicheng City | 0.59 | 0.60 | 0.71 | 0.73 | 0.72 | 0.67 |
| Laohekou City | 0.70 | 0.73 | 0.78 | 0.77 | 0.75 | 0.73 |
| Nanzhang County | 0.61 | 0.65 | 0.71 | 0.66 | 0.69 | 0.66 |
| Gucheng County | 0.60 | 0.64 | 0.74 | 0.71 | 0.72 | 0.65 |
| Baokang County | 0.57 | 0.62 | 0.65 | 0.68 | 0.67 | 0.60 |
| Downtown | 0.59 | 0.61 | 0.65 | 0.70 | 0.72 | 0.73 |
| Administrative Divisions | Main Driving Factors |
|---|---|
| Zaoyang City | Water quality standard river length ratio |
| Yicheng City | Surface water supply, Reservoir regulation ability, Water quality standard river length ratio |
| Laohekou City | Surface water supply, Water consumption per capita, Riverbank stability |
| Nanzhang County | Longitudinal connectivity, Surface water supply, Reservoir regulation ability |
| Gucheng County | Longitudinal connectivity, Surface water supply, Reservoir regulation ability, Water consumption per capita, Farmland average per Irrigation water consumption |
| Baokang County | Water surface rate, Area and length ratio of backbone rivers, Longitudinal connectivity, Surface water supply, Reservoir regulation ability |
| Downtown | Area and length ratio of backbone rivers, River network development coefficient, Longitudinal connectivity, Water consumption per capita, Farmland average per Irrigation water consumption, Sewage treatment rate |
| X47 | X11 | X15 | P | X47 | X11 | X15 | P | X47 | X11 | X15 | P |
|---|---|---|---|---|---|---|---|---|---|---|---|
| 0.60 | 0.45 | 0.60 | 0.78 | 0.70 | 0.45 | 0.60 | 0.79 | 0.80 | 0.45 | 0.60 | 0.79 |
| 0.70 | 0.79 | 0.70 | 0.79 | 0.70 | 0.80 | ||||||
| 0.80 | 0.79 | 0.80 | 0.80 | 0.80 | 0.80 | ||||||
| 0.50 | 0.60 | 0.79 | 0.50 | 0.60 | 0.79 | 0.50 | 0.60 | 0.79 | |||
| 0.70 | 0.79 | 0.70 | 0.79 | 0.70 | 0.80 | ||||||
| 0.80 | 0.79 | 0.80 | 0.80 | 0.80 | 0.80 | ||||||
| 0.55 | 0.60 | 0.79 | 0.55 | 0.60 | 0.79 | 0.55 | 0.60 | 0.80 | |||
| 0.70 | 0.79 | 0.70 | 0.80 | 0.70 | 0.80 | ||||||
| 0.80 | 0.80 | 0.80 | 0.80 | 0.80 | 0.80 |
© 2016 by the authors; licensee MDPI, Basel, Switzerland. This article is an open access article distributed under the terms and conditions of the Creative Commons Attribution (CC-BY) license (http://creativecommons.org/licenses/by/4.0/).
Share and Cite
Zuo, Q.; Luo, Z.; Ding, X. Harmonious Development between Socio-Economy and River-Lake Water Systems in Xiangyang City, China. Water 2016, 8, 509. https://0-doi-org.brum.beds.ac.uk/10.3390/w8110509
Zuo Q, Luo Z, Ding X. Harmonious Development between Socio-Economy and River-Lake Water Systems in Xiangyang City, China. Water. 2016; 8(11):509. https://0-doi-org.brum.beds.ac.uk/10.3390/w8110509
Chicago/Turabian StyleZuo, Qiting, Zengliang Luo, and Xiangyi Ding. 2016. "Harmonious Development between Socio-Economy and River-Lake Water Systems in Xiangyang City, China" Water 8, no. 11: 509. https://0-doi-org.brum.beds.ac.uk/10.3390/w8110509