Article

Diesel or Electric Jeepney? A Case Study of Transport Investment in the Philippines Using the Real Options Approach

by
Casper Boongaling Agaton
1,2,*,
Charmaine Samala Guno
3,
Resy Ordona Villanueva
4 and
Riza Ordona Villanueva
4
1
Copernicus Institute of Sustainable Development, Utrecht University, Princetonlaan 8a, 3584 CB Utrecht, The Netherlands
2
Utrecht University School of Economics, Kriekenpitplein 21, 3584 EC Utrecht, The Netherlands
3
Mindoro State College of Agriculture and Technology, Masipit, Calapan City 5200, Philippines
4
St. Paul University, Manila, 680 Pedro Gil St, Malate, Manila 1004, Philippines
*
Author to whom correspondence should be addressed.
World Electr. Veh. J. 2019, 10(3), 51; https://0-doi-org.brum.beds.ac.uk/10.3390/wevj10030051
Submission received: 5 May 2019 / Revised: 16 August 2019 / Accepted: 20 August 2019 / Published: 22 August 2019

Abstract

:
The Philippines is moving towards a more sustainable public transport system by introducing a public utility vehicle (PUV) modernization program with electric jeepneys (e-jeepneys) and modernized diesel jeepneys. Despite its potential to address problems related to air pollution, traffic congestion, dependence on fuel imports, and carbon emissions, transport groups show resistance to the adoption of the government program due to costs and investment risk issues. This study aims to guide transport operators in making investment decisions between the modernized diesel jeepney and the e-jeepney fleet. Applying the real options approach (ROA), this research evaluates option values and optimal investment strategies under uncertainties in diesel prices, jeepney base fare price, electricity prices, and government subsidy. The optimization results reveal a better opportunity to invest in the e-jeepney fleet in all scenarios analyzed. Results also show a more optimal decision strategy to invest in the e-jeepney immediately in the current business environment, as delaying or postponing investment may incur opportunity losses. To make the adoption of the e-jeepney more attractive to transport operators, this study further suggests government actions to increase the amount of subsidy and base fares, establish public charging stations, and continue efforts to rely on cleaner, cheaper, and renewable sources of electricity.

Graphical Abstract

1. Introduction

In order to address the global problems of greenhouse gas (GHG) emissions, air pollution, and dependence on fossil fuels, different countries and regions are finding cleaner and more sustainable modes of transportation. Currently, the transport sector accounts for 23% of global energy-related CO₂ emissions and is continuously growing due to increasing passenger and freight activity [1]. As aviation, shipping, and heavy-duty roads are the most difficult modes to decarbonize, the electrification of passenger cars and public utility vehicles (PUVs) appears to have the potential to reduce GHG emissions and other pollutants [2,3]. Developed countries put considerable effort into making electric mobility more attractive by providing fiscal incentives, subsidy schemes, and public charging infrastructure. This resulted in a record 1.1 million electric vehicles (EVs) sold worldwide in 2017, which is expected to increase to 11 million in 2025 and surge to 30 million in 2030 [4]. Meanwhile, developing countries adopt electric mobility that suits the local circumstances such as electric scooters in India, electric “tuk-tuks” in Thailand and Kenya, second-hand electric cars in Jordan, and e-jeepneys in the Philippines.
Jeepneys, refurbished American vehicles left after the Second World War, are the Philippines’ most popular mode of transportation, providing cheaper rides and allowing millions of passengers to hop on and off anywhere. There are around 270,000 franchised jeepney units on the road across the country, with some 75,000 units in Metro Manila alone. With the country’s fast development and economic growth, old-model jeepneys have become the main contributor to air pollution and traffic congestion in the cities. According to the Manila Aerosol Characterization Experiment (MACE 2015) study, jeepneys, which account for 20% of the total vehicle fleet, are responsible for 94% of the soot particle mass in Metro Manila, with 2000 times higher emissions compared to the EURO 6 standard for diesel in Europe [5]. To address this problem, the government recently launched the “Public Utility Vehicle (PUV) Modernization Program”, which aims to make the country’s public transportation system efficient and environment-friendly by phasing out jeepneys, buses, and other PUVs that are at least 15 years old and replacing them with safer, more comfortable and more sustainable alternatives [6]. Replacement PUVs, such as e-jeepneys and modernized diesel jeepneys, are required to have at least a Euro 4-compliant engine or an electric engine and must contain safety features like speed limiters, accessibility features like ramps and seatbelts, closed-circuit television cameras, Wi-fi and USB ports, GPS, and a dashboard camera (see Figure 1) [7]. Currently, the government provides a 5% subsidy to every e-jeepney unit, which costs between USD 64.19 M and USD 73.36 M/unit, payable within 7 years at a 6% interest rate. This e-jeepney investment cost is three times the average price of a brand new modernized diesel jeepney, which only costs USD 18.34 M to USD 27.51 M/unit. Regardless of the potential to solve traffic conditions and air pollution, provide new jobs, enhance the tourism industry, and streamline public transport, the modernization program has faced numerous protests from drivers and operator organizations due to financing issues. This gives an impetus to conduct a study that analyzes the economic viability of adopting the modernized PUV and suggests investment strategies making the e-jeepney more attractive than the diesel jeepney.
Traditional valuation methods for transportation investment projects in the Philippines include return on investment (ROI), payback period, net present value (NPV), internal rate of return (IRR), and cost-benefit analysis (CBA) [8,9,10]. However, these methods do not account for possible uncertainties that affect investment decisions such as fuel prices, demand and prices of products, fare prices, government policies, and technological advancement. The real options approach (ROA) overcomes these limitations by combining uncertainty and risk with flexibility in making investment decisions, as potential factors that give additional value to the project [11]. Several literature works analyze investment decisions, particularly for electric vehicles, using this approach. Among these studies include a choice between hybrid vehicles and EVs, while considering the option to change promotion from hybrid vehicles (HVs) to EVs in the future [12]; redesigning or investing in gas, hybrid electric and EVs under uncertainties in gas prices and regulatory standards [13]; the adoption of EVs for mail and parcel distribution, considering the uncertainty about future fuel prices and future battery costs [14]; market growth of investments in plug-in EVs and charging infrastructure for plug-in EV users under fluctuations in gasoline prices [15]; investment decisions and patterns related to HVs under technological and market uncertainties and irreversibility, which impacts the investment and innovation decisions of automotive firms, supporting the development of more sustainable vehicle technologies [16]; and analyzing flexible lease contracts in the fleet replacement problem with alternative fuel vehicles considering CO2 prices, fuel prices, mileage covered by a vehicle, fuel consumption, and technological uncertainties [17].
To the best of our knowledge, we rarely find any literature applying ROA in EV investments in the context of developing countries, particularly for countries that are highly dependent on imported fossil fuel products. These studies include a replacement of old conventional fuel-powered vehicles with hybrid EVs under uncertainty in fuel prices [18]; optimal rail transit investment under time-inconsistent preferences and population uncertainty [19]; and a ROA model addressing transit technology investment considering uncertainty in urban population size [20]. We try to contribute to the existing literature by proposing a ROA framework for analyzing a PUV investment project by taking the case of the Philippines. This study is very valuable and timely as the country is moving from a carbon-intensive towards a low- to zero-carbon public transport system. Applying the ROA, this research aims to analyze the decision of a transport operator to invest either in the modernized diesel jeepney or in the e-jeepney fleet. As the country is heavily dependent on imported fossil fuel products with 55% import from diesel demand [21], we consider using the volatility of diesel prices as the main uncertainty in estimating the option values and optimal timing of investment in PUV projects. Further, we analyze how base fare price, electricity price, and government subsidy in the e-jeepney affect the investment decision-making process. We then compare the usefulness of the proposed ROA model over the traditional valuation methods in analyzing PUV investment projects. We finally aim to suggest government policies that boost investments in EVs to realize the government’s goal of a more sustainable and environment-friendly transport system.

2. Materials and Methods

We consider a transport operator or company who has the option to invest in a project of buying a fleet of modernized diesel jeepneys, or a fleet of e-jeepneys. The net present value of investing in diesel jeepneys NPVj can be expressed in Equation (1).
N P V j = t = 0 T j ρ t π j I j = t = 0 T j ρ t ( P j Q j P d , t Q d C j ) I j
where π j is the annual cash flow of diesel jeepney operation from period 0 to T j , the effective lifetime of the jeepney; ρ is the social discount factor equal to 1 / ( 1 + δ ) t ; δ is the risk-free interest rate, and I j is the cost of investment in the diesel jeepney fleet including the disposal cost. The annual cash flow is computed from the average earnings P j from an individual vehicle unit Q j minus the operations and maintenance costs C j , which include the driver salary, boundary, registration, franchise, and maintenance, and the fuel cost that is equal to the amount of fuel Q d used by the fleet times the price of diesel.
In line with previous studies [22,23,24], we assume that the price of diesel Pd,t is stochastic and follows the Geometric Brownian motion (GBM), as shown in Equation (2):
d P d , t = α P d , t d t + σ P d , t d W t
where W t is a Wiener process, and the percentage drift, α , and the percentage volatility, σ , are constant. We apply Ito’s formula to solve Equation (2) and obtain:
l n P d , t P d , 0 = ( α σ 2 2   ) t + σ W t
Using Equation (3), we apply the Augmented Dickey–Fuller (ADF) unit root test to determine the drift and variance of diesel prices, as shown in regression Equation (4):
l n P d , t P d , 0 = g ( 1 ) + g ( 2 ) l n P d , 0 +   j = 1 L λ j Δ l n P d , t j + ϵ t
where g ( 1 ) = ( α σ 2 2   ) t , g ( 2 ) is a coefficient estimated in the unit root test, λ j is a coefficient for L number of lags for Δ l n P d , t = l n P d , t l n P d , 0 , and ϵ t = σ W t . From the ADF test result, we estimate the future diesel prices, as shown in Equation (5):
P d , t + 1 = P d , t + α P d , t + σ P d , t ε t
where α and σ are the drift and variance parameters representing the mean and volatility of the price process, and ε t ~ N ( 0 , 1 ) , a random number.
On the other hand, the net present value of investing in e-jeepneys NPVej is expressed in Equation (6):
N P V e j = t = 0 T e j ρ t π e j + s I e j = t = 0 T e j ρ t ( P e j Q e j P e Q e C e j ) + s I e j
where π e j is the annual cash flow of e-jeepney operation from period 0 to T e j ; s is the government subsidy for jeepney modernization; and I e j = ρ t I ( 1 + i ) + D e j is the e-jeepney investment cost, which can be loaned at i interest rate with I monthly amortization up to a certain number of years and incur a disposal cost at the end of its lifetime T e j . The annual cash flow is calculated from the average annual earnings P e j of each e-jeepney Q e j minus the cost of electricity P e consumed by the fleet Q e and the operations and maintenance cost C e j , as described in Equation (1).
The investor’s problem is to maximize the value of the investment subject to stochastic prices of diesel fuel, as shown in Equation (4):
m a x { N P V e j ,   E [ N P V j ] | P d , t }
where the expected NPV of diesel jeepney E [ N P V j ] 1 M m = 1 M N P V j , m is calculated using Monte Carlo simulations at a sufficiently large number of times M , subject to stochastic prices of diesel. From Equation (7), investment option values at each initial price of diesel V ( P d , t ) are solved using the optimization, as shown in Equation (8):
V ( P d , t ) = m a x { N P V e j ,   E [ N P V j ] | P d , t }
We describe the optimal timing of investment in e-jeepneys P d * as the minimum price of diesel fuel, where the maximized option value V P d , t at the initial diesel price t is equal to the maximized option value V P d , t + 1 at the initial diesel price t + 1 , as shown in Equation (9):
P d * = m i n { P d , t | V P d , t ( P d , t ) = V P d , t + 1 ( P d , t ) }
Comparing P d * with the current price of diesel yields various strategies, as described in Equation (10), where no investment should be made if V ( P d * ) < 0 ; otherwise, invest in:
e j e e p n e y ,   i f   d i e s e l f u e l e d   j e e p n e y i n d i f f e r e n t ,   i f ,   i f P d c u r > P d * P d c u r < P d * P d c u r = P d * }
To estimate the real option values, we create a dynamic optimization program using Matlab divided into four segments. The first segment estimates the stochastic prices of diesel fuel and follows GBM using Equation (5). In the second segment, we incorporate these prices into the N P V j in Equation (1). The third segment includes the Monte Carlo simulation to calculate the expected NPV of the diesel jeepney E [ N P V j ] . The last segment is the dynamic optimization to calculate the maximized value of either investing in the e-jeepney or in the diesel jeepney, at each initial price of diesel. We plot all estimated values of NPVs and optimization results using Excel, as shown in the following section.
We finally compare the ROA estimations with traditional valuation methods including the NPV, payback period (PBP), returns on investment (ROI), and internal rate of return (IRR), using Equations (1), (6), and (11–13) as shown below. The PBP refers to the amount of time it takes to recover the cost of an investment. This is equal to the cost of the investment divided by the annual net cash flow, as described in Equation (11):
P B P = i n v e s t m e n t   c o s t a n n u a l   n e t   c a s h   f l o w
The ROI is the benefit to an investor resulting from an investment and is described using Equation (12):
R O I = n e t   i n c o m e e x p e n s e s t o t a l   i n v e s t m e n t ×   100
The IRR is the discount rate that makes the NPV equal to zero, as shown in Equation (13). We calculate the IRR using MS Excel Solver.
I R R = N P V = t = 1 T a n n u a l   n e t   c a s h   f l o w ( 1 + I R R ) t   I   = 0
In this research, we use data from various government agencies to estimate the parameters for the optimization problem. Investment data, including the costs, fare prices, electricity price, subsidy schemes, operations and maintenance cost, proposed driver salary, franchising, diesel consumption for a jeepney, and electricity consumption for an e-jeepney, are estimated using the data from the Philippines’ Department of Transportation (DoTr), Land Transportation Franchising and Regulatory Board (LTFRB), and Department of Energy (DOE). 26-period average annual price data from World Bank -development indicators are used to run the Augmented Dickey–Fuller unit root test for the stochastic process of diesel (see Supplementary Material Table S2). The test result confirms that P d , t follows GBM with α = 0.01143 and σ = 0.02608 . These parameters are then used to generate stochastic prices of diesel, as described in Equation (2). The optimization results are tested for sensitivity analysis with respect to fare prices, electricity prices, and government subsidy. Six jeepney fares are analyzed: USD 21.81c (PHP 10) current base fare; a proposed higher fare, USD 26.17c (PHP 2 addition); and some reductions in fare prices, USD 17.45c (reduced by PHP 2), USD 15.27c (by PHP 3), USD 13.09c (by PHP 4), and USD 10.91c (by PHP 5). For the electricity price scenario, the current USD 22.20c (PHP 10.18/kWh) electricity rate is adjusted to a possible PHP2 decline in prices to USD 17.45c/kWh, and PHP3 and PHP5 increases to USD 28.35c/kWh and USD 32.72/kWh. Finally, proposed 10% and 0% subsidies are analyzed along with the current government subsidy of 5% of the investment. All data and variables, including the description and estimation, are summarized as shown in Supplementary Material Table S1.

3. Results

3.1. Traditional Valuation Methods

Table 1 summarizes the financial estimation results for PUV modernization projects using the traditional valuation methods. The results show that NPVs for both the e-jeepney and the modernized diesel jeepney projects are positive, which indicates positive returns for investing in any of the alternatives. Despite the high investment cost for each e-jeepney unit, results reveal a better investment opportunity for the e-jeepney fleet, with USD 4.892 million NPV rather than USD 3.138 million for the modernized diesel jeepney fleet. The main reasons for this include the more energy efficient e-jeepney, higher earnings from the larger seating capacity of the e-jeepney, and the high fuel cost for the traditional jeepney. This result supports previous claims that investing in electric PUVs is more profitable than combustion vehicles in the Philippines due to higher passenger capacity, lower fuel consumption, and safer body design [8,9].
On the other hand, other traditional valuation methods favor investment in the diesel jeepney fleet with shorter PBP, higher ROI, and higher IRR. The PBP estimation shows that an investment in the modernized diesel jeepney fleet can be recovered in 3.28 years, while it is 4.09 years for the e-jeepney fleet. Over the 30-year lifetime of jeepney operation, the diesel project returns the investment by 5 times while it is quadruple for the e-jeepney project. These results are due to higher investment costs for the e-jeepney, which are triple the cost for the diesel jeepney. Further, the IRRs for both projects are also higher than the hurdle rate of 15% set by the Philippine government [25], which implies that both projects are profitable.
While the traditional financial tools are already practical methods for PUV project valuation, these all-or-nothing strategies, outsetting all future outcomes as fixed, pose several potential problems. These include a constant nature of weighted average cost of capital through time, undervaluing the investment, the estimation of economic life, which forecasts errors in creating the future cash flows, and insufficient tests for the plausibility of the final results [26]. In a stochastic world, there would be fluctuations in business conditions that would change the value of the project [26]. Meanwhile, ROA can mitigate some of these problematic areas by combining risks and uncertainties in the future cash flow, with managerial flexibility in making investment decisions that give additional value to the project [11].

3.2. Baseline Scenario

The baseline scenario in Figure 2 describes different investment values under the business as usual environment. This figure compares the NPVs for the e-jeepney (green curve) and the diesel jeepney (yellow curve), expected net present value (ENPV) for the diesel jeepney (blue curve), considering the volatility of diesel fuel prices, and the maximized option values (dotted black curve) for the investment project at different initial prices of diesel. Initial results show a higher NPV for the e-jeepney, indicating a more profitable project than the diesel jeepney. This result supports the NPV results from the previous subsection, showing a better investment project for the e-jeepney.
The next point of interest is the blue curve, which describes the ENPV of the modernized jeepney at different initial prices of diesel. The Monte Carlo simulation result shows how E [ N P V j ] decreases with stochastic prices of diesel. This result is expected as higher fuel price incurs higher cost for jeepney operations and therefore lower profits. With the current trend in fuel prices, investment in the diesel jeepney will no longer be feasible in the future, which will further support the country’s ambitious aim to have a more efficient and environment-friendly transport system. The dotted black curve illustrates the dynamics of real option values. This describes the maximized value of either investing in the modernized diesel jeepney or in the e-jeepney, at different initial prices of diesel. The ROA model estimates the optimal timing of investment in the e-jeepney, denoted by P d * , which is the price of diesel that maximizes the investment in the e-jeepney. Below this threshold, the other alternative is a better investment option. Using the decision rule described in Equation (10), the optimization results reveal that investment in the modernized diesel jeepney is a better option if the price of fuel is below P d * = USD 0.4362/L. However, the current price of diesel is P d c u r = U S D   0.8992 / L , which is greater than the estimated P d * . This suggests an optimal decision to invest in the e-jeepney project under the current business environment. This result highlights the advantage of using ROA, as traditional valuation methods assume a single static decision, while ROA assumes a multidimensional series of decisions with management flexibility to adapt to changes in the business environment [26].
Figure 3 illustrates the dynamics of investment values at different periods. The simulation results show that while the investment value of the e-jeepney is constant, the expected NPV of investment in the diesel jeepney decreases over time and obtains negative values at some periods. The E [ N P V j ] curve (blue) suggests that investment in the modernized diesel jeepney is only profitable within 9 years of the decision-making period; otherwise, future investments only obtain negative profits. The main reason for this is the expected rising diesel fuel prices in the world market for the coming years [27,28], resulting in increasing operations cost and lower discounted cash flow. Moreover, we can observe that E [ N P V j ] across the investment period is as stochastic as the diesel price uncertainty conditions set in the proposed ROA model. Further, the red curve describes the opportunity loss from delaying investment in the e-jeepney. This loss is an opportunity cost by means of the revenue that could be earned from investing in the e-jeepney over the diesel jeepney at different investment periods. The result in the initial investment period T = 0 shows that, while both investments are profitable, the operator may incur an opportunity loss of USD 3.5 million for choosing the diesel jeepney over the e-jeepney project. At period T = 10 and beyond, the opportunity loss reaches USD 5.07 million and more, which is higher than the value of investment in the e-jeepney. This implies no better investment option but the e-jeepney fleet project from period T = 10 . These results support the above claim that adopting the e-jeepney is a more optimal investment decision for the current business scenario; otherwise, the transport operator may incur opportunity loss from postponing the investment in the e-jeepney.

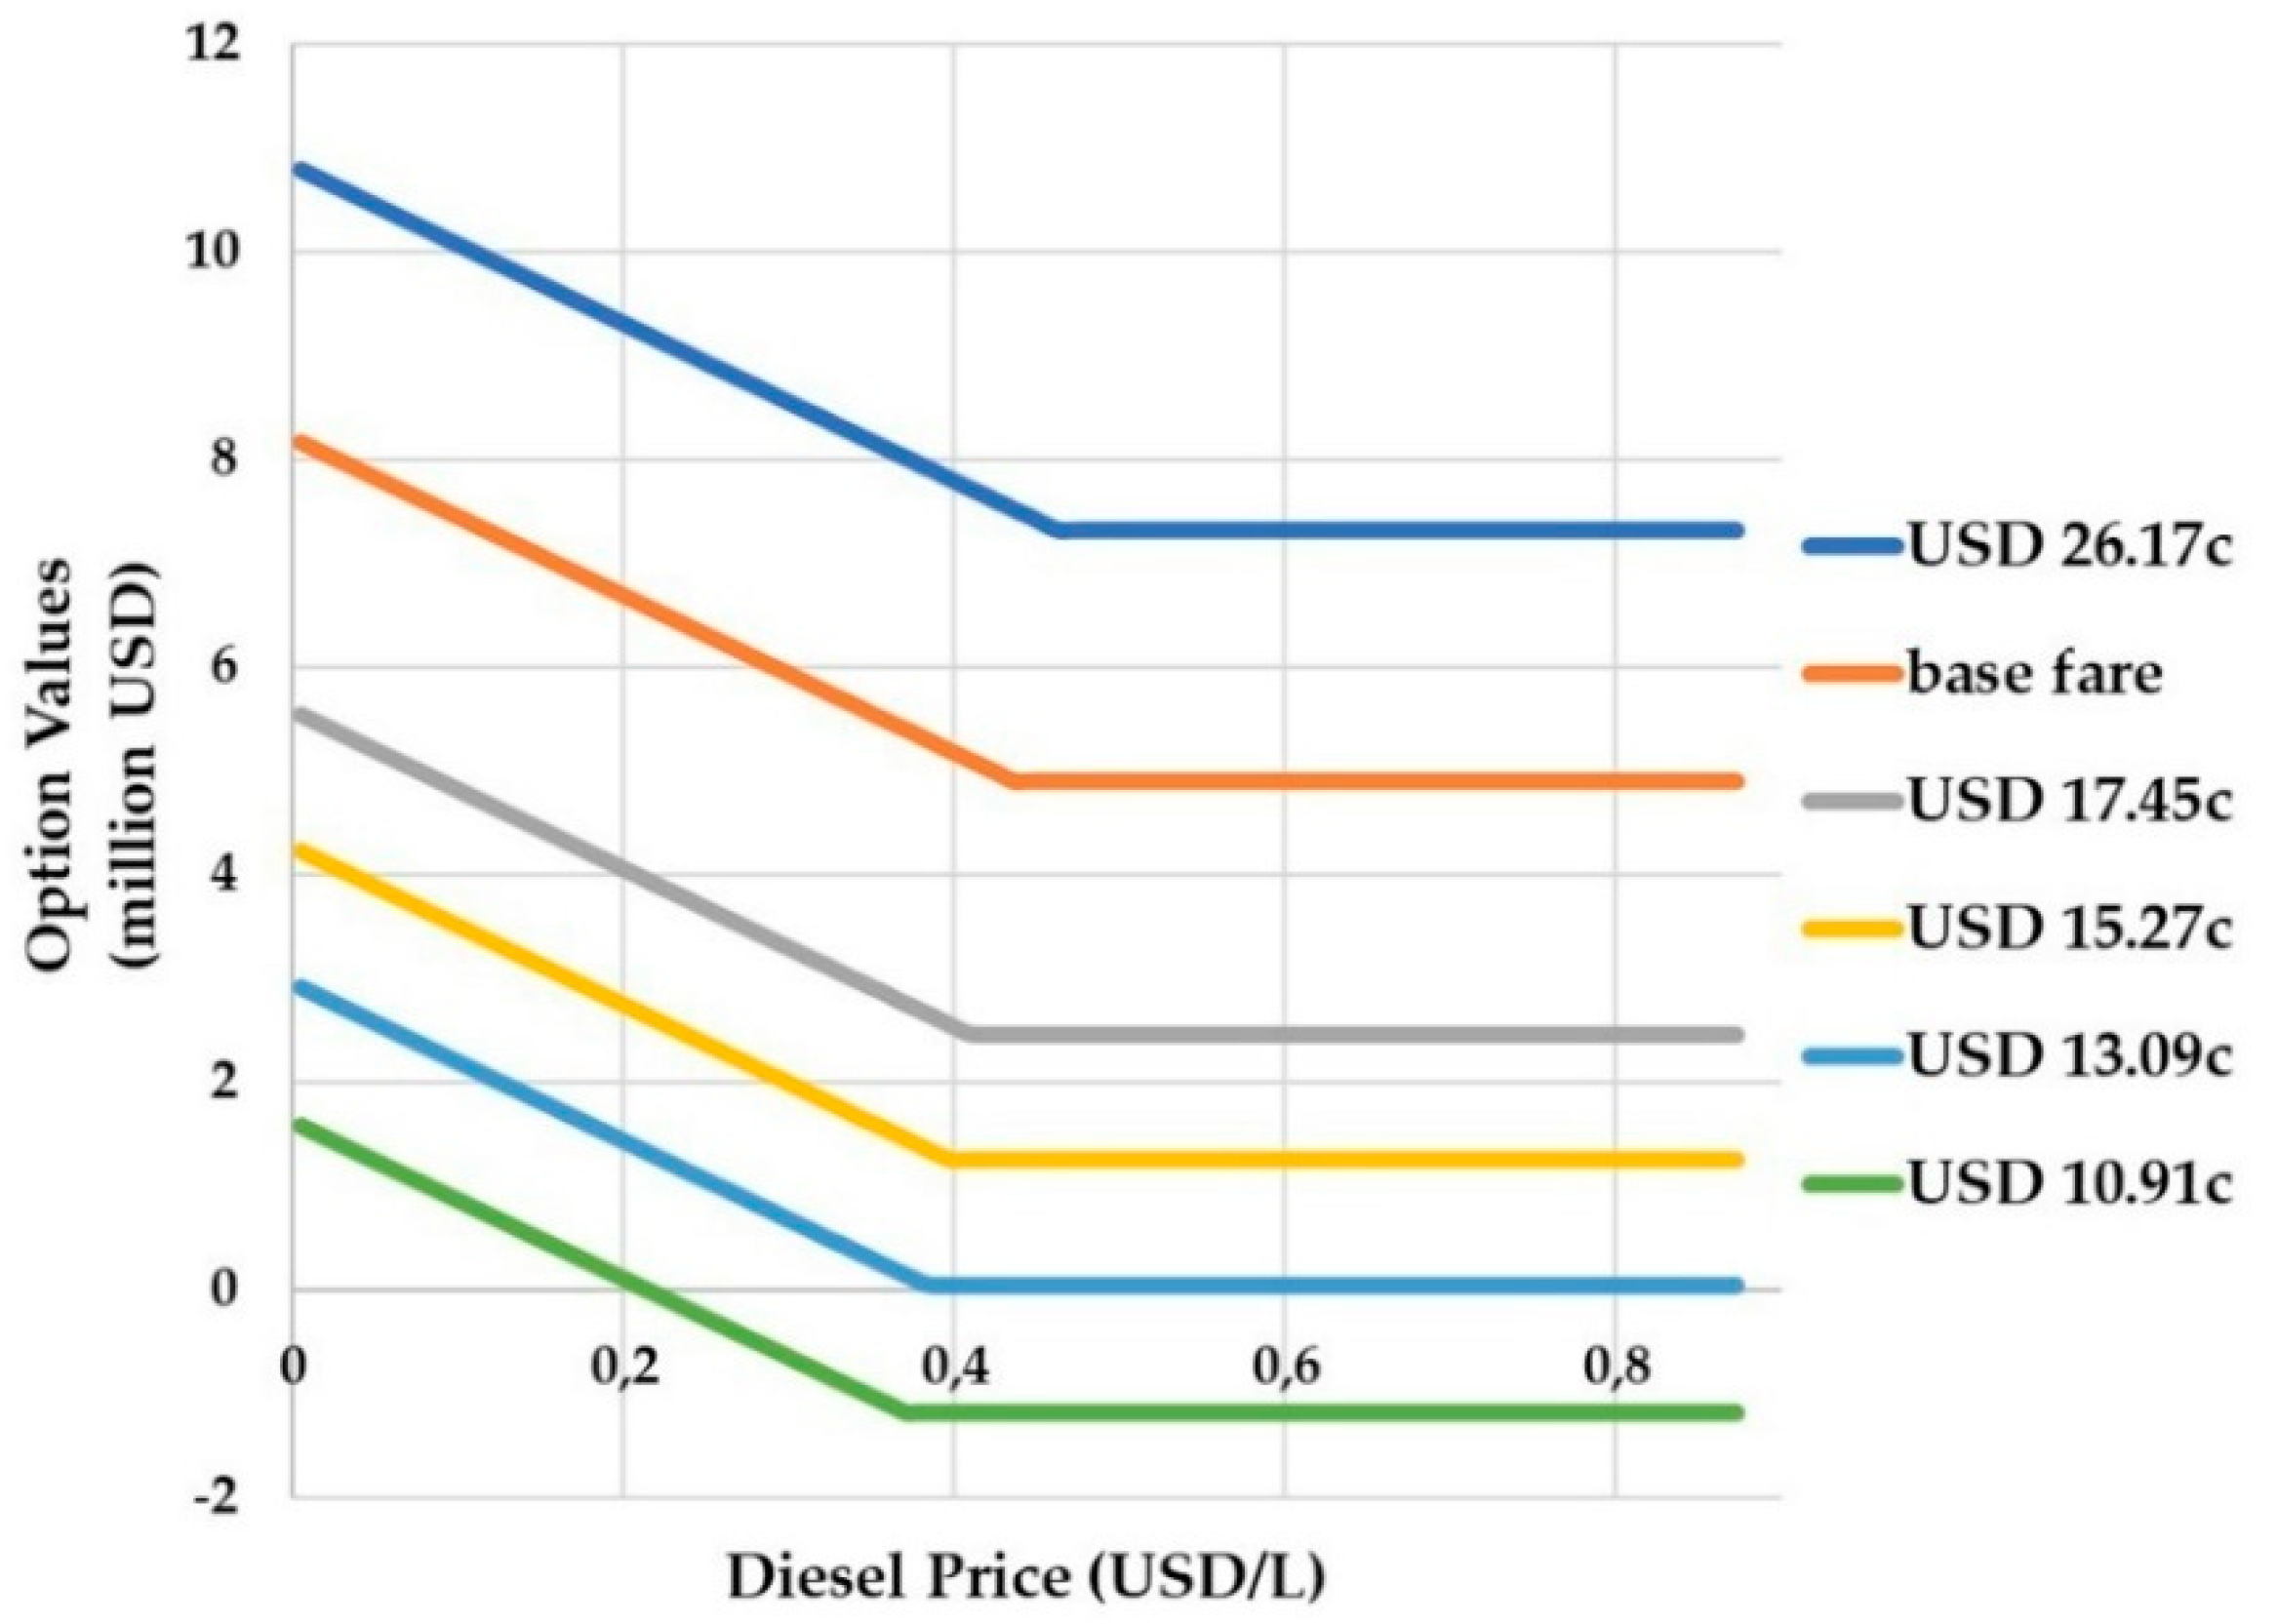
3.3. Jeepney Fare Scenario

In this scenario, we analyze the sensitivity of investment decisions with respect to changes in jeepney fares. Currently, public transport vehicles such as buses, jeepneys, and taxis are regulated by the LTFRB including routes, entries, and fares. As of December 2018, the base fare for traditional jeepneys in Metro Manila and nearby regions is USD 19.63c, which covers the first 4 km of public utility jeepney (PUJ) Routes. According to this agency, modern jeepneys that are compliant with the Public Utility Vehicle Modernization Program (PUVMP) can charge a minimum fare of USD 21.81cs. This scenario describes how variations in fares affect the option values and identifies the critical value of fare reduction for the adoption of PUVMP.
Figure 4 describes the option values at different jeepney base fares. The optimization shows an upright shift in the options curve at higher base fares. This result suggests that the government must increase the base fares in order to attract transport operators and prospective investors to adopt the PUV modernization program. This will have no or little effect on the demand, as passengers in the case of the Philippines are price takers due to the limited number of PUVs. On the contrary, a reduction of base fares shifts the option curve down left. Consequently, a fare reduction causes considerable revenue loss for the operator [29], hence, lower profit for operators and lower expected NPV for the project investment. Therefore, careful fare system planning for PUVs must be done to reflect the maximization of demand, revenue, profit, and social welfare [30]. Moreover, the fare USD 13.09c curve indicates the minimum fare reduction possible. Beyond this reduction, investment in any alternative incurs only losses, as described by the fare USD 10.91c (green curve).

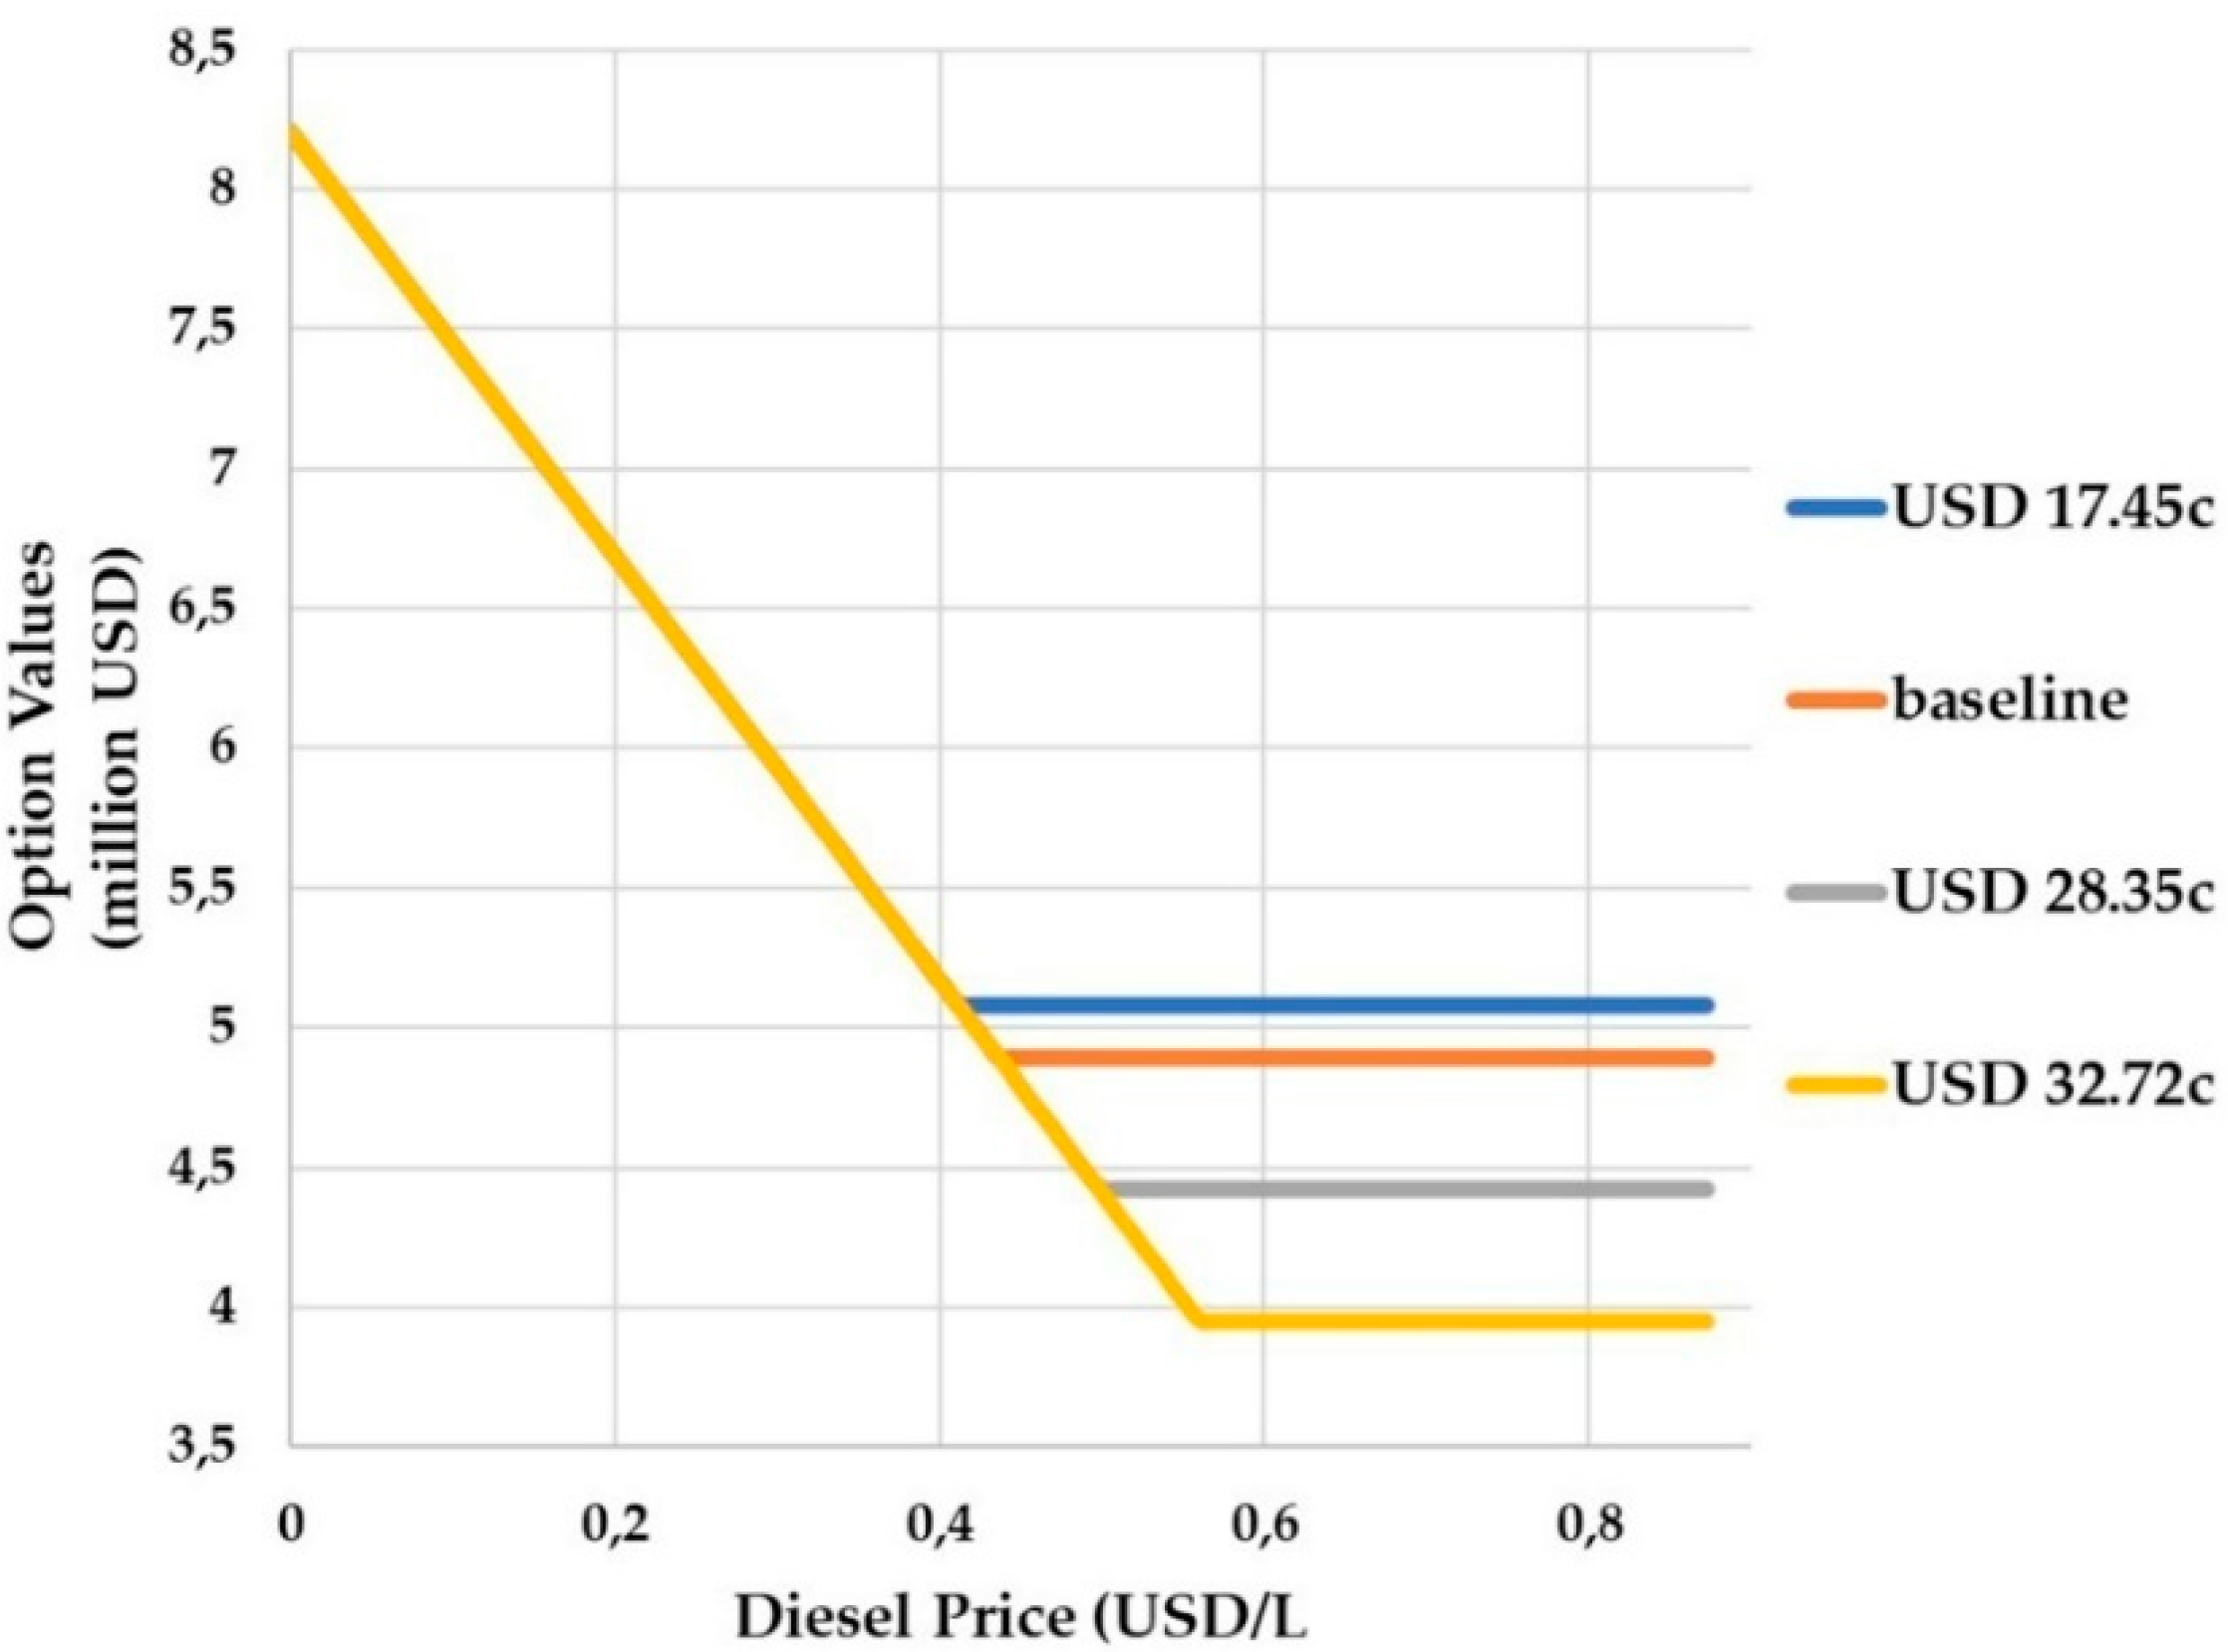
3.4. Electricity Price Scenario

In this scenario, we analyze the effect of changing electricity prices on the e-jeepney investment. At present, the country has relatively higher electricity rates compared with neighboring countries in the Asia-Pacific region. While Thailand, Malaysia, South Korea, Taiwan, and Indonesia have lower electricity prices due to government subsidies in the form of fuel subsidies, cash grants, additional debt, and deferred expenditures, the Philippines has higher prices due to no government subsidy, fully cost-reflective, imported fuel-dependent, and heavy taxes across the supply chain [31,32]. By changing the value broadly, we present how potential government actions on electricity prices affect investment conditions in the e-jeepney. Additionally, with the increasing investments in renewable energy sources (RES) in the country [33], we assume future reductions in electricity prices as a result of electricity surplus from RES being fed into the grid [34,35,36].
Figure 5 describes the option values at different electricity prices. The shifts on the bases of the curves show changes only for the NPV of the e-jeepney project. This result is evident as higher electricity prices ( P e > U S D   22.20   c / k W h ) incur higher costs for e-jeep operation, hence, lower profit and lower NPV. On the other hand, lower electricity prices ( P e > U S D   22.20   c / k W h ) result lower operations costs and higher profits for the e-jeepney. Note that investment in the other alternative is not affected by the price variability as electricity is not used in diesel jeepney operation. This result supports previous works highlighting a higher profitability of EVs at lower electricity prices [37,38]. This suggests that the government should regulate electricity prices at or lower than the current rate in order to make a better investment environment for e-jeepneys and realize its PUV modernization program. It also suggests that the government should boost investments in RES, as this will not only result in lower dependence on imported fossil fuels for energy generation and lower GHG emissions, but also reduce local electricity prices, which eventually make e-jeepneys a more attractive investment project.

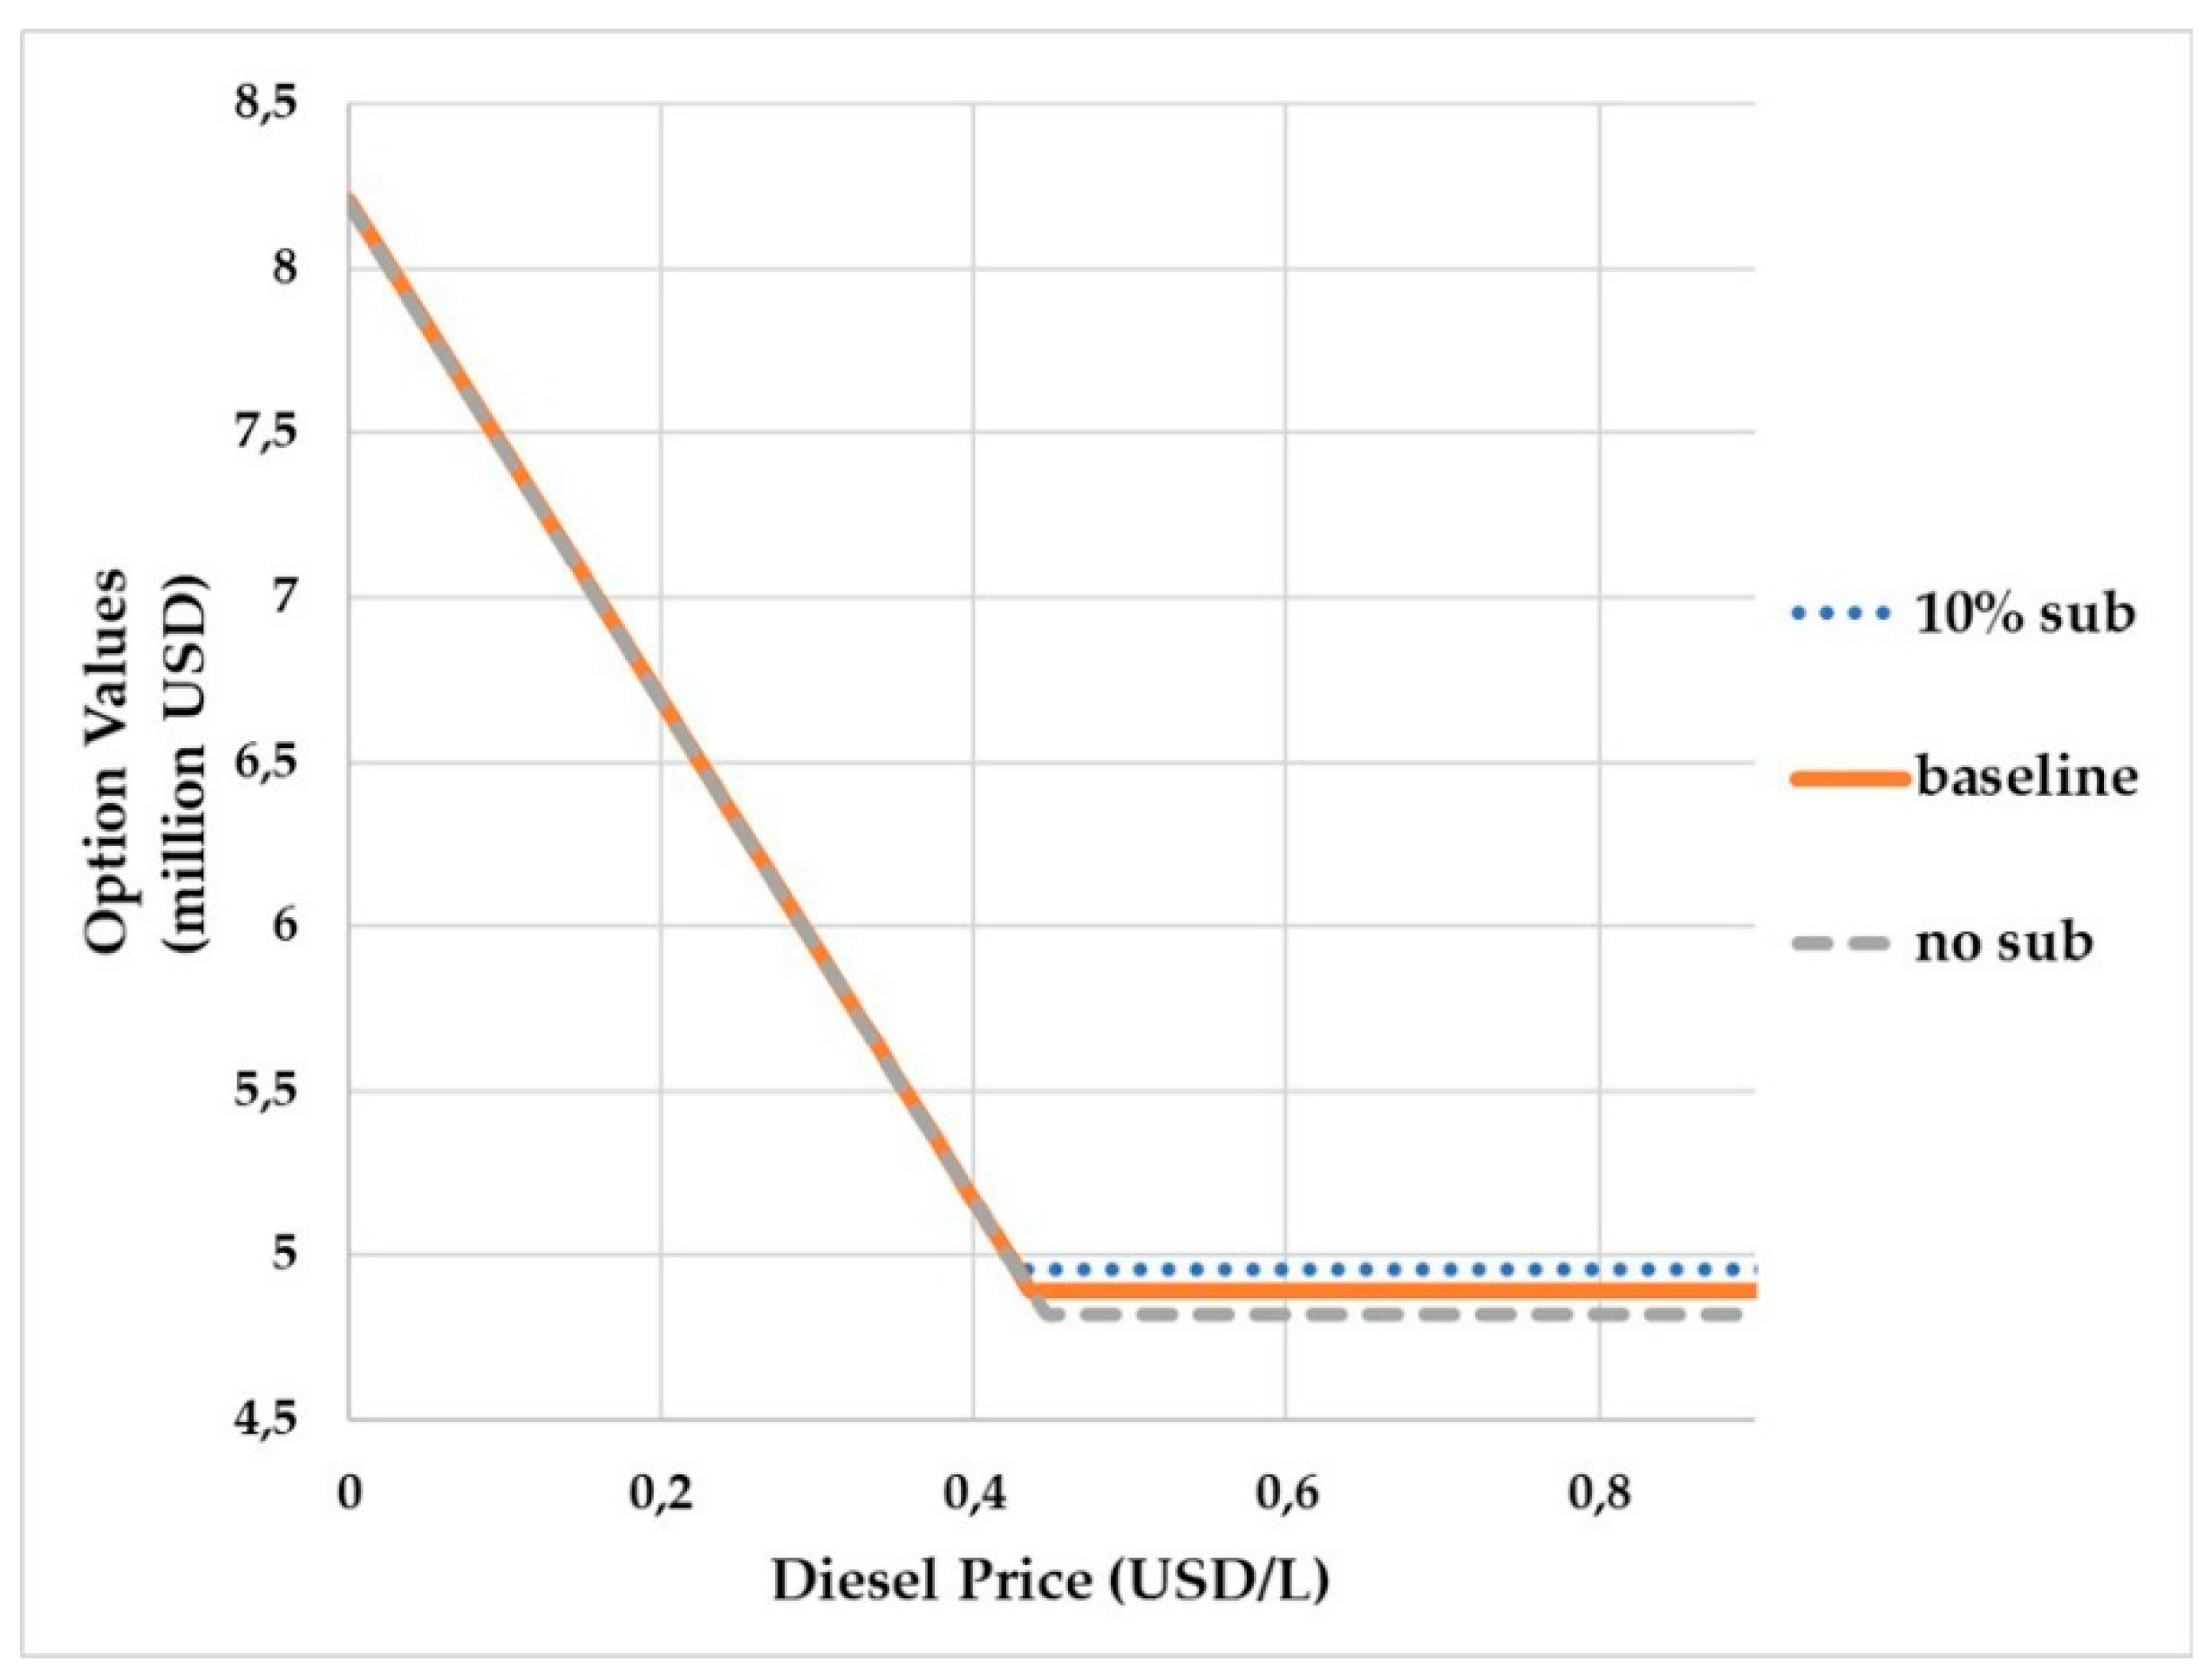
3.5. Government Subsidy Scenario

Lastly, we describe the significance of government subsidy for the investment in the e-jeepney project. According to the DoTr’s order on PUVMP guidelines, existing PUV operators with valid franchises and those applying for new or developmental routes are eligible for a fixed amount of USD 1745 per unit as an equity subsidy, provided that they drop the old PUJ units and substitute them with modernized jeepney units compliant with the Omnibus Franchising Guidelines (OFG) requirements [6]. In this scenario, we analyze how various subsidy schemes affect investment decisions for the adoption of the e-jeepney.
Figure 6 shows the optimization results for the option values of e-jeepney investment at various government subsidies: the current 5% of the total value per unit, 10% subsidy, and no subsidy. The option curves reveal no significant difference between the subsidy schemes analyzed. This result is in contrary to a previous study on bus purchase cost subsidy in the United States, which showed a significant impact on optimal bus type choice and its replacement age, and favoring diesel bus over hybrid EV without subsidy [39]. However, the break-even value of government subsidy in the previous study indicates that hybrid buses are not optimal unless the subsidy is equal to or greater than 63% ceteris paribus, a value relatively higher than the 5% subsidy offered by the Philippine government for the EV project analyzed in the current study. The current research result further indicates that the government intervention of giving modest and scanty assistance for prospective e-jeepney fleet investors makes no significant impact in the investment decision-making process. This implication is in line with previous studies showing electric vehicles to be a good economic option even without governmental subsidies [40,41].

4. Discussion

In this research, we only focus on the financial side of public transport investment. In real project valuation, there are also several factors considered that are equally important in the decision-making process. These may include an economic impact assessment of job creation and less dependence on imported diesel fuel; health and social impacts of providing safe and more comfortable modes of public transportation; public perception; and environmental impacts on noise, CO2 emission, and air pollution reductions [42,43,44,45]. The results of a previous study on alternative technologies for the Philippine utility jeepney [46] showed that the modernization project acquires additional benefits of USD 3076/vehicle in tax collections and USD 276/vehicle in employment income generated from the e-jeepney, while the benefits were USD 310/vehicle and USD 303/vehicle from the EURO-4 diesel jeepney. This study further quantifies the health and non-health benefits (USD 19,522/vehicle and USD 4157/vehicle) for the e-jeepney, with USD 16,616/vehicle and USD 3205/vehicle for the EURO-4 diesel jeepney. The health impacts account to respiratory illnesses and premature mortality caused by particulate matter, and NOx and SOx emissions emanating from vehicle tailpipes and from power generation (for the e-jeepney), while non-health impacts account to corresponding visibility reduction, soiling, and material damage [46]. As the urban air pollution in the Philippines has considerable health implications at about 1.5% of the country’s GDP [46], the shift from combustion engines to EVs is beneficial to health and environment, especially when the government also transitions to greener sources of energy [45,47,48]. On the other hand, one study [46] estimated a negative USD 1470/vehicle of GHG savings from the e-jeepney, while it was positive USD 928/vehicle for the EURO-4 diesel jeepney. This implies that the shift to electric jeepneys will not provide GHG benefits under the current energy environment, as the baseline grid mix in the country is dominated by coal (75% of total energy generation) [11], which increases the grid GHG emission factor. In terms of public perception, market research on the future of EVs in Southeast Asia revealed that 46% of Filipinos expressed interest in owning an e-vehicle (e-jeepney or e-tricycle), while more commuters preferred to ride EVs than the conventional transportation in areas where EVs are available [49]. The study stated that the figure increased to 75 percent if the government gives incentives to EV buyers including waived taxes, more charging infrastructure, priority lanes for EVs during car registration, and free parking [49]. The study further reiterated the support from local government units in the deployment of EV units, while more cooperatives and operators are becoming involved by replacing their old units and obtaining new franchises with the help of the DoTr [49]. While the public perception of EVs is relatively low in other countries due to concerns about high battery costs, safety, reliability, range per charge, and poor public charging infrastructures [50,51], Filipinos’ environmental awareness is now increasing with the adoption of more sustainable modes of public transport. While the GHG savings and the traditional valuation methods favor modernized jeepneys with shorter PBP, higher ROI, and higher IRR; other analyses including economic impacts on employment and additional tax collection, health and non-health impacts, and public perception favor the e-jeepney project, which further complements our analysis using the proposed ROA model.
In the jeepney fare scenario, we analyze how the changing base fare affects investment decisions for the PUV project. We assume that the USD 2.18c (PHP 1) fare difference between modern and traditional jeepneys has no or little effect on the demand, as passengers in the case of the Philippines are price takers due to the limited number of PUVs. In the medium to long-run, this assumption is true as traditional jeepneys will be phased out in 10 to 15 years [6]; hence, there will be a uniform price for all types of jeepney. It should be noted that in the short-run, fare differences may affect the demand as consumers may prefer traditional jeepneys with lower fares. In this case, future studies may include the cross-price elasticity of demand, which reflects the substitution pattern between the traditional and modernized jeepneys [52]. Moreover, cross-price elasticity may also include the availability of charging stations; charging prices of the stations; and PUV substitutes such as hybrid, hydrogen-fueled, and other modes of public transportation [53,54].
The context of the decision-making analyses in this study focuses on the transport operator who will adopt PUVMP with the e-jeepney; hence, we assume that charging stations for e-jeepneys are located at company and public terminals. We recognize that our results can further be influenced by a supporting project from the government to establish charging infrastructures, which can be placed in strategic places. This can be planned by utilizing PUV recharging information like frequency, amount and time to estimate the distances between the stations [55,56]. However, this is in contrast with a study which suggests that the charging of electric PUVs should be coordinated to minimize potential energy losses and maximize the main grid load factor [57]. Using the same recharging information, operators can manage the charging schedule of the units in their respective terminals. While individual charging may not affect the distributions systems, simultaneous charging of an entire fleet may incur potential problems in old transformers and excessive voltage drops [58]. Moreover, for the last 10 years, there was an average of 11% annual increase in the production of electricity using coal [59]. This indicates that there was an observable increase in the demand for electricity even before the dawn of charging e-jeepneys. It should be noted that emissions from burning fossil fuels like coal release GHGs, which affect the environment. While we are sure that the GHG emissions of the e-jeepney are Euro-4 compliant, the production of electricity that powers these vehicles is not. Therefore, the government should increase its efforts to develop infrastructures that generate electricity from RES.
This study compares the economic attractiveness of investment in the e-jeepney and the modernized diesel jeepney. Future studies may also consider other environment-friendly alternatives such as biofuel vehicles, hydrogen-fueled vehicles, and hybrid vehicles. While this study analyzes the case of PUV investment in the Philippines, future studies may consider applying the proposed model for PUV projects in developing countries such as electric tricycles, electric tuk-tuks, e-scooters, electric water taxis, and other sustainable modes of public transportation that fit with the local setting.
Finally, this study analyzes an investment setting with stochastic diesel fuel prices, while assuming all other variables are constant through time. We acknowledge other uncertainties that affect investment decisions, particularly for public transport, including the prices of electricity, jeepney fares, operation and maintenance costs, demand for more environment-friendly PUVs, technological innovations, investment costs, and other relevant variables. These uncertainties can also be incorporated in the model to better capture a more realistic investment setting relevant to market and climate change policy. Despite these limitations, we believe that the ROA framework proposed in this study could be a good benchmark for further analysis of investment decisions for cleaner and more sustainable modes of public transportation.

5. Conclusions

This study discusses an investment case for adopting the modernized diesel jeepney or the e-jeepney in the Philippines. We apply the real options approach under uncertainty in diesel fuel prices to evaluate the option values and optimal investment strategies in PUV projects. We characterize various scenarios where the e-jeepney is a more favorable investment than the modernized diesel jeepney and analyze how sensitivity to electricity prices, jeepney fares, and government subsidy in the e-jeepney affect the investment decisions for PUVs. We also compare the decision usefulness of the proposed ROA model over the traditional financial tools for analyzing PUV investment projects. Our analysis highlights the advantages of ROA by combining risks, uncertainties, and managerial flexibility in making investment decisions.
Our analyses conclude that there is a better investment opportunity for the e-jeepney over the diesel jeepney. Results are robust with all scenarios investigated. Results also show a more optimal decision strategy to invest immediately under the current business environment, as delaying or postponing investment may incur opportunity losses. While environmental impacts and traditional financial tools such as PBP, ROI, and IRR favor the modernized jeepney project, other investment analyses including public perception, health and non-health benefits, and economic impacts on tax and employment favor the e-jeepney project, which complements the result of our analysis using the proposed ROA. To make the adoption of the e-jeepney more attractive, this study further suggests government actions to increase the amount of subsidy with flexible payment terms; increase jeepney base fares for quick and higher ROI; establish charging infrastructures optimally located in strategic places while considering the driver’s spontaneous adjustments, and the interactions of travel and charging decisions; and continue efforts to rely on cleaner, cheaper, and renewable sources of electricity.

Supplementary Materials

The supplementary material is available online at https://0-www-mdpi-com.brum.beds.ac.uk/2032-6653/10/3/51/s1.

Author Contributions

Conceptualization, C.B.A., C.S.G., Re.O.V. and Ri.O.V.; Data curation, C.S.G. and Re.O.V.; Formal analysis, C.B.A.; Investigation, Re.O.V.; Methodology, C.B.A.; Project administration, C.S.G.; Software, C.B.A.; Supervision, C.B.A.; Validation, C.S.G., Re.O.V. and Ri.O.V.; Writing—original draft, C.B.A., C.S.G., Re.O.V. and Ri.O.V.; Writing—review & editing, Ri.O.V.

Funding

This research received no external funding.

Acknowledgments

The authors acknowledge Utrecht University, the Philippines’ Department of Energy (DoE), Department of Transport (DoTr), and the Land Transportation Franchising and Regulatory Board (LTFRB).

Conflicts of Interest

The authors declare no conflict of interest.

Nomenclature

AcronymsDescription
ADFAugmented Dickey–Fuller
CBACost-Benefit Analysis
DOEDepartment of Energy
DoTrDepartment of Transportation
EVElectric Vehicles
IRRInternal Rate of Return
GBMGeometric Brownian Motion
GHGGreenhouse Gasses
GPSGlobal Positioning System
HVHybrid Vehicle
IRRInternal Rate of Return
LTFRBLand Transportation Franchising and Regulatory Board
MACEManila Aerosol Characterization Experiment
NPVNet Present Value
OFGOmnibus Franchising Guidelines
PBPPayback Period
PUJPublic Utility Jeepney
PUVPublic Utility Vehicle
PHPPhilippine Peso
PUVMPPublic Utility Vehicle Modernization Program
RESRenewable Energy Sources
ROAReal Options Approach
ROIReturn on Investment
SymbolsDescriptionUnit
αgradient of diesel prices
σstandard deviation of diesel prices
ρdiscount factor
Pejaverage annual earnings from e-jeepneyPHP/yr
Qejnumber of e-jeepney units per fleet; minimum set by the governmentunit
Peprice electricityPHP/kWh
Qeaverage annual electricity consumed by the fleetkWh
Cejaverage annual operations and maintenance cost for e-jeepneyPHP/yr
sgovernment subsidy for e-jeepney fleet PHP
Iannual amortization for e-jeepney fleet PHP/yr
Tejeffective lifetime of e-jeepneyYr
ENPVExpected Net Present ValuePHP
NPVejnet present value of e-jeepney fleet projectPHP
Pjaverage annual earnings from diesel jeepneyPHP/yr
Qjnumber of diesel jeepney units per fleet unit
Qdaverage annual fuel consumption of diesel jeepney fleetL/yr
Cjaverage annual operations and maintenance cost for diesel jeepneyPHP/yr
Ijaverage investment cost for diesel jeepneyPHP
Tjeffective lifetime of diesel jeepneyYr
TDecision-making period
Pd,0initial diesel pricePHP/L
P d c u r current price of diesel PHP/L
NPVjnet present value of diesel jeepney fleet projectPHP

References

  1. IPCC. Climate Change 2014: Mitigation of Climate Change. Contribution of Working Group III to the Fifth Assessment Report of the Intergovernmental Panel on Climate Change; Edenhofer, O.R., Pichs-Madruga, Y., Sokona, E., Farahani, S., Kadner, K., Seyboth, A., Adler, I., Baum, S., Brunner, P., Eickemeier, B., et al., Eds.; Cambridge University Press: Cambridge, UK, 2014; Available online: https://www.ipcc.ch/site/assets/uploads/2018/02/ipcc_wg3_ar5_frontmatter.pdf (accessed on 30 March 2019).
  2. The International Energy Agency (IEA). Tracking Clean Energy Progress 2017. Available online: https://www.iea.org/publications/freepublications/publication/TrackingCleanEnergyProgress2017.pdf (accessed on 30 March 2019).
  3. Ajanovic, A. The future of electric vehicles: Prospects and impediments. WIREs Energy Environ. 2015, 4, 236–521. [Google Scholar] [CrossRef]
  4. BNEF, Electric Vehicle Outlook. 2018. Available online: https://about.bnef.com/electric-vehicle-outlook/ (accessed on 30 March 2019).
  5. Kecorius, S.; Madueño, L.; Vallar, E.; Alas, H.; Betito, G.; Birmili, W.; Cambaliza, M.O.; Catipay, G.; Galvez, M.C.; Lorenzo, G.; et al. Aerosol particle mixing state, soot number size distributions, and emission factors in a polluted urban environment: Case study of Metro Manila, Philippines. Atmos. Environ. 2017, 170, 169–183. [Google Scholar] [CrossRef]
  6. Department of Transportation (DoTr). Guidelines on the Availment of the Equity Subsidy under the Public Utility Vehicle (PUV) Modernization Program. 2018. Available online: https://drive.google.com/file/d/1Sq8JbgN1E4hF4a6gbslFdk7DwbX7ulhB/view (accessed on 30 March 2019).
  7. Philippine Information Agency (PIA). Makati-Mandaluyong eSakay Route Launched. Available online: https://pia.gov.ph/news/articles/1017399 (accessed on 30 March 2019).
  8. Lopez, N.S.; Soliman, J.; Biona, J.B.M. Life Cycle Cost and Benefit Analysis of Low Carbon Vehicle Technologies. In Sustainable Energy Technology and Policies; De, S., Bandyopadhyay, S., Assadi, M., Mukherjee, D., Eds.; Green Energy and Technology Springer: Singapore, 2018; pp. 131–146. [Google Scholar]
  9. Balaria, F.E.; Pascual, M.P.; Santos, M.D.; Ortiz, A.F.; Gabriel, A.G.; Mangahas, T.L.S. Sustainability of E-Trike as Alternative Mode of Public Transportation System: The Case of Cabanatuan City, Philippines. Open J. Civ. Eng. 2017, 7, 362–377. [Google Scholar] [CrossRef] [Green Version]
  10. Sarsalejo, L.F.C.; Preciados, L.S. Comparative Profitability Analysis of Electric, Pedicab, and Gasoline-Fuelled Tricycles. J. Educ. Hum. Resour. Dev. 2018, 6, 1–11. [Google Scholar]
  11. Agaton, C.B. A Real Options Approach to Renewable and Nuclear Energy Investments in the Philippines; Logos Verlag Berlin: Berlin, Germany, 2019; Volume 71. [Google Scholar]
  12. Nishihara, M. Hybrid or electric vehicles? A real options perspective. Oper. Res. Lett. 2010, 38, 87–93. [Google Scholar] [CrossRef] [Green Version]
  13. Kang, N.; Bayrak, A.; Papalambros, P.Y. Robustness and Real Options for Vehicle Design and Investment Decisions Under Gas Price and Regulatory Uncertainties. J. Mech. Des. 2018, 140, 10140401–10140411. [Google Scholar] [CrossRef]
  14. Kleindorfer, P.R.; Neboian, A.; Roset, A.; Spinler, S. Fleet Renewal with Electric Vehicles at La Poste. INFORMS J. Appl. Anal. 2012, 42, 465–477. [Google Scholar] [CrossRef]
  15. Yamashita, D.; Niimura, T.; Takamori, H.; Wang, T.; Yokoyama, R. Plug-in Electric Vehicle Markets and Their Infrastructure Investment Policies under Fuel Economy Uncertainty. Int. J. Real Options Strategy 2013, 1, 39–60. [Google Scholar] [CrossRef] [Green Version]
  16. Avadikyan, A.; Llerena, P. A real options reasoning approach to hybrid vehicle investments. Technol. Forecast. Soc. Chang. 2010, 77, 649–661. [Google Scholar] [CrossRef]
  17. Ansaripoor, A.H.; Oliveira, F.S. Flexible lease contracts in the fleet replacement problem with alternative fuel vehicles: A real-options approach. Eur. J. Oper. Res. 2018, 266, 316–327. [Google Scholar] [CrossRef]
  18. He, H.; Fan, J.; Li, Y.; Li, J. When to switch to a hybrid electric vehicle: A replacement optimisation decision. J. Clean. Prod. 2017, 148, 295–303. [Google Scholar] [CrossRef]
  19. Guo, Q.W.; Chen, S.; Schonfeld, P.; Li, Z. How time-inconsistent preferences affect investment timing for rail transit. Transp. Res. Part B Methodol. 2018, 118, 172–192. [Google Scholar] [CrossRef]
  20. Li, Z.C.; Guo, Q.W.; Lam, W.H.; Wong, S.C. Transit technology investment and selection under urban population volatility: A real option perspective. Transp. Res. Part B Methodol. 2015, 78, 318–340. [Google Scholar] [CrossRef] [Green Version]
  21. Department of Energy (DOE). Oil Supply/Demand Report FY 2018 vs FY 2017. Available online: https://www.doe.gov.ph/downstream-oil (accessed on 28 March 2019).
  22. Fonseca, M.N.; de Oliveira Pamplona, E.; de Mello Valerio, V.E.; Aquila, G.; Rocha, L.C.S.; Junior, P.R. Oil price volatility: A real option valuation approach in an African oil field. J. Pet. Sci. Eng. 2017, 150, 297–304. [Google Scholar] [CrossRef]
  23. Guedes, J.; Santos, P. Valuing an offshore oil exploration and production project through real options analysis. Energy Econ. 2016, 60, 377–386. [Google Scholar] [CrossRef]
  24. Agaton, C.B.; Karl, H. A real options approach to renewable electricity generation in the Philippines. Energy Sustain. Soc. 2018, 8, 1. [Google Scholar] [CrossRef] [Green Version]
  25. National Economic and Development Agency (NEDA). Updated Social Discount Rate for the Philippines. 2016. Available online: http://www.neda.gov.ph/wp-content/uploads/2017/01/Revisions-on-ICC-Guidelines-and-Procedures-Updated-Social-Discount-Rate-for-the-Philippines.pdf (accessed on 13 August 2019).
  26. Mun, J. Real options analysis versus traditional DCF valuation in layman’s terms. In Managing Enterprise Risk: What the Electric Industry Experience Implies for Contemporary Business; Leggio, K.B., Taylor, M.L., Eds.; Elsevier: Amsterdam, The Netherlands, 2006; pp. 75–106. [Google Scholar]
  27. US Energy Information Administration. Annual Energy Outlook 2019 with Projections to 2050. Available online: https://www.eia.gov/outlooks/aeo/pdf/aeo2019.pdf (accessed on 23 April 2019).
  28. International Energy Agency (IEA). World Energy Outlook. 2018. Available online: https://www.iea.org/weo2018/ (accessed on 23 April 2019).
  29. White, P.R. Public Transport: Its Planning, Management and Operation; Routledge: New York, NY, USA, 2017. [Google Scholar]
  30. Borndoerfer, R.; Karbstein, M.; Pfetsch, M.E. Models for fare planning in public transport. Discret. Appl. Math. 2012, 160, 2591–2605. [Google Scholar] [CrossRef] [Green Version]
  31. Agaton, C.B. Real Options Analysis of Renewable Energy Investment Scenarios in the Philippines. Renew. Energy Sustain. Dev. 2017, 3, 284–292. [Google Scholar] [CrossRef] [Green Version]
  32. Fernandez, L. Power Prices: Where We Are and How Do We Reduce the Bill; Philippines’ Department of Trade and Industry (DTI): London, UK, 2015. Available online: http://industry.gov.ph/wp-content/uploads/2015/08/Power-Prices-Where-We-Are-and-How-Can-We-Reduce-Our-Bill-by-Lawrence-Fernandez-MERALCO1.pdf (accessed on 23 April 2019).
  33. Agaton, C.B. Use coal or invest in renewables: A real options analysis of energy investments in the Philippines. Renewables 2018, 5, 1. [Google Scholar] [CrossRef]
  34. Sáenz de Miera, G.; del Río González, P.; Vizcaíno, I. Analysing the impact of renewable electricity support schemes on power prices: The case of wind electricity in Spain. Energy Policy 2008, 36, 3345–3359. [Google Scholar] [CrossRef]
  35. Sorknæs, P.; Djørup, S.R.; Lund, H.; Thellufsen, J.Z. Quantifying the influence of wind power and photovoltaic on future electricity market prices. Energy Convers. Manag. 2019, 180, 312–324. [Google Scholar] [CrossRef]
  36. Hirth, L. What caused the drop in European electricity prices? A factor decomposition analysis. Energy J. 2018, 39, 143–157. [Google Scholar] [CrossRef]
  37. De Schepper, E.; Van Passel, S.; Lizin, S. Economic benefits of combining clean energy technologies: The case of solar photovoltaics and battery electric vehicles. Int. J. Energy Res. 2015, 39, 1109–1119. [Google Scholar] [CrossRef]
  38. Hoarau, Q.; Perez, Y. Interactions between electric mobility and photovoltaic generation: A review. Renew. Sustain. Energy Rev. 2018, 94, 510–522. [Google Scholar] [CrossRef] [Green Version]
  39. Feng, W.; Figliozzi, M. Vehicle technologies and bus fleet replacement optimization: Problem properties and sensitivity analysis utilizing real-world data. Public Transp. 2014, 6, 137–157. [Google Scholar] [CrossRef]
  40. Bubeck, S.; Tomaschek, J.; Fahl, U. Perspectives of electric mobility: Total cost of ownership of electric vehicles in Germany. Transp. Policy 2016, 50, 63–77. [Google Scholar] [CrossRef]
  41. Nian, V.; Hari, M.P.; Yuan, J. A new business model for encouraging the adoption of electric vehicles in the absence of policy support. Appl. Energy 2019, 235, 1106–1117. [Google Scholar] [CrossRef]
  42. Ji, S.; Cherry, C.R.; Bechle, M.J.; Wu, Y.; Marshall, J.D. Electric Vehicles in China: Emissions and Health Impacts. Environ. Sci. Technol. 2012, 46, 2018–2024. [Google Scholar] [CrossRef]
  43. Hawkins, T.R.; Singh, B.; Majeau-Bettez, G.; Strømman, A.H. Comparative environmental life cycle assessment of conventional and electric vehicles. J. Ind. Ecol. 2013, 17, 53–64. [Google Scholar] [CrossRef]
  44. Yong, J.Y.; Ramachandaramurthy, V.K.; Tana, K.M.; Mithulananthan, N. A review on the state-of-the-art technologies of electric vehicle, its impacts and prospects. Renew. Sustain. Energy Rev. 2015, 49, 365–385. [Google Scholar] [CrossRef]
  45. Buekers, J.; Holderbeke, M.V.; Bierkens, J.; Panisa, L.I. Health and environmental benefits related to electric vehicle introduction in EU countries. Transp. Res. Part D Transp. Environ. 2014, 33, 26–38. [Google Scholar] [CrossRef]
  46. Biona, J.B.; Mejia, M.; Tacderas, M.; dela Cruz, N.; Dematera, K.; Romero, J. Alternative Technologies for the Philippine Utility Jeepney: A Cost-Benefit Study; Blacksmith Institute and Clean Air Asia: Pasig City, Philippines, 2017. [Google Scholar]
  47. Holland, S.P.; Mansur, E.T.; Muller, N.Z.; Yates, A.J. Are there environmental benefits from driving electric vehicles? The importance of local factors. Am. Econ. Rev. 2016, 106, 3700–3729. [Google Scholar] [CrossRef]
  48. Ziefle, M.; Beul-Leusmann, S.; Kasugai, K.; Schwalm, M. Public perception and acceptance of electric vehicles: Exploring users’ perceived benefits and drawbacks. In International Conference of Design, User Experience, and Usability; Marcus, A., Ed.; Springer: Cham, Switzerland, 2014; Volume 8159, pp. 628–639. [Google Scholar]
  49. Frost & Sullivan. The Future of Electric Vehicles in Southeast Asia: Position Paper. 2018. Available online: https://asia.nissannews.com/en/releases/release-568d250ed392364df4a81d7c61017eee/images/074b20d9e25174eab8146462b7be1932083d9d3a (accessed on 14 August 2019).
  50. Sovacool, B.K.; Kester, J.; Heida, V. Cars and kids: Childhood perceptions of electric vehicles and sustainable transport in Denmark and the Netherlands. Technol. Forecast. Soc. Chang. 2019, 144, 182–192. [Google Scholar] [CrossRef]
  51. She, Z.Y.; Sun, Q.; Ma, J.J.; Xie, B.C. What are the barriers to widespread adoption of battery electric vehicles? A survey of public perception in Tianjin, China. Transp. Policy 2017, 56, 29–40. [Google Scholar] [CrossRef]
  52. Xing, J.; Leard, B.; Li, S. What Does an Electric Vehicle Replace? No. w25771; National Bureau of Economic Research: Cambridge, MA, USA, 2019. [Google Scholar]
  53. Springel, K. Network Externality and Subsidy Structure in Two-Sided Markets: Evidence from Electric Vehicle Incentives; United States Environmental Protection Agency: Washington, DC, USA, 2016. [Google Scholar]
  54. Luo, C.; Huang, Y.F.; Gupta, V. Stochastic dynamic pricing for EV charging stations with renewable integration and energy storage. IEEE Trans. Smart Grid 2017, 9, 1494–1505. [Google Scholar] [CrossRef]
  55. He, F.; Yin, Y.; Zhou, J. Deploying public charging stations for electric vehicles on urban road networks. Transp. Res. Part C Emerg. Technol. 2015, 60, 227–240. [Google Scholar] [CrossRef]
  56. Wang, C.; He, F.; Lin, X.; Shen, Z.J.M.; Li, M. Designing locations and capacities for charging stations to support intercity travel of electric vehicles: An expanded network approach. Transp. Res. Part C Emerg. Technol. 2019, 102, 210–232. [Google Scholar] [CrossRef]
  57. Clement-Nyms, K.; Haesen, E.; Driesen, J. The Impact of Charging Plug-In Hybrid Electric Vehicles on a Residential Distribution Grid. IEEE Trans. Power Syst. 2010, 25, 371–380. [Google Scholar] [CrossRef]
  58. Richardson, P.; Flynn, D.; Keane, A. Optimal Charging of Electric Vehicles in Low-Voltage Distribution Systems. IEEE Trans. Power Syst. 2012, 27, 268–279. [Google Scholar] [CrossRef]
  59. DOE. Summary of Installed Capacity, Dependable Capacity, Power Generation and Consumption. 2018. Available online: https://www.doe.gov.ph/sites/default/files/pdf/energy_statistics/01_2018_power_statistics_as_of_29_march_2019_summary.pdf (accessed on 23 April 2019).
Figure 1. Most common public utility vehicles in the Philippines: (a) traditional diesel jeepney; (b) modernized diesel jeepney with Euro 4-compliant engine; (c) air-conditioned e-jeepney. Source: Land Transportation Franchising and Regulatory Board (LTFRB).
Wevj 10 00051 g001
Figure 2. Investment values at initial prices of diesel fuel. P d * is the minimum price of diesel for the e-jeepney project; P d c u r = U S D 0.8992 L is the current price of diesel. Optimization results are tabulated in Supplementary Material Table S3.
Wevj 10 00051 g002
Figure 3. Dynamics of investment values at different periods. E [ N P V j ] is the expected NPV of investment in the diesel jeepney; N P V e j is the NPV of investment in the e-jeepney; opportunity loss is the value of delaying investment in the e-jeepney. Optimization results for the dynamics of investment values at different periods are tabulated in Supplementary Material Table S4.
Wevj 10 00051 g003
Figure 4. Option values at different jeepney fares. Current base fare = USD 21.81c (PHP 10); USD 26.17c adds PHP 2 onto the base fare); USD 17.45c, 15.27c, 13.09c, and 10.91c reduce the current base fare by PHP 2, PHP 3, PHP 4, and PHP 5 (USD 1 = PHP 45.85). Optimization results are tabulated in Supplementary Material Table S5.
Wevj 10 00051 g004
Figure 5. Option values at different electricity prices. Current electricity price = USD 22.20c/kWh; USD 17.45c reduces the electricity rate by PHP 2/kWh; USD 28.35c and USD 32.72c increase the electricity rate by PHP 3/kWh and PHP 5/kWh (USD 1 = PHP 45.85). Optimization results are tabulated in Supplementary Material Table S6.
Wevj 10 00051 g005
Figure 6. Option values at different government subsidies for investment in the e-jeepney. Baseline = 5% subsidy; 10% sub = 10% subsidy; no sub = removal of subsidy. Optimization results are tabulated in Supplementary Material Table S7.
Wevj 10 00051 g006
Table 1. Financial estimation results using traditional valuation methods.
Valuation MethodE-JeepneyModernized Diesel Jeepney
Net present value (NPV) (USD)4.892 million3.138 million
Payback period (PBP) (years)4.093.28
Return on investment (ROI) (30 years)373%490%
Internal rate of return (IRR) 32.3643.89

