Article

Dynamic Wireless Power Transfer Charging Infrastructure for Future EVs: From Experimental Track to Real Circulated Roads Demonstrations †

by
Stéphane Laporte
1,*,
Gérard Coquery
1,
Virginie Deniau
2,
Alexandre De Bernardinis
3 and
Nicolas Hautière
4
1
VEDECOM Institute, 23 bis allée des Marronniers, 78000 Versailles, France
2
IFSTTAR, LEOST, 20 rue Élisée Reclus, 59650 Villeneuve D’Ascq, France
3
IFSTTAR, SATIE, 25 Allée des Marronniers, 78000 Versailles, France
4
IFSTTAR, COSYS, 4-20 Boulevard Newton, 77420 Champs-sur-Marne, France
*
Author to whom correspondence should be addressed.
This paper is an extended version of a paper presented at 32nd International Electric Vehicle Symposium 2019 (EVS 32), Lyon, France, 19–22 May 2019.
World Electr. Veh. J. 2019, 10(4), 84; https://0-doi-org.brum.beds.ac.uk/10.3390/wevj10040084
Submission received: 11 October 2019 / Revised: 18 November 2019 / Accepted: 19 November 2019 / Published: 24 November 2019

Abstract

:
In a context of growing electrification of road transport, Wireless Power Transfer (WPT) appears as an appealing alternative technology as it enables Electric Vehicles (EVs) to charge while driving and without any mechanical contact (with overhead cables or rails in the ground). Although the WPT technology background dates from the end of 20th century, recent advances in semiconductor technologies have enabled the first real demonstrations. Within the FABRIC European project, the French research Institute VEDECOM and its partners implemented a whole prototype wireless power transfer charging infrastructure. The first demonstrations of Inductive WPT in different real driving conditions (up to 20 kW, from 0 to 100 km/h, with one or two serial vehicles) were provided. This paper describes the prototype equipment and its instrumentation and provides the system characterization results. The future of the Inductive WPT technology is further discussed considering its different technical and economic challenges. In parallel, how this technology could be part of future generation road infrastructures is discussed. Future research and demonstration steps are presented in the conclusion.

1. Introduction

The decarbonation of road transport will largely rely on electromobility deployment for the next decade in Europe and worldwide. In [1] (p. 80), the International Energy Agency (IEA) predicts that Electric Vehicles (EVs) will reach a market share (or sales share) of 26% in China and 23% in Europe by 2030, taking into account road transportation modes. As EV penetration grows, so will the number of the associated charging infrastructures.
Commercially available EVs rely on conventional wired charging technologies currently deployed in growing charging infrastructures [2]. From a user’s point of view, the charging experience is quite different from what it used to be with Internal Combustion Engine (ICE) vehicles: On the one hand, mass market EV Renault Zoe’s fastest charge is minimum 30 min. with current 50 kW DC chargers for 150 km additional autonomy [3]. On the other hand, the ICE equivalent vehicle category, such as Clio, has at least double autonomy for a charging time of just a few minutes [4].
Thus, even if the energy density of Electric Vehicle Batteries (EVB) and transferrable power levels with wired charging technologies improve continuously, the gap to reach ICE vehicles’ charging performances and user charging experience is still significant and will probably not be filled in a decade. In addition, some new issues limiting or delaying the deployment of the improved conventional wired technology might even appear (cable handling, for instance). Fortunately, electromobility offers alternative charging solutions which are worth exploring or re-exploring in light of recent technology improvements.
Electric Road Systems (ERS) as described in [5] (p. 1) are now entering the “Valley of death” after their pleasant journey in the landscape of research. These complex systems include dynamic charging technologies which are attractive alternatives since they do not rely on large and heavy batteries. Indeed, they directly and efficiently get power while moving along a road, therefore saving battery size as well as dedicated charging time and space.
Among these technologies, overhead conductive charging has been deployed successfully for buses in urban roadways since the beginning of the 20th century (with traditional pantographs conveying current from overhead wires). Overhead conductive charging for trucks and High Duty Vehicles (HDV) is still in its experimental stages [6] in dedicated highway lanes. Ground conductive charging has been tested in Sweden on a dedicated lane and a wide range of vehicles from passenger cars to HDV [7]. These technologies can be considered as mature technologically in their original field of application (guided transport). However, considering the many use cases addressed by non-guided transports, they are not fully robust or interoperable yet. Many technical papers have reviewed the advantages and drawbacks, infrastructure costs and viability aspects of these technologies [8] (p. 56), [9,10,11].
Wireless charging solutions are at the origin of more than a century-old Roadway-Powered Electric Vehicle (RPEV) concept, as recalled in [12]. These solutions can be viewed as being the ultimate alternative solution for conventional plug-in EV charging issues. Indeed, in addition to the benefits of charging while moving, they suppress the hazards of electricity transmission from a moving object to a fixed one through mechanical contact.
As recalled by Cirimele [13] (p. 2), electricity wireless transmission has been the object of research interest for centuries [14,15,16]. Wireless transmission of power has always been a goal since the founding of Electrical Engineering as emphasized by Grant in [17] (p. 1277). In the last decade, the scientific community has defined as Wireless Power Transfer (WPT) as the different ways to transfer energy in a wide range of applications. Amongst the different WPT methods listed in [13] (p. 2), in [18] (pp. 2–3) or [19] (p. 4), this work is focused on resonant Inductive Power Transmission (IPT) for EVs.

2. Fundamental Research Background and State of the Art of IPT Applications to Non-Guided Surface Transport

IPT principles are based on Ampere’s law of 1820 and magnetic induction discovered by Faraday in 1831. As also recalled in [13] (p. 2), Nicolas Tesla, one of the fathers of wireless power transmission, presented a first contactless system [20]. He patented another apparatus for wireless electricity transmission using inductors over a long distance in 1893 and identified later [21] two important parameters for inductive transmission:
-
The increase of frequency to improve the power transfer capability.
-
The use of capacitors connected to the coils to create a resonant system and improve effectiveness.
The elementary components and functionalities of a resonant inductive WPT system are recalled in [13] (pp. 3–4) and [17], (pp. 1278–1279) or [22] (p. 30).
The first attempt to couple significant power was patterned in 1894 by Hutin and Leblanc [23]. A first real application of the IPT for an EV was done in 1943, but with extremely poor efficiency [24]. Table 1 resumes the main IPT demonstrations listed by Grant [17], Cirimele [13], Jang [25], Brecher [26], Panchal [27] and Qiu [28].
Improved performances of the power electronic devices at frequencies above the tens of kilohertz, and with current between tens and hundreds of Amperes, have raised considerable interest for researchers and industries in IPT technologies since the 1990s. Successful commercialization initiatives with buses in static/stationary use cases are recalled in Table 1.
The first static IPT applications up to 20 kW are reported in the automotive sector in [13] (p. 7) since 2011 and in [37,38]. The commercialization of the first static IPT systems has started recently [39]. IPT transition from static to dynamic exploration is beginning. Oak Ridge National Laboratory (ONRL) announced the first demonstrations of slow Dynamic IPT at 20 kW in an adapted serial car and in laboratory conditions in 2016, thus bringing the Technology Readiness Level (TRL) to a value of 4–5 according to the standard classification [40]. Many other research projects have investigated the broad aspects of dynamic IPT [13] (p. 8) in Europe and all over the world.
The goal of the FABRIC European project, which started in 2014 and finished mid-2018 [41], was to assess the feasibility of different on-road charging technologies for the range extension on EVs and pave the way for future potential deployments. In order to bridge the gap between laboratory and operational environment, the specifications for the IPT demonstrations operated by the FABRIC partner VEDECOM in collaboration with Qualcomm CDMA Technologies GmbH (Qualcomm) and Renault were set as follows [42] (p. 571):
-
The fixed part of the Dynamic IPT system should be integrated in a representative road environment, enabling easy access for tune-up and maintenance
-
The mobile part of the Dynamic IPT system should be integrated in a serial car
-
The IPT system should enable
Charge from 0 to 100 km/h (to cover speed range for urban to highway use cases)
Operate at 85 kHz. This frequency is in compliance with the emerging standardization objective issued from the industry considering difficulty of meeting Electromagnetic Field (EMF) and Electromagnetic Compatibility (EMC) requirements, packaging on vehicle, mass and volume, comparative cost of power electronics as explained in [43] (p. 10)
Charge of two vehicles on a 100 m test track (to ensure a minimum representativity at reasonable project cost)
Charge up to 20 kW (which is representative of the traction power needed for a small passenger car at highway speed)
With these specifications, the technology objectives were set up to a TRL 6–7 since the demonstrations were designed for a relevant environment, particularly as far as it concerns:
-
Road integration: the previous demonstration of dynamic IPT charging on a passenger car was done in laboratory conditions [35]. This demonstration is intended in a real civil engineered road and in real climatic conditions
-
Driving conditions: the previous demonstration of dynamic IPT charging on a passenger car was done from stationary to low speeds [35]. This study was designed from stationary to highway speed (100 km/h)
-
Number of passenger vehicles demonstrated: single vehicle charging was previously demonstrated [35]. The Versailles-Satory charging scenario for FABRIC involves two vehicles
-
Operating frequency: from Table 1, previous demonstrations were done at operating frequencies between 15 and 25 kHz. This demonstration was designed for a current standard operating frequency of 85 kHz.
This paper provides an extensive outlook on the Versailles-Satory demonstrations and lessons learned within the FABRIC project. In particular:
-
It describes the experimental road infrastructure implemented, the additional equipment integrated in a serial car, the characterization means, and methods used. Finally, it provides most recent investigations’ methodology (Section 3, Material and Methods)
-
It resumes the final characterized performances and safety assessment of the prototype system, provides the latest results and discussions (Section 4, Public Demonstrations, Validation Result and Discussions)
-
It concludes on the results achieved vs. the initial objectives (Section 5, Conclusions) and on the next use cases which should be further demonstrated. Finally, it describes the remaining gaps to be bridged and how further developed IPT systems could find their place in future ERS ecosystems.

3. Material and Methods

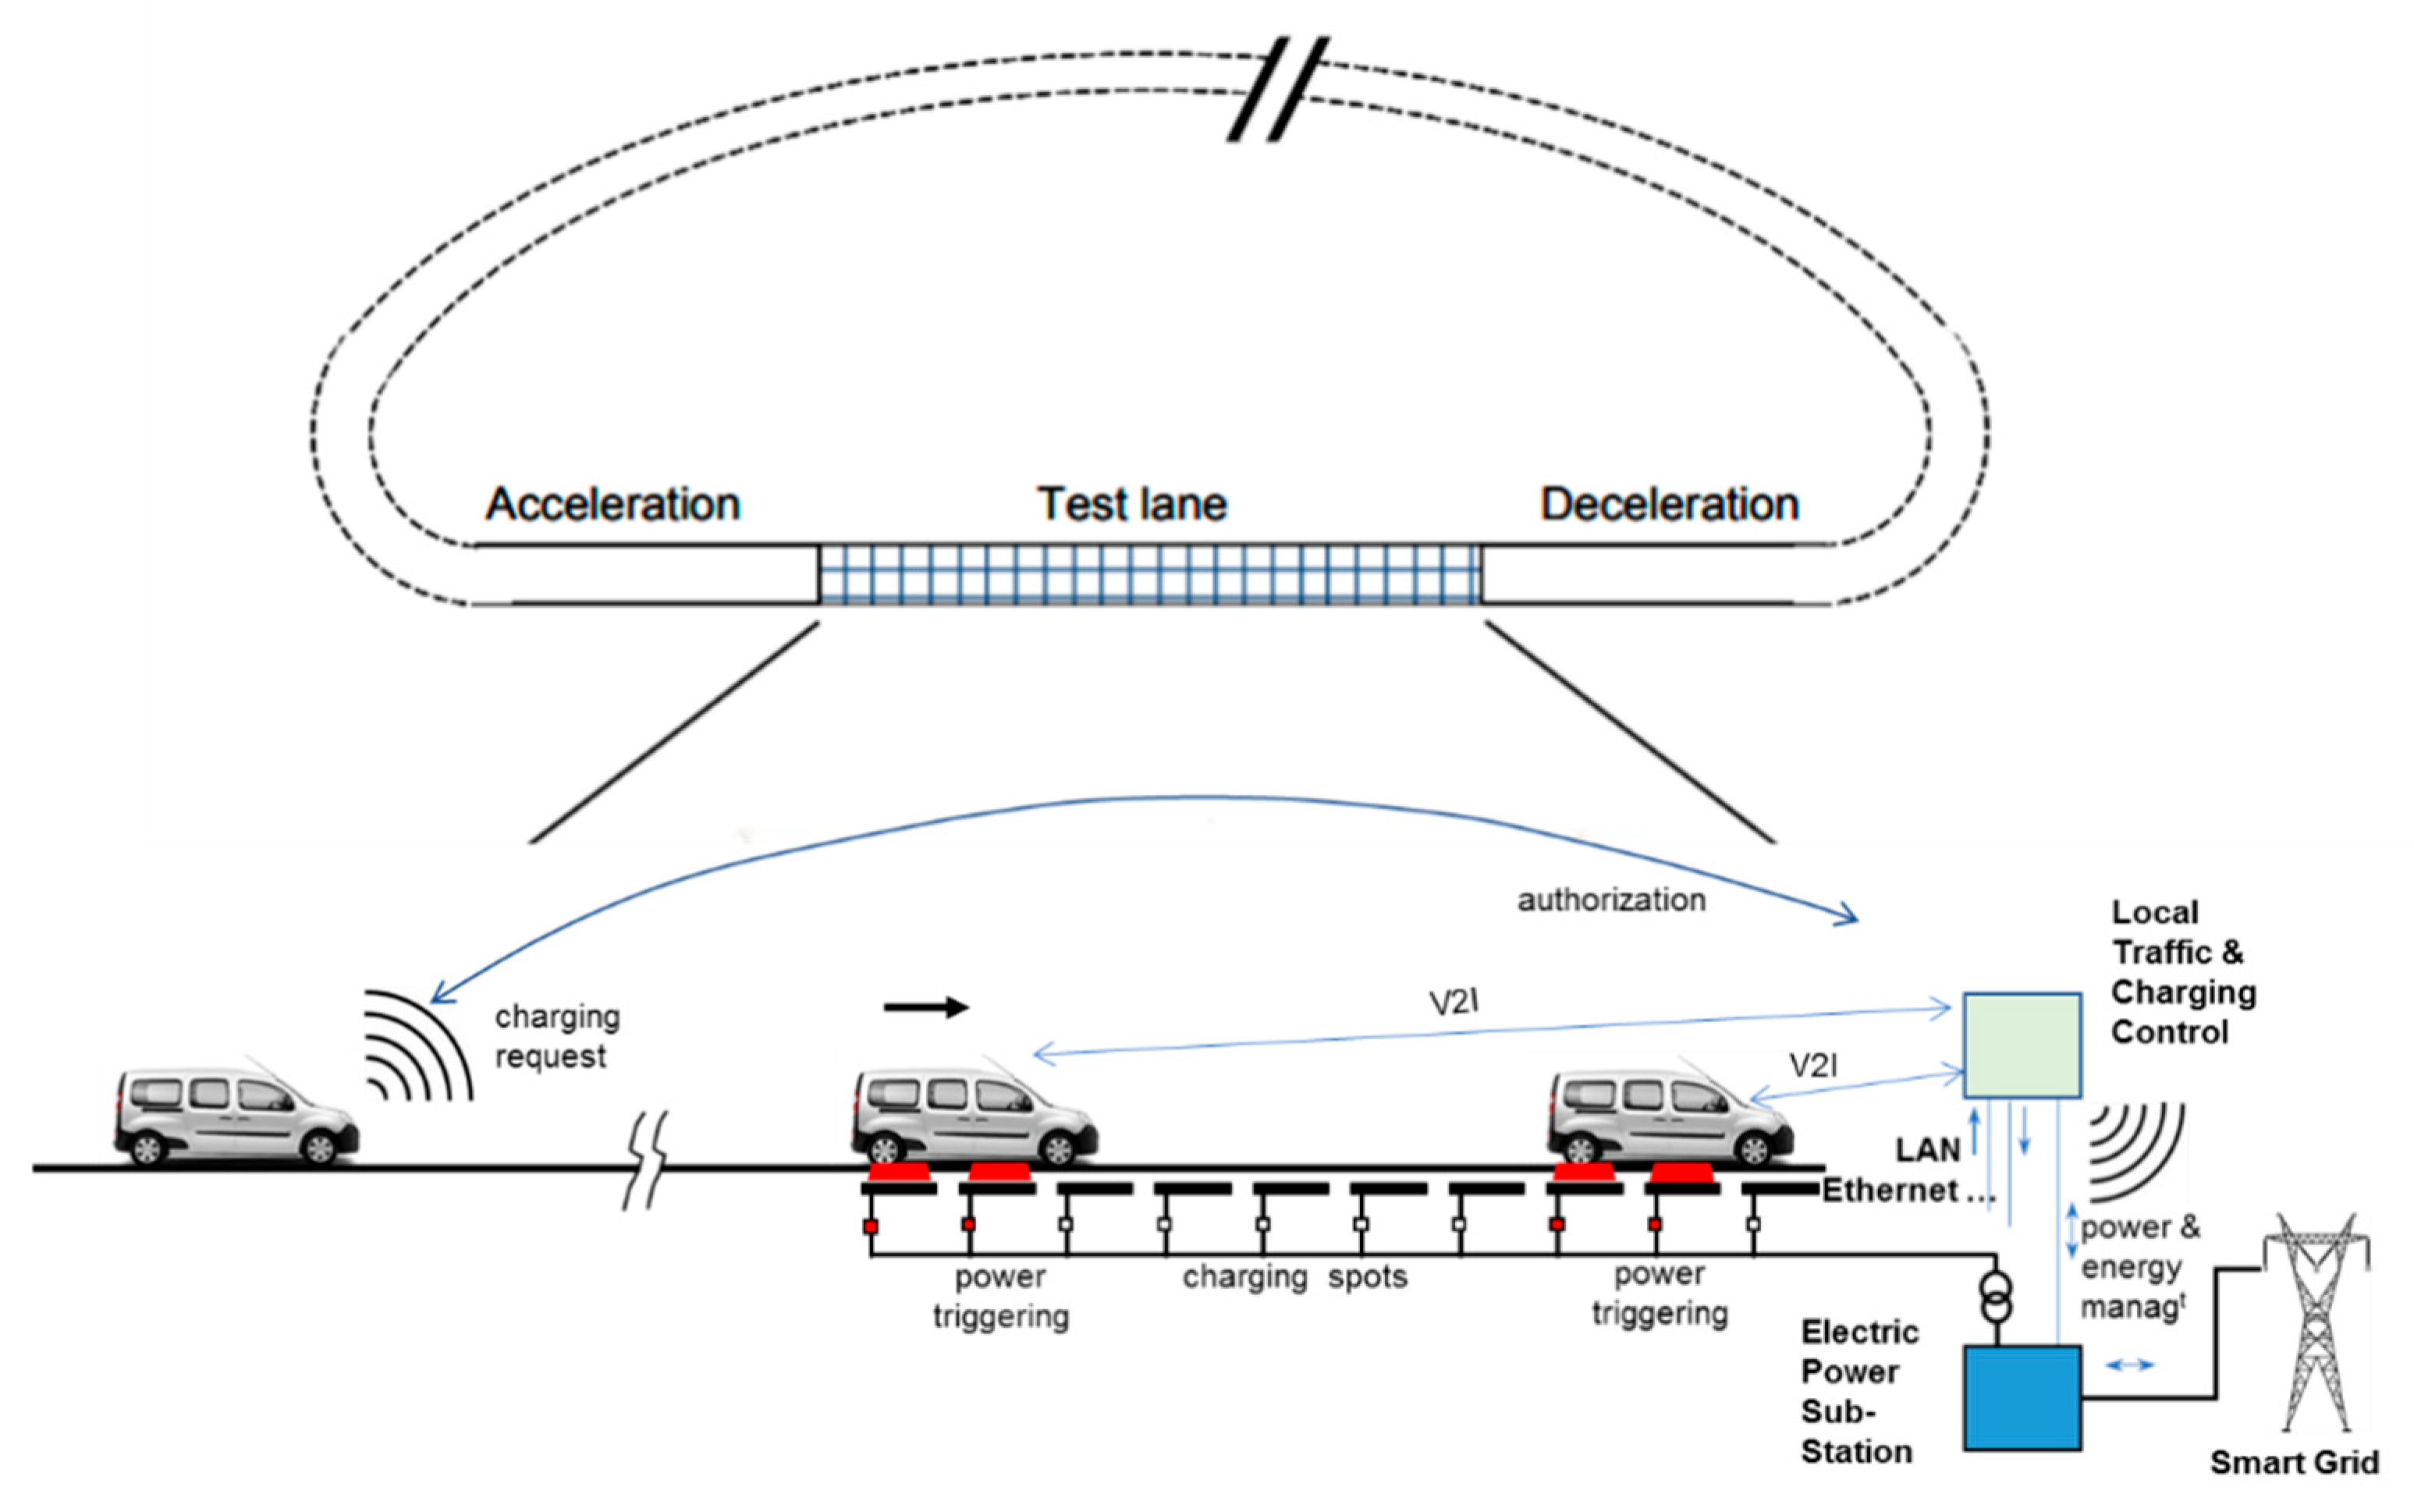
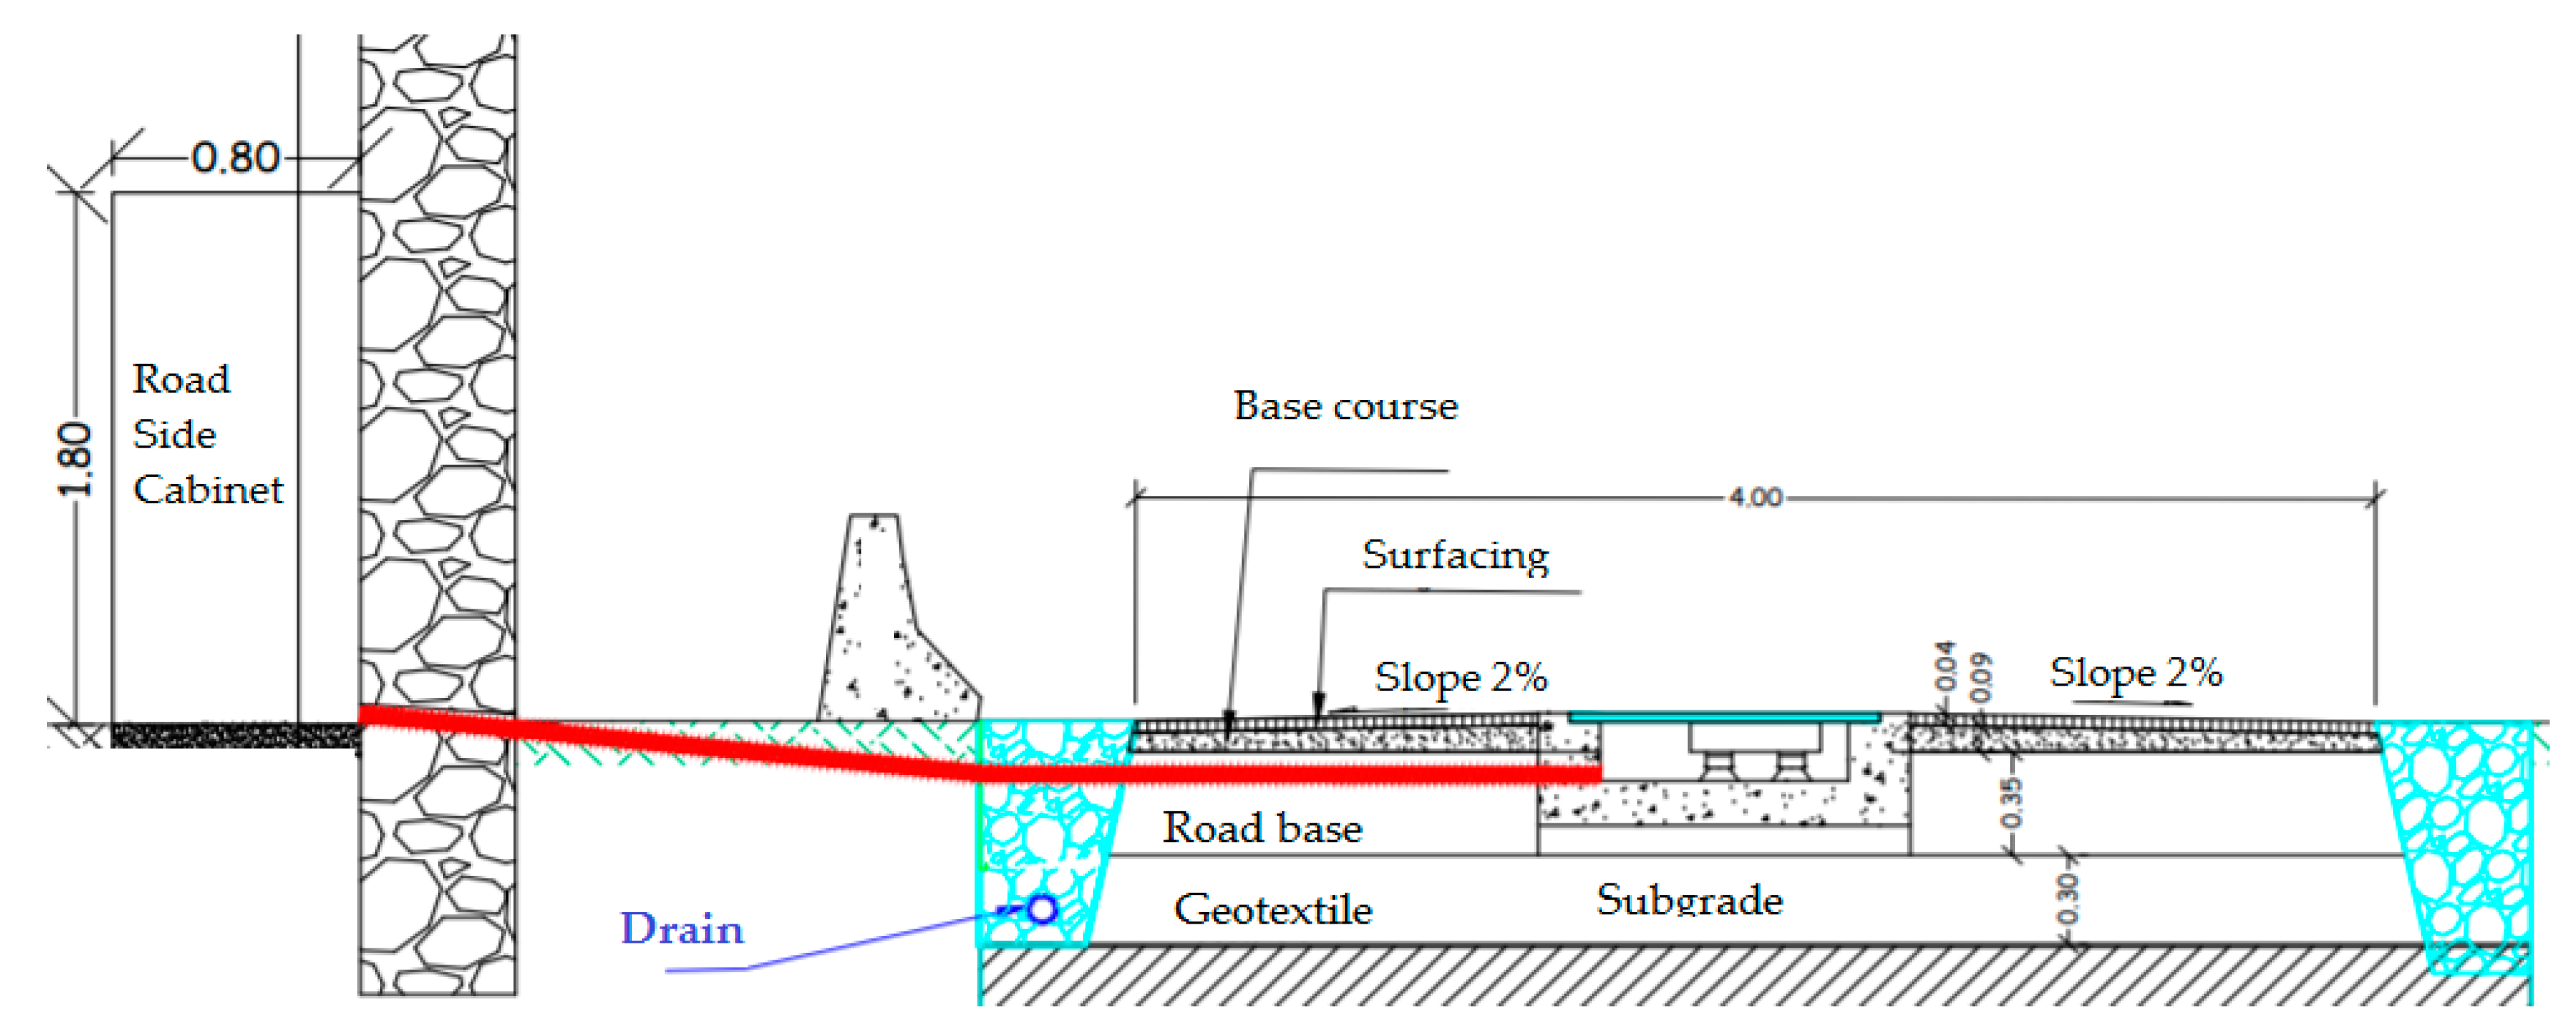
3.1. Road Infrastructure

The overall concept of the Versailles-Satory demonstration for the FABRIC project was to adapt the FABRIC experimental road to the existing test tracks of the Versailles-Satory test site. The original Dynamic Wireless Power Transfer (DWPT) system was provided by Qualcomm. The general track configuration is described in Figure 1 below:
This experimental charging lane concept was developed to meet the different FABRIC project use cases expectations and to allow the simultaneous presence of two vehicles, analysis of the various transitions and the stabilization of charging. A minimum length of 100 m was required for speeds of a minimum of 60 km/h and with an effort to reach 80 km/h. Various power levels were to be tested; the target was to experiment a power flow up to 20 kW at high speed. As a complement to any electric on and off-board data measurement, precise positioning of cars and magnetic field emissions measurement close to the track would be available for data logging.
Due to the technology designed by Qualcomm, a part of the power electronic had to be close to the emitter coils. Therefore, it was necessary to have easy access to all components integrated beneath the road surface. The available space was finally set to a cavity 80 cm wide and 20 cm deep formed by a precast central trench, as can be seen in Figure 2.
In order to close this cavity, a special study was conducted in cooperation with IFSTTAR to define the adequate surfacing material. Different design constraints were set: no presence of iron elements, resistance in worst-case braking scenarios, smallest thickness, friction equivalent to road surface, easy opening and closing. These requirements were solved through simulation and testing considering 3 cm thick bolted covers made in highly reinforced glass-fiber material. The final integrated charging lane can be seen in Figure 3.

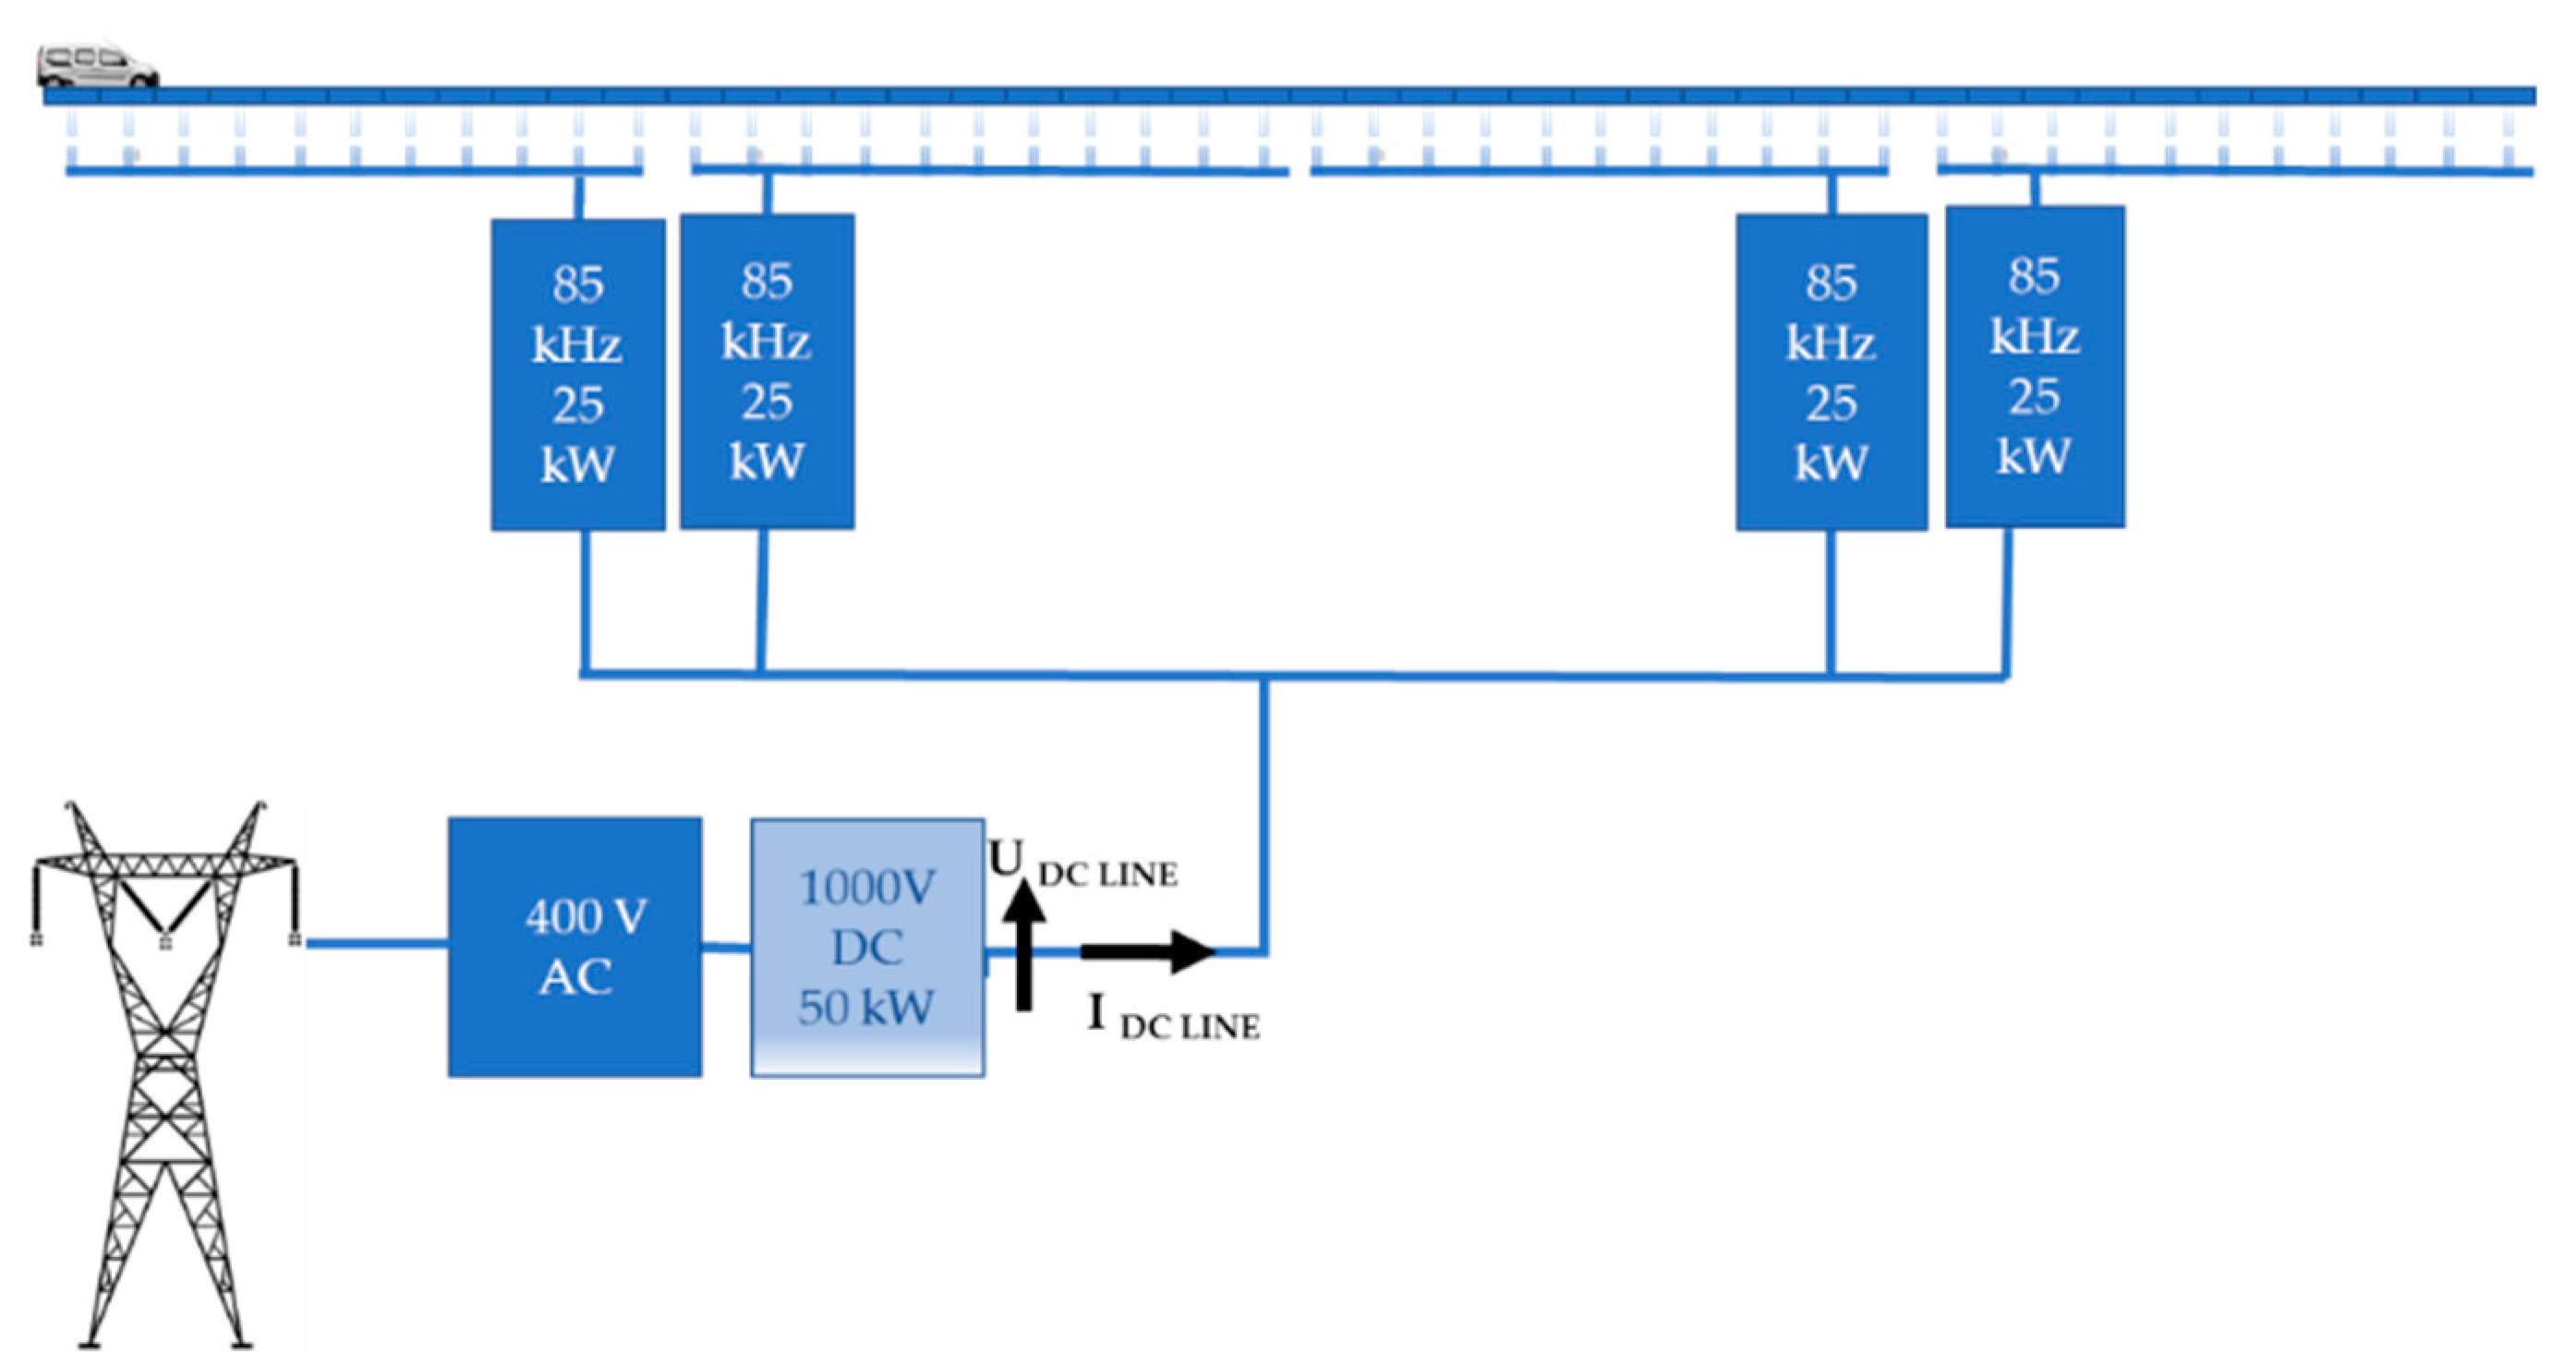
3.2. Electric Infrastructure Integrated with the Dynamic IPT System and Additional Equipement

The DWPT primary system is supplied by a 1000 V DC electrical distribution with 50 kW power along the test lane, as shown in Figure 4.
A transformation cabinet which was implemented close to the experimental track hosts the grid AC/DC transformer as well as the grid power measurement equipment (where UDC Line and IDC Line were measured).

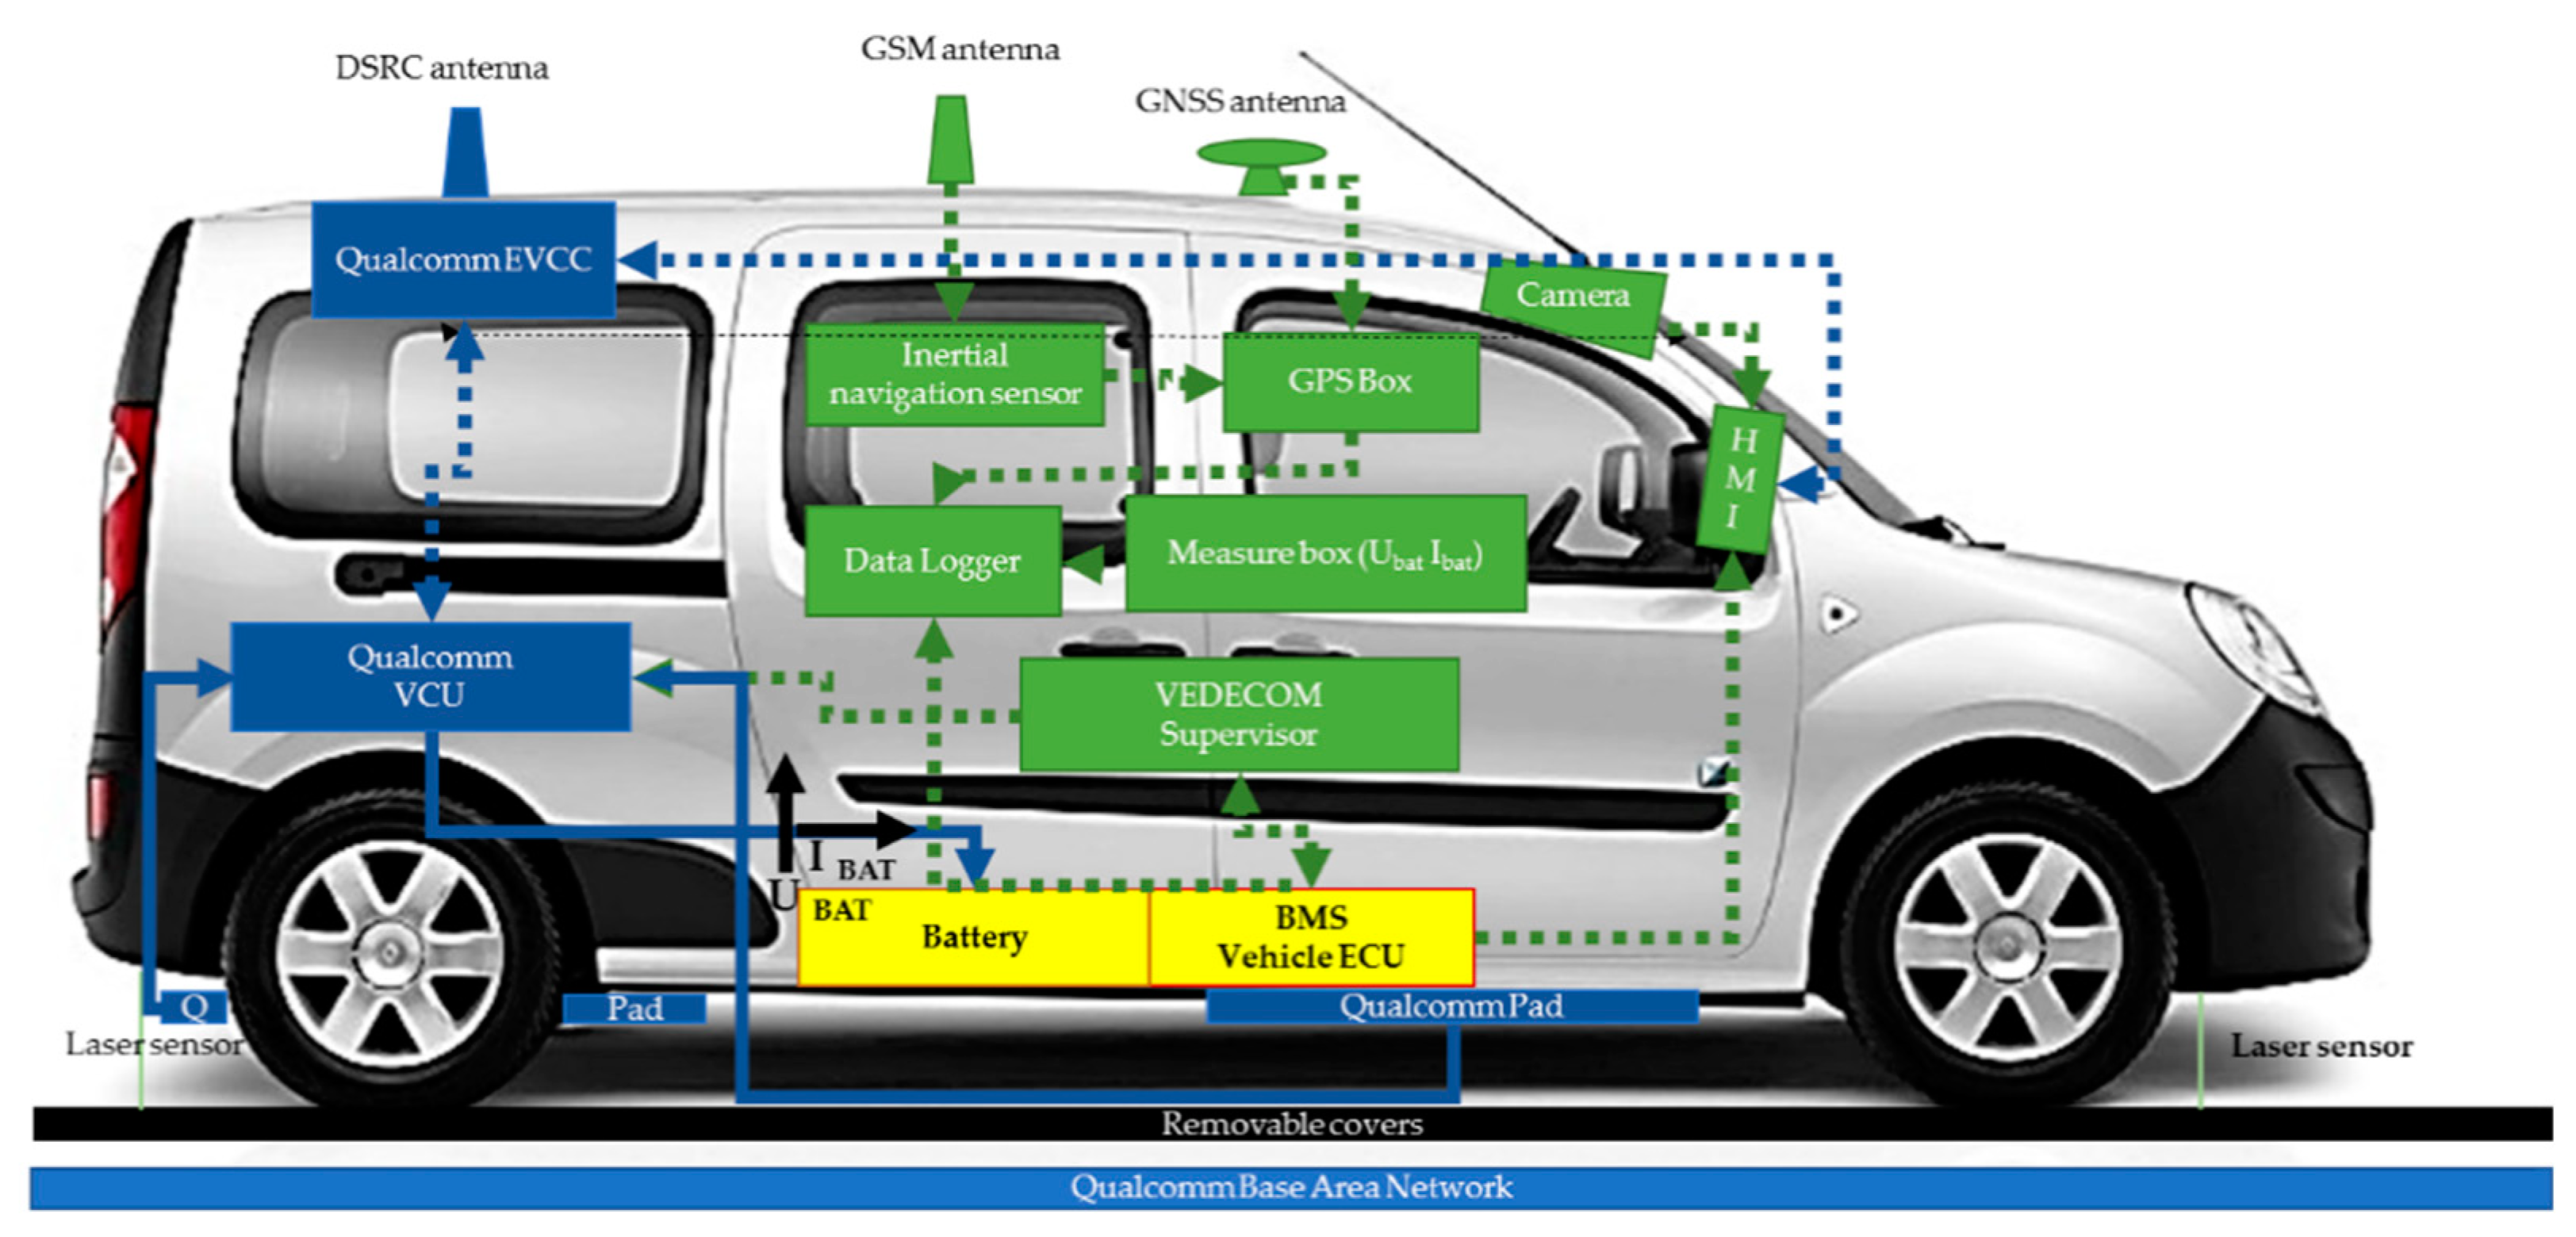
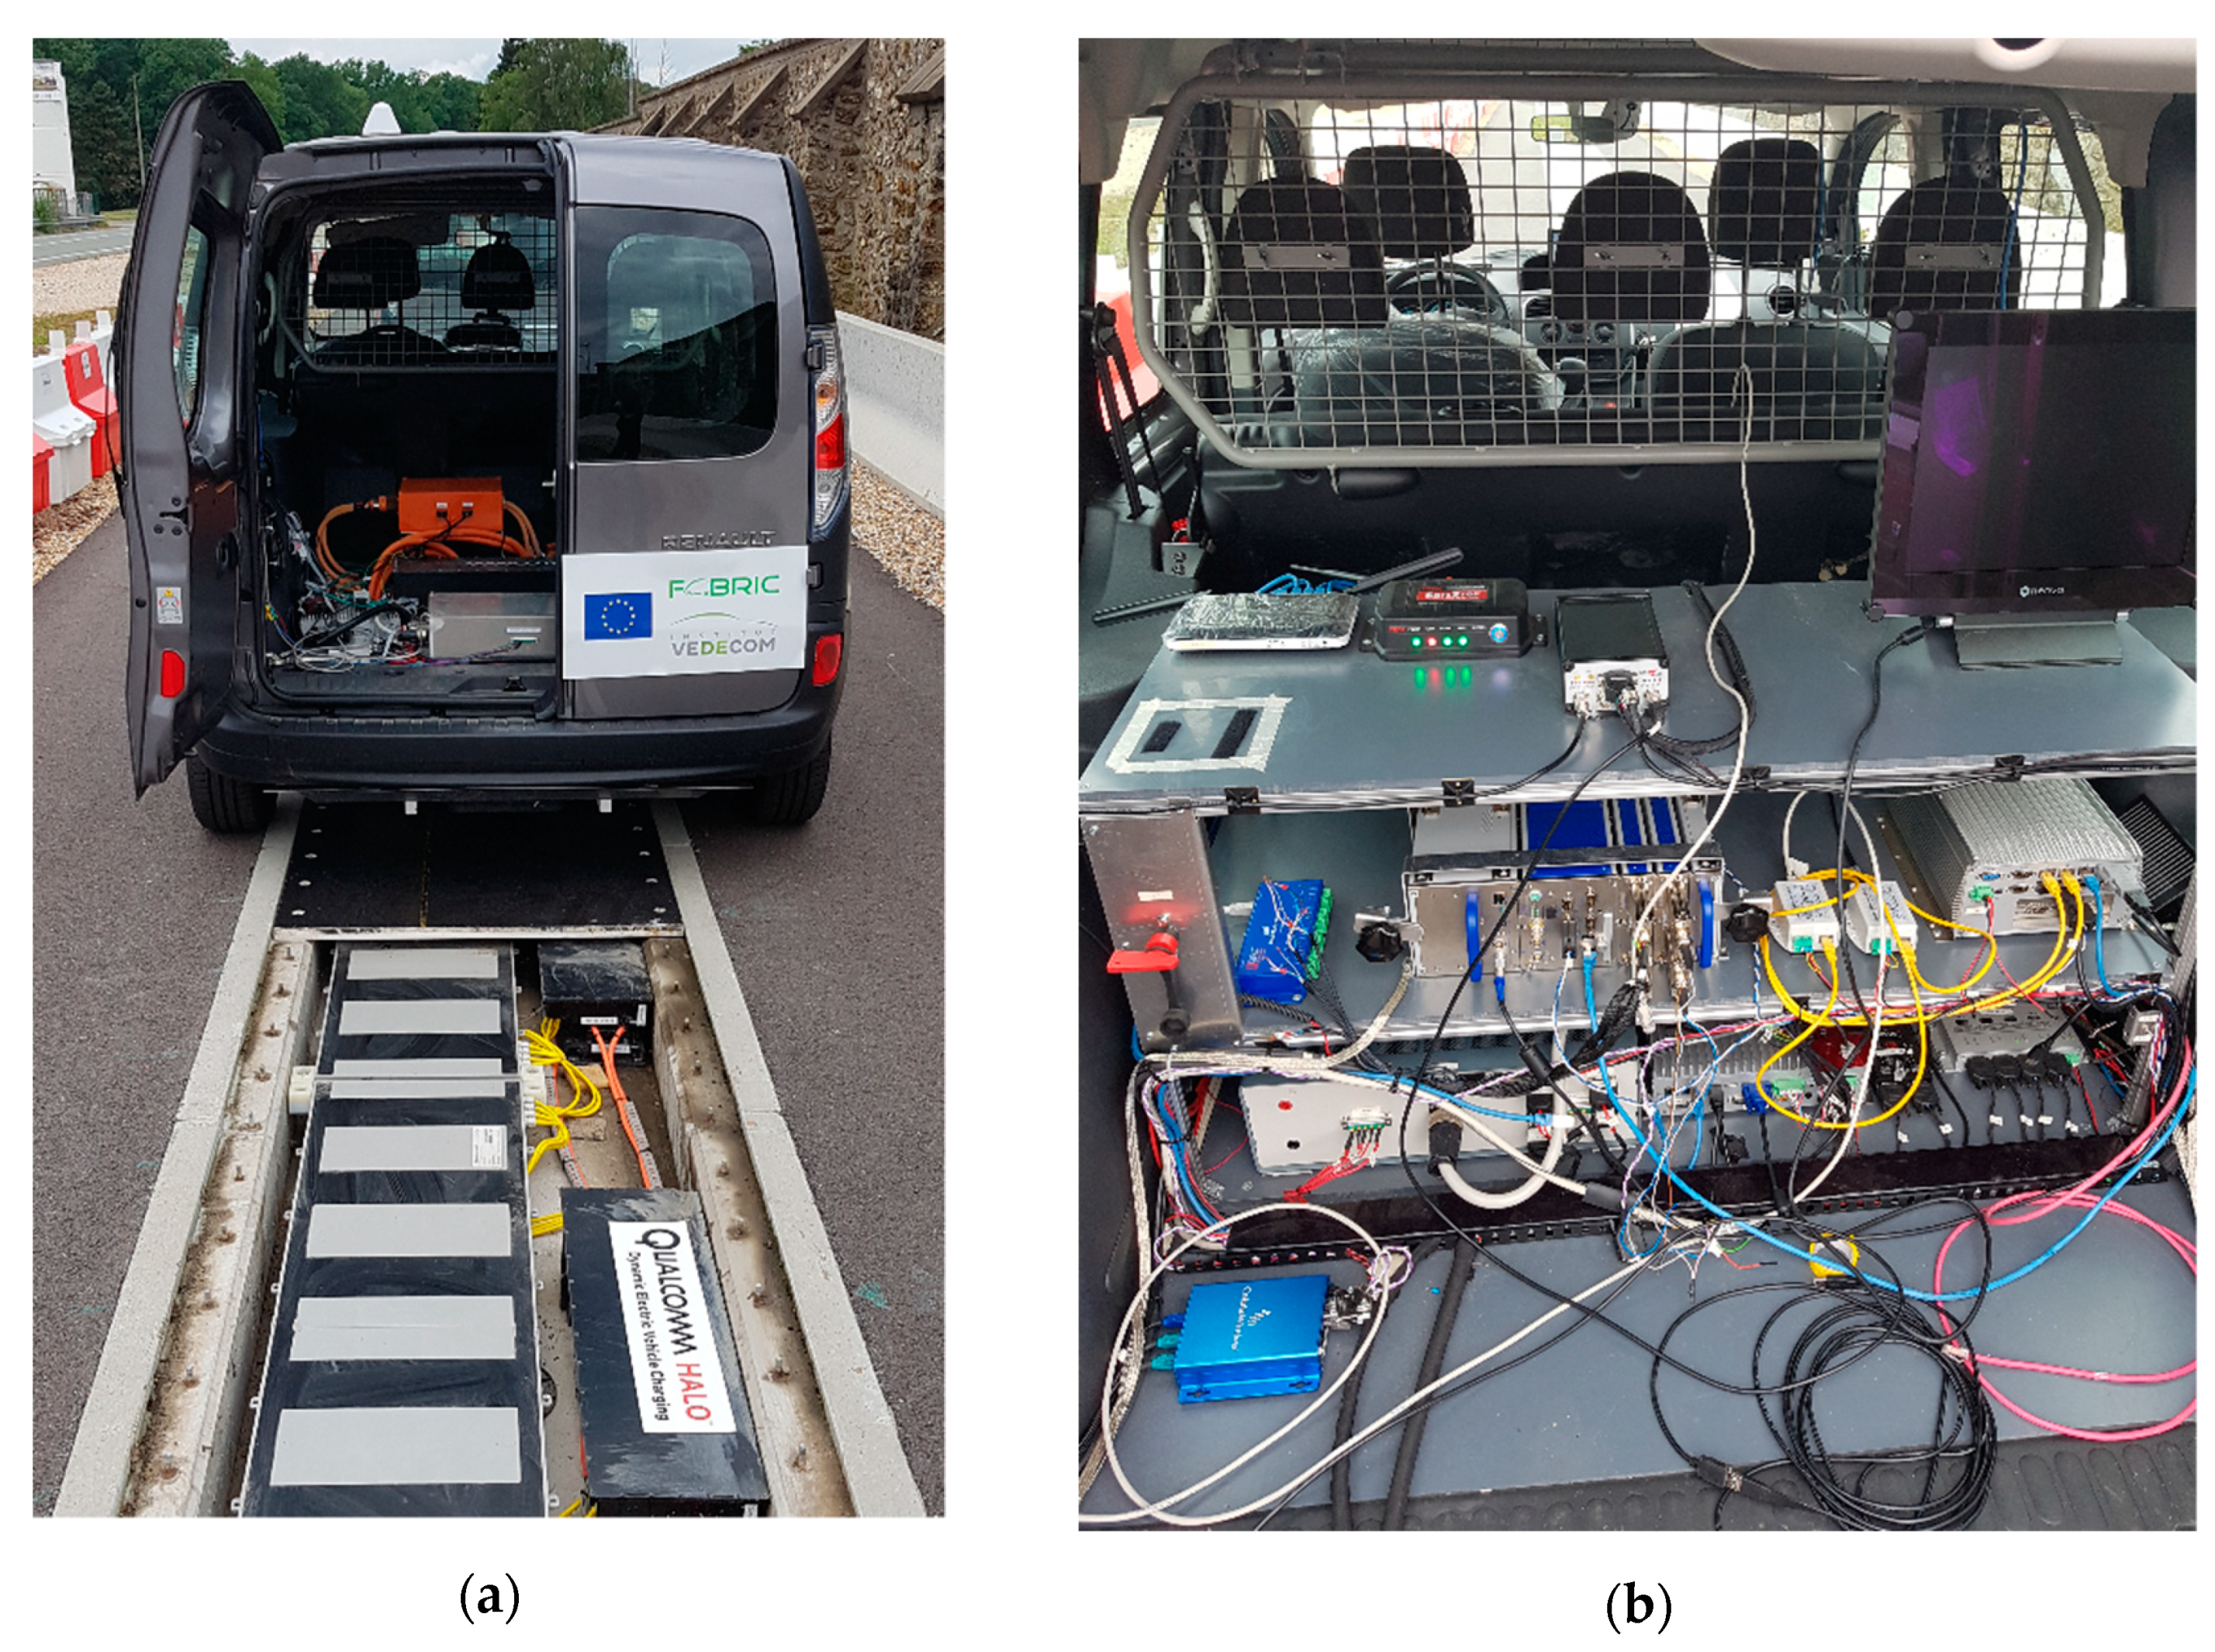
3.3. Serial Vehicle Implemented with Dynamic IPT System and Additional Equipment

Two extended Kangoos were provided for the experimentations by Renault. Two pads containing secondary coils were integrated under the car. These two pads deliver energy to the battery through a Qualcomm power converter, as shown in light blue in Figure 4.
Additional equipment integrated in the car by VEDECOM are displayed in green in Figure 5. They provided the following data:
  • electric measurements (charging current and battery voltage in the measure box)
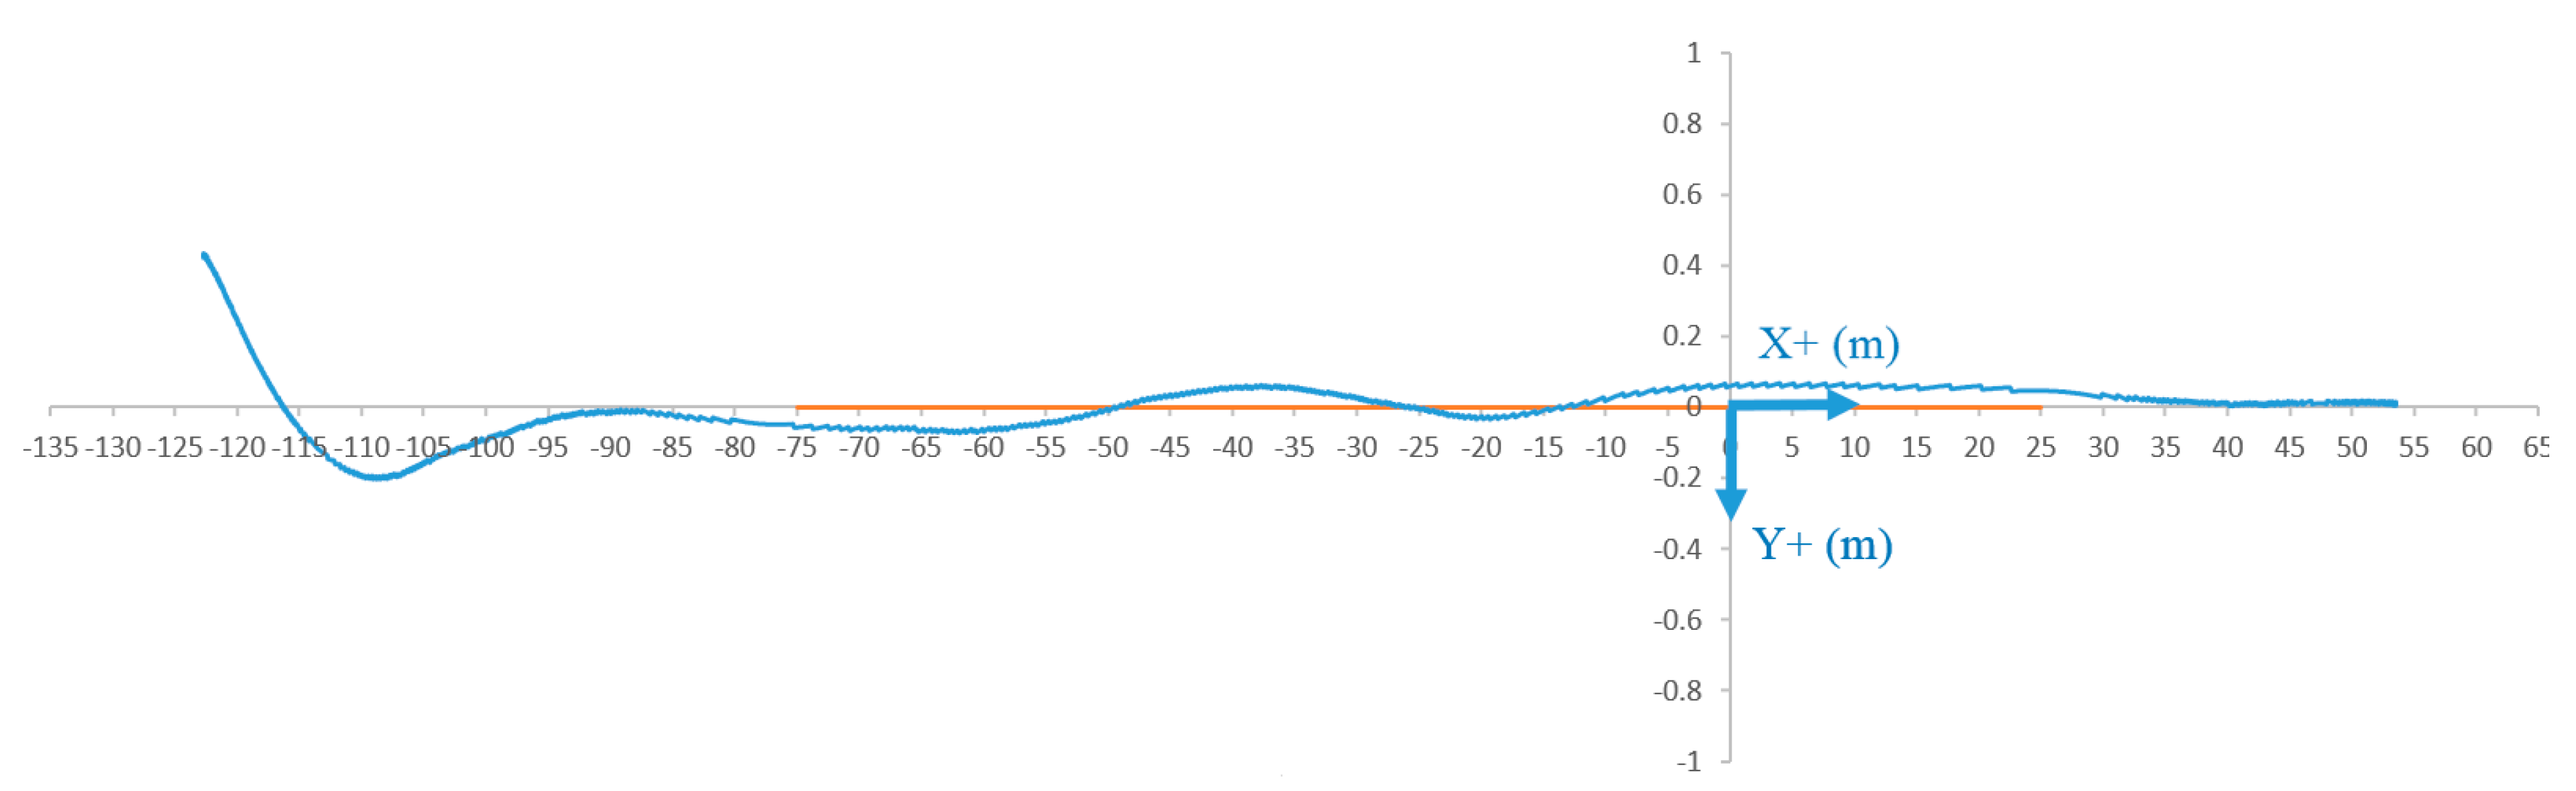
  • misalignment measurements (through data generated by a Global Positioning System (GPS) enhanced by a Real Time Kinematic (RTK) system including inertial navigation sensors)
  • air gap measurements (using four vertical laser sensors)
All the vehicle measurements and car CAN data could be recorded via a multichannel data logger with an adjustable acquisition frequency up to 100 kHz.
The GPS-RTK system, integrated in one prototype car, provided up to centimeter-level accuracy positioning of one reference point of the car (middle of rear axle).
The control/command data exchange between the infrastructure supervision room and the car was done through a Direct Short-Range Communication (DSRC) antenna. All the information was displayed in the car on an Human Machine Interface (HMI) also integrating a real-time misalignment feedback graphic interface (based on a lane detection system developed according the methodology background of [44]), as shown in Figure 6:
The DWPT system was implemented in two car prototypes which can be viewed in Figure 7a,b:

3.4. Vehicle Verifications w/r External Power Source

In order to verify that the vehicle could withstand brutal power variations from an external power source in driving conditions without unwanted BMS warning flags, a specific wheel bench test campaign was conducted. These verifications are detailed in [42] (p. 572).

3.5. Validation of the Integrated Vehicule and Infrastructure Methodology

The vehicle and charging infrastructure validation methodologies are described in detail in FABRIC D4.7.1. [45]. This section resumes the main methodologies and associated results.

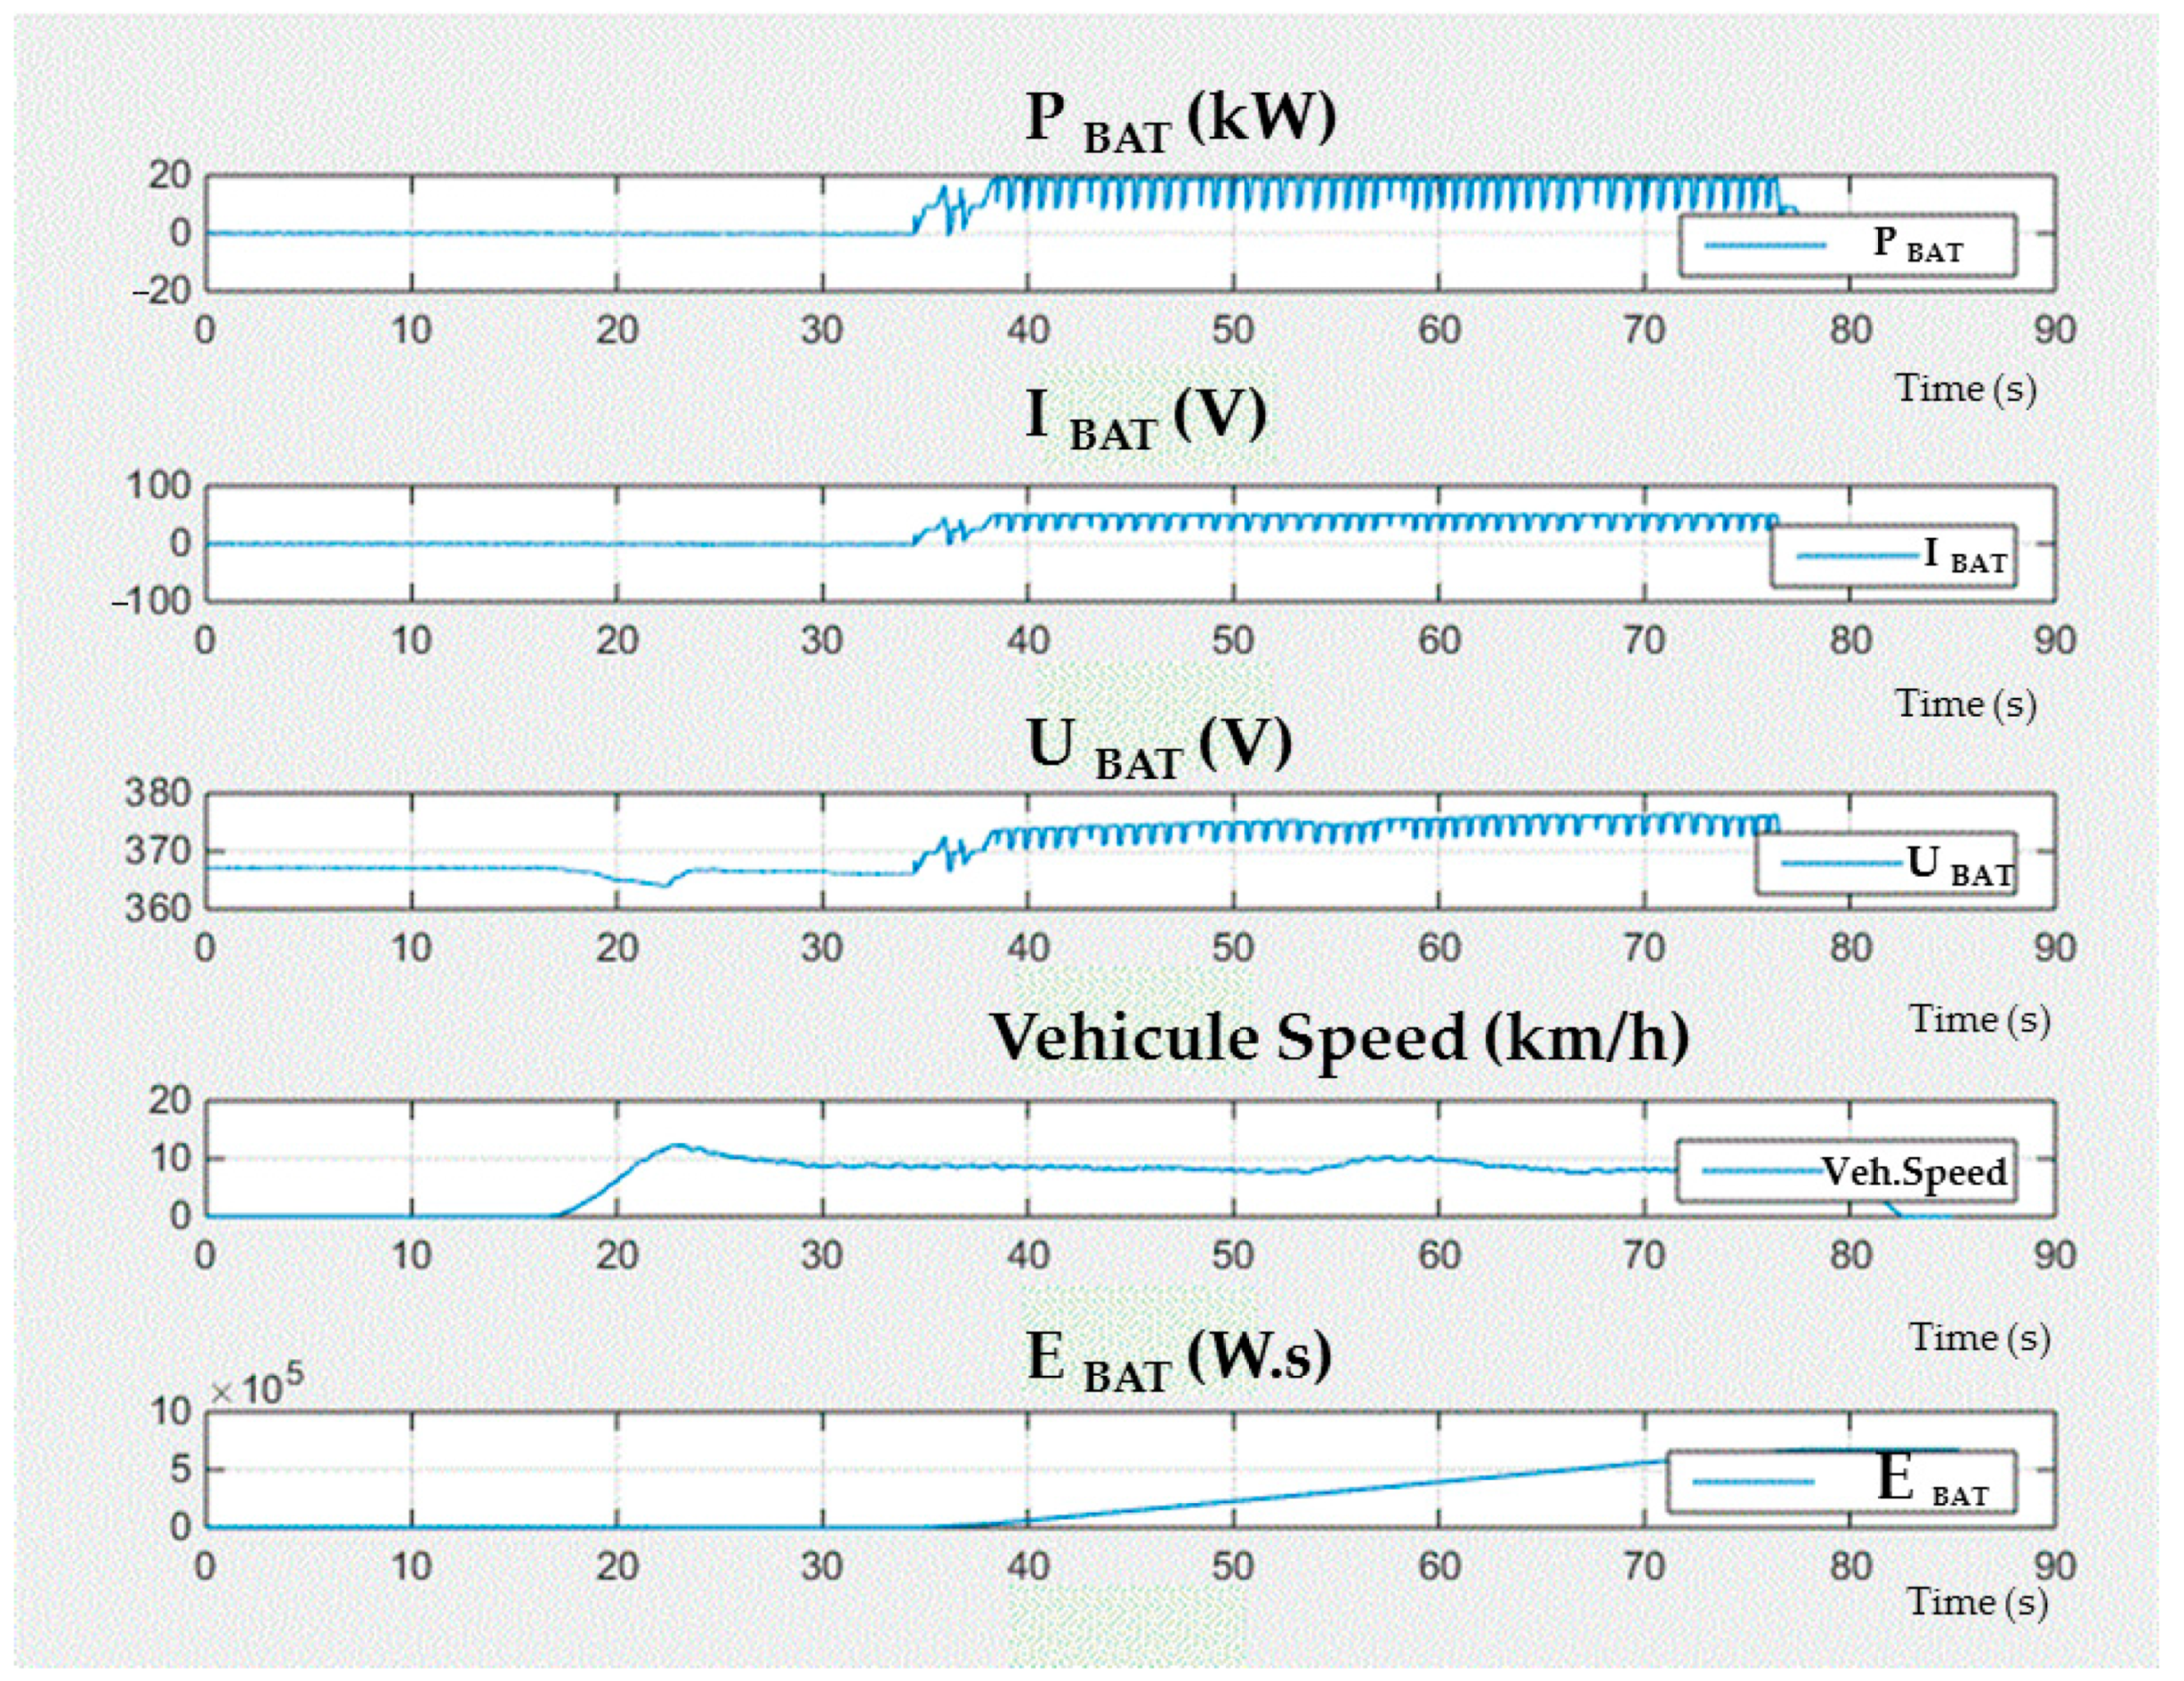
3.5.1. Battery Voltage and Current Shapes Visualization

Current and voltage shapes data (UBAT, IBAT, see Figure 5) were recorded at a 1 kHz sampling rate.
Power (PBAT) and Energy (EBAT) received by the battery were calculated and displayed on a standard graphical output designed under Matlab®.
Power (PDC LINE) and Energy (EDC LINE) sent by the grid after DC conversion were measured and calculated with the Power meter (see Table 2).

3.5.2. Dynamic IPT System Efficiency

The Dynamic IPT system efficiency was calculated after a test run and is defined as the ratio between EBAT and EDC LINE.

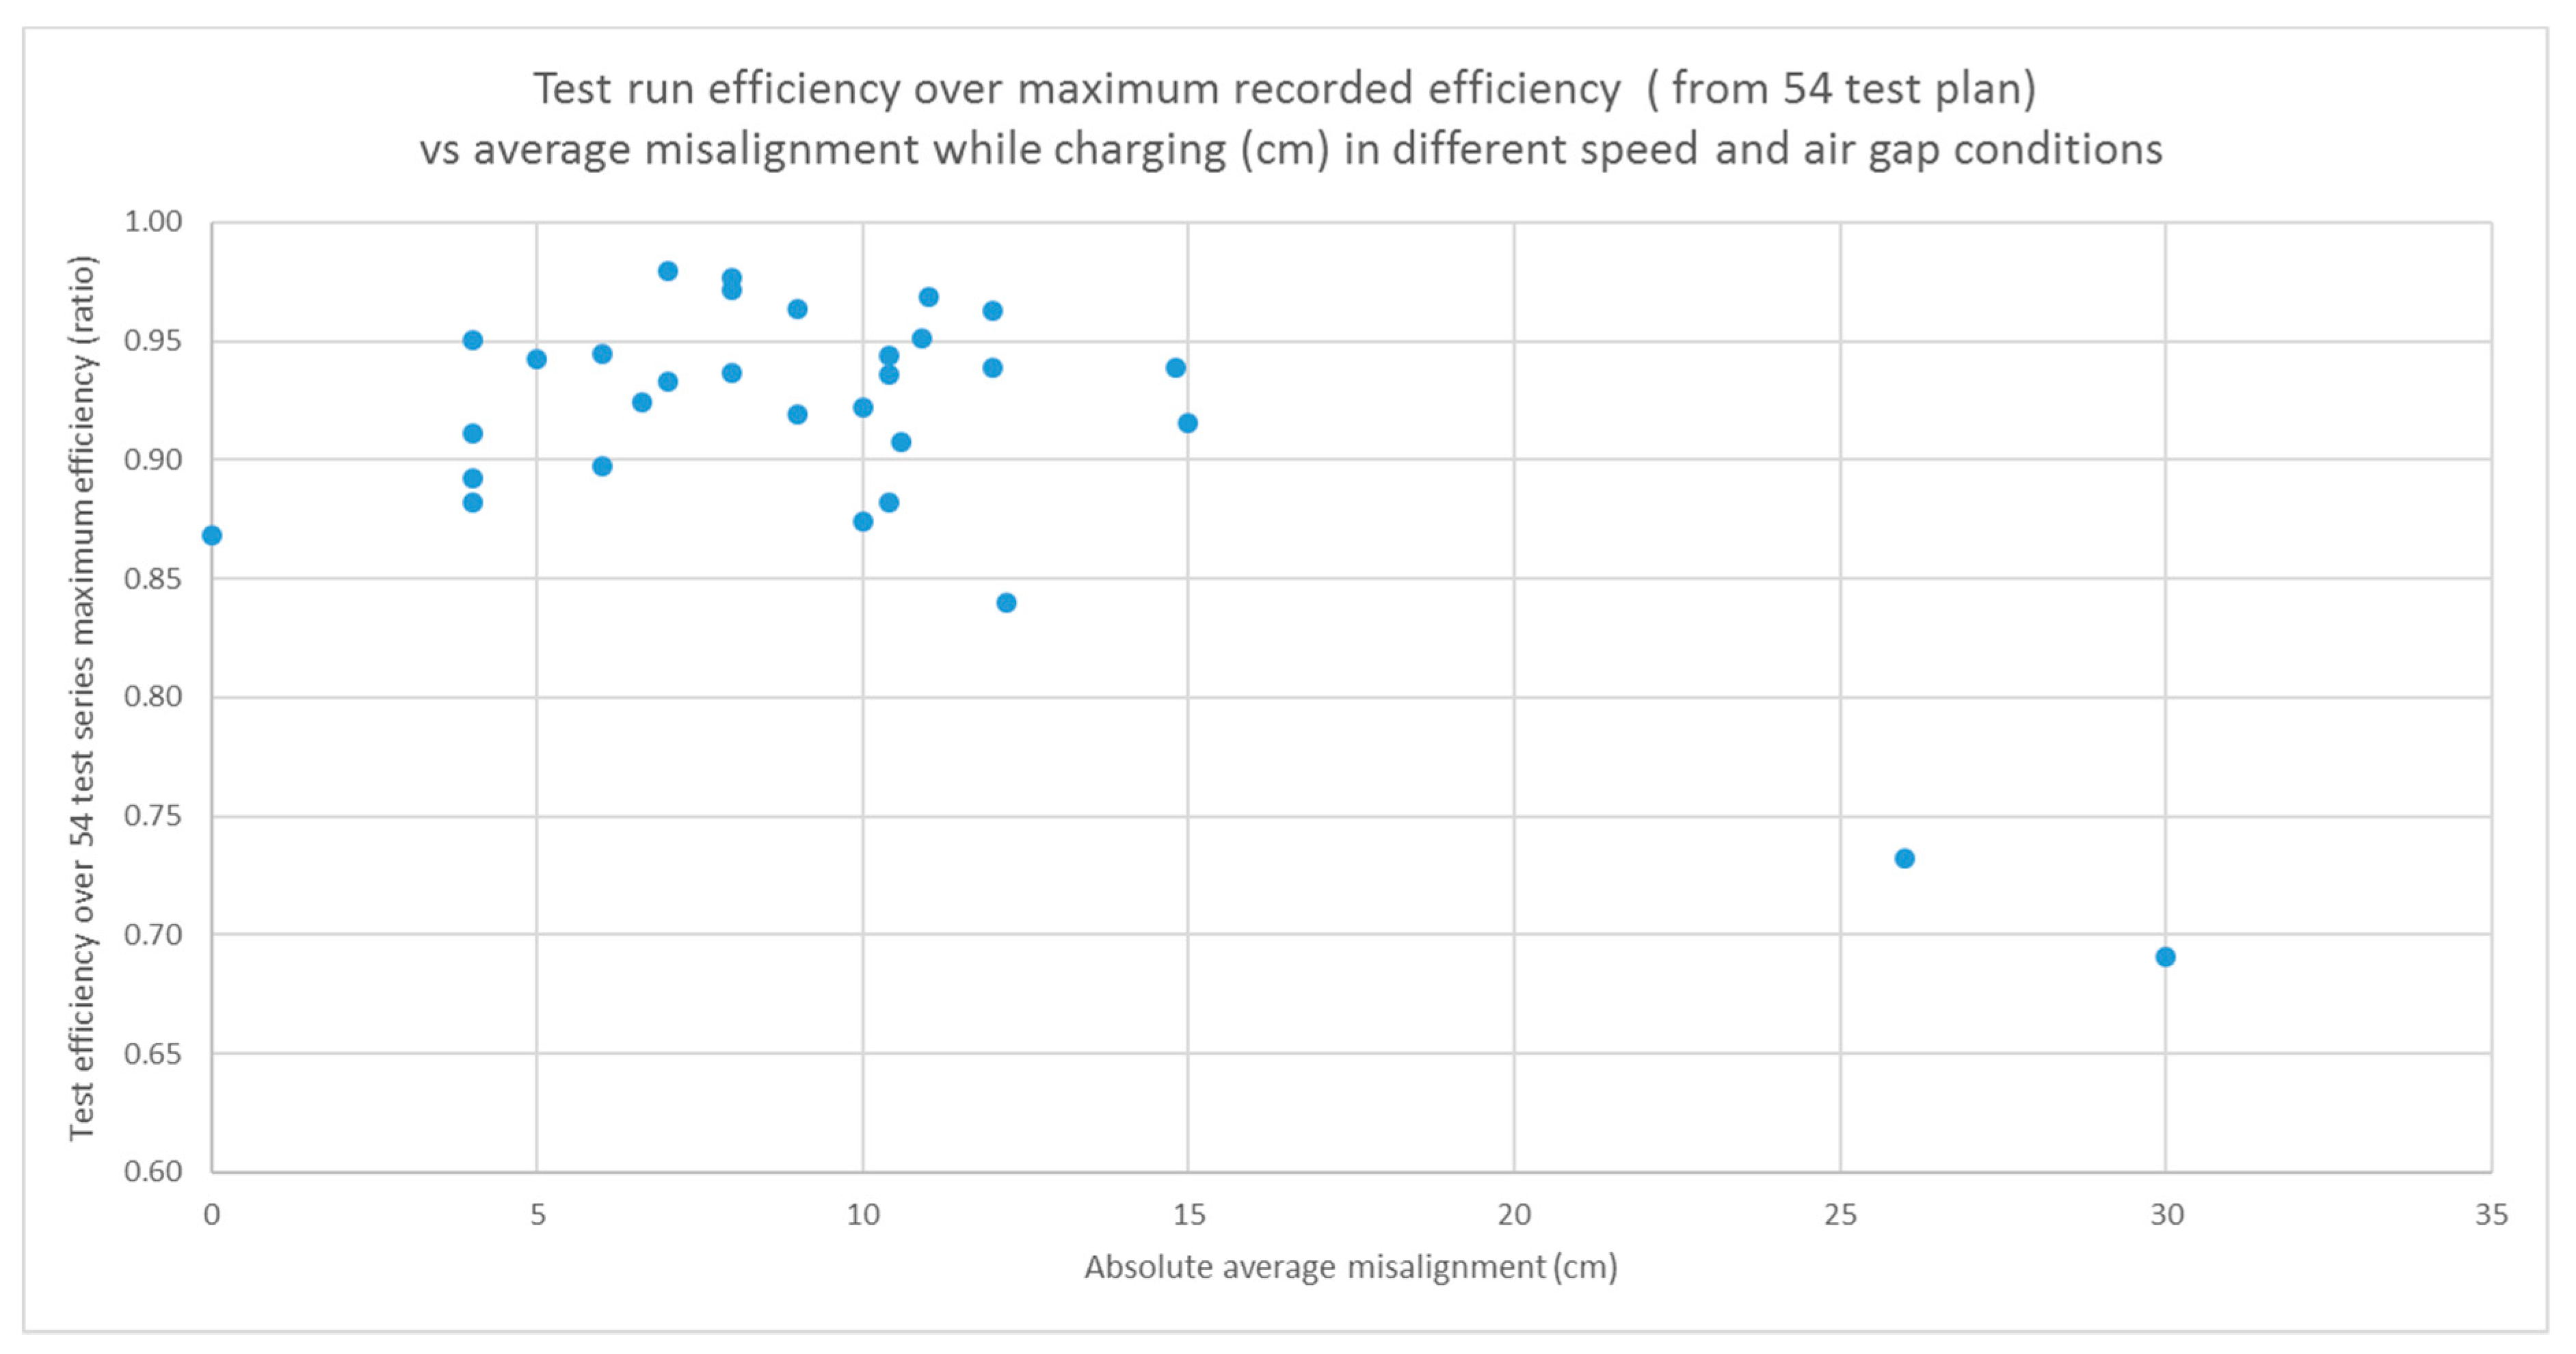
3.5.3. Influence Factors Impact on Efficiency

The system performances were assessed following the FABRIC methodology in many real driving conditions, with lateral misalignment between secondary and primary coils centerlines. Misalignment was calculated from the data provided by the GPS-RTK system described in Section 3.3. The positions of the car reference point (middle of rear axle) were recorded and post-processed using a standard code in java. This code converted geographical coordinates (latitude and longitude) into a Lambert 93 planar coordinate system (most commonly used for autonomous car geolocation procedures). These coordinates were converted into a coordinate system linked to the track. For practical reasons, the origin of the system was taken at the start of the last 25 m section, the x-axis matching the reference line (0 misalignment) pointing in the direction of motion during standard charge, and the y-axis pointing to the right. Figure 8 provides an example of the data generated in this coordinate system.
A 54-test plan was designed to organize the data collection and quantify the impact on charge performance of three influencing factors:
  • Misalignment (three targets: no misalignment, light right misalignment and light left misalignment; the driving objective was to remain in the functioning range of ±20 cm)
  • Air gap (three levels: nominal 175 mm, and two other levels close to the limits of the functional range of ±25 mm)
  • Speed (three levels: 20, 50 and 70 km/h).
Additional details are provided in [42].

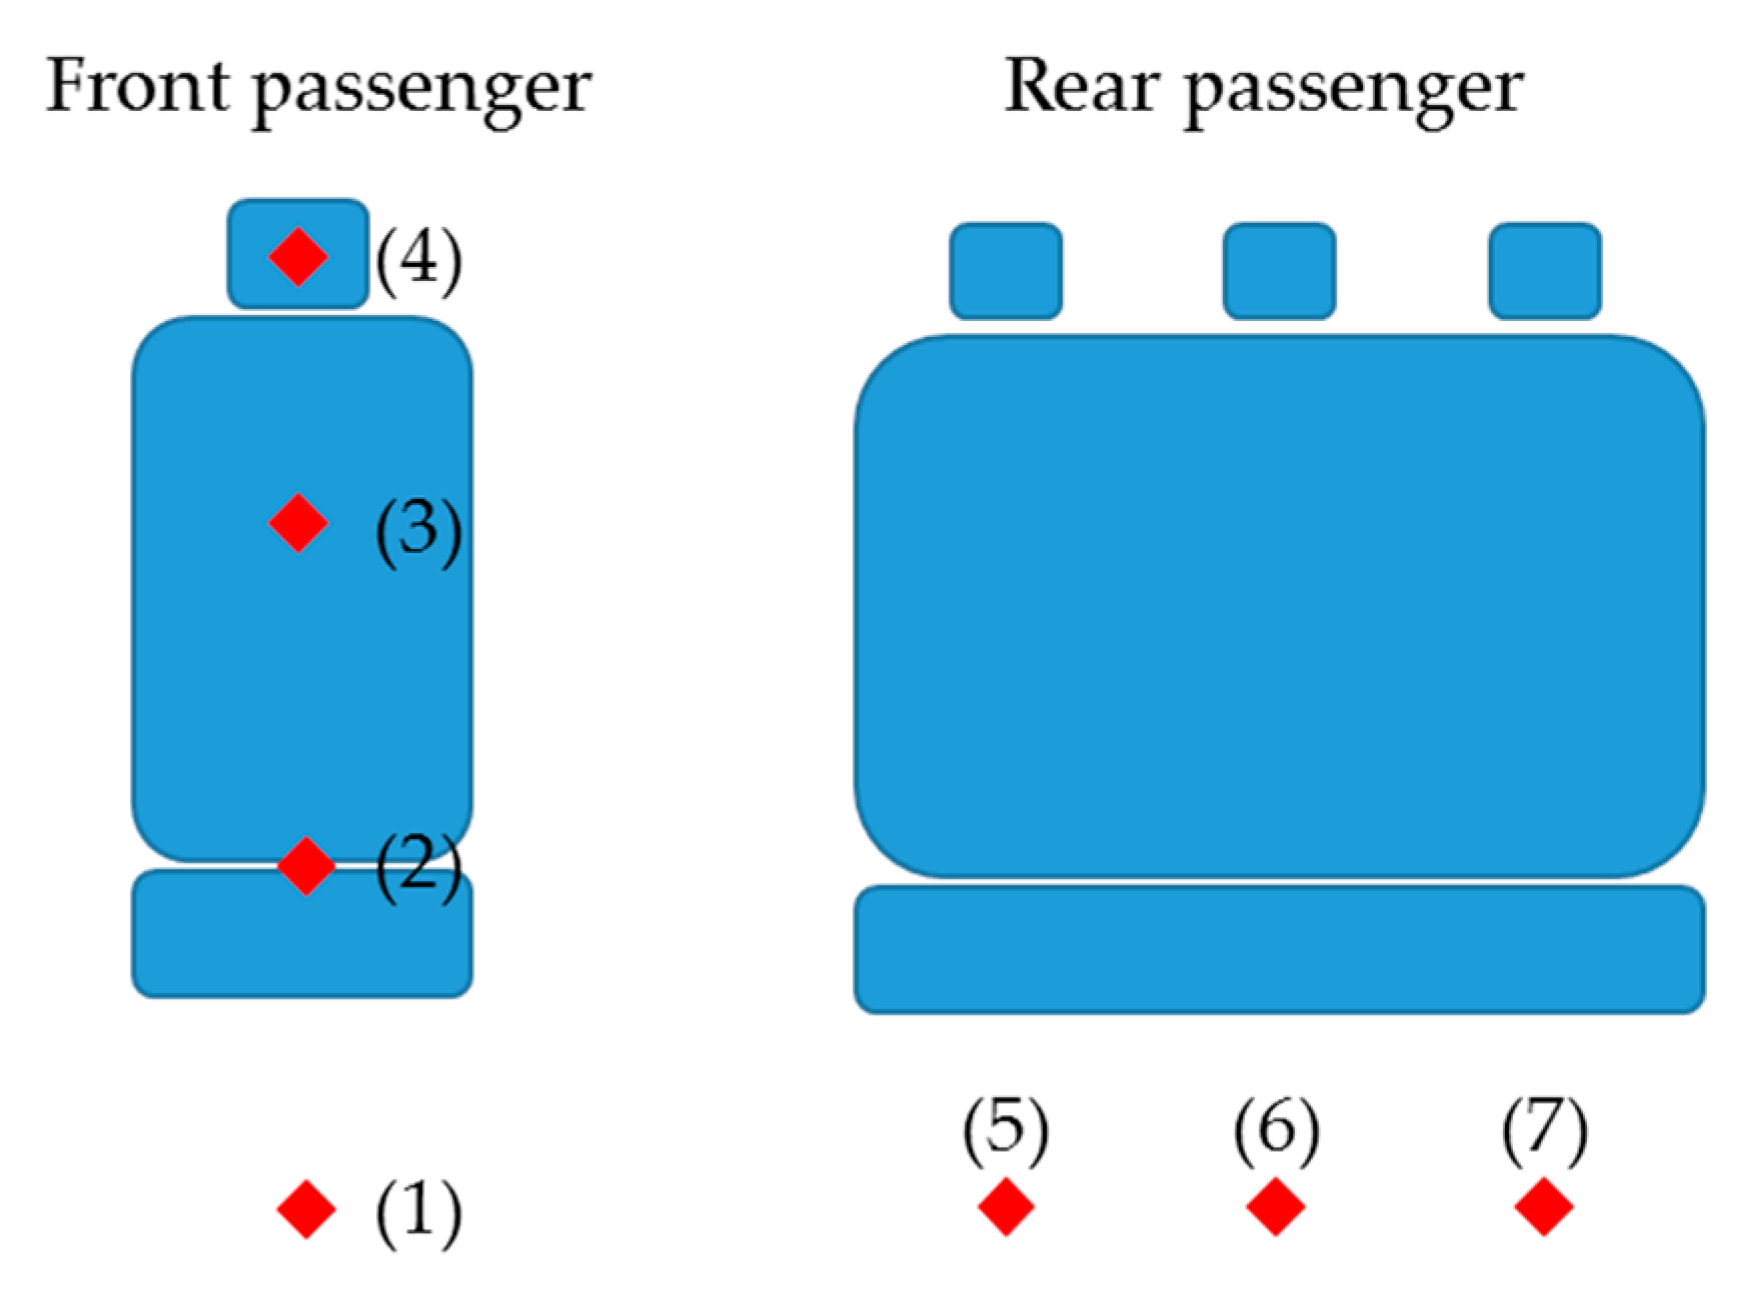
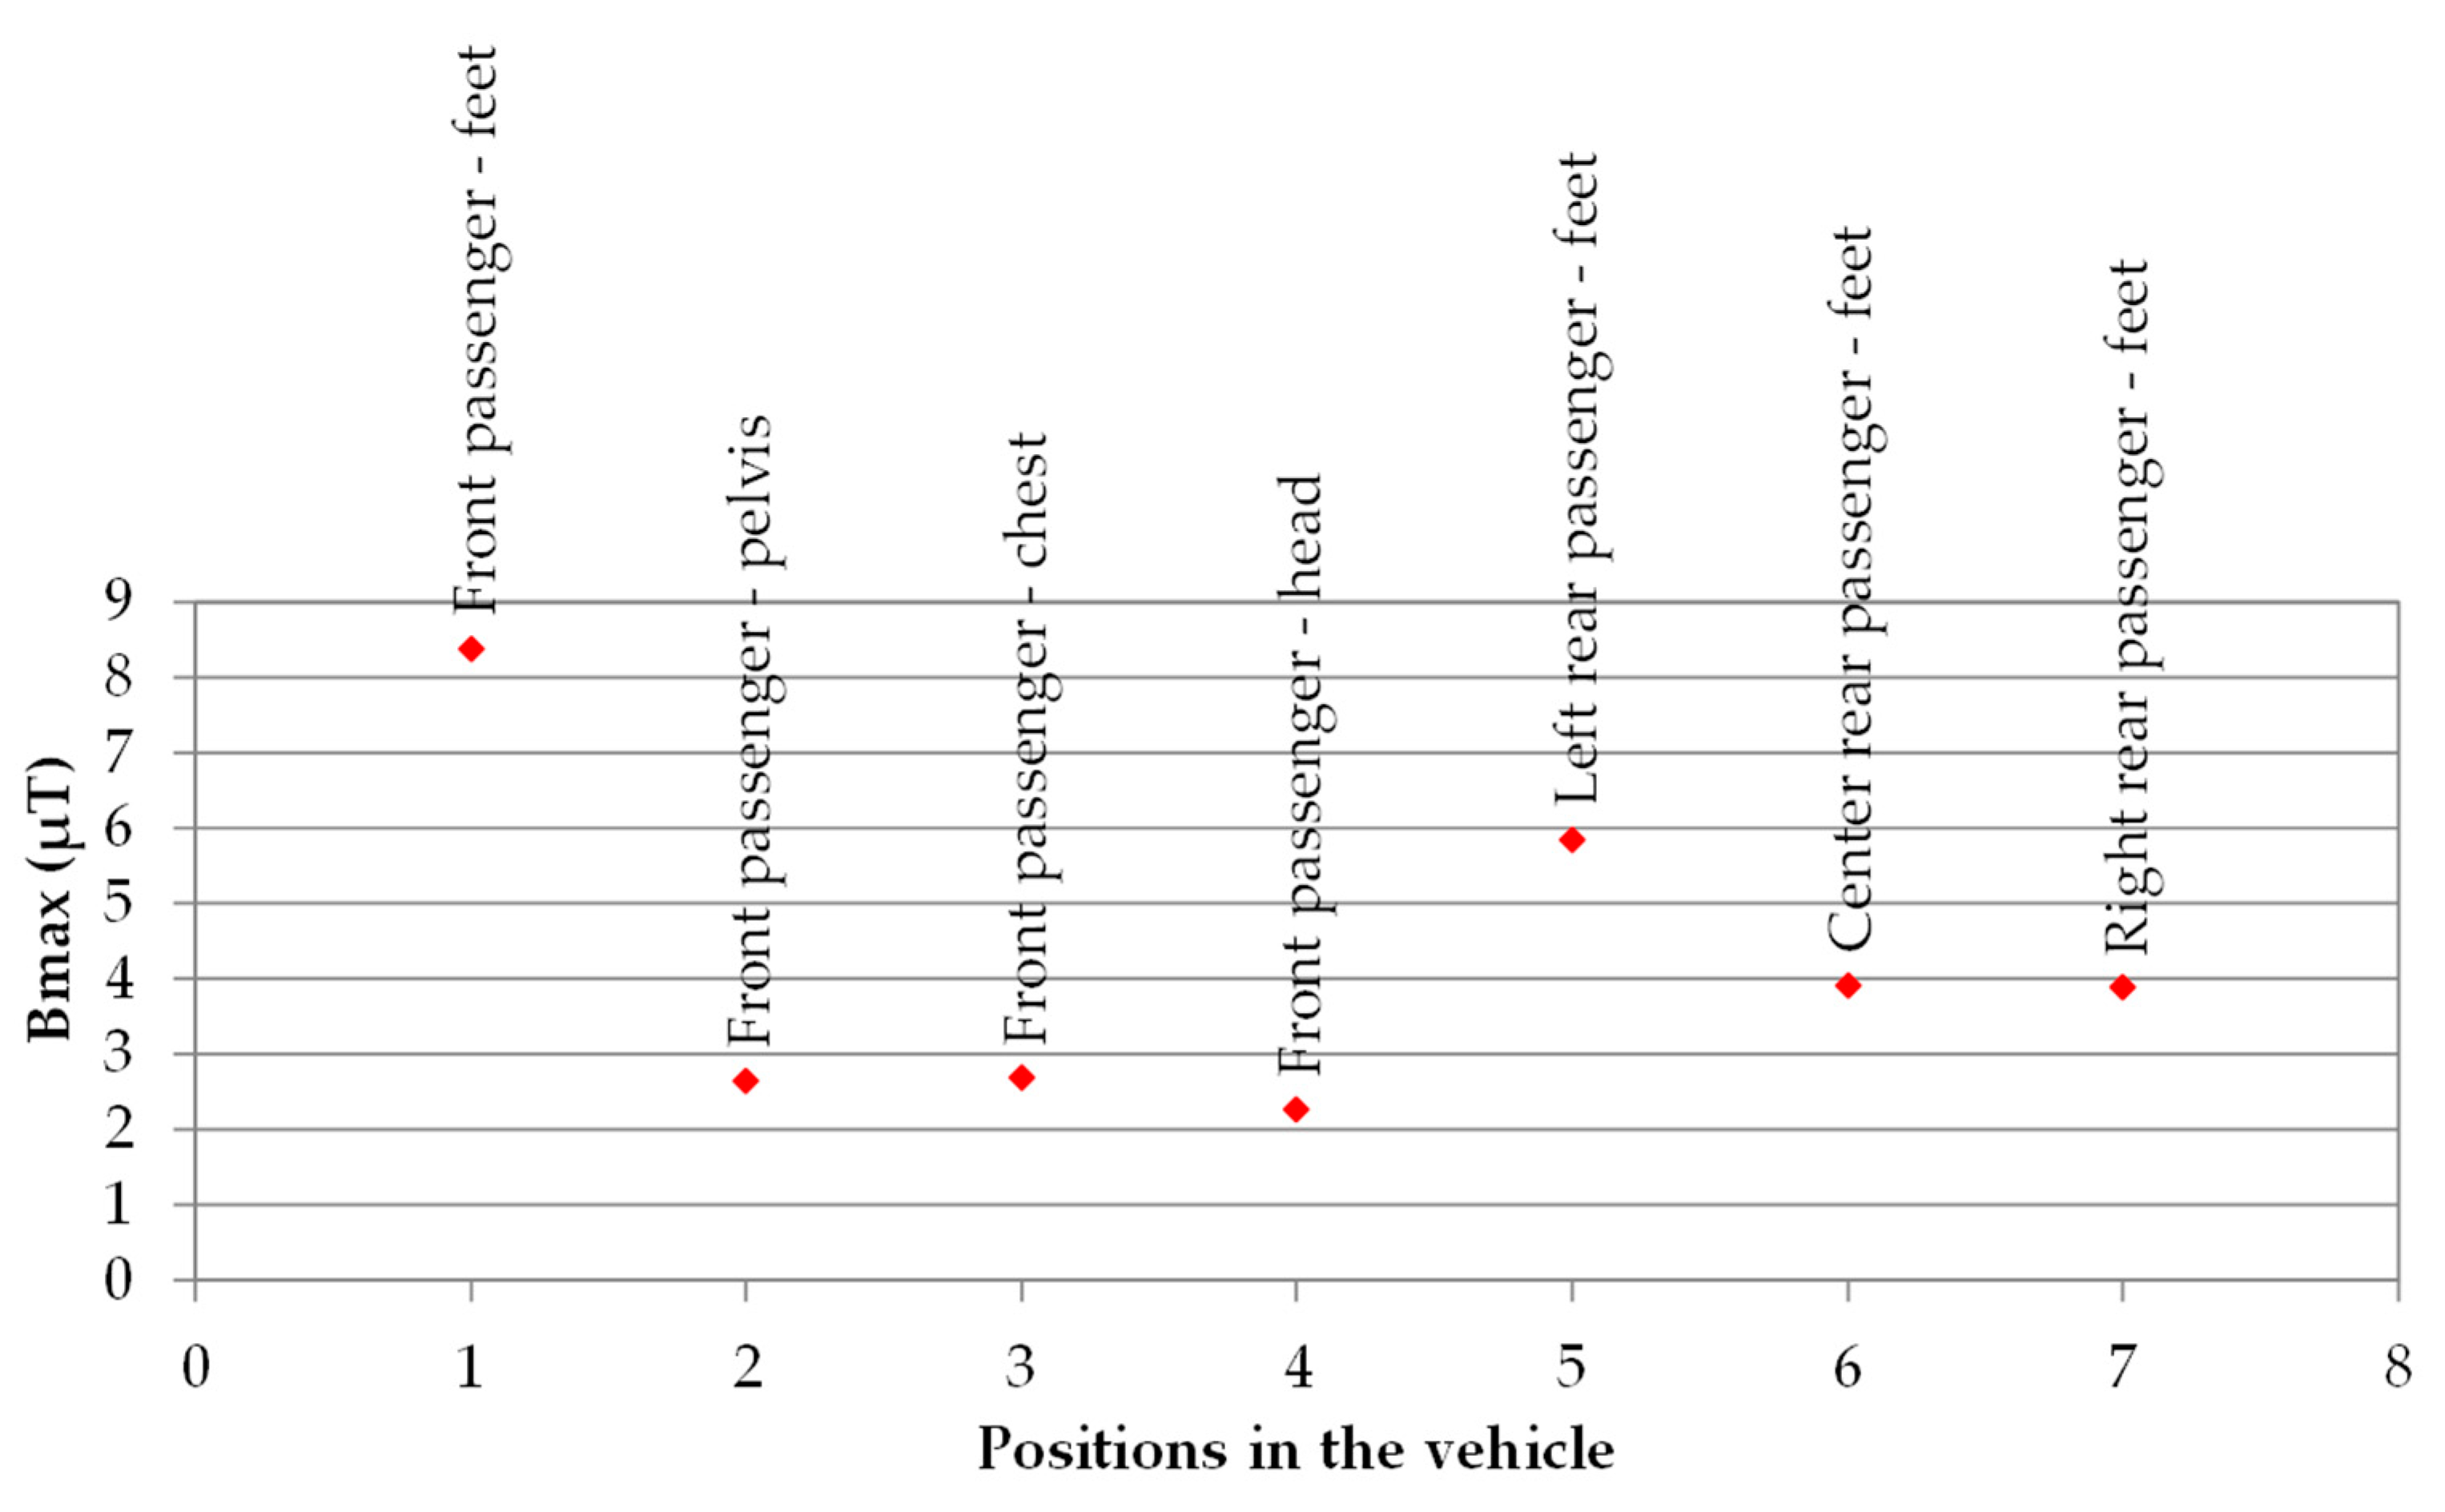
3.5.4. EMF Assessment Inside and Outside of the Vehicle

The exposure measurement points inside the vehicle are shown in Figure 9.
The measurements were performed with a wide frequency exposure level tester (1–400 kHz) which is an equipment typically used to evaluate compliance with the exposure levels defined by the International Commission on Non-Ionizing Radiation Protection (ICNIRP) 2010 [46].
Outside the vehicle, as illustrated in Figure 10, the probe was located along the charging lane, 0.5 m above the ground and 1.5 m away from the track reference line (coils centerline).

3.5.5. Additional FABRIC Validation Methodologies

Additional methodologies were also deployed from FABRIC project [45] to assess:
-
Grid impact measurements
-
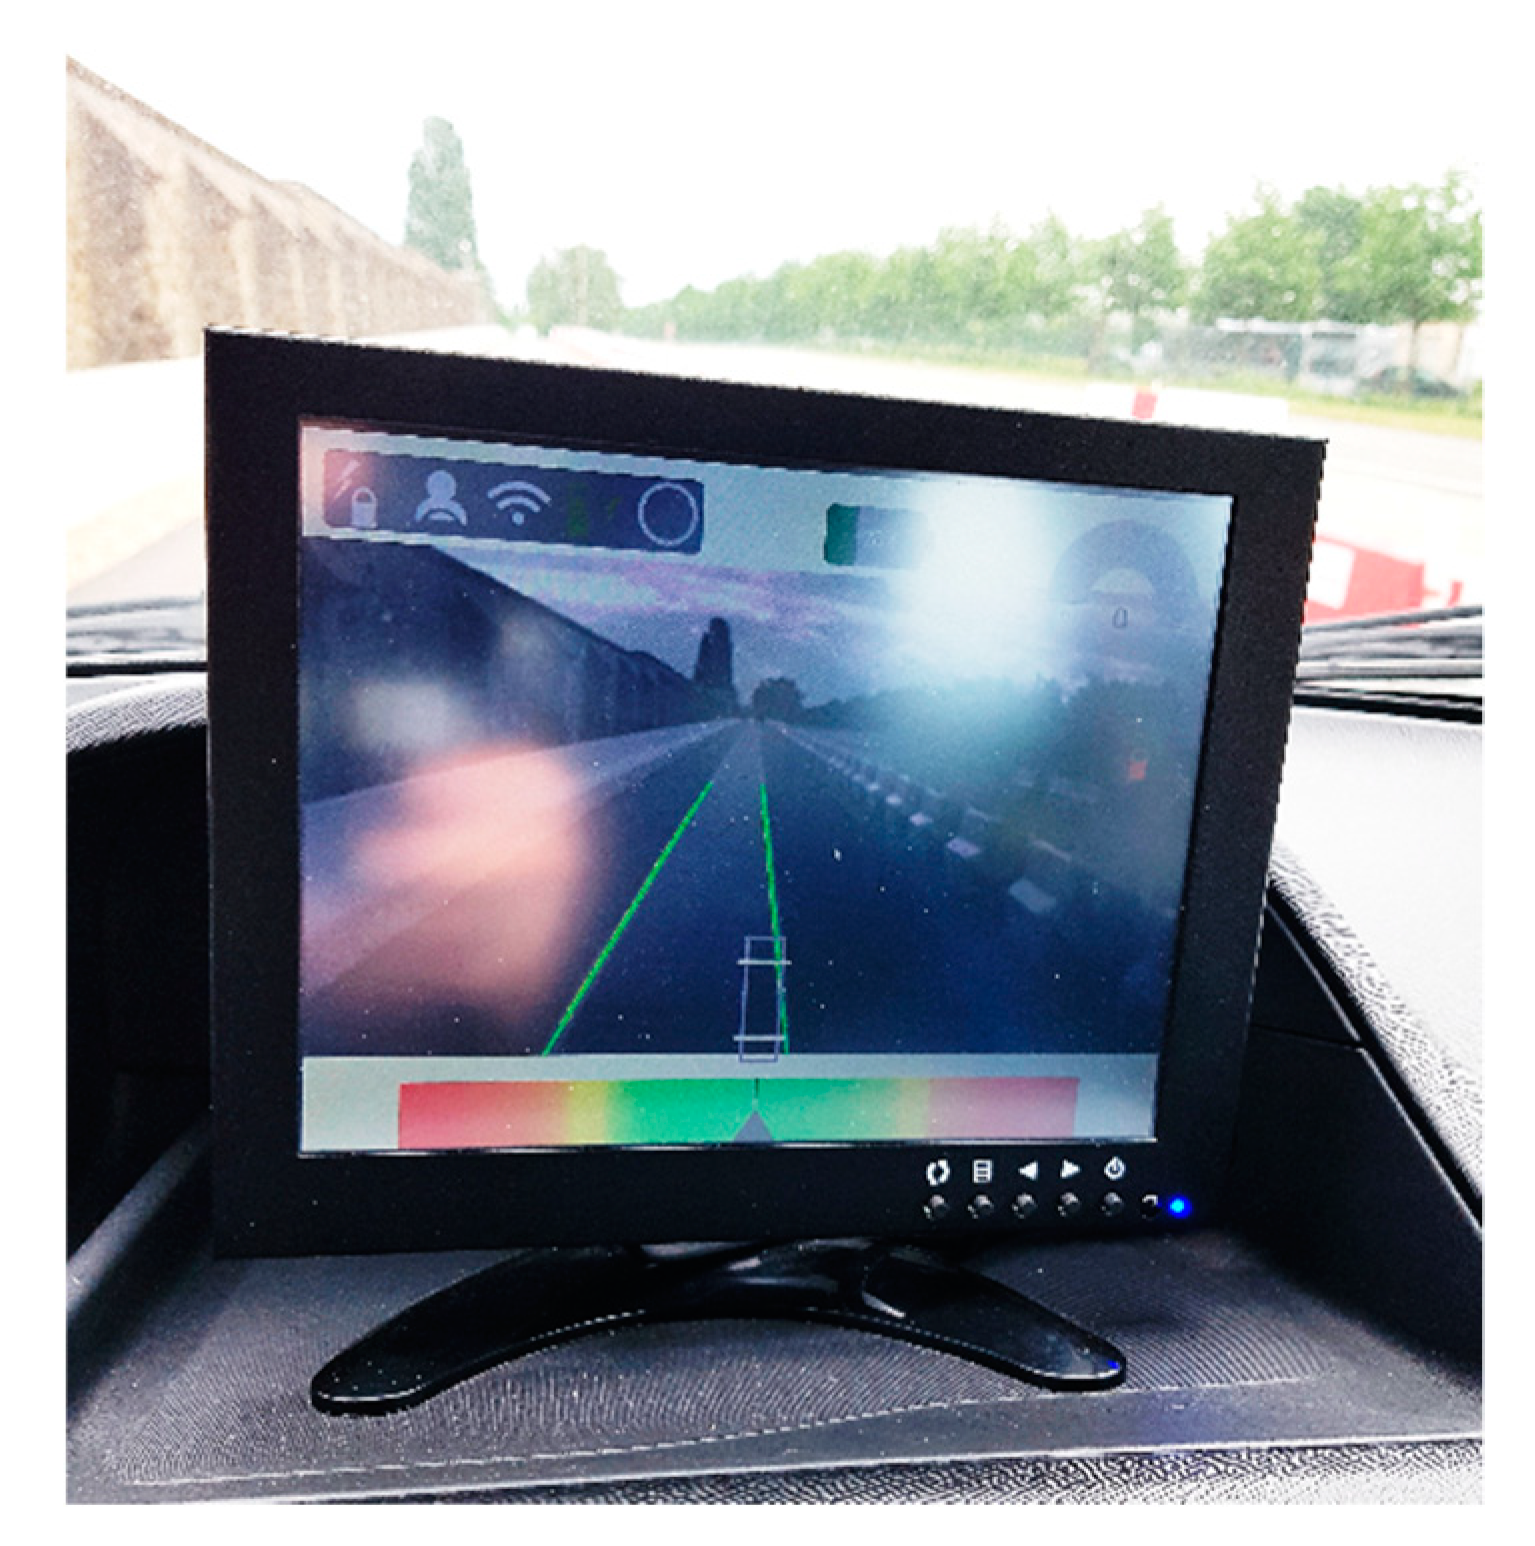
ICT functions (mainly for HMI and Lane-Keeping Assistant (LKA) validation).
These are also detailed in and [42] (pp. 573–574).

3.6. Additional System Characterizations Methodologies

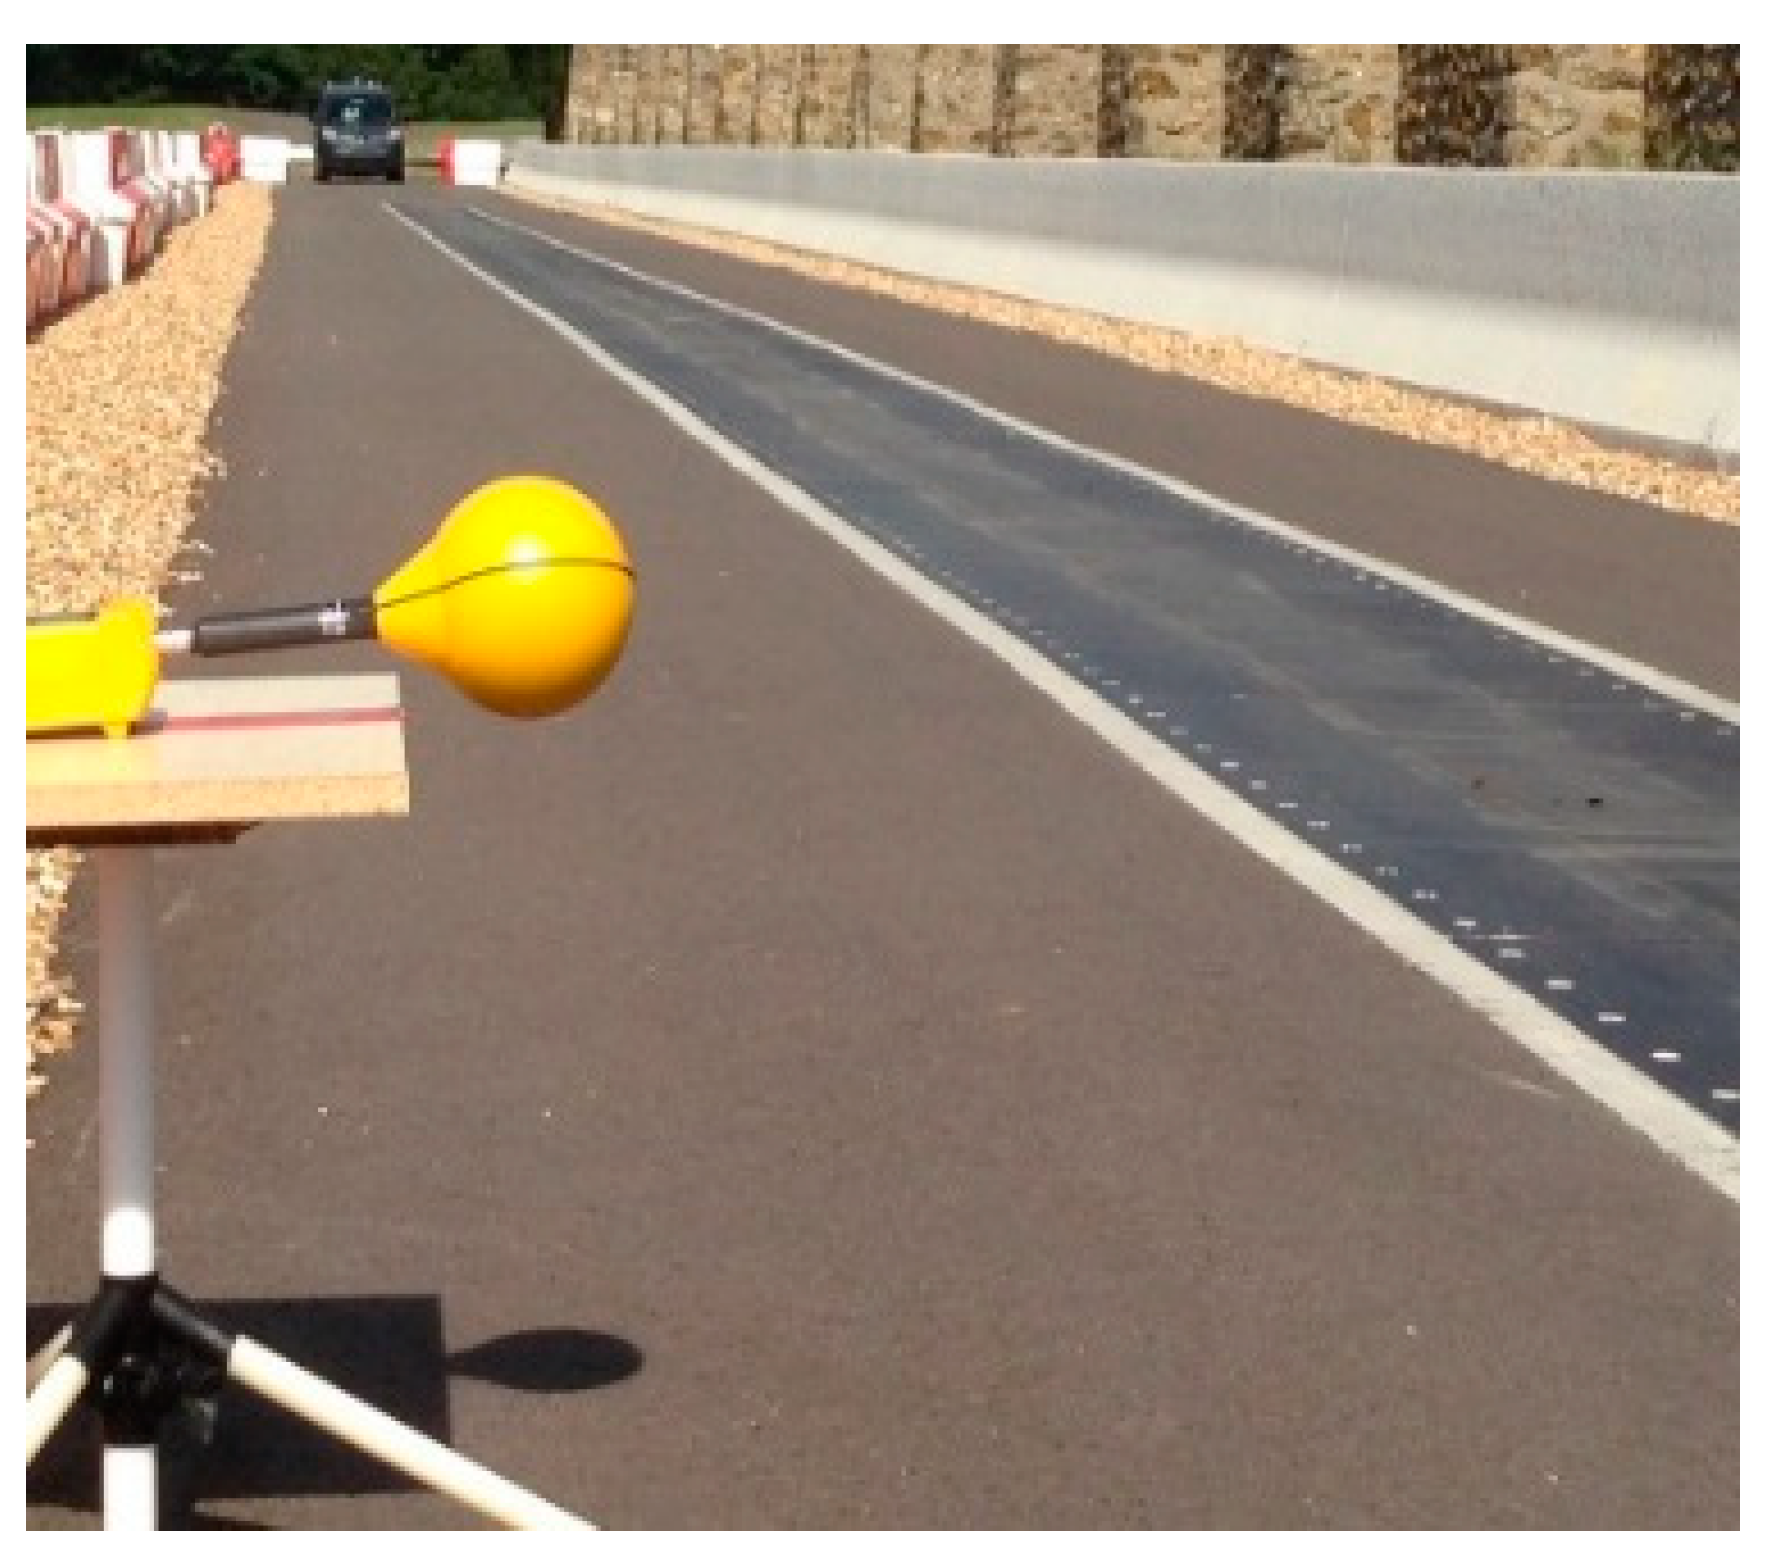
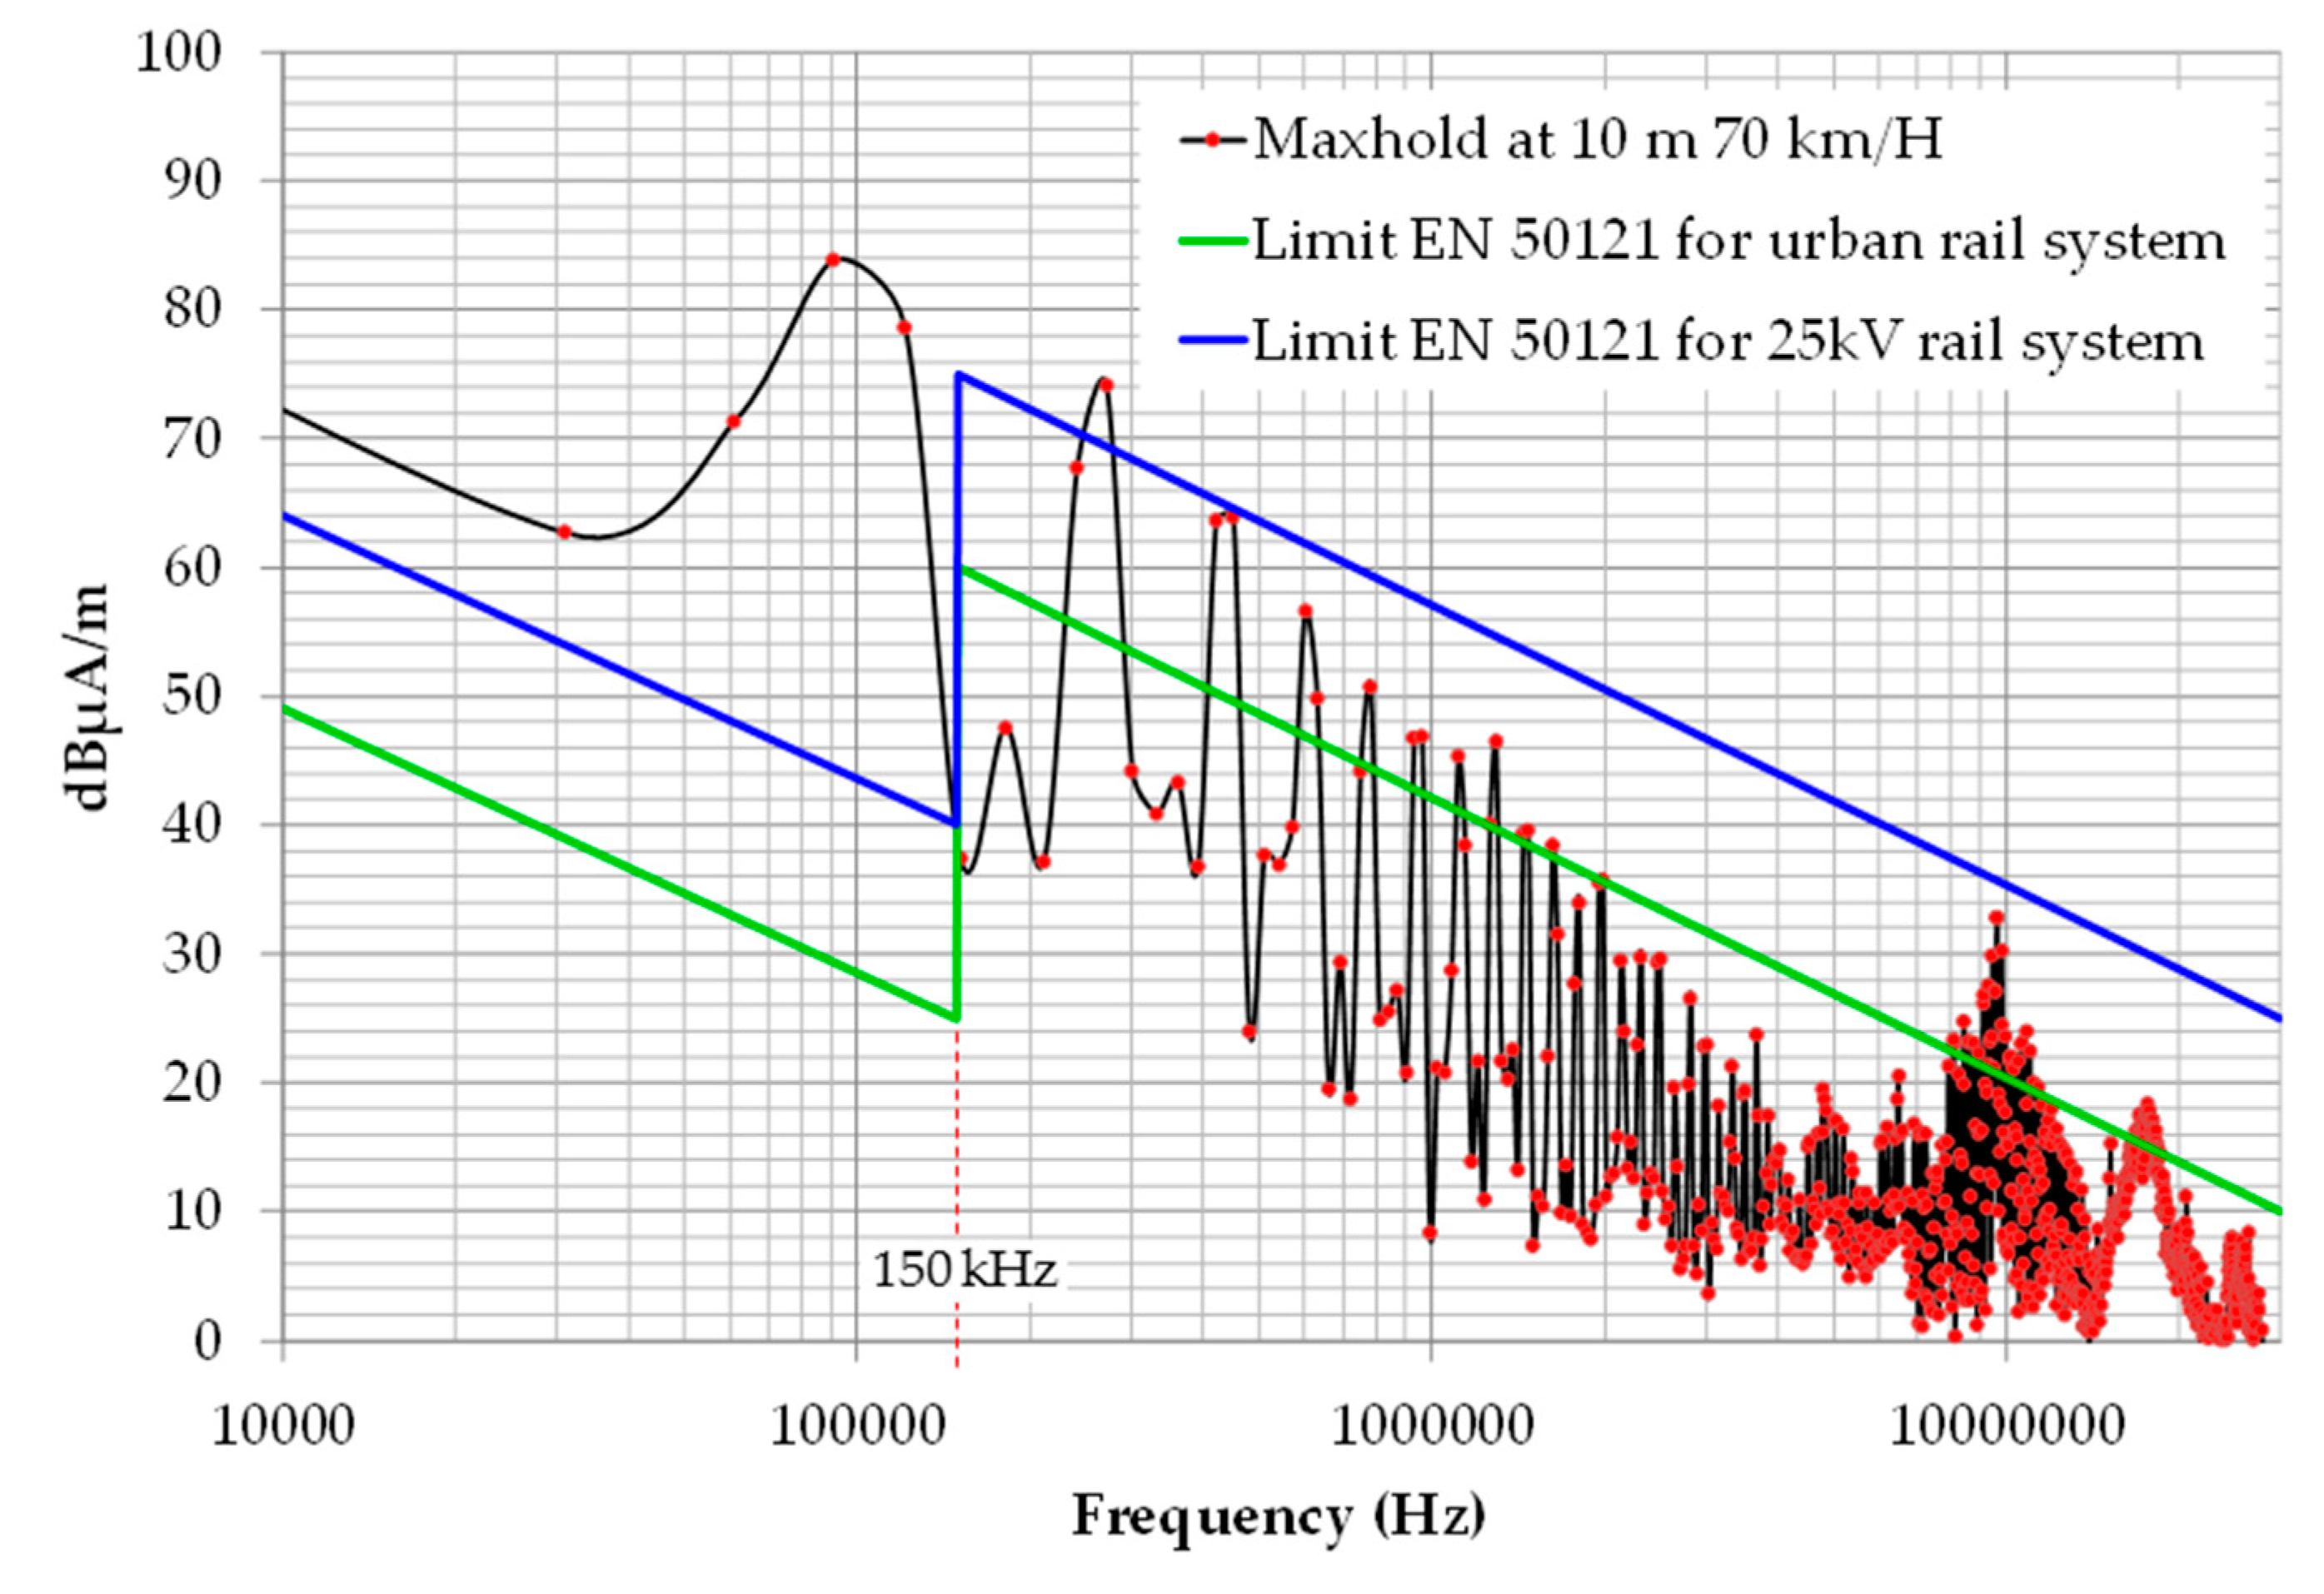
3.6.1. Radiated Emissions

In the automotive field, radiated Electromagnetic (EM) emissions measurements are carried out in a static situation by positioning the vehicle on a chassis dynamometer. However, with the dynamic IPT system, a measurement method must be adopted to measure the radiated EM emissions of the complete “vehicle plus dynamic charging infrastructure” system. In the railway field, the EN 50121-2 standard [47] is dedicated to the radiated EM emissions measurement of the railway system as a whole and this standard includes limits to be respected. Therefore, we adopted the same measurement method and performed comparisons with the limits applied to the railway system.
As mentioned in [47], radiated EM emissions were measured 10 m away from the road center at the passage of the vehicle at maximum charging power (20 kW), with a dedicated magnetic antenna for 10 kHz to 30 MHz frequencies. The configuration of the spectrum analyzer connected to the antenna (sweep time, number of points, resolution bandwidth) was in compliance with [47] for the 150 kHz–30 MHz frequency band.

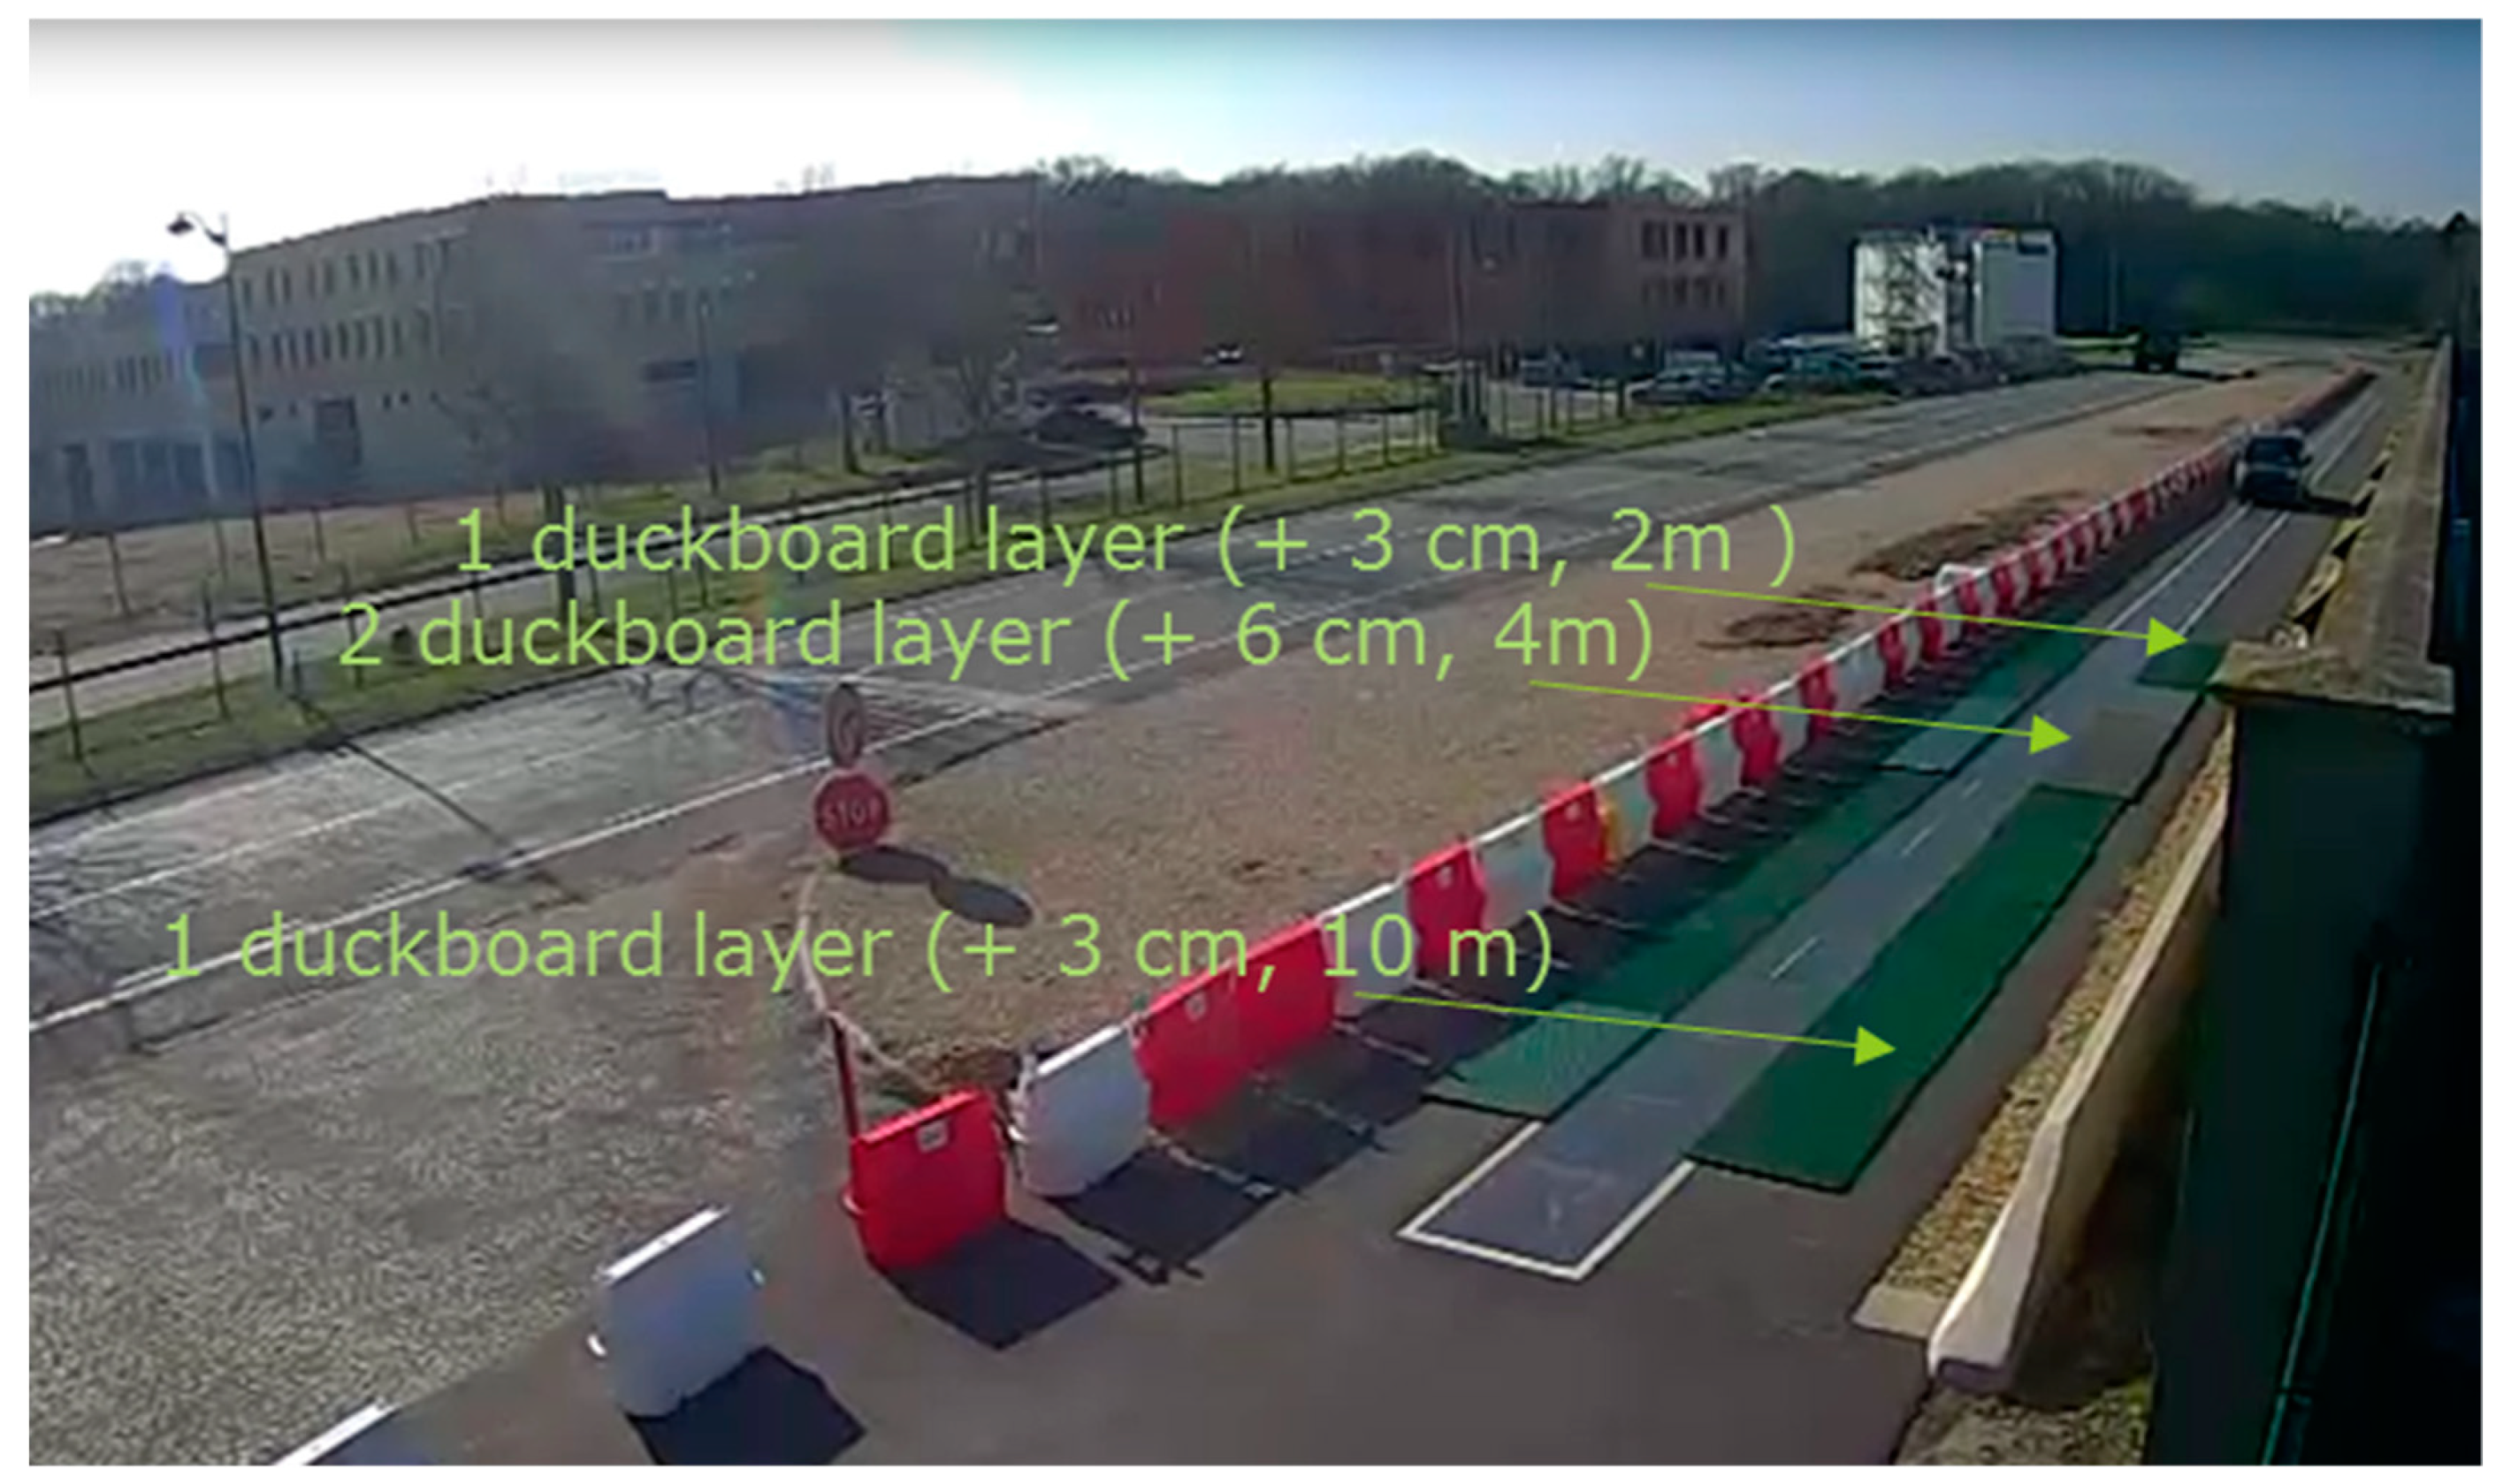
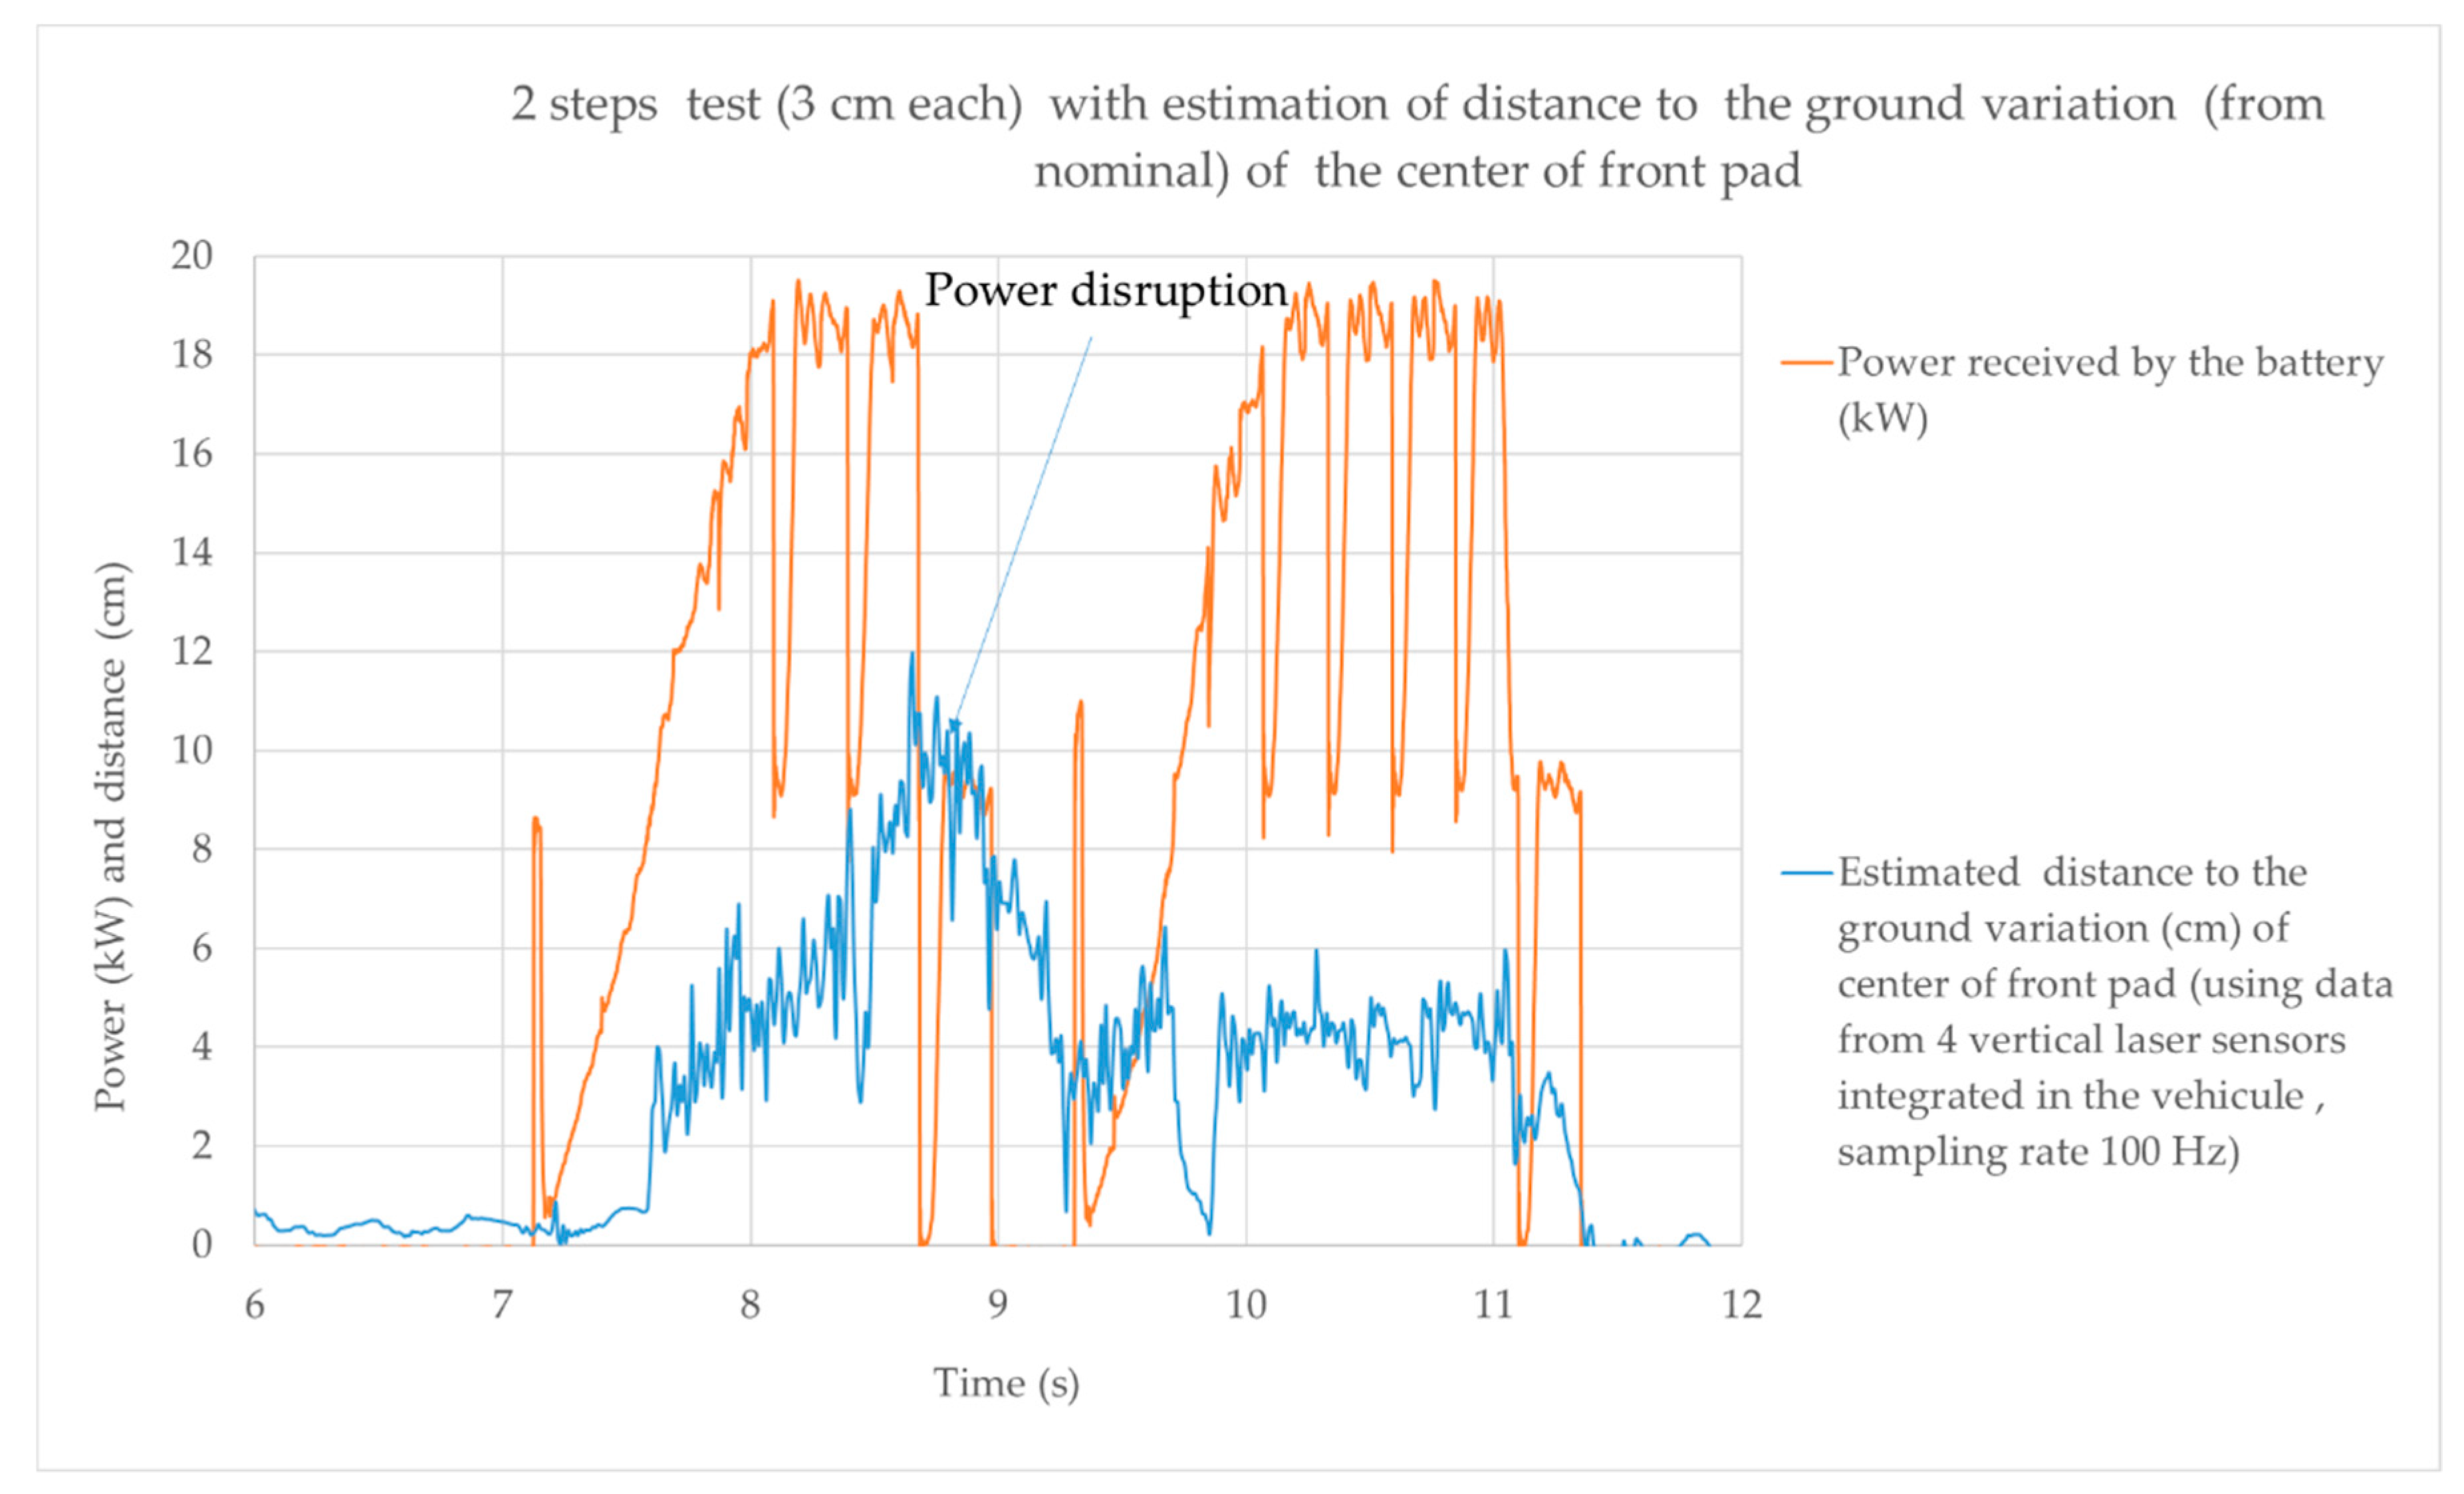
3.6.2. Impact of a Dynamic Air Gap Variation on Charge Performance Evaluation Methodology

The additional laser instrumentation described in Section 3.3 enabled experimental measurement of real-time distance to the ground of four points located below the car body. From these measurements, an estimation of the variation of the distance to the ground vs. an origin position (taken at no speed) of the front pad could be computed. These data could be merged and associated with PBAT data.
With this methodology, it was possible to study the effect of an air gap variation provoked by a road discontinuity on charge performance. In order to reproduce a significant discontinuity, a two-step test was set up using different duckboard layers as shown in Figure 11.

4. Public Demonstrations, Validation Result and Discussions

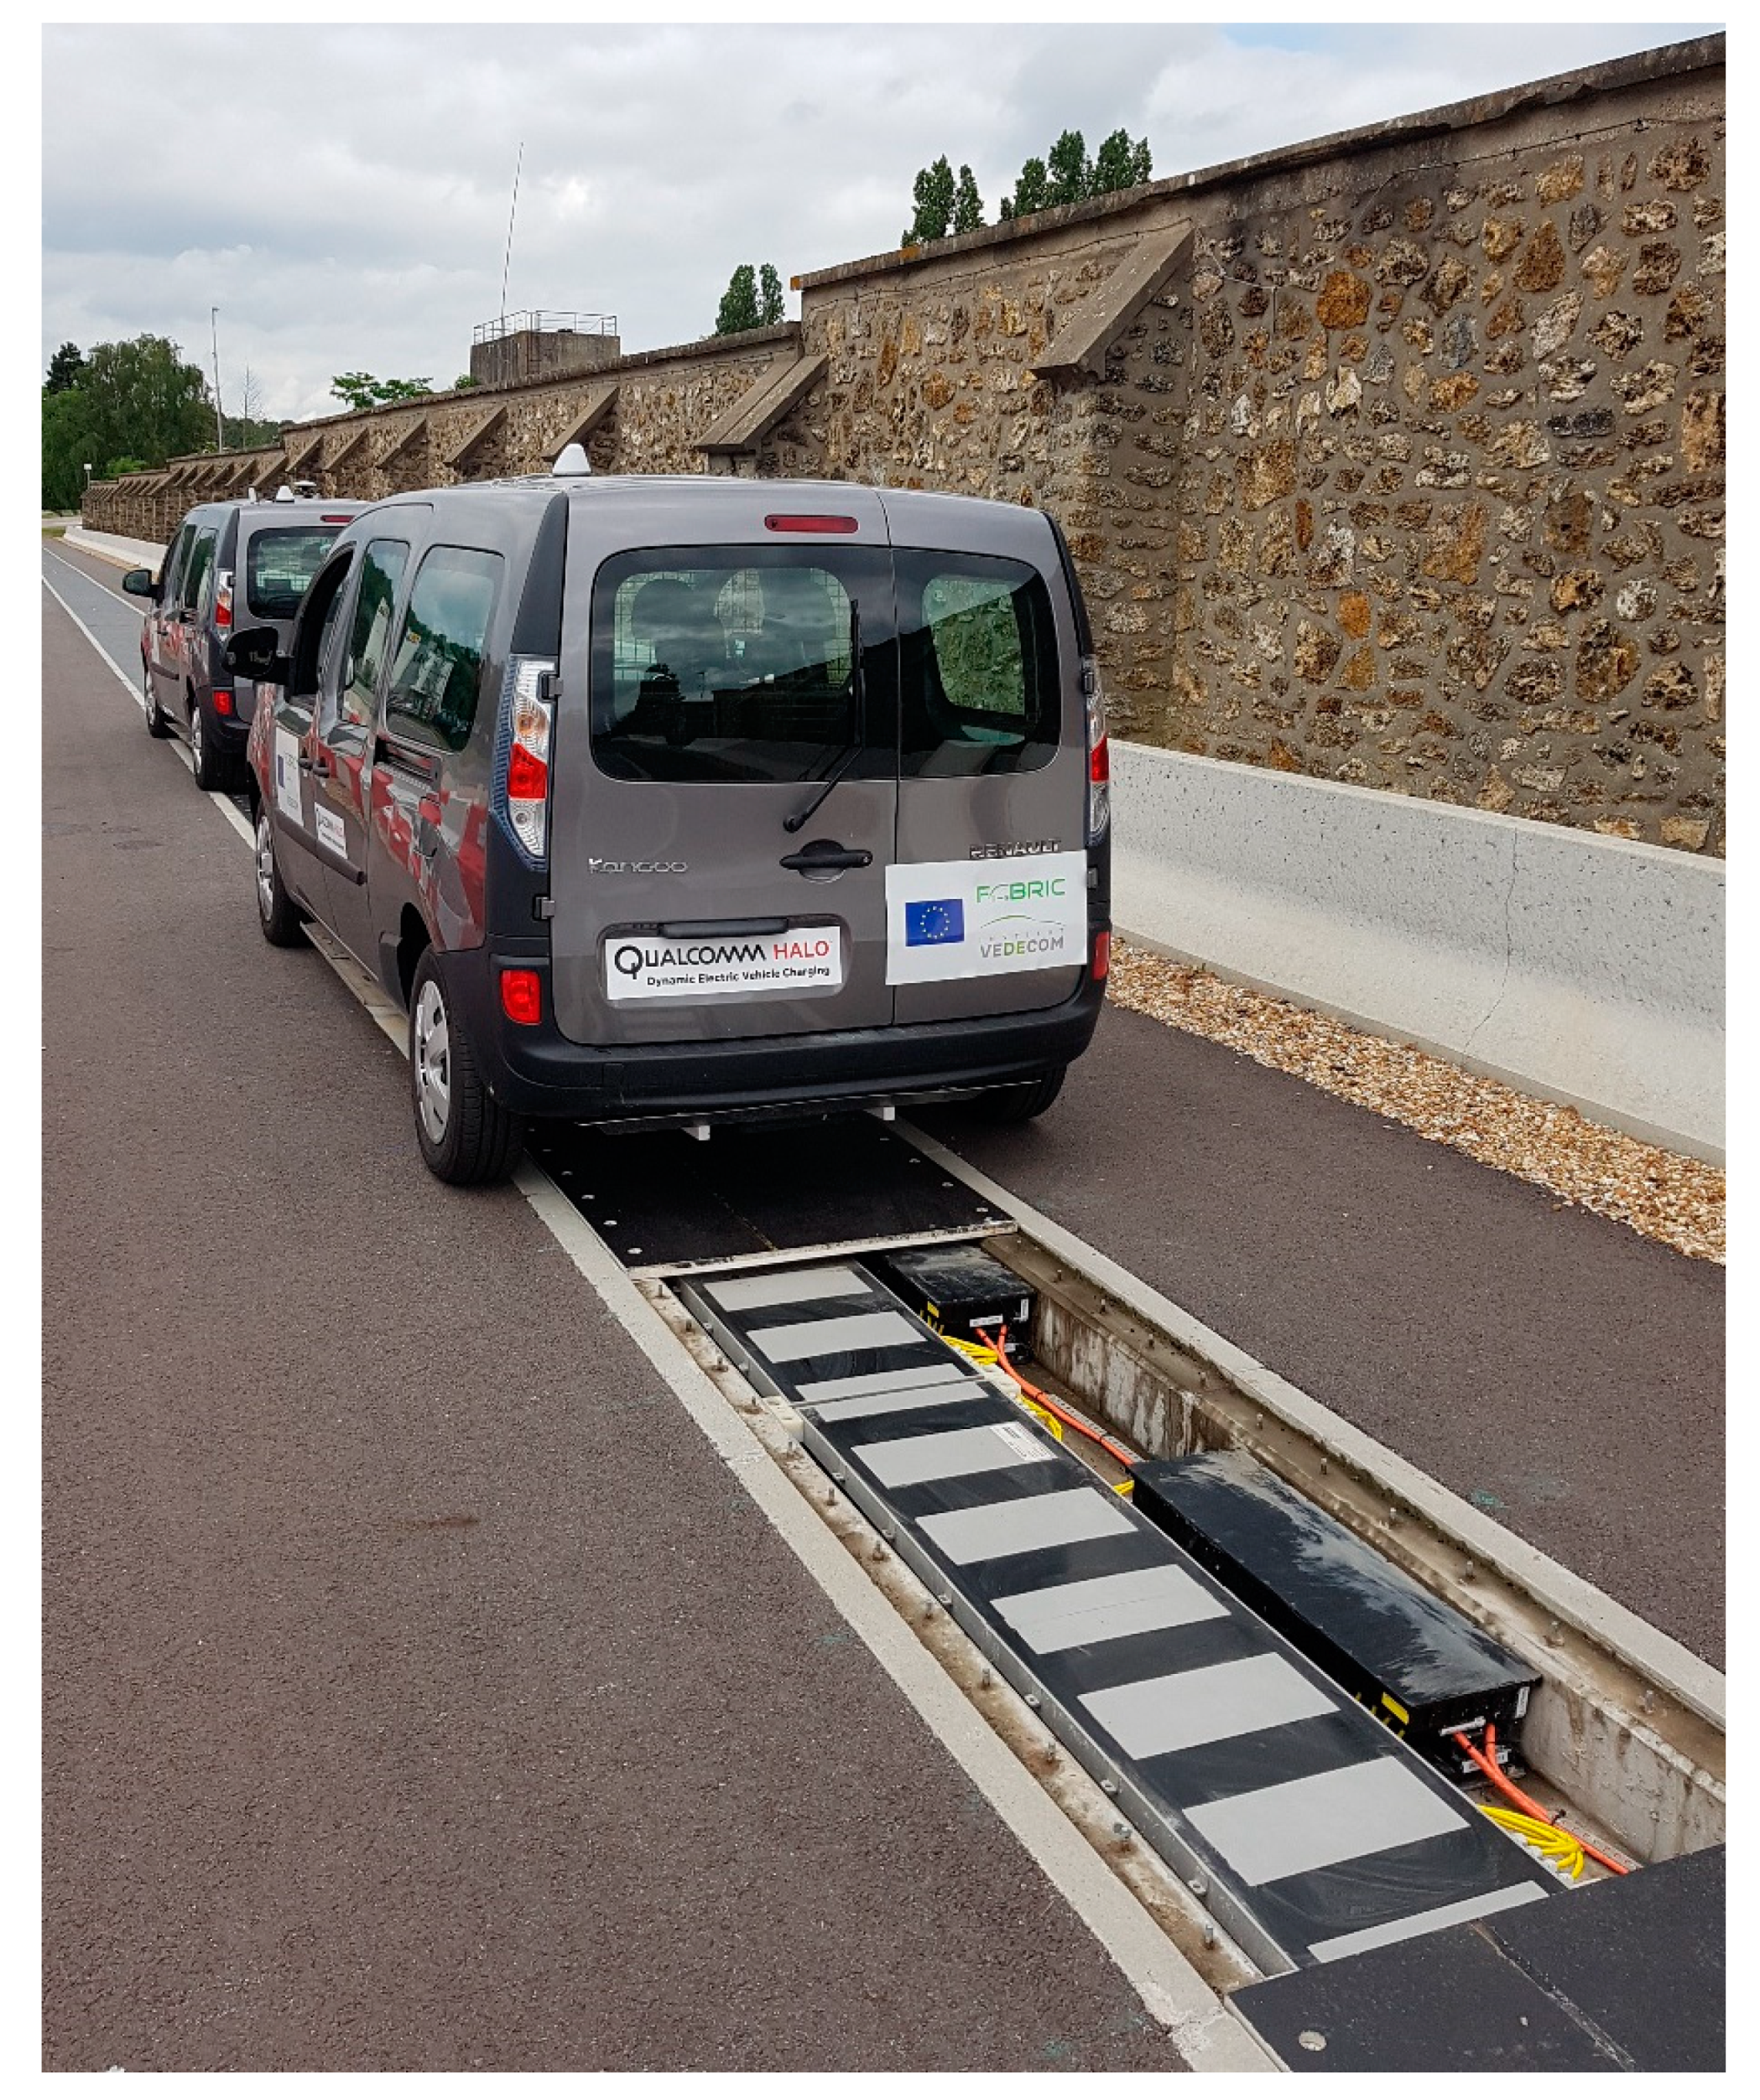
4.1. Public Demonstrations

Between March and October 2017, the following dynamic charging performances were demonstrated publicly several times, i.e.,
  • at different power levels up to 20 kW
  • from 0 up to 100 km/h speed
  • with two prototype cars
  • according to the different FABRIC use cases (stationary …)
The experimental Wireless Power Transfer infrastructure can be seen in operation in [48] as well as in [36], which also resumes the FABRIC project demonstrations and findings.

4.2. Main Validation Results

4.2.1. Battery Voltage and Current Shapes

A typical example of measured current and voltage shapes (UBAT, IBAT), with calculated Power and Energy received by the battery while charging (PBAT and EBAT) can be seen in Figure 12.
The current and voltage shapes IBAT and UBAT have a pulsated shape, as shown in Figure 12. Additional tune-up of the system and/or an additional filter could have reduced the amplitude of these pulsations. These probably have an impact on the efficiency levels reported in Section 4.2.2 and potentially on some EMC aspects.
The impact on battery life is not straightforward from a first literature review. Short and transient current pulses occur naturally in most EV load profiles. For example, accelerations or regenerative breaking generate high amplitude currents with a frequency from 10 mHz to 10 Hz. The literature review done in [49] shows a disconcerting variety of conclusions concerning the impact of these currents on battery life with different technologies.
From [50] in the case of Li-Ion batteries, it was found that:
-
Regenerative braking improves cycle life
-
Cycle depth is a dominant factor for cycle life and battery degradation.
From [51], no difference in aging mechanism between cells exposed to no AC and cells exposed to several different frequencies from 1 Hz to 1 kHz was observed during a one-year experimental investigation.
From this perspective, repeated WPT opportunistic charges (at city lights or at stops or in motion for example) with current and voltage shapes complying with existing or future standards powering the battery could contribute to limit the discharge depth of batteries and therefore, have potentially a good impact on battery life. Still, the effect of periodic and pulsated current issued from future IPT systems should be further studied.

4.2.2. Dynamic IPT System Efficiency

As reported in the preliminary results reported in [42] (p. 576) on the tested prototype, the total efficiency measured grid to battery reached around 70%. The value appears to be relatively low, which is explained firstly by the strong innovative concept of the system using only one AC converter for several distributed coil emitters. The designers expect to reach a significant progress close to 90% with a more mature technology.

4.2.3. Influence Factors Impact on Efficiency

From the 54-test series, the main influence factor on efficiency was found to be misalignment. Figure 13 presents the efficiency indicator (percentage of maximum efficiency recorder during the 54-test series) versus the misalignment data.
Figure 13 shows values of efficiency globally greater than 85% of the maximum recorded efficiency of the 54-test series. When average misalignment is contained in a [−15; +15] cm range, speed varies from 20 to 70 km/h and the air gap varies in the prototype functional range (see Section 3.5.3). Beyond these misalignment values, efficiency starts to drop significantly. More details can be found in [42] (p. 575).
No significant variation of the average misalignment was recorded while charging from 20 to 70 km/h using the LKA (see Figure 6). This is probably due to the experience gained by the drivers during the many tests performed and the relatively short charging distance. Should longer charging distances be considered and higher charging speeds, automation of a precise lane keeping task will become a necessity. Future Connected Autonomous Electric Vehicles (CAEV) might eventually integrate advanced lane keeping functions which could possibly be based on the EM field generated while driving.
Misalignment tolerance of future WPT systems could also be improved by design.

4.2.4. EMF Assessment Inside and Outside of the Vehicle

Tests inside the car results show ICNIRP 2010 [46] compliant values for the operating frequency of 85 kHz, as shown in Figure 14.
Outside the vehicle, the EMF levels were measured in different driving conditions while charging. The airgaps between the car and road embedded coils were set to their nominal position.
The levels obtained for the different tested use cases shown in Table 3 were below the values recommended by [46]. In addition, some Electromagnetic Compatibility (EMC) verifications were conducted without detecting a significant impact on the basic car functions.
With the cumulated investigations performed on the Versailles-Satory test site and the other demonstration operated by the teams of Politecnico di Torino [45], FABRIC developed some background which can be used further in future assessment methodologies of Dynamic IPT systems.
Different standardization processes focusing on Inductive Dynamic PT are currently active, as mentioned in [13] (p. 10). Amongst the different research and standardization activities, complementary investigations regarding the EMF exposure levels of vehicle passengers and Vulnerable Road Users (VRU) will be required. Reference [52] has recently defined limit power for WPT systems operating at 85 kHz. Reference [53] aimed to improve measurement methods, dosimetric models and phantoms of such measurement in vehicle inductive charging systems.

4.2.5. Additional FABRIC Validation Results

Additional assessment results of grid impact and ICT functions (mainly HMI and LKA validation are detailed in [42] (pp. 573–574).

4.3. Additional System Characterizations Result

4.3.1. Radiated Emissions

The radiated emissions results are plotted in Figure 15.
The results under 150 kHz are not relevant and cannot be compared to the EN 50121 standard limit. Indeed, the measurement was carried out with a 10 kHz resolution bandwidth (RBW) required to the 150 kHz–30 MHz frequency band in EN 50121. However, at frequencies inferior to 150 kHz, the EN 50121 limit is defined for a measurement with a 200 Hz RBW. Since measurement with a 200 Hz RBW takes too long to scan the 10 kHz–150 kHz frequency band in relation to the crossing time of the vehicle in front of the antenna, we employed a 10 kHz RBW. A measurement with a 10 kHz RBW instead of a 200 Hz RBW overvalues the result.
For frequencies between 150 kHz and 30 MHz, the emissions clearly exceed the limit applied for the URBAN railway system. Nevertheless, considering the limit for the 25 kV rail system, only the third harmonic exceeded the limit. Knowing that radiated electromagnetic emissions could be characterized in the same way in a future standard for DWPT systems, it would be necessary to better confine the magnetic field under the vehicle to reduce side emissions.

4.3.2. Impact of a Dynamic Air Gap Variation on Charge Performance

From Figure 16, we can observe that the transmitted power level is not influenced by a total air gap increase of 10 cm from the nominal condition. Above this value, power disruption is observed. The total air gap includes car vibrations while driving over the duckboard layers.
This instrumentation could eventually be helpful to assess future product performances in real driving conditions including road discontinuities.

5. Conclusions

5.1. Demonstrations and Experimental Characterizations in Real Conditions

The implementation of a prototype Dynamic IPT system in two serial vehicles and in the Versailles-Satory experimental electric road project delivered demonstrations in compliance with the initial FABRIC objectives in terms of:
  • power levels (20 kW)
  • charging speeds (from 0 to 100 km/h)
  • number of vehicles dynamically chargeable on the track (up to two).
Extensive demonstrations were performed in 2017 and the system was operable for a year in many driving and climatic conditions. Road integration was handled with a civil engineering approach given accessibility constraints to power electronic components. After the demonstrations illustrated in [36,37,38,39,40,41,42,43,44,45,46,47,48], the TRL for the dynamic IPT technology could be valued between 6 and 7.
The results obtained from an extensive series of tests in many driving conditions are presented and discussed in the Results section of this paper. They address global system efficiency, current shapes, the impact of experimentally measured misalignment, EMF compliance with reference guidelines, additionally measured radiated emissions and experimentally characterized air gap variations. All these methodologies developed collaboratively within the FABRIC project can support future infrastructure and product design, ongoing standardization and product assessment.

5.2. Prospectives

In light of these results, considering the successful feasibility demonstrations and other investigations of the FABRIC project, many issues were identified. First, costs evaluations are somewhat discouraging, since they range up to 3 MEUR/lane/km [54]. The many interoperability issues [55] are also critical factors intensively reviewed by many ongoing standardization processes [13]. Finally, industrial processes for road integration also require a major effort [56].
Considering the current dynamic IPT systems performances, the centered urban use case appears as the most accessible. Indeed, in this use case:
  • EVs have the lowest speed and consumption, which implies a higher potential for additional autonomy per km of charge while driving
  • Pressure to ban ICE engines is very high in urban centers
  • Land prices make charging infrastructure implantation costs very high
  • The density of power supply equipment potentially available is important. Capacities from existing metro and tram electric utilities could support part of the dynamic IPT charging infrastructure deployment.
The first real deployment initiatives in an urban area appeared in Norway [57].
However, urban use case implies many interactions with VRU. Therefore, specific challenges concerning safety, cohabitation and user acceptance will be prominent. On the other hand, extra urban use case can permit the deployment of a controlled access lane in order to manage or cancel the interactions with VRU. Therefore, higher-power experimentations could be possible.
Finally, the current research tries to identify the right dimensioning and covering rate of IPT systems for long-distance applications [11,58]. Future System design considerations [59], traffic simulations with high charging power and shared CAEV [60] show an interesting prospective. Advanced energy management concepts like vehicular energy have been proposed [61]. Globally, visions of future energy harvesting road ecosystems [62] could include vehicle to infrastructure bidirectional energy transfers based on WPT, as visualized in Figure 17.

Author Contributions

Conceptualization, S.L., G.C., V.D.; Methodology, S.L., G.C., V.D.; Validation, S.L., G.C., V.D., Formal analysis, S.L., G.C., V.D.; Investigation, S.L., G.C., V.D.; Data curation, S.L., V.D.; Writing-original draft preparation, S.L.; writing—review and editing, G.C., V.D., A.D.B., N.H., visualization, S.L., V.D., A.D.B., N.H.; supervision; S.L., G.C., V.D.; Project administration; S.L.

Funding

This research was funded by the European Commission, under FABRIC, a collaborative project part of the FP7 for research, technological development and demonstration (Grant Agreement NO 605405) and by VEDECOM for the experimental track implementation.

Acknowledgments

IFSTTAR for the support on road design and EM characterizations. Renault for the supplied integrated vehicle prototypes during the FABRIC project. The tests were performed on a prototype Qualcomm WPT system loaned to VEDECOM and supported by Qualcomm engineers throughout installation and testing.

Conflicts of Interest

The authors declare no conflict of interest.

Glossary

The following abbreviations are used in this manuscript:
BMSBattery Management System
CAEVConnected Autonomous Electric Vehicles
DC/ACDirect Current/Alternative Current
DSRCDirect Short-Range Communication
DWPTDynamic Wireless Power Transfer
ECUElectric Control Unit
EMElectromagnetic
EMCElectromagnetic Compatibility
EMFElectromagnetic Field
ERSElectric Road Systems
EVElectric Vehicle
EVBElectric Vehicle Batteries
EVCCElectric Vehicle Communication Controller
GNSSGlobal Navigation Satellite System
GPSGlobal Positioning System
GSMGlobal System for Mobile
HDVHigh Duty Vehicles
HMIHuman Machine Interface
ICEInternal Combustion Engine
ICNIRPInternational Commission on Non-Ionizing Radiation Protection
ICTInformation and Communication Technology
IEAInternational Energy Agency
IFSTTARInstitut Français des Sciences et Technologies des Transports, de l’Aménagement et des Réseaux
IPTInductive Power Transfer
LKALane Keeping Assistant
RBWResolution Bandwidth
RPEVRoadway Powered Electric Vehicle
RTKReal-Time Kinematic
SOCState of Charge
TRLTechnology Readiness Level
VCUVehicle Charge Unit
VRUVulnerable Road Users
WPTWireless Power Transfer

References

  1. Global EV Outlook 2018. Available online: https://webstore.iea.org/global-ev-outlook-2018 (accessed on 6 November 2019).
  2. Open Charge Map. Available online: https://openchargemap.org/site/ (accessed on 30 September 2019).
  3. Zoe Voiture Citadine Electrique Renault. Available online: https://www.renault.fr/vehicules/vehicules-electriques/nouvelle-zoe.html (accessed on 6 November 2019).
  4. Clio Voiture Citadine Renault. Available online: https://www.renault.fr/vehicules/vehicules-particuliers/nouvelle-clio.html (accessed on 6 November 2019).
  5. Tongur, S.; Sundelin, H. The Electric Road System. In Proceedings of the Asian Conference on Energy, Power and Transportation Electrification (ACEPT), Singapore, 25–27 October 2016; IEEE: Piscataway, NY, USA, 2016. [Google Scholar]
  6. California EHighway Demonstration Uses Overhead Lines to Charge Trucks en Route. Available online: https://chargedevs.com/newswire/california-ehighway-demonstration-uses-overhead-lines-to-charge-trucks-en-route/ (accessed on 30 September 2019).
  7. Electrified Road in Sweden for Charging Moving Cars. Available online: https://www.youtube.com/watch?v=YjAlsxUOGzQ (accessed on 30 September 2019).
  8. IRENA-Innovation Outlook-Smart Charging for EV. Available online: https://www.irena.org/-/media/Files/IRENA/Agency/Publication/2019/May/IRENA_Innovation_Outlook_EV_smart_charging_2019.pdf (accessed on 6 November 2019).
  9. Suul, J.A.; Guidi, G. Overview and Electro-Technical Evaluation of the State-of-the-Art for Conductive and Inductive Power Transfer Technologies, SINTEF Energy Research Report 2018. Available online: https://www.sintef.no/globalassets/project/elingo/18-0733---rapport-3---technology-for-dynamic-on-road----6-til-nett.pdf (accessed on 30 September 2019).
  10. Zhao, H.; Wang, Q.; Fulton, L.; Jaller, M.; Burke, A. A Comparison of Zero-Emission Highway Trucking Technologies; UC Office of the President, University of California Institute of Transportation Studies: Berkeley, CA, USA, 2018; Available online: https://escholarship.org/uc/item/1584b5z9 (accessed on 8 November 2019).
  11. Shekhar, A.; Prasanth, V.; Bauer, P.; Bolech, M. Economic Viability Study of an On-Road Wireless Charging System with a Generic Driving Range Estimation Method. Energies 2016, 9, 76. [Google Scholar] [CrossRef]
  12. Choi, S.Y.; Gu, B.W.; Jeong, S.Y.; Rim, C.T. Advances in Wireless Power Transfer Systems for Roadway-Powered Electric Vehicles. IEEE J. Emerg. Sel. Top. Power Electr. 2015, 3, 18–36. [Google Scholar] [CrossRef]
  13. Cirimele, V.; Freschi, F.; Mitolo, M. Inductive power transfer for automotive, applications: State-of-the-art and future trends. In Proceedings of the 2016 IEEE Industry Applications Society Annual Meeting, Portland, OR, USA, 2–6 October 2016. [Google Scholar]
  14. Faraday, M. Experimental researches in electricity. Philos. Trans. R. Soc. Lond. 1832, 122, 125–162. [Google Scholar]
  15. Cichon, D.J.; Wiesbeck, W. The Heinrich Hertz wireless experiments at Karlsruhe in the view of modern communication. In Proceedings of the 1995 International Conference on 100 Years of Radio, London, UK, 5–7 September 1995; pp. 1–6. [Google Scholar]
  16. Tesla, N. The transmission of electrical energy without wires. In Electrical World and Engineer; McGraw Publishing Company: New York, NY, USA, 1904; Volume 1. [Google Scholar]
  17. Grant, A.; Covic, G.C.; John, T.; Boys, J.B. Inductive Power Transfer. Proc. IEEE 2013, 101, 1276–1289. [Google Scholar]
  18. Jawad, A.M.; Nordin, R.; Gharghan, S.K.; Jawad, H.M.; Ismail, M. Opportunities and Challenges for Near-Field Wireless Power Transfer: A Review. Energies 2017, 10, 1022. [Google Scholar] [CrossRef]
  19. Houran, M.A.; Xu, Y.; Chen, W. Magnetically Coupled Resonance WPT: Review of Compensation Topologies, Resonator Structures with Misalignment, and EMI Diagnostics. Electronics 2018, 11, 296. [Google Scholar] [CrossRef]
  20. Tesla, N. Apparatus for Transmission of Electrical Energy. U.S. Patent 649,621, 15 May 1900. Available online: https://www.google.com/patents/US649621 (accessed on 6 November 2019).
  21. Tesla, N. Telegraph and Telephone Age. In World System of Wireless Transmission of Energy; Twenty First Century Books: Breckenridge, CO, USA, 1927. [Google Scholar]
  22. Al-Saadi, M.; Al-Gizi, A.G.; Al-Chlaihawi, S.; Al-Omari, A.H. Inductive Power Transfer for Charging the Electric Vehicle Batteries, Inductive Power Transfer for Charging the Electric Vehicle Batteries. Electr. Electr. Autom. (EEA) 2018, 66, 29–39. [Google Scholar]
  23. Hutin, M.; Leblanc, M. Transformer System for Electric Railway, 23 October 1894. Available online: https://patents.google.com/patent/US527857A/en (accessed on 6 November 2019).
  24. Babat, G.I. Electrodeless discharges and some allied problems. J. Inst. Electr. Eng. Part III Radio Commun. Eng. 1947, 94, 27–37. [Google Scholar] [CrossRef]
  25. Jang, Y.J. Survey of the operation and system study on wireless charging electric vehicle systems. Transp. Res. Part C Emerg. Technol. 2018, 95, 844–864. [Google Scholar] [CrossRef]
  26. Brecher, A.; Arthur, D. Review and Evaluation of Wireless Power Transfer (WPT) for Electric Transit Applications (Report 0060); Technical Report; FTA Reports and Publication: New Jersey, NJ, USA, 2014. [Google Scholar]
  27. Panchal, C.; Stegen, S.; Lu, J. Review of static and dynamic wireless electric vehicle charging system. Eng. Sci. Technol. Int. J. 2018, 21, 922–937. [Google Scholar] [CrossRef]
  28. Qiu, C.; Chau, K.T.; Liu, C.; Chan, C.C. Overview of Wireless Power Transfer for Electric Vehicle. In Proceedings of the EVS27 Conference, Barcelona, Spain, 17–20 November 2013. [Google Scholar]
  29. Systems Control Technology, Inc. Roadway Powered Electric Vehicle Project Track Construction and Testing Program Phase 3D; Partners for Advanced Transportation Technology; UC Berkeley: Berkeley, CA, USA, 1994; Available online: https://escholarship.org/uc/item/1jr98590 (accessed on 8 November 2019).
  30. Boys, J.T.; Green, A.W. Inductive Power Pick-Up Coils. WO Patent App. PCT/NZ1994/000,115, 27 April 1995. Available online: https://www.google.com/patents/WO1995011545A1?cl=en (accessed on 8 November 2019).
  31. Boys, J.T.; Green, A.W. Flux Concentrator for an Inductive Power Transfer System. U.S. Patent 5,821,638, 13 October 1998. Available online: https://www.google.com/patents/US5821638 (accessed on 8 November 2019).
  32. Wave Website. Available online: http://www.waveipt.com/ (accessed on 13 September 2017).
  33. Bombardier-Primove in Berlin. Available online: https://www.bombardier.com/fr/media/newsList/details.bt_20150901_-berlin-erste-hauptstadt-mit-kabellos-geladener-e-bu.bombardiercom.html (accessed on 8 November 2019).
  34. Suh, I. Application of shaped magnetic field in resonance (SMFIR) technology to future urban transportation. In Proceedings of the CIRP Design Conference: Interdisciplinary Design; KAIST: Daejeon, Korea, 2011; pp. 226–232. [Google Scholar]
  35. ORNL Surges Forward with 20-Kilowatt Wireless Charging for Electric Vehicles. Available online: https://www.youtube.com/watch?v=NP-SACM3jtQ (accessed on 13 September 2017).
  36. FABRIC EU PROJECT Final Event & Demonstration Video. Available online: https://www.youtube.com/watch?v=ngrJ60o06f8 (accessed on 30 September 2019).
  37. HaloIPT to Provide Induction Charging System for Phantom EE. Available online: http://www.greencarcongress.com/2011/03/haloipt-to-provide-induction-charging-system-for-phantom-ee.html (accessed on 13 September 2017).
  38. Carlson, R.W.; Normann, B. Test results of the plugless inductive charging system from evatran group, inc. SAE Int. J. Alt. Power. 2014, 3, 64–71. [Google Scholar] [CrossRef]
  39. BMW Wireless Charging. Car Charging in 3, 5 Hrs. without a Cable. Available online: https://www.youtube.com/watch?v=GlrcPrzuPMM (accessed on 8 November 2019).
  40. ISO 16290:2013. Available online: https://www.iso.org/fr/standard/56064.html (accessed on 8 November 2019).
  41. FABRIC EU PROJECT. Available online: https://www.fabric-project.eu (accessed on 30 September 2019).
  42. Laporte, S.; Coquery, G.; Révilloud, M.; Deniau, V. Experimental performance assessment of a dynamic wireless power transfer system for future EV in real driving conditions. In Proceedings of the e-Energy’18 9th International Conference on Future Energy System, Karlsruhe, Germany, 12–15 June 2018; pp. 570–578. [Google Scholar]
  43. International Telecommunication Union. Wireless Power Transmission Using Technologies Other than Radio Frequency Beam, Report ITU-R SM.2303-2, 06 2017. Available online: https://www.itu.int/dms_pub/itu-r/opb/rep/R-REP-SM.2303-2-2017-PDF-E.pdf (accessed on 8 November 2019).
  44. Revilloud, M.; Gruyer, D.; Rahal, M.C. A new multi-agent approach for lane detection and tracking. In Proceedings of the International Conference on Robotics and Automation (ICRA), Stockholm, Sweden, 16–21 May 2016. [Google Scholar]
  45. FABRIC EU PROJECT/Deliverable/FABRIC_Validation_Methodology (D4.7.1). Available online: https://www.fabric-project.eu/www.fabric-project.eu/images/Deliverables/FABRIC_D4.7.1_V2_20171006_FABRIC_Validation_methodology_submitted.pdf (accessed on 30 September 2019).
  46. International Commission on Non-Ionizing Radiation Protection. Guidelines for limiting exposure to time-varying electric and magnetic fields (1Hz–100 kHz). Health Phys. 2010, 6, 818–836. [Google Scholar]
  47. Railway Applications—Electromagnetic Compatibility—Part 2: Emission of the Whole Railway System to the Outside World; CENELEC, EN 50121-2; International Electrotechnical Commission: Geneva, Switzerland, 2017.
  48. Dynamic Electric Vehicle Charging-Fully Charged. Available online: https://www.youtube.com/watch?v=2t0E4AcVu6o (accessed on 30 September 2019).
  49. Savoye, F.; Venet, P.; Pelissier, S.; Millet, M.; Groot, J. Impact of periodic current pulses on Li-ion batteries lifetime in vehicular application. Int. J. Electr. Hybrid Vehicles 2015, 7, 323–341. [Google Scholar] [CrossRef]
  50. Keil, P.; Jossen, A. Impact of Dynamic Driving Loads and Regenerative Braking on the Aging of Lithium-Ion Batteries in Electric Vehicles. J. Electrochem. Soc. 2017, 164, A3081–A3092. [Google Scholar] [CrossRef]
  51. Bessman, A.; Soares, R.; Wallmarkb, O.; Svensa, P.; Lindbergha, G. Aging effects of AC harmonics on lithium-ion cells. J. Energy Storage 2019, 21, 741–749. [Google Scholar] [CrossRef]
  52. Park, S. Evaluation of Electromagnetic Exposure during 85 kHz Wireless Power Transfer for Electric Vehicles. IEEE Trans. Magn. 2018, 54. [Google Scholar] [CrossRef]
  53. Zucca, M.; Bottauscio, O.; Harmon, S.; Guilizzoni, R.; Schilling, F.; Schmidt, M.; Ankarson, P.; Bergsten, T.; Tammi, K.; Sainio, P.; et al. Metrology for Inductive Charging of Electric Vehicles (MICEV). In Proceedings of the 2019 AEIT International Conference of Electrical and Electronic Technologies for Automotive (AEIT AUTOMOTIVE), Torino, Italy, 2–4 July 2019. [Google Scholar]
  54. FABRIC EU PROJECT/Deliverable/Analysis of Deployment Scenarios, Standardization and Harmonization (D5.5.4). Available online: https://www.fabric-project.eu/images/Deliverables/FABRIC_D5.5.4_Deployment_and_Standard_Feb2018_submitted.pdf (accessed on 30 September 2019).
  55. FABRIC EU PROJECT/Deliverable/Interoperability Considerations (D33.3). Available online: https://www.fabric project.eu/images/Deliverables/FABRIC_D33.3_Interoperability_considerations_2017_update.pdf (accessed on 30 September 2019).
  56. Cirimele, V.; Torchio, R.; Virgillito, A.; Freschi, F.; Alotto, P. Challenges in the Electromagnetic Modeling of Road Embedded Wireless Power Transfer. Energies 2019, 12, 2677. [Google Scholar] [CrossRef]
  57. Oslo to Become First City to Charge Electric Taxis over the Air. Available online: https://www.reuters.com/article/us-norway-electric-taxis/oslo-to-become-first-city-to-charge-electric-taxis-over-the-air-idUSKCN1R21ED (accessed on 8 November 2019).
  58. Foote, A.; Onar, O.C.; Debnath, S.; Chinthavali, M.; Ozpineci, B.; Smith, D.E. Optimal Sizing of a Dynamic Wireless Power Transfer System for Highway Applications. In Proceedings of the 2018 IEEE Transportation Electrification Conference and Expo (ITEC), Long Beach, CA, USA, 13–15 June 2018. [Google Scholar]
  59. Mohamed, A.A.S.; Meintz, A.; Zhu, L. System Design and Optimization of In-route Wireless Charging Infrastructure for Shared Automated Electric Vehicles. IEEE Access 2019, 7, 79968–79979. [Google Scholar] [CrossRef]
  60. Mohamed, A.A.S.; Lashway, C.R.; Mohammed, O. Modeling and Feasibility Analysis of Quasi dynamic WPT System for EV Applications. IEEE Trans. Transp. Electrif. 2017, 3, 343–353. [Google Scholar] [CrossRef]
  61. Lam, A.Y.S.; Leung, K.; Li, V.O.K. Vehicular Energy Network. IEEE Trans. Transp. Electrif. 2017, 3, 392–404. [Google Scholar] [CrossRef]
  62. Pei, J.; Zhou, B.; Lyu, L. e-Road: The largest energy supply of the future. Appl. Energy 2019, 241, 174–183. [Google Scholar] [CrossRef]
Figure 1. Versailles-Satory experimental demonstration concept overview for the Versailles-Satory test site.
Wevj 10 00084 g001
Figure 2. Views of the experimental track pre-cast trench-based initial concept with a roadside DC/AC conversion cabinet behind the existing wall.
Wevj 10 00084 g002
Figure 3. Views of the finally implemented experimental road with 3 cm thick removable composite covers.
Wevj 10 00084 g003
Figure 4. Functional schematics of electric infrastructure feeding the charging lane and showing the different conversion stages from grid (400 V AC) to coils emitting a magnetic field pulsated at 85 kHz.
Wevj 10 00084 g004
Figure 5. Car Dynamic Wireless Power Transfer (DWPT) system components (in blue), main additional measurement and localization equipment (in green), main car original components related to the system (in yellow).
Wevj 10 00084 g005
Figure 6. Lane-Keeping Assistant (LKA) based on a lane-tracking video system integrated in the HMI developed for the FABRIC project.
Wevj 10 00084 g006
Figure 7. Views of car prototypes. (a) First car prototype (EV1) used to test the first versions of the charging system with view of the open central trench containing road embedded emitter coil system; (b) view of the second car prototype (EV2) with finally implemented vehicle instrumentation.
Wevj 10 00084 g007
Figure 8. Example of car reference point trajectory (middle of car rear axle) in track coordinates during at 50 km/h 18 kW charge test (x and y in m).
Wevj 10 00084 g008
Figure 9. Measurement locations for B magnetic field measurements inside the vehicle points.
Wevj 10 00084 g009
Figure 10. B Magnetic field emission measurements outside the vehicle.
Wevj 10 00084 g010
Figure 11. Two-step tests using different duckboard layers.
Wevj 10 00084 g011
Figure 12. Example of on-board pulsated current and voltages generated by the prototype Dynamic IPT system charging at 20 kW while driving at 10 km/h.
Wevj 10 00084 g012
Figure 13. Efficiency indicator values as a function of absolute average misalignment. This indicator is calculated as the ratio between the actual efficiency for a test run over the maximum recorded efficiency value from a 54-test series.
Wevj 10 00084 g013
Figure 14. B-field measurements inside the vehicle for front passengers showing values below 27 μT following International Commission on Non-Ionizing Radiation Protection (ICNIRP) 2010 applicable requirements.
Wevj 10 00084 g014
Figure 15. Radiated emissions measured 10 m away from the system.
Wevj 10 00084 g015
Figure 16. Estimated airgap variation of the front pad data merged with power received by the battery data.
Wevj 10 00084 g016
Figure 17. Potential of Dynamic Bidirectional WPT in a future road infrastructure ecosystem.
Wevj 10 00084 g017
Table 1. This table describes the main demonstrations of Inductive Power Transmission systems in non-guided surface transport applications. The last line includes the FABRIC project target specifications for the Versailles-Satory demonstration.
YearProjectVeh. TypeDriving CondAir Gap cmMax Power kWOp. Freq. HzEff. %Ref. and Outcomes
1980sPATH UC BerkeleyBusDynamic5–102002060Ref. [29]
Project Stopped
1997Conductix-WampflerBusStatic Stationary43015 Patents [30,31]
First commercialized static WPT
2011SELECT Utah State UniversityBusStatic Stationary15–25252090Ref. [32]
Commercial activities (WAVE)
2011PRIMOVE BombardierBusStatic Stationary Dynamic 20020>85Ref. [33]
Commercialization static systems in Mannheim, Berlin
2011KAIST OlevBusStatic Stationary Dynamic15–201002085Ref. [34]
First commercialized dynamic wireless charging bus
2016ONRLPass. carSlow dynamic 2022–2390Ref. [35]
Research Laboratory conditions
2017FABRIC Versailles-Satory Site2 serial Pass. carsStationary to highway speed (100 km/h)17.52085 Ref. [36]
Experimental representative road
Table 2. Details of the type of measurement instruments used for the characterization in this study.
Data MeasuredMeasuring Equipment DescriptionMeasuring RangeRelative Resolution
Vehicle Battery Voltage (UBAT)Voltage transducer0–350 V0.6%
Vehicle Battery Current (IBAT)Current transducer0–200 A<0.5%
Grid Power (UDC Line and IDC Line) Multiphase precision Power meter <0.05%
Distance to the ground (4 points)Laser transducer0–500 mm<0.5%
Table 3. Summary of the different test conditions. The maximum recorded values in different driving conditions were compared to ICNIRP 2010 [46] levels.
Car PrototypesDriving ConditionsCharging Power (kW)Speed (km/h)ICNIRP 2010 Compliant
EV1 & EV2Car inter-distance: 50 m1820Yes
EV1 & EV2Car inter-distance: 50 m1850Yes
EV1 & EV2Car inter-distance: 50 m1870Yes
EV2Stationary 5 s205–10–5–0Yes
EV2Zig-Zag2020Yes
EV2Misalignment Target 15 cm right2040Yes
EV2Misalignment Target 15 cm left2040Yes

