
Numerical Simulation of Hydrogen Leakage and Diffusion Process of Fuel Cell Vehicle

School of Mechanical, Electronic and Control Engineering, Beijing Jiaotong University, Beijing 100044, China
*
Author to whom correspondence should be addressed.
World Electr. Veh. J. 2021, 12(4), 193; https://0-doi-org.brum.beds.ac.uk/10.3390/wevj12040193
Submission received: 24 August 2021
/
Revised: 29 September 2021
/
Accepted: 9 October 2021
/
Published: 15 October 2021
(This article belongs to the Special Issue Towards Intelligent E-Mobility—Selected Papers from The 34th International Electric Vehicles Symposium and Exhibition (Nanjing, China))
Abstract
:Regarding the problem of hydrogen diffusion of the fuel cell vehicle (HFCV) when its hydrogen supply system leaks, this research uses the FLUENT software to simulate numerical values in the process of hydrogen leakage diffusion in both open space and closed space. This paper analyzed the distribution range and concentration distribution characteristics of hydrogen in these two different spaces. Besides, this paper also took a survey about the effects of leakage rate, wind speed, wind direction in open space and the role the air vents play on hydrogen safety in closed space, which provides a reference for the hydrogen safety of HFCV. In conclusion, the experiment result showed that: In open space, hydrogen leakage rate has a great influence on its diffusion. When the leakage rate doubles, the hydrogen leakage range will expand about 1.5 times simultaneously. The hydrogen diffusion range is the smallest when the wind blows at 90 degrees, which is more conducive to hydrogen diffusion. However, when the wind direction is against the direction of the leakage of hydrogen, the range of hydrogen distribution is maximal. Under this condition, the risk of hydrogen leakage is highest. In an enclosed space, when the vent is set closest to the leakage position, the volume fraction of hydrogen at each time is smaller than that at other positions, so it is more beneficial to safety.
1. Introduction
Hydrogen energy as a new type of energy is increasingly gaining attention. As a clean fuel, hydrogen has widely been used in fuel cell vehicles. However, hydrogen is not only combustible, but also easy to leak and diffuse. Once accidental hydrogen leakage occurs in fuel cell vehicles, it will affect people and their surroundings. Therefore, it is necessary to study the hydrogen leakage and diffusion of fuel cell vehicles. Many scholars have studied hydrogen leakage and diffusion characteristics through field experiments [1,2,3] and computational fluid dynamics [4,5,6].
Limited by testing conditions, most of the relevant research at home and abroad is carried out by numerical simulation methods. Domestic scholars’ simulation of hydrogen leakage and diffusion process in open space focuses on the analysis of hydrogen concentration distribution and diffusion distance in dangerous areas, and there are several discussions about influencing factors such as leakage volume, leakage location and environmental wind. Yu Zhao [7] simulated the concentration and combustible area of hydrogen leakage. Liu yanlei of Zhejiang University [8] studied the effects of different ambient wind speeds and temperatures on the diffusion distance of dangerous areas after hydrogen leakage in open space, and simulated the volume, velocity, pressure and temperature distribution in open space. Xu Ping et al. [9] studied the hydrogen diffusion nephogram and diffusion distance at different leakage positions. Zheng Jinyang et al. [10] studied the effects of distance between leakage hole and obstacle and obstacle height on hydrogen volume fraction and diffusion distance in open space.
Foreign scholars have studied the hydrogen leakage and diffusion in confined space and analyzed the influence of vents in closed places such as garage and underground parking lots. Schoi et al. [11] simulated the diffusion process of hydrogen in the parking lot and analyzed the change of volume ratio of combustible area with time under different hydrogen leakage flow. Hajji et al. [12,13,14] studied the relevant influencing factors such as the position, shape and size of the vent for hydrogen leakage in the garage with a top angle of 120°. Prasad et al. [15] simulated the leakage and diffusion process of hydrogen under different vent areas and positions in the garage. Matsuura et al. [16,17,18] studied the laws of hydrogen leakage and diffusion in two sizes of space, and compared and analyzed the changes of hydrogen leakage and diffusion under different ventilation conditions. Papanikolaou et al. [19] analyzed the correlation between hydrogen diffusion and vents in the garage. Kazuo Matsuura et al. [20] studied the transient behavior and aggregation process of hydrogen in partially open space. Barrey et al. [21] studied the effects of leakage source height, ventilation mode and leakage rate on gas diffusion distribution by using helium instead of hydrogen. Cariteau et al. [22] studied the effects of leakage rate, vent area, quantity and location on hydrogen leakage diffusion and accumulation by using helium instead of hydrogen in confined space. Ekoto et al. [23] studied the diffusion and combustion characteristics of forklift hydrogen leakage in the warehouse, as well as the effects of mitigation measures such as natural ventilation, mechanical ventilation and pressure relief membrane. Giannissi et al. [24,25] established a numerical simulation model of hydrogen leakage and diffusion in confined space under natural ventilation and verified the effectiveness of the model by comparing the test and simulation results. Gupta et al. [26] experimented in the garage and found that the leakage had a greater effect on the helium concentration distribution in the garage space.
To sum up, most researchers focused on the influencing factors of hydrogen leakage and diffusion in open space and confined space, and achieved abundant research results. In this paper, the structural characteristics of fuel cell vehicle and on-board hydrogen supply system are analyzed. The concentration distribution characteristics of hydrogen leakage and diffusion in open space and closed space are studied by using Fluent software. In this paper, the hydrogen leakage and diffusion process of HFCV in open and closed spaces is simulated and analyzed by Fluent. Based on the existed research, the safety problems of fuel cell vehicle and its surroundings under different environmental factors and influencing factors are explored. The objective of this paper is to evaluate and guide the safety of hydrogen distribution around the whole vehicle after hydrogen leakage in different environments by CFD.
2. Numerical Simulation Model
2.1. Physical Model
On the basis of the analysis of fuel cell vehicles and vehicle—board hydrogen supply system structure, the physical model is simplified, the hydrogen storage bottle, cab and chassis structure are retained, and the pipes and valves are omitted. The cab and chassis are reduced to rectangular, the hydrogen cylinder is reduced to cylindrical, and the 10 m × 4 m × 5 m rectangular computing space is determined. The cab is 1.84 m × 2.55 m × 3.086 m rectangular, the chassis is 5.54 m × 2.55 m and the hydrogen storage bottle is a rectangle with a diameter of 1.11 m and a height of 2.162 m. The hydrogen storage bottle is 0.9 m, the hydrogen storage tank above the chassis is 0.87 m away from the rear wall of the cab, and the body is 1 m high from the ground. To reduce the computational time, half of the simplified model is taken as the physical model for the solution calculation, as is shown in Figure 1.
Three leakage ports, which are recorded as leakage ports I, II, III, are created based on the physical model. The leakage ports I and II are located below the hydrogen storage bottle and respectively leak to the rear and front of the car. The leakage port III is located on the side of the bottle and leaks upward. The leakage port is shown in Figure 2. After the hybrid grid is used to divide the grid, the unstructured grid is divided near the hydrogen storage bottle and the bottle mouth, and the other areas are divided into hexahedron structured grids. The grid number is about 950,000, and the grid division results are shown in Figure 3.
2.2. Boundary Conditions
In this paper, Fluent software is used to carry out numerical simulation, and the following settings in Table 1 are made before calculation:
(1) Boundary conditions: mass flow inlet is adopted for the gas leakage port; The boundary and vent of the calculation domain adopt the pressure outlet; The air inlet adopts speed inlet to simulate the environment of different wind speeds.
(2) Hydrogen leaks evenly at a constant rate, and the leakage port is the mass flow inlet;
(3) Hydrogen and air are ideal gases, and there is no chemical reaction in the process of mixing and flow;
(4) Considering the influence of buoyancy and gravity, the gravity is—9.81 m/s2;
(5) The outlet is a pressure outlet, and the wall surface is smooth without sliding;
(6) Select realizable K- ε Turbulence model and component transport model are used for unsteady simulation.
2.3. Mathematical Model
The process of hydrogen leakage and diffusion needs to be described by solving the gas mass, momentum, energy and component equations. The control equations include mass conservation equation, momentum conservation equation, energy conservation equation and component transport equation.
(1) Mass conservation equation
The process of hydrogen leakage and diffusion in the air of fuel cell vehicle meets the mass conservation equation. After hydrogen leakage, mass exchange occurs with air in X, Y and Z directions, and the hydrogen velocity decreases. After considering the change of gas density and velocity, the continuity equation of hydrogen leakage diffusion process is shown in Formula (1):
(2) Momentum conservation equation
During the process of hydrogen leakage and diffusion, parameters such as density, velocity and pressure of gas change constantly. Momentum conservation equation establishes the relationship between gas density, velocity, pressure and external force. In rectangular coordinates, the momentum conservation equation of hydrogen leakage and diffusion process is:
(3) Energy conservation equation
Due to the different air temperature between hydrogen and the leakage environment, there is heat exchange between hydrogen and the environment in the leakage diffusion process, which meets the energy conservation equation. The energy conservation equation of hydrogen leakage diffusion process:
(4) Component conservation equation
Hydrogen leaks and diffuses in the air, which belongs to the single-phase two-component diffusion problem. The component conservation equation of hydrogen leakage diffusion process is as follows:
In hydrogen leakage diffusion simulations, the following equation should be expressed based on the energy, momentum, mass conservation law and component transport equation.
The τ is time, the ∅ is a general variable, the ρ is gas density, kg/m3; Γ is diffusion coefficient, the S is source term, and the is the component of velocity vector along the x, y, z direction, m/s.
2.4. Model Validation
The hydrogen leakage and diffusion test in space made by Pitts et al. [27] is simulated and verified to verify the rationality and accuracy of the simulation method used in this paper to simulate the concentration distribution in the process of hydrogen leakage and diffusion in space, tested at 6.1 m × 6.1 m × 3.05 m. The physical model established according to the test scenario is shown in Figure 4a. Hydrogen leaks upward into the space through a square leakage port with a side length of 0.305 m at the height of 0.15 m in the lower part of the space.
In the experiment, two monitoring points are selected and set as A1 (3.05 m, 3.05 m, −5.49 m) and A2 (3.05 m, 0.38 m, −5.49 m), respectively. The test data at the two monitoring points are compared with the hydrogen concentration data simulated and calculated in this paper, as shown in Figure 4b. It can be seen that the simulation results are basically consistent with the experimental results, so it is considered that this method can be used to simulate the concentration in the process of hydrogen leakage and diffusion in space.
3. Results
3.1. Hydrogen Leakage and Diffusion Process HFCV Open Space and Influencing Factors
3.1.1. Location of Leakage
When hydrogen leaks to the rear of the vehicle, the hydrogen leakage is less affected by the cab and space structure, and it has a large hydrogen concentration distribution range. In the case of hydrogen leakage from the leakage port I, the hydrogen concentration distribution around the whole car body is shown in Figure 5. It can be seen that when hydrogen begins to leak in open space, hydrogen mainly diffuses along the direction of leakage, and the concentration distribution range increases. In the stable stage, the cross section width of hydrogen gas mass gradually widens with the increase of diffusion distance.
Figure 6 shows the hydrogen concentration distribution of leakage port II in open space. It can be seen that when hydrogen leaks, it will spread quickly to the rear wall of the cab, and the hydrogen concentration in the corner between the cab and the chassis, resulting in the hydrogen storage bottle and the chassis area of the car as higher. When the leakage is continuous, there is always hydrogen distribution on the back wall of the cab. If the hydrogen leakage is not stopped in time, the hydrogen will spread to the cab, and if so, the combustion explosion will endanger the safety of the driver.
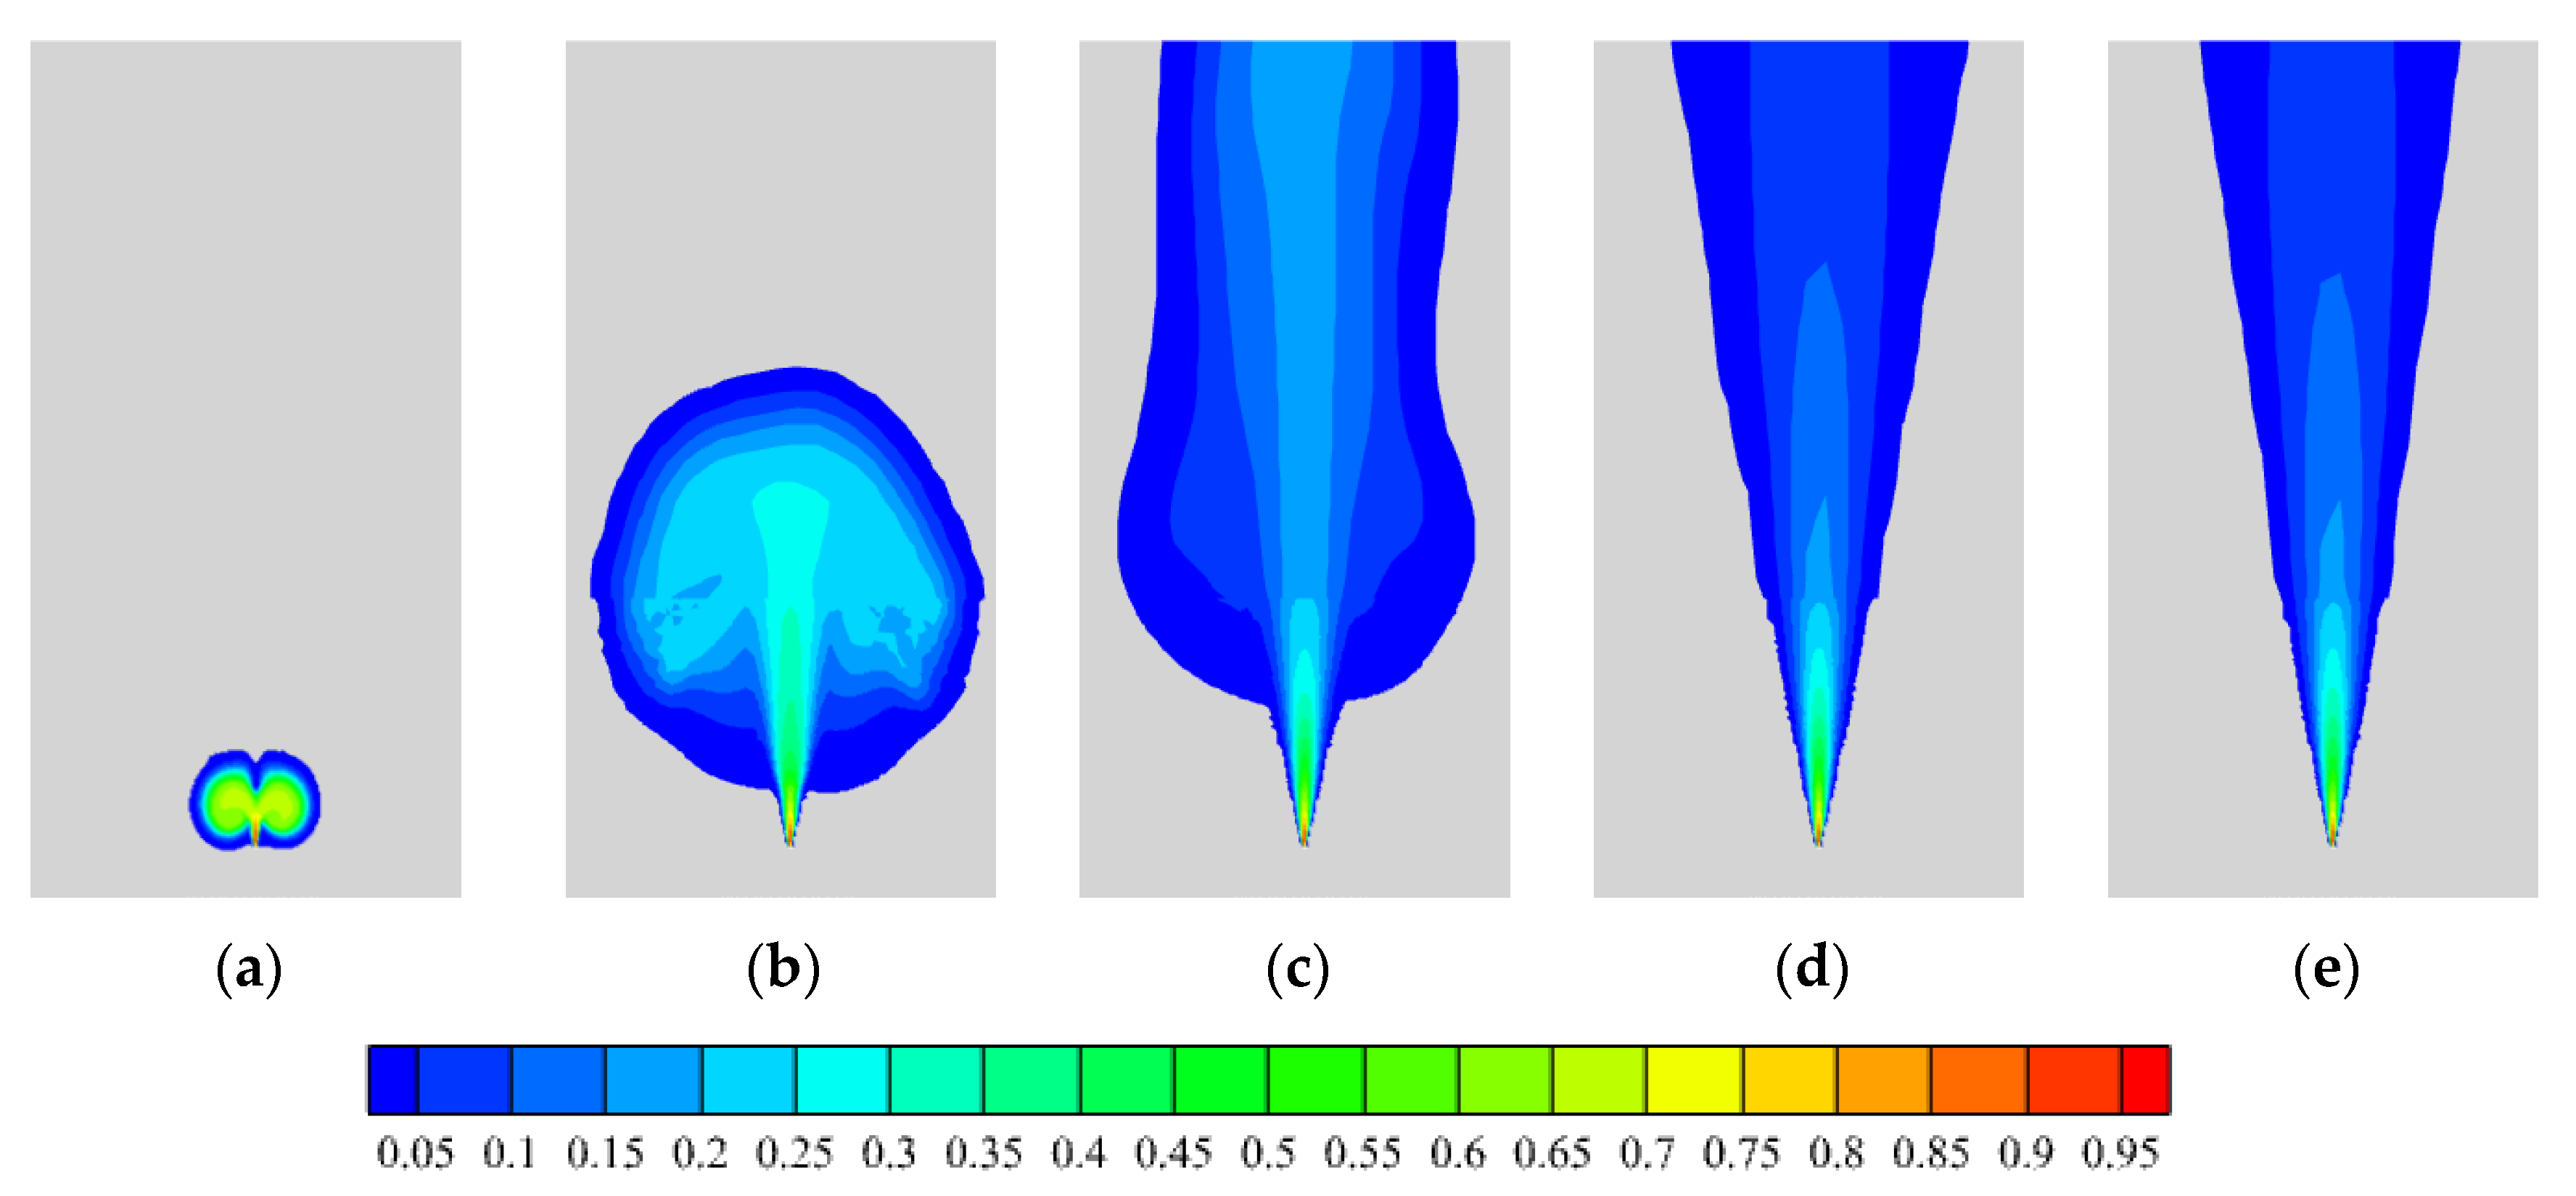
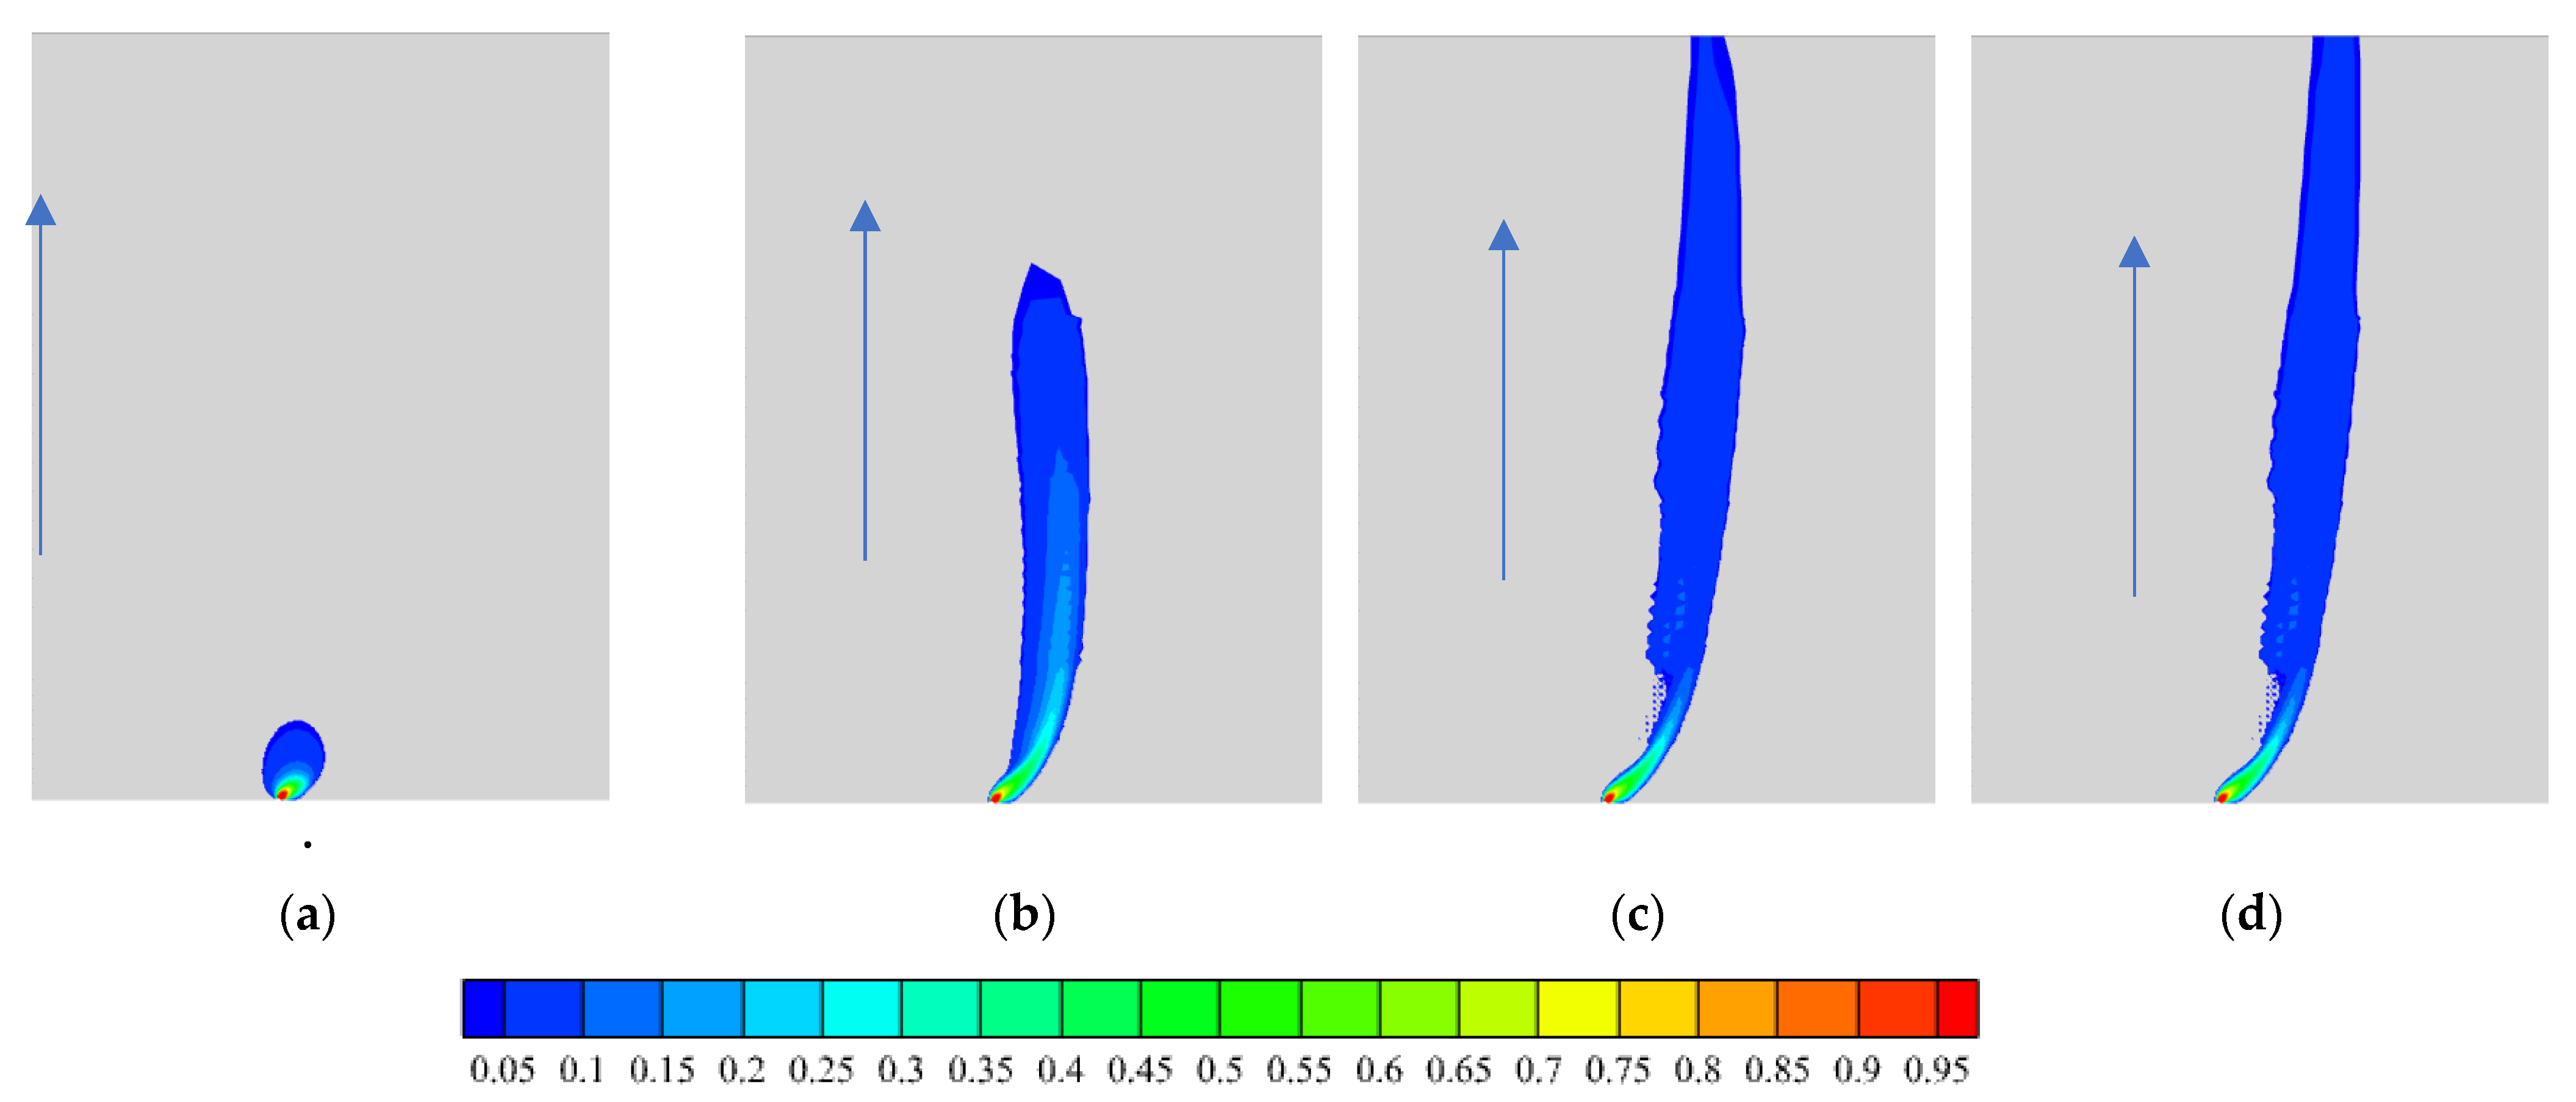
When hydrogen leaks vertically from leakage port III, hydrogen is less affected by the structure of the vehicle. Figure 6 shows the distribution of hydrogen concentration in this area. From Figure 7, it can be seen that hydrogen diffuses rapidly upward at the beginning of leakage, and the distribution range of hydrogen concentration is basically stable. With the increase of hydrogen diffusion height, the width of hydrogen section also increases, and the boundary of hydrogen concentration is conical.
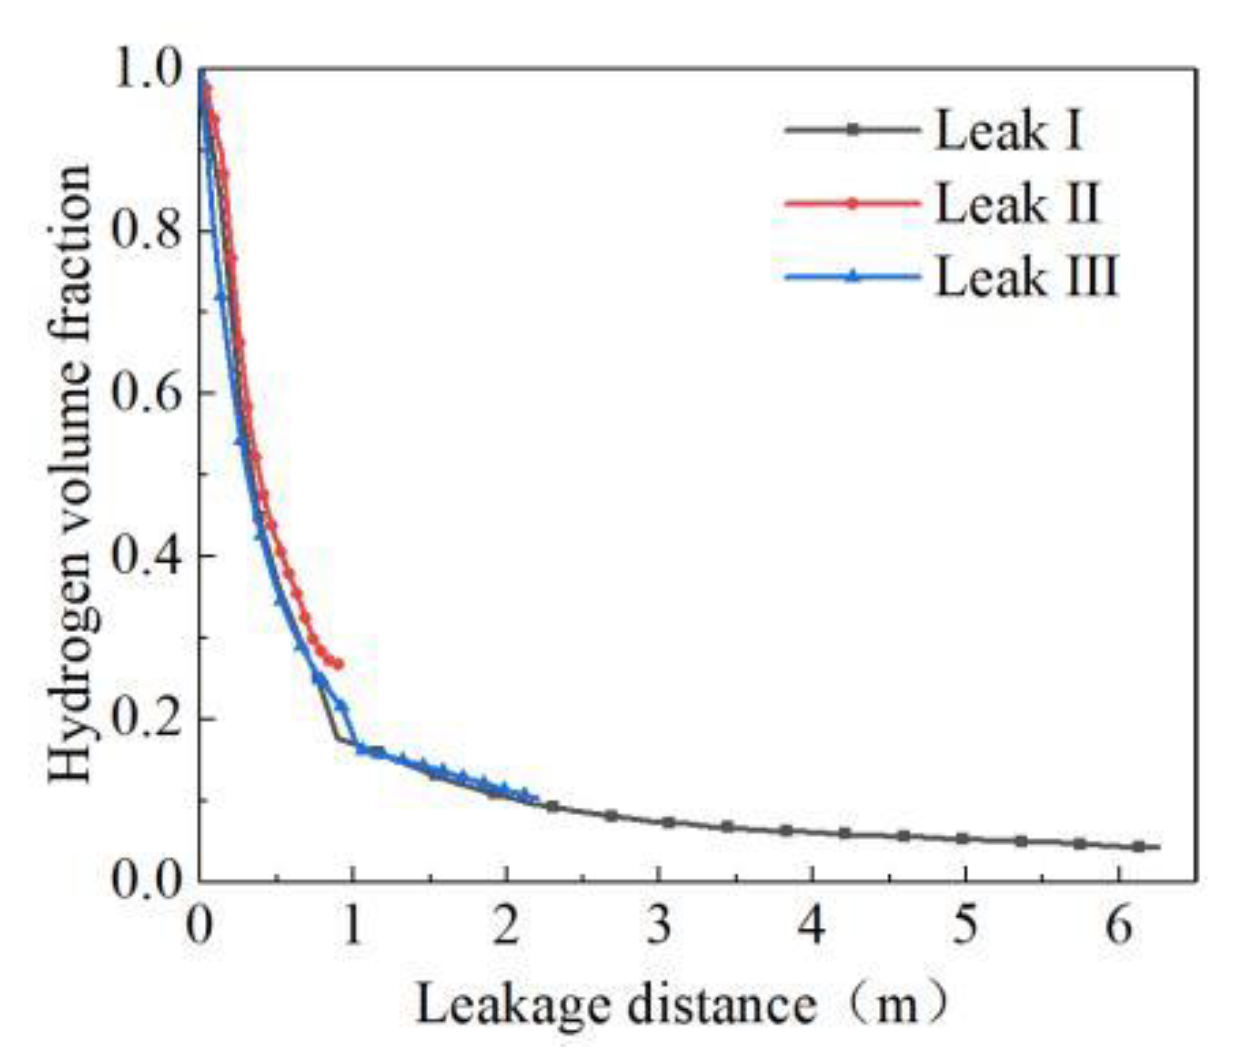
The change of hydrogen concentration on the three outlet leakage axes is compared as is shown in Figure 8. It can be seen that when the leakage rate, leakage diameter and other parameters are the same, the hydrogen concentration change curve on the leakage axis is basically the same, and the leakage port and hydrogen leakage axis are 6.255 m, 0.9 m and 2.2 m. It can be concluded that the safe distance of hydrogen diffusion under this simulation condition is about 6.25 m long.
3.1.2. Rate of Leakage
During the hydrogen leakage process, the leakage port pressure constantly decreases, and the leakage rate also constantly decreases. In no wind open space, mouth leakage of 10 mm, with hydrogen leaking to the rear at selected rates of 20 g/s, 10 g/s and 5 g/s of leakage are utilized for simulation. The distribution of hydrogen concentration at different leakage rates is shown in Figure 9 and Figure 10.
3.1.3. Wind Speed
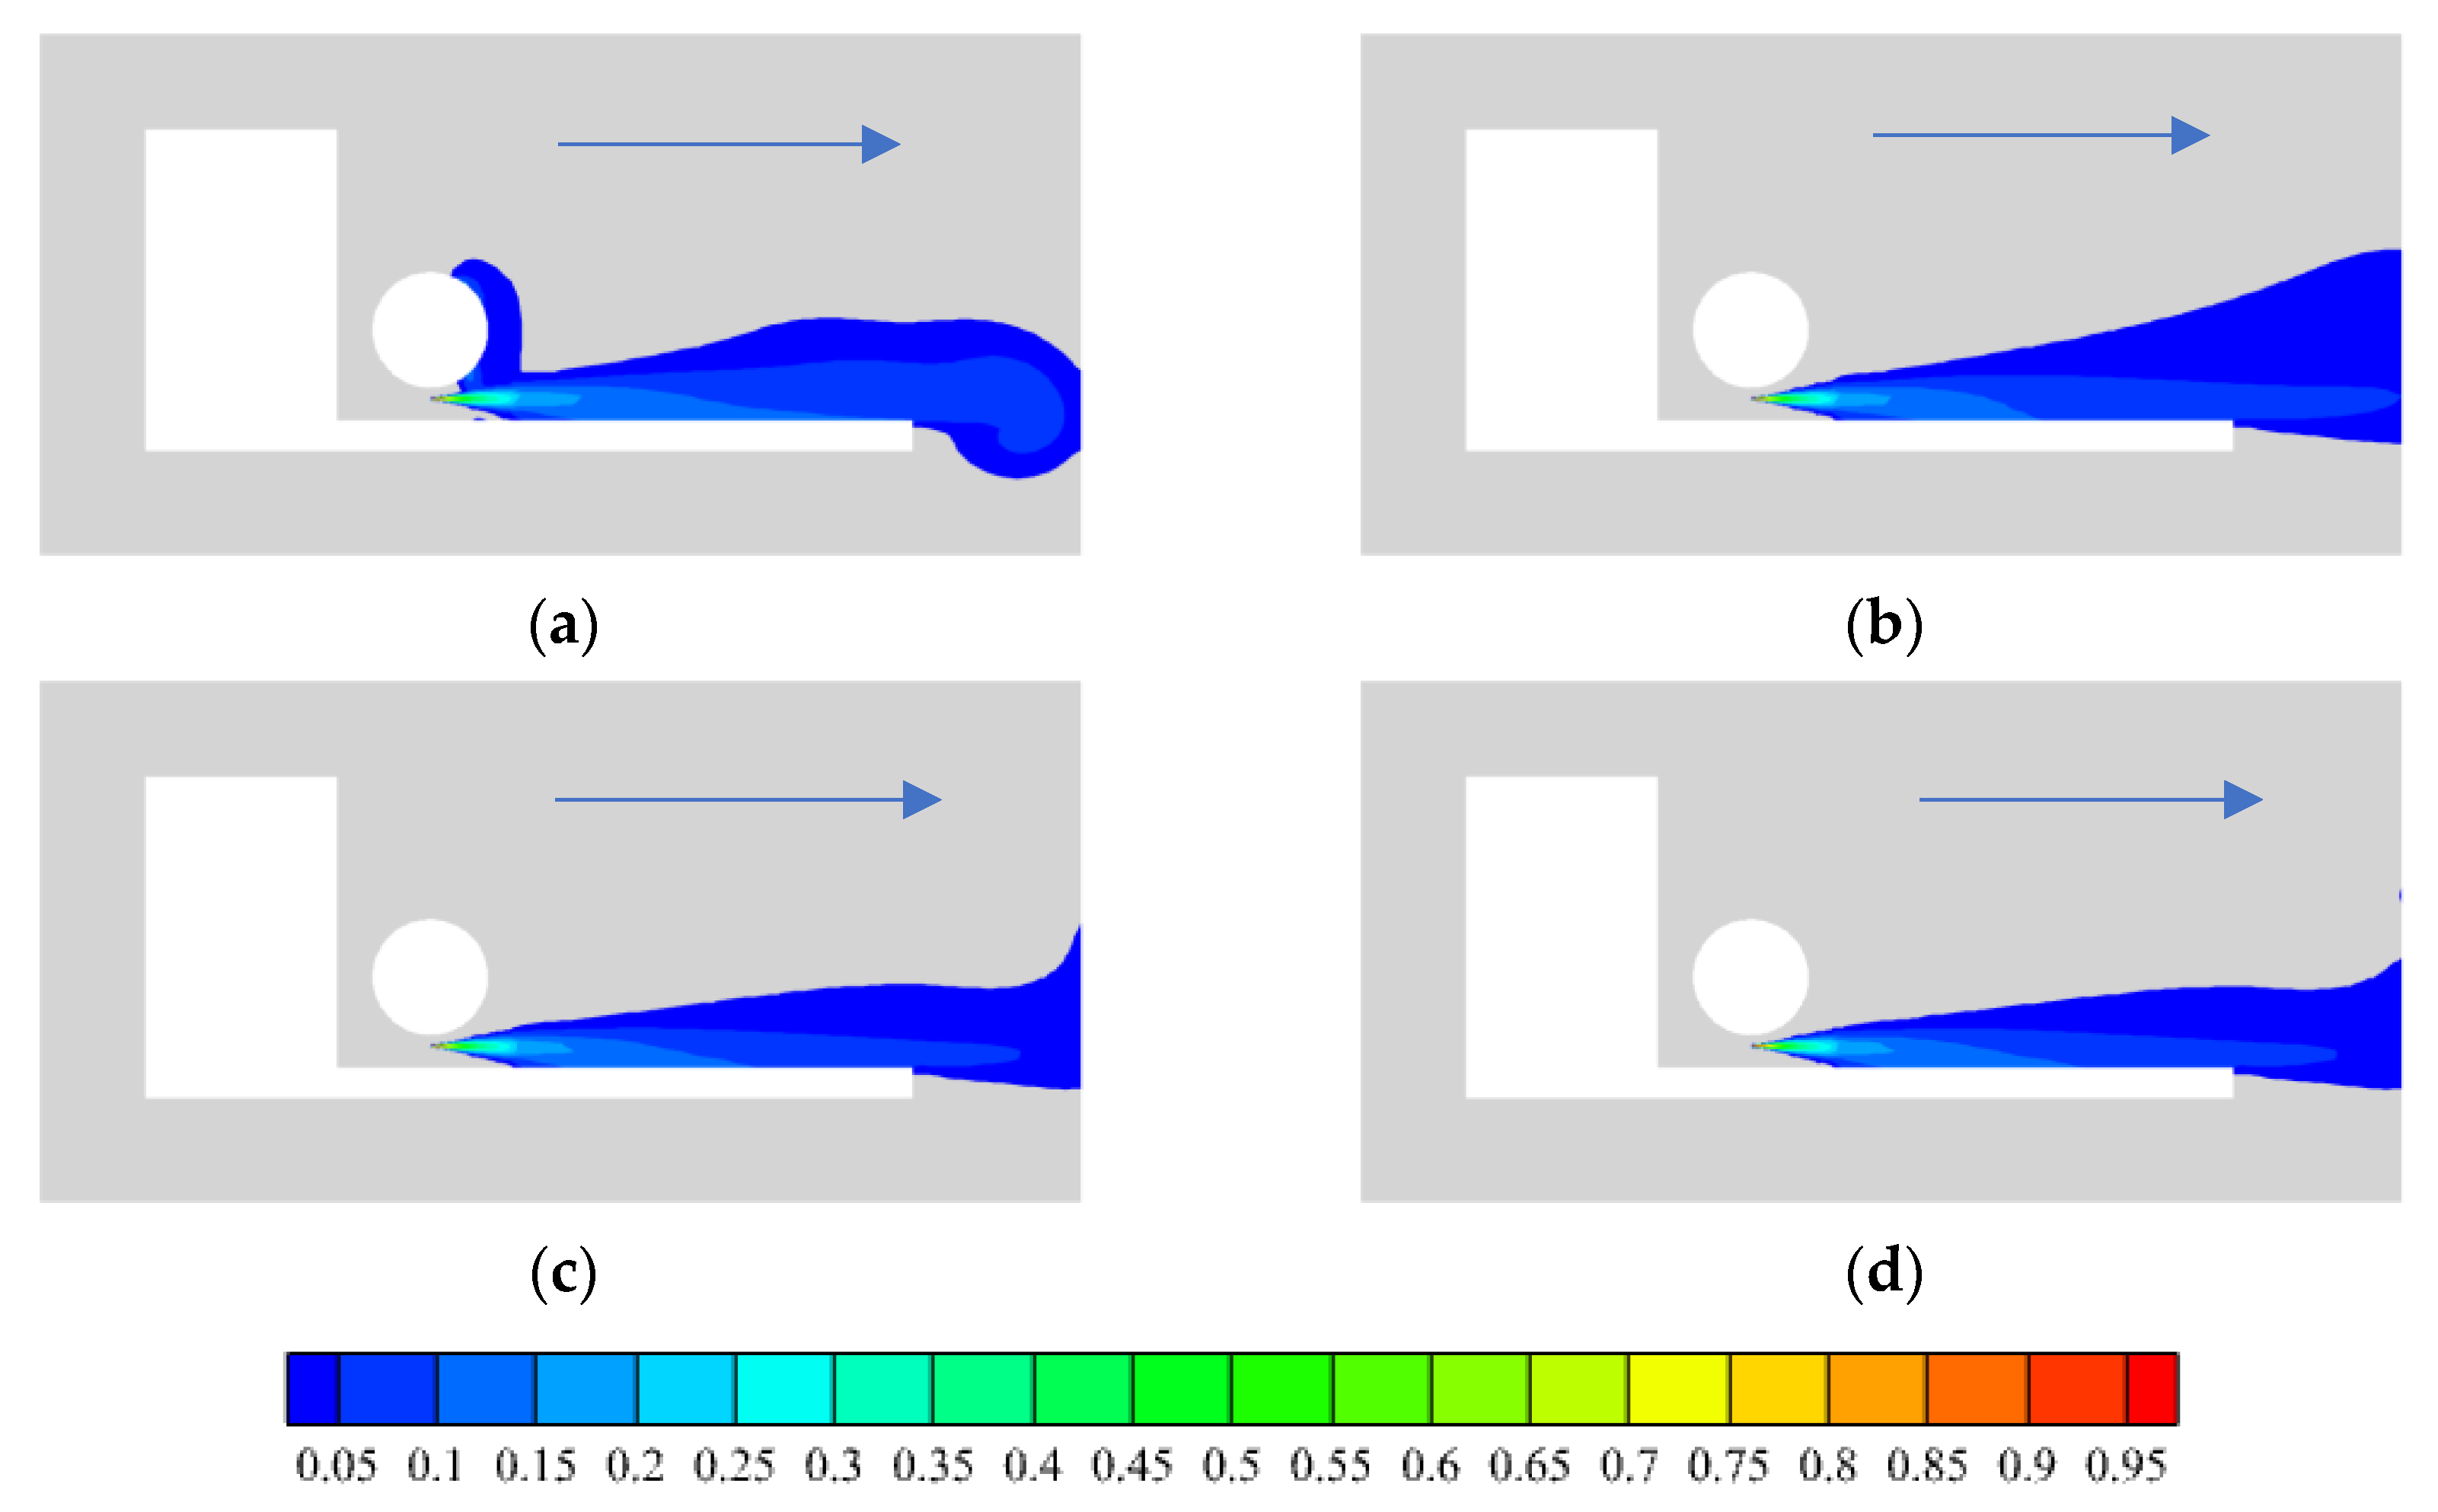
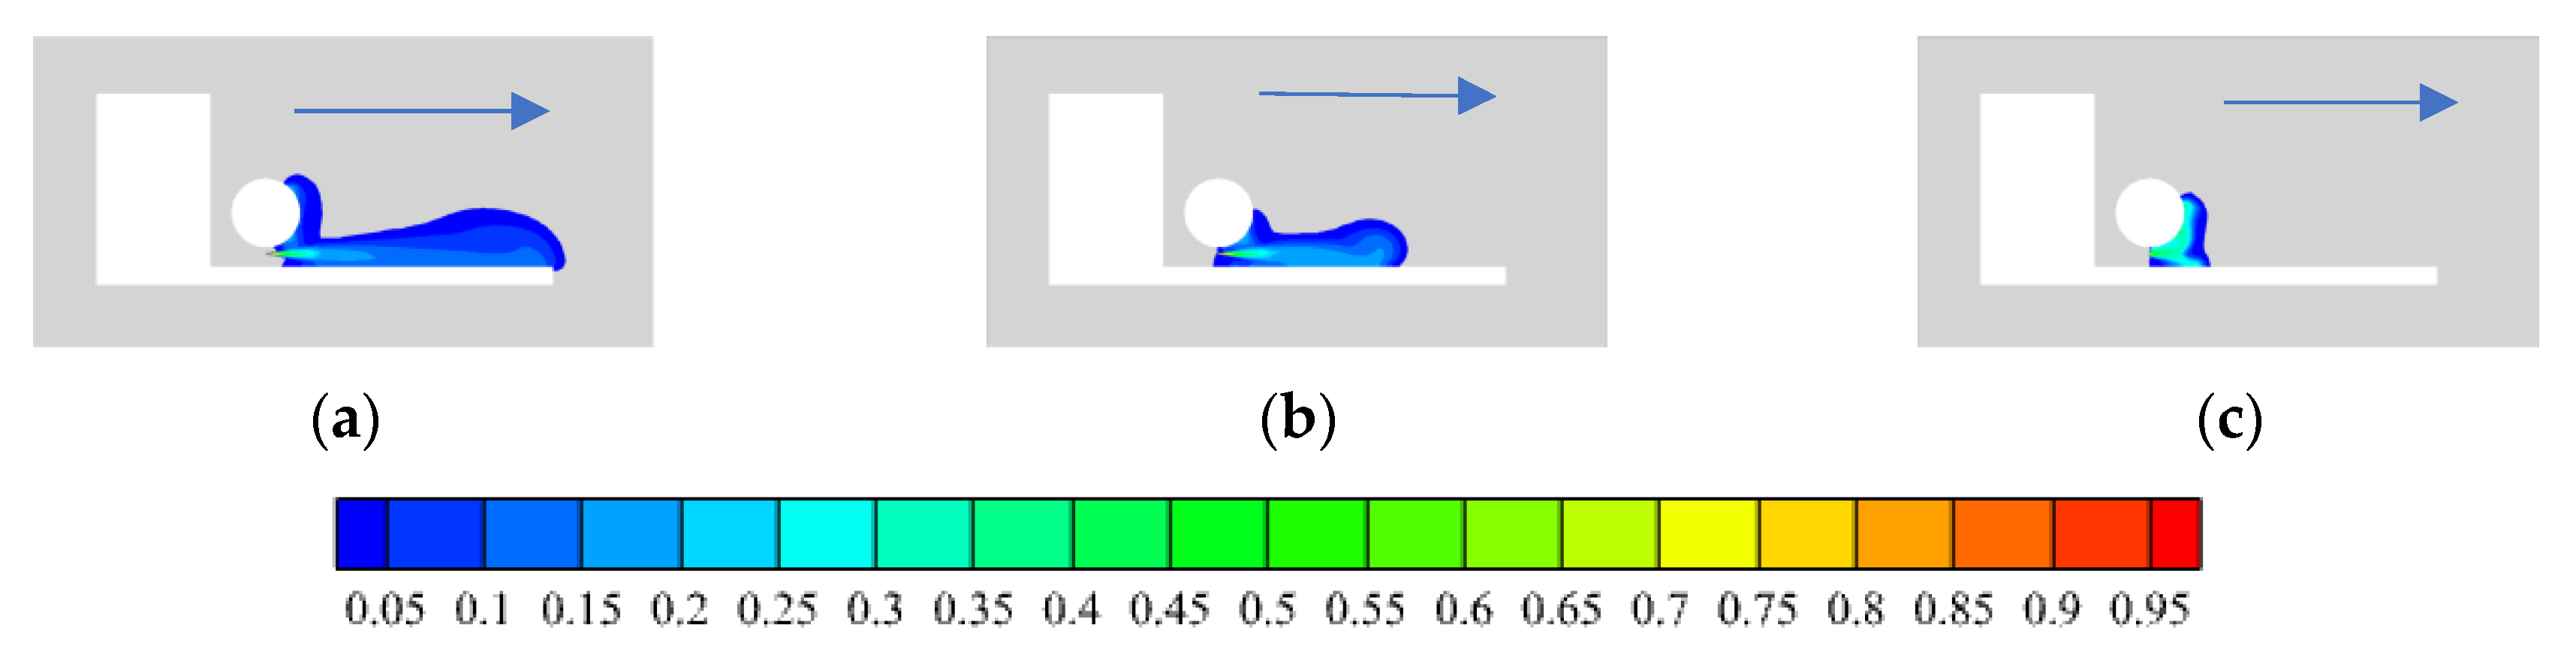
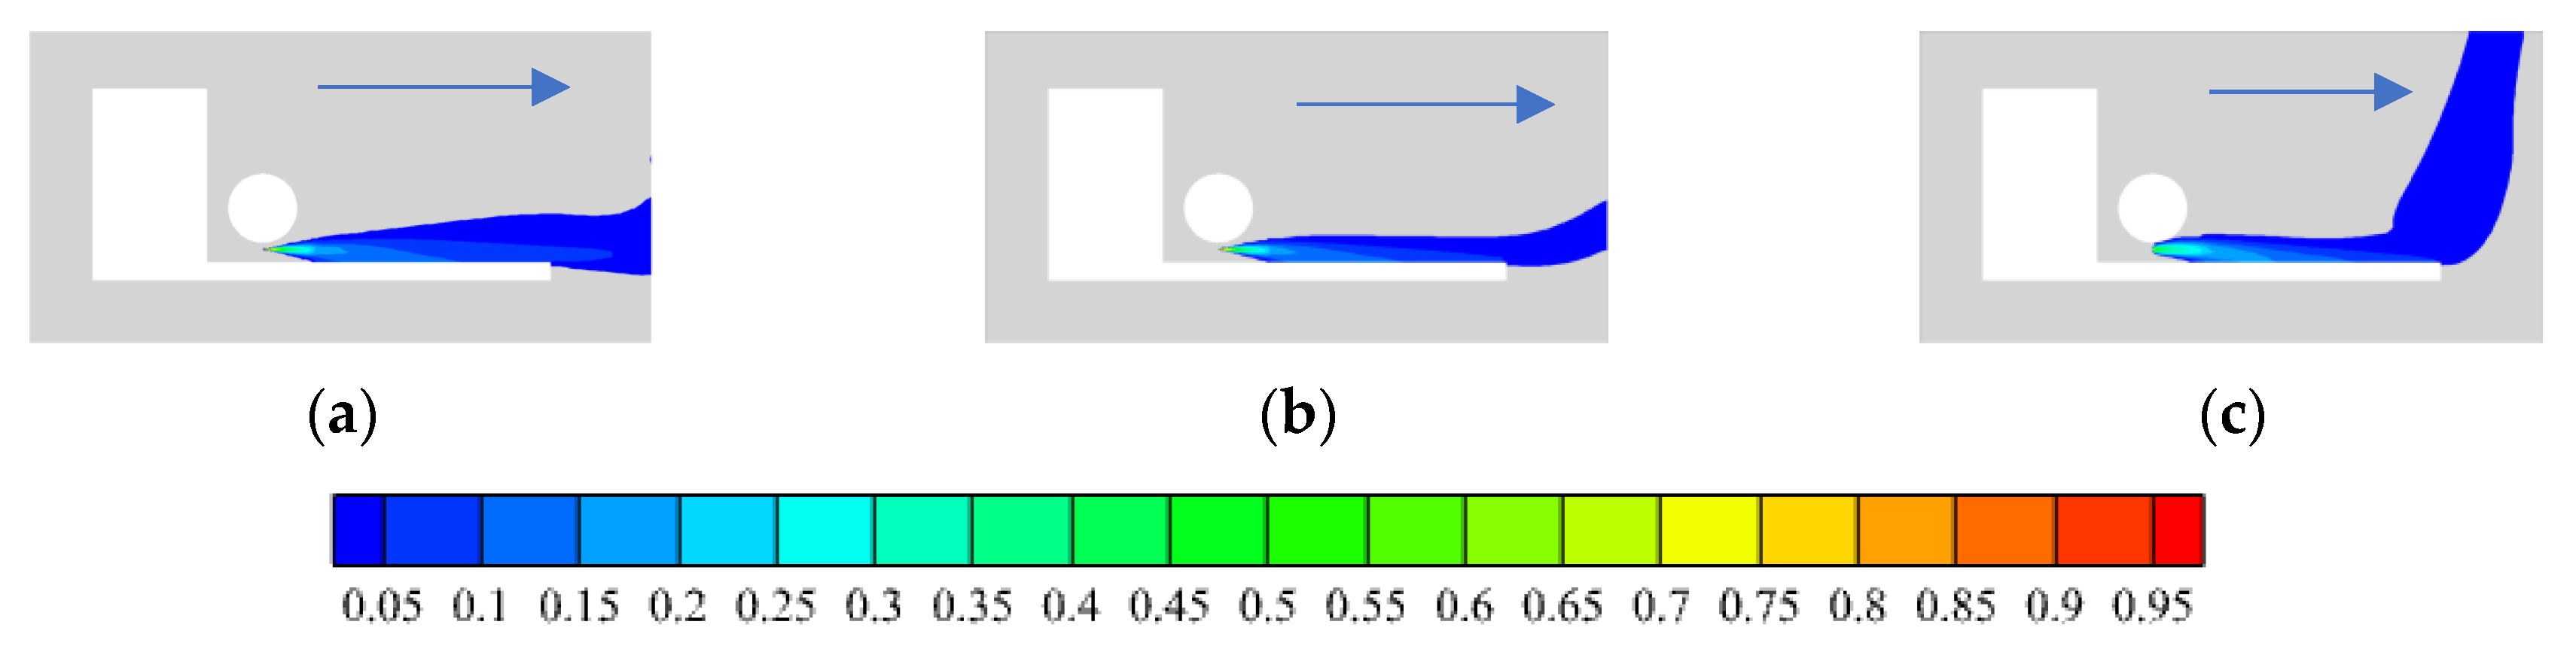
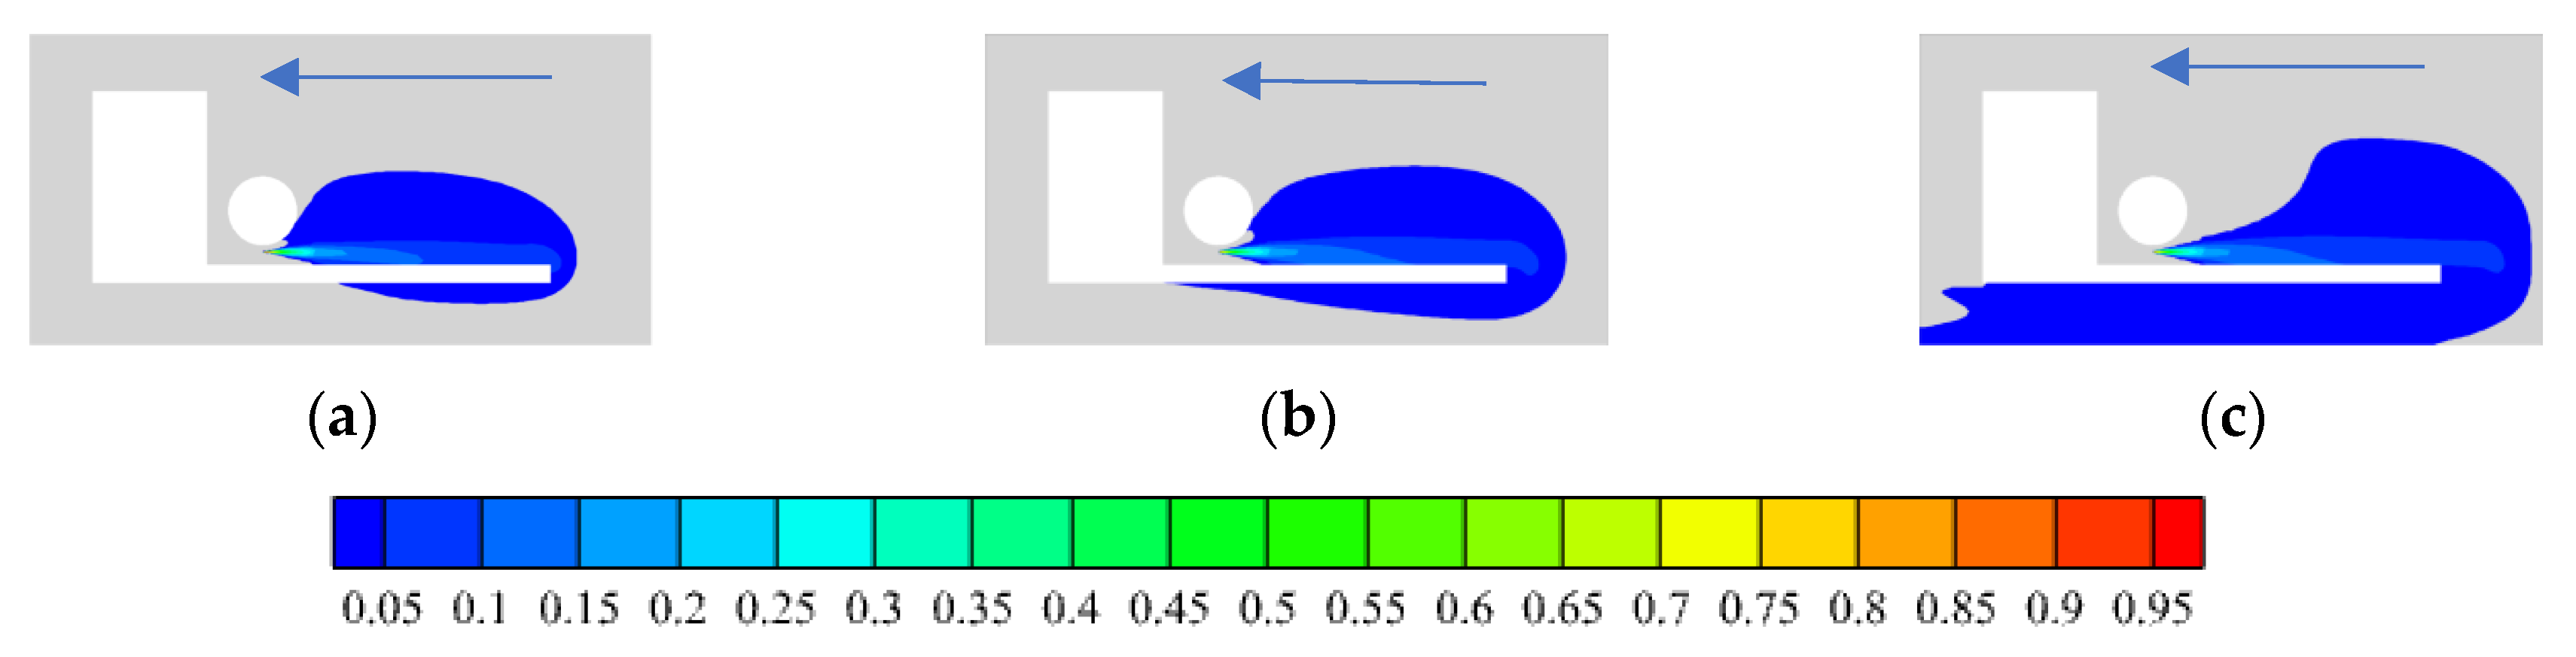
In an open environment, when hydrogen leaks to the rear of the car, hydrogen under the wind is easy to spread to the cab, so the risk is higher. The simulation investigates the influence of different wind speed on hydrogen leakage and diffusion under the reverse wind direction and simulates the distribution of hydrogen concentration at different leakage times when the reverse wind speed is 10 m/s, 5 m/s and 2 m/s, respectively. The distribution of hydrogen concentration at different wind speeds is shown in Figure 11 and Figure 12.
When hydrogen begins to leak, hydrogen is distributed at the angle between the rear wall and the upper wall of the chassis at 10 m/s wind speed and the surface of the hydrogen storage bottle. At 5 m/s and 2 m/s wind speed, hydrogen mainly diffuses to the rear of the vehicle. The greater the headwind speed, the slower the hydrogen diffuses along the leakage direction. It can be seen that the smaller the headwind speed, the larger the concentration distribution range of hydrogen, especially with the difference of hydrogen distribution range under the chassis.
3.1.4. Wind Direction
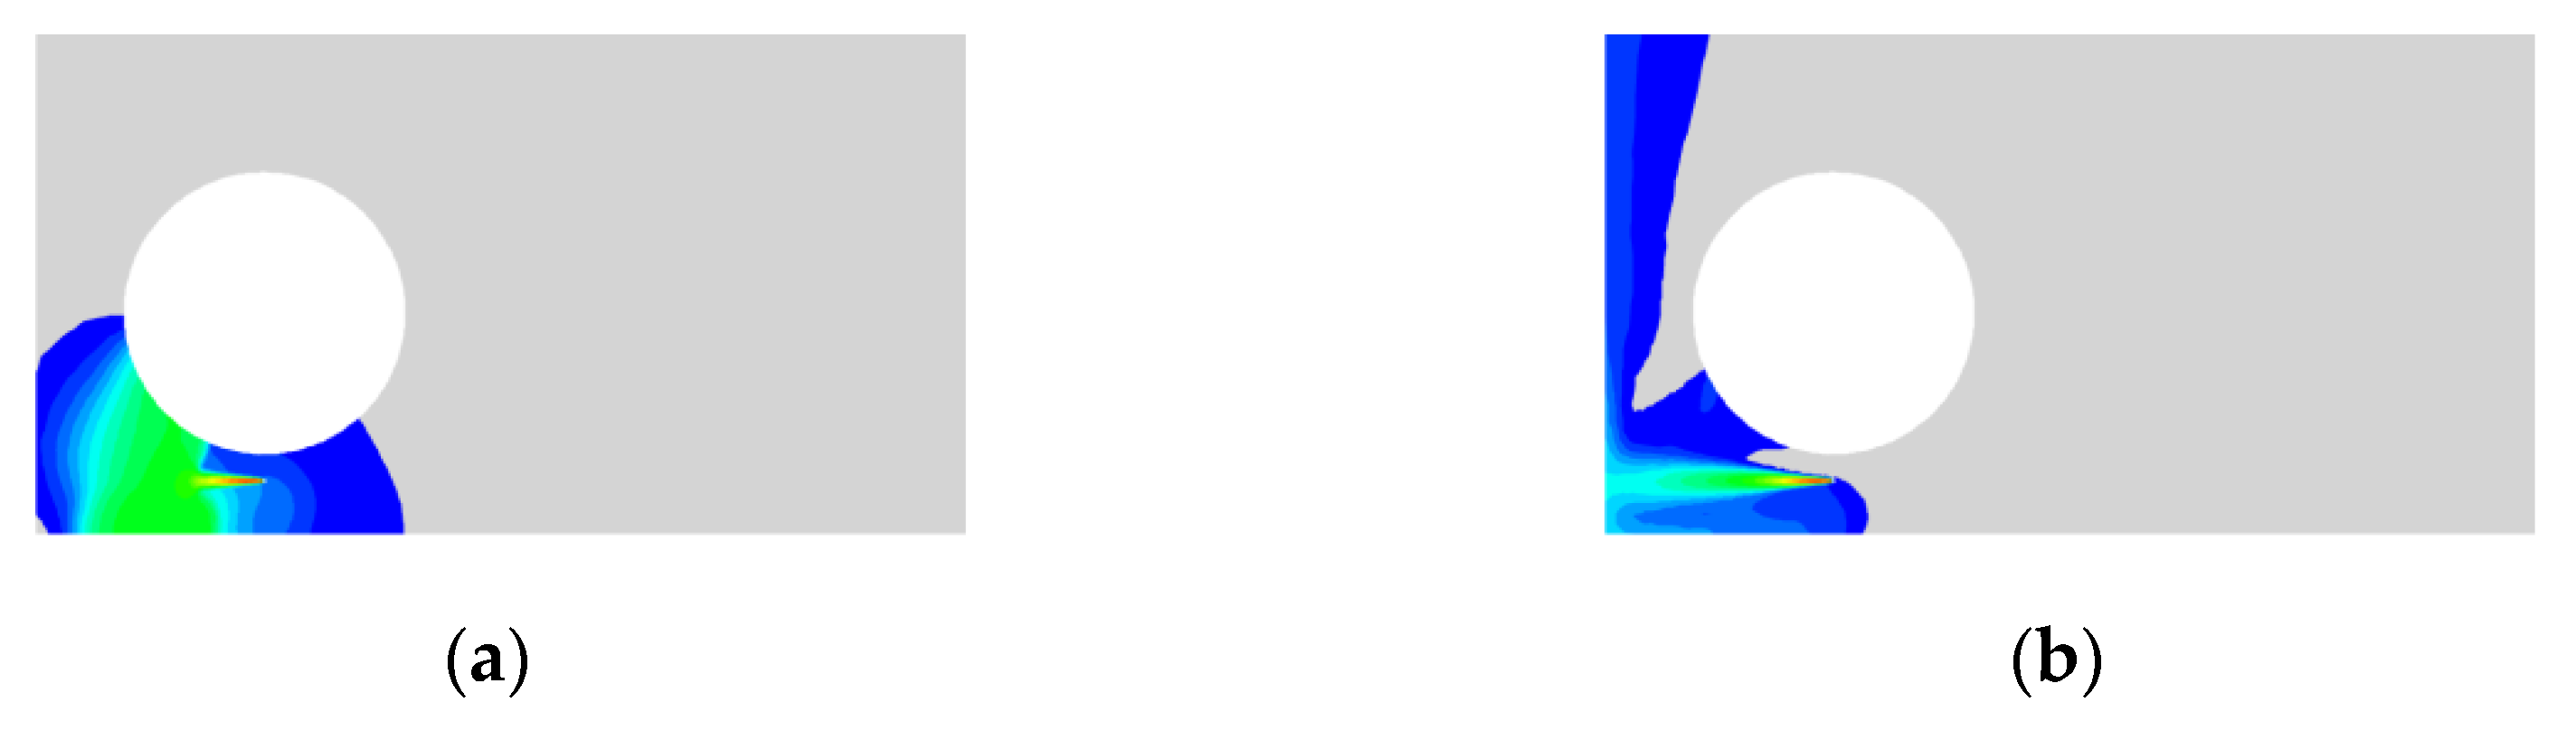
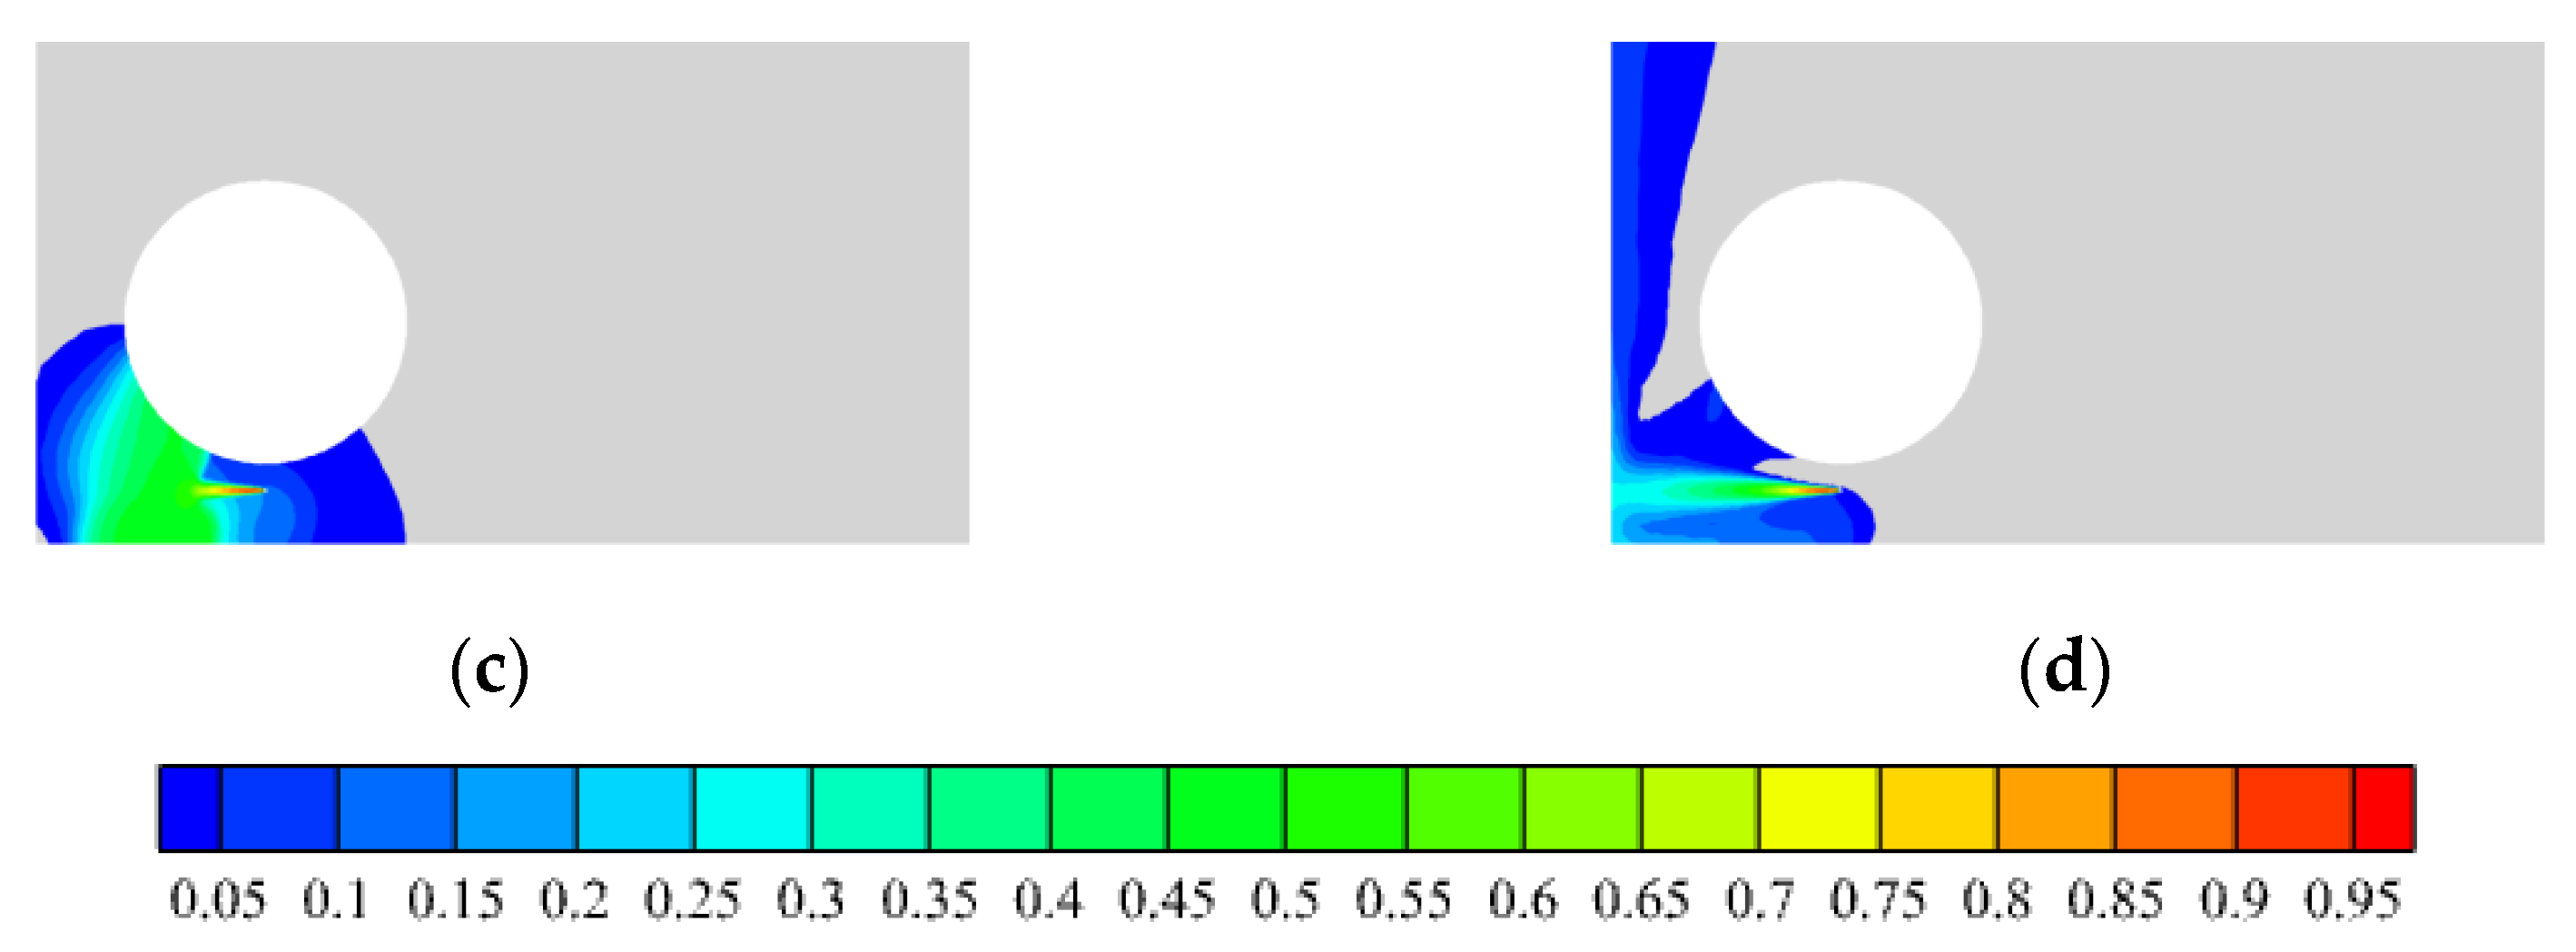
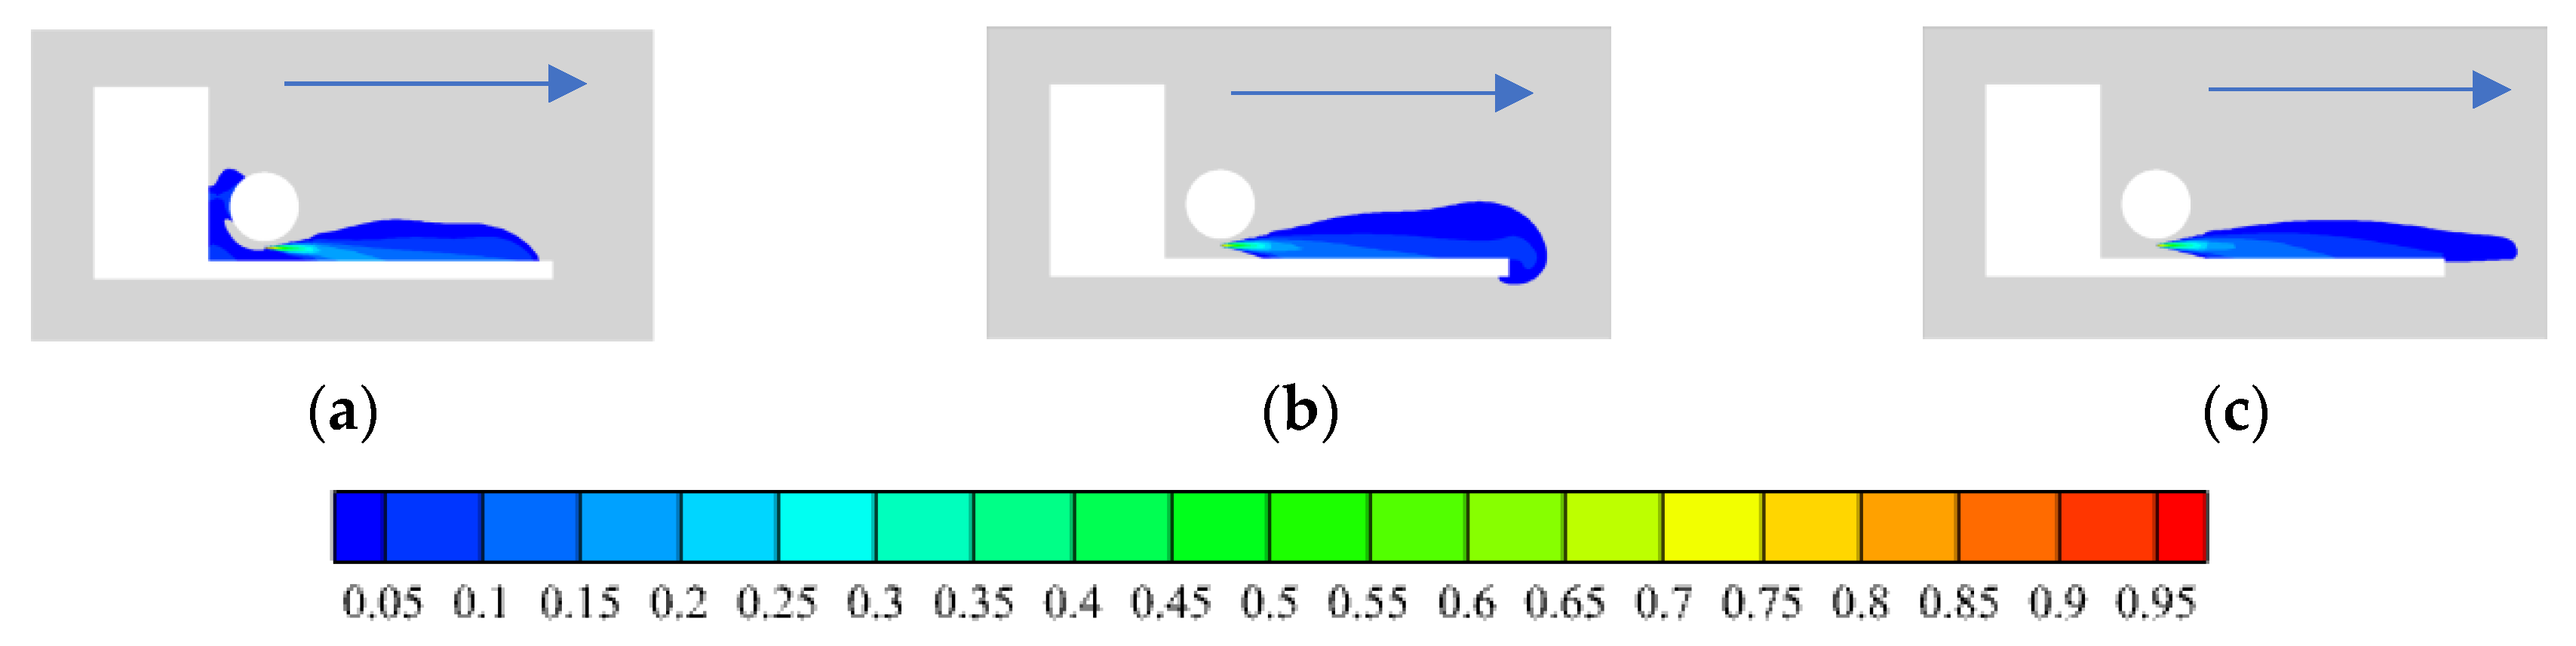
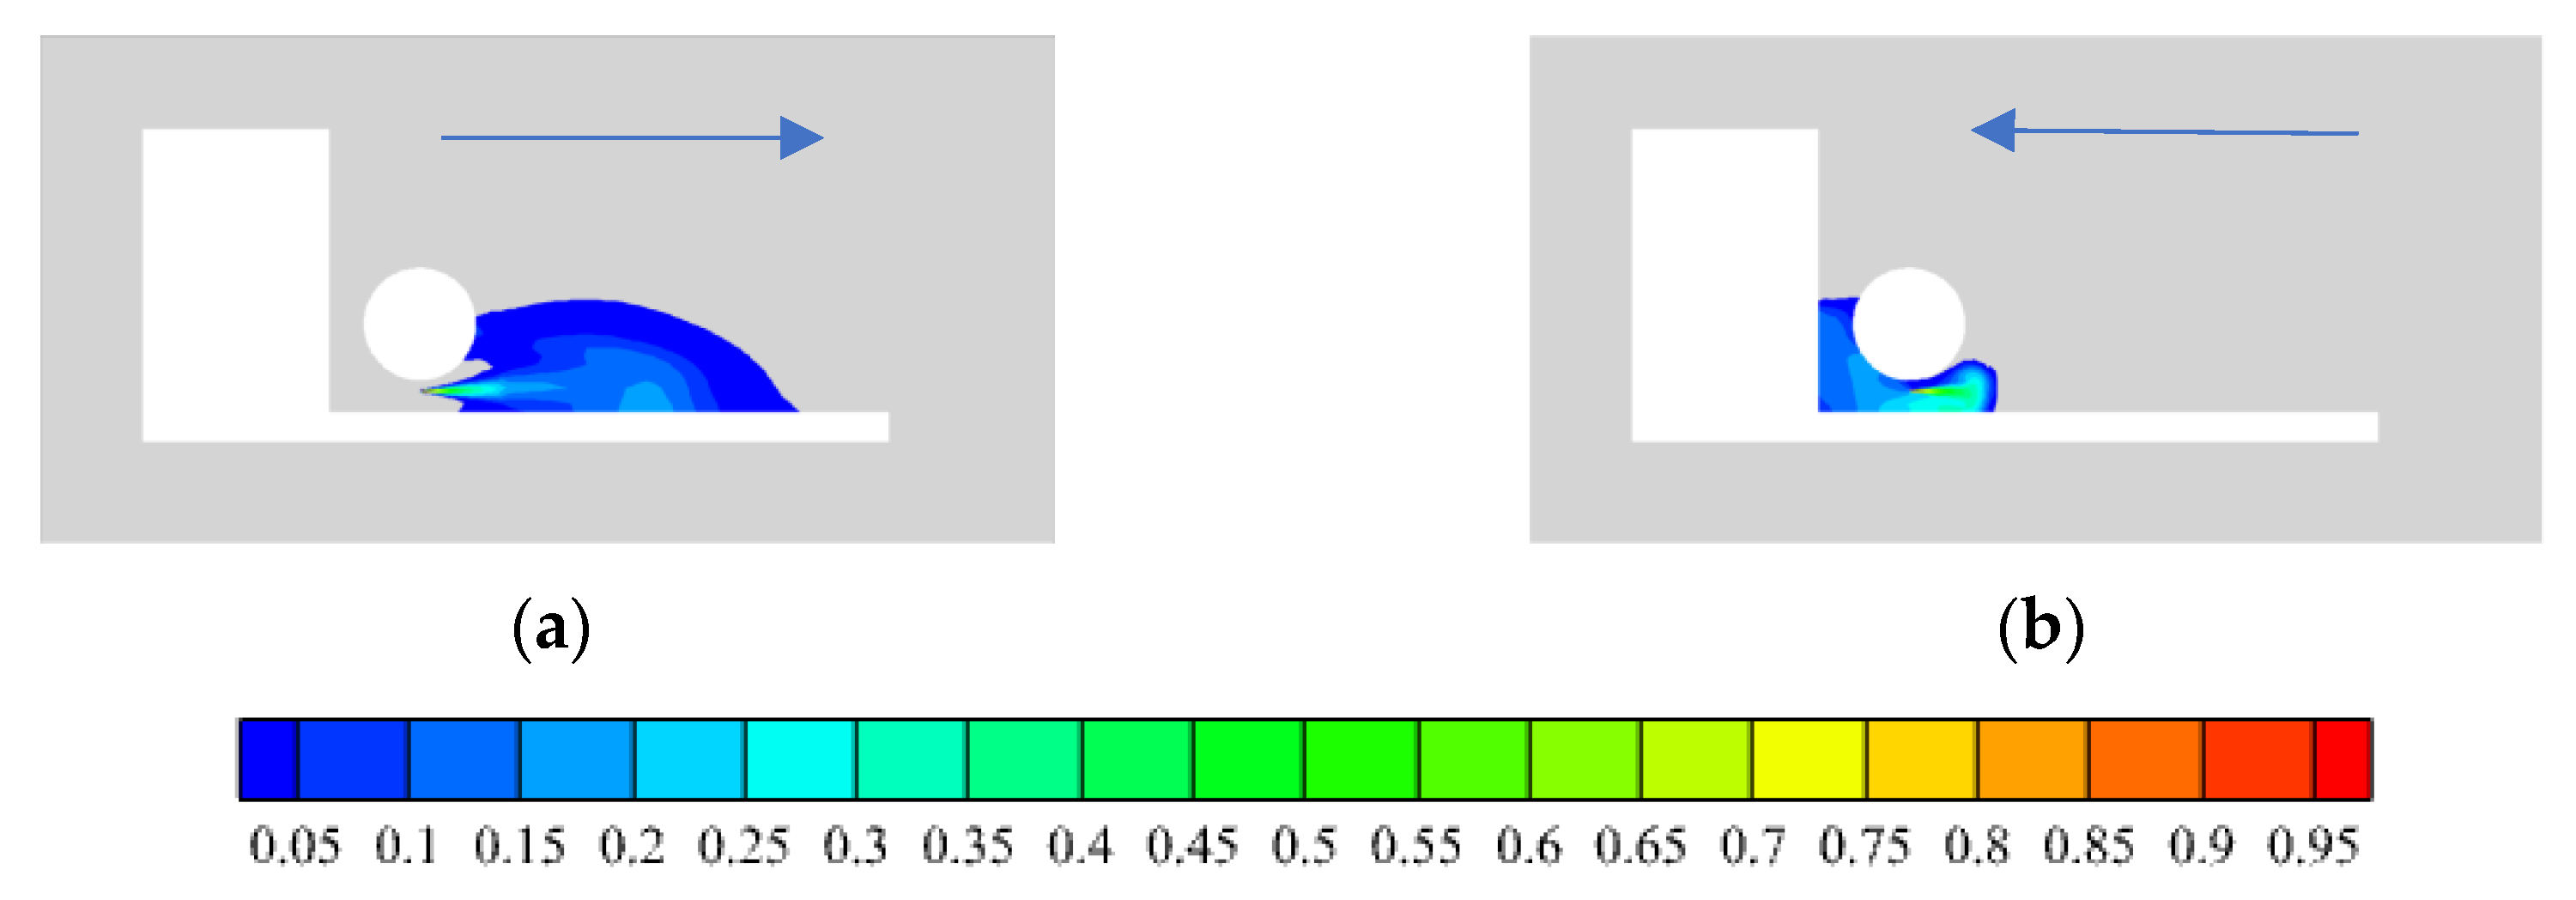
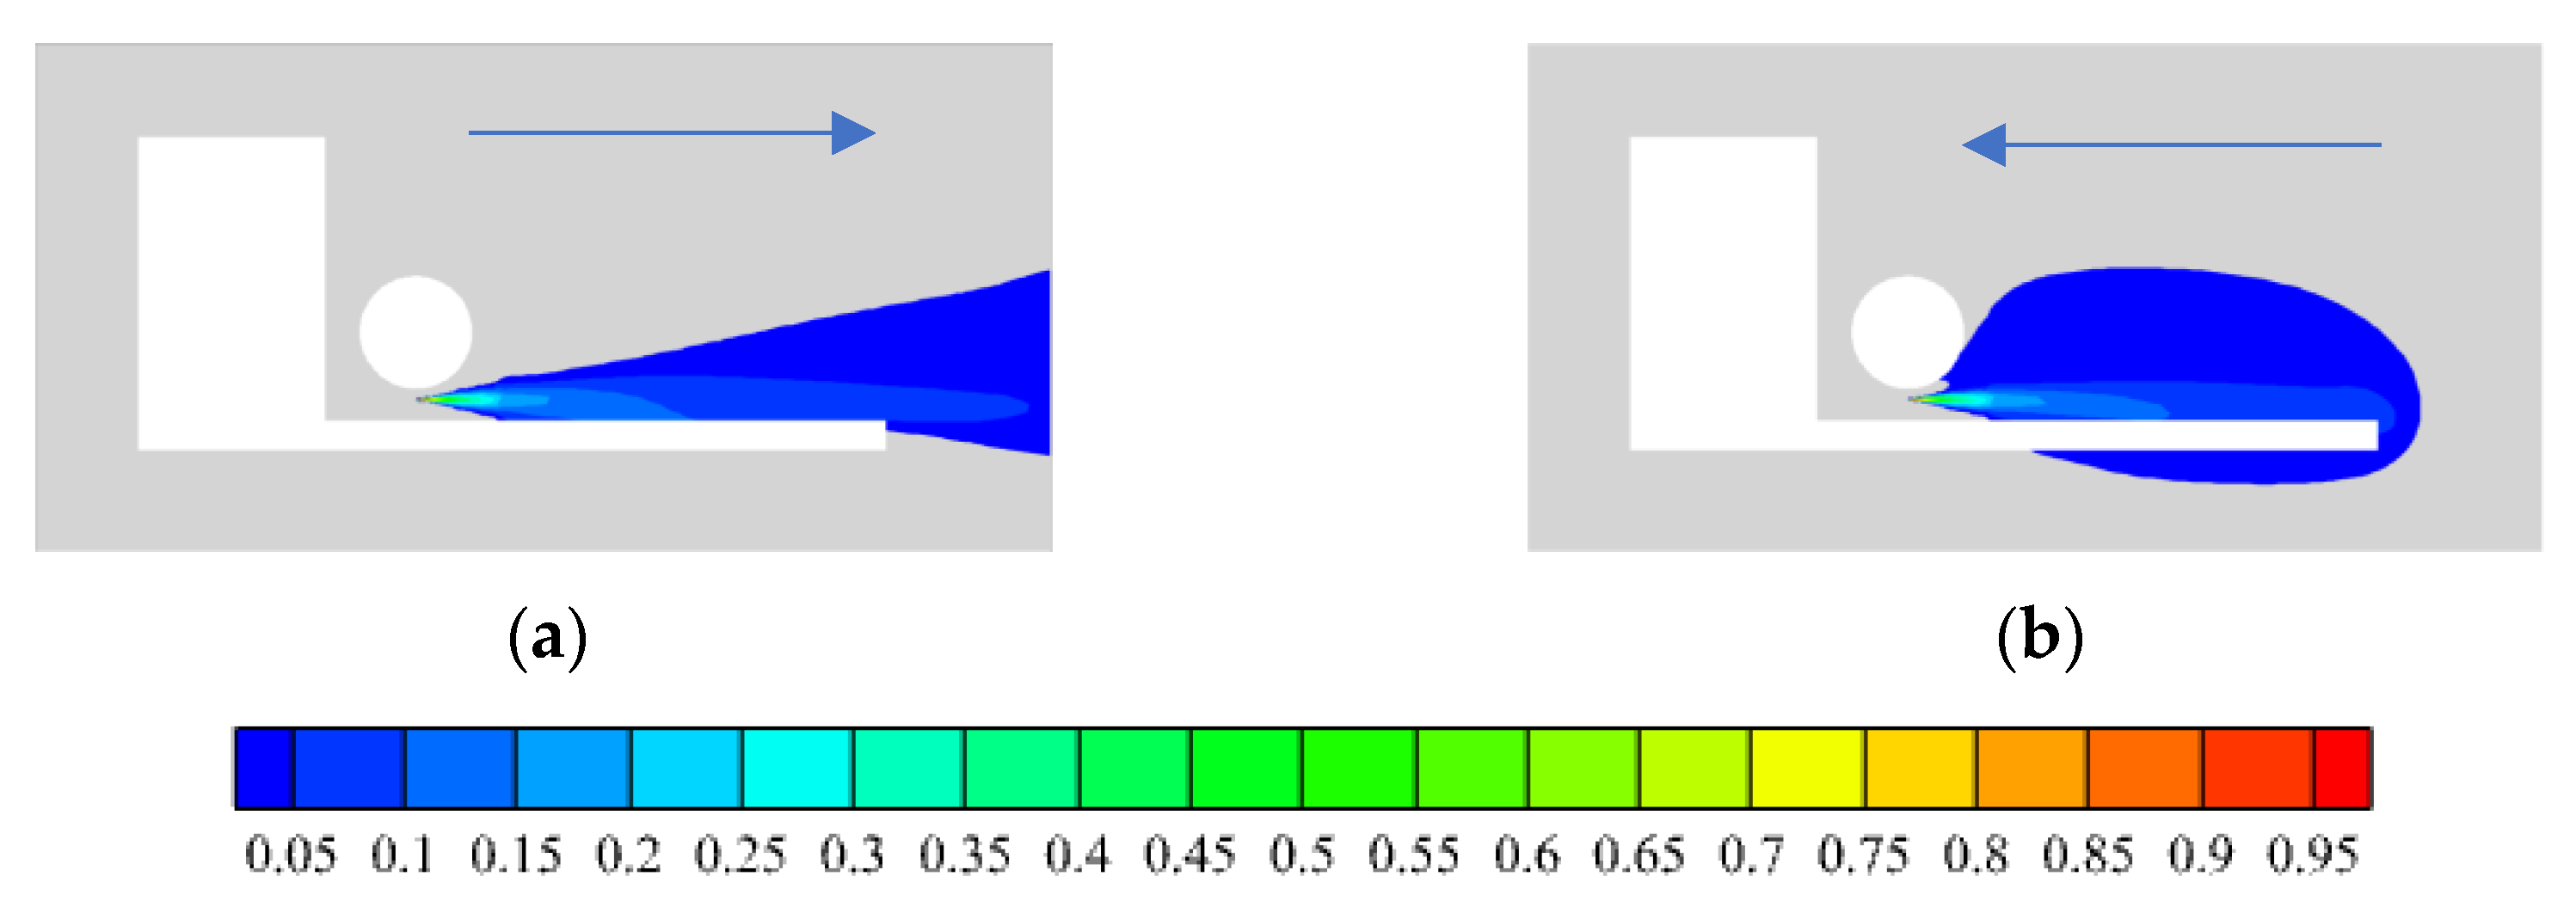
Hydrogen gas leaks back from 10 mm caliber and 20 g/s leakage rate, downwind wind, reverse wind and 90 degree side wind at 10 m/s, and the hydrogen concentration distribution during hydrogen leakage and diffusion are simulated in Figure 13 and Figure 14. It can be seen that when the hydrogen just leaks, the downwind wind will accelerate the diffusion of hydrogen along the leakage direction, and the reverse wind will move part of the hydrogen to the leakage reverse direction, and produce a certain time of hydrogen accumulation at the rear wall of the cab and the corner of the upper wall of the chassis. After a certain time, the downwind hydrogen gas is only distributed backward in the leakage direction, and the hydrogen boundary is gradually widened as the leakage distance increases. The distribution of hydrogen behind the cab and the corner above the chassis and on the hydrogen storage tank is decreasing. There is also a hydrogen distribution below the chassis under the counter wind. With the leakage time, the hydrogen distribution range basically no longer changes with the leakage time and is in a steady state. The boundary of the downwind hydrogen distribution has an oblique line characteristic and a conical distribution. In the reverse wind environment, hydrogen is distributed on the surface of the hydrogen storage tank and the top and bottom areas of the chassis, with the overall elliptical distribution.
Hydrogen concentration distribution at a 90 degrees side wind 10 m/s is shown in Figure 15. It can be seen that under the influence of side wind, hydrogen no longer diffuses along the direction of leakage, but diffuses downwind to the outside under the direction of side wind. Under the lateral wind environment, the diffusion direction of hydrogen is obviously downwind, the diffusion process is the fastest, and the distribution range of hydrogen concentration is the smallest.
The 90 degree side wind and the downwind are beneficial to hydrogen diffusion, while the headwind is not conducive to hydrogen diffusion. According to the diffusion effect of hydrogen in different wind directions, the diffusion effect of hydrogen in 90 degrees side wind is better than that in downwind, while the diffusion effect in headwind is the worst.
3.2. Analysis of the Influencing Factors of the Airway in Closed Space
3.2.1. Area of Vent
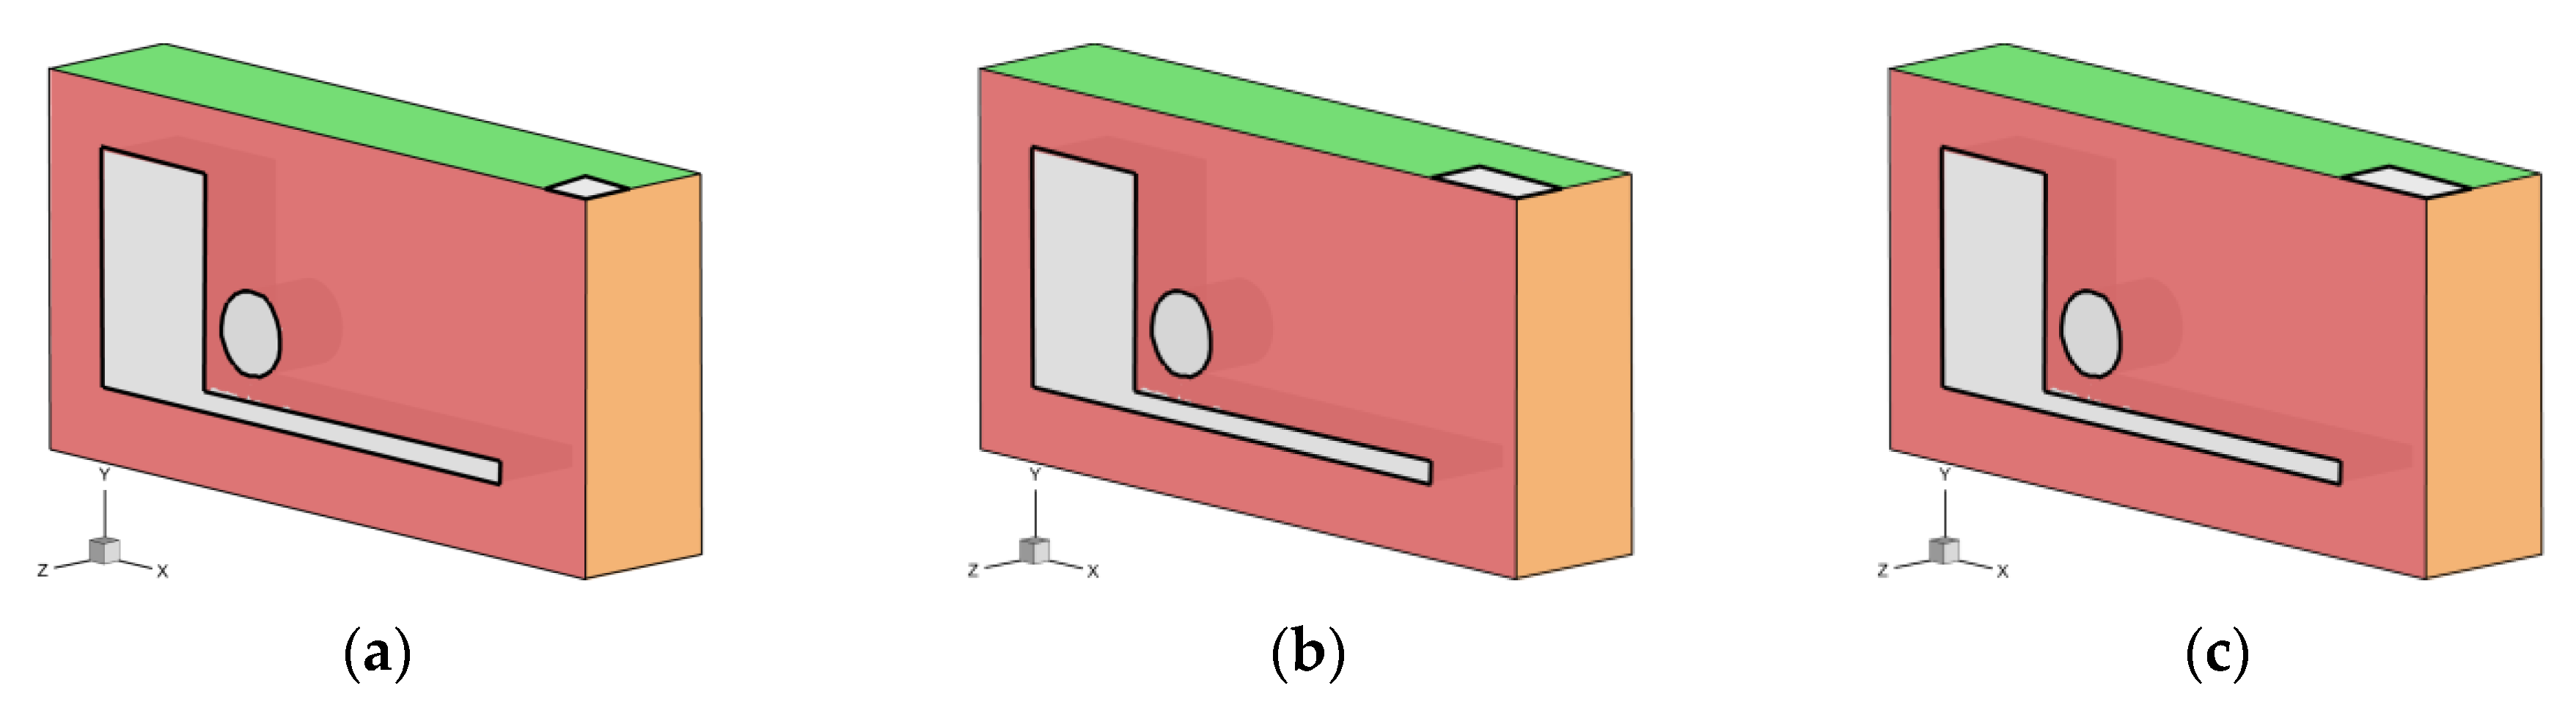
In the closed space, the vent has a non-negligible influence on the concentration distribution during the hydrogen leakage, so the influence of different vent areas on the hydrogen leakage and diffusion is analyzed. In Figure 16, the vents of the upper wall, as S1, S2, S3.
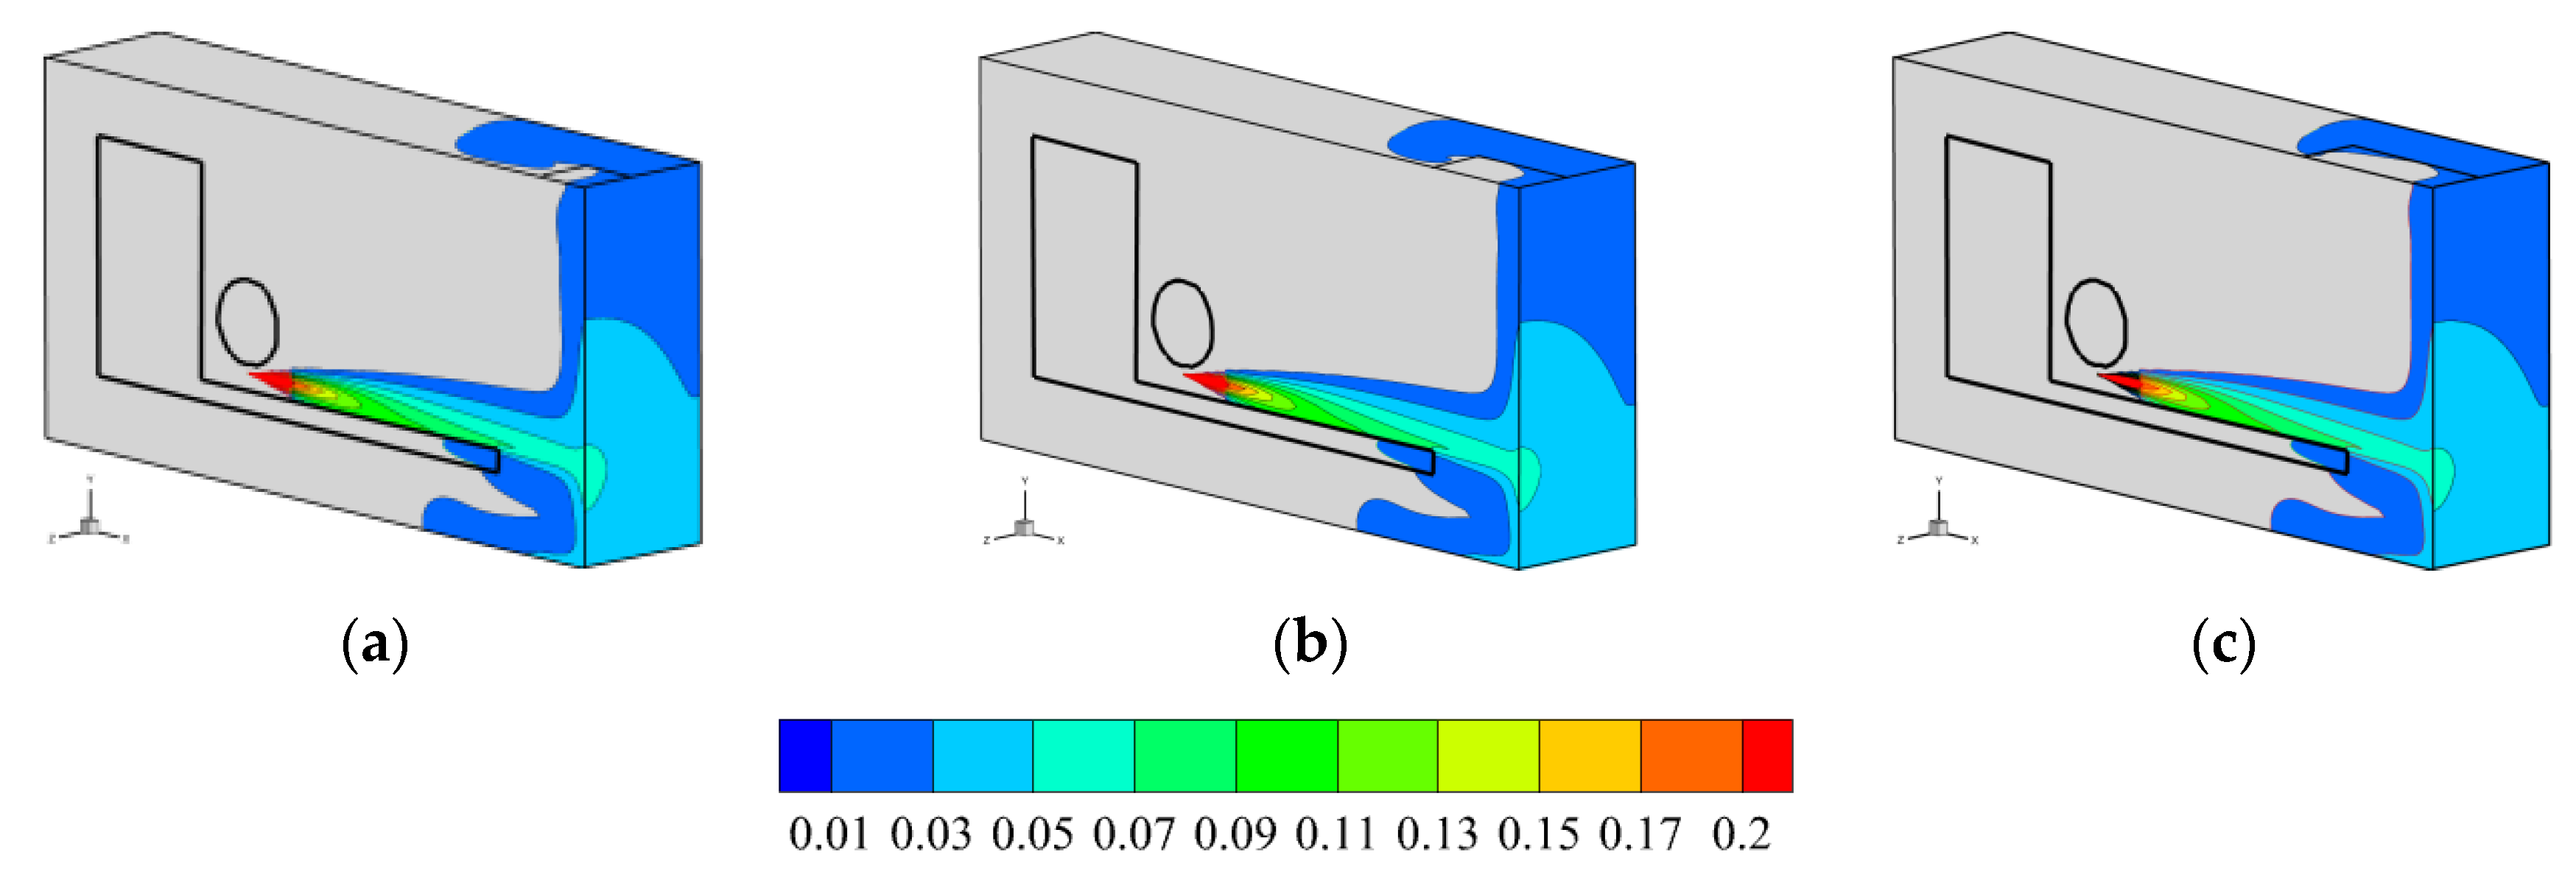
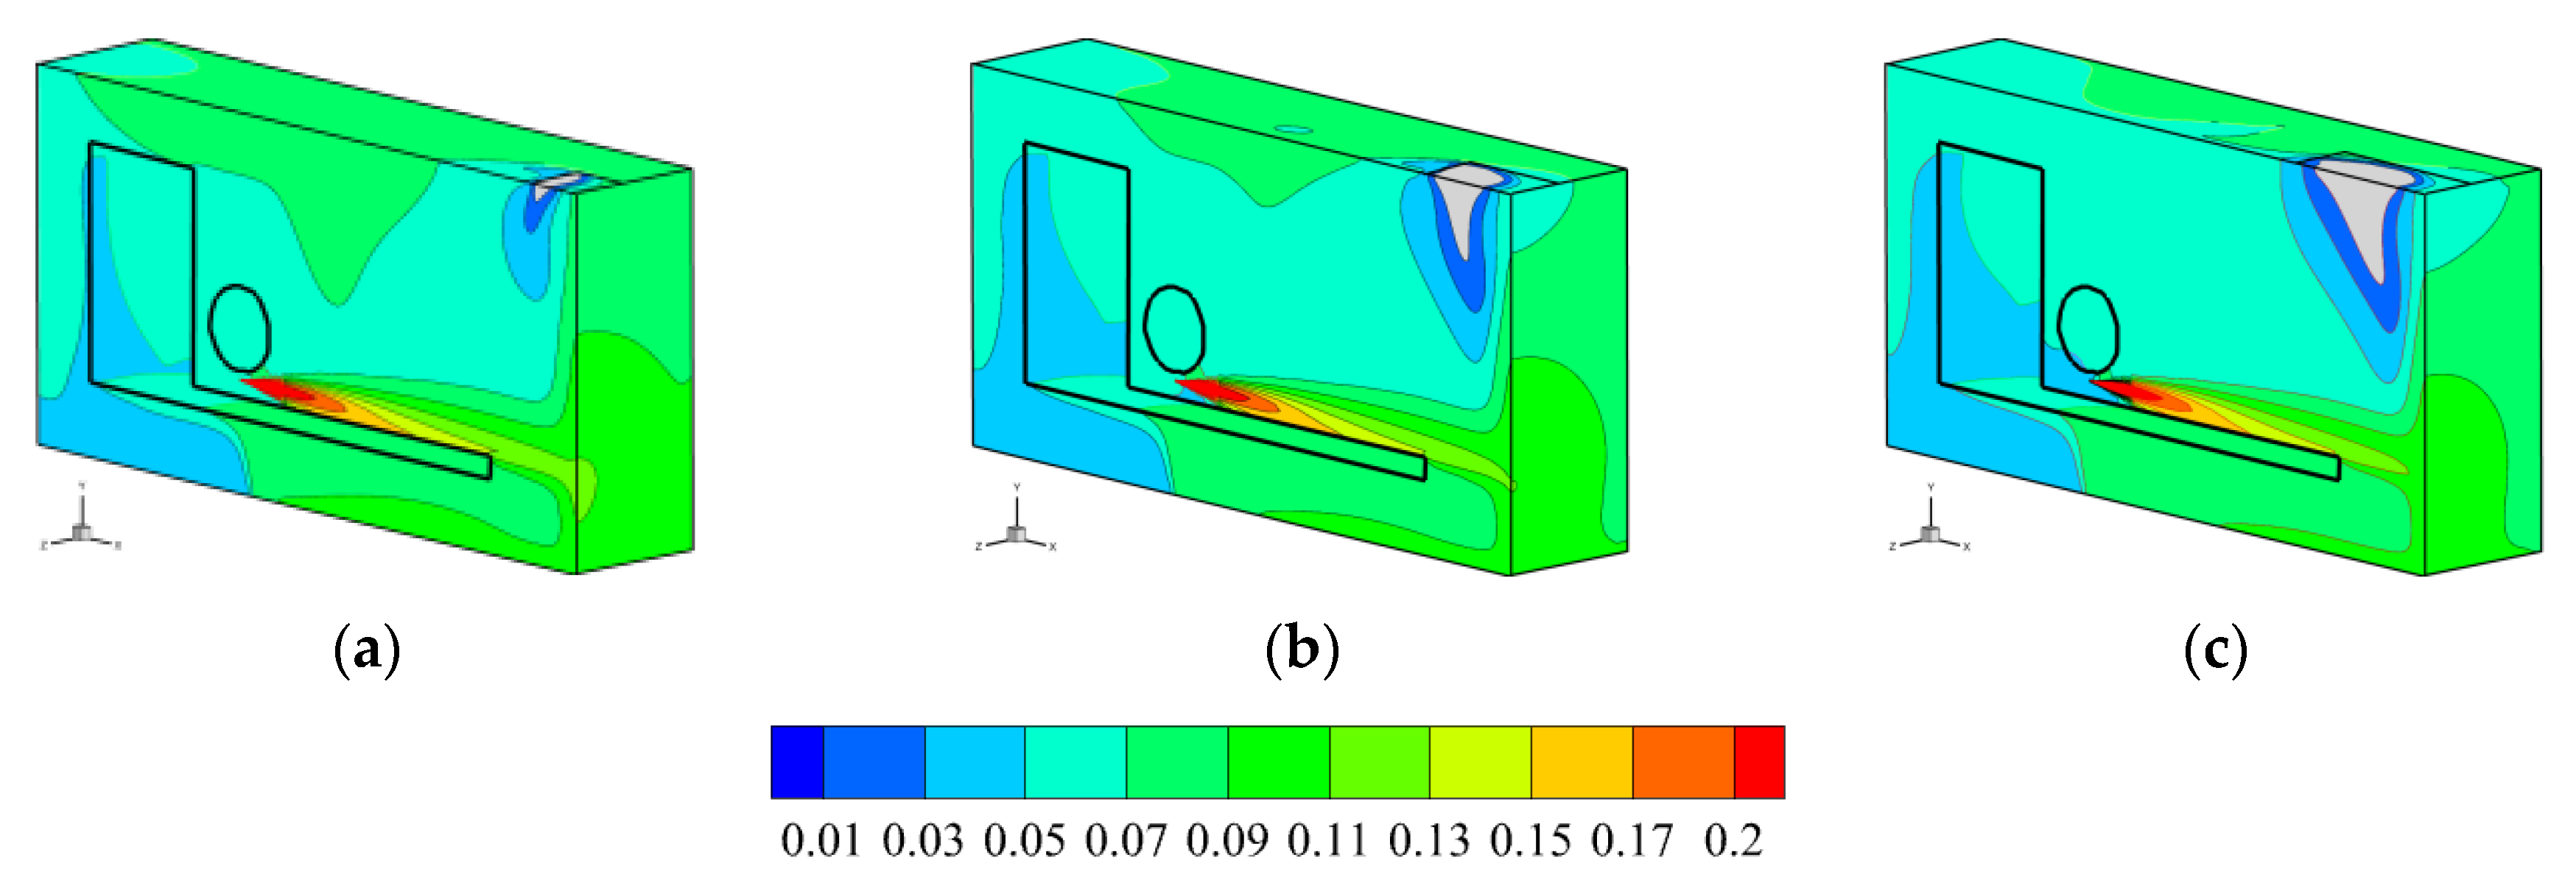
The concentration distribution of hydrogen diffusion in the closed space under different vent areas is shown in Figure 17 and Figure 18. It can be seen that when hydrogen leaks to the rear of the car, it will first spread in the leakage direction to the back wall of the space and spread around in the rear wall block. When the upward diffused hydrogen spreads near the vent, the larger the vent, the smaller the hydrogen distribution range on the upper wall of the space. The space of the distribution of hydrogen concentration is basically the same, with the difference mainly in the area near the vent, the larger the area, the greater the distribution range of lower hydrogen concentration near the vent.
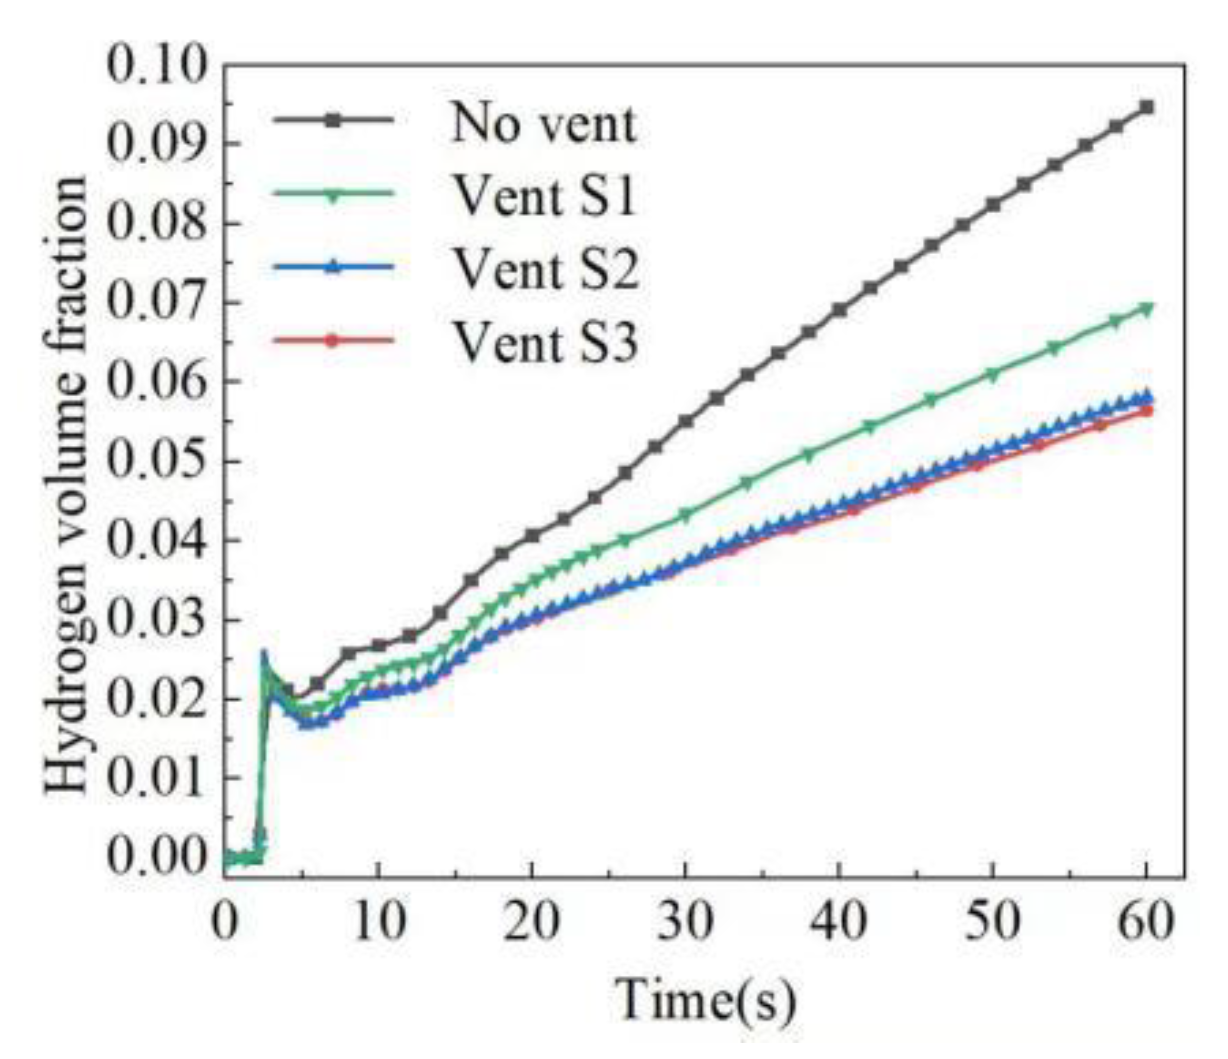
A monitoring point is set up in the center of the vent M, and the change of hydrogen concentration at each monitoring point under different vent areas is shown in Figure 19. At 2.5 s, the volume fraction of hydrogen increases sharply, and then increases linearly after a slight decrease. The vent area is different, and the concentration curve is different. The larger the vent, the lower the hydrogen concentration in the area near the vent. The increase of the vent area reduces the hydrogen concentration and the rising rate of the concentration in the area near the vent, but the influence area is limited near the vent, and has no effect on the space area far from the vent.
3.2.2. Location of Vent
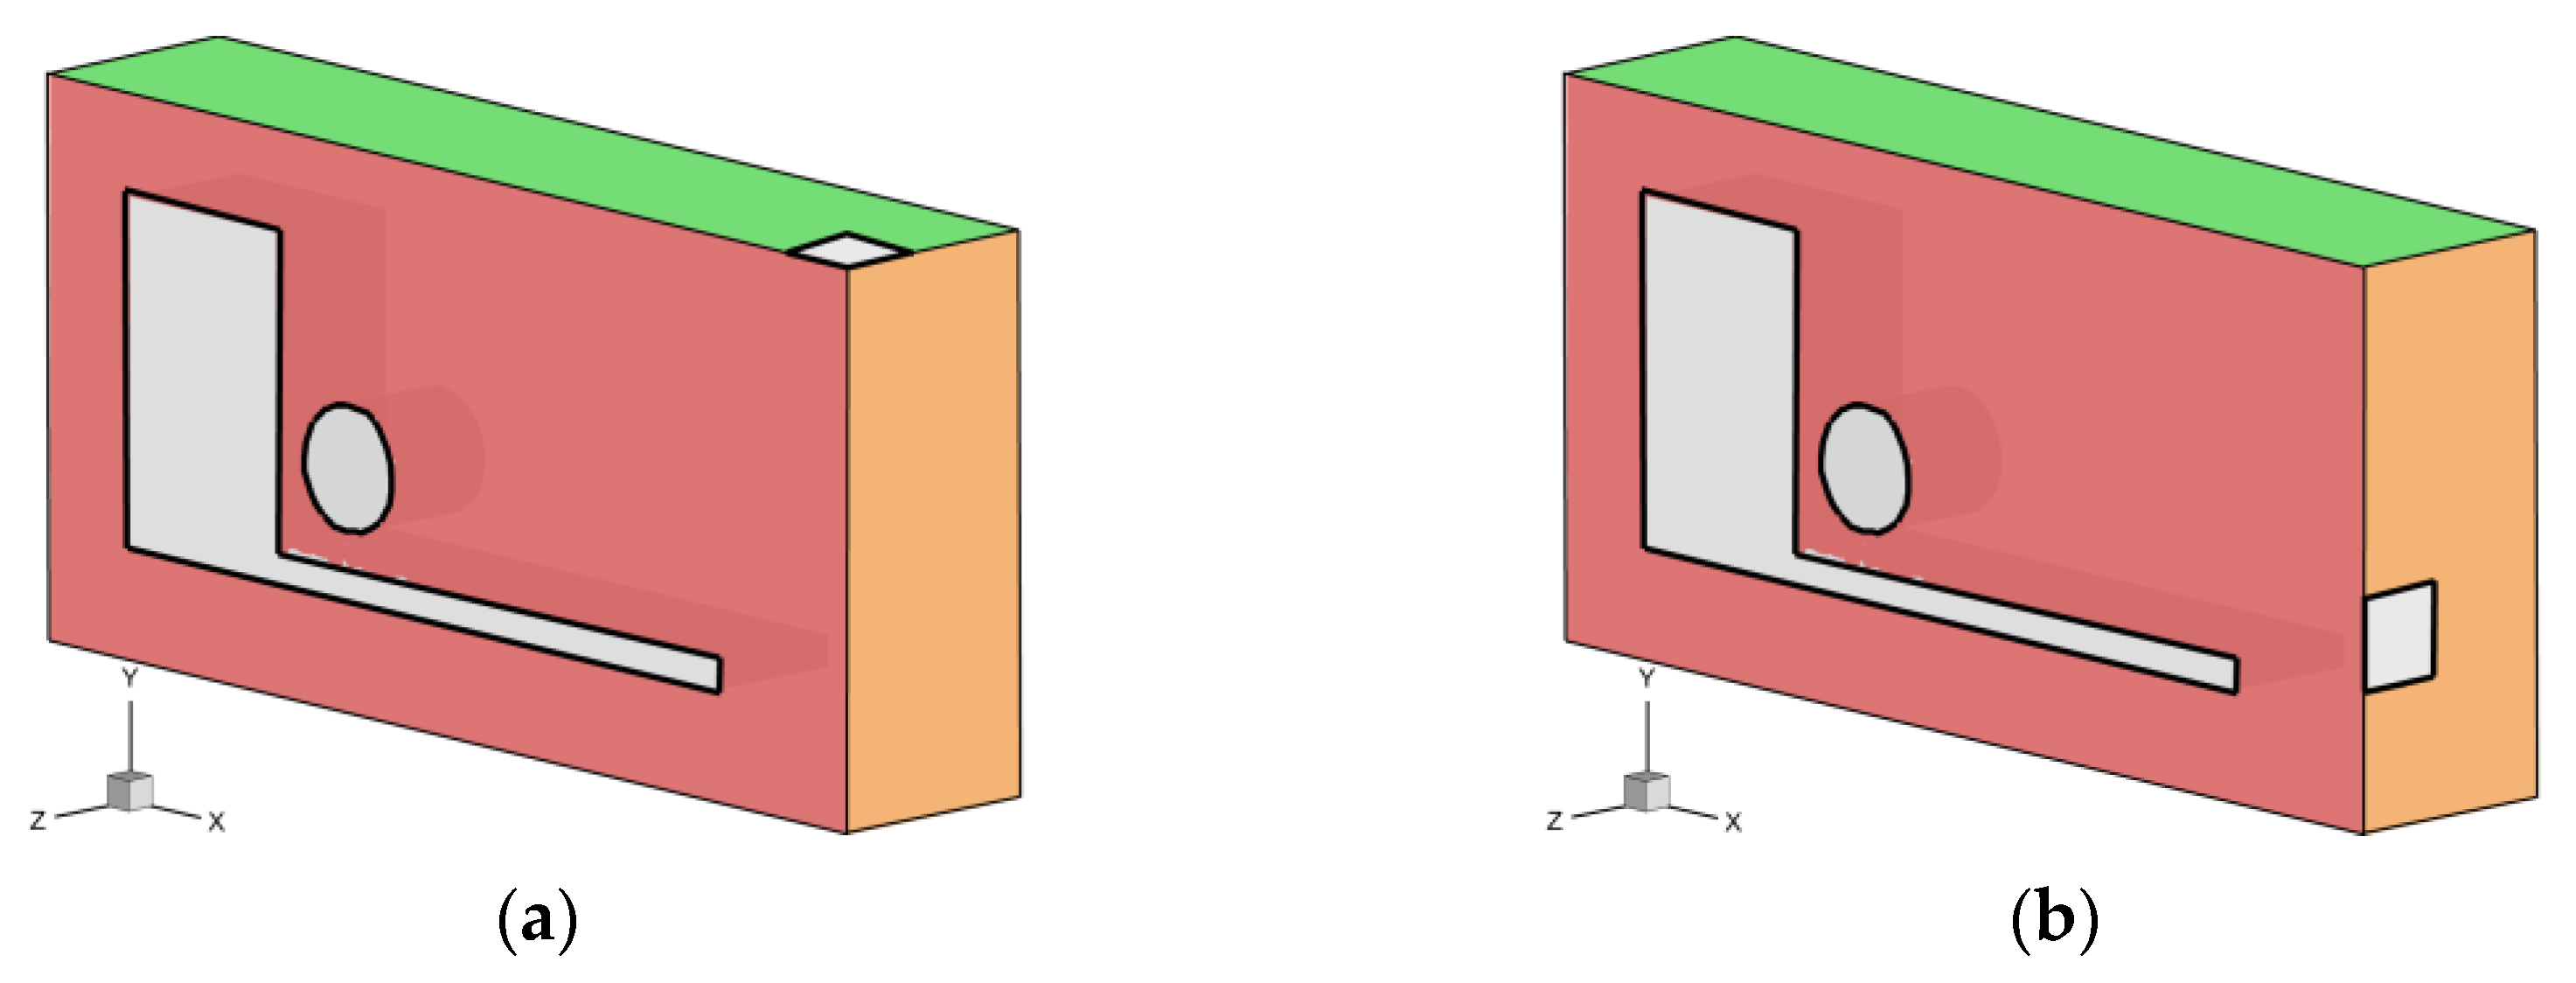
Such as Figure 20 set vent S4, the set equal area vent behind the wall in space S1 analyzes the effect of vent position on hydrogen concentration in closed space.
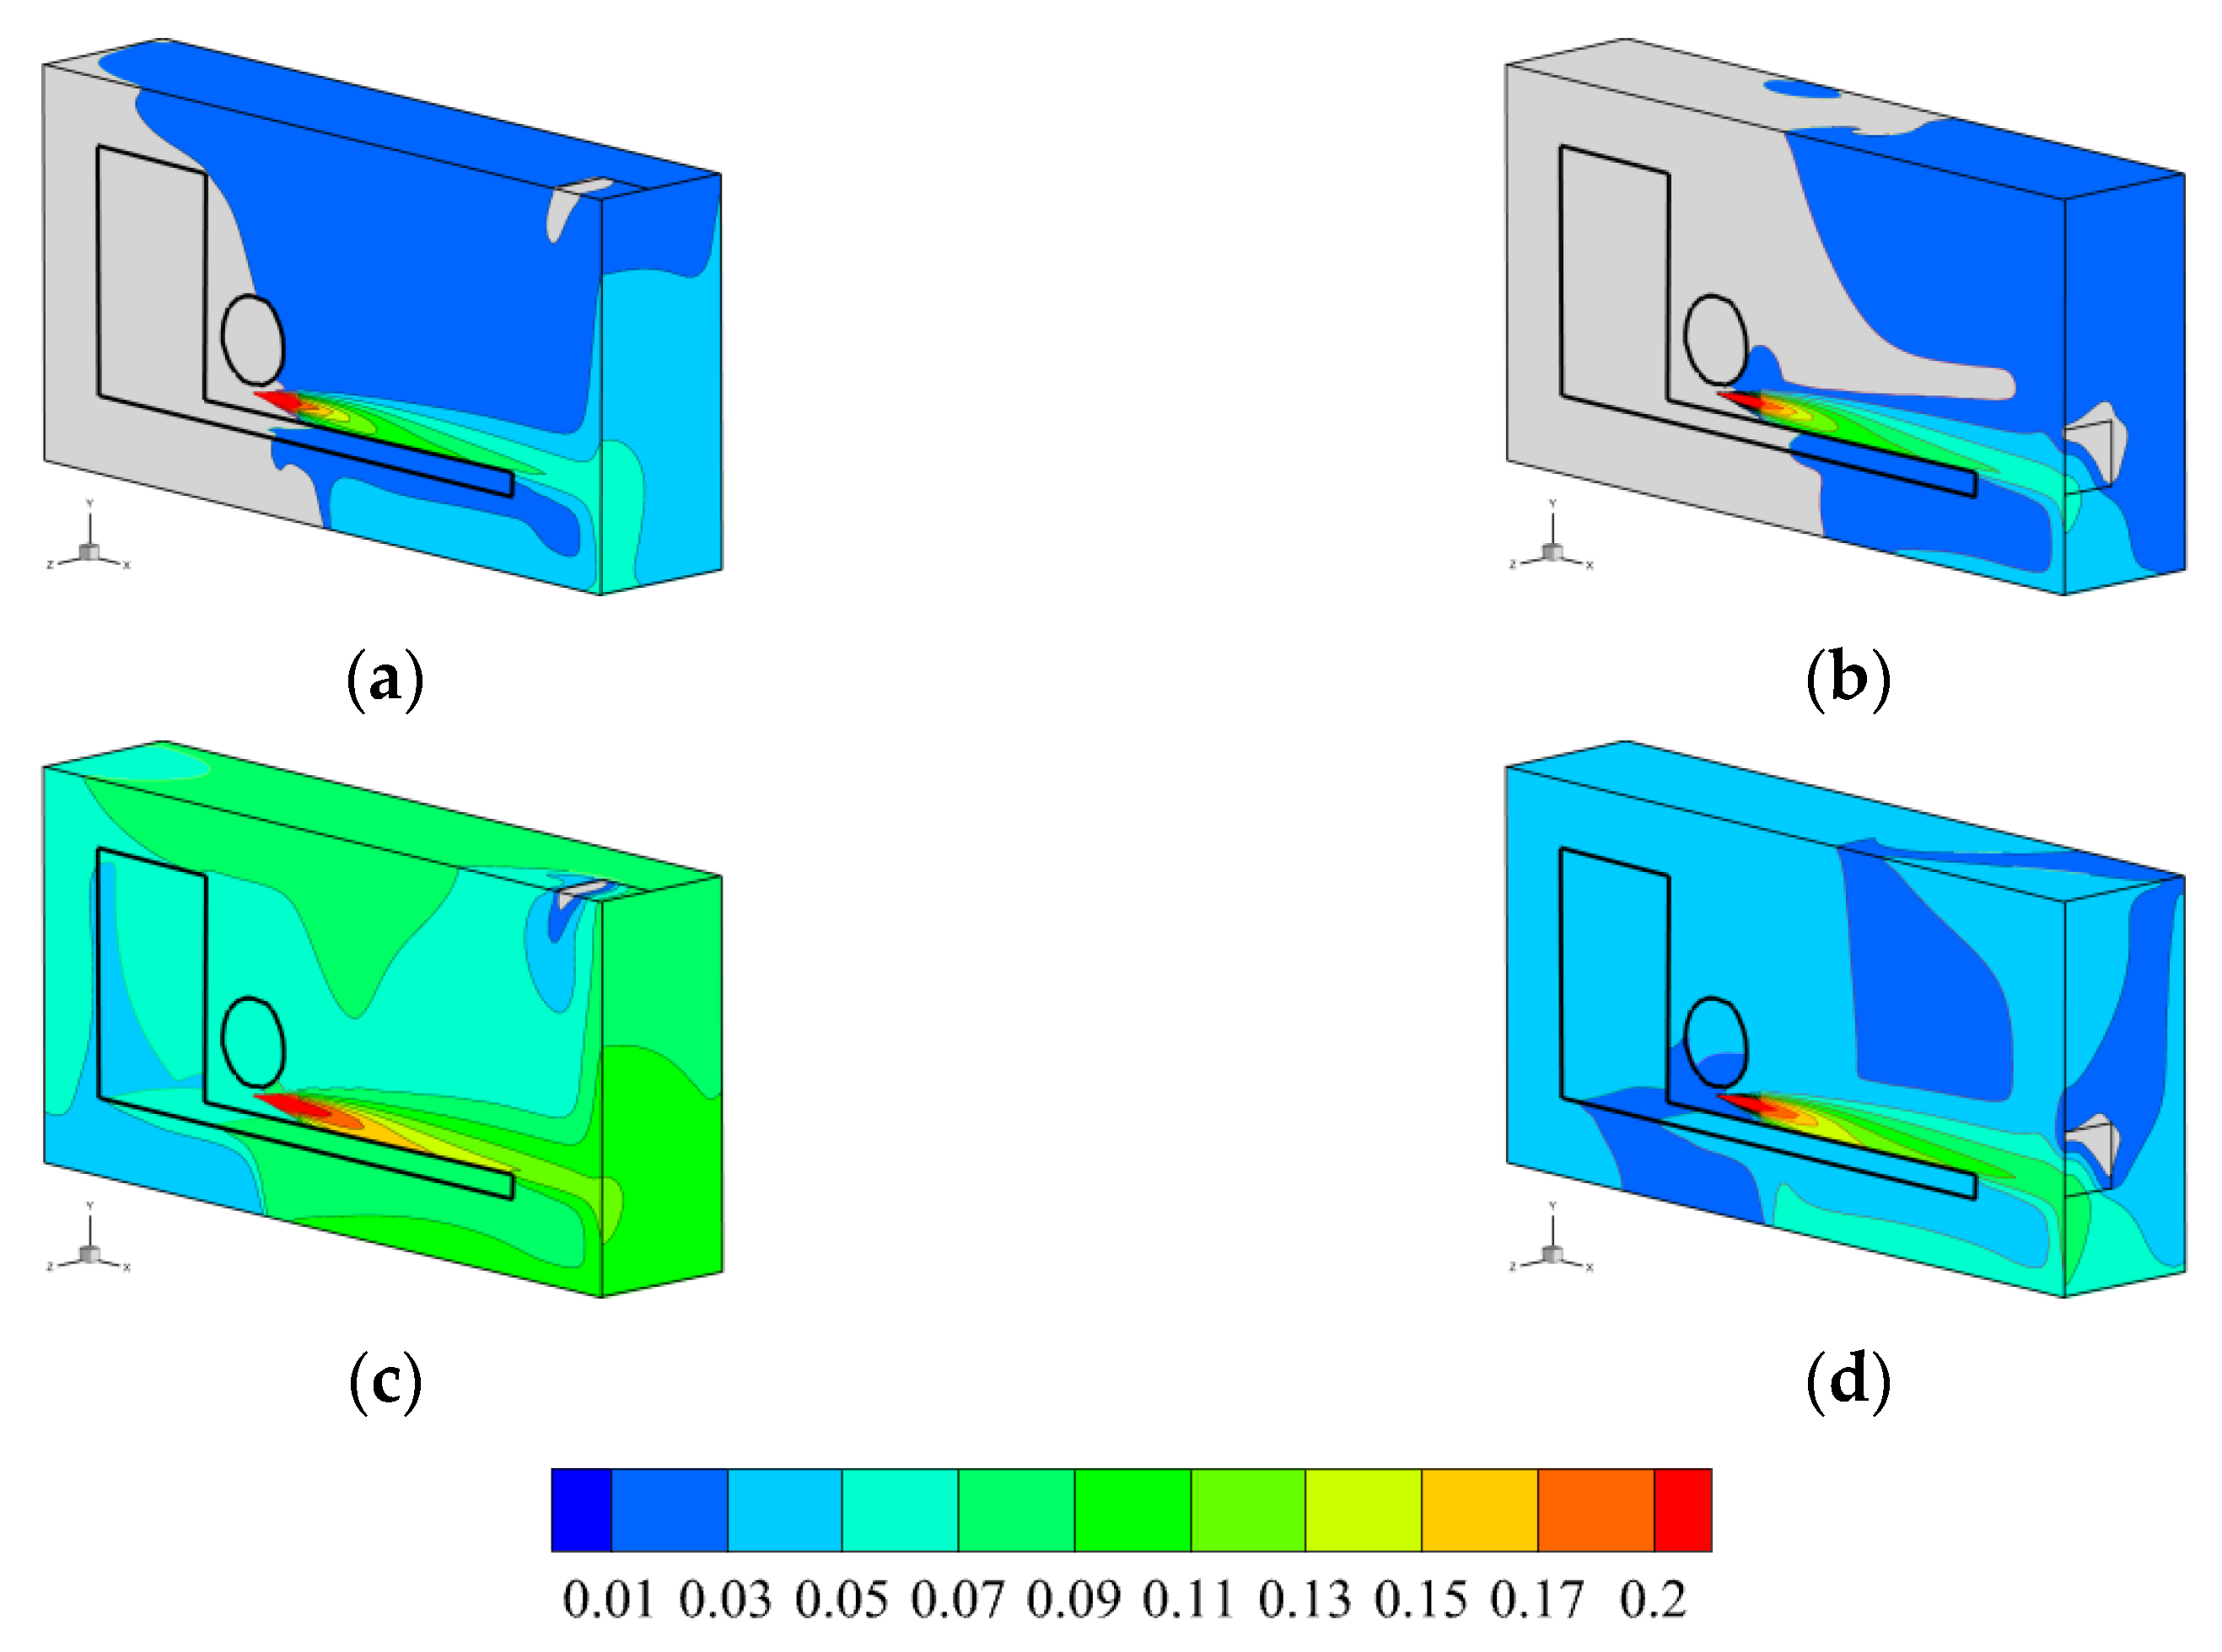
The concentration distribution of hydrogen diffusion in closed space at different vent locations is shown in Figure 21. It can be seen that at the beginning of the hydrogen leakage to the rear of the vehicle, the hydrogen gas at the top vent S1 of the environment has diffused along the upper wall of the space to the front of the space, while the hydrogen at the rear vent S4 of the environment has just diffused to the middle of the space. At the end of the simulation, the concentration and distribution of hydrogen in space in the top vent environment is larger, and the difference is still mainly concentrated in the upper half of the space. The reason is that in the case of hydrogen leakage to the rear of space, compared with the top vent, opening a vent at the back of space can make more hydrogen diffuse directly from the vent to the external environment. The diffusion process and concentration distribution range of hydrogen in space are significantly affected.
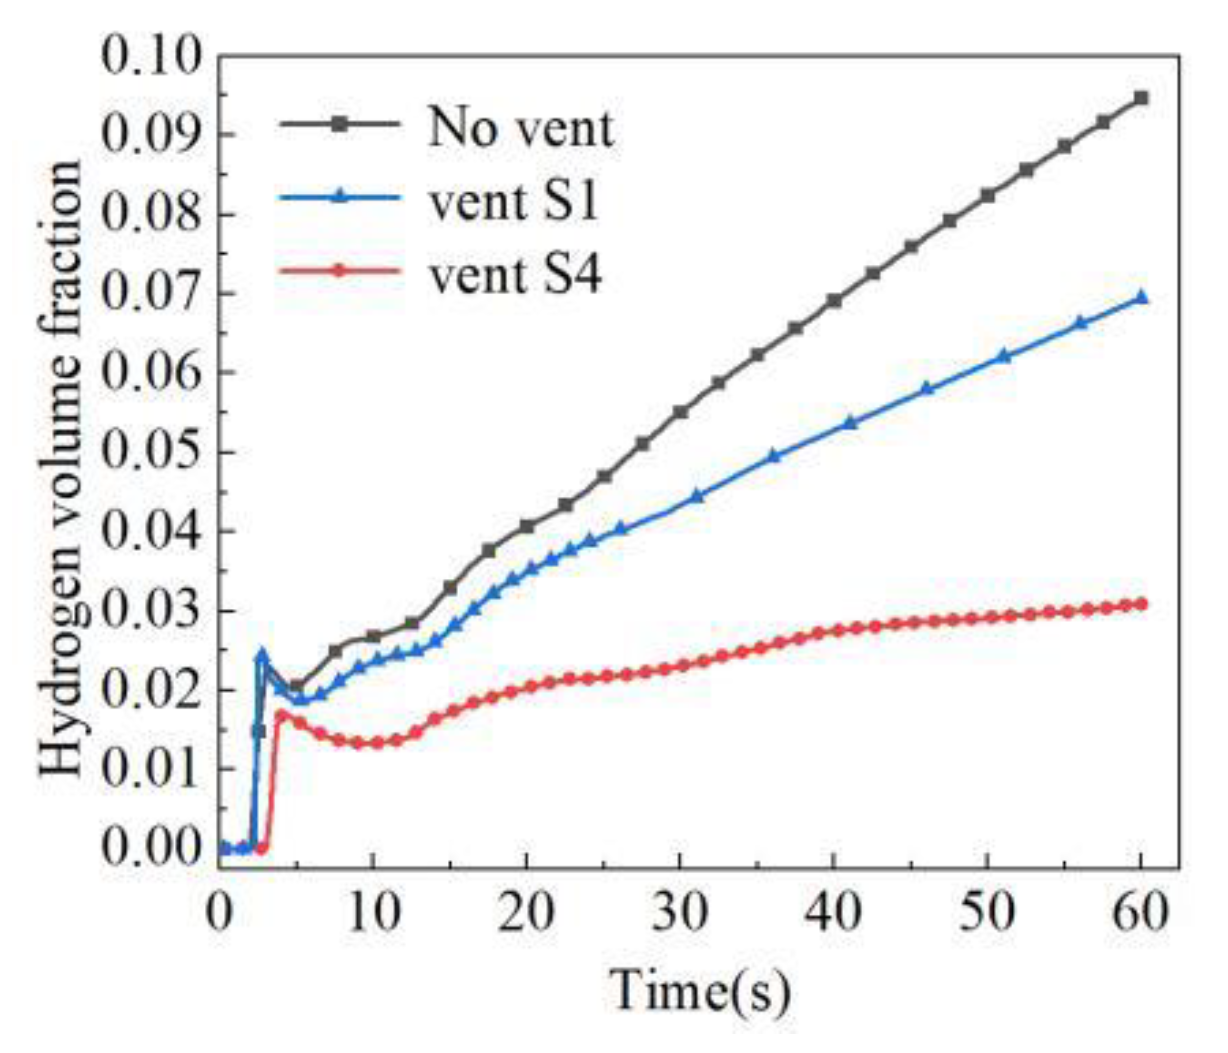
Changes in hydrogen concentration M monitoring points at different vent locations are shown in Figure 22. The slope and concentration values of the hydrogen concentration change curve under the S4 of no vent, vent S1 and vent decrease in turn, and the hydrogen volume fraction under the vent S4 is only 40% under the vent S1 at 60 s, indicating that the vent position significantly affects the rising rate and concentration of hydrogen at the monitoring point.
The analysis shows that the effect of rear vent on hydrogen concentration is reflected in more areas of closed space, while the effect of top vent is limited to the area near the vent. When the vent area is limited, the leakage position and direction of hydrogen are analyzed, and the ventilation effect in the closed space can be improved by opening the vent in a reasonable position.
4. Conclusions
By using Fluent software, the influence factors of hydrogen leakage diffusion in open space and the influence of air vent on hydrogen leakage diffusion in closed space are studied.
- The hydrogen leakage and diffusion process in open space is divided into three stages: leakage and diffusion, concentration dilution and stable balance. At the beginning of the leakage, when the air can dilute hydrogen, the distribution range is reduced. After the hydrogen leakage, diffusion and dilution, the hydrogen distribution range never changes. When the distribution is stable, the hydrogen concentration is characterized by a conical stratified distribution structure, the hydrogen concentration and concentrated gradient near the leakage port. The width increases with the diffusion distance and with the inclined straight line characteristics.
- In open space, the leakage rate greatly effects the hydrogen distribution range. The greater the leakage rate, the greater the hydrogen concentration range. Environmental wind affects the hydrogen distribution range and the diffusion direction. When hydrogen leaks to the rear of the car, the smaller the wind speed under different adverse wind speeds, the larger the hydrogen distribution range, and more hydrogen is distributed under the chassis, which is not conducive to the safety of HFCV. Under different wind directions, the 90-degree side wind significantly changes the hydrogen diffusion direction of hydrogen, with the fastest diffusion and the minimum concentration distribution range, the most conducive to hydrogen diffusion. However, the maximum distribution range and the highest risk are under the reverse wind.
- The air outlet in closed space has an effect on the rising rate and size of hydrogen concentration. In the case of hydrogen backward leakage, the influence of the top vent is slight. Under different top vent areas, the overall diffusion process of hydrogen in space never changes, and the effect is limited to the vicinity of the vent. Compared with the top vent, opening the vent at the back of the space can make hydrogen diffuse to the external environment faster and significantly reduce the rising rate and concentration of hydrogen concentration in this space. Therefore, after hydrogen leakage, the best effect is to open the vent in the position where hydrogen first diffuses.
In the following research process, more detailed hydrogen safety analysis can be carried out in local complex areas, such as pipe valves, on-board hydrogen system, etc. Simulation will be carried out for other differing environments to more accurately predict the hydrogen concentration distribution around the whole vehicle after the leakage of hydrogen supply system in the effort to put forward more practical safety evaluation and guidance.
Author Contributions
Conceptualization, X.Z.; methodology, M.J.; software, M.J., J.H.; validation, M.J., H.Z. and X.Z.; writing—review and editing, M.J., H.Z.; project administration, X.Z.; visualization, H.Z. All authors have read and agreed to the published version of the manuscript.
Funding
This research was funded by the National Key R&D Program of China, grant number 2019YFB1504904.
Conflicts of Interest
The authors declare no conflict of interest.
References
- Lacome, J.; Jamois, D.; Perrette, L. Large-scale hydrogen release in an isothermal confined area. Int. J. Hydrogen Energy 2011, 36, 2302–2312. [Google Scholar] [CrossRef] [Green Version]
- Prabhakar, A.; Agrawal, N.; Raghavan, V. Experimental investigation onhelium distribution and stratification in unventilated vertical cylindrical enclosure effect of jet release rates and total release volume. Int. J. Hydrogen Energy 2016, 48, 23131–23228. [Google Scholar]
- Shu, Z.; Liang, W.; Zheng, X. Dispersion characteristics of hydrogen leakage: Comparing the prediction model with the experiment. Energy 2021, 236, 121420. [Google Scholar] [CrossRef]
- Venetsanos, A.; Papanikolaou, E.; Delichatsios, M. An inter-comparison exercise on the capabilities of CFD models to predict the short- and long-term distribution and mixing of hydrogen in a garage. Int. J. Hydrogen Energy 2009, 34, 5912–5923. [Google Scholar] [CrossRef]
- Zou, Q.; Tian, Y.; Han, F. Prediction of state property during hydrogen leaks from high-pressure hydrogen storage systems. Int. J. Hydrogen Energy 2019, 44, 22394–22404. [Google Scholar] [CrossRef]
- Abohamzeh, E.; Salehi, F.; Sheikholeslami, M. Review of hydrogen safety during storage, transmission, and applications processes. J. Loss Prev. Process Ind. 2021, 72, 104569. [Google Scholar] [CrossRef]
- Yu, Z. Numerical simulation of hydrogen leakage and diffusion [D]. Natl. Univ. Def. Sci. Technol. 2008. [Google Scholar]
- Liu, Y. High pressure hydrogen rapid charge temperature rise control and leakage diffusion law. Study Zhejiang Univ. 2009. [Google Scholar]
- Xu, P.; Liu, P.; Liu, Y. Numerical simulation of leakage and diffusion at different positions of high pressure hydrogen storage tank. J. Chem./Eng. 2008, 22, 921–926. [Google Scholar]
- Zheng, J.; Liu, Y.; Xu, P. Numerical simulation of influence of obstacles on leakage and diffusion of high pressure hydrogen storage tank. J. Zhejiang Univ. 2008, 42, 2177–2180. [Google Scholar]
- Choi, J.; Hur, N.; Kang, S. A CFD simulation of hydrogen dispersion for the hydrogen leakage from a fuel cell vehicle in an underground parking garage. Int. J. Hydrogen Energy 2013, 19, 8084–8091. [Google Scholar] [CrossRef]
- Hajjia, Y.; Jouinia, B.; Bouteraaa, M. Numerical study of hydrogen release accidents in a residential garage. Int. J. Hydrogen Energy 2015, 31, 9747–9759. [Google Scholar] [CrossRef]
- Hajji, Y.; Bouteraa, M.; Cafsi, A. Dispersion and behavior of hydrogen during a leak in a prismatic cavity. Int. J. Hydrogen Energy 2014, 11, 6111–6119. [Google Scholar] [CrossRef]
- Hajji, Y.; Bouteraa, M.; ELCafsi, A. Natural ventilation of hydrogen during a leak in a residential garage. Renew. Sust. Energy Rev. 2015, 50, 810–818. [Google Scholar] [CrossRef]
- Prasad, K.; Pitts, W.; Yang, J. Effect of wind and buoyancy on hydrogen release and dispersion in a compartment with vents at multiple levels. Int. J. Hydrogen Energy 2010, 35, 9218–9231. [Google Scholar] [CrossRef]
- Kazuo, M.; Masami, N.; Jun, I. Forced ventilation for sensing-based risk mitigation of leaking hydrogen in a partially open space. Int. J. Hydrogen Energy 2010, 35, 980–8578. [Google Scholar]
- Matsuura, K.; Nakano, M.; Ishimoto, J. Acceleration of hydrogen forced ventilation after leakage ceases in a partially open space. Int. J. Hydrogen Energy 2012, 9, 7940–7949. [Google Scholar] [CrossRef]
- Matsuura, K.; Nakano, M.; Ishimoto, J. Sensing-based risk mitigation control of hydrogen dispersion and accumulation in a partially open space with low-height openings by forced ventilation. Int. J. Hydrogen Energy 2012, 37, 1972–1984. [Google Scholar] [CrossRef]
- Papanikolaou, E.; Venetsanos, A.; Heitsch, M.; Baraldi, D.; Huser, A.; Pujol, J.; Garcia, J.; Markatos, N. HySafe SBEP-V20: Numerical studies of release experiments inside a naturally ventilated residential garage. Int. J. Hydrogen Energy 2010, 35, 4747–4757. [Google Scholar] [CrossRef] [Green Version]
- Kazuo, M.; Hiroshi, K.; Hisayoshi, T. Numerical simulation of leaking hydrogen dispersion behavior in a partially open space. Int. J. Hydrogen Energy 2007, 33, 240–247. [Google Scholar]
- Barley, C.D.; Gawlik, K. Buoyancy-driven ventilation of hydrogen from buildings: Laboratory test and model validation. Int. J. Hydrogen Energy 2009, 34, 5592–5603. [Google Scholar] [CrossRef] [Green Version]
- Cariteau, B.; Tkatschenko, I. Experimental study of the effects of vent geometry on the dispersion of a buoyant gas in a small enclosure. Int. J. Hydrogen Energy 2013, 38, 8030–8038. [Google Scholar] [CrossRef]
- Isaac, W.E.; William, G.H.; Greg, H.E.; Merilo, E.G.; Groethe, M.A. Experimental investigation of hydrogen release and ignition from fuel cell powered forklifts in enclosed spaces. Int. J. Hydrogen Energy 2012, 37, 17446–17456. [Google Scholar]
- Giannissi, S.G.; Shentsov, V.; Melideo, D.; Cariteau, B.; Baraldi, D.; Venetsanos, A.G.; Molkov, V. CFD benchmark on hydrogen release and dispersion in confined, naturally ventilated space with one vent. Int. J. Hydrogen Energy 2015, 40, 2415–2429. [Google Scholar] [CrossRef]
- Giannissi, S.G.; Venetsanos, A.G.; Markatos, N. CFD modeling of hydrogen dispersion under cryogenic release conditions. Int. J. Hydrogen Energy 2014, 39, 15851–15863. [Google Scholar] [CrossRef]
- Gupta, S.; Brinster, J.; Studer, E. Hydrogen related risks within aprivate garage: Concentration measurements in a realistic full-scale experimental facility. Int. J. Hydrogen Energy 2009, 34, 5902–5911. [Google Scholar] [CrossRef]
- Pitts, W.M.; Yang, J.C.; Blais, M.; Joyce, A. Dispersion and burning behavior of hydrogen released in a full-scale residential garage in the presence and absence of conventional automobiles. Int. J. Hydrogen Energy 2012, 37, 17457–17469. [Google Scholar] [CrossRef]
Figure 1.
Physical model for calculation.

Figure 2.
Leakage at different leakage locations. They are listed as: (a) Leakage at leakage port I & II; (b) Leakage at leakage port III.
Figure 2.
Leakage at different leakage locations. They are listed as: (a) Leakage at leakage port I & II; (b) Leakage at leakage port III.

Figure 3.
Final Grid Partition Results.

Figure 4.
Model validation diagram. They should be listed as: (a) physical model; (b) Simulation and experimental comparison of hydrogen concentration change curve.
Figure 4.
Model validation diagram. They should be listed as: (a) physical model; (b) Simulation and experimental comparison of hydrogen concentration change curve.

Figure 5.
Distribution diagram of hydrogen concentration at the leakage outlet in open space. These are listed as: (a) t = 1 s; (b) t = 2.5 s; (c) t = 7.5 s; (d) t = 15 s.
Figure 5.
Distribution diagram of hydrogen concentration at the leakage outlet in open space. These are listed as: (a) t = 1 s; (b) t = 2.5 s; (c) t = 7.5 s; (d) t = 15 s.

Figure 6.
Distribution diagram of hydrogen concentration in open space vent II. These are listed as: (a) t = 0.5 s; (b) t = 1.5 s; (c) t = 9.5 s; (d) t = 11 s.
Figure 6.
Distribution diagram of hydrogen concentration in open space vent II. These are listed as: (a) t = 0.5 s; (b) t = 1.5 s; (c) t = 9.5 s; (d) t = 11 s.


Figure 7.
Distribution Chart of Hydrogen Concentration at Leakage Site III in open space. These are listed as: (a) t = 0.25 s; (b) t = 0.5 s; (c) t = 0.75 s; (d) t = 1.5 s; (e) t = 15 s.
Figure 7.
Distribution Chart of Hydrogen Concentration at Leakage Site III in open space. These are listed as: (a) t = 0.25 s; (b) t = 0.5 s; (c) t = 0.75 s; (d) t = 1.5 s; (e) t = 15 s.

Figure 8.
Change of hydrogen concentration in different leakage axis in open space.

Figure 9.
Distribution diagram of hydrogen concentration at different leakage rates at t = 0.75 s. These are listed as: (a) Q = 20 g/s; (b) Q = 10 g/s; (c) Q = 5 g/s.
Figure 9.
Distribution diagram of hydrogen concentration at different leakage rates at t = 0.75 s. These are listed as: (a) Q = 20 g/s; (b) Q = 10 g/s; (c) Q = 5 g/s.

Figure 10.
Distribution diagram of hydrogen concentration at different leakage rates at t = 15 s. These are listed as: (a) Q = 20 g/s; (b) Q = 10 g/s; (c) Q = 5 g/s.
Figure 10.
Distribution diagram of hydrogen concentration at different leakage rates at t = 15 s. These are listed as: (a) Q = 20 g/s; (b) Q = 10 g/s; (c) Q = 5 g/s.

Figure 11.
Distribution diagram of hydrogen concentration at different wind speeds at t = 1 s. These are listed as: (a) 10 m/s; (b) 5 m/s; (c) 2 m/s.
Figure 11.
Distribution diagram of hydrogen concentration at different wind speeds at t = 1 s. These are listed as: (a) 10 m/s; (b) 5 m/s; (c) 2 m/s.

Figure 12.
Distribution diagram of hydrogen concentration at different wind speeds at t = 15 s. These are listed as: (a) 10 m/s; (b) 5 m/s; (c) 2 m/s.
Figure 12.
Distribution diagram of hydrogen concentration at different wind speeds at t = 15 s. These are listed as: (a) 10 m/s; (b) 5 m/s; (c) 2 m/s.

Figure 13.
Distribution of hydrogen concentration in different wind directions at t = 0.5 s. These are listed as: (a) following wind; (b) against the wind.
Figure 13.
Distribution of hydrogen concentration in different wind directions at t = 0.5 s. These are listed as: (a) following wind; (b) against the wind.

Figure 14.
Distribution of hydrogen concentration in different wind directions at t = 15 s. These are listed as: (a) following wind; (b) against the wind.
Figure 14.
Distribution of hydrogen concentration in different wind directions at t = 15 s. These are listed as: (a) following wind; (b) against the wind.

Figure 15.
Distribution of hydrogen concentration in a 90-degree side plane. These are listed as: (a) t = 0.25 s; (b) t = 0.5 s; (c) t = 0.75 s; (d) t = 15 s.
Figure 15.
Distribution of hydrogen concentration in a 90-degree side plane. These are listed as: (a) t = 0.25 s; (b) t = 0.5 s; (c) t = 0.75 s; (d) t = 15 s.

Figure 16.
Schematic illustration of the spatial structure of different vent areas. They should be listed as: (a) S1; (b) S2; (c) S3.
Figure 16.
Schematic illustration of the spatial structure of different vent areas. They should be listed as: (a) S1; (b) S2; (c) S3.

Figure 17.
Spatial hydrogen concentration distribution in different vent areas at t = 4.5 s. These are listed as: (a) S1; (b) S2; (c) S3.
Figure 17.
Spatial hydrogen concentration distribution in different vent areas at t = 4.5 s. These are listed as: (a) S1; (b) S2; (c) S3.

Figure 18.
Spatial hydrogen concentration distribution in different vent areas at t = 60 s. These are listed as: (a) S1; (b) S2; (c) S3.
Figure 18.
Spatial hydrogen concentration distribution in different vent areas at t = 60 s. These are listed as: (a) S1; (b) S2; (c) S3.

Figure 19.
Changes of hydrogen concentration at monitoring points at different vent areas.

Figure 20.
Schematic illustration of spatial structure at different vent locations. These are listed as: (a) S1; (b) S4.
Figure 20.
Schematic illustration of spatial structure at different vent locations. These are listed as: (a) S1; (b) S4.

Figure 21.
Distribution diagram of spatial hydrogen concentration at different vent locations. These are listed as: (a) S1, t = 12 s; (b) S4, t = 12 s; (c) S1, t = 60 s; (d) S2, t = 60 s.
Figure 21.
Distribution diagram of spatial hydrogen concentration at different vent locations. These are listed as: (a) S1, t = 12 s; (b) S4, t = 12 s; (c) S1, t = 60 s; (d) S2, t = 60 s.

Figure 22.
Change of hydrogen concentration at the monitoring points at different vent locations.


Table 1.
Parameter.
| Nomenclature | |||
|---|---|---|---|
| velocity (m/s) | E | total energy of micro element (J) | |
| t | time (s) | thermal conductivity | |
| gas density (kg/m3) | h | enthalpy | |
| viscous stress (N) | mass concentration | ||
| P | gas pressure (Pa) | c | volume concentration |
| J | diffusion flux | D | diffusion coefficient |
Publisher’s Note: MDPI stays neutral with regard to jurisdictional claims in published maps and institutional affiliations. |
© 2021 by the authors. Licensee MDPI, Basel, Switzerland. This article is an open access article distributed under the terms and conditions of the Creative Commons Attribution (CC BY) license (https://creativecommons.org/licenses/by/4.0/).
Share and Cite
MDPI and ACS Style
Jiao, M.; Zhu, H.; Huang, J.; Zhang, X. Numerical Simulation of Hydrogen Leakage and Diffusion Process of Fuel Cell Vehicle. World Electr. Veh. J. 2021, 12, 193. https://0-doi-org.brum.beds.ac.uk/10.3390/wevj12040193
AMA Style
Jiao M, Zhu H, Huang J, Zhang X. Numerical Simulation of Hydrogen Leakage and Diffusion Process of Fuel Cell Vehicle. World Electric Vehicle Journal. 2021; 12(4):193. https://0-doi-org.brum.beds.ac.uk/10.3390/wevj12040193
Chicago/Turabian StyleJiao, Mingyu, Haoran Zhu, Jinglong Huang, and Xin Zhang. 2021. "Numerical Simulation of Hydrogen Leakage and Diffusion Process of Fuel Cell Vehicle" World Electric Vehicle Journal 12, no. 4: 193. https://0-doi-org.brum.beds.ac.uk/10.3390/wevj12040193