How Do People Move Around? National Data on Transport Modal Shares for 131 Countries


1
Transport Research Institute (TRI), School of Engineering & the Built Environment, Edinburgh Napier University, Edinburgh EH10 5DT, UK
2
UQ Business School, The University of Queensland, Brisbane, QLD 4072, Australia
3
Faculty of Engineering of Bilbao, University of the Basque Country, 48013 Bilbao, Spain
4
Resource Efficient Built Environment Lab (REBEL), Edinburgh Napier University, Edinburgh EH10 5DT, UK
*
Author to whom correspondence should be addressed.
World 2020, 1(1), 34-43; https://0-doi-org.brum.beds.ac.uk/10.3390/world1010003
Submission received: 19 May 2020
/
Revised: 9 June 2020
/
Accepted: 16 June 2020
/
Published: 18 June 2020
Abstract
:The COVID-19 pandemic has brought global mobility into the spotlight, with well over 100 countries having instituted either a full or partial lockdown by April 2020. Reduced mobility, whilst causing social and economic impacts, can also be beneficial for the environment and future studies will surely quantify such environmental gains. However, accurate quantification is intimately linked to good quality data on transport modal shares, as passenger cars and public transport have significantly different emissions profiles. Herein, we compile a currently lacking dataset on global modal transport shares for 131 countries. Notably, these are the countries covered by the Google Community Mobility Reports (plus Russia and China for their global relevance), thus allowing for a smooth integration between our dataset and the rich information offered by the Google Community Mobility Reports, thus enabling analysis of global emissions reductions due to mobility restrictions. Beyond the current pandemic, this novel dataset will be helpful to practitioners and academics alike working in transport research.
1. Introduction
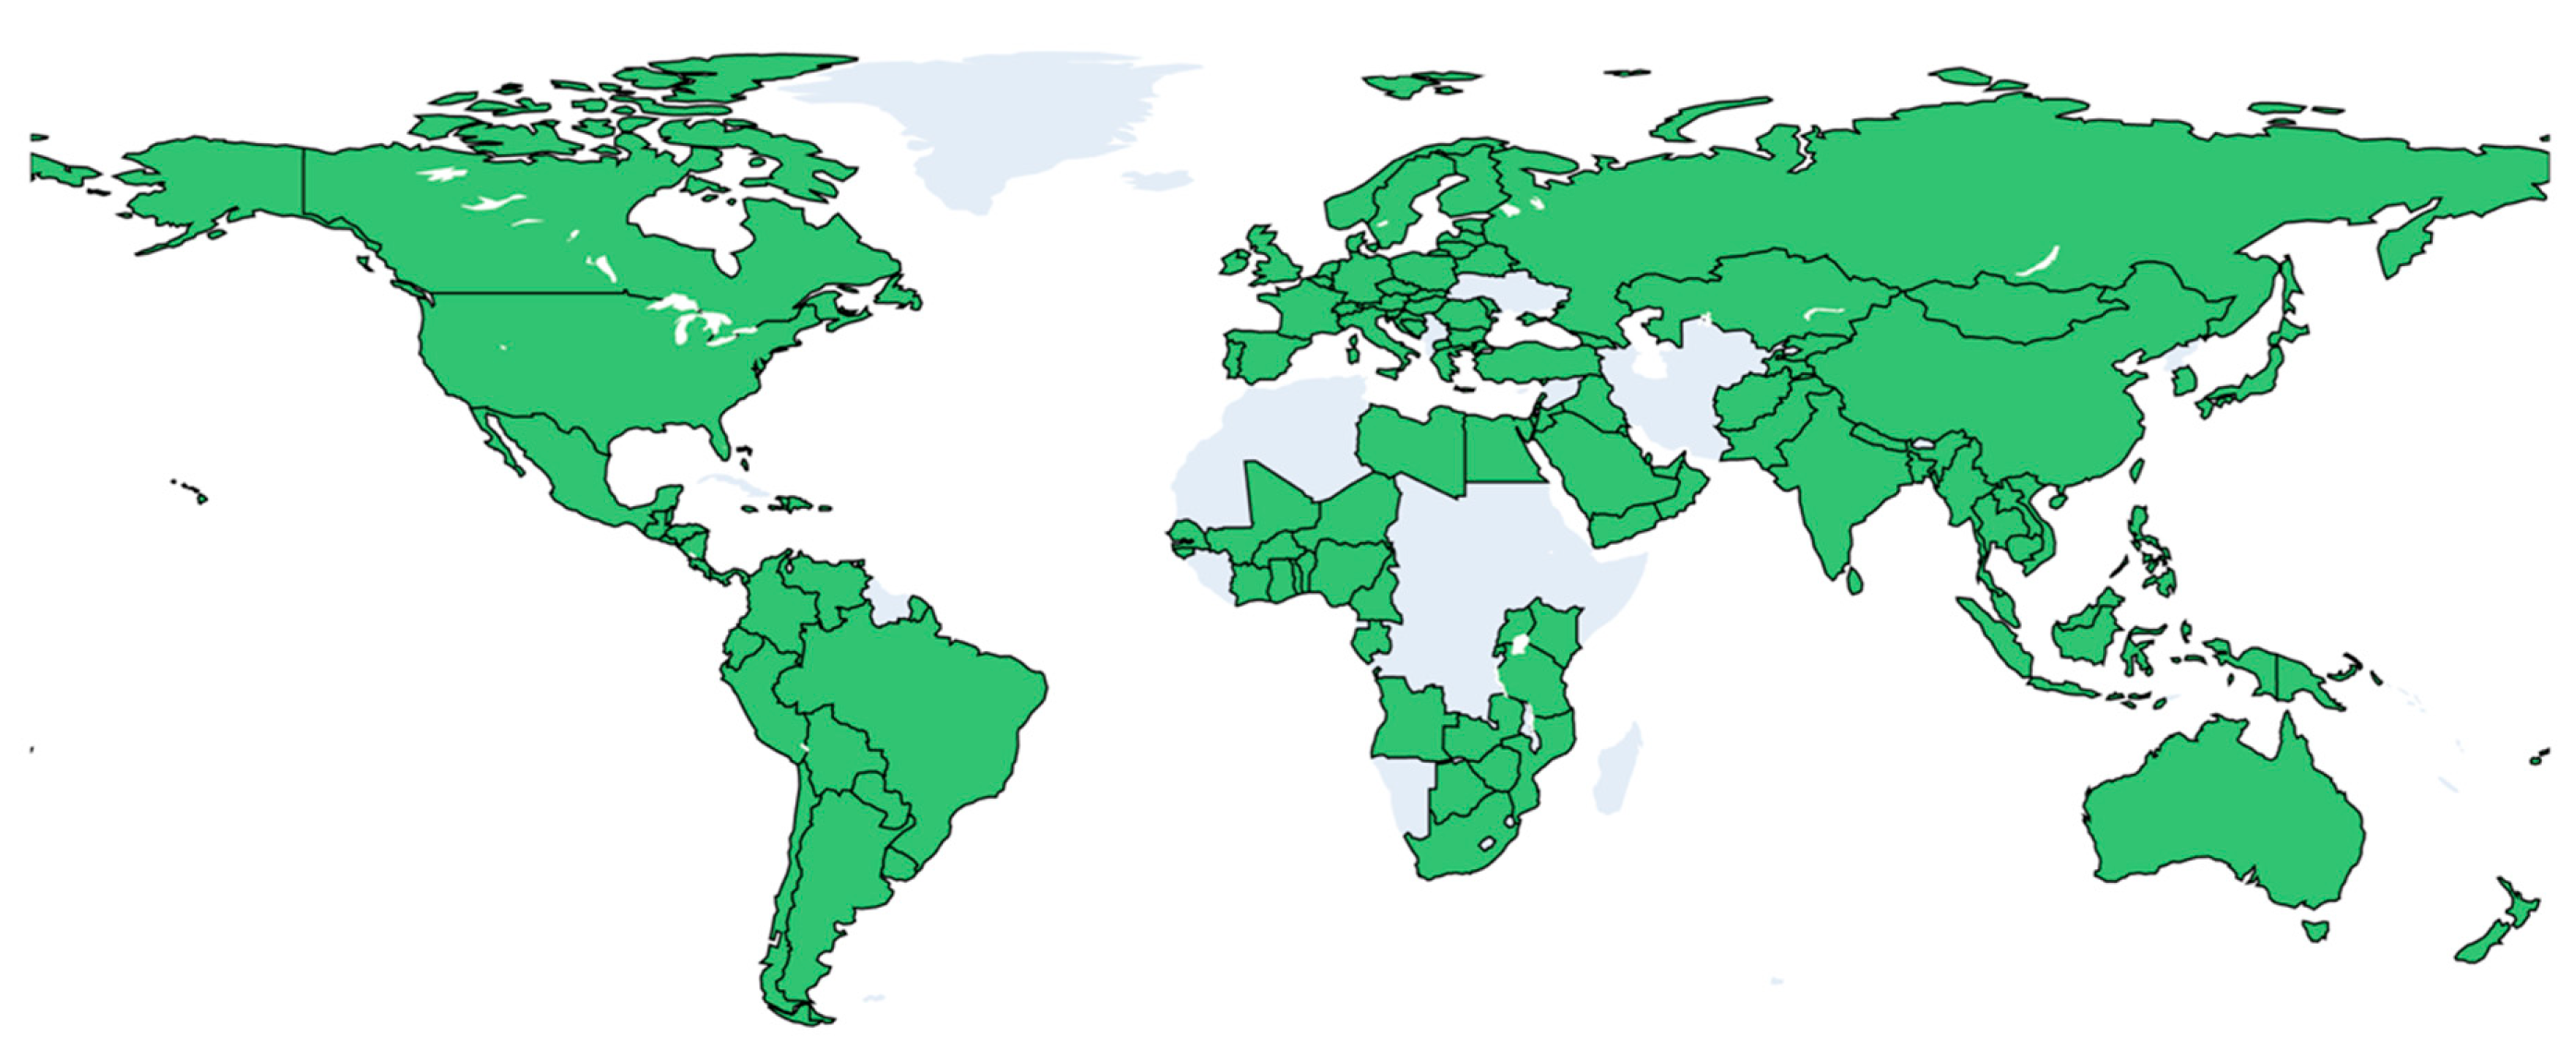
The COVID-19 pandemic has restated the importance of ‘one world, one health’ [1]. This unity has also been felt in other aspects of society, such as mobility restrictions caused by global lockdown measures, with well over 100 countries entering some form of lockdown [2]. These restrictions prompted Google to take the unprecedented measure of collecting, harmonizing, and releasing anonymized data on global mobility [3]. This information is invaluable in understanding the reduction in people’s movement due to global restrictions but does not report on what kind of transport is avoided by moving less. Given that studies are already appearing based on the Google Community Mobility Reports (GCMR) [4,5], and likely many more will follow, we intend to support such research by presenting an unprecedented dataset of modal transport shares for 131 countries (see Figure 1). Notably, these are the countries covered by the GCMR (plus Russia and China for their global relevance), thus allowing for a smooth integration between our dataset and the rich information offered by Google. This novel data will not only support immediate research efforts linked to understanding the environmental implications of the COVID-19 pandemic but it also represents a stepping-stone for creating and maintaining such global datasets for future research and analyses on global transport issues.
2. Materials and Methods
To compile the global modal share data to distinguish primarily between public vehicle use (rail, bus, coach) and private vehicle use (mainly the passenger car), a three-step data collection procedure was developed and implemented. Table 1 shows the source type and number of countries covered in each step.
- Step 1
The first step was to use international, reputable databases that systematically compile and report transport modal split information. Parameters on these databases are regularly updated, cleaned, and reported following certain standards. Retrieving data directly from these centrally-managed sources helps safeguard the data in terms of their quality and consistency. In this step, data were identified for 37 countries using the following sources:
- (a)
- The ITF (International Transport Forum) Transport Statistics database [6], which provides the modal share information for various countries across the globe that are members of the Organization for Economic Co-operation and Development (OECD). The reported cases are from various years; 47% of data were from 2018, 23% from 2017, 13% from 2016, and 17% from 2015 or earlier.
- (b)
- The Eurostat, the Statistical Office of the European Union [7], which provides a comprehensive database with a broad range of transport statistics (including modal shares) for all of the European Union countries as well as for candidate countries and those belonging to the European Free Trade Association. 63% of data were from 2017, 7% from 2016, 7% from 2015, and 25% from 2014 or earlier.
- Step 2
For countries that are not covered in these international databases, the second step was to source data individually; data for 53 countries were compiled in this step. The relevant documents were identified through a systematic online search using keywords such as “passenger modal share”, “passenger modal split”, “passenger mode share”, or similar. Upon the identification of appropriate sources, we manually reviewed them to extract the relevant shares for the specified transport modes (for further details on the transport modes covered, see Section 3). For several countries, official transportation data only report city-level traffic, mainly covering passenger transport in the metropolitan areas. In these cases, transport shares were weighted against their city population to proxy the nationwide modal share pattern. These individual sources included:
- (c)
- Reports from acknowledged international organizations or associations with particular focus on passenger mobility, such as the World Bank [8], the International Association of Public Transport [9], the Japan International Cooperation Agency [10], the Global BRT Data [11], and the United Nations Economic Commission for Europe [12]. 11% of data were from 2019–2018, 42% from 2017–2014, and 47% from 2013 or earlier.
- (d)
- National governance or policy documents, such as mobility reports, national transport strategies, and assessments or urban mobility plans that are publicly available. 33% of data were from 2015–2012, 50% of data were from 2010–2009, and the rest were from 2004.
It should be noted that sources (c) and (d) were mostly used to identify modal shares in low-income or developing countries, where comprehensive transport databases are not typically held by Public Authorities [13]. Special consideration was given to countries with unique mobility characteristics in terms of preferred transport modes. These characteristics may refer to the extensive use of private motorized modes other than a passenger car (e.g., two or three wheelers, auto rickshaw), informal public transport, and massive transit systems (e.g., bus rapid transit systems). To ensure that such country-specific characteristics were captured within the modal share options of the dataset, we validated the collected information from sources (c) and (d) through informal feedback from transport researchers with relevant expertise.
- Step 3
For a number of countries, the identification of the modal share data through the aforementioned sources was not possible, which left 42 countries with no transport mode data. These are the countries whose transport data are published on non-English platforms or their data simply do not exist. Step 3 aimed to fill in the missing values by estimating the private vehicle share based on economic factors. Economic factors, especially income, have long been suggested as important explanatory variables for the number of private vehicles owned in society [14]. This relationship between vehicle ownership and Gross Domestic Product (GDP) was empirically confirmed for OECD countries [15], India [16], China [17], and the global case of 154 countries [18].
Since car ownership and car use are highly correlated, a regression analysis was performed to establish the relationship between the percentage of private vehicles among all inland vehicles and income. From Steps 1 and 2, the 87 countries with complete modal share data were used for the regression analysis; specifically, 66 data points (75%) were selected to calibrate the coefficients and 21 data points were used as the validation set to compare the officially observed car shares and the predicted values from the regression model. Once the validation result was satisfactory, the regression coefficient () was used to predict the percentage of private vehicle use for the remaining 42 countries based on their GDP per capita (constant 2010 US$) [19]. The regression formula is specified as follows:
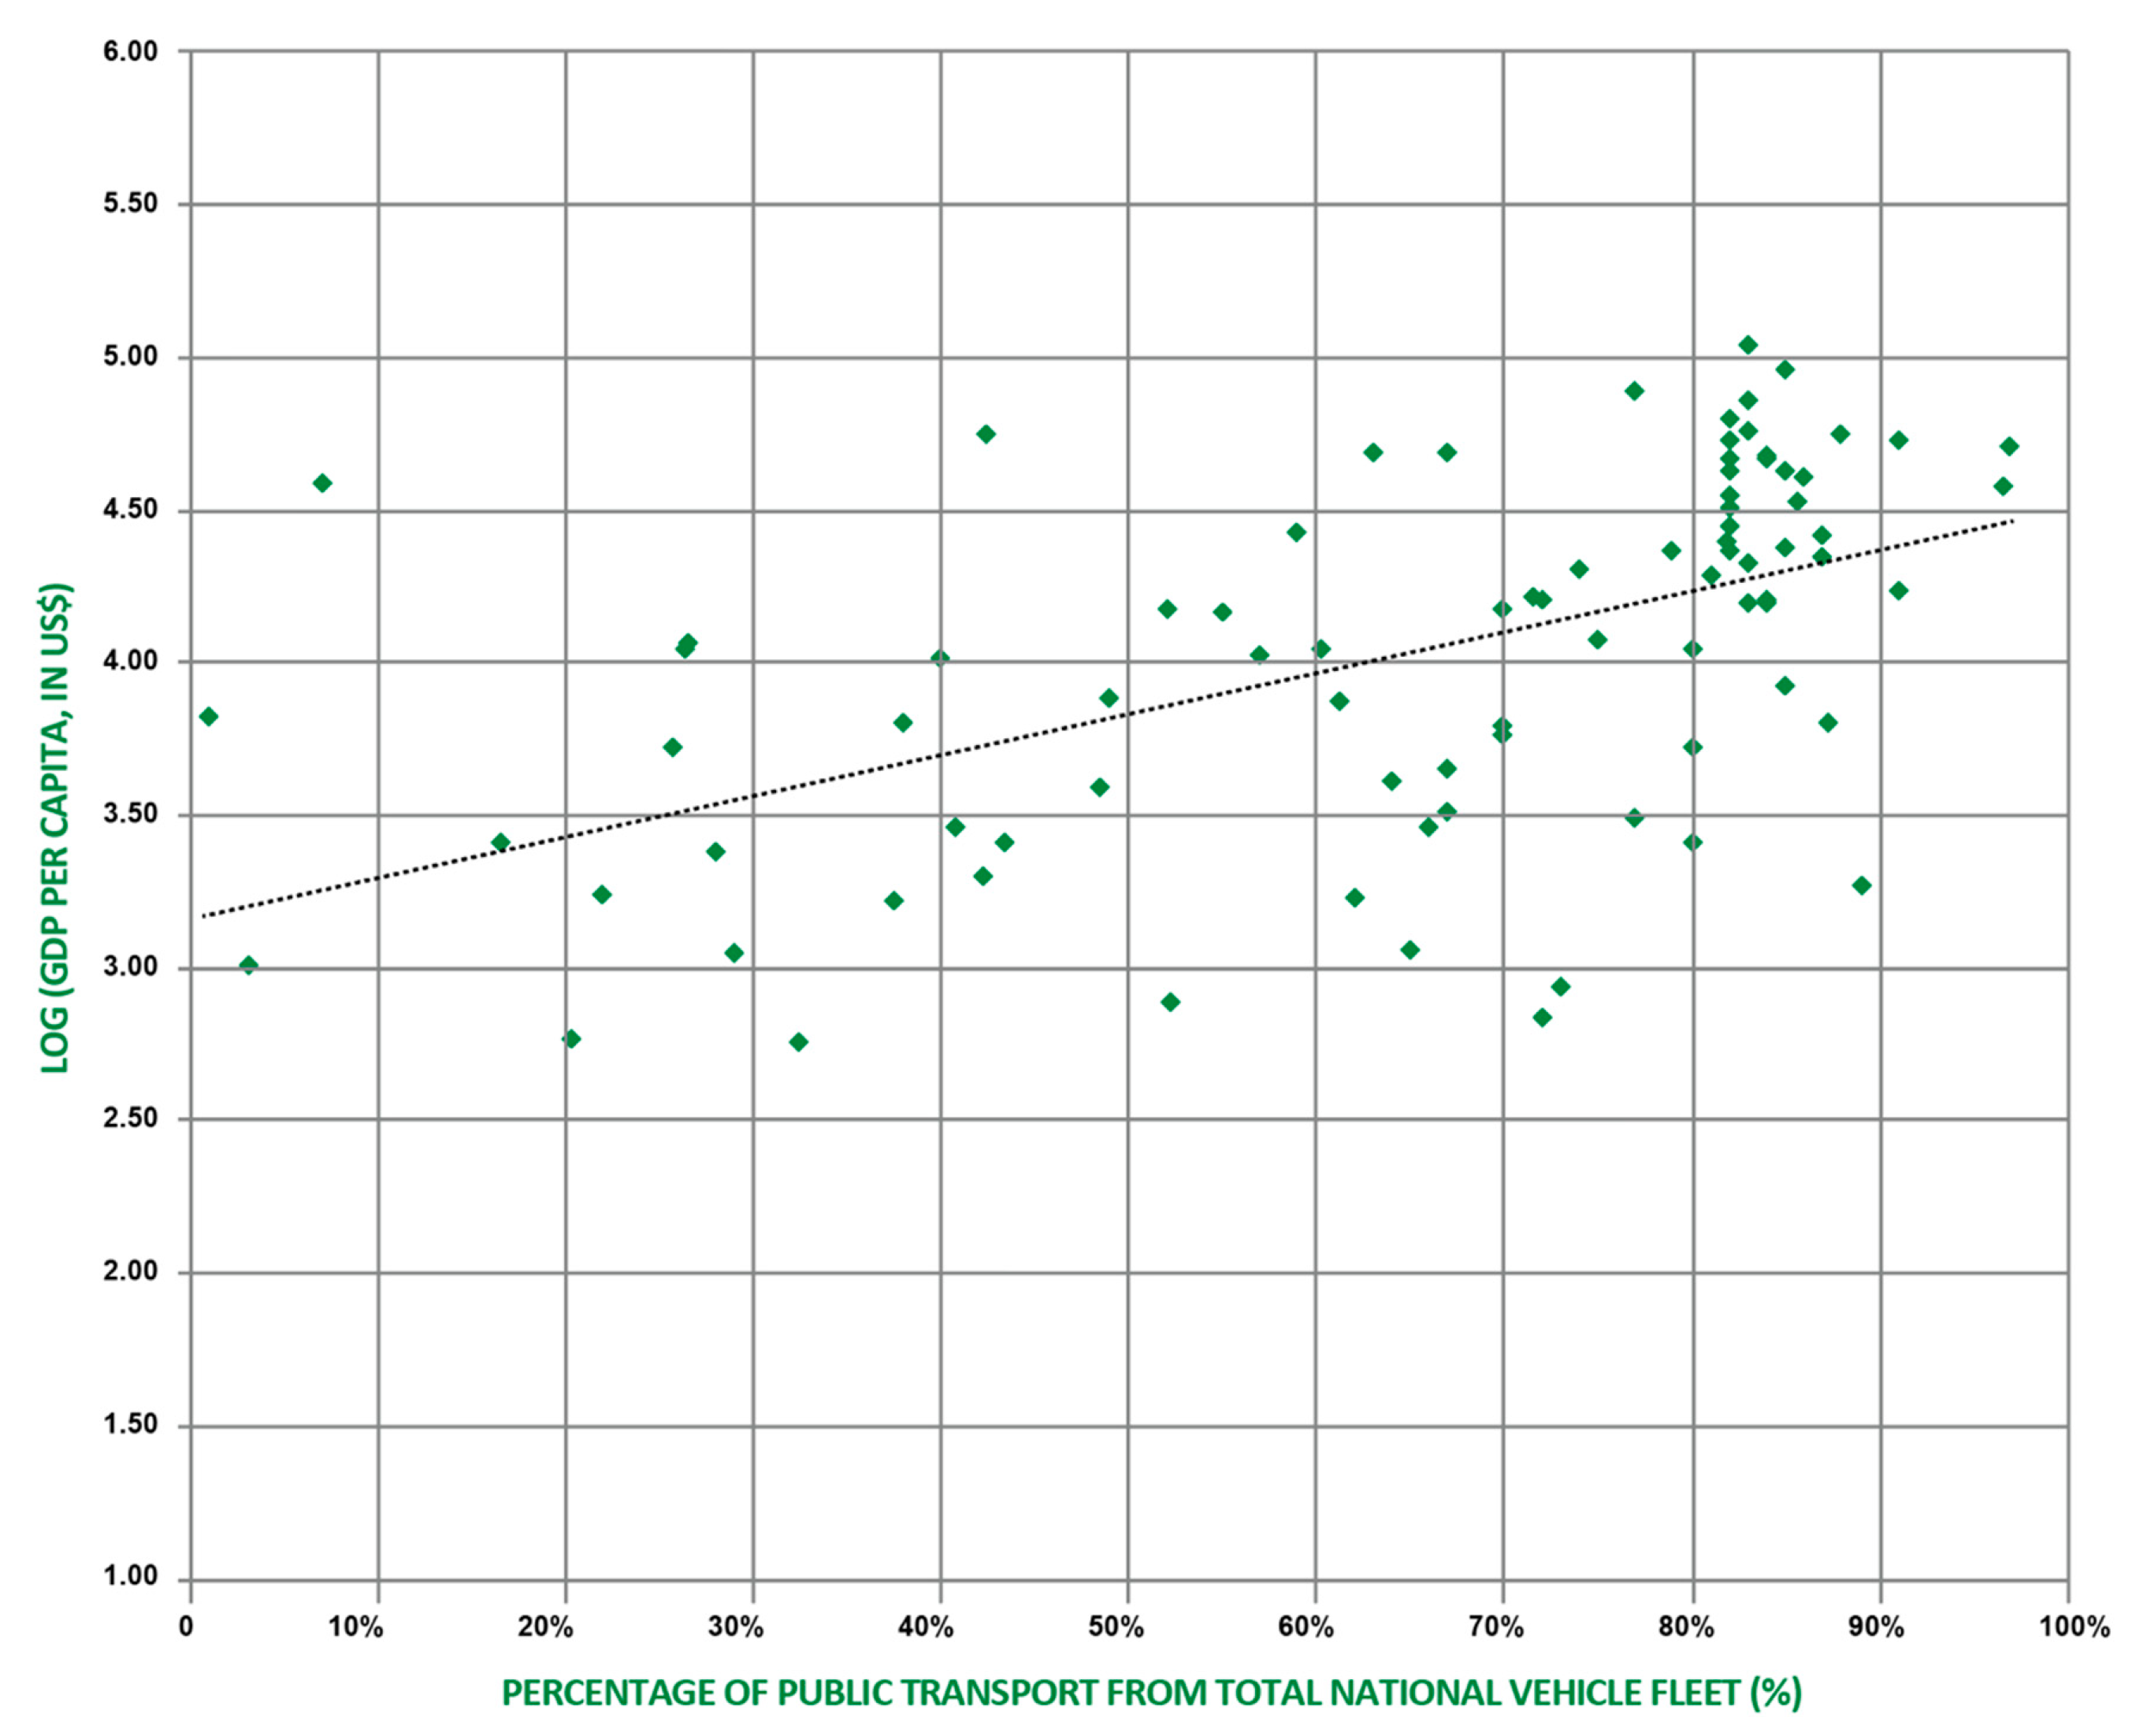
where, is a constant term and ε denotes an error term. Figure 2 displays the scatter plot between car use and GDP per capita for 87 countries. The clustering of data points in the upper right of the plot illustrates a positive relationship between these two variables. The literature has identified an S-shape relationship between income and vehicle ownership, referred to as the Gompertz Curve [20]. Based on this curve, the vehicle ownership ratio tends to rise when the economy first expands, then accelerates, and later reaches a saturation point when countries obtain a highly developed status with high income per capita. In the analysis, multiple specifications on its shape were examined to identify the best functional form.
Based on the adjusted R-squared value, the simple linear relationship outperforms other function forms, including the S-shape and others. The model was strongly significant (F = 21.968, p-value < 0.001, adjusted R-squared = 0.26) and the coefficient was 0.098 (p-value < 0.001). This supports a clear pattern that the percent of private vehicle use increases with rising income. The validation analysis showed that, for the 21 data points, the predicted car shares were higher for 8 countries than their official figures and lower for 13 countries. This suggests that the regression model does not systematically bias toward a higher or lower value. The average difference between the predicted and official car share data for these 21 data points was 12%.
3. Data
Based on the data sources above and following the procedure described, we collected data on transport modal shares as well as car shares over total vehicles in a country.
3.1. Transport Modal Share
The modal share constitutes an indicator that quantifies the percentage share of each specific transport mode within the transport network of a well-defined spatial entity (e.g., city, region, or country). The calculation of the modal share can be based on various elements, such as the percentage of travelers using a specific transport mode, the percentage of trips conducted, or the distance traveled using a specific transport mode. Given the availability of various approaches to estimate the modal share indicators, countries may employ different methodologies with respect to how the modal shares are defined and how the necessary data are collected. As expected, this variation of approaches may induce significant barriers in collating disparate modal share data from across the globe and creating a comprehensive dataset. In this study, we attempted to reduce the bias potentially arising from inconsistencies in the modal share calculation approaches by drawing national data (where possible) from comprehensive databases that use consistent criteria for such calculations, such as those held by the ITF or the Eurostat. Despite the disparate nature, the integration of national modal share data and the development of a global dataset could provide an aggregate, yet informative, screening of mobility trends in each country.
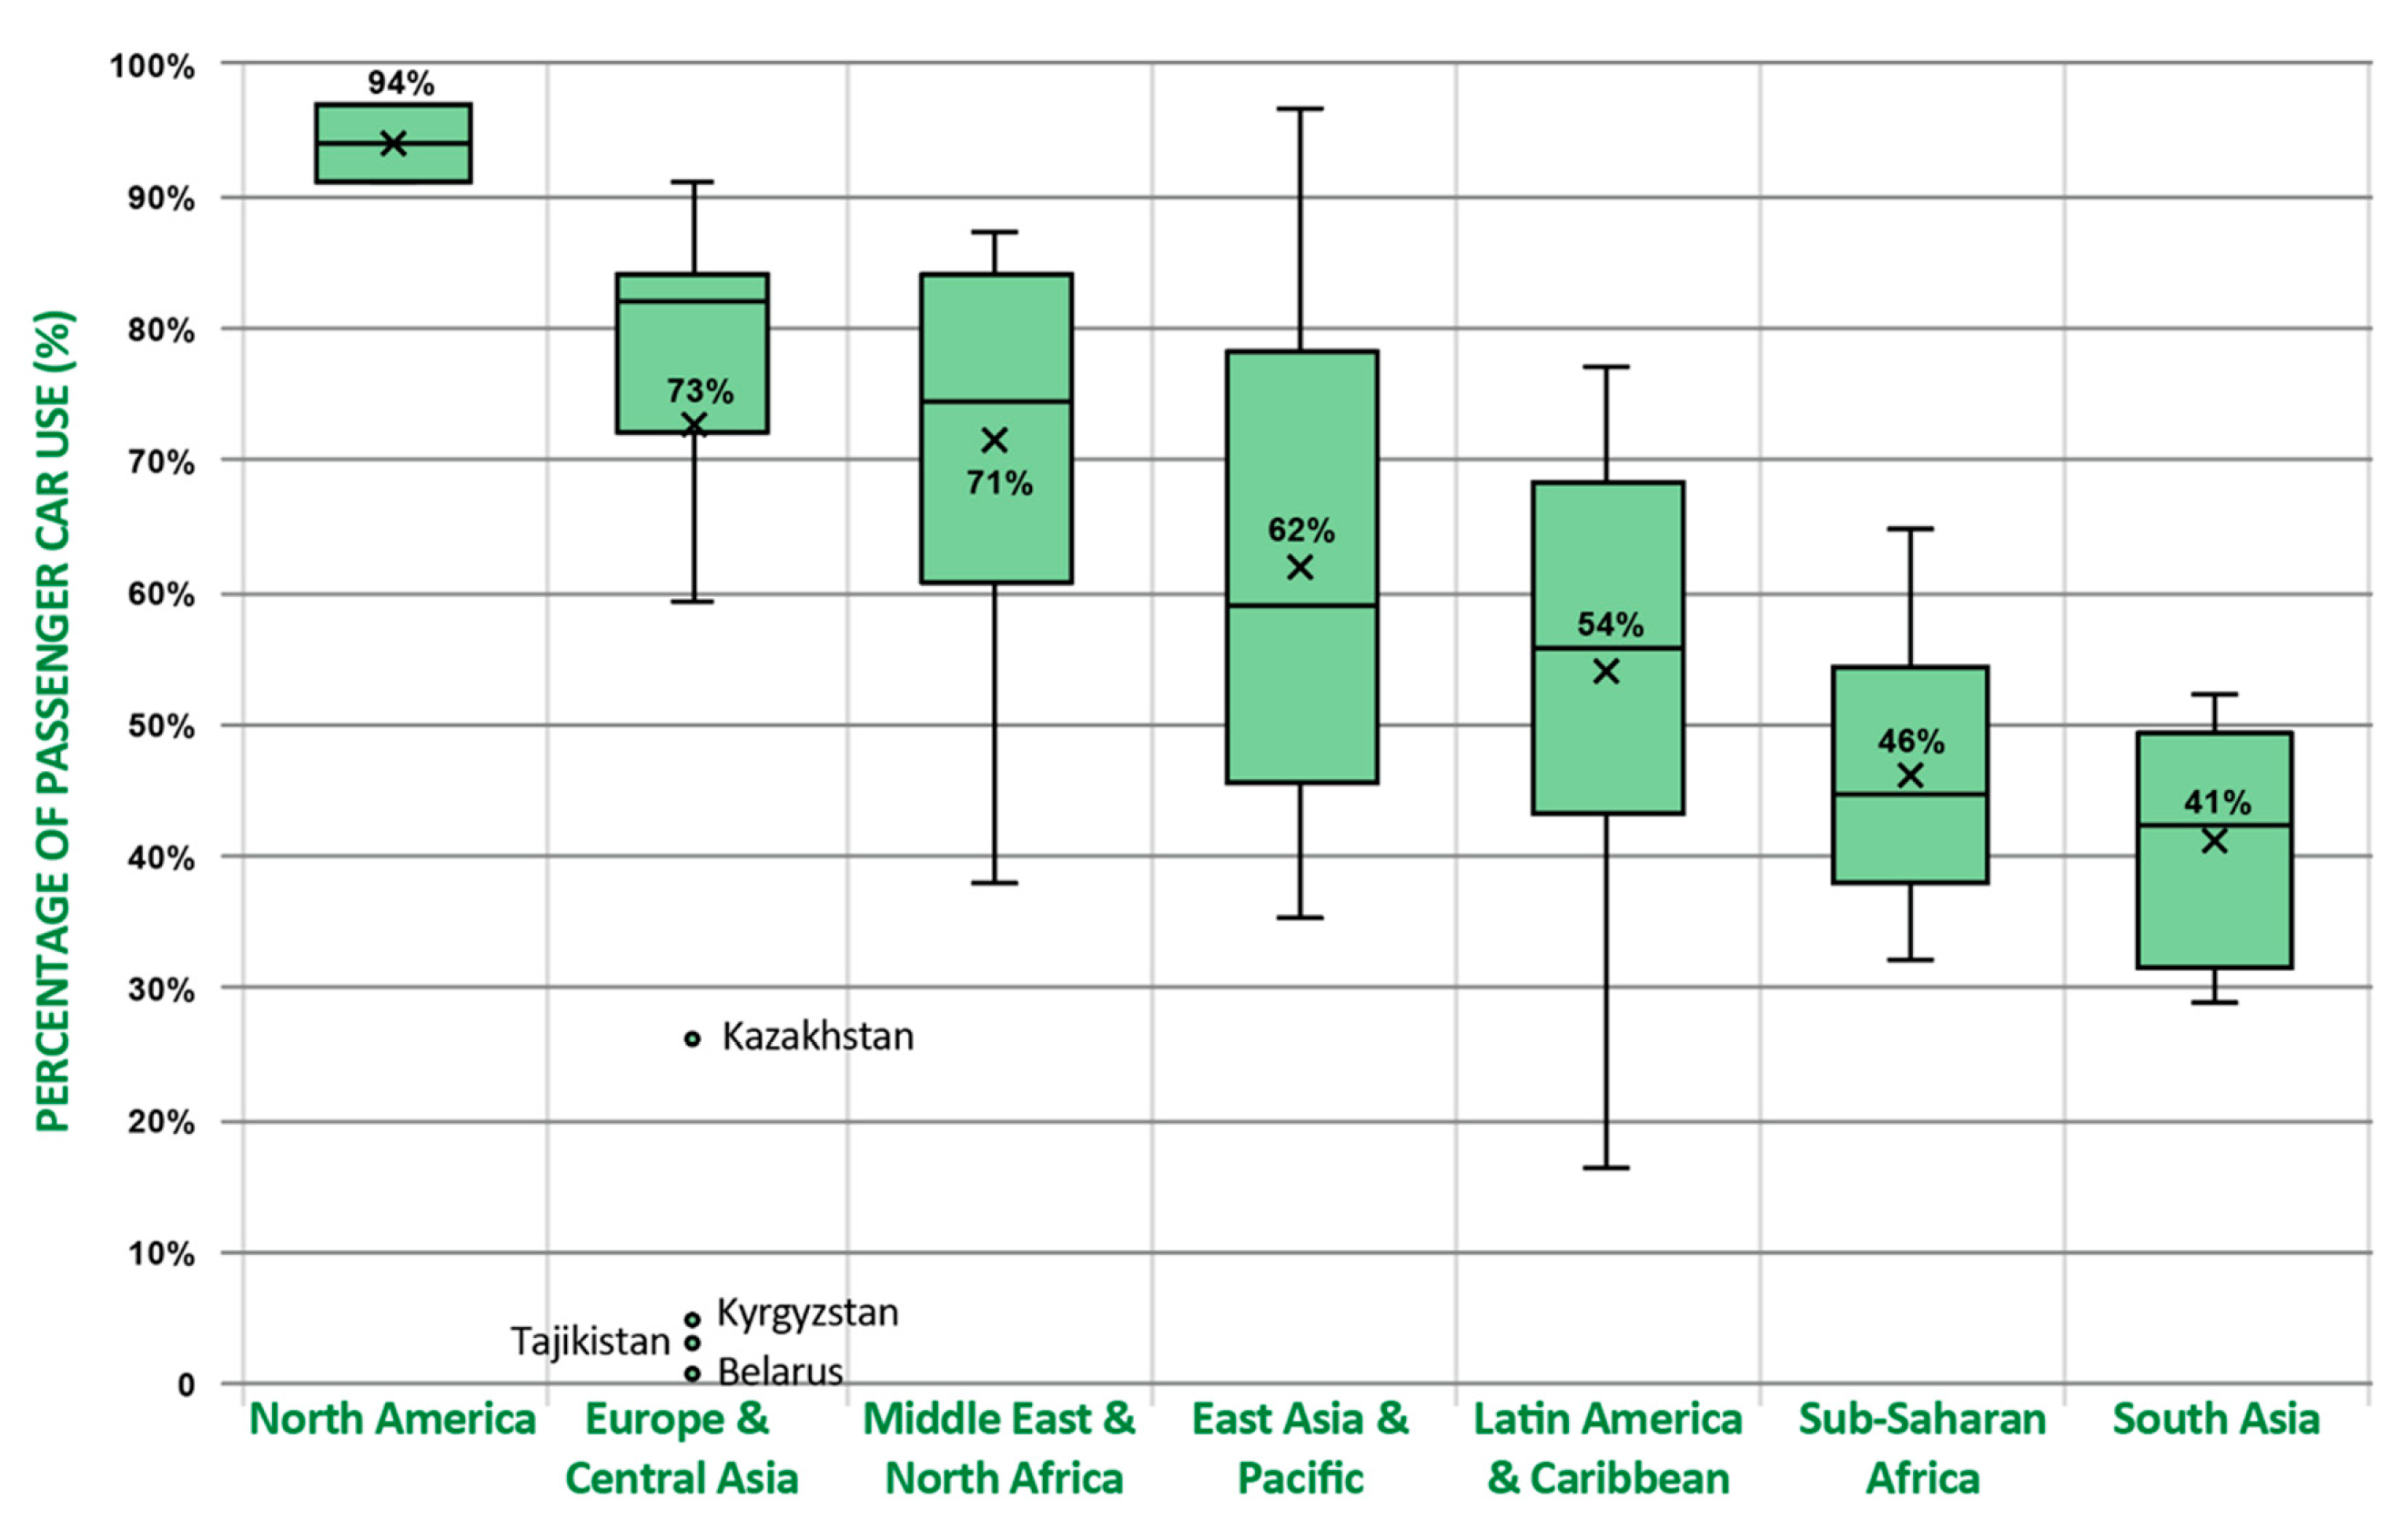
The dataset consisted of modal shares for motorized passenger transport from 131 countries. These shares reflect passenger trips that were taken, using motorized modes, within the inland transport network, including passenger car, rail, and bus or coach; non-motorized modes (e.g., walking or cycling) have been excluded from the scope of the analysis. Another limitation faced in the data collation process arose from the lack of information about rail share for the majority of countries. For cases where rail share data could not be explicitly extracted from the data sources, we provided modal share statistics by distinguishing between public transport (that collectively comprised bus/coach and rail shares) and private transport (particularly the passenger car). Detailed modal share values for all 131 countries in the dataset are included in the Supplementary Material. To offer a comprehensive overview of the contextual and spatial variations of the passenger car share, Table 2 gives a breakdown of average car share by region, GDP per capita, and human development index.
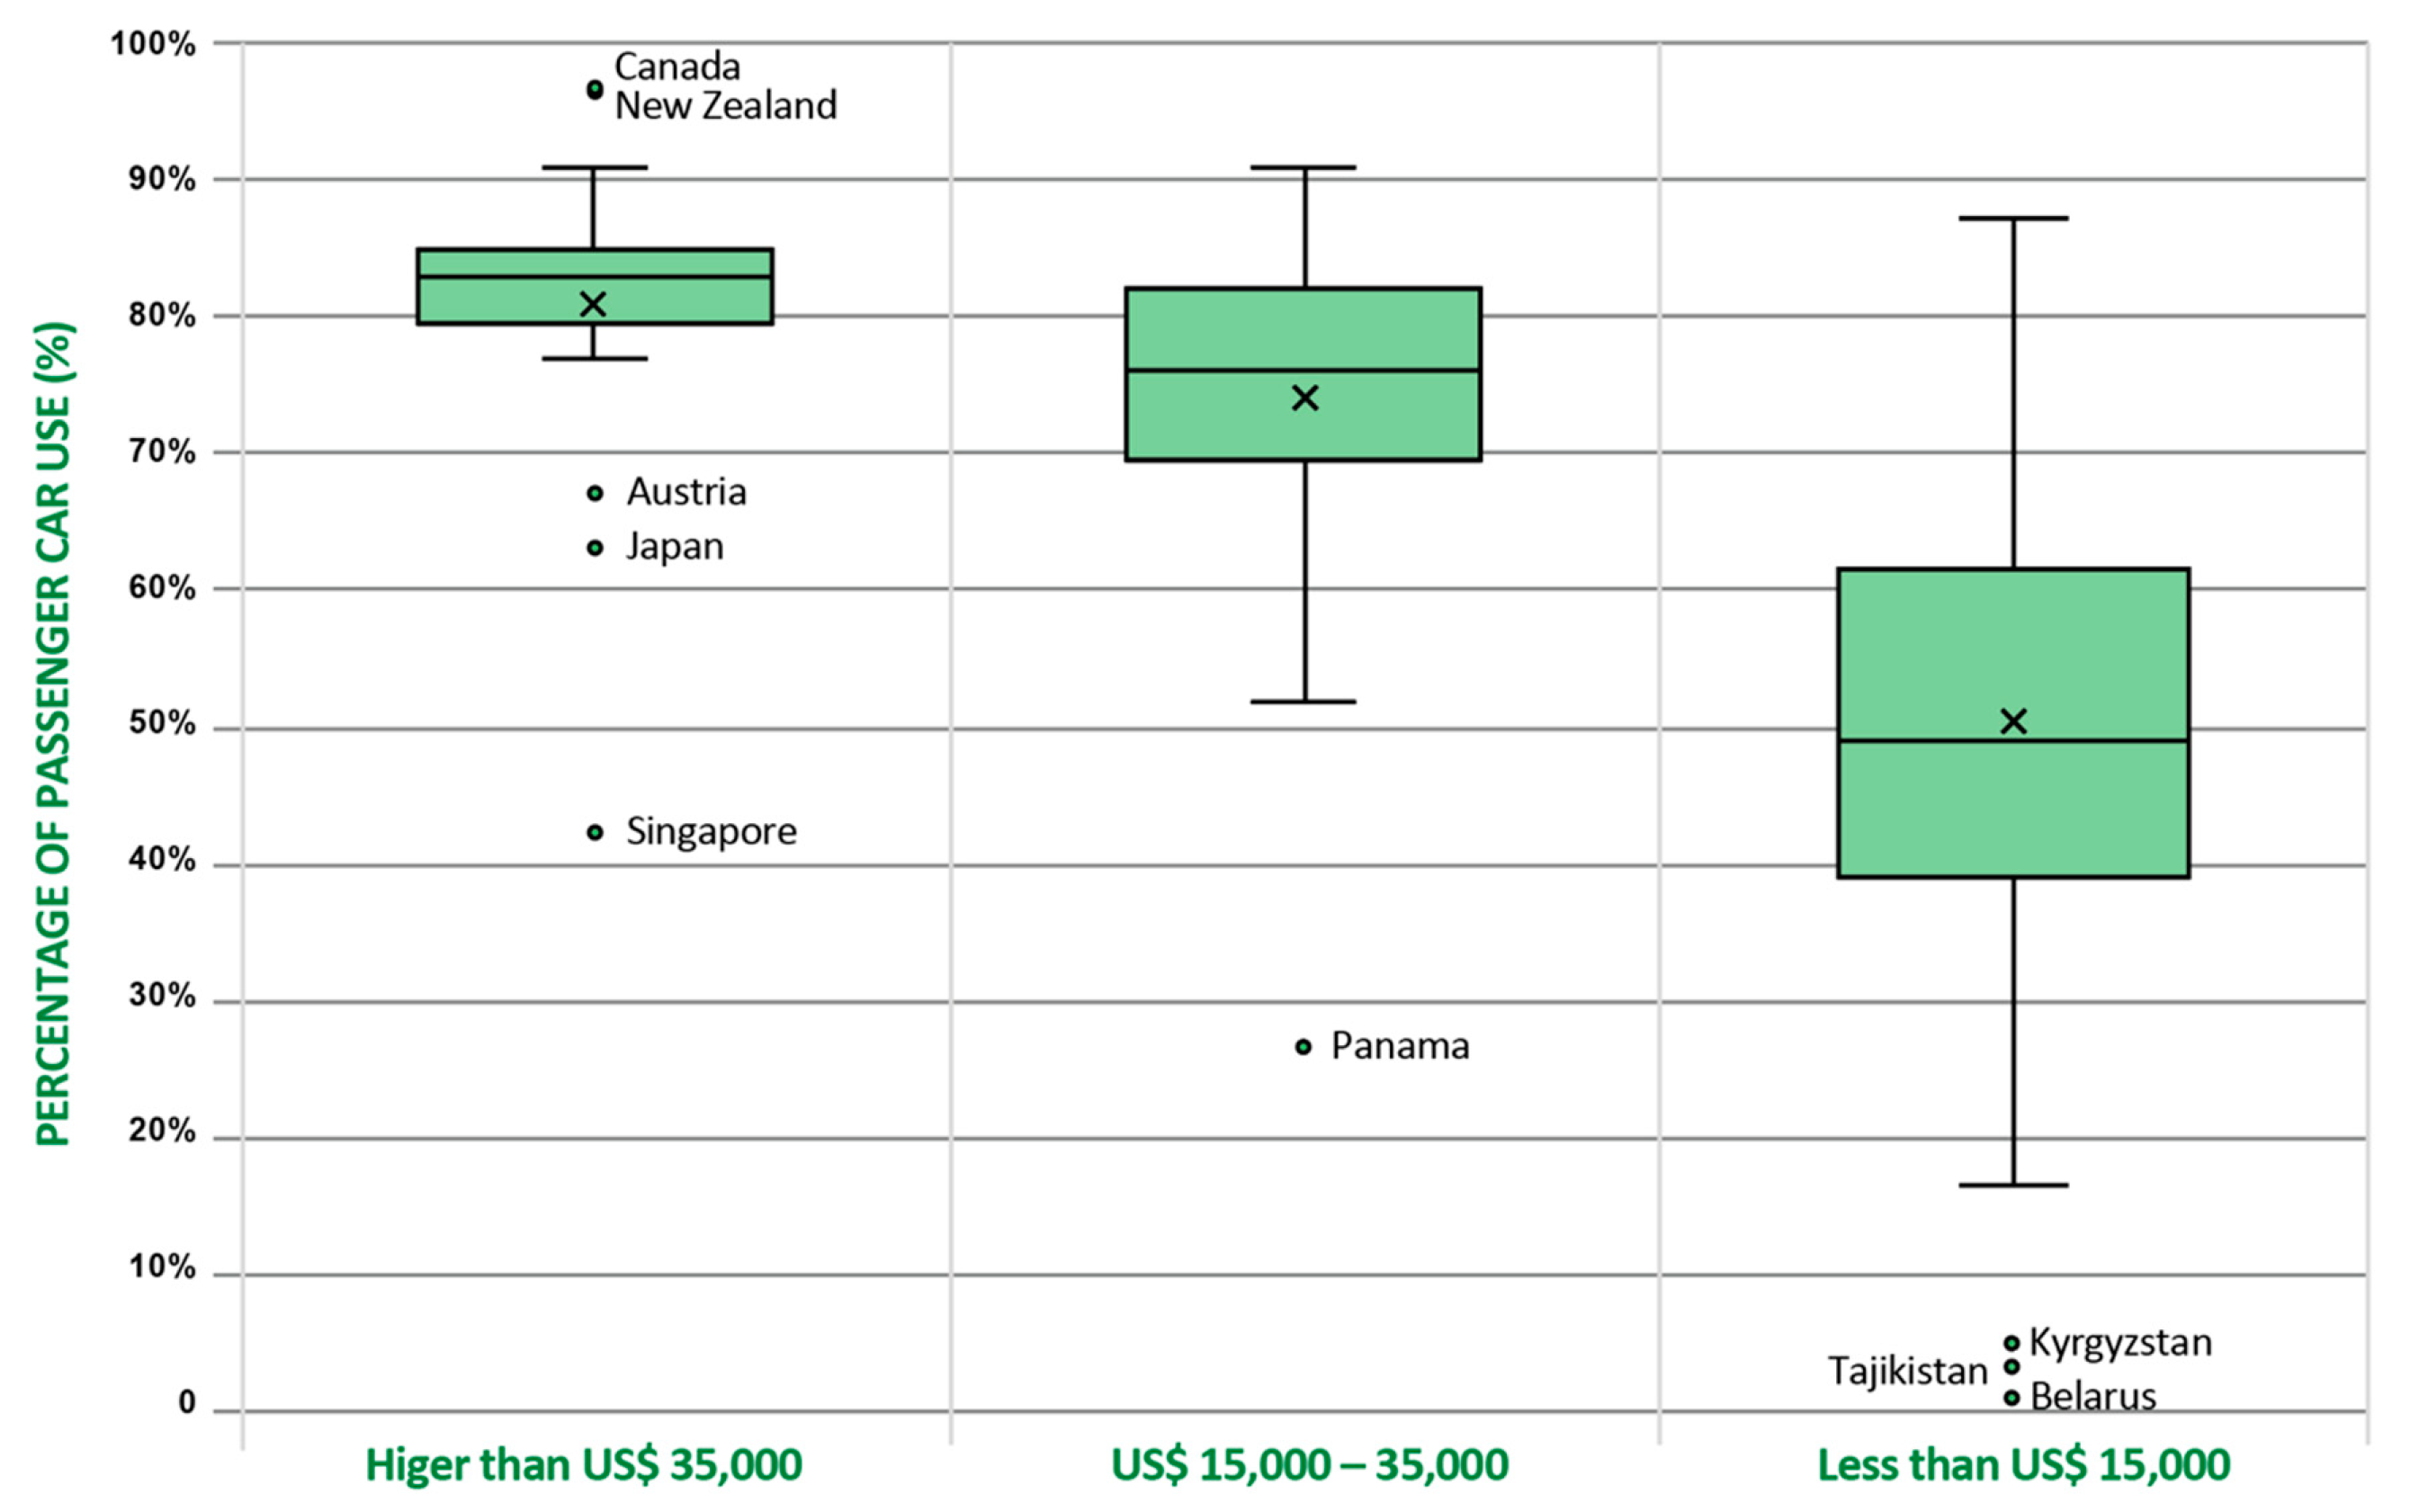
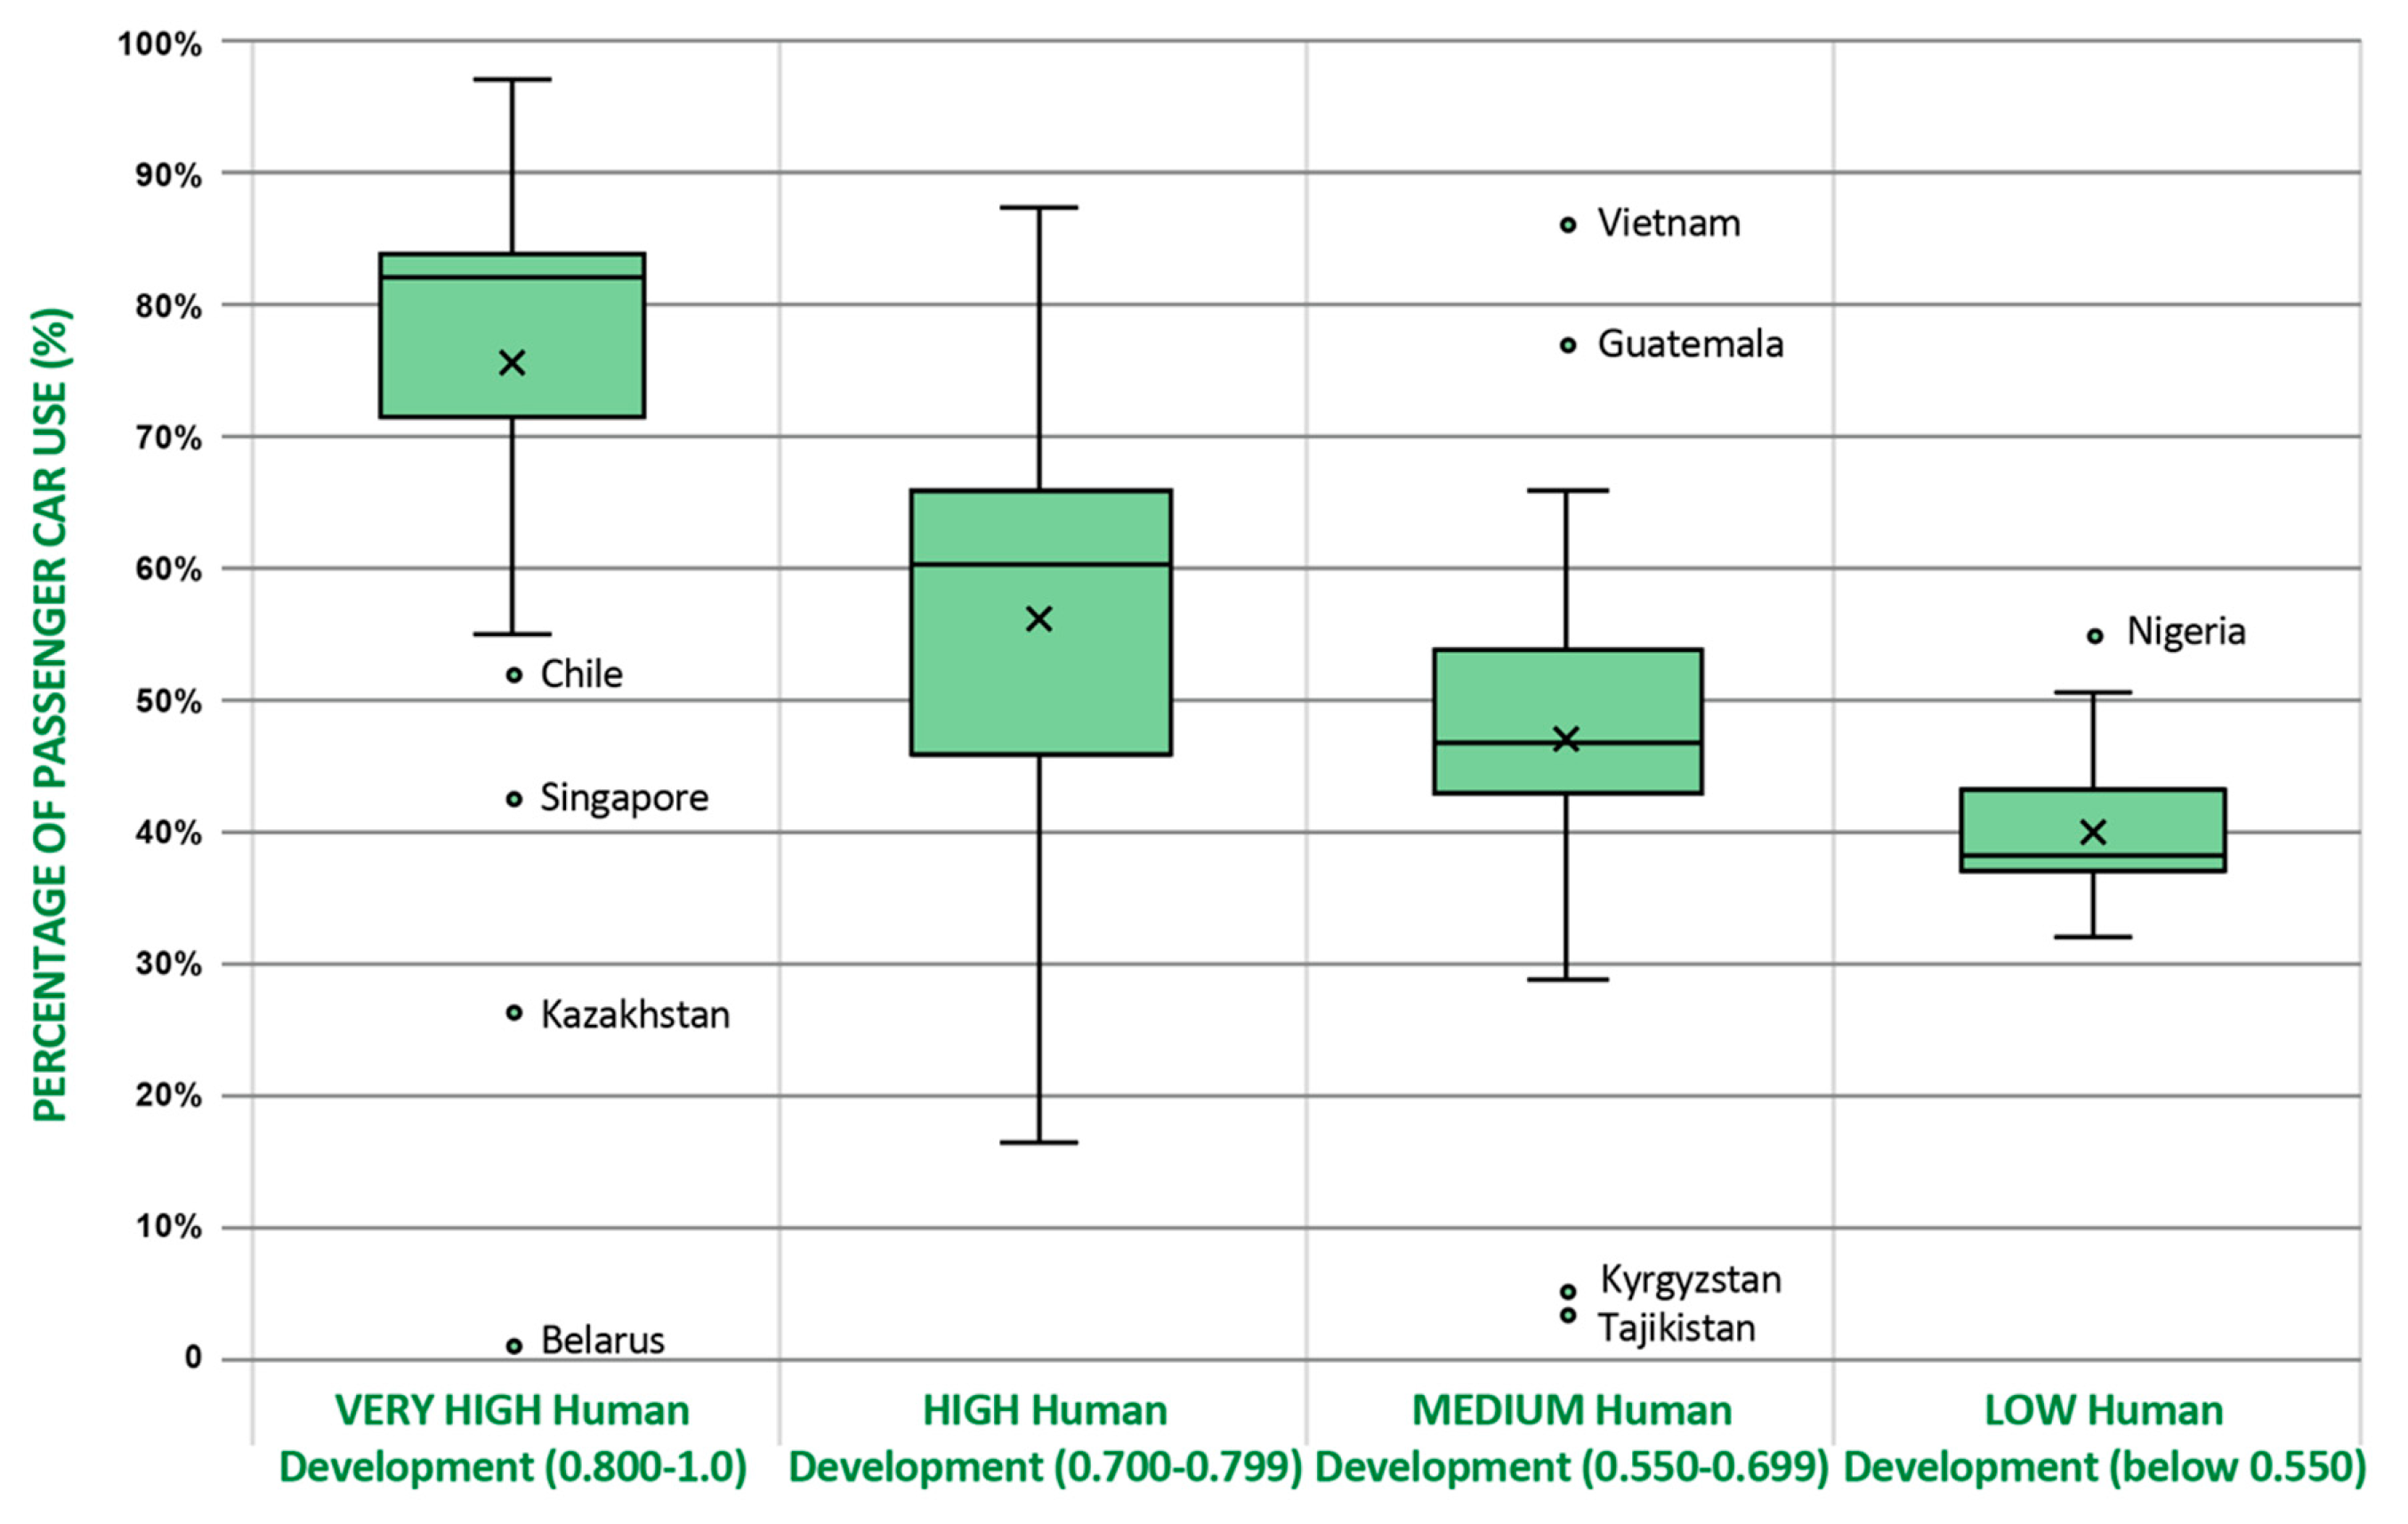
Figure 3, Figure 4 and Figure 5 provide illustrations of the car share distribution by region, GDP per capita, and human development index, respectively. Overall, the average passenger car share for the 131 countries included in the dataset was 61.2%. As shown in the first column of Table 2, the highest percentage car share (94%) was identified in North America, where the urban sprawl, ample availability of highway networks and parking spaces, lack of appealing policy context for public transport, and high motorization rates have long led to the establishment of car-dependent mobility systems. On the contrary, regions such as Latin America, Sub-Saharan Africa, and South Asia exhibit significantly lower car shares. This pattern could be attributed to the success of massive transport systems (especially in metropolitan areas of Latin America), the extensive use of informal public transport, and the presence of low-income countries in these regions. The positive correlation between income, economic and societal growth, and car share is further illustrated in the second and third column of Table 2. In line with previous research [21], higher GDP relates to higher car share. A similar pattern was observed when considering the average car shares by groups of countries featuring different levels of human development. The latter was quantified through the Human Development Index (HDI), which was developed by the United Nations to evaluate the overall development of a country taking into account key dimensions such as health, life expectancy, education, and standard of living [22]. Table 2 shows that countries with a very high development index exhibited a higher than average car share, thus indicating the dominant role of private, motorized mobility in contemporary developed societies. However, the presence of countries with successful public and/or non-motorized transport systems (e.g., Nordic countries, The Netherlands, Japan) in the group of countries with very high human development counterbalances the high car share trends induced by heavily car-dependent countries (e.g., USA, Canada, and Australia) that belong in the same group.
3.2. Car Share
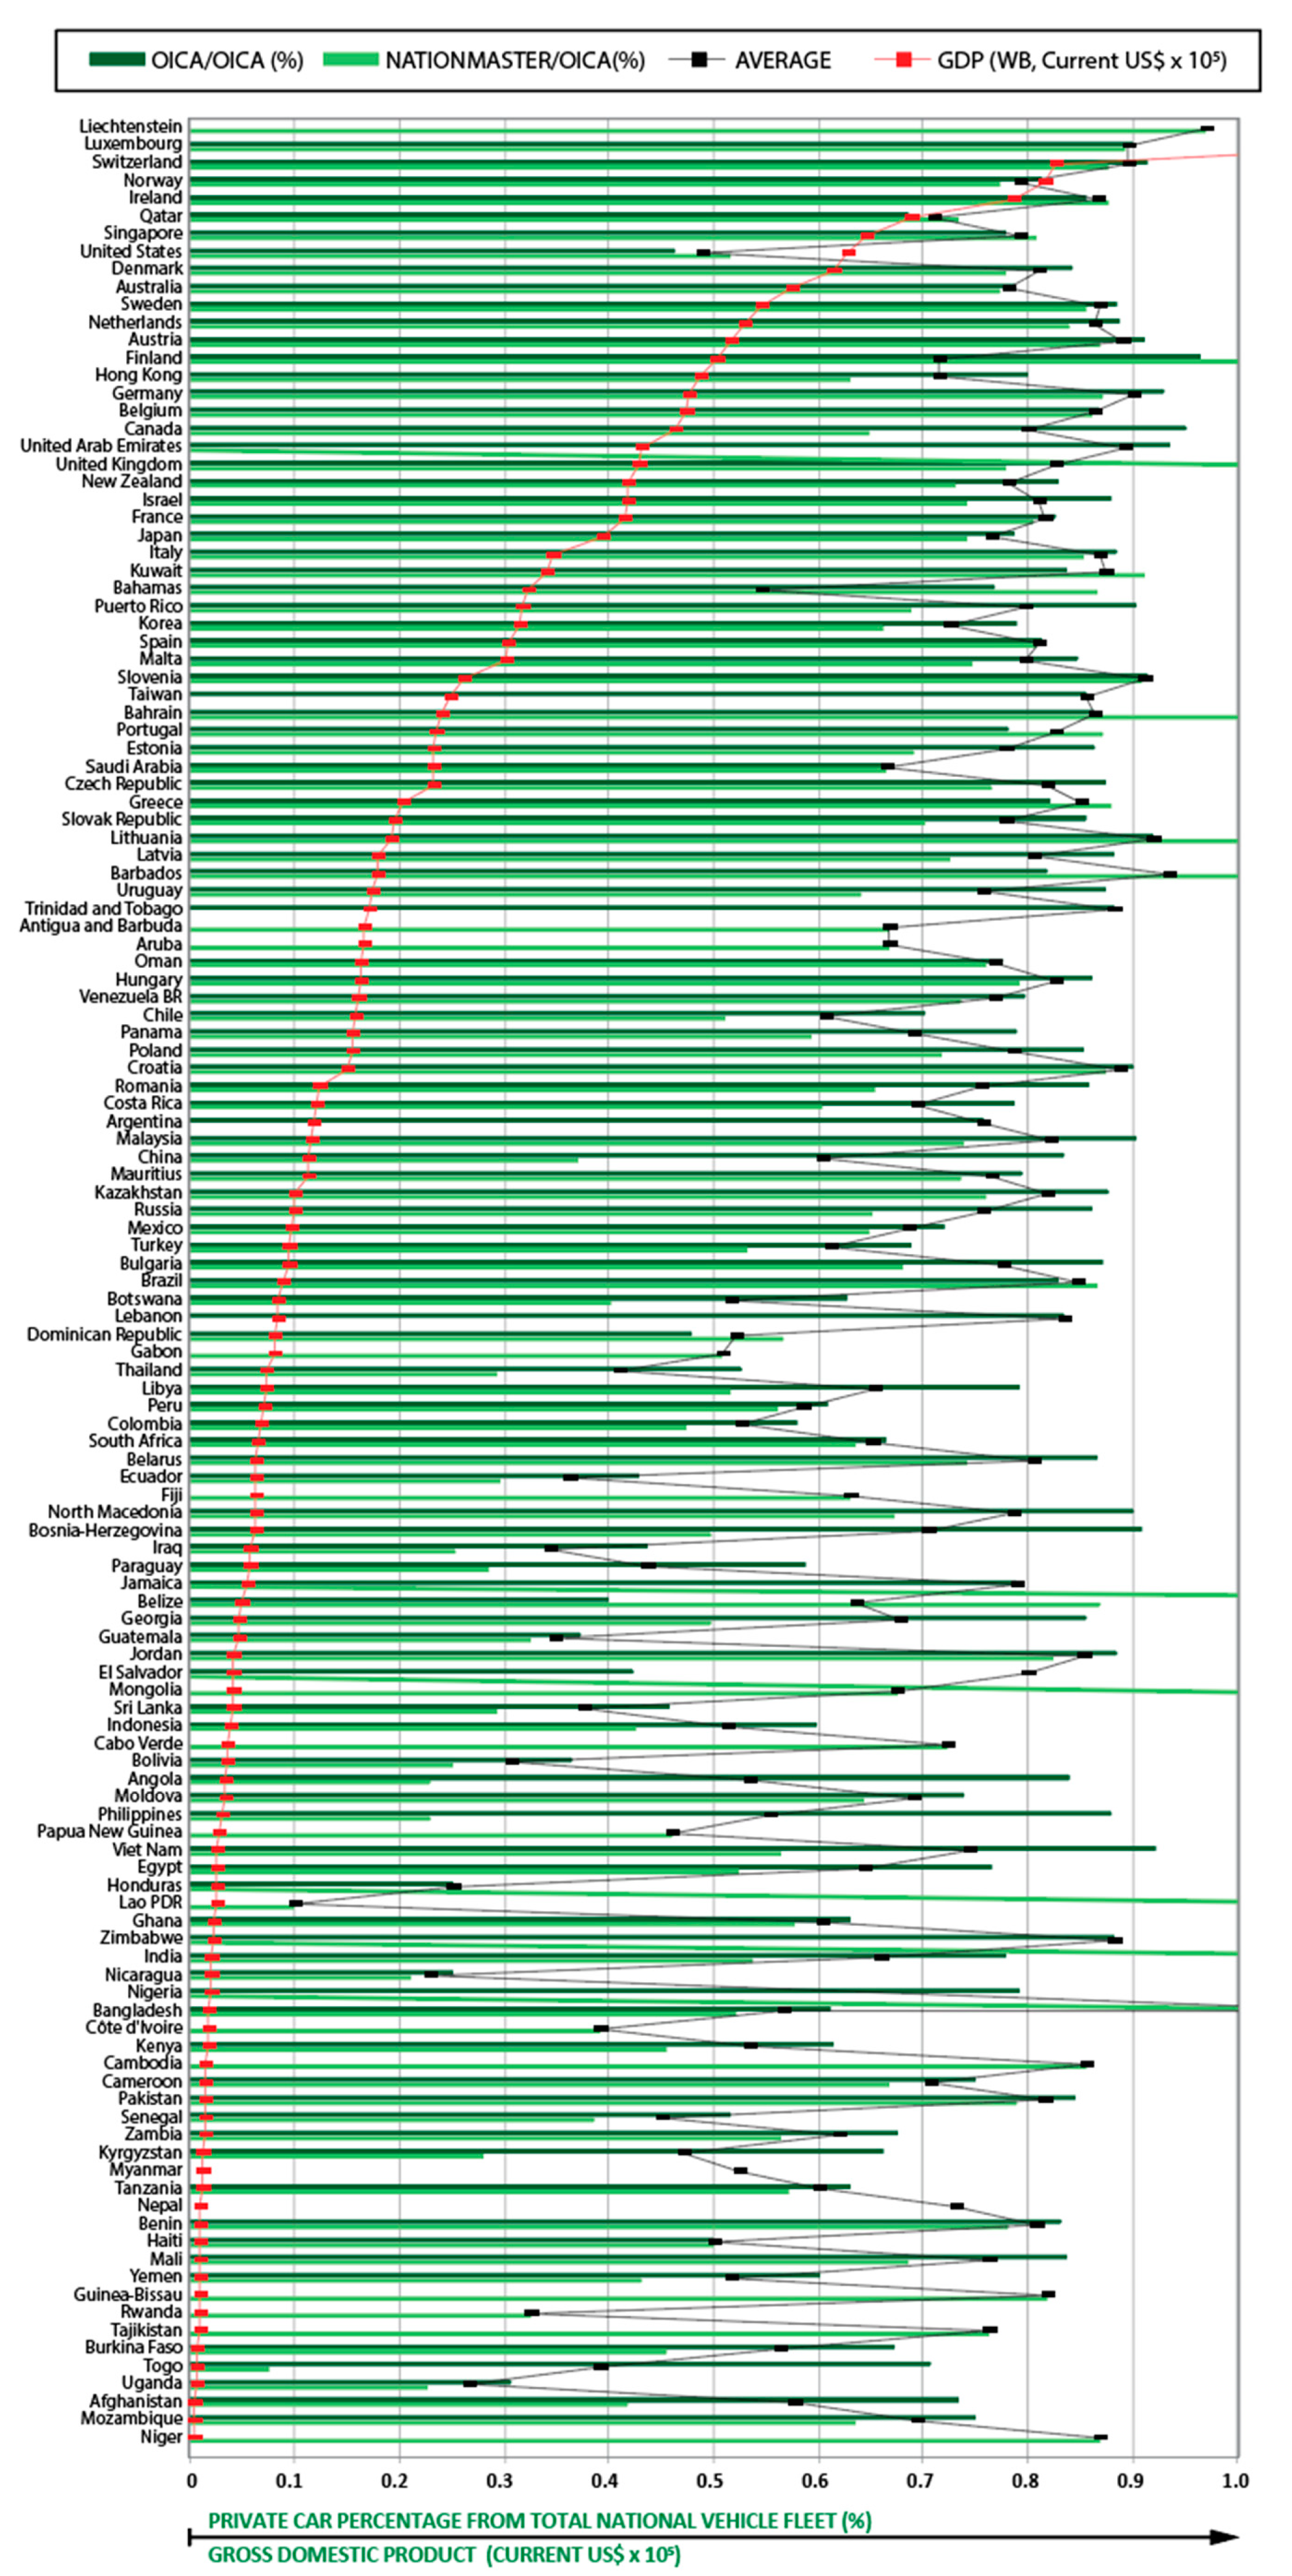
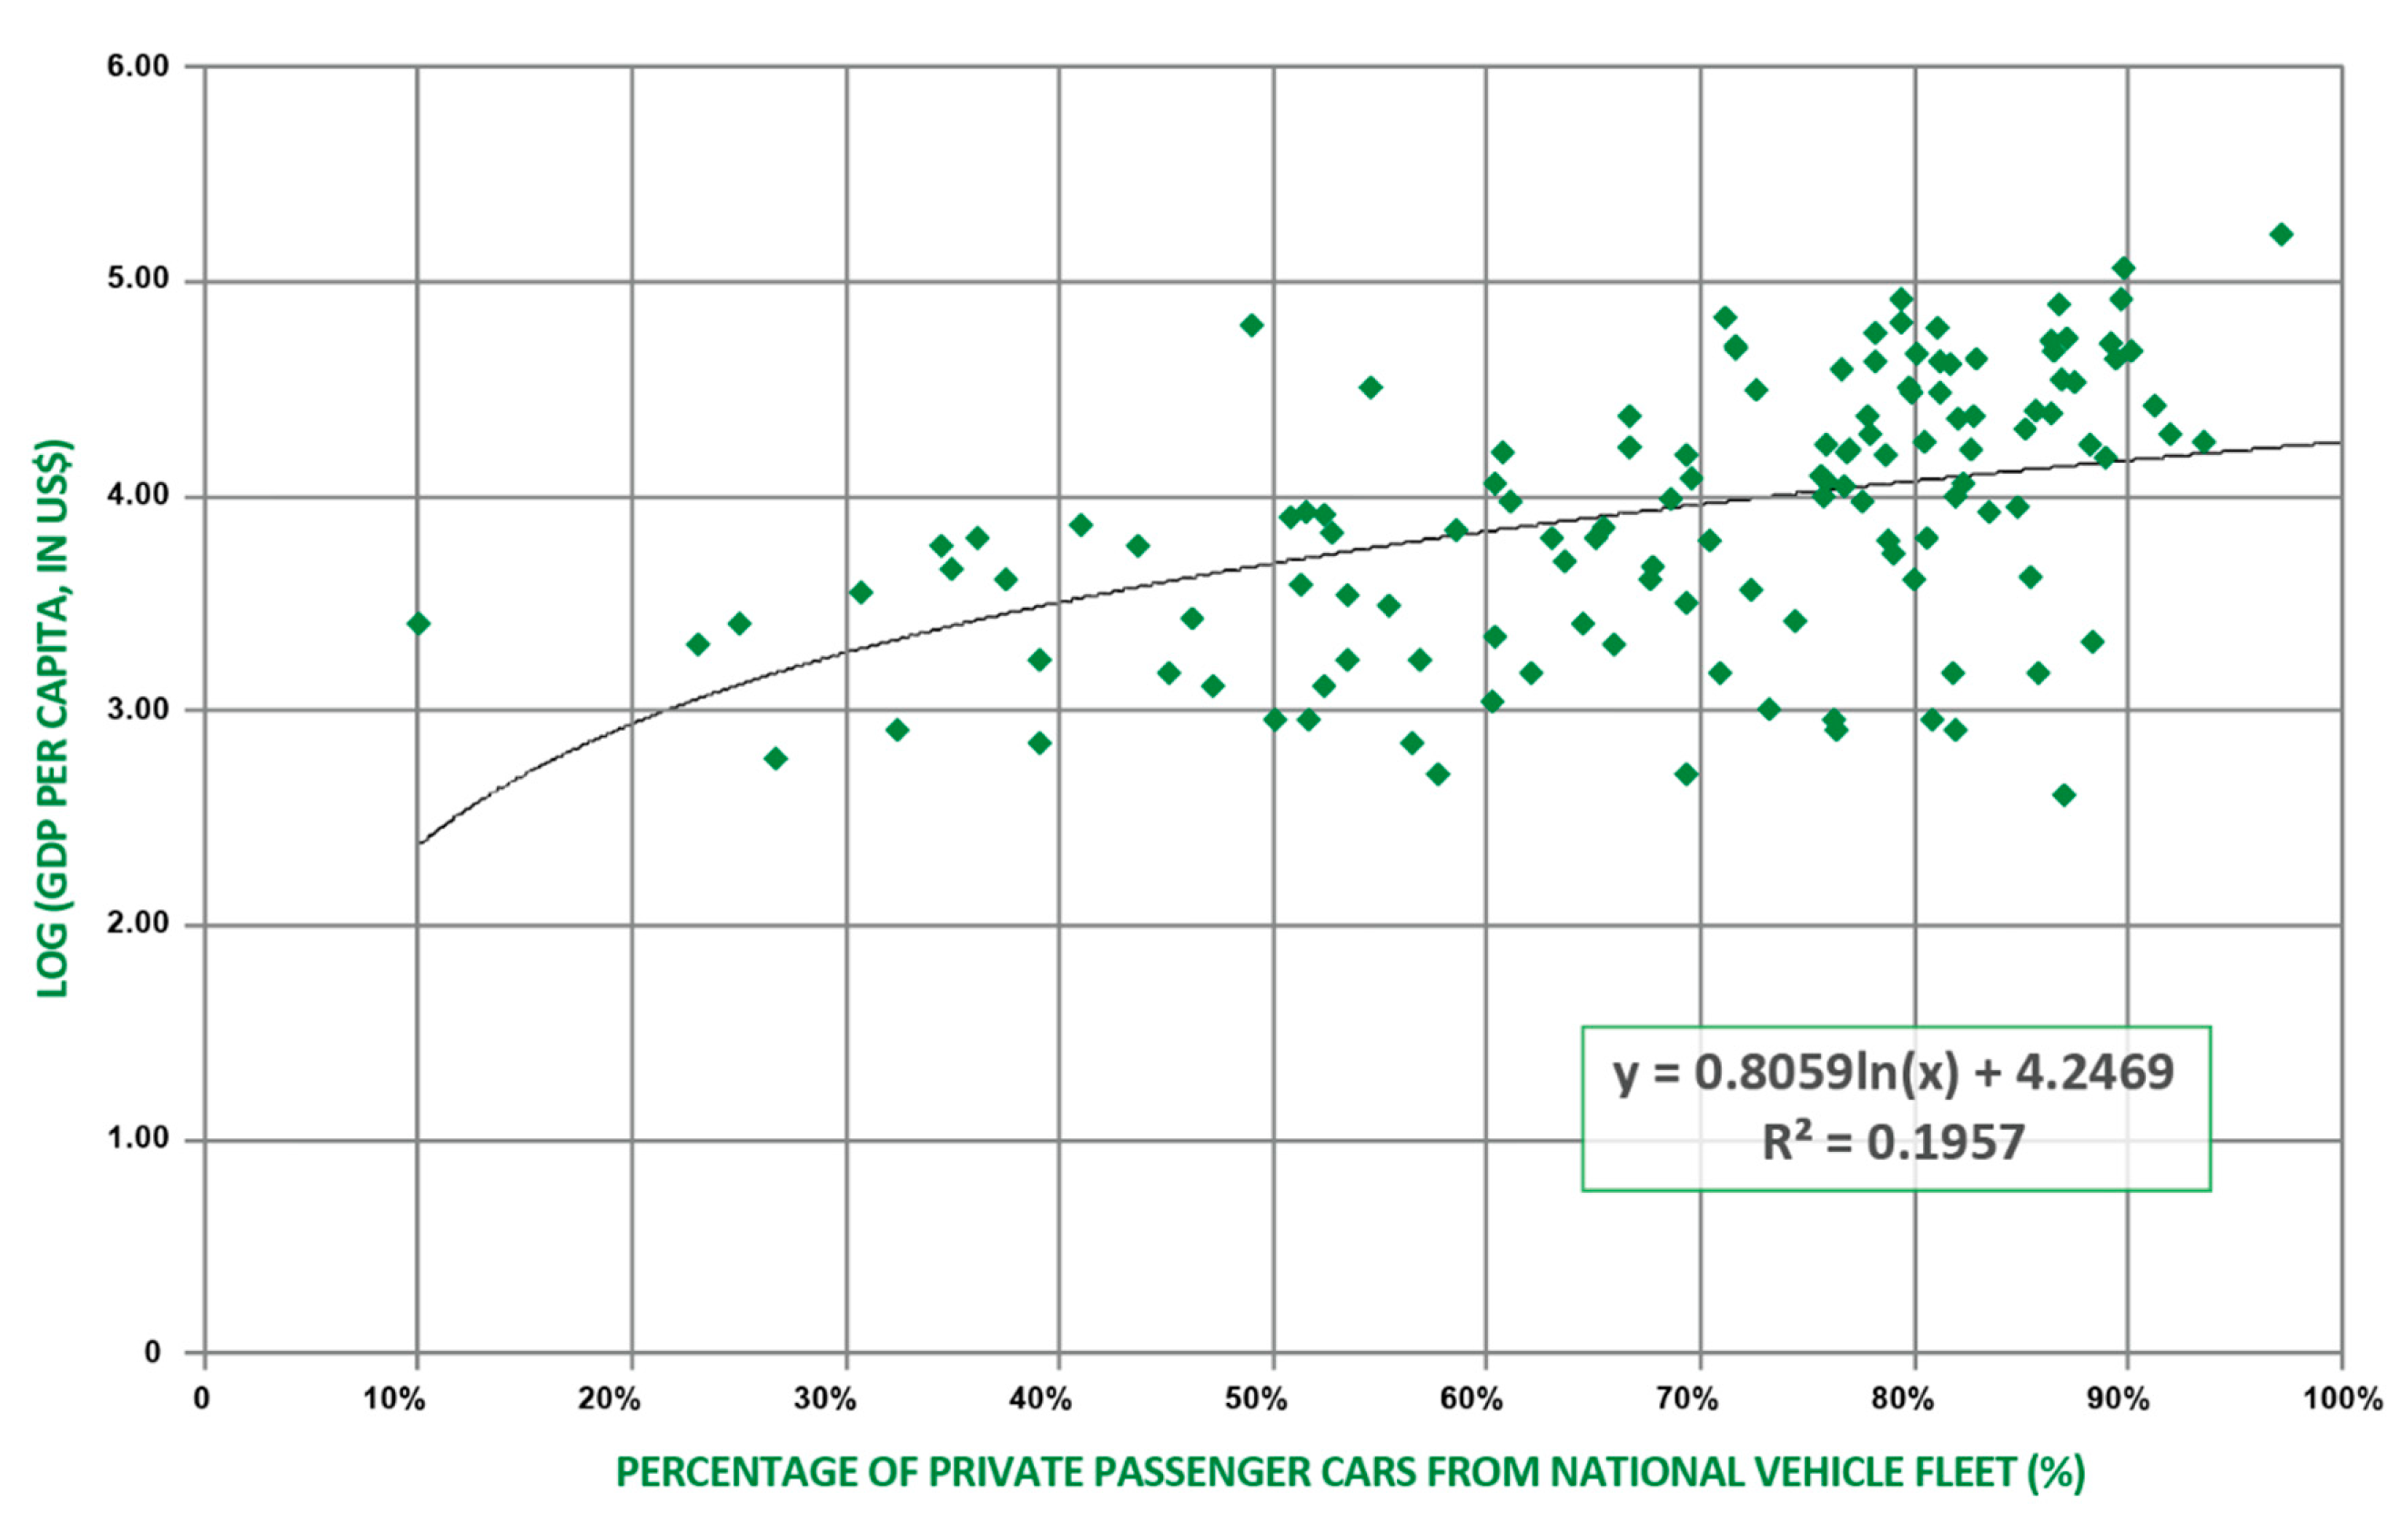
Even though modal shares can explicitly illustrate the extent to which each transport mode is used, they cannot provide insightful information about the composition of the available vehicle fleet within each transport mode. In fact, the characteristics of the vehicle fleet significantly affect the modal shares [23], among other factors. Therefore, to carry out a high-level screening of worldwide mobility trends, the vehicle fleet composition and transport mode need to be jointly considered. To capture the composition of the vehicle fleet per country, we distinguished between passenger cars and any other vehicle type. This allowed us to compute the passenger car share, which gave an indicator to show the percentage of passenger cars in the total national vehicle fleet. To provide a global dataset for this indicator, two different data sources were combined [24,25] to obtain two separate share values for each country and then the average value was calculated. For some countries, information was drawn from specific data sources [26,27,28,29,30]. In total, information for 131 countries was compiled; the two source-specific shares along with the average value are shown in Figure 6. Countries were organized from highest GDP [19] to lowest, and greater accuracy was observed in countries with a higher GDP. Data for Figure 6 and Figure 7 were gathered using the latest available years; GDP from 2018 [19], OICA database from 2015 [25], and NationMaster database from 2010 (54%), 2009 (13%), 2008 (8%), 2007 (19%), and 2006 or earlier (5%) [24].
Similar to the analysis for the modal share, we also estimated a regression model to identify the relationship between passenger car share in the total vehicle fleet and income, in terms of GDP per capita, as shown by the scatter plot in Figure 7. The consistent pattern of the data points in the scatter plot reaffirms the positive correlation between country income and passenger car share.
4. Discussion and Conclusions
This study aimed to address the gap stemming from the limited availability of global information on transport modal shares. Existing databases provided the modal share information for either individual countries or for groups of countries comprising international entities (e.g., OECD, European Union). Herein, we present a comprehensive dataset of modal share statistics concerning motorized passenger transport for 131 countries across the globe. The dataset was compiled using information from acknowledged databases (ITF, Eurostat), country-specific sources, and regression-based estimates.
This novel global dataset provides the shares of public transport (bus/coach and rail) and passenger cars in inland transport networks. It also provides the percentage of passenger cars in the total national vehicle fleet. This multifaceted information can help researchers and practitioners gain a high-level understanding of the characteristics and performance of transport networks, especially in terms of infrastructure, operations, and travel behavior. Despite the aggregate nature of the presented information, this dataset can serve as a supporting tool for interdisciplinary research endeavors in which the transport sector may have significant implications. Modal share information constitutes an indispensable component for policy frameworks that crosses the boundaries of the transport field and blends with the energy and environmental sectors, public health, economics, human factors, and urban planning. Specifically, international comparisons of transport-related air pollution or energy demand are highly dependent on modal share information. For example, the mobility-related energy consumption at a country level is a function, among others, of the modal share. In addition, decisions for significant policy objectives, such as a shift to sustainable mobility, decarbonization of transport, and urban inclusion, can be informed using modal share information. These decisions are directly related to transportation planning, which is normally featured through a 4-step planning process. Modal split constitutes a fundamental step of that process typically carried out between trip distribution and trip assignment processes [31]. In this context, the information on actual modal shares provided by this dataset enables a high-level evaluation of the planning process, thus laying the groundwork for planning interventions, in line with the policy objectives of each country.
The worldwide coverage provided by the dataset also enables the comprehensive assessment of impacts or response to global events affecting the transport sector, such as pandemics, natural hazards, or oil price changes. For example, the unprecedented impact of the COVID-19 pandemic on mobility is expected to generate a new array of policies aimed at mitigating a sharp increase in private motorized mobility. The information offered by this dataset can facilitate a cross-comparison of these policies in the post-COVID era, since the modal share and vehicle fleet composition constitute key indicators for Public Authorities to identify the current situation, specify mobility targets, and conduct ex ante evaluations before the final implementation of these policies.
The provision of such a global dataset does not come without limitations. These primarily stem from the limited availability of the modal share information for a number of countries and potential variations in the methodologies employed worldwide for the collection of transport data. Some of these limitations have been partially addressed at a regional level (e.g., the European Union) through the harmonization of data collection and reporting approaches. However, any benefits gained by the region-specific standardization may fade out, since significant disparities in the design, methodology, timing, and evaluation of data collection are not addressed systematically in a global context. This further highlights the need for a central data repository that can be hosted and managed by a universally endorsed international entity (along the same lines as OECD), which will collect, store, publish, and regularly review transport data following well-designed and systematic procedures. Despite the economic, political, and cultural barriers that may arise, the development of such a central repository could facilitate and expedite knowledge transfer and global decision making, especially in periods requiring rapid and well-coordinated actions at a global level as with, for example, the COVID-19 pandemic.
Supplementary Materials
The following are available online at https://0-www-mdpi-com.brum.beds.ac.uk/2673-4060/1/1/3/s1.
Author Contributions
Conceptualization, F.P.; methodology, F.P., G.F., Y.-Y.S.; data collection and curation, G.F., Y.-Y.S., O.A.-G., F.P.; writing, F.P., G.F., Y.-Y.S., O.A. All authors have read and agreed to the published version of the manuscript.
Funding
This research received no external funding.
Acknowledgments
F.P. gratefully acknowledges the Vice Chancellor’s Research Fellowship he holds at Edinburgh Napier University.
Conflicts of Interest
The authors declare no conflict of interest.
References
- Trilla, A. One world, one health: The novel coronavirus COVID-19 epidemic. Med. Clin. (Barc.) 2020, 154, 175–177. [Google Scholar] [CrossRef] [PubMed]
- BBC. Coronavirus: The World in Lockdown in Maps and Charts. 2020. Available online: https://www.bbc.com/news/world-52103747 (accessed on 1 May 2020).
- Google. COVID-19 Community Mobility Reports. 2020. Available online: https://www.google.com/COVID-19/mobility/ (accessed on 15 April 2000).
- Liu, Z.; Ciais, P.; Deng, Z.; Lei, R.; Davis, S.J.; Feng, S.; Zheng, B.; Cui, D.; Dou, X.; He, P.; et al. Decreases in global CO2 emissions due to COVID-19 pandemic. arXiv 2020, arXiv:2004.13614. [Google Scholar]
- Wellenius, G.A.; Vispute, S.; Espinosa, V.; Fabrikant, A.; Tsai, T.C.; Hennessy, J.; Williams, B.; Gadepalli, K.; Boulanger, A.; Pearce, A.; et al. Impacts of State-Level Policies on Social Distancing in the United States Using Aggregated Mobility Data during the COVID-19 Pandemic. arXiv 2020, arXiv:2004.10172. [Google Scholar]
- ITF. Passenger Transport. 2020. Available online: https://0-doi-org.brum.beds.ac.uk/10.1787/g2g5557f-en (accessed on 15 April 2000).
- Eurostat. Modal Split of Passenger Transport. 2020. Available online: https://appsso.eurostat.ec.europa.eu/nui/show.do?dataset=tran_hv_psmod&lang=en (accessed on 15 April 2000).
- World Bank. Abidjan Urban Mobility Project; World Bank: Washington, DC, USA, 2018. [Google Scholar]
- UITP. MENA Transport Report 2016; International Association of Public Transport: Brussels, Belgium, 2016. [Google Scholar]
- JICA. Publications. 2020. Available online: https://www.jica.go.jp/english/publications/index.html (accessed on 12 May 2020).
- BRT. Modal Spilt% Public Transport. 2020. Available online: https://brtdata.org/indicators/systems/modal_split__public_transport (accessed on 20 April 2000).
- UNECE. Road Traffic. 2020. Available online: https://www.unece.org/ru/trans/welcome.html (accessed on 18 April 2000).
- Tischer, V.; Tischer, V.; Fountas, G.; Polette, M.; Rye, T. Environmental and economic assessment of traffic-related air pollution using aggregate spatial information: A case study of Balneário Camboriú, Brazil. J. Transp. Health 2019, 14, 100592. [Google Scholar] [CrossRef]
- Lu, H.; Ma, H.; Sun, Z.; Wang, J. Analysis and Prediction on Vehicle Ownership Based on an Improved Stochastic Gompertz Diffusion Process. J. Adv. Transp. 2017, 2017, 4013875. [Google Scholar] [CrossRef]
- Liddle, B. The systemic, long-run relation among gasoline demand, gasoline price, income, and vehicle ownership in OECD countries: Evidence from panel cointegration and causality modeling. Transp. Res. Part D Transp. Environ. 2012, 17, 327–331. [Google Scholar] [CrossRef] [Green Version]
- Bansal, P.; Kockelman, K.M.; Schievelbein, W.; Schauer-West, S. Indian vehicle ownership and travel behavior: A case study of Bengaluru, Delhi and Kolkata. Res. Transp. Econ. 2018, 71, 2–8. [Google Scholar] [CrossRef]
- Zhang, Z.; Jin, W.; Jiang, H.; Xie, Q.; Shen, W.; Han, W. Modeling heterogeneous vehicle ownership in China: A case study based on the Chinese national survey. Transp. Policy 2017, 54, 11–20. [Google Scholar] [CrossRef]
- Keshavarzian, M.; Anaraki, K.; Zamani, M.; Erfanifard, A. Projections of oil demand in road transportation sector on the basis of vehicle ownership projections, worldwide: 1972–2020. Econ. Model. 2012, 29, 1979–1985. [Google Scholar] [CrossRef]
- World Bank. GDP per Capita (Current US$). 2020. Available online: https://data.worldbank.org/indicator/NY.GDP.PCAP.CD (accessed on 15 April 2020).
- Dargay, J.; Gately, D. Vehicle Ownership to 2015: Implications for energy use and emissions. Energy Policy 1997, 25, 1121–1127. [Google Scholar] [CrossRef]
- Santos, G.; Georgina, S.; Hanna, M.; Dimitris, P.; von Brunn, T. Factors influencing modal split of commuting journeys in medium-size European cities. J. Transp. Geogr. 2013, 30, 127–137. [Google Scholar] [CrossRef]
- Anand, S.; Sen, A. Human Development Index: Methodology and Measurement; UNDP: New York, NY, USA, 1994. [Google Scholar]
- Anastasopoulos, P.C.; Fountas, G.; Sarwar, M.T.; Karlaftis, M.G.; Sadek, A.W. Transport habits of travelers using new energy type modes: A random parameters hazard-based approach of travel distance. Transp. Res. Part C 2017, 77, 516–528. [Google Scholar] [CrossRef]
- NationMaster. International Statistics. Passenger Cars per 1000 People. 2010. Available online: http://www.nationmaster.com/country-info/stats/Transport/Roads/Passenger-cars/Per-1,000-people (accessed on 12 May 2020).
- OICA. International Organization of Motor Vehicle Manufacturers. Vehicles in Use. 2018. Available online: http://www.oica.net/category/vehicles-in-use/ (accessed on 5 May 2020).
- Eurostat. Passenger Cars in the EU Statistics Explained. 2000. Available online: https://ec.europa.eu/eurostat/statistics-explained/index.php?title=Passenger_cars_in_the_EU (accessed on 13 May 2020).
- World Bank. Motor Vehicles per 1000 People. 2014. Available online: https://web.archive.org/web/20140209114811/http://data.worldbank.org/indicator/IS.VEH.NVEH.P3 (accessed on 13 May 2020).
- UK Government. Vehicles Statistics Information. 2020. Available online: https://www.gov.uk/government/publications/vehicles-statistics-guidance (accessed on 12 May 2020).
- CEIC Data. Motor Vehicle Sales Passenger Cars. 2020. Available online: https://www.ceicdata.com/en/indicator/gabon/motor-vehicle-sales-passenger-cars (accessed on 13 May 2020).
- Rapo, M. Tilastokeskus Väestörakenne. 2018. Available online: https://www.stat.fi/til/vaerak/2018/vaerak_2018_2019-03-29_tie_001_fi.html (accessed on 13 May 2020).
- Karlaftis, M.; Kepaptsoglou, K.; Fountas, G. Transportation planning. In Routledge Handbook of Transportation; Teodorovic, D., Ed.; Routledge: London, UK, 2015. [Google Scholar]
Figure 1.
Overview of countries covered in the dataset presented in this article. Full details with country names are available in the Supplementary Material.
Figure 1.
Overview of countries covered in the dataset presented in this article. Full details with country names are available in the Supplementary Material.

Figure 2.
Scatter plot of car use and Gross Domestic Product (GDP) for 87 countries.

Figure 3.
Boxplots of private car share from the national vehicle fleet, by region.

Figure 4.
Boxplots of car share by GDP per capita.

Figure 5.
Boxplots of car share by GDP per Human Development Index (HDI) category.

Figure 6.
Shares of passenger cars in the national vehicle fleet for the countries included in the dataset.
Figure 6.
Shares of passenger cars in the national vehicle fleet for the countries included in the dataset.

Figure 7.
Relationship between GDP per capita and passenger car share in the total vehicle fleet (note a logarithmic scale is used for GDP).
Figure 7.
Relationship between GDP per capita and passenger car share in the total vehicle fleet (note a logarithmic scale is used for GDP).


Table 1.
Data sources and proportion of data per source.
| Source Type | Number of Countries | Percentage of Countries |
|---|---|---|
| ITF & Eurostat (Step 1) | 37 | 28% |
| Country specific source (Step 2) | 52 | 40% |
| Regression-based estimates (Step 3) | 42 | 32% |
| Total | 131 | 100% |
Table 2.
Breakdown of car share by region, GDP per capita and human development index.
| Region | Car Share | GDP per Capita | Car Share | Human Development Index | Car Share |
|---|---|---|---|---|---|
| North America | 94.0% | Above US$35,000 | 80.8% | Very high | 75.6% |
| Europe & Central Asia | 72.7% | US$35,000–15,000 | 74.1% | High | 56.2% |
| Middle East & North Africa | 71.5% | Below US$15,000 | 50.6% | Medium | 47.1% |
| East Asia & Pacific | 62.0% | Low | 40.1% | ||
| Latin America & Caribbean | 54.0% | ||||
| Sub-Saharan Africa | 46.2% | ||||
| South Asia | 41.1% |
© 2020 by the authors. Licensee MDPI, Basel, Switzerland. This article is an open access article distributed under the terms and conditions of the Creative Commons Attribution (CC BY) license (http://creativecommons.org/licenses/by/4.0/).
Share and Cite
MDPI and ACS Style
Fountas, G.; Sun, Y.-Y.; Akizu-Gardoki, O.; Pomponi, F. How Do People Move Around? National Data on Transport Modal Shares for 131 Countries. World 2020, 1, 34-43. https://0-doi-org.brum.beds.ac.uk/10.3390/world1010003
AMA Style
Fountas G, Sun Y-Y, Akizu-Gardoki O, Pomponi F. How Do People Move Around? National Data on Transport Modal Shares for 131 Countries. World. 2020; 1(1):34-43. https://0-doi-org.brum.beds.ac.uk/10.3390/world1010003
Chicago/Turabian StyleFountas, Grigorios, Ya-Yen Sun, Ortzi Akizu-Gardoki, and Francesco Pomponi. 2020. "How Do People Move Around? National Data on Transport Modal Shares for 131 Countries" World 1, no. 1: 34-43. https://0-doi-org.brum.beds.ac.uk/10.3390/world1010003